k18d matlab modelling toolkit - rohde & schwarz
TRANSCRIPT

K18D MATLAB Modeling Toolkit Application Note
Products:
ı R&S®FSW-K18D
ı R&S®FSV3-K18D
ı R&S®FPS-K18D
Digital pre-distortion (DPD) is a common method to linearize the output signal of a power amplifier (PA),
which is being operated in its non-linear operating range.
The R&S K18D application family offers a very easy-to-use method to pre-distort amplifiers without
modelling the DUT.
However, many engineers in PA design request a simple and easy-to-use tool that delivers a DPD model
applicable to any real-world signal.
This application note with the accompanying software tool allows engineers without in-depth knowledge of
DPD or remote programming to generate a DPD model and verify it against the DUT, based on the results
of the K18D application.
Note:
Please find the most up-to-date document on our homepage
http://www.rohde-schwarz.com/appnote/1EF105.
This document is complemented by software. The software may be updated even if the version of the
document remains unchanged
App
licat
ion
Not
e
Mar
tin W
eiß
Dr.
Flo
rian
Ram
ian
3.20
19 –
1E
F10
5_1e
Table of Contents
1EF105_1e Rohde & Schwarz K18D MATLAB Modeling Toolkit
2
Table of Contents
1Introduction 3
2Modelling DPD ............................................................................................................ 4
2.1Iterative Direct DPD ............................................................................................................................... 4
2.2Complexity of DPD Models ................................................................................................................... 4
2.3From Direct DPD to Model DPD ........................................................................................................... 5
3K18D Modeling Toolkit .............................................................................................. 6
4Fine Tuning Measurement and Modelling ................................................................ 8
4.1Pre-requirements and installation ....................................................................................................... 8
4.2 Results 9
4.3Configuration Parameters .................................................................................................................... 9
4.4MATLAB interoperation and signal processing ...............................................................................10
5 Literature 11
6Ordering Information ............................................................................................... 12
Introduction
1EF105_1e Rohde & Schwarz K18D MATLAB Modeling Toolkit
3
1 Introduction
Today's amplifiers are highly optimized designs by means of efficiency. This applies
not only to battery powered mobile devices, but also to higher power applications for
example base stations or other transmitters, as the power consumption (for both
operation and cooling) is the main contributor to operational expenses.
Along with the omnipresent efficiency requirement, carrier frequencies and bandwidths
increase to satisfy the end user’s demand for more throughput. All these factors create
a challenge the PA designer.
Consequently, the use of pre-distortion techniques is mandatory, even though these
techniques require significant computational effort.
A key requirement for any PA vendor is to provide specification values of the amplifier
under DPD conditions. Even though the PA might be sold without the accompanying
DPD algorithm, it is definitely a huge competitive advantage if your amplifier comes
together with an algorithm for DPD.
With the R&S K18 (Amplifier Measurements including memory-less polynomial DPD)
and K18D (Direct DPD), Rohde & Schwarz provides measurement applications that
simplify PA verification dramatically.
This application note takes DPD a step further and allows the user to derive a memory
polynomial directly from the result of K18D, without any DPD or programming
language. The memory polynomial (or any other DPD model) is the basis for real-time
pre-distortion on a real-world signal.
Note: To get started immediately, directly continue with chapter 3.

Modelling DPD
1EF105_1e Rohde & Schwarz K18D MATLAB Modeling Toolkit
4
2 Modelling DPD
2.1 Iterative Direct DPD
During the design phase of a power amplifier, it is important to quickly analyze the
performance of the current design under DPD conditions or compare it to a different
design. The K18D, Direct DPD application (see [1]) provides this analysis and
comparison. Direct DPD quickly provides a highly linearized output signal, but does not
derive a model. It compares the measured output of a DUT to the ideal reference
signal on a sample-by-sample basis, and modifies each sample individually in
amplitude and phase to derive the pre-distorted signal P (Fig. 2-1). Due to the non-
linearity of the DUT, iterative usage of Direct DPD is highly recommended. Iterative
Direct-DPD will converge after typically 5-10 iterations. Instrument noise and dynamic
range will limit the performance, but techniques such as I/Q Averaging (see [1]) greatly
reduce these effects.
Fig. 2-1: (a, left) Direct DPD, where each sample of a reference signal A is compared against each
sample of the output signal M of the DUT, and a pre-distorted signal P derived. Direct DPD delivers
best results when operated iteratively in a loop (b, right).
2.2 Complexity of DPD Models
Any system integrator planning to use a PA under DPD conditions will require the PA
vendor to specify its performance under modelling DPD, i.e. real-world DPD conditions
(see Fig. 2-2).
Narrow bandwidth mobile devices often limit the DPD model complexity to memory-
less polynomial models. These are easy to fit – the R&S FSW-K18 for example can
directly deliver the polynomial coefficients. However, the larger the bandwidth, the
higher the demand for memory modelling.
Memory modelling introduces a significantly higher computational complexity.
Consequently, significant R&D effort is put into finding the best model for a given PA
design and signal type. The meaning of “best” may vary, as it will always be a trade-off
between linearity and complexity.
Compare against
Reference
Pre-Distort
(Direct DPD)
Measure

Modelling DPD
1EF105_1e Rohde & Schwarz K18D MATLAB Modeling Toolkit
5
Popular models are the Volterra series, memory polynomial, generalized memory
polynomial, or the Wiener and Hammerstein models.
Fig. 2-2: Schematic of a DUT applying DPD to a signal in real-time.
2.3 From Direct DPD to Model DPD
The "K18D Modeling Toolkit" provided with this application note derives coefficients for
a memory polynomial, based on the pre-distorted waveform resulting from K18D.
The toolkit uses MATLAB to find the coefficients. The toolkit comes with a set of
MATLAB functions that follow the equation below.
�̃�(𝑛𝑇) = ∑ ∑ 𝑘𝑝,𝑚𝐴(𝑛𝑇 − 𝜏𝑚)
𝑀
𝑚=1
𝑃
𝑝=1
|𝐴(𝑛𝑇 − 𝜏𝑚)|𝑝−1
It solves the equation by replacing the unknown model DPD signal �̃� by the known
iterative Direct DPD result P (see chapter 2.1). Since A is the known reference signal,
the resulting equations can be solved for 𝑘𝑝,𝑚.
The equations will be solved not only for one pre-distorted signal P, but for all signals
Pn resulting from N iterative Direct DPD steps, as show in Fig. 2-3. This allows the user
to pick the best fit.
Fig. 2-3: Signal flow for the Modelling Toolkit. For each iteration step of Direct DPD, coefficients are
calculated and a pre-distorted signal based on the model is created.
K18D Modeling Toolkit
1EF105_1e Rohde & Schwarz K18D MATLAB Modeling Toolkit
6
3 K18D Modeling Toolkit
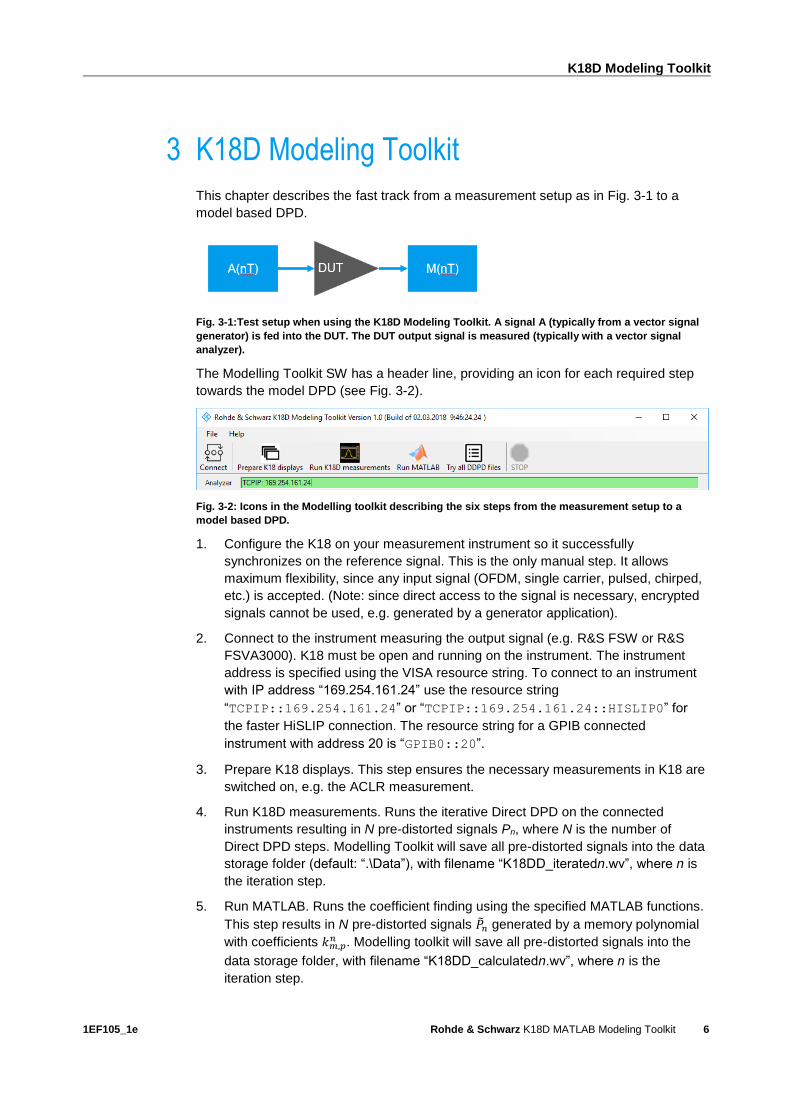
This chapter describes the fast track from a measurement setup as in Fig. 3-1 to a
model based DPD.
Fig. 3-1:Test setup when using the K18D Modeling Toolkit. A signal A (typically from a vector signal
generator) is fed into the DUT. The DUT output signal is measured (typically with a vector signal
analyzer).
The Modelling Toolkit SW has a header line, providing an icon for each required step
towards the model DPD (see Fig. 3-2).
Fig. 3-2: Icons in the Modelling toolkit describing the six steps from the measurement setup to a
model based DPD.
1. Configure the K18 on your measurement instrument so it successfully
synchronizes on the reference signal. This is the only manual step. It allows
maximum flexibility, since any input signal (OFDM, single carrier, pulsed, chirped,
etc.) is accepted. (Note: since direct access to the signal is necessary, encrypted
signals cannot be used, e.g. generated by a generator application).
2. Connect to the instrument measuring the output signal (e.g. R&S FSW or R&S
FSVA3000). K18 must be open and running on the instrument. The instrument
address is specified using the VISA resource string. To connect to an instrument
with IP address “169.254.161.24” use the resource string
“TCPIP::169.254.161.24” or “TCPIP::169.254.161.24::HISLIP0” for
the faster HiSLIP connection. The resource string for a GPIB connected
instrument with address 20 is “GPIB0::20”.
3. Prepare K18 displays. This step ensures the necessary measurements in K18 are
switched on, e.g. the ACLR measurement.
4. Run K18D measurements. Runs the iterative Direct DPD on the connected
instruments resulting in N pre-distorted signals Pn, where N is the number of
Direct DPD steps. Modelling Toolkit will save all pre-distorted signals into the data
storage folder (default: “.\Data”), with filename “K18DD_iteratedn.wv”, where n is
the iteration step.
5. Run MATLAB. Runs the coefficient finding using the specified MATLAB functions.
This step results in N pre-distorted signals �̃�𝑛 generated by a memory polynomial
with coefficients 𝑘𝑚,𝑝𝑛 . Modelling toolkit will save all pre-distorted signals into the
data storage folder, with filename “K18DD_calculatedn.wv”, where n is the
iteration step.

K18D Modeling Toolkit
1EF105_1e Rohde & Schwarz K18D MATLAB Modeling Toolkit
7
6. Try all DPD. This step will verify all signals from Direct DPD as well as from the
model DPD. It will show ACLR and EVM results for each (pre-distorted) signal.
7. Find the coefficients of the last step in “vfcCoeffs.bin” in the data storage folder or
run “RunModelling.m” (also in data storage folder) and adjust the file names within
the MATLAB function to any other signal from the previous steps.
Fig. 3-3: Table with results from Direct DPD (iterated) and modelling DPD (calculated).

Fine Tuning Measurement and Modelling
1EF105_1e Rohde & Schwarz K18D MATLAB Modeling Toolkit
8
4 Fine Tuning Measurement and Modelling
The Modelling toolkit delivers results in just six steps. However, it can be configured in
a number of ways. This chapter discusses the SW prerequisites and configuration
parameters.
4.1 Pre-requirements and installation
The software requires
ı A R&S instrument running the K18D connected via LAN, USB or GPIB bus to the
PC the software is running on
ı A VISA installation on the PC the software is running on
ı A MATLAB installation (and valid MATLAB licence) on the PC the software is
running on
ı A 64-bit Windows operating system
The software does not require an installation – the executable may be placed in any
folder.
Fine Tuning Measurement and Modelling
1EF105_1e Rohde & Schwarz K18D MATLAB Modeling Toolkit
9
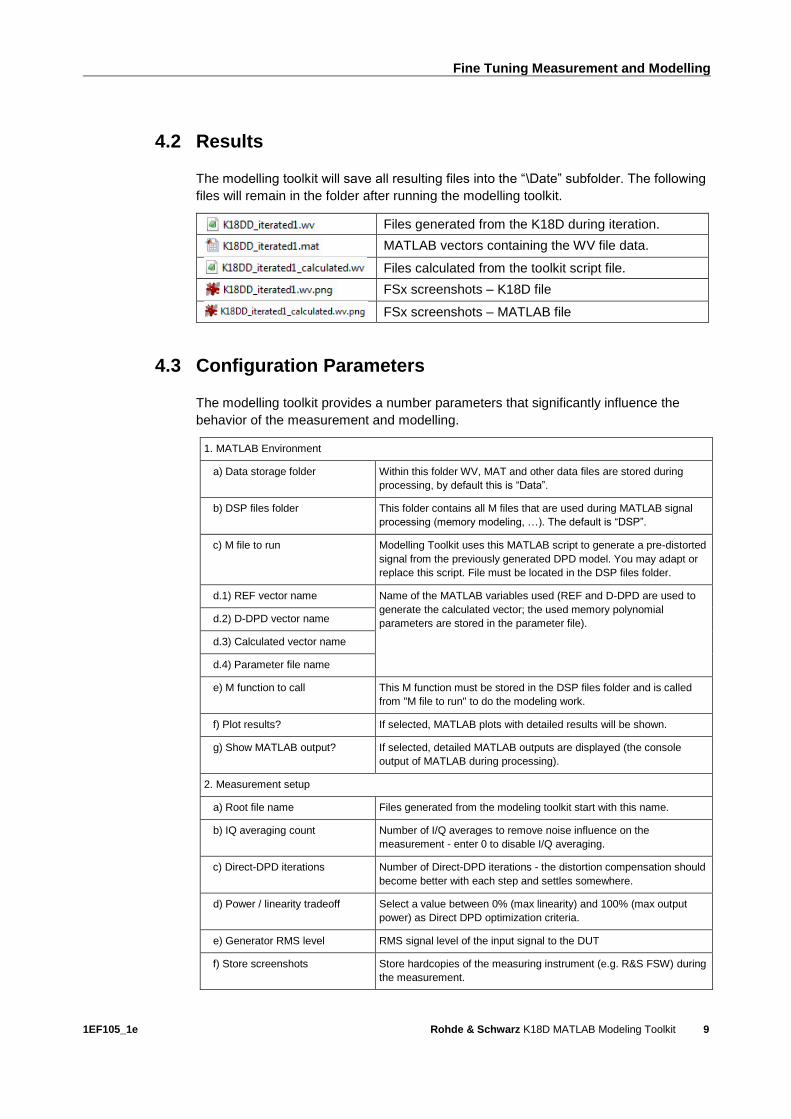
4.2 Results
The modelling toolkit will save all resulting files into the “\Date” subfolder. The following
files will remain in the folder after running the modelling toolkit.
Files generated from the K18D during iteration.
MATLAB vectors containing the WV file data.
Files calculated from the toolkit script file.
FSx screenshots – K18D file
FSx screenshots – MATLAB file
4.3 Configuration Parameters
The modelling toolkit provides a number parameters that significantly influence the
behavior of the measurement and modelling.
1. MATLAB Environment
a) Data storage folder Within this folder WV, MAT and other data files are stored during
processing, by default this is “Data”.
b) DSP files folder This folder contains all M files that are used during MATLAB signal
processing (memory modeling, …). The default is “DSP”.
c) M file to run Modelling Toolkit uses this MATLAB script to generate a pre-distorted
signal from the previously generated DPD model. You may adapt or
replace this script. File must be located in the DSP files folder.
d.1) REF vector name Name of the MATLAB variables used (REF and D-DPD are used to
generate the calculated vector; the used memory polynomial
parameters are stored in the parameter file). d.2) D-DPD vector name
d.3) Calculated vector name
d.4) Parameter file name
e) M function to call This M function must be stored in the DSP files folder and is called
from "M file to run" to do the modeling work.
f) Plot results? If selected, MATLAB plots with detailed results will be shown.
g) Show MATLAB output? If selected, detailed MATLAB outputs are displayed (the console
output of MATLAB during processing).
2. Measurement setup
a) Root file name Files generated from the modeling toolkit start with this name.
b) IQ averaging count Number of I/Q averages to remove noise influence on the
measurement - enter 0 to disable I/Q averaging.
c) Direct-DPD iterations Number of Direct-DPD iterations - the distortion compensation should
become better with each step and settles somewhere.
d) Power / linearity tradeoff Select a value between 0% (max linearity) and 100% (max output
power) as Direct DPD optimization criteria.
e) Generator RMS level RMS signal level of the input signal to the DUT
f) Store screenshots Store hardcopies of the measuring instrument (e.g. R&S FSW) during
the measurement.

Fine Tuning Measurement and Modelling
1EF105_1e Rohde & Schwarz K18D MATLAB Modeling Toolkit
10
3. Memory polynomial model
a) Memory depth Memory depth ("filter taps") of the memory polynomial model.
b) Polynomial order Polynomial order ("non-linearity") of the memory polynomial model.
c) Training vector length Use the specified (limited) number of samples for model calculation in
order to speed processing on long signals. Use 0 to indicate to use
the complete signal.
4.4 MATLAB interoperation and signal processing
The Modeling Toolkit will automatically detect a MATLAB installation, automate it via
the COM interface and start all processing steps. There is no need to start MATLAB
manually.
The modeling toolkit auto-generates a script file called “RunModeling” (you can set the
name in the modeling toolkit GUI as well as the other parameters used).
The script file will load both reference and DDPD file, normalize it to an amplitude of 1
(which makes signal processing easier to understand), call the modeling function
“DPDModelSynthesis”, save the generated output files and the memory polynomial
coefficients.
ı By default, there are three MATLAB files installed with the modeling toolkit:
- “DPDModelSynthesis” – the root function that is called.
- “MemModeling” – this function calculated the model of the pre-distorter
- “MemApply” – this function applies the model to a given input signal

Literature
1EF105_1e Rohde & Schwarz K18D MATLAB Modeling Toolkit
11
5 Literature
[1] Dr. Ramian Florian 1EF99: Iterative Direct DPD [Online]. - Rohde & Schwarz, 9
13, 2019. - 1e. - https://www.rohde-schwarz.com/applications/iterative-direct-dpd-
white-paper_230854-478144.html.
Ordering Information
1EF105_1e Rohde & Schwarz K18D MATLAB Modeling Toolkit
12
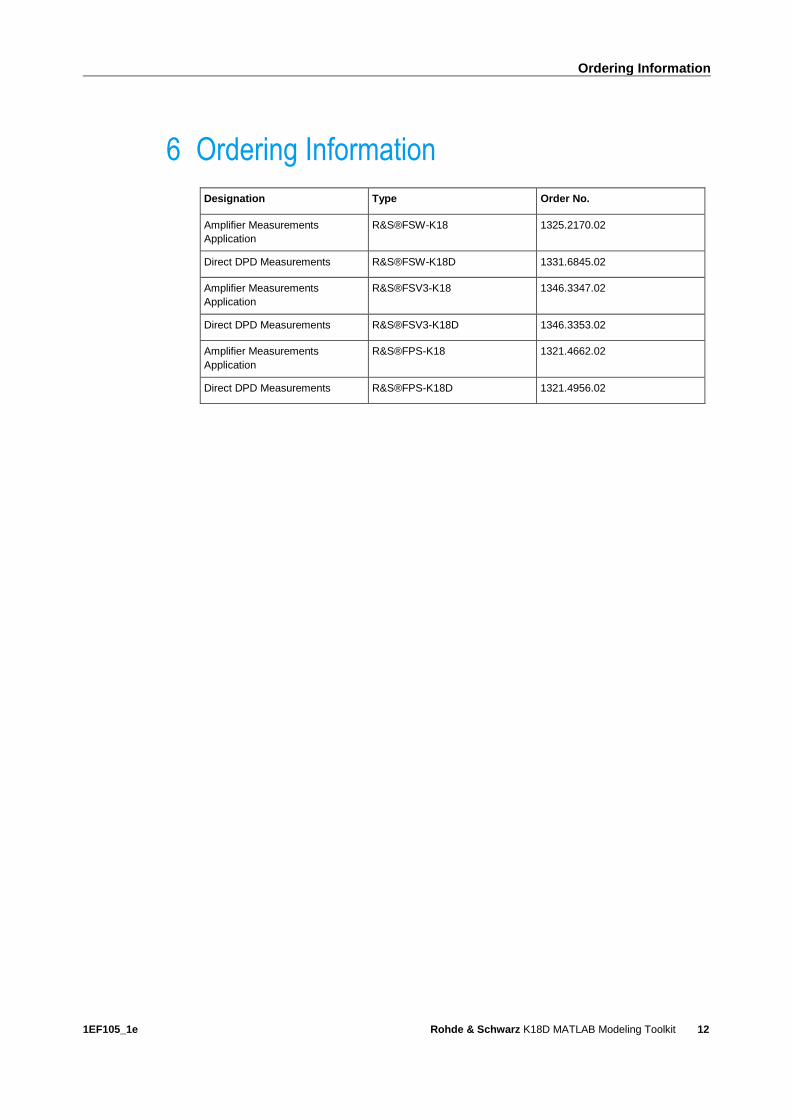
6 Ordering Information
Designation Type Order No.
Amplifier Measurements
Application
R&S®FSW-K18 1325.2170.02
Direct DPD Measurements R&S®FSW-K18D 1331.6845.02
Amplifier Measurements
Application
R&S®FSV3-K18 1346.3347.02
Direct DPD Measurements R&S®FSV3-K18D 1346.3353.02
Amplifier Measurements
Application
R&S®FPS-K18 1321.4662.02
Direct DPD Measurements R&S®FPS-K18D 1321.4956.02

Rohde & Schwarz
The Rohde & Schwarz electronics group offers
innovative solutions in the following business fields:
test and measurement, broadcast and media, secure
communications, cybersecurity, radiomonitoring and
radiolocation. Founded more than 80 years ago, this
independent company has an extensive sales and
service network and is present in more than 70
countries.
The electronics group is among the world market
leaders in its established business fields. The
company is headquartered in Munich, Germany. It
also has regional headquarters in Singapore and
Columbia, Maryland, USA, to manage its operations
in these regions.
Regional contact
Europe, Africa, Middle East +49 89 4129 12345 [email protected] North America 1 888 TEST RSA (1 888 837 87 72) [email protected] Latin America +1 410 910 79 88 [email protected] Asia Pacific +65 65 13 04 88 [email protected]
China +86 800 810 82 28 |+86 400 650 58 96 [email protected]
Sustainable product design
ı Environmental compatibility and eco-footprint
ı Energy efficiency and low emissions
ı Longevity and optimized total cost of ownership
This and the supplied programs may only be used
subject to the conditions of use set forth in the
download area of the Rohde & Schwarz website.
Version 1EF105_1e | R&S®K18D MATLAB Modeling Toolkit
R&S® is a registered trademark of Rohde & Schwarz GmbH & Co.
KG; Trade names are trademarks of the owners.
Rohde & Schwarz GmbH & Co. KG
Mühldorfstraße 15 | 81671 Munich, Germany
Phone + 49 89 4129 - 0 | Fax + 49 89 4129 – 13777
www.rohde-schwarz.com
PA
D-T
-M: 3573.7
380.0
2/0
3.0
0/E
N