k2usermanual
DESCRIPTION
K2UserManualTRANSCRIPT

For further assistance please email [email protected]
K2 User Manual
Europe TechEdge A/S Dampfærgevej 3, 4th Floor
DK-2100 Copenhagen N Voice: +45 35 31 40 80
Asia Pacific
TechEdge Asia Pacific, Singapore Pte Ltd 38B Club Street
Singapore 069418 Voice: +65 6602 8114
Version Date
2.0.4 29/01/2015
Latest Changes:
Flighting (page 19) Specific Spots (page 33) Reach by Week (page 43)
Click on page number!
UK Voice: +44 20 7100 9948 Voice: +44 20 7100 9606
USA
Voice: +1 3476973130

© TechEdge A/S 2015 2/62 [email protected]
ABOUT THIS USER MANUAL From version 2.0 we will update the manual whenever we release a new K2 feature sheet. You can download the latest version of this manual at any time from www.grouptechedge.com/manual/k2usermanual.zip
Please consider the environment before printing this manual. An electronic version has the benefit of being much easier to search and navigate than a paper version, and due to the continual development of K2 this manual is updated on a regular basis.
This manual is provided with book marks corresponding to the table of contents. Open the side panel in your PDF viewer and use Bookmarks to quickly navigate through the document. You can also use ‘Find’ feature in your PDF viewer to search for specific terms.
If you would like to receive feature sheets highlighting new developments in K2 please email [email protected] to be added to the mailing list. We also welcome your comments or suggestions.
Thanks,
TechEdge Support team

© TechEdge A/S 2015 3/62 [email protected]
1 INTRODUCTION 5
2 RUNNING MODE AND GOAL CRITERIA 6 2.1 Cover Guide and Optimization Modes 6 2.2 Goal Criteria 6
Reach by TVR/TRP/GRP: 6 Reach by Budget: 7 Fixed reach by TVR/TRP/GRP: 7 Fixed reach by Budget: 7 Cost-reach mode: 7
3 CAMPAIGN PARAMETERS 8 3.1 Area 8 3.2 Channels 8
Selecting Channels 8 Creating Channel Groups 9 Saving Channel Selections 9 Channel Views 10 Regional Channels (applicable to UK only) 10 Options 13
3.3 Daypart 13 Selecting Dayparts 13 Creating Dayparts 14
3.4 Targets 16 Selecting Targets 16 Creating Targets 16 Secondary Targets 17
3.5 Period 18 3.6 Flighting 19
4 CAMPAIGN SETTINGS AND CONSTRAINTS 22 4.1 Cost 22
Fixed cost mode 22 Variable cost mode 23
4.2 Channel constraints 26 Cover Guide Mode 26 Optimize Mode 28
4.3 Daypart Constraints 29 4.4 Weekly Constraints 30 4.5 Filters 30
Index Range 30 Best % 31 TVR Range 31 Exclude Spots in Daypart 31 Include Programmes 31 Exclude Programmes 32 Apply Ofcom Rules 33 Specific Spots 33
5 MANAGING CAMPAIGNS AND REPORTS 37 5.1 Running multiple campaigns 37 5.2 Running small/large campaigns 37 5.3 Saving reports 38
6 RESULTS 39 6.1 Key results 39 6.2 Secondary and Index Targets 40 6.3 Secondary Reporting Areas 41
© TechEdge A/S 2015 4/62 [email protected]
6.4 Tables by Channel Group 41 6.5 Reach 42 6.6 Tables by Channel 43 6.7 Multi Campaigns 44 6.8 Others 44
7 MONTE CARLO 45 7.1 Functions of Monte Carlo 45 7.2 Monte Carlo Output 46
User-defined splits 46 Historic splits 47 Settings – Structure Monte Carlo 48
8 COVER GUIDES 49 8.1 Build Up Cover Guide 49 8.2 Planning Cover Guide 50
9 GRAPHICAL SECTION 51 9.1 Global Setup 51 9.2 Cover Guide Chart 52
10 DECAY 53
11 REPORTS 56 Save tables to Excel 56 Best campaign spot list report 56 Campaign schedules report 57 Universe 57
12 SETTINGS 58 Default values 58 Settings 58 Algorithm 60 Spot Pool 61 Rep. Areas 62 Ofcom Rules 62
© TechEdge A/S 2015 5/62 [email protected]
1 Introduction
K2 is a strategic channel/daypart optimizer offering the following features:
Genetic- and hill climbing algorithms searches through the entire solution space ensuring optimal solutions, which are realistic and achievable
Works on respondent level (raw) data, including all channels and demographics, and calculating to market standards
Variable cost – share, seasonality, daypart sensitive prices Multiple campaigns scenario – optimization on total budget spend across
the year Verification of output as an optimal result

© TechEdge A/S 2015 6/62 [email protected]
2 Running mode and goal criteria
2.1 Cover Guide and Optimization Modes
K2 serves two purposes; optimization of channel and daypart splits and/or creating cover guides.
In order to get started you must first select if you wish to create cover guides based on a user defined channel/daypart split or if you wish to optimize. Toggle between the two running modes using the dropdown menu at the top right of the screen:
Figure 1: Selecting running mode
When you choose the Cover Guide mode you will be able to enter a channel/daypart split and K2 will calculate the reach and frequency (R&F) and other key figures.
The Optimizer mode allows you to leave the channel/daypart constraints empty and let K2 find the most optimal channel/daypart split.
2.2 Goal Criteria
Once you have selected the mode you must determine your goal criteria. The goal criteria are the following:
A ratings goal where K2 optimizes the reach or frequency
A budget goal/constraint where K2 optimizes the reach or frequency
A fixed goal where K2 optimizes the ratings or budget
Cost/reach scenario where the ratings and cost are given and a frequency goal is entered. K2 then displays the relationship between reach and total cost in order to see which campaigns are most cost efficient within the given constraints.
Reach by TVR/TRP/GRP:
This setting will optimize on channel and daypart splits, only taking into considerations the channels ability to deliver R&F. This goal criterion should be used if the purpose is only to create cover guides and disregard cost factors.

© TechEdge A/S 2015 7/62 [email protected]
Reach by Budget:
This setting allows you to set a budget constraint and use planning cost in order to see which channels are most cost efficient. One of the most important parameters of optimizing is cost as two channels can be equally good at delivering reach, but one might be more cost efficient than the other.
Fixed reach by TVR/TRP/GRP:
If you already have a set communication goal such as 50% 3+, this setting will work out the minimum number of ratings required to obtain your goal.
Fixed reach by Budget:
Same as above only this setting will tell you the minimum budget taking into account the cost efficiency of the channel.
Cost-reach mode:
The cost reach mode will within fixed parameters display several options, allowing the user to select a channel/daypart split depending on whether reach or cost is more important.
The ratings and planning cost will be fixed and K2 will go directly to the Monte Carlo section to display different channel daypart splits that all meets the set rating goal. Expensive campaigns will typically deliver more reach up to a point, where less expensive campaigns will deliver a lower reach. The user can sort on the column called Cost/Reach to see which campaigns are most cost efficient.
Once the goal criteria have been selected you must select the parameters of the campaign. Each input parameter is described more in detail on the following pages.

© TechEdge A/S 2015 8/62 [email protected]
3 Campaign Parameters
3.1 Area
First you must choose a reporting area to run the report on. This can be Full Network (the default for UK users), or any other reporting area available. Users outside the UK can choose between different countries if the data is available.
Figure 2: Selecting a Reporting Area
3.2 Channels
Selecting Channels
Choose the individual channels or channel groups you wish to include in the report. Any channel that has a staggercast (e.g.+1) sister channel will always figure as a “stagger”, thus automatically placing a spot an hour later on the +1 channel. For example, in a UK channel list there will be a single entry called ‘ITV2 (Stagger)’, rather than separate entries for ITV2 and ITV2+1. In some installations this channel may appear as ‘ITV2 (Total)’.
Figure 3: Channel Picker screen

© TechEdge A/S 2015 9/62 [email protected]
Clicking on the [Channels] button opens up the “Channel Picker” screen. See Figure 3. The cursor will automatically be in the ‘Filter’ input box at the bottom of the screen. Here you can type in characters to filter the channel list — in the example below ‘ITV’ has been entered in the Filter box, so the channel list only displays channels that include these characters.
Channels that have been selected at least once are represented by a light blue colour in the main channel list. By clicking on the tabs Name or Area column headings you can sort the channel list by these parameters.
Creating Channel Groups
The folder icon in the top right of the Channel Picker window creates a folder or subfolder for channel groups. Once you have created and named a folder, you can highlight it in the right-hand window and add channels to the folder using the channel picker. In the example below, a folder has been created that contains all ITV channels:
Figure 4: Creating channel groups
By default all channels within a folder will be displayed as one entity with the folder’s name as the reported entity for the purpose of both entering constraints (channel splits, daypart splits and costs) and in the subsequent report. However, it is still possible to split outputs by the individual channels within the folder. If you choose to optimize on channels groups, natural delivery will be used to divide ratings between the individual channels within the groups unless you choose otherwise.
Saving Channel Selections
You can save a selection of channels using the [Save as Group] button in the top-right corner of the Channel Picker. To recall a previously saved group, switch the mode using the [User defined groups] tick-box in the top-left corner. To edit a previously saved group, right click on the group name and choose [Edit]. It is possible to filter the channel user groups to only show a subset of users by clicking on the [Filter] button in the bottom right corner and putting a tick next to the user(s) you wish to see, and then clicking ‘Enable Filter’ and pressing [OK]. The list will then show only the selected users.

© TechEdge A/S 2015 10/62 [email protected]
Channel Views
Channel list views are user-made channel lists where only a relevant selection of channels is displayed. For example, you can set up a list view containing only sports channels or only channels operated by a particular broadcaster.
List views can be accessed using the dropdown menu in the top-right corner of the Channel Picker:
Figure 5: Channel list views
The ‘Default’ option always includes all available channels in the country(s) selected. [Edit view list…] brings up the ‘Edit Channel View’ window:
Figure 6: Edit channel view window
From here you can delete channel views by highlighting them and clicking on the trash can icon, edit an existing channel view by highlighting a channel view and pressing the [Edit] button, or create a new channel view by pressing the [Add] button. Please note that channel views can contain folder groups if required (see page 9). It is also possible to reorder the list of channel views using the blue up/down arrows.
Regional Channels (applicable to UK only)
If you work in the UK full network area and select a channel with regional channels such as ITV1 then by default you will be able to select which areas to include in the optimization.

© TechEdge A/S 2015 11/62 [email protected]
You do not need to select any additional channels if you only want to work on network channels. By default K2 will have chosen the network for the regional channels making it a national campaign. If you wish to up weight certain reporting areas click on the [Regions] button and check the box next to the reporting area(s) you wish to include. In the example below two full ITV reporting areas (London and Yorkshire) have been selected:
Figure 7: Selecting regions
It is also possible to select specific STI area(s) by selecting from the second level (e.g. pick ‘ITV Carlton’ instead of ‘ITV London’).
In the channel constraints section it will now be possible to enter local ratings by reporting area:
Figure 8: Regional channel constraints
Please note that when entering a TVR goal next to a regional channel in the Cover Guide running mode, the number you type in the left-hand column should be the regional TVR. K2 will then automatically convert this to a national TVR in the right-hand column. The goal entered for the campaign should be the sum of the national TVR. In Figure 8: Regional channel constraintsFigure 8 a TVR of 175 was set for London and 180 for Yorkshire. This equates to a national TVR of 32.8 and 18.5 respectively. The TVR goal would be 51.3 (the sum of the National TVR column) when running in ‘Reach by TVR’ mode.

© TechEdge A/S 2015 12/62 [email protected]
If one or more of the selected regions has multiple STI areas you can also specify a specific delivery across these areas. To do this, click on the region name in the channel constraints — see Figure 9
Figure 9: Selecting STI areas
You can now enter the TVR goal for the STI area, and K2 will convert this to both a local and national TVR.
Please note that with ‘Regions’ enabled it is not possible to select a channel group containing a channel with regional variations: the regional channel will always appear separately in both the constraints setting and the results. To overcome this ‘UK Regions’ functionality can be disabled in the Setup menu:

© TechEdge A/S 2015 13/62 [email protected]
Figure 10: Disabling UK Regions
With ‘UK Regions’ disabled you can no longer specify a regional split, but regional channels can be grouped together with non-regional channels and be treated as a single entity for entering channel constraints/reporting.
Options
The [Options…] button in the bottom right corner of the channel picker allows you to search for channel names [Find], create folders [New folder], and clear all selected channels [Clear].
3.3 Daypart
Selecting Dayparts
By default the daypart will be set to ‘All day’ for every channel. A daypart can be applied to each channel if desired by clicking on the [Dayparts] button and then clicking the hyperlink next to the channel name. Select a saved daypart from the list, or click the [Create Daypart…] button to create a new daypart. If you wish to you the same daypart for all channels, you can use the “apply all” button.

© TechEdge A/S 2015 14/62 [email protected]
Figure 11: Selecting dayparts
Creating Dayparts
To create a new daypart click on the [Create daypart…] button. The menu has three main options: Quick Daypart, Advanced Daypart or Intervals.
Figure 12: Creating advanced dayparts
Quick daypart: Type in time(s) for the dayparts you wish to analyse. When you have created your daypart(s), press ‘Save as’ and name your daypart group.
Advanced dayparts: Allows you to name dayparts (e.g. Breakfast, Daytime etc.) and add them to a certain group.

© TechEdge A/S 2015 15/62 [email protected]
First of all type the name of a folder in the ‘Title’ dialogue box, and click the ‘Add’ button to the right of this to create the folder. You will notice that the ‘To group’ drop-down menu automatically changes to the name of the folder you have just created. You can now change the start and end time and click the second ‘Add’ button to create a daypart in the group.
Figure 13: Advanced dayparts example
It is possible to create multiple groups by typing a new name in the ‘Title’ dialogue box and clicking ‘Add’ again. Use the ‘To group’ drop-down menu to select which group a new daypart should be added to. It is also possible to add multiple dayparts into the same group. In the example above, three daypart groups have been created.
When using Advanced Dayparts, it is also possible to make dayparts that only apply to specific channels and/or days of the week. To select the weekdays a daypart should apply to click on the ‘Weekdays’ button. When you now create a daypart in the ‘Advanced daypart’ section, it will only be applied to the days of the week selected here. The ‘Channel’ button works in the same way. For example, you can use the Weekday button to created two different peaktime definitions (one for weekdays, one for weekends), or use the Channel button to create different peaktime definitions for different channels.
Interval dayparts: This option allows you to split a time segment into its constituent intervals. You can select whether dayparts created here are added to individual groups, or added in to an existing group. Type in the desired interval duration (e.g. 10 min, 15 min), and the time period to be covered (e.g. 1800-2259). When you press ‘Add’, the daypart will be split into the interval you specified. As with Advanced Dayparts, you can use the ‘Weekdays’ and ‘Channels’ buttons when using Intervals to make dayparts that only apply to specific weekdays and/or channels.

© TechEdge A/S 2015 16/62 [email protected]
3.4 Targets
Selecting Targets
Click on the [Target] button to select the target that you wish to optimize against. It is possible to select secondary targets both before and after running the optimization (see page 17), but in the target picker only one target can be chosen and optimized against.
Creating Targets
If the target you wish to use in your analysis has not already been defined in your system, use the ‘Create Target’ button at the top-right of the Target Picker to enter the Create Target view.
Figure 14: Create Target window
On the left hand side of the Create Target window you will see all the demographic information available. This information varies by country, and for those users with multi-country installations you can also select which country you wish to create a target in by expanding the relevant country flag. You can then click on a ‘+’ sign next to a level of demographic information to see the dimensions available, and select the relevant dimension(s) by either double-clicking or by using the right arrow in the middle of the window.
As you start to build your target by selecting demographic dimensions, the sample size and universe information displayed in the top-right corner of the Create Target window automatically update. Please note that the universe figure is given in 000s. By clicking on the date you can change the period to which the sample and universe size relates. The demographic information used in a panel may change over time, meaning that some demographics may only be used in certain date ranges. Where this is the case it is usually indicated by a date range in brackets next to the demographic name.
© TechEdge A/S 2015 17/62 [email protected]
Once you are happy with the target you have created, press the ‘Pick’ button at the bottom-right of the Create Target window to use the target in a query without saving it, or press ‘Save As’ and give your target a name to save it for future use. In the future it can then be selected by expanding the relevant user name in the Target Picker.
Secondary Targets
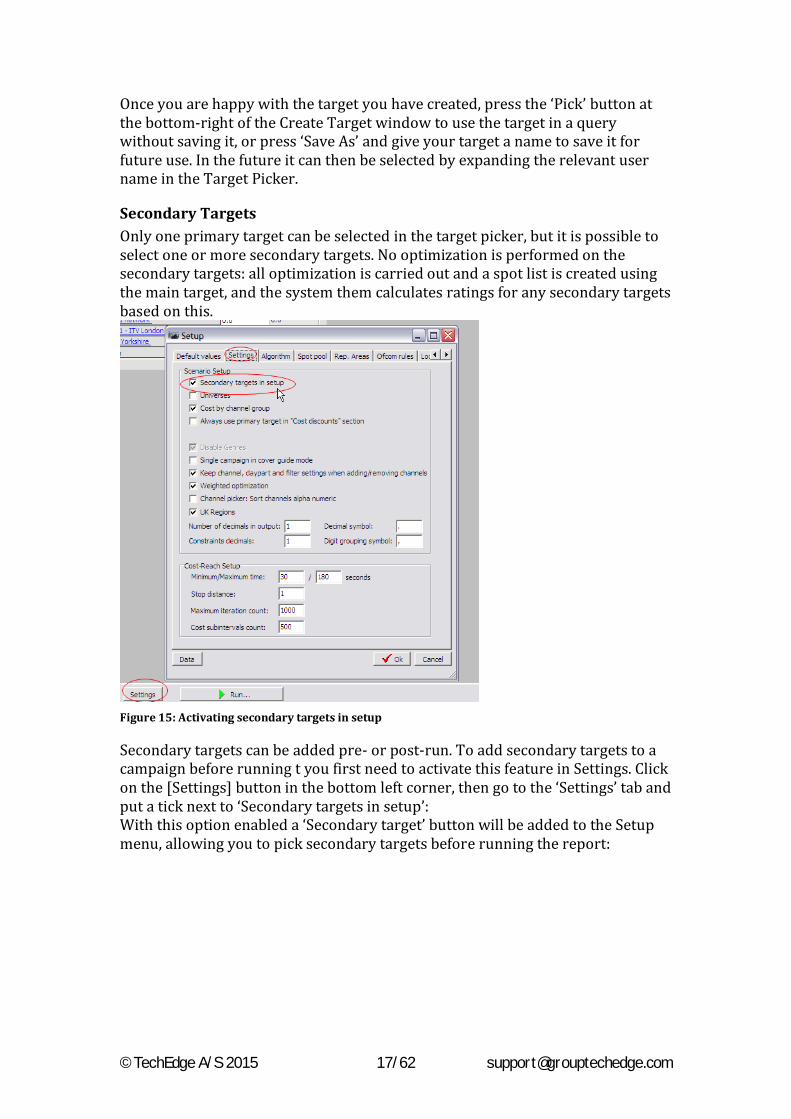
Only one primary target can be selected in the target picker, but it is possible to select one or more secondary targets. No optimization is performed on the secondary targets: all optimization is carried out and a spot list is created using the main target, and the system them calculates ratings for any secondary targets based on this.
Figure 15: Activating secondary targets in setup
Secondary targets can be added pre- or post-run. To add secondary targets to a campaign before running t you first need to activate this feature in Settings. Click on the [Settings] button in the bottom left corner, then go to the ‘Settings’ tab and put a tick next to ‘Secondary targets in setup’: With this option enabled a ‘Secondary target’ button will be added to the Setup menu, allowing you to pick secondary targets before running the report:

© TechEdge A/S 2015 18/62 [email protected]
Figure 16: Selecting secondary targets in setup
Click on [Secondary trg:] and then [Targets] to select the secondary target(s). It is also possible to save the selection as a default for future reports.
In addition it is also possible to add secondary targets to a report after it has been run. Please see page 40 for more details.
3.5 Period
The period that is entered should reflect your campaign period. If you have a 4 week campaign the reference period should also be 4 weeks to proper reflect the R&F build up. The reference period should be chosen carefully to reflect the same viewing pattern as the actual period where the campaign will be launched (for example same period last year).
Press the [Period] button to open the period picker dialogue box. On the left hand side you can change the period resolution between years, months, quarters, weeks and days. Highlight the period you wish to analyse and press the right arrow to select it.

© TechEdge A/S 2015 19/62 [email protected]
Figure 17: Period Picker
3.6 Flighting
The Flighting feature allows you to alter the ratings/budget mix by channel and daypart across a period. This feature is only available when using the ‘Cover Guide’ running mode mode (see Cover Guide and Optimization Modes on page 6).
When entering the period, select the individual sub-periods that you want to use in your flighting. For example, if you wish to run weeks 14 to 17 and vary the flighting by week, then select each of the 5 individual weeks:

© TechEdge A/S 2015 20/62 [email protected]
Figure 18: Period selection for Flighting
This can of course be months, days or any other periods. After entering the usual channel, period target and daypart (if required) selections, tick on the ‘Define flighting’ checkbox and click the ‘Define flighting’ link to set up your flighting. Please note that you do not need to enter a ratings or budget goal, as this will be filled in automatically based on your flighting:
Figure 19: Define flighting

© TechEdge A/S 2015 21/62 [email protected]
You can now enter the number of ratings or budget required for each channel by sub-period (the arrow keys on your keyboard can be used to move between cells):
Figure 20: Flighting channel constraints
If you are using dayparts in the run, click on the ‘Channels’ link to toggle between channel constraints and daypart constraints and enter the % split across dayparts. After entering the splits for one channel/period you can right-click and select ‘Apply splits to all period segments’ to copy the same splits to all periods, or ‘Apply splits to all channels’ to apply copy the splits to all channels:
Figure 21: Flighting daypart constraints
After pressing OK the TVR/Budget goal will be set to match the sum of your flighting and you can proceed with your run as normal.

© TechEdge A/S 2015 22/62 [email protected]
4 Campaign Settings and Constraints
4.1 Cost
If you are working on a cost rather than ratings goal (e.g. Reach by Budget), the first thing to fill in is the costs. The cost section is quite advanced as it features both fixed and variable cost.
Fixed cost mode
The fixed cost option is relatively simple. You can manually enter a Cost per Point (CPP) or a Cost per Thousand (CPT) price for each channel/channel group you have selected. The price can be an average for the day or specified by daypart. The cost that is entered should reflect the actual price relating to the budget. If you have entered a net budget, the costs should be net costs. Similarly the cost should reflect if you are working on 30” or 15” etc.
Figure 22: Entering costs in Fixed Cost mode
When using Fixed Cost mode, the buying audience will default to the target entered in the campaign setup. However, cost can be entered for any buying target audience. K2 will then automatically calculate the conversion between the campaign target and the buying target, and display how many ratings are needed in both targets. Click on the ‘Cost…’ hyperlink under a channel name to change the buying audience and/or switch between CPP and CPT. Click on the target name (for example, Adults in Figure 23) to open the target picker, and select a new buying target for the channel. Click on ‘Apply all’ if you wish to use this new buying target for all channels.

© TechEdge A/S 2015 23/62 [email protected]
Figure 23: Switching buying audience
Variable cost mode
The variable cost mode allows you to enter a price that varies depending on seasonality, volume, daypart or share allocation. This allows you to optimize on cost that changes depending on the share volume to a single channel when you are doing annual negotiation deals, and enter your annual deals for each client once the prices have been settled.
Having selected Variable cost mode, the Cost settings section will now show ‘-None-’ next to each channel/channel group:
Figure 24: Variable cost mode
Click on “-None-“ next to a channel name to select a predefined cost discount structure to apply to the channel/channel group if one is available, or to create a new cost discount structure. When creating a new variable cost structure, you will be asked to pick between a volume-based model and a share allocation model:

© TechEdge A/S 2015 24/62 [email protected]
Figure 25: Creating a new variable cost structure
The ‘Type’ column shows whether saved cost templates were created using the ‘Volume’ or ‘Share’ mode.
Variable Cost by Volume When creating a new Volume discount structure, start by entering a base CPP/CPT:
Figure 26: Entering base CPP/CPT
You can then use the tabs to apply one or more discount structures to this base CPP/CPT:

© TechEdge A/S 2015 25/62 [email protected]
Flat Discount: Enter any flat discounts given to the client. You can choose to enter the cost as an index, rebate or reinforcement and whether the discounts should be added or multiplied.
Season: Periods can be entered freely by typing dates (in the format ‘ddmmyy’) in the From and To columns. You can then enter a discount rate (either as an index, rebate or reinforcement) to be applied to the period. ‘Auto fill’ allows you to enter a discount value in all the rows at once. The [Week] and [Month] buttons allow you to easily create weekly or monthly periods for a whole year.
Volume: By setting up a “ladder” of volumes and corresponding discounts the model takes into account the total budget level to a given station when optimizing. Daypart: The daypart section of the cost structure allows you to differentiate the CPP/CPT by daypart by applying an index to the base CPP/CPT. Click on [Daypart] to select a daypart scheme (see Daypart on page 13 for further information on selecting and creating dayparts).
Variable Cost by Share You can also work with variable cost based on share allocation by clicking on [New] and selecting ‘Share’ from the menu. Using variable cost by share allows you to set up costs that change depending on the share. This way the appropriate prices will be used at varying share levels to a given TV-station during the optimization.
Once you have selected to set up a new variable cost structure “By share” you will need to enter a CPP or CPT. You can attach the cost to a specific target group, but this is not mandatory unless you wish to see the conversion between an optimization target and a cost target.
For each 5% share interval you can set an index which the CPP/CPT is multiplied with during optimization.
Figure 27: Discount structure by share

© TechEdge A/S 2015 26/62 [email protected]
Please note that share works in internval of 5% and is rounded down (e.g. any share between 10 and 14.99 wil get the cost entered for 10). The exception is 5, where any share between 0- and 4.99 will get the cost for 5% share, and 100 where the cost is only applied if the TV-station gets exactly 100% share.
If you enter an index at the interval at 5 and at 100 and press “autofill”, the system will calculate the linear index between the shares automatically and populate all other index values.
In the Monte Carlo section the price also changes accordingly to the share allocation, giving you a true picture of the dynamics of share and price:
Figure 28: Variable cost by share in Monte Carlo
Importing CPP/CPT Data CPP/CPT data can also be imported into K2 from a spread-sheet to save the end users keying in cost information. Since the format of cost spread-sheets vary, this is a bespoke development for each client. Please contact TechEdge Support for further information.
4.2 Channel constraints
Cover Guide Mode
When running in ‘Cover Guide’ mode (see Cover Guide and Optimization Modes on page 6), the channel constraints entered must sum to 100% (if working on percentages) or the TVR goal (if entering channel constraints as ratings). You can switch between ‘%’ and ‘TVR’ in channel constraints by clicking on the unit name above the channel list.

© TechEdge A/S 2015 27/62 [email protected]
Figure 29: Channel constraints entered as % must sum to 100 in Cover Guide mode
Figure 30: Channel constraints entered as ratings must match TVR goal in Cover Guide mode
If you want your campaign to be based on natural delivery, pressing the [Natural delivery constraints] will automatically calculate natural delivery (share of 30-sec equivalent commercial impacts) across the selected channels and fill in the channel constraints accordingly. When applied to a channel that has no spot log in AdvantEdge, K2 simulates a 3 minutes break on the channel every 20 minutes and calculates the fictive TVRs accordingly.
Figure 31: Using Natural Delivery
If your channel selection includes channel groups (see Creating Channel Groups on page 9) then the channel group name will be displayed in the channel

© TechEdge A/S 2015 28/62 [email protected]
constraints list, and a single value can be entered against the group. By default, natural delivery will then be used to apportion ratings/budget across the channels contained in the group. By clicking on the group name it is possible to override this by clearing the ‘natural delivery’ tick box and manually entering a % split between the channels so that sum equals 100%:
Figure 32: Setting channel distribution within a channel group
Optimize Mode
When running in Optimize mode (see Cover Guide and Optimization Modes on page 6) you can leave the channel constraints empty if you want K2 to optimize freely across the whole solution space. K2 will then distribute ratings/budge across all selected channels in order to maximize your chosen goal.
Alternatively you can enter a minimum and/or maximum value for each channel/channel group. A maximum of 60% of ratings have been assigned to Channel 4 in the example below, with no minimum constraint. In this case the remaining ratings will be freely distributed across the other three channels in order to maximize reach:
Figure 33: Setting min/max channel constraints
If you enter the minimum values so they sum up to 100 then the system will simply run the scenario through based on the exact channel splits (the same as Cover Guide mode). If you want your campaign to be based on natural delivery, pressing the [Natural delivery constraints] will automatically calculate natural delivery (share of 30-sec equivalent commercial impacts) across the selected channels and fill in the

© TechEdge A/S 2015 29/62 [email protected]
channel constraints accordingly. Any campaign based on Natural Delivery will have “N.D” appended to the campaign title for ease of reference.
By clicking on ‘%’ above the list of channels in the Channel constraints window you can switch to a ratings mode and enter min/max ratings by channel or channel group.
4.3 Daypart Constraints
If no dayparts have been selected the default setting will be ‘All day’, and no constraints need to be entered. Likewise if a single daypart has been entered (such as 1900-2259hrs) then no constraints can be entered.
If multiple dayparts have been selected then the same principle applies here as with the channel constraints. When running in ‘Cover Guide’ mode, the daypart constraints for each individual channel or channel group must sum to 100%:
Figure 34: Entering daypart constraints in Cover Guide mode
Please note that if you wish to apply the same daypart constraints across all channels/channel groups you can fill in the values for the first channel and then right-click and select ‘Apply to this campaign’ to enter the same values against all other channels/channel groups. If the [Natural delivery constraints] button has been pressed in Channel Constraints, all daypart splits are also filled in based on share of commercial impacts. When running in Optimize mode, minimum and maximum daypart constraints can be entered if desired:

© TechEdge A/S 2015 30/62 [email protected]
Figure 35: Entering daypart constraints in Optimize mode
If no daypart constraints are entered in Optimize mode then K2 will find the optimal spread across the selected dayparts, and the campaign results will show the optimal distribution across the dayparts. When running in Optimize mode it is also possible to select an ‘Average’ daypart split based across all selected channel rather than specifying the daypart split for each individual channel. This can be toggled by clicking on the ‘Average’ and ‘By channel’ links in the Daypart Constraints input window,
4.4 Weekly Constraints
If the weekly constrains are left empty K2 will automatically distribute the ratings evenly across the weeks. Alternatively you can choose the front or backload the campaigns by specifying the % split across the selected weeks (in Cover Guide mode) or by entering a min/max % by week (in Optimize mode).
4.5 Filters
As K2 works on the average delivery of campaigns made out of randomly selected spots, the filter section allows you to include and/or exclude certain spots from the available spot pool. Filters are applied at channel level – when multiple channels have been entered for the campaign, use the ‘Channel’ drop-down menu to select the channel/channel group the filter should apply to. Please note the different filters can be applied independently to each channel/channel group in the campaign.
Index Range
Before using the Index filter you need to click on [Idx trg] and select an Index target. This will calculate a ratings conversion between the campaign target and the index target: Index = (Campaign Target TVR/Index Target TVR) x 100.
You can then select the index range of the spots you wish to include. In the example below K2 will only use spots with an index above 100 but no higher than 300 when indexed against Adults:

© TechEdge A/S 2015 31/62 [email protected]
Figure 36: Setting an index filter
Please note that leaving the ‘To’ box blank removes the upper limit on the index, giving you all spots that index over the ‘From’ figure.
Best %
As above, this filter is based on the index between the campaign target and the index target. In this case the spot pool is limited to only choose from the best X% (for example 50%) of spots, based on the index of the campaign target compared to the index target.
TVR Range
This filter allows you to exclude all spots below or above the specified ratings level.
Exclude Spots in Daypart
This filter allows you to remove spots from the spot pool within the selected daypart.
Include Programmes
This filter allows you to specify programme(s) that you would like to place spots in as part of your campaign. Please note that the campaign will also use spots outside of the selected programme(s). Click on the [Prog] button to open the programme picker:

© TechEdge A/S 2015 32/62 [email protected]
Figure 37: Programme picker
From here you can use the [Find] button to search for and select specific titles. It is also possible to make a selection based on programme metadata – for example, selecting a genre.
Once you have made your selection and pressed the [Pick] button, a ‘Programmes’ hyperlink will appear next to the ‘Include Programmes’ filter. Clicking on this will bring up a list of all relevant programming and show the TVR for each programme. You can use the [Include selected] and [Do not include] buttons to refine your selection and choose specific transmissions in which you would like spots to be placed.
Figure 38: Programmes filter
Exclude Programmes
This filter works in the same way as the ‘Include Programmes’ filter (see above), but no spots will be placed in the selected programme(s).

© TechEdge A/S 2015 33/62 [email protected]
Apply Ofcom Rules
This UK-specific filter allows users to filter out spots that a campaign would not be permitted to use under Ofcom’s rules governing advertising of fast food. Before using the filter for the first time you must select the main and index target as well as the conversion number you wish to use under [Settings]:
Figure 39: Setting up Ofcom rule
Once this has been done, ticking on the ‘Ofcom rules’ filter will automatically exclude any spots outside the permitted index range.
Specific Spots
It is now possible to select some specific spots to be included as part of a campaign. This feature is available in both Optimize and Cover Guide running modes.
After setting up your campaign as normal, tick on the ‘Include specific spots’ option in the ‘Filter’ section to activate it, and then click on the ‘Specific spots’ button:
Figure 40: Include specific spots

© TechEdge A/S 2015 34/62 [email protected]
This will open a window allowing you to create a spot pool by filtering on channel, period and (optionally) daypart or brand information. After making your selections click on ‘Add item’ to add these spots to the spot pool. Multiple selections can be made in this way. Click ‘OK’ when all selections have been made:
Figure 41: Defining a spot pool for Specific Spots
Next click on the ‘Filter…’ link to bring up a list of spots matching your search criteria. Please note that this list can be sorted by clicking on a column heading (hold down Ctrl on your keyboard to sort by multiple columns). By default all spots will be excluded (indicated by red text). Highlight any spot that you would like to specifically include in your campaign and press the ‘Include Spots’ button to add it. The text will turn black:

© TechEdge A/S 2015 35/62 [email protected]
Figure 42: Selecting specific spots
When you have selected all the required specific spots click the ‘OK’ button. The ratings/cost of the selected spots will automatically be taken from the overall goal for the campaign, and K2 will allocate the remaining ratings/budget in the normal way.
In the Campaign Results screen two extra tables will be added. ‘Unique reach by specific spots’ shows how much unique reach the selected spots have added to the overall campaign, and how much unique reach the other spots added. E.g. in the example below the specific spots have added 1.8 unique reach points, so if these spots were to be excluded the overall reach of 70.9% would fall to 69.1%. ‘Specific spots’ shows the sum ratings of the specific spots and the Reach %.

© TechEdge A/S 2015 36/62 [email protected]
Figure 43: Specific spots in campaign results
Any specifically selected spots will also be marked in the ‘Campaign schedules report (see page 57).

© TechEdge A/S 2015 37/62 [email protected]
5 Managing Campaigns and Reports
5.1 Running multiple campaigns
It is possible to run multiple campaigns in K2 in order to easily compare results. Click the [Add] button at the top of the screen to add an additional campaign. The new campaign will inherit the settings from Campaign 1, although these can then be adjusted.
Figure 44: Adding a campaign
Pressing the [List] button opens the campaign list view, form where you can add, delete or copy campaigns.
By default the campaigns will be named ‘Campaign 1’, ‘Campaign 2’ etc. These can be replaced with custom names by clicking on the campaign title.
5.2 Running small/large campaigns
By default K2 is set to perform 100 iterations of each campaign in order to present the optimal campaign and calculate averages. When running very small campaigns this may not provide the desired level of accuracy – this can be seen in the Results menu by checking the ‘R&F Confidence (+/-)’ and ‘R&F min/max’ values (see Key results on page 39).
If the confidence range is too large, the range can be diminished by running additional iterations at the expense of processing speed.
Conversely, when running large campaigns the simulation iteration count can be decreased to speed up processing time and avoid potential out-of-memory errors. The number of iterations can be changed by clicking on [Settings] in the bottom right corner of the main screen and changing the value in ‘Simulation iteration count’ on the Algorithm tab.

© TechEdge A/S 2015 38/62 [email protected]
Figure 45 - Changing Simulation iteration count
5.3 Saving reports
Reports can be saved pre-run by clicking on the [Save] button at the bottom of the screen. You will be asked to enter a name for the report and select a user/group to save it under. It is also possible to save reports post-run.

© TechEdge A/S 2015 39/62 [email protected]
6 Results
6.1 Key results
The Results tab gives the summary figures for the campaign. If two or more campaigns have been run simultaneously (see page 37) the each table will be replicated for each campaign.
By default the first table displays the reach, reach confidence interval, number of ratings, ratings index and average frequency. By clicking on [Layout] it is possible to add additional units to this table by ticking on them in the ‘Key Figures’ section.
Figure 46: Results tables
The second table shows the percentage distribution of ratings by channel. If multiple dayparts were used in the campaign, the ratings here will be split by channel and then daypart. These channel/daypart splits are also displayed graphically to the right of the tables.
The third table shows frequency distribution (the % reach by frequency level). The frequency levels displayed in his table (and also in cover guides) can be changed by clicking on [Layout] (see Figure 47). Frequency levels can be cumulative (e.g. 3+), exact (e.g. 3), or ranges (e.g. 1-3).

© TechEdge A/S 2015 40/62 [email protected]
Figure 47: Selecting frequency levels
6.2 Secondary and Index Targets
Secondary targets can be added to a report after the initial run by clicking the [Layout] button and then clicking the [Targets] button under ‘Secondary targets and universes’. Columns will be added to the report tables for any selected secondary target(s), and cover guides will also be replicated for these targets. Please note that secondary targets may also be included as part of the initial query setup (see page 17).
Figure 48: Adding secondary targets

© TechEdge A/S 2015 41/62 [email protected]
In this same section it also possible to change the Index target used for calculating affinity.
6.3 Secondary Reporting Areas
It is also possible to add secondary reporting areas to a campaign where applicable. For example, it is possible to run a UK Network campaign, and then select London as a secondary reporting area to see what ratings and reach that network campaign would give in the London area. Secondary areas are activated by clicking on [Layout] and then [Rep. Areas], and selecting the desired areas from the list. A new column will then appear in the ‘Key Figures’ table for each selected area, and new rows will be added to the ‘Frequency distribution’ table. Cover guides will also be replicated for each area.
Figure 49: Selecting secondary reporting areas
6.4 Tables by Channel Group
By clicking on the [Layout] button you can add additional tables summarising data by channel groups to the report.

© TechEdge A/S 2015 42/62 [email protected]
Figure 50: Tables by channel group
TVR Distribution Shows the actual number of ratings given to each channel group.
TVR/budget Distribution (cost targets) Shows the actual number of ratings and spend given to each channel group based on the buying audience for each channel group (see page 22).
Costs Shows either the CPT or CPP for each channel group. Use the drop-down menu to toggle between CPT/CPP.
Share/Average TVR Show the average rating and the average share for each channel group.
Spot Count Gives a count of the number of spots used on each channel group.
6.5 Reach
By clicking on the [Layout] button you can add additional tables summarising Reach to the report.
Figure 51: Reach tables
Unique reach by channel Shows the unique reach (in %) added to the campaign by individual channel.

© TechEdge A/S 2015 43/62 [email protected]
Unique reach by channel group Shows the unique reach (in %) added to the campaign by channel group (e.g. all channels within a folder will be reported as one line).
Reach by channel Shows the total reach of the campaign on each individual channel.
Reach by channel Shows the total reach of the campaign on each channel group.
Reach by Week Show the total reach of the campaign by week.
6.6 Tables by Channel
By clicking on the [Layout] button you can select to show additional information by channel.
Figure 52: Tables by Channel
TVR Distribution Shows the number of ratings assigned to each channel.
TVR/budget distribution (cost targets) Shows the number of ratings per channel in the cost target, and the budget assigned to each channel (only available when costs have been entered).
Costs Shows either the Cost Per Thousand (CPT), the Cost Per Pont (CPP) or the % of budget assigned to each channel. Use the dropdown to cycle between units. Only available when costs have been entered.
Share/Average TVR Displays the average TVR and the average share of viewing for the selected spots per channel.
Spot Count Shows the number of spots given to each channel.

© TechEdge A/S 2015 44/62 [email protected]
6.7 Multi Campaigns
These tables are only available when running multiple campaigns (see Running multiple campaigns on page 37). Click on [Layout] to select these tables.
Figure 53: Multiple campaign tables
Campaign average table Shows the average percentage distribution of ratings/budget by channel group across all campaigns, and (if running in cost mode) the average CPT or CPP by channel group across all campaigns.
Total summary This adds a table summarising the reach, average frequency and number of ratings for each campaign.
6.8 Others
Constraint settings This will summarise the constraints entered for each campaign. For example, when running in Optimize mode this will show the minimum/maximum constraints entered for channels, dayparts and weeks.

© TechEdge A/S 2015 45/62 [email protected]
7 Monte Carlo
7.1 Functions of Monte Carlo
The Monte Carlo provides six functions:
To prove that an optimal solution has been found. By letting the Monte Carlo algorithm create random channel/dayparts splits and running multiple iterations on each split to see the average delivery, the Monte Carlo function compares the result to other channel daypart splits. K2 will automatically use the same restrictions as used in the input. These can however be changed in the settings section under “splits”.
By creating different channel/dayparts splits that has a delivery similar or close to the optimal channel/daypart split it illustrates that there are multiple ways of achieving the goal desired goal.
The Monte Carlo algorithm illustrates where each channels plateau is. In the graph on the right hand side of the screen the effective reach is displayed on the Y axis and share allocation to a certain channel on the X axis. This illustrates the share level where the channel performs well under the parameters and restraints given in the input.
Monte Carlo allows the user to manually enter channel/dayparts splits and compare to the optimal result.
It is possible to compare optimal result with actual historical campaigns
When running in Cost /Reach mode (see Goal Criteria on page 6) the only output is the Monte Carlo section.

© TechEdge A/S 2015 46/62 [email protected]
7.2 Monte Carlo Output
Figure 54: Monte Carlo results screen
The main window displays the channel and daypart splits for each campaign along with reach and ratings. Initially just one campaign will be displayed (marked ‘Optimal’ in the Type column) – this is the best campaign created by K2 during the initial run. By pressing the [Start] button at the bottom of the screen K2 will begin running random simulations (within the constraints settings entered) and add these results to the table and graph. These simulations are not optimised in any way – K2 will simply run random scenarios until it exhausts the possible splits. These campaigns will have the type ‘MC’ entered next to them. If you have set up an optimisation run, occasionally leaving Monte Carlo running simulations may yield a campaign with a slightly more efficient channel/daypart split, in which case the ‘Optimal’ campaign will drop down the ranking list. It is also possible to sort the data by clicking on a column heading.
The graph to the right illustrates the relationship between the total cost/ratings of the campaign and the reach obtainable. Each campaign run in Monte Carlo mode will be plotted on this graph. Use the dropdown below the graph to select the channel group to be displayed.
User-defined splits
It is possible to manually enter channel and daypart splits and see the reach achieved by pressing the [Splits] button at the bottom of the screen and choosing ‘User defined splits’:

© TechEdge A/S 2015 47/62 [email protected]
Figure 55: User-defined splits
From here you can manually enter channel splits (first row) and daypart splits. Press [Calculate] to calculate the reach for the entered splits. Press [Clone] to create a new user-defined split that inherits settings from the preceding one, or [Add Split] to create a new split with values set to zero. Press [Enter] to add the user-defined splits to the main Monte Carlo output – they will be marked as ‘User def’ in the Type column and will appear as blue dots on the reach chart.
Historic splits
This option allows you to compare results against actual historical campaigns.
Figure 56: Historical splits
Click on [Splits] and select ‘Historical Splits’, and then use the [Period] and [Brands…] buttons to select the desired date range and brand(s) or product categories, then click [Run] to generate the results.
K2 will automatically split data into separate campaigns by brand and period. The ‘Within constraints’ column will show you whether a campaign adheres to the constraints entered for the K2 run. Campaigns that fall outside the constraints can be removed by right-clicking and selecting ‘Remove invalid

© TechEdge A/S 2015 48/62 [email protected]
campaigns’. All campaigns will automatically be adjusted to the same rating or budget level as the campaign constraints entered in the input section. Only the channel/ daypart split will be used to benchmark against the optimal solution. Historical campaigns can be added to the main Monte Carlo results screen by pressing [Enter] – these will be marked as ‘Hist’ in the Type column, and will appear as green dots on the reach chart.
Settings – Structure Monte Carlo
A structured Monte Carlo mode can be entered by clicking on [Splits] and choosing ‘Settings’.
Figure 57: Structured Monte Carlo
Tick to activate ‘Structured Monte Carlo’ and add a step increment value between 1 and 50. The ‘Check’ button calculates the number of possible permutations and notifies you if this is greater than 2000, in which case it is recommended to increase the step value.

© TechEdge A/S 2015 49/62 [email protected]
8 Cover Guides
Two different cover guides are available in K2 – a Build Up cover guide and a Planning cover guide. A Build Up cover guide displays the actual build for a specific campaign over the selected period up to the rating or budget level selected for the campaign. A Planning cover guide considers each ratings point to be the end of the campaign, and redistributes spots accordingly. It can thus be used as a generic cover guide.
The reason for the difference is that a campaign which delivers 300 ratings over 3 weeks will have a different reach build up compared to a campaign which delivers 100 ratings across the weeks. Each campaign will deliver a different Reach result at 100 ratings because the density of the spots will be different.
Cover guides are generated for both primary and secondary targets/reporting areas when these have been selected. If multiple campaigns were included in the run (see 5.1 on page 37) cover guides will be generated for each campaign.
8.1 Build Up Cover Guide
The Build Up cover guide displays the reach build for the campaign up to the rating level for the campaign. This can be displayed by day, by week or by rating level – use the tick boxes to select which table(s) to display. When selecting to display the reach by rating, you can specify rating interval to use – click [Update] to apply the setting to the table. If a budget goal was entered for the campaign, the cost will also be calculated at each rating interval.
Figure 58: Buildup Cover Guide
Please note that the frequency levels displayed in the cover guide are inherited from the settings in the main Results screen. To change these click on [Layout] in the main Results page (see Figure 47). Frequency levels can be cumulative (e.g. 3+), exact (e.g. 3), or ranges (e.g. 1-3).

© TechEdge A/S 2015 50/62 [email protected]
8.2 Planning Cover Guide
Before calculating a planning cover guide you must input a Start TVR/cost, a Step TVR/cost (e.g. the rating or cost interval to display) and an End TVR/cost. If the campaign was run in cost mode, you can use the link above the input boxes to switch between cost or ratings values. Please note that the end TVR/cost can exceed that of the original campaign – K2 will use the reach build to model the additional reach provide by any extra ratings/budget. If costs have been used to construct the planning cover guide, the table will also show the number of ratings delivered at each cost interval.
Figure 59: Planning Cover Guide
If one or more secondary targets have been included in the analysis, a planning cover guide will also be displayed for each target. These will display the cost/TVR based on the primary target, the TVR level for the secondary target (e.g. conversion), and the reach levels for the secondary target.

© TechEdge A/S 2015 51/62 [email protected]
9 Graphical Section
The graphical section displays the campaign results in chart format.
9.1 Global Setup
Use the Global Setup section in the top right corner to select which campaign to display (where multiple campaigns have been run simultaneously), which target(s) to display (where secondary targets have been included), and the R&F mode to use (by Cost or by Rating) if costs have been used. You can also chose to tick on/off a ‘Total Summary’ table which will be overlaid on the cover guide graph showing Reach, Frequency, TVR and Budget for the campaign, and the chart legend. These settings are applied to all graphical outputs.
Figure 60: Global Setup

© TechEdge A/S 2015 52/62 [email protected]
9.2 Cover Guide Chart
The first chart displays the reach build by rating/budget. Use the settings under ‘Cover Guide’ on the right hand side of the screen to select which frequencies to display on the chart, and also which campaign(s) should be displayed. This makes it easy to compare the reach build of multiple campaigns. The other menu options allow you to toggle off/on a cover guide table, a weekly cover guide and a Frequency Reach Graph.
Figure 61: Cover Guide chart options

© TechEdge A/S 2015 53/62 [email protected]
10 Decay
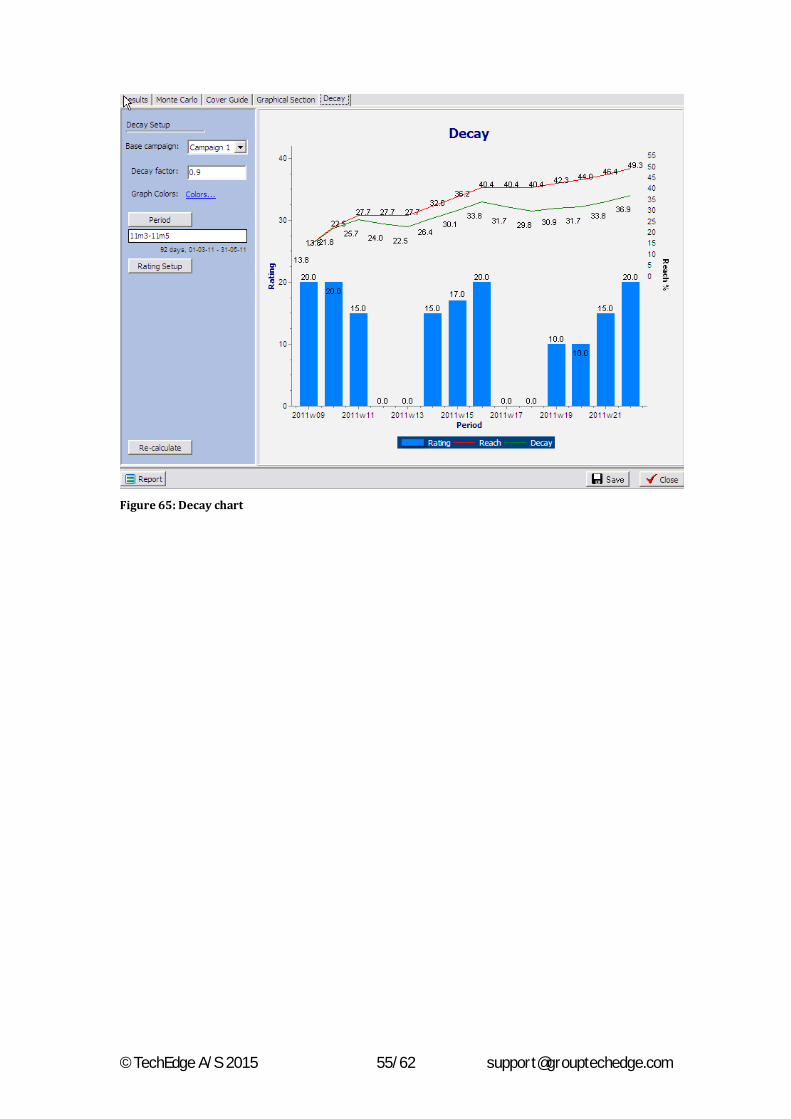
It is possible to include a decay factor in a K2 output to model the effect of periods of inactivity and the reduction in advertising effectiveness with time elapsed. The decay calculation is based on reach, but the ratings value for the previous week/month is factored by a user defined factor.
Figure 62: Decay chart
For example, consider a two-week campaign with 100 ratings each week. Reach for this campaign is based on 200 ratings. Decay for the campaign is based on 190 ratings (100 for the current week and 90 for the previous week) if the decay factor is set as 0.9.
The decay graph will keep adjusting by a factor in periods where there is no activity, whilst the reach curve stays at the same level until a new campaign starts.
One important aspect of this functionality is that it allows you to type in ratings level by week/month for large periods of time. The cover guide figures where the reach and decay figures are taken from the period that you have defined in the input screen.

© TechEdge A/S 2015 54/62 [email protected]
Figure 63: Selecting period for Decay
By default the ratings are populated based on the goal for the campaign, but any ratings values can be entered,
Figure 64: Enter ratings by week/month

© TechEdge A/S 2015 56/62 [email protected]
11 Reports
The [Report] button is situated at the bottom-left corner of each output screen (Results, Monte Carlo, Cover Guide, Graphical Section and Decay):
In each case it contain four options:
Save tables to Excel
This option will save any tables/charts currently displayed on screen to an Excel file – e.g. if this option is used in Cover Guide window, only the Cover Guide tables will be saved to an Excel file. A ‘Save’ dialogue box will open, allowing you to specify a save location and file name.
Best campaign spot list report
This option will create a PDF document listing each individual spot used by J2 to create the optimal schedule, including ratings for each spot and cumulative reach. Use the drop-down menu at the bottom of the screen to zoom in/out, and use the [Prev<-] and [->Next] buttons to navigate through the pages. The spot list will be preceded by a campaign summary showing the reach achieved and the channel splits used.
Figure 66: Best campaign spot list

© TechEdge A/S 2015 57/62 [email protected]
Campaign schedules report
This option allows you to export a spot list to Excel. You will be presented with an option to ‘Include best campaign spot list’ in the export. This will include the spot list from the optimal schedule (the same spot list used by the ‘Best campaign spot list’ report described above). You can also opt to output additional campaign schedules. These additional campaigns will be ranked according to their performance – e.g. ticking on ‘Include best campaign spot list’ and selecting two additional campaigns will produce three spot lists in Excel: the optimal campaign, the second best campaign and the third best campaign.
Universe
The [Universe] button displays the sample and universe information for all targets used in the query. By default this will show the ‘R&F Sample’ which is based on the middle day of the selected period. This can be changed using the dropdown menu to show the average sample/universe across the period, or the daily/ weekly/ monthly/yearly split. Universe data can be exported to Excel using the [Excel] button.

© TechEdge A/S 2015 58/62 [email protected]
12 Settings
The [Settings] button located in the bottom left corner of the main screen opens a menu with five tabs.
Default values
Changes made here effect the default values entered into K2 upon start-up.
Figure 67: Default values
Default values can be entered for the reporting Area, and a default Channel selection can also be made (the system default is blank, with no channels entered on startup). Default planning and index targets can also be selected, as well as a universe. The default cost mode can be switched between CPT, CPP or Cost Discount.
Settings
The first option on the Settings tab enables you to toggle on/off secondary targets in the main setup screen (see ‘Secondary trg’) button visible at the top of Figure 68). Please note that there is always an option to add secondary targets from the Results screen.

© TechEdge A/S 2015 59/62 [email protected]
Figure 68: Settings
Also under settings you can choose whether costs should be applied by channel group or individual channel, and force K2 to always use the primary target in the ‘Cost discounts’ section.
There is also an option to ‘Keep channel, daypart and filter settings when adding/removing channels’. If this option is disabled, the channel/daypart constraints and any applied filters will be reset if a channel is added/removed from the campaign.
Activating the ‘Weighted optimization’ option allows you to optimize against several frequency levels and specify the importance between them. When activated, an ‘Advanced’ link will appear next to the frequency input window, opening a new input window:
Figure 69: Advanced frequency settings

© TechEdge A/S 2015 60/62 [email protected]
The top two input boxes allow you to select either the maximum frequency level or manually specify frequency ranges, and create rows accordingly. In the above example, the maximum frequency is set at 4. A weight of 75% has been set for 4+ reach, and 25% for 3+. This means that although optimizing against 4+, the 3+ reach (with a weight of 25%) will also be taken into consideration. This could reflect the probability that the viewer will remember the commercial—viewers who have seen the commercial 3 times are less likely to remember it as compared to viewers who have seen it more than 4 times. Please note that the weight figures you key in do not need to add up to “100”. The normalized weight would take a portion of the weight entered, and this normalized weight will always add up to 1.
Further down in the Settings tab is the option to enable/disable UK Regions when running UK data – please see the section on page 13 for further information. In this section you can also specify the number of decimal places that can be used when entering constraints and the number of decimal places included in the output.
The final section on the Settings tab allows you to alter the setup for the Cost-Reach running mode.
Algorithm
The Algorithm tab allows you to increase/decrease the number of iterations K2 runs for each campaign. Please refer to ‘Running small/large campaigns’ on page 37 for more information.

© TechEdge A/S 2015 61/62 [email protected]
Figure 70: Algorithm
From the algorithm tab it is also possible to change the rating mode from Spot to Break to reflect the currency traded in each market, and change the interval between fictional breaks. Ticking on ‘Channel share less than…’ will allow K2 to disregard channel shares below the specified percentage, and distribute these ratings equally across the remaining channels.
The ‘Buildup Cover Guide TVR Resolution’ dropdown menu allows you to select the lowest resolution available when viewing the Buildup Cover Guide (see page 49). By default this is set to 1 rating – please note that lowering the resolution will increase processing time.
For installations with both internal promos and commercial spots, K2 can toggle between the two. If you want to run a cover guide based on promo data, select ‘internal promo spots’ from the dropdown menu, or if you wish to run cover guides on commercial airtime then select spots. The default setting is commercial spots.
Spot Pool
The Spot Pool tab allows you to restrict the pool of spots used by K2 either by ‘Spot Class’ (e.g. commercial spots, Sponsorship, Promo etc.) and/or by brand. These settings can be saved as either user or system defaults.

© TechEdge A/S 2015 62/62 [email protected]
Rep. Areas
This tab enables secondary reporting areas to be set as a default so that they are automatically included in all outputs. Please note that this will require more processing time. Reporting areas can always be added to an output after a report has been run – see Secondary Reporting Areas on page 41 for more information.
Ofcom Rules
This enables you to enter an index target and base target, and specify a conversion. This will then be used to remove spots from the spot pool when ‘Apply Ofcom rules’ is activated in the filter section (see page 33) when they fall outside the specified range. This feature was designed for UK clients needing to plan campaigns that comply with Ofcom’s HFSS rules. In this case the target audience would be Children, the base audience would be Individuals, and the conversion would be 120.