kaiser family foundation/new york times medical bills … · topline kaiser family foundation/new...
TRANSCRIPT

Topline
Kaiser Family Foundation/New York Times Medical Bills Survey
January 2016
2
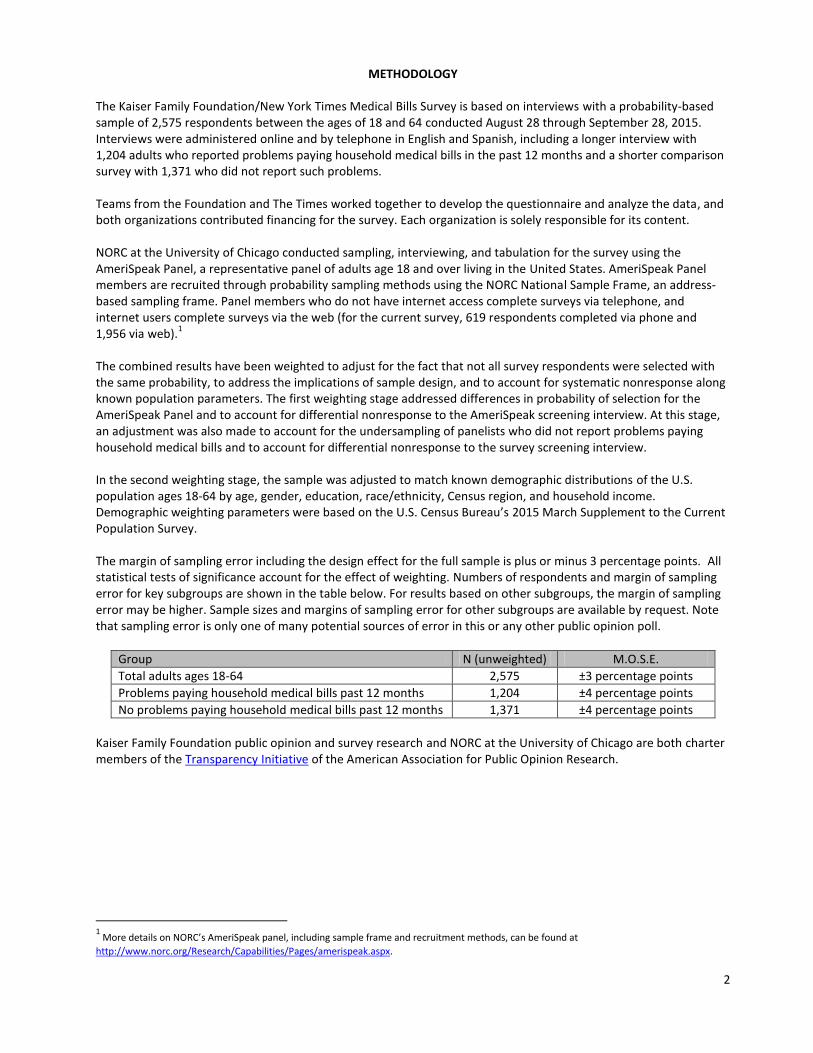
METHODOLOGY The Kaiser Family Foundation/New York Times Medical Bills Survey is based on interviews with a probability-based sample of 2,575 respondents between the ages of 18 and 64 conducted August 28 through September 28, 2015. Interviews were administered online and by telephone in English and Spanish, including a longer interview with 1,204 adults who reported problems paying household medical bills in the past 12 months and a shorter comparison survey with 1,371 who did not report such problems. Teams from the Foundation and The Times worked together to develop the questionnaire and analyze the data, and both organizations contributed financing for the survey. Each organization is solely responsible for its content. NORC at the University of Chicago conducted sampling, interviewing, and tabulation for the survey using the AmeriSpeak Panel, a representative panel of adults age 18 and over living in the United States. AmeriSpeak Panel members are recruited through probability sampling methods using the NORC National Sample Frame, an address-based sampling frame. Panel members who do not have internet access complete surveys via telephone, and internet users complete surveys via the web (for the current survey, 619 respondents completed via phone and 1,956 via web).
1
The combined results have been weighted to adjust for the fact that not all survey respondents were selected with the same probability, to address the implications of sample design, and to account for systematic nonresponse along known population parameters. The first weighting stage addressed differences in probability of selection for the AmeriSpeak Panel and to account for differential nonresponse to the AmeriSpeak screening interview. At this stage, an adjustment was also made to account for the undersampling of panelists who did not report problems paying household medical bills and to account for differential nonresponse to the survey screening interview. In the second weighting stage, the sample was adjusted to match known demographic distributions of the U.S. population ages 18-64 by age, gender, education, race/ethnicity, Census region, and household income. Demographic weighting parameters were based on the U.S. Census Bureau’s 2015 March Supplement to the Current Population Survey. The margin of sampling error including the design effect for the full sample is plus or minus 3 percentage points. All statistical tests of significance account for the effect of weighting. Numbers of respondents and margin of sampling error for key subgroups are shown in the table below. For results based on other subgroups, the margin of sampling error may be higher. Sample sizes and margins of sampling error for other subgroups are available by request. Note that sampling error is only one of many potential sources of error in this or any other public opinion poll.
Group N (unweighted) M.O.S.E.
Total adults ages 18-64 2,575 ±3 percentage points
Problems paying household medical bills past 12 months 1,204 ±4 percentage points
No problems paying household medical bills past 12 months 1,371 ±4 percentage points
Kaiser Family Foundation public opinion and survey research and NORC at the University of Chicago are both charter members of the Transparency Initiative of the American Association for Public Opinion Research.
1 More details on NORC’s AmeriSpeak panel, including sample frame and recruitment methods, can be found at
http://www.norc.org/Research/Capabilities/Pages/amerispeak.aspx.
3
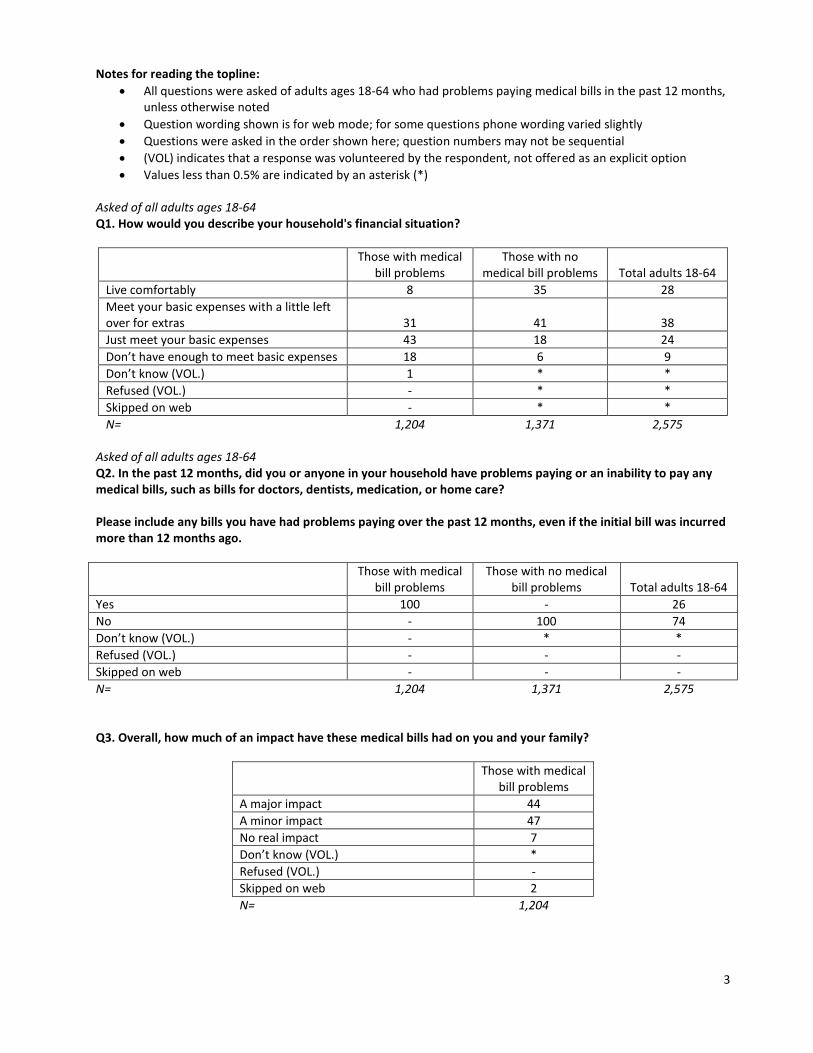
Notes for reading the topline:
All questions were asked of adults ages 18-64 who had problems paying medical bills in the past 12 months, unless otherwise noted
Question wording shown is for web mode; for some questions phone wording varied slightly
Questions were asked in the order shown here; question numbers may not be sequential
(VOL) indicates that a response was volunteered by the respondent, not offered as an explicit option
Values less than 0.5% are indicated by an asterisk (*) Asked of all adults ages 18-64 Q1. How would you describe your household's financial situation?
Those with medical bill problems
Those with no medical bill problems Total adults 18-64
Live comfortably 8 35 28
Meet your basic expenses with a little left over for extras 31 41 38
Just meet your basic expenses 43 18 24
Don’t have enough to meet basic expenses 18 6 9
Don’t know (VOL.) 1 * *
Refused (VOL.) - * *
Skipped on web - * *
N= 1,204 1,371 2,575 Asked of all adults ages 18-64 Q2. In the past 12 months, did you or anyone in your household have problems paying or an inability to pay any medical bills, such as bills for doctors, dentists, medication, or home care? Please include any bills you have had problems paying over the past 12 months, even if the initial bill was incurred more than 12 months ago.
Those with medical bill problems
Those with no medical bill problems Total adults 18-64
Yes 100 - 26
No - 100 74
Don’t know (VOL.) - * *
Refused (VOL.) - - -
Skipped on web - - -
N= 1,204 1,371 2,575 Q3. Overall, how much of an impact have these medical bills had on you and your family?
Those with medical bill problems
A major impact 44
A minor impact 47
No real impact 7
Don’t know (VOL.) *
Refused (VOL.) -
Skipped on web 2
N= 1,204

4
Q4. Thinking about your most recent problem with medical bills, would you say this was first time you had such a problem, or have you had problems paying medical bills before that?
Those with medical bill problems
This is the first time you have had such a problem 36
This is not the first time you have had such problems 60
Don’t know (VOL.) 1
Refused (VOL.) -
Skipped on web 2
N= 1,204 Q5. In addition to problems paying medical bills, have you also had problems paying other types of bills in the past 12 months, or not?
Those with medical bill problems
Yes, I had problems paying other types of bills in the past 12 months 66
No, I did not have problems paying other types of bills in the past 12 months 31
Don’t know (VOL.) -
Refused (VOL.) -
Skipped on web 2
N= 1,204 If “Yes” in Q5 Q6. Did your problems paying other types of bills start as a result of your medical bills, or for some other reason?
Those with medical bill problems
Yes, my problems started as a result of my medical bills 29
No, my problems did NOT start as a result of my medical bills 70
Don’t know (VOL.) *
Refused (VOL.) -
Skipped on web *
N= 835
5
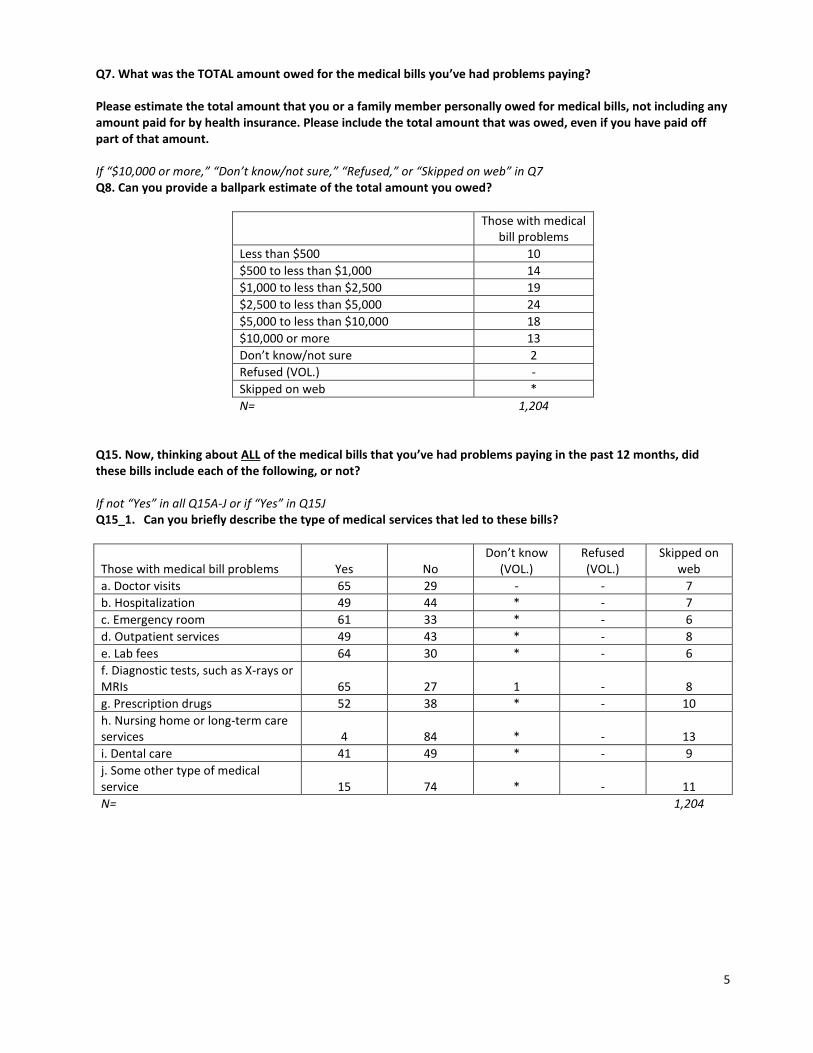
Q7. What was the TOTAL amount owed for the medical bills you’ve had problems paying? Please estimate the total amount that you or a family member personally owed for medical bills, not including any amount paid for by health insurance. Please include the total amount that was owed, even if you have paid off part of that amount. If “$10,000 or more,” “Don’t know/not sure,” “Refused,” or “Skipped on web” in Q7 Q8. Can you provide a ballpark estimate of the total amount you owed?
Those with medical bill problems
Less than $500 10
$500 to less than $1,000 14
$1,000 to less than $2,500 19
$2,500 to less than $5,000 24
$5,000 to less than $10,000 18
$10,000 or more 13
Don’t know/not sure 2
Refused (VOL.) -
Skipped on web *
N= 1,204 Q15. Now, thinking about ALL of the medical bills that you’ve had problems paying in the past 12 months, did these bills include each of the following, or not? If not “Yes” in all Q15A-J or if “Yes” in Q15J Q15_1. Can you briefly describe the type of medical services that led to these bills?
Those with medical bill problems Yes No Don’t know
(VOL.) Refused (VOL.)
Skipped on web
a. Doctor visits 65 29 - - 7
b. Hospitalization 49 44 * - 7
c. Emergency room 61 33 * - 6
d. Outpatient services 49 43 * - 8
e. Lab fees 64 30 * - 6
f. Diagnostic tests, such as X-rays or MRIs 65 27 1 - 8
g. Prescription drugs 52 38 * - 10
h. Nursing home or long-term care services 4 84 * - 13
i. Dental care 41 49 * - 9
j. Some other type of medical service 15 74 * - 11
N= 1,204

6
Q15. Now, thinking about ALL of the medical bills that you’ve had problems paying in the past 12 months, did these bills include each of the following, or not? Q16. Which of these represents the largest share of the bills you had problems paying? Asked of those who answered “yes” to more than one item in Q15. Percentages shown based on total, including those who answered yes to only one item. Q15/Q16 COMBINED SOLE OR MAIN TYPE OF MEDICAL BILLS
Those with medical bill problems
Emergency room 21
Hospitalization 20
Dental care 12
Diagnostic tests, such as X-rays or MRIs 11
Doctor visits 9
Outpatient services 6
Prescription drugs 5
Lab fees 4
Nursing home or long-term care services 1
Some other type of medical service 8
Unknown (don’t know, refused, skipped on web)
1
N= 1,204 Q9. Thinking about all of the medical bills you’ve had problems paying in the past 12 months, were these bills for…
Those with medical bill problems Yes No
Don’t know (VOL.)
Refused (VOL.)
Skipped on web
a. Your own medical care 73 25 - - 2
b. Your spouse or partner’s medical care 33 63 - - 4
c. Your child’s medical care 25 70 - - 5
d. Another family member’s medical care 10 85 - - 6
N= 1,204

7
Q9. Thinking about all of the medical bills you’ve had problems paying in the past 12 months, were these bills for… Q10. Which of these represents the largest share of the bills you had problems paying? Asked of those who answered “yes” to more than one item in Q9. Percentages shown based on total, including those who answered yes to only one item. Q9/Q10 COMBINED SOLE OR MAIN TYPE OF MEDICAL BILLS
Those with medical bill problems
Bills for your own medical care 59
Bills for your spouse or partner’s medical care 18
Bills for your child’s medical care 12
Bills for your family member’s medical care 11
No, Don’t know, Refused, or skipped all items in Q9 -
Don’t know (VOL.) -
Refused (VOL.) -
Skipped on web -
N= 1,204 For the following questions we’d like you to think about the bills for [your/your spouse’s/your child’s/your family member’s] medical care. (Language in brackets inserted based on response to Q9/Q10) Asked if largest portion of bills were for a spouse or partner, a child, or another family member in Q10, or if only had bills for a spouse or partner, a child, or another family member in Q9 [note: parallel question about respondent’s health status asked at end of questionnaire] QHS001Fam. In general, how would you rate [your spouse’s/your child’s/your family member’s] OVERALL health?
Those with medical bill problems
Excellent 13
Very good 27
Good 31
Fair 23
Poor 7
Don’t know (VOL.) -
Refused (VOL.) -
Skipped on web -
N= 405
8
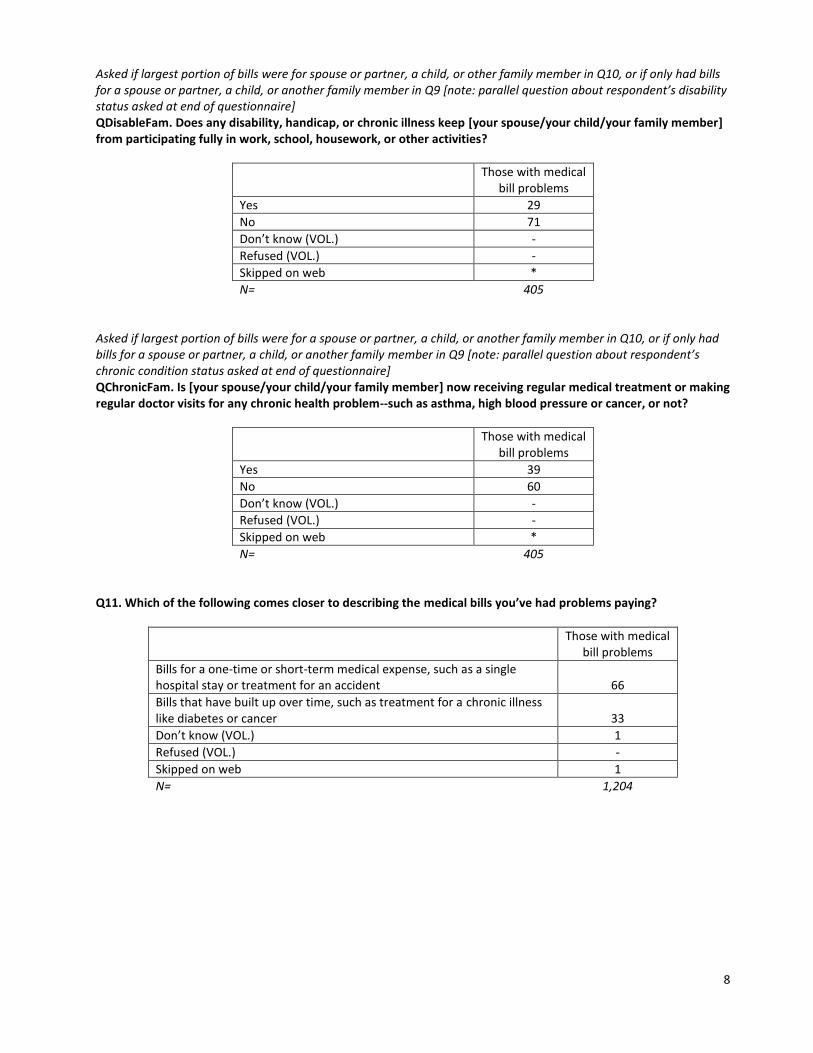
Asked if largest portion of bills were for spouse or partner, a child, or other family member in Q10, or if only had bills for a spouse or partner, a child, or another family member in Q9 [note: parallel question about respondent’s disability status asked at end of questionnaire] QDisableFam. Does any disability, handicap, or chronic illness keep [your spouse/your child/your family member] from participating fully in work, school, housework, or other activities?
Those with medical bill problems
Yes 29
No 71
Don’t know (VOL.) -
Refused (VOL.) -
Skipped on web *
N= 405 Asked if largest portion of bills were for a spouse or partner, a child, or another family member in Q10, or if only had bills for a spouse or partner, a child, or another family member in Q9 [note: parallel question about respondent’s chronic condition status asked at end of questionnaire] QChronicFam. Is [your spouse/your child/your family member] now receiving regular medical treatment or making regular doctor visits for any chronic health problem--such as asthma, high blood pressure or cancer, or not?
Those with medical bill problems
Yes 39
No 60
Don’t know (VOL.) -
Refused (VOL.) -
Skipped on web *
N= 405 Q11. Which of the following comes closer to describing the medical bills you’ve had problems paying?
Those with medical bill problems
Bills for a one-time or short-term medical expense, such as a single hospital stay or treatment for an accident 66
Bills that have built up over time, such as treatment for a chronic illness like diabetes or cancer 33
Don’t know (VOL.) 1
Refused (VOL.) -
Skipped on web 1
N= 1,204

9
If bills were for a one-time expense or if bills built up over time in Q11 Q14. IF ONE-TIME EXPENSE: Approximately how long ago did this incident occur? IF BILLS BUILT UP: Approximately how long ago did the treatment that led to your problem paying [your/your spouse’s/your child’s/your family member’s] bills begin?
Those with medical bill problems
Within the last month 4
Between one and six months ago 25
Between seven and twelve months ago 25
Between one and two years ago 22
More than two years ago 24
Don’t know (VOL.) -
Refused (VOL.) *
Skipped on web *
N= 1,191 Q12. Thinking about the bills that have built up over time, [are you/is your spouse/your child/your family member] still receiving that treatment, or not?
Those with medical bill problems
Yes, still receiving treatment 36
No, no longer receiving treatment 63
Don’t know (VOL.) -
Refused (VOL.) *
Skipped on web 1
N= 1,204

10
Q13. Could you briefly describe the illness or injury that led to [your/your spouse’s/your child’s/your family member’s] bills? [Open-ended question] Note: Results add up to more than 100% because multiple responses were accepted.
Those with medical bill problems
Diseases/Illnesses/Symptoms (NET) 36
Heart disease/heart attack/stroke 8
Cancer/tumors 6
Gastrointestinal/stomach 6
Allergies/asthma/respiratory disease 5
Diabetes 4
High blood pressure 4
Neurological problems 3
Auto-immune disease 2
Kidney disease/problems 2
Cervical/ovarian/gynecologic problems 2
Thyroid issues 1
Pain/Injuries (NET) 16
Arthritis/joint pain/problems 8
Back/neck pain/problems 6
Chronic pain (other/unspecified) 3
Accident/Broken Bones (NET) 15
Broken bones 5
Accident, car/vehicle 5
Accident, unspecified 5
Accident, job related 1
Surgery 10
Teeth/dental 10
Infectious diseases (NET) 9
Pneumonia/lung infection 3
Viral infections 3
Other/unspecified infections 2
Mental health/substance abuse 5
Pregnancy/child birth/maternity care 5
Cancer screening 1
Vision/eye problems 1
Other 8
Don’t know/Refused/Skipped 5
N= 1,204
11
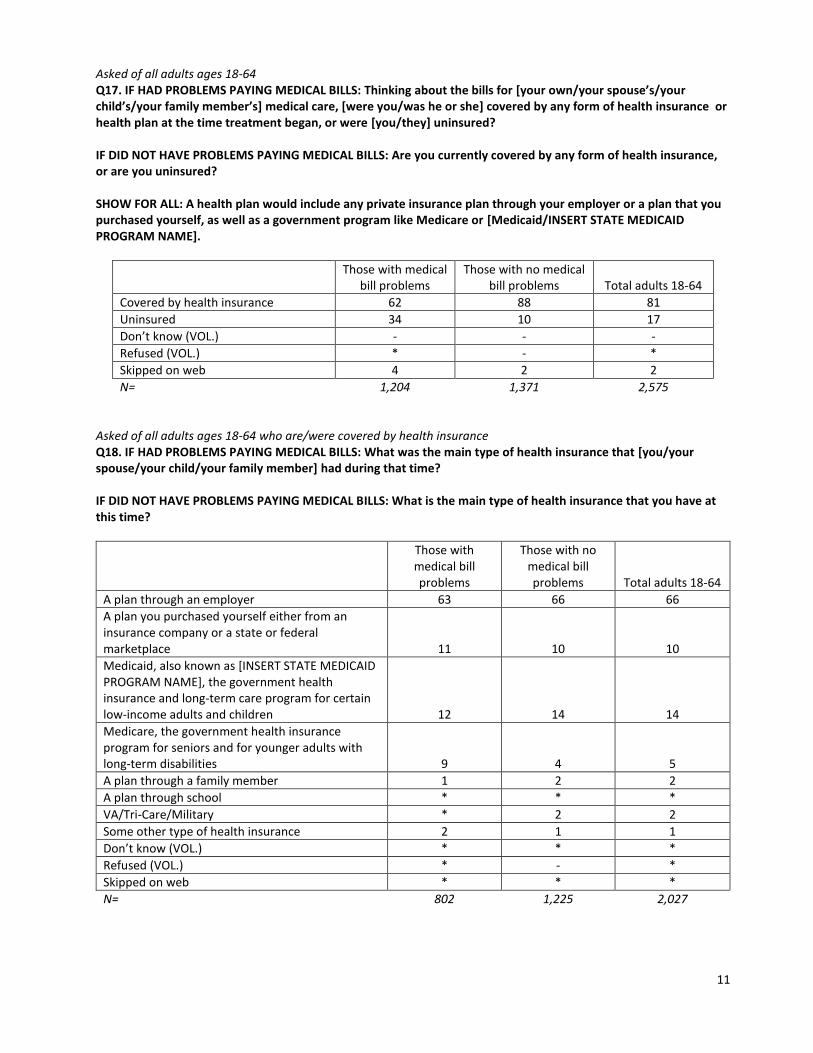
Asked of all adults ages 18-64 Q17. IF HAD PROBLEMS PAYING MEDICAL BILLS: Thinking about the bills for [your own/your spouse’s/your child’s/your family member’s] medical care, [were you/was he or she] covered by any form of health insurance or health plan at the time treatment began, or were [you/they] uninsured? IF DID NOT HAVE PROBLEMS PAYING MEDICAL BILLS: Are you currently covered by any form of health insurance, or are you uninsured? SHOW FOR ALL: A health plan would include any private insurance plan through your employer or a plan that you purchased yourself, as well as a government program like Medicare or [Medicaid/INSERT STATE MEDICAID PROGRAM NAME].
Those with medical bill problems
Those with no medical bill problems Total adults 18-64
Covered by health insurance 62 88 81
Uninsured 34 10 17
Don’t know (VOL.) - - -
Refused (VOL.) * - *
Skipped on web 4 2 2
N= 1,204 1,371 2,575 Asked of all adults ages 18-64 who are/were covered by health insurance Q18. IF HAD PROBLEMS PAYING MEDICAL BILLS: What was the main type of health insurance that [you/your spouse/your child/your family member] had during that time? IF DID NOT HAVE PROBLEMS PAYING MEDICAL BILLS: What is the main type of health insurance that you have at this time?
Those with medical bill problems
Those with no medical bill problems Total adults 18-64
A plan through an employer 63 66 66
A plan you purchased yourself either from an insurance company or a state or federal marketplace 11 10 10
Medicaid, also known as [INSERT STATE MEDICAID PROGRAM NAME], the government health insurance and long-term care program for certain low-income adults and children 12 14 14
Medicare, the government health insurance program for seniors and for younger adults with long-term disabilities 9 4 5
A plan through a family member 1 2 2
A plan through school * * *
VA/Tri-Care/Military * 2 2
Some other type of health insurance 2 1 1
Don’t know (VOL.) * * *
Refused (VOL.) * - *
Skipped on web * * *
N= 802 1,225 2,027

12
Asked of all adults ages 18-64 who are/were covered by health insurance through an employer, an insurance company or marketplace, or some other type in Q18 NEW1. IF HAD PROBLEMS PAYING MEDICAL BILLS: Was that a health care plan that only covered [you/your spouse/your child/your family member], or did it also cover other family members? IF DID NOT HAVE PROBLEMS PAYING MEDICAL BILLS: Is the health care coverage you have just for yourself or does it also cover other family members?
Those with medical bill problems
Those with no medical bill problems Total adults 18-64
Plan only covered [you/your spouse/your child/your family member] 37 34 34
Plan covered other family members 61 62 62
Don’t know (VOL.) * * *
Refused (VOL.) - - -
Skipped on web 2 4 3
N= 619 994 1,613 Asked of all adults ages 18-64 who are/were covered by health insurance through an insurance company or marketplace in Q18 Q19. Was this plan purchased directly from an insurance company, from the marketplace known as [INSERT STATE OR FEDERAL HEALTH INSURANCE EXCHANGE NAME], or through an insurance agent or broker? Asked of all adults ages 18-64 who are/were covered by health insurance purchased directly from an insurance company or through an insurance agent or broker in Q19 Q20. Regardless of how you purchased your plan, do you know if it is a marketplace or [Health Exchange name] plan, is it NOT a marketplace or [Health Exchange name] plan, or are you not sure? Asked of all adults ages 18-64 who are/were covered by health insurance through an insurance company or marketplace in Q18 Q21. As far as you know, are you getting financial help from the government, such as a premium tax credit or premium assistance, to help pay the monthly premium for this health insurance, or not? Q17/Q18/Q19/Q20/Q21 COMBINED BASED ON TOTAL ADULTS AGES 18-64
Those with medical bill problems
Those with no medical bill problems Total adults 18-64
Health insurance through employer 39 58 53
Health insurance through non-group plan, likely a marketplace (Q19=”marketplace” or Q20=”yes” or Q21=”yes”) 3 6 5
Health insurance through non-group plan, likely not a marketplace 3 3 3
Health insurance through Medicaid 8 12 11
Health insurance through Medicare 6 4 4
Health insurance through some other type 3 5 4
No health insurance coverage 34 10 17
Don’t know/refused 4 2 2
N= 1,204 1,371 2,575
13
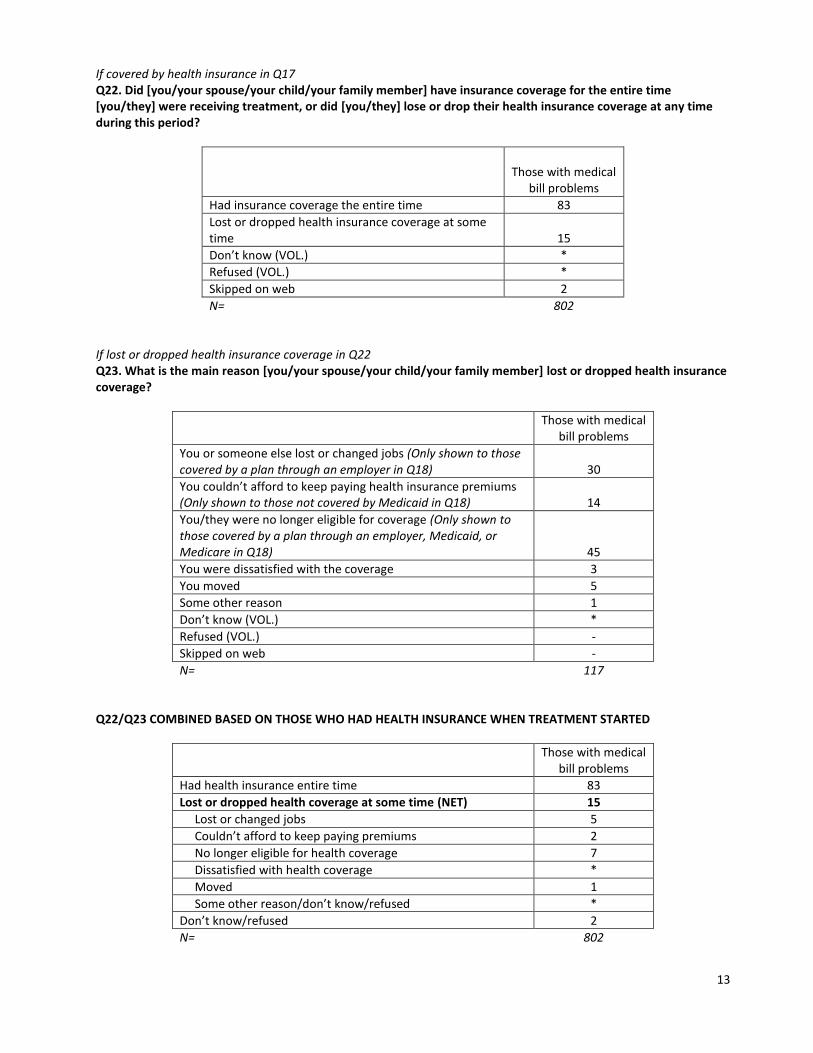
If covered by health insurance in Q17 Q22. Did [you/your spouse/your child/your family member] have insurance coverage for the entire time [you/they] were receiving treatment, or did [you/they] lose or drop their health insurance coverage at any time during this period?
Those with medical
bill problems
Had insurance coverage the entire time 83
Lost or dropped health insurance coverage at some time 15
Don’t know (VOL.) *
Refused (VOL.) *
Skipped on web 2
N= 802 If lost or dropped health insurance coverage in Q22 Q23. What is the main reason [you/your spouse/your child/your family member] lost or dropped health insurance coverage?
Those with medical bill problems
You or someone else lost or changed jobs (Only shown to those covered by a plan through an employer in Q18) 30
You couldn’t afford to keep paying health insurance premiums (Only shown to those not covered by Medicaid in Q18) 14
You/they were no longer eligible for coverage (Only shown to those covered by a plan through an employer, Medicaid, or Medicare in Q18) 45
You were dissatisfied with the coverage 3
You moved 5
Some other reason 1
Don’t know (VOL.) *
Refused (VOL.) -
Skipped on web -
N= 117 Q22/Q23 COMBINED BASED ON THOSE WHO HAD HEALTH INSURANCE WHEN TREATMENT STARTED
Those with medical bill problems
Had health insurance entire time 83
Lost or dropped health coverage at some time (NET) 15
Lost or changed jobs 5
Couldn’t afford to keep paying premiums 2
No longer eligible for health coverage 7
Dissatisfied with health coverage *
Moved 1
Some other reason/don’t know/refused *
Don’t know/refused 2
N= 802
14
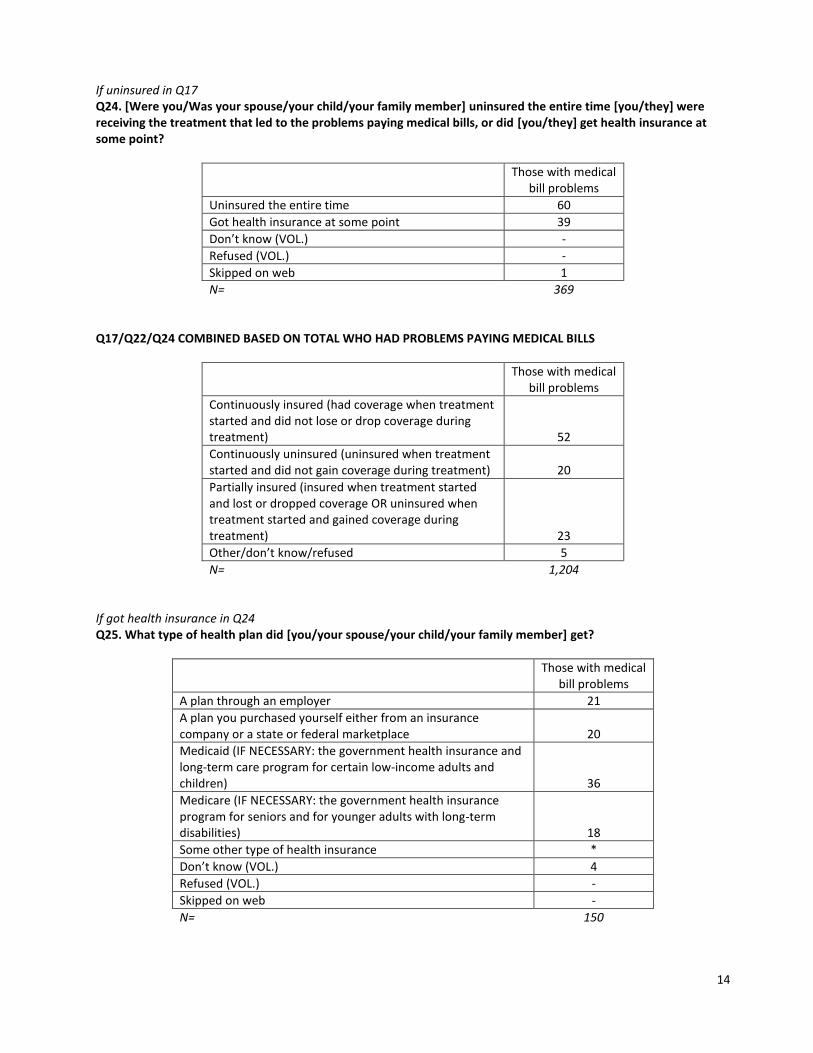
If uninsured in Q17 Q24. [Were you/Was your spouse/your child/your family member] uninsured the entire time [you/they] were receiving the treatment that led to the problems paying medical bills, or did [you/they] get health insurance at some point?
Those with medical bill problems
Uninsured the entire time 60
Got health insurance at some point 39
Don’t know (VOL.) -
Refused (VOL.) -
Skipped on web 1
N= 369 Q17/Q22/Q24 COMBINED BASED ON TOTAL WHO HAD PROBLEMS PAYING MEDICAL BILLS
Those with medical bill problems
Continuously insured (had coverage when treatment started and did not lose or drop coverage during treatment) 52
Continuously uninsured (uninsured when treatment started and did not gain coverage during treatment) 20
Partially insured (insured when treatment started and lost or dropped coverage OR uninsured when treatment started and gained coverage during treatment) 23
Other/don’t know/refused 5
N= 1,204 If got health insurance in Q24 Q25. What type of health plan did [you/your spouse/your child/your family member] get?
Those with medical bill problems
A plan through an employer 21
A plan you purchased yourself either from an insurance company or a state or federal marketplace 20
Medicaid (IF NECESSARY: the government health insurance and long-term care program for certain low-income adults and children) 36
Medicare (IF NECESSARY: the government health insurance program for seniors and for younger adults with long-term disabilities) 18
Some other type of health insurance *
Don’t know (VOL.) 4
Refused (VOL.) -
Skipped on web -
N= 150
15
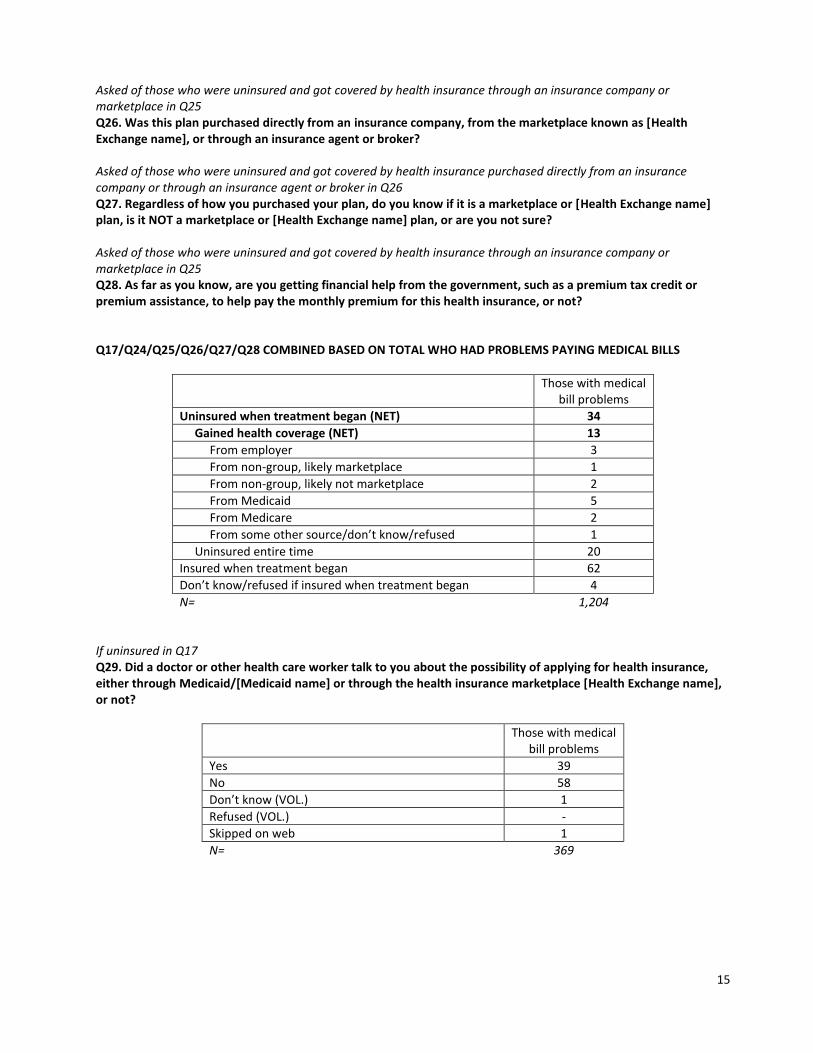
Asked of those who were uninsured and got covered by health insurance through an insurance company or marketplace in Q25 Q26. Was this plan purchased directly from an insurance company, from the marketplace known as [Health Exchange name], or through an insurance agent or broker? Asked of those who were uninsured and got covered by health insurance purchased directly from an insurance company or through an insurance agent or broker in Q26 Q27. Regardless of how you purchased your plan, do you know if it is a marketplace or [Health Exchange name] plan, is it NOT a marketplace or [Health Exchange name] plan, or are you not sure? Asked of those who were uninsured and got covered by health insurance through an insurance company or marketplace in Q25 Q28. As far as you know, are you getting financial help from the government, such as a premium tax credit or premium assistance, to help pay the monthly premium for this health insurance, or not? Q17/Q24/Q25/Q26/Q27/Q28 COMBINED BASED ON TOTAL WHO HAD PROBLEMS PAYING MEDICAL BILLS
Those with medical bill problems
Uninsured when treatment began (NET) 34
Gained health coverage (NET) 13
From employer 3
From non-group, likely marketplace 1
From non-group, likely not marketplace 2
From Medicaid 5
From Medicare 2
From some other source/don’t know/refused 1
Uninsured entire time 20
Insured when treatment began 62
Don’t know/refused if insured when treatment began 4
N= 1,204 If uninsured in Q17 Q29. Did a doctor or other health care worker talk to you about the possibility of applying for health insurance, either through Medicaid/[Medicaid name] or through the health insurance marketplace [Health Exchange name], or not?
Those with medical bill problems
Yes 39
No 58
Don’t know (VOL.) 1
Refused (VOL.) -
Skipped on web 1
N= 369

16
If uninsured the entire time receiving treatment in Q24 Q30. Did you apply or attempt to get health insurance from any of the following?
Yes No Don’t know
(VOL.) Refused (VOL.)
Skipped on web
a. Medicaid, also known as [INSERT STATE MEDICAID PROGRAM NAME] 52 48 - - 1
b. The health insurance marketplace [Health Exchange name] 28 71 - - 1
c. Directly from a private insurance company, health insurance agent, or broker (other than through [Health Exchange name]) 16 82 - - 1
d. Some other source 9 87 - - 5
N= 215 If attempted to get insurance through Medicaid in Q30 Q31. Did you not get coverage from Medicaid because you were told you were not eligible, because you were not able to complete the application process, or for some other reason? If “some other reason” in Q31 Q31A. Why were you unable to get coverage from Medicaid? Percentages shown based on total, including recoded “other” responses that fell under other categories.
Those with medical bill problems
Not eligible 58
Not able to complete the application process 18
Too expensive 3
Some other reason 4
Don’t know (VOL.) 12
Refused (VOL.) *
Skipped on web *
N= 107 Q30/Q31/Q31A COMBINED BASED ON THOSE WHO WERE UNINSURED THE ENTIRE TIME RECEIVING TREATMENT
Those with medical bill problems
Attempted to get health insurance through Medicaid (NET) 52
Not eligible 30
Not able to complete application process 9
Some other reason/don’t know/refused 12
Did not attempt to get health insurance through Medicaid 48
Don’t know/refused/skipped 1
N= 215

17
If attempted to get insurance through the health insurance marketplace, an insurance company or broker, or some other source in Q30 Q32. Did you not get private health insurance coverage because it was too expensive, because you were not able to complete the application process, or for some other reason? (sample size insufficient to report) Q30/Q31/Q32 COMBINED BASED ON THOSE WHO WERE UNINSURED THE ENTIRE TIME RECEIVING TREATMENT
Those with medical bill
problems
Attempted to get health insurance through a marketplace, private insurance company, or some other source (NET) 38
Did not get because too expensive 29
Did not get because not able to complete application process 7
Did not get for some other reason/don’t know/refused 4
Did not attempt to get health insurance through these sources 62
N= 215 Asked of all adults ages 18-64 who were covered by health insurance in Q17 Q33. IF HAD PROBLEMS PAYING MEDICAL BILLS: Thinking about the insurance plan [you/your spouse/your child/your family member] had when the bills occurred, what was the amount of the insurance plan’s annual deductible for medical care? IF DID NOT HAVE PROBLEMS PAYING MEDICAL BILLS: Thinking about your current insurance plan, what is the amount of the insurance plan’s annual deductible for medical care? SHOWN TO ALL: A deductible is the amount you have to pay yourself before your insurance plan will start paying any part of your medical bills. If you are not sure what this number is, please look it up in your insurance documents. Asked of all adults ages 18-64 who were covered by health insurance in Q17 and did not answer Q33 NEW2. Is the health plan’s annual deductible less than $1500 a year, at least $1500 but less than $3,000 a year, or $3,000 a year or more? Asked of all adults ages 18-64 who were covered by health insurance in Q17 and plan covered other family members in NEW1 and gave an answer to Q33 or NEW2 NEW3. Is that a FAMILY deductible, meaning you must spend that amount on your entire family’s medical care before the insurance company begins to pay, or is it a PER PERSON deductible, meaning that you must spend that amount on care for any one person before the insurance company will begin to pay for that person’s care?

18
Q33/NEW1/NEW2/NEW3 COMBINED BASED ON THOSE WITH EMPLOYER OR SELF-PURCHASED HEALTH INSURANCE COVERAGE
Those with medical bill problems
Those with no medical bill problems Total adults 18-64
High deductible plan ($1,500 or more for individual, $3,000 or more for family) 48 33 36
Not high deductible plan (Less than $1,500 for individual, less than $3,000 for family) 47 63 60
Don’t know/refused/skipped 5 5 5
N= 583 940 1,523 If insured in Q17 Q34. Now thinking about all of the bills you’ve had trouble paying, was any of the following a reason you had trouble paying medical bills?
Yes No Don’t know
(VOL.) Refused (VOL.)
Skipped on web
a. The amount you had to pay for copays, deductibles, or coinsurance was more than you could afford 75 22 * - 3
b. [You/Your family member(s)/You or your family member(s)] received care from an out-of-network doctor or facility, and insurance would not cover the bill or would only cover a portion 32 59 1 - 9
c. You submitted a claim to your insurance company but the claim was denied 26 66 1 - 7
N= 802 Q17/Q34 COMBINED BASED ON TOTAL WHO HAD PROBLEMS PAYING MEDICAL BILLS
Those with medical bill problems
Insured when treatment began (NET) 62
Copays, deductibles, coinsurance not affordable 47
Received care from out-of-network doctor or facility 20
Insurance claim was denied 16
Uninsured when treatment began 34
Don’t know/refused/skipped if insured when began treatment 4
N= 1,204

19
If submitted a claim that was denied in Q34 Q35. What reason did the insurance company give for denying your claim? [Open-ended question]
Those with medical bill problems
Treatment not covered by plan 25
Provider not covered/not in network 14
Paperwork/documentation issue 9
Reached maximum that insurance would pay 7
Not medically necessary 5
Pre-existing condition/illness 4
Did not have insurance long enough to be covered 3
Other 13
No reason given/don’t know 21
Refused -
Skipped on web -
N= 192 If received care from out-of-network facility that insurance wouldn’t cover in Q34 Q36. Did you know that the health care provider was not in your plan’s network at the time [you/your family member(s)/you or your family member(s)] received care, or not?
Those with medical bill problems
Yes 28
No 69
Don’t know (VOL.) 3
Refused (VOL.) -
Skipped on web 1
N= 232 Q40. Did you work out a payment plan with any health care provider for at least some of what you owed, or not?
Those with medical bill problems
Yes 53
No 43
Don’t know (VOL.) 1
Refused (VOL.) -
Skipped on web 4
N= 1,204

20
If “Yes” in Q40 Q41. Are you or were you paying interest or a finance charge to the provider, or not?
Those with medical bill problems
Yes, paying interest or a finance charge 23
No, not paying interest or a finance charge 53
Not sure 24
Refused (VOL.) -
Skipped on web -
N= 659 Q40/Q41 COMBINED BASED ON TOTAL WHO HAD PROBLEMS PAYING MEDICAL BILLS
Those with medical bill problems
Work out a payment plan with health care provider (NET) 53
Paying interest or finance charge 12
Not paying interest or finance charge 28
Not sure 12
Did not work out payment plan with health care provider 43
Don’t know/refused/skipped 5
N= 1,204 If only had hospitalization bills in Q15 Q42. Does any hospital where [you/your family member(s)/you or your family member(s)] received care have a program to reduce or waive bills for people who have trouble paying, or not?
Those with medical bill problems
Yes 27
No 25
Don’t know 46
Refused (VOL.) -
Skipped on web *
N= 530 If “Yes” in Q42 Q43. Did you enroll or sign up for the program, or not?
Those with medical bill problems
Yes 55
No 44
Don’t know (VOL.) -
Refused (VOL.) -
Skipped on web *
N= 160

21
Q15/Q42/Q43 COMBINED BASED ON TOTAL WHO HAD PROBLEMS PAYING MEDICAL BILLS
Those with medical bill problems
Had problems paying hospital bills (NET) 48
Hospital has program to reduce/waive bills (NET) 13
Signed up for program 7
Did not sign up for program 6
Don’t know/refused *
Hospital does not have program to reduce/waive bills 12
Don’t know/refused if hospital has program 22
Did not have problems paying hospital bills/Don’t know/Refused 52
N= 1,204 If had problems paying non-hospitalization bills in Q15 Q44. Did any (other) healthcare provider agree to reduce the amount that you owe, or not?
Those with medical bill problems
Yes 14
No 83
Don’t know (VOL.) 1
Refused (VOL.) *
Skipped on web 2
N= 1,177 Q15/Q44 COMBINED BASED ON TOTAL WHO HAD PROBLEMS PAYING MEDICAL BILLS
Those with medical bill problems
Had problems paying bills besides hospital bills (NET) 97
Any provider agreed to reduce amount owed 14
No provider agreed to reduce amount owed 80
Don’t know/refused if provider agreed to reduce amount owed 3
Only had problems paying hospital bills *
N= 1,204

22
Q45. In order to pay medical bills, have you (or someone else in the household) done each of the following in the past 12 months, or not?
Among those with medical bill problems Yes No
Don’t know (VOL.)
Refused (VOL.)
Skipped on web
a. Borrowed money from friends or family 37 60 - * 3
b. Taken out another mortgage on your home 2 94 - * 5
c. Borrowed money from a payday lender 13 82 * * 4
d. Taken out another type of loan (other than a mortgage or loan from a payday lender) 15 81 - * 4
e. Sought the aid of a charity or non-profit organization 12 86 - - 2
f. Increased your credit card debt 34 64 - - 2
g. Cut back spending on food, clothing, or basic household items 70 29 - - 2
h. Put off vacations or major household purchases 72 26 - - 2
i. Taken money out of retirement, college, or other long-term savings accounts 26 73 - - 1
j. Taken an extra job or worked more hours 41 58 - - 1
k. Changed your living situation, such as moving in with family or friends 17 81 - - 1
l. Used up all or most of your savings 59 40 - - 1
N= 1,204
23
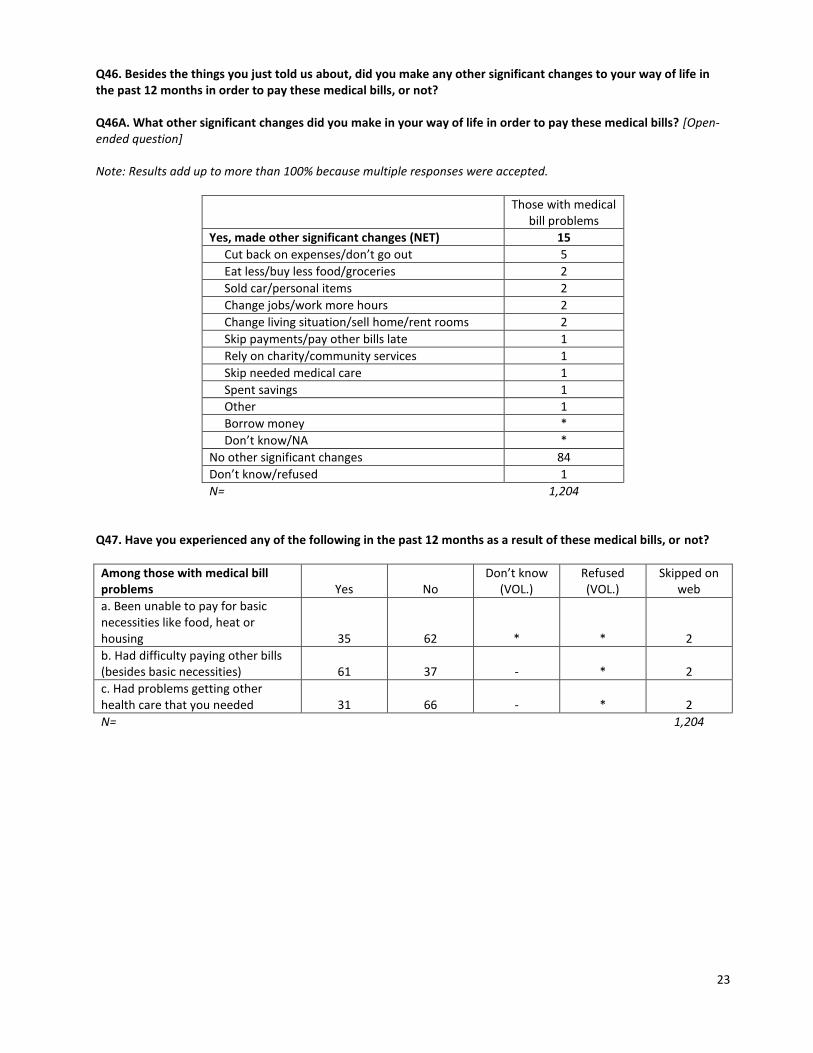
Q46. Besides the things you just told us about, did you make any other significant changes to your way of life in the past 12 months in order to pay these medical bills, or not? Q46A. What other significant changes did you make in your way of life in order to pay these medical bills? [Open-ended question] Note: Results add up to more than 100% because multiple responses were accepted.
Those with medical bill problems
Yes, made other significant changes (NET) 15
Cut back on expenses/don’t go out 5
Eat less/buy less food/groceries 2
Sold car/personal items 2
Change jobs/work more hours 2
Change living situation/sell home/rent rooms 2
Skip payments/pay other bills late 1
Rely on charity/community services 1
Skip needed medical care 1
Spent savings 1
Other 1
Borrow money *
Don’t know/NA *
No other significant changes 84
Don’t know/refused 1
N= 1,204 Q47. Have you experienced any of the following in the past 12 months as a result of these medical bills, or not?
Among those with medical bill problems Yes No
Don’t know (VOL.)
Refused (VOL.)
Skipped on web
a. Been unable to pay for basic necessities like food, heat or housing 35 62 * * 2
b. Had difficulty paying other bills (besides basic necessities) 61 37 - * 2
c. Had problems getting other health care that you needed 31 66 - * 2
N= 1,204

24
Q48. Did you (or anyone else in your household) lose a job or have to take a cut in pay or hours due to the illness or injury that led to these bills? This can either be the result of the illness itself or in order to care for the person who was sick.
Those with medical bill problems
Yes 29
No 70
Don’t know (VOL.) -
Refused (VOL.) *
Skipped on web 1
N= 1,204 If “Yes” in Q48 Q49. Did your overall household income decrease as a result of this change in work status, or not?
Those with medical bill problems
Yes, decreased a lot 64
Yes, decreased a little 32
No, did not decrease 4
Don’t know (VOL.) -
Refused (VOL.) -
Skipped on web -
N= 349 Q48/Q49 COMBINED BASED ON TOTAL WHO HAD PROBLEMS PAYING MEDICAL BILLS
Those with medical bill problems
Lost a job/cut in pay due to illness (NET) 29
Income decreased a lot 19
Income decreased a little 9
Income did not decrease 1
Don’t know/refused income change -
Did not lose a job/cut in pay due to illness 70
Don’t know/refused/skipped 1
N= 1,204 Q50. Have you since paid off all the medical bills you owed, or do you still owe money on at least one bill (including medical bills you paid with a credit card and haven’t paid off yet)?
Those with medical bill problems
Paid off all the medical bills 18
Still owe money on at least one bill 80
Don’t know (VOL.) 1
Refused (VOL.) *
Skipped on web 2
N= 1,204
25
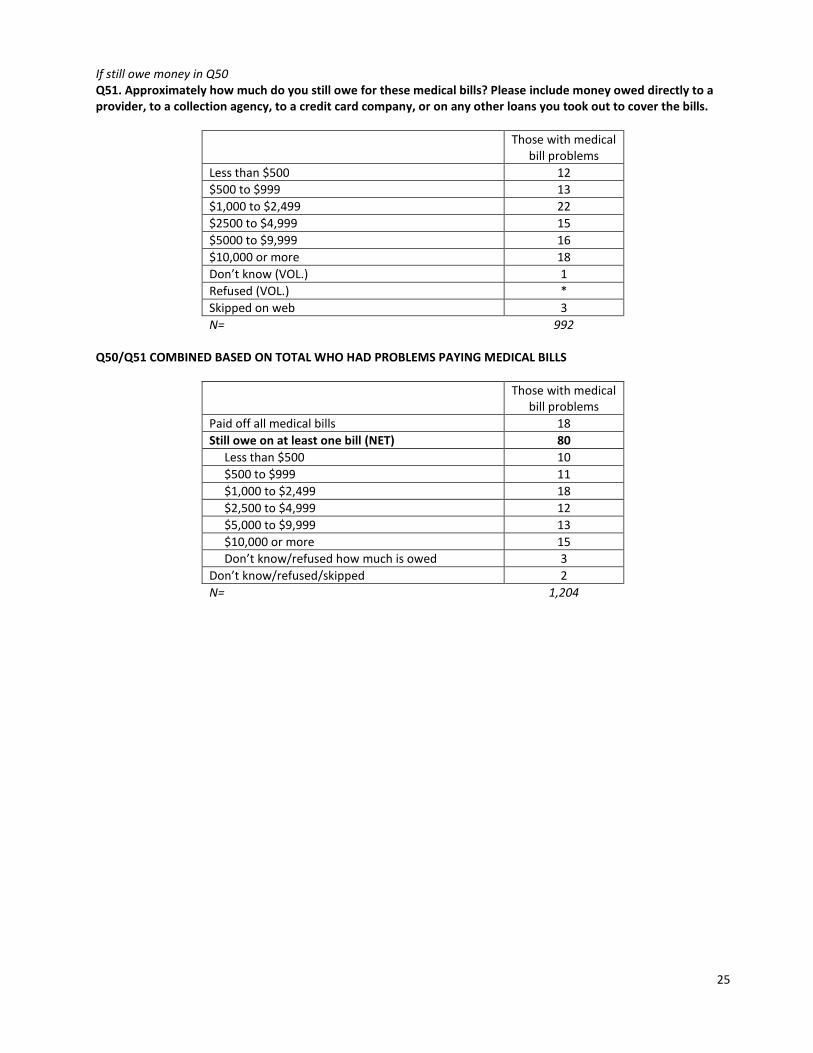
If still owe money in Q50 Q51. Approximately how much do you still owe for these medical bills? Please include money owed directly to a provider, to a collection agency, to a credit card company, or on any other loans you took out to cover the bills.
Those with medical bill problems
Less than $500 12
$500 to $999 13
$1,000 to $2,499 22
$2500 to $4,999 15
$5000 to $9,999 16
$10,000 or more 18
Don’t know (VOL.) 1
Refused (VOL.) *
Skipped on web 3
N= 992 Q50/Q51 COMBINED BASED ON TOTAL WHO HAD PROBLEMS PAYING MEDICAL BILLS
Those with medical bill problems
Paid off all medical bills 18
Still owe on at least one bill (NET) 80
Less than $500 10
$500 to $999 11
$1,000 to $2,499 18
$2,500 to $4,999 12
$5,000 to $9,999 13
$10,000 or more 15
Don’t know/refused how much is owed 3
Don’t know/refused/skipped 2
N= 1,204
26
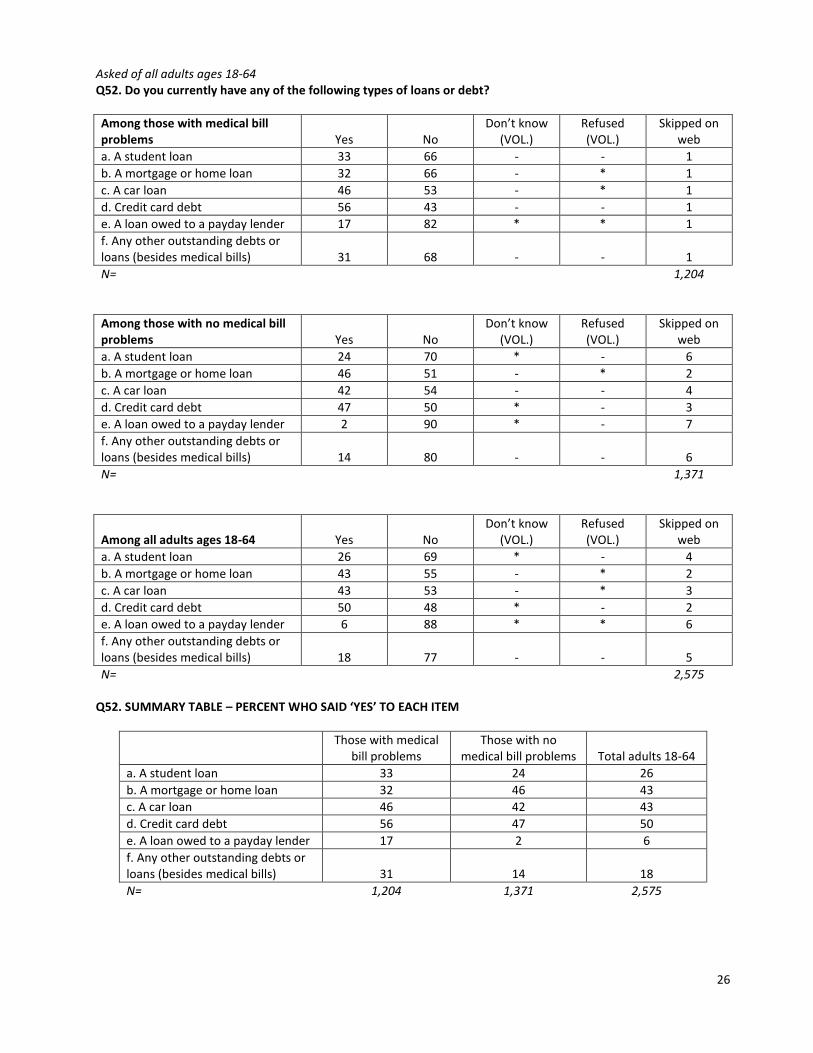
Asked of all adults ages 18-64 Q52. Do you currently have any of the following types of loans or debt?
Among those with medical bill problems Yes No
Don’t know (VOL.)
Refused (VOL.)
Skipped on web
a. A student loan 33 66 - - 1
b. A mortgage or home loan 32 66 - * 1
c. A car loan 46 53 - * 1
d. Credit card debt 56 43 - - 1
e. A loan owed to a payday lender 17 82 * * 1
f. Any other outstanding debts or loans (besides medical bills) 31 68 - - 1
N= 1,204
Among those with no medical bill problems Yes No
Don’t know (VOL.)
Refused (VOL.)
Skipped on web
a. A student loan 24 70 * - 6
b. A mortgage or home loan 46 51 - * 2
c. A car loan 42 54 - - 4
d. Credit card debt 47 50 * - 3
e. A loan owed to a payday lender 2 90 * - 7
f. Any other outstanding debts or loans (besides medical bills) 14 80 - - 6
N= 1,371
Among all adults ages 18-64 Yes No Don’t know
(VOL.) Refused (VOL.)
Skipped on web
a. A student loan 26 69 * - 4
b. A mortgage or home loan 43 55 - * 2
c. A car loan 43 53 - * 3
d. Credit card debt 50 48 * - 2
e. A loan owed to a payday lender 6 88 * * 6
f. Any other outstanding debts or loans (besides medical bills) 18 77 - - 5
N= 2,575 Q52. SUMMARY TABLE – PERCENT WHO SAID ‘YES’ TO EACH ITEM
Those with medical
bill problems Those with no
medical bill problems Total adults 18-64
a. A student loan 33 24 26
b. A mortgage or home loan 32 46 43
c. A car loan 46 42 43
d. Credit card debt 56 47 50
e. A loan owed to a payday lender 17 2 6
f. Any other outstanding debts or loans (besides medical bills) 31 14 18
N= 1,204 1,371 2,575
27
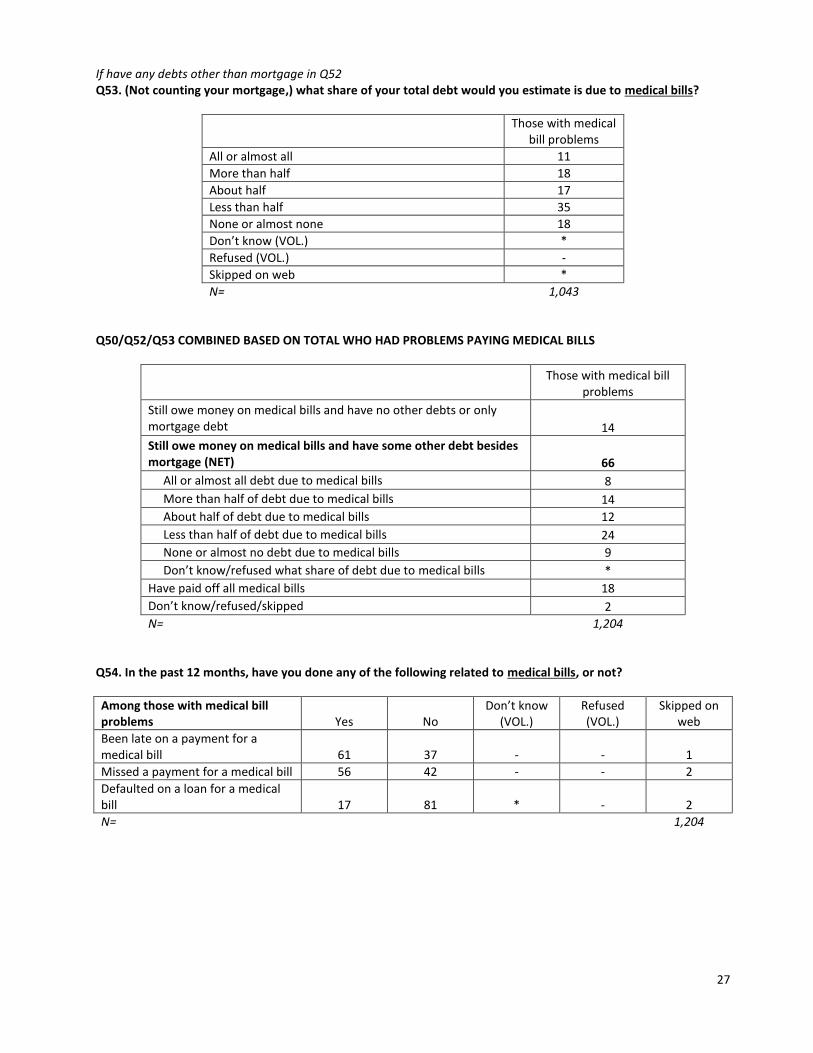
If have any debts other than mortgage in Q52 Q53. (Not counting your mortgage,) what share of your total debt would you estimate is due to medical bills?
Those with medical bill problems
All or almost all 11
More than half 18
About half 17
Less than half 35
None or almost none 18
Don’t know (VOL.) *
Refused (VOL.) -
Skipped on web *
N= 1,043 Q50/Q52/Q53 COMBINED BASED ON TOTAL WHO HAD PROBLEMS PAYING MEDICAL BILLS
Those with medical bill problems
Still owe money on medical bills and have no other debts or only mortgage debt 14
Still owe money on medical bills and have some other debt besides mortgage (NET) 66
All or almost all debt due to medical bills 8
More than half of debt due to medical bills 14
About half of debt due to medical bills 12
Less than half of debt due to medical bills 24
None or almost no debt due to medical bills 9
Don’t know/refused what share of debt due to medical bills *
Have paid off all medical bills 18
Don’t know/refused/skipped 2
N= 1,204 Q54. In the past 12 months, have you done any of the following related to medical bills, or not?
Among those with medical bill problems Yes No
Don’t know (VOL.)
Refused (VOL.)
Skipped on web
Been late on a payment for a medical bill 61 37 - - 1
Missed a payment for a medical bill 56 42 - - 2
Defaulted on a loan for a medical bill 17 81 * - 2
N= 1,204

28
Asked of all adults ages 18-64 Q55. In the past 12 months, have you done any of the following related to another loan or debt besides medical bills, or not?
Among those with medical bill problems Yes No
Don’t know (VOL.)
Refused (VOL.)
Skipped on web
a. Been late on a payment for a bill other than medical bills 56 42 1 * 1
b. Missed a payment for a bill other than medical bills 46 52 1 * 1
c. Defaulted on a loan not related to medical bills 19 79 * * 1
N= 1,204
Among those with no medical bill problems Yes No
Don’t know (VOL.)
Refused (VOL.)
Skipped on web
a. Been late on a payment for a bill other than medical bills 19 81 - - *
b. Missed a payment for a bill other than medical bills 11 89 - - *
c. Defaulted on a loan not related to medical bills 4 95 - - *
N= 1,371
Among all adults ages 18-64 Yes No Don’t know
(VOL.) Refused (VOL.)
Skipped on web
a. Been late on a payment for a bill other than medical bills 29 71 * * *
b. Missed a payment for a bill other than medical bills 20 79 * * *
c. Defaulted on a loan not related to medical bills 8 91 * * *
N= 2,575 Asked of all adults ages 18-64 Q56. Have you (or someone else in your household) been contacted by a collection agency in the past 12 months for any reason, or not?
Those with medical bill problems
Those with no medical bill problems Total adults 18-64
Yes, been contacted by a collection agency 58 16 27
No, have not been contacted by a collection agency 41 84 73
Don’t know (VOL.) 1 - *
Refused (VOL.) - - -
Skipped on web * * *
N= 1,204 1,371 2,575

29
Asked of all adults ages 18-64 who answered “Yes” in Q56 Q57. Was that because of medical bills, some other type of bills, or both?
Those with medical bill problems
Those with no medical bill problems
Total adults 18-64
Medical bills 43 26 35
Some other type of bills 20 60 37
Both medical bills and some other type of debt 34 10 24
Don’t know (VOL.) 1 * *
Refused (VOL.) - - -
Skipped on web 2 4 3
N= 769 238 1,007 Q56/Q57 COMBINED BASED ON ALL ADULTS AGES 18-64
Those with medical bill problems
Those with no medical bill problems
Total adults 18-64
Contacted by collection agency past 12 months (NET) 58 16 27
Medical bills 25 4 9
Some other type of bills 12 9 10
Both medical bills and other type of bills 20 2 6
Don’t know/refused why contacted 2 1 1
Not contacted by collection agency 41 84 73
Don’t know/refused/skipped 1 * *
N= 1,204 1,371 2,575 Asked of all adults ages 18-64 who were contacted about some other type of bills or both medical bills and other type of bills in Q57 Q57A. For what other type of debt were you contacted by a collection agency? [Open-ended question] Note: Results add up to more than 100% because multiple responses were accepted.
Those with medical bill problems
Those with no medical bill problems
Total adults 18-64
Credit card 37 36 36
Student/college loan 18 13 15
Auto/car loan 10 9 10
Cell phone/phone 5 10 8
Utility bill 8 4 6
Loan – unspecified 9 4 6
Payday loan 7 3 5
Home loan/mortgage/rent 6 4 5
Cable bill 4 5 4
Medical bill 3 1 2
Relative’s bills 2 2 2
Bank charges 3 1 2
Other 8 9 8
Don’t know/NA 4 7 6
Refused - 1 1
N= 443 170 613
30
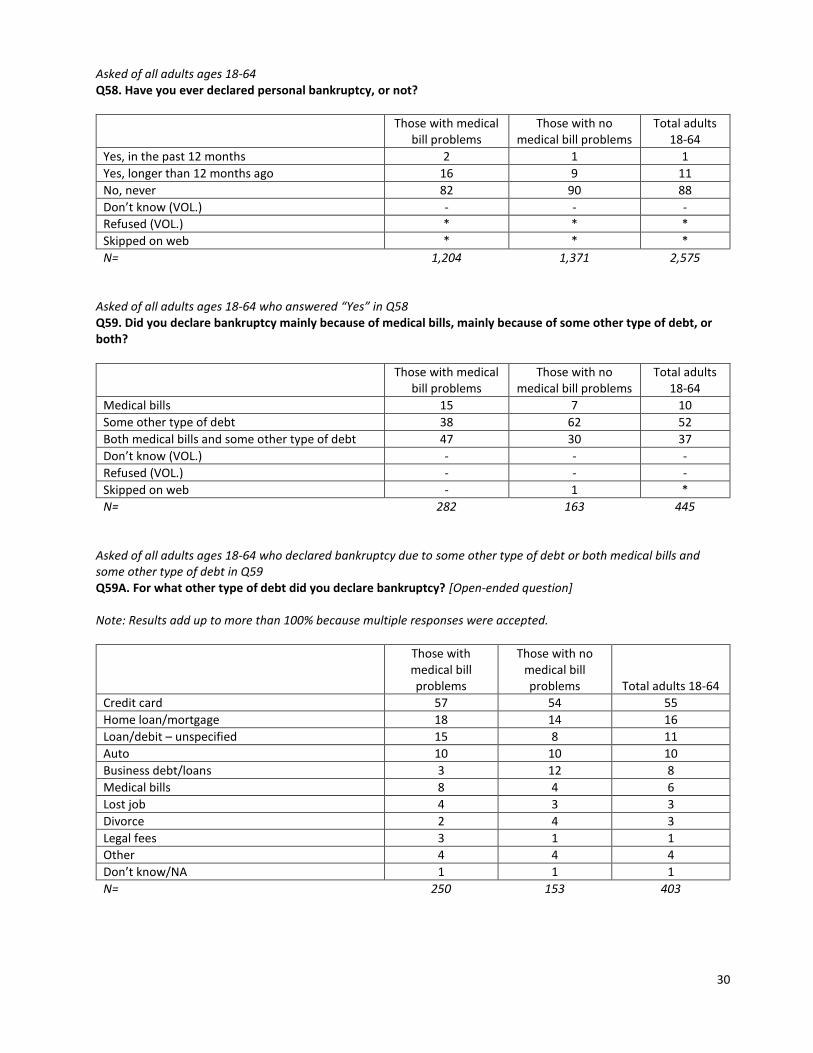
Asked of all adults ages 18-64 Q58. Have you ever declared personal bankruptcy, or not?
Those with medical bill problems
Those with no medical bill problems
Total adults 18-64
Yes, in the past 12 months 2 1 1
Yes, longer than 12 months ago 16 9 11
No, never 82 90 88
Don’t know (VOL.) - - -
Refused (VOL.) * * *
Skipped on web * * *
N= 1,204 1,371 2,575 Asked of all adults ages 18-64 who answered “Yes” in Q58 Q59. Did you declare bankruptcy mainly because of medical bills, mainly because of some other type of debt, or both?
Those with medical bill problems
Those with no medical bill problems
Total adults 18-64
Medical bills 15 7 10
Some other type of debt 38 62 52
Both medical bills and some other type of debt 47 30 37
Don’t know (VOL.) - - -
Refused (VOL.) - - -
Skipped on web - 1 *
N= 282 163 445 Asked of all adults ages 18-64 who declared bankruptcy due to some other type of debt or both medical bills and some other type of debt in Q59 Q59A. For what other type of debt did you declare bankruptcy? [Open-ended question] Note: Results add up to more than 100% because multiple responses were accepted.
Those with medical bill problems
Those with no medical bill problems Total adults 18-64
Credit card 57 54 55
Home loan/mortgage 18 14 16
Loan/debit – unspecified 15 8 11
Auto 10 10 10
Business debt/loans 3 12 8
Medical bills 8 4 6
Lost job 4 3 3
Divorce 2 4 3
Legal fees 3 1 1
Other 4 4 4
Don’t know/NA 1 1 1
N= 250 153 403
31
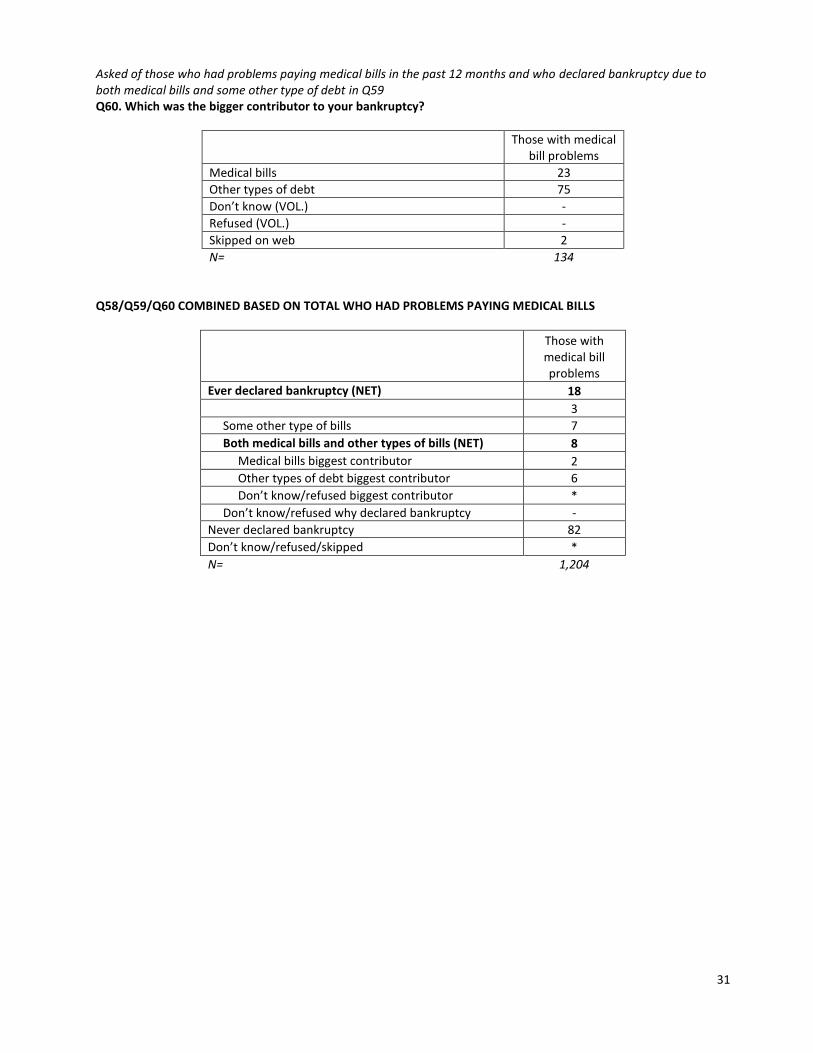
Asked of those who had problems paying medical bills in the past 12 months and who declared bankruptcy due to both medical bills and some other type of debt in Q59 Q60. Which was the bigger contributor to your bankruptcy?
Those with medical bill problems
Medical bills 23
Other types of debt 75
Don’t know (VOL.) -
Refused (VOL.) -
Skipped on web 2
N= 134 Q58/Q59/Q60 COMBINED BASED ON TOTAL WHO HAD PROBLEMS PAYING MEDICAL BILLS
Those with medical bill problems
Ever declared bankruptcy (NET) 18
3
Some other type of bills 7
Both medical bills and other types of bills (NET) 8
Medical bills biggest contributor 2
Other types of debt biggest contributor 6
Don’t know/refused biggest contributor *
Don’t know/refused why declared bankruptcy -
Never declared bankruptcy 82
Don’t know/refused/skipped *
N= 1,204
32
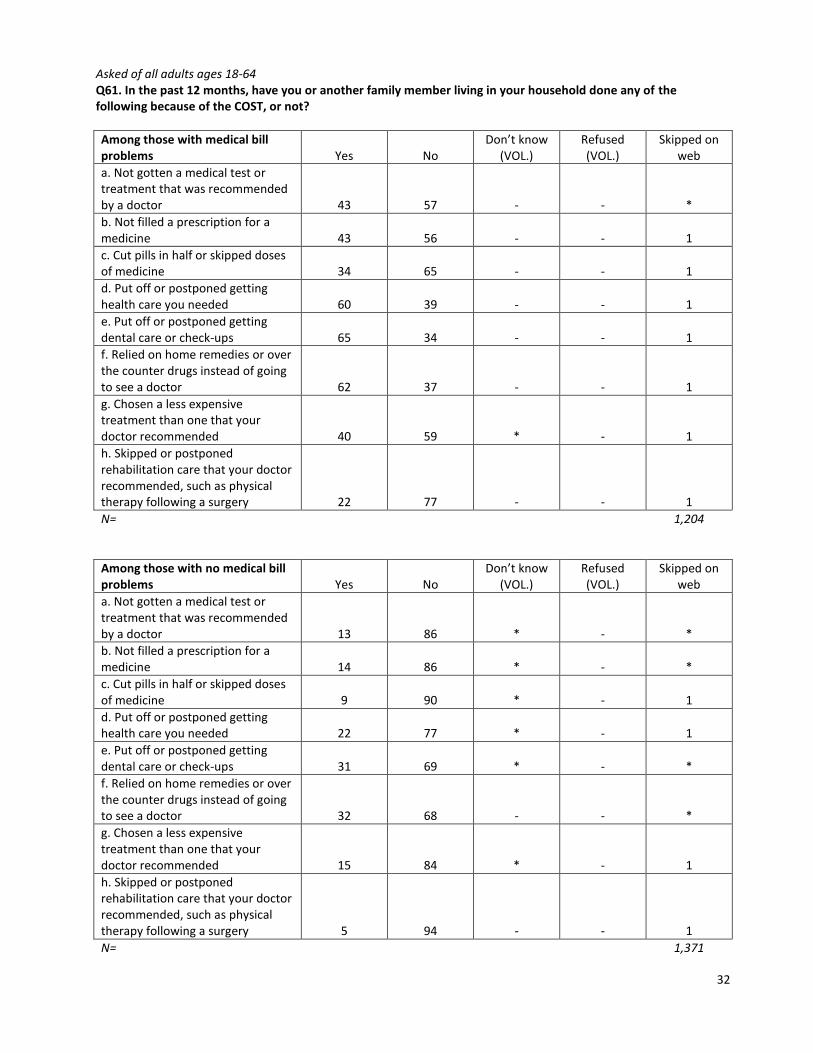
Asked of all adults ages 18-64 Q61. In the past 12 months, have you or another family member living in your household done any of the following because of the COST, or not?
Among those with medical bill problems Yes No
Don’t know (VOL.)
Refused (VOL.)
Skipped on web
a. Not gotten a medical test or treatment that was recommended by a doctor 43 57 - - *
b. Not filled a prescription for a medicine 43 56 - - 1
c. Cut pills in half or skipped doses of medicine 34 65 - - 1
d. Put off or postponed getting health care you needed 60 39 - - 1
e. Put off or postponed getting dental care or check-ups 65 34 - - 1
f. Relied on home remedies or over the counter drugs instead of going to see a doctor 62 37 - - 1
g. Chosen a less expensive treatment than one that your doctor recommended 40 59 * - 1
h. Skipped or postponed rehabilitation care that your doctor recommended, such as physical therapy following a surgery 22 77 - - 1
N= 1,204
Among those with no medical bill problems Yes No
Don’t know (VOL.)
Refused (VOL.)
Skipped on web
a. Not gotten a medical test or treatment that was recommended by a doctor 13 86 * - *
b. Not filled a prescription for a medicine 14 86 * - *
c. Cut pills in half or skipped doses of medicine 9 90 * - 1
d. Put off or postponed getting health care you needed 22 77 * - 1
e. Put off or postponed getting dental care or check-ups 31 69 * - *
f. Relied on home remedies or over the counter drugs instead of going to see a doctor 32 68 - - *
g. Chosen a less expensive treatment than one that your doctor recommended 15 84 * - 1
h. Skipped or postponed rehabilitation care that your doctor recommended, such as physical therapy following a surgery 5 94 - - 1
N= 1,371
33
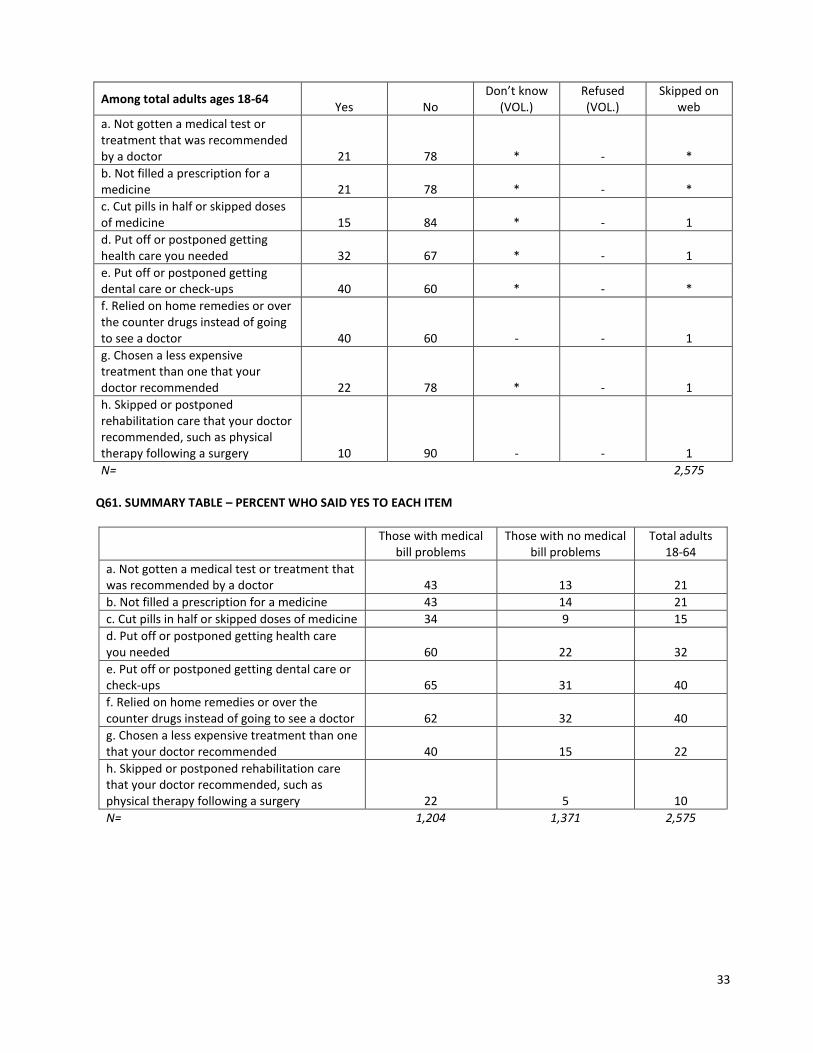
Among total adults ages 18-64 Yes No
Don’t know (VOL.)
Refused (VOL.)
Skipped on web
a. Not gotten a medical test or treatment that was recommended by a doctor 21 78 * - *
b. Not filled a prescription for a medicine 21 78 * - *
c. Cut pills in half or skipped doses of medicine 15 84 * - 1
d. Put off or postponed getting health care you needed 32 67 * - 1
e. Put off or postponed getting dental care or check-ups 40 60 * - *
f. Relied on home remedies or over the counter drugs instead of going to see a doctor 40 60 - - 1
g. Chosen a less expensive treatment than one that your doctor recommended 22 78 * - 1
h. Skipped or postponed rehabilitation care that your doctor recommended, such as physical therapy following a surgery 10 90 - - 1
N= 2,575 Q61. SUMMARY TABLE – PERCENT WHO SAID YES TO EACH ITEM
Those with medical
bill problems Those with no medical
bill problems Total adults
18-64
a. Not gotten a medical test or treatment that was recommended by a doctor 43 13 21
b. Not filled a prescription for a medicine 43 14 21
c. Cut pills in half or skipped doses of medicine 34 9 15
d. Put off or postponed getting health care you needed 60 22 32
e. Put off or postponed getting dental care or check-ups 65 31 40
f. Relied on home remedies or over the counter drugs instead of going to see a doctor 62 32 40
g. Chosen a less expensive treatment than one that your doctor recommended 40 15 22
h. Skipped or postponed rehabilitation care that your doctor recommended, such as physical therapy following a surgery 22 5 10
N= 1,204 1,371 2,575

34
Asked of all adults ages 18-64 Q62. When you visit a doctor, how often does the doctor explain to you the costs associated with recommended procedures, and whether they would be covered by your health insurance?
Those with medical bill problems
Those with no medical bill problems Total adults 18-64
Almost always 16 16 16
Sometimes 22 21 21
Rarely 26 29 28
Never 35 34 34
Don’t know (VOL.) 1 1 1
Refused (VOL.) - - -
Skipped on web * * *
N= 1,204 1,371 2,575 Asked of all adults ages 18-64 Q63. In the past 12 months, have you ever…
Among those with medical bill problems Yes No
Don’t know (VOL.)
Refused (VOL.)
Skipped on web
a. Checked with a doctor’s office or health plan before a visit to find out how much you would have to pay 49 51 - - *
b. Attempted to shop around at different providers to find the best price for a medical service 34 66 - - 1
c. Tried to negotiate with a doctor, hospital, or other health care provider to get a lower price before receiving services 22 77 - - 1
d. Received free care or reduced fees from a doctor, hospital, or health care clinic 21 78 - - 1
e. Been asked to pay up front for the full cost of medical care (not just your insurance copay) 36 63 * - 1
N= 1,204
Among those with no medical bill problems Yes No
Don’t know (VOL.)
Refused (VOL.)
Skipped on web
a. Checked with a doctor’s office or health plan before a visit to find out how much you would have to pay 34 66 - - *
b. Attempted to shop around at different providers to find the best price for a medical service 17 83 - - *
c. Tried to negotiate with a doctor, hospital, or other health care provider to get a lower price before receiving services 6 93 * - 1
d. Received free care or reduced fees from a doctor, hospital, or health care clinic 12 88 * - *
e. Been asked to pay up front for the full cost of medical care (not just your insurance copay) 14 86 * - *
N= 1,371

35
Among total adults ages 18-64 Yes No
Don’t know (VOL.)
Refused (VOL.)
Skipped on web
a. Checked with a doctor’s office or health plan before a visit to find out how much you would have to pay 38 62 - - *
b. Attempted to shop around at different providers to find the best price for a medical service 21 78 - - *
c. Tried to negotiate with a doctor, hospital, or other health care provider to get a lower price before receiving services 10 89 * - 1
d. Received free care or reduced fees from a doctor, hospital, or health care clinic 14 85 * - *
e. Been asked to pay up front for the full cost of medical care (not just your insurance copay) 19 80 * - *
N= 2,575 Q63. SUMMARY TABLE – PERCENT WHO SAID ‘YES’ TO EACH ITEM
Those with medical bill problems
Those with no medical bill problems
Total adults 18-64
a. Checked with a doctor’s office or health plan before a visit to find out how much you would have to pay 49 34 38
b. Attempted to shop around at different providers to find the best price for a medical service 34 17 21
c. Tried to negotiate with a doctor, hospital, or other health care provider to get a lower price before receiving services 22 6 10
d. Received free care or reduced fees from a doctor, hospital, or health care clinic 21 12 14
e. Been asked to pay up front for the full cost of medical care (not just your insurance copay) 36 14 19
N= 1,204 1,371 2,575 If had problems paying medical bills in the past 12 months and attempted to shop around in Q63b Q64. When you shopped around for prices or checked before a visit, how easy or difficult was it to find the information about how much you would have to pay?
Those with medical bill problems
Very easy 8
Somewhat easy 21
Somewhat difficult 46
Very difficult 23
Don’t know (VOL.) 1
Refused (VOL.) -
Skipped on web *
N= 422

36
If had problems paying medical bills in the past 12 months and tried to negotiate in Q63c Q65. When you negotiated with a health care provider, were you able to get a lower price, or not?
Those with medical bill problems
Yes 32
No 67
Don’t know (VOL.) *
Refused (VOL.) -
Skipped on web *
N= 262
Asked of all adults ages 18-64 who are married SEMPLOY. Which statement best describes your spouse or partner’s current employment status?
Those with medical bill problems
Those with no medical bill problems Total adults 18-64
Working (NET) 71 81 79
Working – as a paid employee 62 73 70
Working – self-employed 9 8 9
Not working (NET) 29 19 21
Not working – on temporary layoff from a job 1 1 1
Not working – looking for work 6 2 3
Not working – retired 6 7 7
Not working – disabled 7 3 4
Not working – other 8 6 7
Don’t know (VOL.) * - *
Refused (VOL.) * - *
Skipped on web * * *
N= 488 699 1,187 Asked of all adults ages 18-64 who are working as a paid employee or spouse is working as a paid employee Q66. If [you/your spouse/you and your spouse] lost your [job/jobs], how long would it be before you exhausted your savings?
Those with medical bill problems
Those with no medical bill problems Total adults 18-64
We/I have no savings 59 18 27
Less than 6 months 31 38 36
6 months to 12 months 7 23 19
More than 12 months 3 19 16
Don’t know (VOL.) - - -
Refused (VOL.) - - -
Skipped on web 1 2 2
N= 714 976 1,690

37
EMPLOY/SEMPLOY/Q66 COMBINED BASED ON ALL ADULTS AGES 18-64
Those with medical bill problems
Those with no medical bill problems Total adults 18-64
Self or spouse working as a paid employee (NET) 61 72 69
No savings 34 13 19
Would exhaust savings in less than 6 months 18 27 25
Would exhaust savings in 6-12 months 4 16 13
Would exhaust savings in more than 12 months 2 14 11
Don’t know/refused/skipped * 1 1
Self and spouse not employed or self-employed only 39 28 31
N= 1,204 1,371 2,575 Asked of all adults ages 18-64 Q67. Do you (or your spouse) currently have each of the following, or not?
Among those with medical bill problems Yes No
Don’t know (VOL.)
Refused (VOL.)
Skipped on web
a. A checking or savings account at a bank or credit union 78 21 * * *
b. A credit card 53 46 * - 1
c. An IRA, 401K or similar kind of retirement account 43 56 * - 1
d. Another type of savings or investment, such as stocks, bonds, or mutual funds (besides those held in an IRA or 401K) 17 82 * - 1
N= 1,204
Among those with no medical bill problems Yes No
Don’t know (VOL.)
Refused (VOL.)
Skipped on web
a. A checking or savings account at a bank or credit union 90 9 * * *
b. A credit card 77 23 - - 1
c. An IRA, 401K or similar kind of retirement account 62 37 * * 1
d. Another type of savings or investment, such as stocks, bonds, or mutual funds (besides those held in an IRA or 401K) 38 61 * * 1
N= 1,371
Among total adults ages 18-64 Yes No
Don’t know (VOL.)
Refused (VOL.)
Skipped on web
a. A checking or savings account at a bank or credit union 87 12 * * *
b. A credit card 71 29 * - *
c. An IRA, 401K or similar kind of retirement account 57 42 * * 1
d. Another type of savings or investment, such as stocks, bonds, or mutual funds (besides those held in an IRA or 401K) 32 67 * * 1
N= 2,575
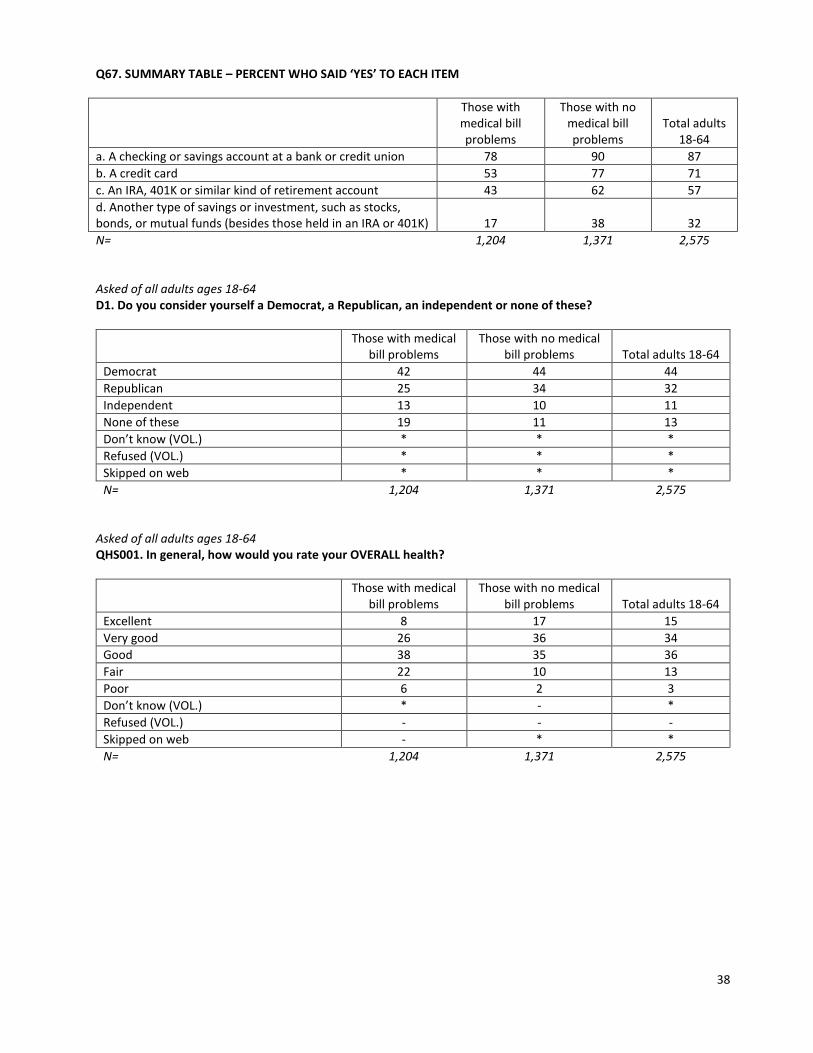
38
Q67. SUMMARY TABLE – PERCENT WHO SAID ‘YES’ TO EACH ITEM
Those with medical bill problems
Those with no medical bill problems
Total adults 18-64
a. A checking or savings account at a bank or credit union 78 90 87
b. A credit card 53 77 71
c. An IRA, 401K or similar kind of retirement account 43 62 57
d. Another type of savings or investment, such as stocks, bonds, or mutual funds (besides those held in an IRA or 401K) 17 38 32
N= 1,204 1,371 2,575 Asked of all adults ages 18-64 D1. Do you consider yourself a Democrat, a Republican, an independent or none of these?
Those with medical
bill problems Those with no medical
bill problems Total adults 18-64
Democrat 42 44 44
Republican 25 34 32
Independent 13 10 11
None of these 19 11 13
Don’t know (VOL.) * * *
Refused (VOL.) * * *
Skipped on web * * *
N= 1,204 1,371 2,575 Asked of all adults ages 18-64 QHS001. In general, how would you rate your OVERALL health?
Those with medical bill problems
Those with no medical bill problems Total adults 18-64
Excellent 8 17 15
Very good 26 36 34
Good 38 35 36
Fair 22 10 13
Poor 6 2 3
Don’t know (VOL.) * - *
Refused (VOL.) - - -
Skipped on web - * *
N= 1,204 1,371 2,575

39
Asked of all adults ages 18-64 QDisable. Does any disability, handicap, or chronic illness keep you from participating fully in work, school, housework, or other activities?
Those with medical bill problems
Those with no medical bill problems Total adults 18-64
Yes 30 12 17
No 69 88 83
Don’t know (VOL.) - * *
Refused (VOL.) - - -
Skipped on web * * *
N= 1,204 1,371 2,575 Asked of all adults ages 18-64 QCHRONIC. Are you, yourself, now receiving regular medical treatment or making regular doctor visits for any chronic health problem--such as asthma, high blood pressure or cancer, or not?
Those with medical bill problems
Those with no medical bill problems Total adults 18-64
Yes 37 25 28
No 62 74 71
Don’t know (VOL.) - - -
Refused (VOL.) - * *
Skipped on web * * *
N= 1,204 1,371 2,575 Survey interview mode
Those with medical bill problems
Those with no medical bill problems Total adults 18-64
Online 74 76 75
Phone 26 24 25
N= 1,204 1,371 2,575
40
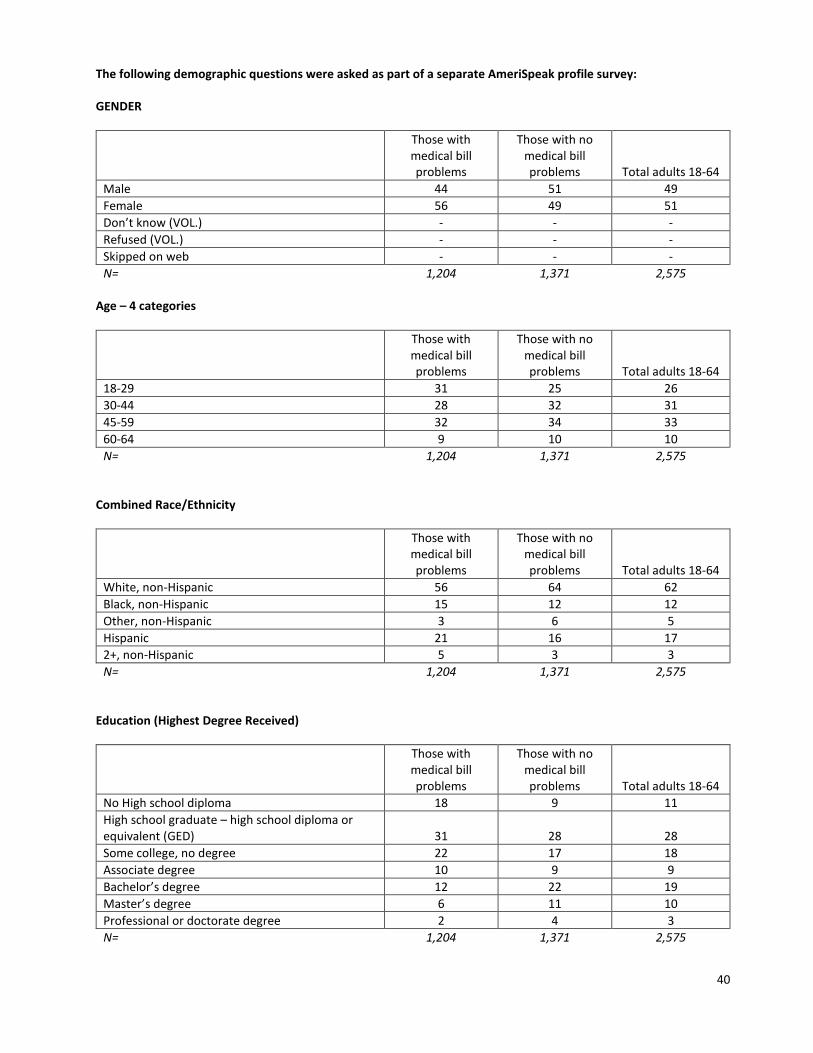
The following demographic questions were asked as part of a separate AmeriSpeak profile survey: GENDER
Those with medical bill problems
Those with no medical bill problems Total adults 18-64
Male 44 51 49
Female 56 49 51
Don’t know (VOL.) - - -
Refused (VOL.) - - -
Skipped on web - - -
N= 1,204 1,371 2,575 Age – 4 categories
Those with medical bill problems
Those with no medical bill problems Total adults 18-64
18-29 31 25 26
30-44 28 32 31
45-59 32 34 33
60-64 9 10 10
N= 1,204 1,371 2,575 Combined Race/Ethnicity
Those with medical bill problems
Those with no medical bill problems Total adults 18-64
White, non-Hispanic 56 64 62
Black, non-Hispanic 15 12 12
Other, non-Hispanic 3 6 5
Hispanic 21 16 17
2+, non-Hispanic 5 3 3
N= 1,204 1,371 2,575 Education (Highest Degree Received)
Those with medical bill problems
Those with no medical bill problems Total adults 18-64
No High school diploma 18 9 11
High school graduate – high school diploma or equivalent (GED) 31 28 28
Some college, no degree 22 17 18
Associate degree 10 9 9
Bachelor’s degree 12 22 19
Master’s degree 6 11 10
Professional or doctorate degree 2 4 3
N= 1,204 1,371 2,575
41
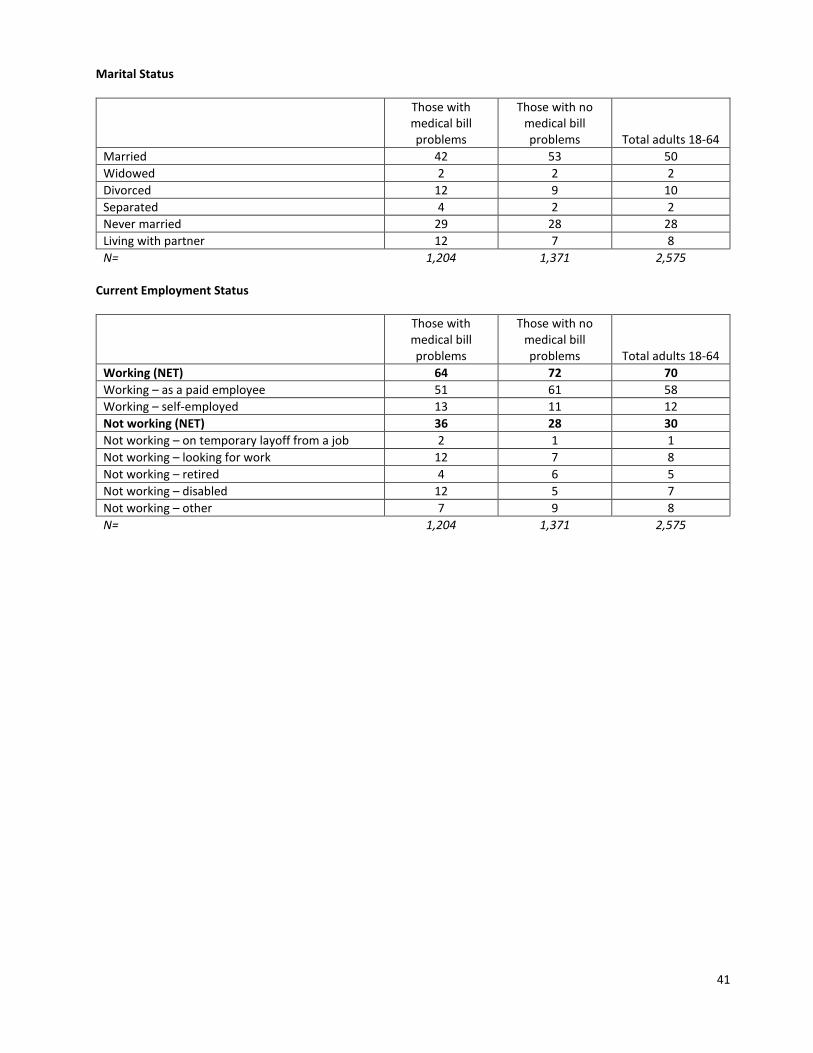
Marital Status
Those with medical bill problems
Those with no medical bill problems Total adults 18-64
Married 42 53 50
Widowed 2 2 2
Divorced 12 9 10
Separated 4 2 2
Never married 29 28 28
Living with partner 12 7 8
N= 1,204 1,371 2,575 Current Employment Status
Those with medical bill problems
Those with no medical bill problems Total adults 18-64
Working (NET) 64 72 70
Working – as a paid employee 51 61 58
Working – self-employed 13 11 12
Not working (NET) 36 28 30
Not working – on temporary layoff from a job 2 1 1
Not working – looking for work 12 7 8
Not working – retired 4 6 5
Not working – disabled 12 5 7
Not working – other 7 9 8
N= 1,204 1,371 2,575

42
Household Income
Those with medical bill problems
Those with no medical bill problems Total adults 18-64
Less than $50,000 (NET) 54 33 38
Less than $5,000 2 1 1
$5,000 to $9,999 4 4 4
$10,000 to $14,999 5 2 3
$15,000 to $19,999 5 3 3
$20,000 to $24,999 6 3 4
$25,000 to $29,999 5 4 4
$30,000 to $34,999 10 4 5
$35,000 to $39,999 6 4 5
$40,000 to $49,999 11 9 9
$50,000 or more (NET) 46 67 62
$50,000 to $59,999 9 8 8
$60,000 to $74,999 9 8 8
$75,000 to $84,999 6 5 5
$85,000 to $99,999 5 7 7
$100,000 to $124,999 7 17 14
$125,000 to $149,999 5 8 7
$150,000 to $174,999 2 5 4
$175,000 to $199,999 1 3 2
$200,000 or more 3 6 5
N= 1,204 1,371 2,575 Region – 4 level
Those with medical bill problems
Those with no medical bill problems Total adults 18-64
Northeast 12 20 18
Midwest 19 22 21
South 45 34 37
West 24 24 24
N= 1,204 1,371 2,575 Metropolitan Area Flag
Those with medical bill problems
Those with no medical bill problems Total adults 18-64
Non-metro area 14 11 12
Metro area 86 89 88
N= 1,204 1,371 2,575
43
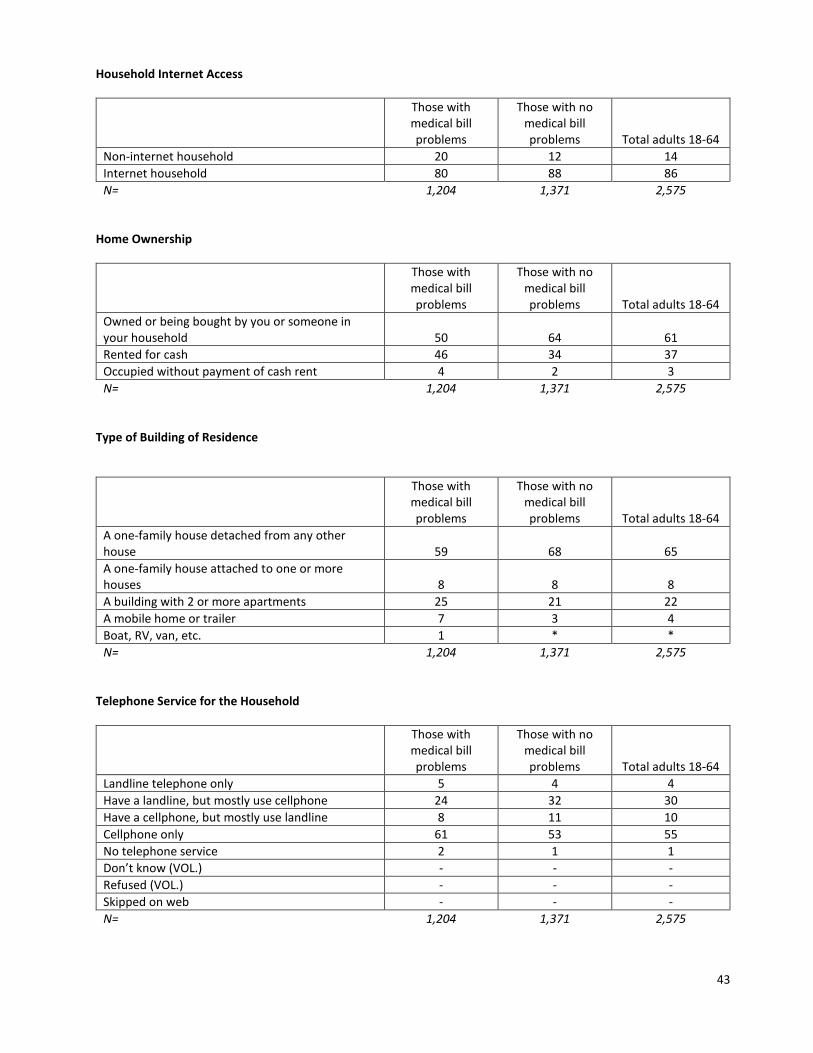
Household Internet Access
Those with medical bill problems
Those with no medical bill problems Total adults 18-64
Non-internet household 20 12 14
Internet household 80 88 86
N= 1,204 1,371 2,575 Home Ownership
Those with medical bill problems
Those with no medical bill problems Total adults 18-64
Owned or being bought by you or someone in your household 50 64 61
Rented for cash 46 34 37
Occupied without payment of cash rent 4 2 3
N= 1,204 1,371 2,575 Type of Building of Residence
Those with medical bill problems
Those with no medical bill problems Total adults 18-64
A one-family house detached from any other house 59 68 65
A one-family house attached to one or more houses 8 8 8
A building with 2 or more apartments 25 21 22
A mobile home or trailer 7 3 4
Boat, RV, van, etc. 1 * *
N= 1,204 1,371 2,575 Telephone Service for the Household
Those with medical bill problems
Those with no medical bill problems Total adults 18-64
Landline telephone only 5 4 4
Have a landline, but mostly use cellphone 24 32 30
Have a cellphone, but mostly use landline 8 11 10
Cellphone only 61 53 55
No telephone service 2 1 1
Don’t know (VOL.) - - -
Refused (VOL.) - - -
Skipped on web - - -
N= 1,204 1,371 2,575

44
Household Size (Including Children)
Those with medical bill problems
Those with no medical bill problems Total adults 18-64
1 13 15 15
2 28 31 31
3 19 20 20
4 19 19 19
5 11 8 9
6 9 7 7
N= 1,204 1,371 2,575 Number of Household Members Age 0-1
Those with medical bill problems
Those with no medical bill problems Total adults 18-64
0 91 94 93
1 8 6 6
2 1 * *
3 * - *
4 * - *
N= 1,204 1,371 2,575 Number of Household Members Age 2-5
Those with medical bill problems
Those with no medical bill problems Total adults 18-64
0 81 87 86
1 15 10 11
2 4 3 3
3 * - *
N= 1,204 1,371 2,575 Number of Household Members Age 6-12
Those with medical bill problems
Those with no medical bill problems Total adults 18-64
0 74 78 77
1 16 14 15
2 9 5 6
3 1 1 1
4 * 1 *
N= 1,204 1,371 2,575
45
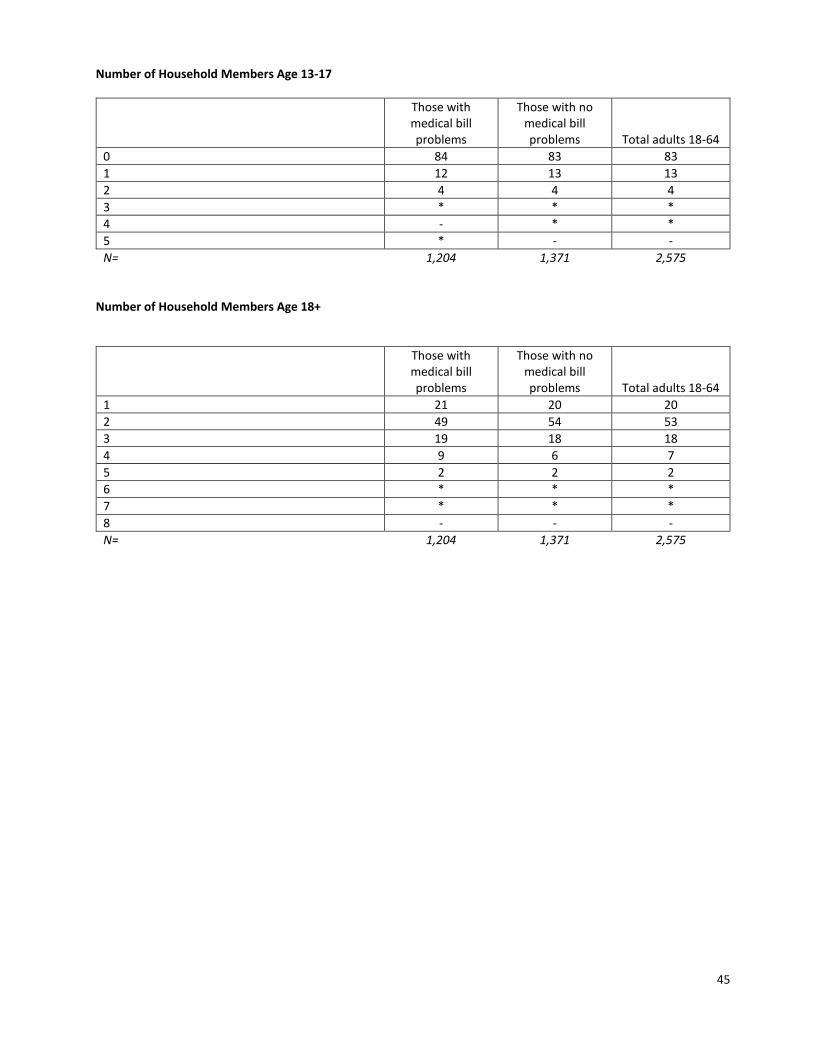
Number of Household Members Age 13-17
Those with medical bill problems
Those with no medical bill problems Total adults 18-64
0 84 83 83
1 12 13 13
2 4 4 4
3 * * *
4 - * *
5 * - -
N= 1,204 1,371 2,575 Number of Household Members Age 18+
Those with medical bill problems
Those with no medical bill problems Total adults 18-64
1 21 20 20
2 49 54 53
3 19 18 18
4 9 6 7
5 2 2 2
6 * * *
7 * * *
8 - - -
N= 1,204 1,371 2,575
The Henry J. Kaiser Family Foundation
Headquarters
2400 Sand Hill Road Menlo Park, CA 94025
Phone: (650) 854-9400 Fax: (650) 854-4800
Washington Offices and Barbara Jordan Conference Center
1330 G Street, NW Washington, DC 20005
Phone: (202) 347-5270 Fax: (202) 347-5274
www.kff.org
This publication (#8806-T) is available on the Kaiser Family Foundation website at www.kff.org.
Filling the need for trusted information on national health issues, the Kaiser Family Foundation is a nonprofit organization based in Menlo Park, California.