kaldor s “t echnical progress function and the verdoorn ...€¦ · of output growth) that is...
TRANSCRIPT
KALDOR’S “TECHNICAL PROGRESS FUNCTION” AND THE VERDOORN LAW REVISITED
John S.L. McCombie
and
Marta R.M. Spreafico*
CAMBRIDGE CENTRE FOR ECONOMIC AND PUBLIC POLICY
CCEPP WP02-15
DEPARTMENT OF LAND ECONOMY
UNIVERSITY OF CAMBRIDGE
MAY 2015
Address for correspondence: John S. L. McCombie, Cambridge Centre for Economic and Public Policy,
Department of Land Economy, University of Cambridge, Cambridge, CB9 3EP, United Kingdom; email
* University of Cambridge (JSLM) and the Catholic University of the Sacred Heart, Milan (MRMS). We
are grateful for the helpful comments of two anonymous referees and to Jesus Felipe, who has
collaborated extensively with John McCombie on the accounting identity critique.
2
KALDOR’S “TECHNICAL PROGRESS FUNCTION” AND THE VERDOORN LAW REVISITED
Abstract: Kaldor put forward his technical progress function as an alternative to
the neoclassical aggregate production function. It is shown that the Verdoorn law
is its empirical counterpart, although allowing for increasing returns to scale.
However, both may be derived from an aggregate Cobb-Douglas production
function. But aggregation problems and the Cambridge capital theory
controversies have shown theoretically that aggregate production functions in all
probability do not exist. Moreover, the only reason that estimations of “aggregate
production functions” give good results is the existence of an accounting identity.
This paper reconsiders the technical progress function and Verdoorn’s law,
especially in the light of these problems. Nevertheless, it is shown that estimates
of the law do, in fact, provide insights into the growth process very similar to
those of Kaldor, but viewed from another perspective.
Key words: Kaldor, technical progress function, Verdoorn’s law, aggregate production
functions, accounting identity critique.
JEL classifications: B5, E12, O4
1. Introduction
Kaldor was highly critical of explaining economic growth in terms of a neoclassical aggregate
production function. In particular, he was extremely sceptical of the attempt to dichotomise
economic growth into that attributable to the rate of exogenous technical change and that to the
growth of factor inputs, in a manner that was first formulated within an analytical model by
Solow (1956) and Swan (1956). He was thus equally critical of the use of the linear and
homogeneous aggregate production function where “the changing state of knowledge” and the
steady-state growth of productivity are represented by a continuous exogenous shift of the
aggregate production function over time (as in the empirical study of Solow, 1957). It made no
sense, according to Kaldor, to view capital accumulation as merely the replication of existing
capital goods, as the act of investment itself generated new and improved methods of
production.

3
Consequently, Kaldor, in 1957, first put forward his alternative approach based on the concept
of the technical progress function (although he makes no reference here to Solow’s growth
model). The initial technical progress function is a dynamic production relationship, relating the
growth of productivity to the growth of the capital-labour ratio. The specification changed in
Kaldor and Mirrlees (1962) to a vintage approach, but the basic insights remained largely the
same. Kaldor, in a manner that ironically anticipated the later neoclassical endogenous growth
theories, argued that the growth of capital per worker induced technical change, but at a
diminishing rate. Although he nowhere explicitly stated so, it seems that he regarded
Verdoorn’s law as the empirical counterpart of his initial specification of the technical progress
function (Kaldor, 1966). Verdoorn’s law, in its simplest form, is the linear relationship between
the growth of productivity and output. An estimate of the Verdoorn coefficient (the coefficient
of output growth) that is statistically significantly greater than zero implies increasing returns to
scale. (See Blankenburg and Harcourt, 2007, on increasing returns.) The original Verdoorn’s
law was deceptively simple (Kaldor, 1966), but since then more sophisticated specifications and
econometric estimations have largely confirmed the original results (see, for example, the
references in Angeriz et al., 2008). There is, however, one major difference between Verdoorn’s
law and the technical progress function. This is the emphasis on increasing returns to scale in
the interpretation of the estimates of Verdoorn’s law. This is in accord with the greater
emphasis Kaldor placed on increasing returns to scale in his later writings, beginning with his
seminal 1972 paper, “The Irrelevance of Equilibrium Economics”. In this, Kaldor was heavily
influenced by Young (1928) and he emphasised the process of cumulative causation in
economic growth. However, the linear version of technical progress function exhibits constant
returns to scale, and the non-linear version has decreasing returns to the growth of the capital-
labour ratio.
There are two seriously related criticisms of the technical progress function, which may be the
reason that it virtually disappeared from the literature without trace after about the early1960s.
The first was that a linear approximation of the technical progress function around, for example,

4
its steady-state growth rate could be integrated to give a Cobb-Douglas production function.
Moreover, Kaldor himself used the linear version in his theoretical models. Notwithstanding the
fact that the non-linear version could not be derived from a Cobb-Douglas production function
(Black 1962), this considerably reduced its novelty. Secondly, to the extent that the technical
progress function represents an aggregate production relationship (albeit without any recourse to
the marginal productivity theory of factor pricing or the other usual neoclassical assumptions), it
is subject to the severe criticisms that the neoclassical production function faces from the
aggregation problem and the Cambridge capital theory controversies. And, ironically, it also
suffers from the criticisms Kaldor himself made of the neoclassical production function.
In spite of these problems, estimations of aggregate production functions generally, but not
always, give good statistical fits, with plausible estimates of the output elasticities. It is now
well-established that this results solely from the use of value data, instead of physical
magnitudes, for output and the capital stock. All that the estimates of putative aggregative
production functions are picking up are a (transformation) of an underlying national income and
product accounts accounting identity. This poses a paradox in that the best statistical fits using
these data should theoretically give estimates that could be (erroneously) interpreted as
indicating constant returns to scale. (It should be emphasised that this is irrespective of whether
the actual production processes expressed in engineering or physical terms display diminishing,
constant, or increasing returns to scale.) However, Verdoorn’s law commonly gives estimates
that suggest that there are substantial increasing returns to scale.
This paper provides an explanation for this conundrum and provides support for Kaldor’s
insights as to the nature of economic growth, although from a different perspective.
In the next section, we consider the theoretical foundations of the two technical progress
functions and discuss their limitations. In section 3 we show how the original technical progress
function is related to Verdoorn’s law and the Cobb-Douglas production function. In section 4
we briefly discuss the aggregation problem and the accounting identity critique. Section 5
explains why estimates of Verdoorn’s law may have a statistically significant positive Verdoorn

5
coefficient, while the accounting identity suggests that it should be equal to zero. The argument
is illustrated by the use of two hypothetical data sets. Section 6 concludes.
2. The Technical Progress Function(s)
There are essentially two versions of the technical progress function. The first (Mark I) was
put forward in Kaldor (1957, 1961) and the second (Mark II) in Kaldor and Mirrlees (1962),
although we shall argue the latter was not markedly different from the former. Kaldor’s views
on modelling growth were in marked contrast to the neoclassical approach as exemplified by
Solow (1956) and Swan (1956). In 1957 Solow had, by using the neoclassical production
function and the marginal productivity conditions, shown that the rate of exogenous technical
progress accounted for about 80 percent of productivity growth of the US during the first half of
the twentieth century. For Kaldor, this exercise made no sense theoretically. “[T]he rate of shift
of the production function due to the changing state of ‘knowledge’ cannot be treated as an
independent function of (chronological) time, but depends upon the rate of accumulation of
capital itself. Since improved knowledge is, largely if not entirely, infused into the economy
through the introduction of new equipment, the rate of shift of the curve will depend on the
speed of movement along the curve, which makes any attempt to isolate the one from the other
the more nonsensical (Kaldor 1961, p. 207, emphasis in the original).1 Thus in many ways,
Kaldor anticipated Arrow’s (1962) learning–by-doing model, induced technical change and
endogenous growth theory. Kaldor (1961, pp. 206-7), for example, discusses “constant or
increasing productivity to capital accumulation”. Consequently, apart from an exogenous
component (determined by the dynamism of the economy), productivity growth increases with
the growth of the capital-labour ratio. However, because new ideas are exploited first and there
are limits to the capacity to absorb these, the increase in induced productivity growth will be at
a diminishing rate.
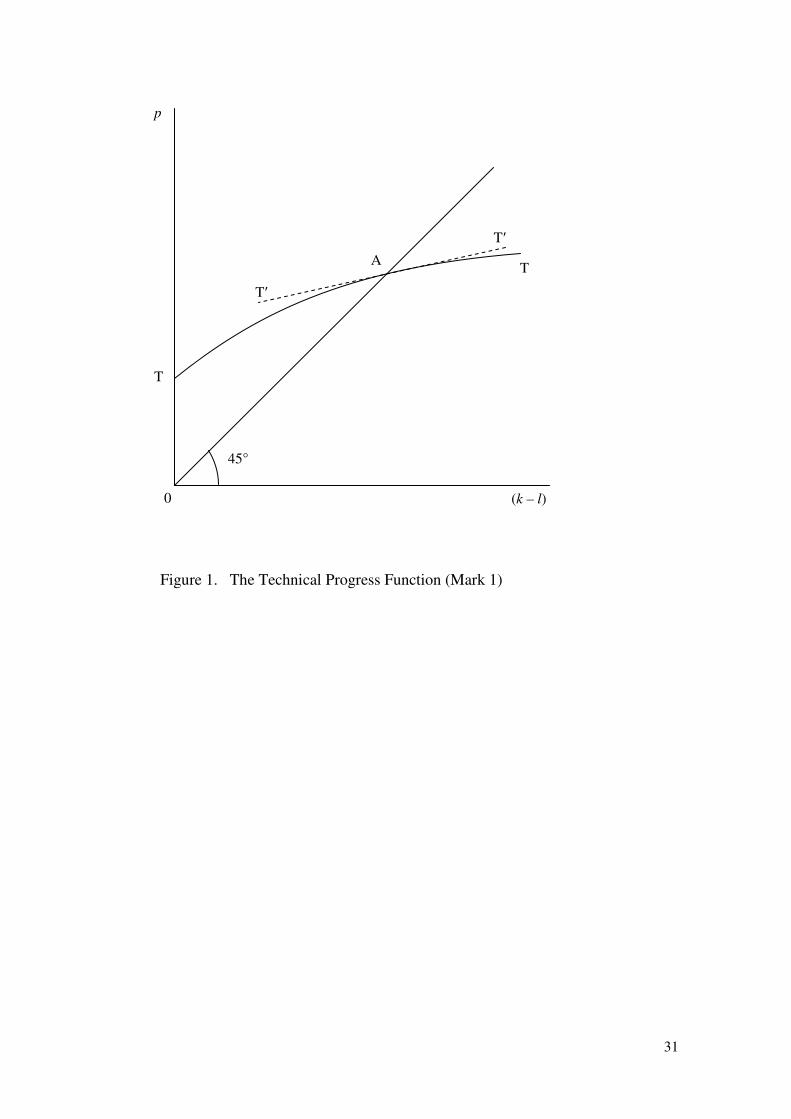
The technical progress function, Mark I, takes the form:
�� = �(�� − ��) �(0) > 0, �� > 0 ��� ��� < 0 (1)

6
where p, k, and l are the rates of growth of productivity, the capital stock and employment. The
relationship is shown in Figure 1, where the technical progress function is given by the curve
TT. Kaldor shows that steady-state growth occurs at the point A, where the growth of
productivity and the capital-labour ratio is equal and there is no growth in the capital-output
ratio.
[Figure 1: The Technical Progress Function (Mark I), about here]
We are concerned only with the technical progress function, rather than Kaldor’s full model,
but he presents a non-neoclassical explanation about how steady-state growth is achieved.
However, as Meade and Hudson pointed out, there were problems with convergence in the 1957
model, although these were solved by respecifying the investment function in Kaldor (1961)
(see Harcourt, 1963, on this or the reprint in Kerr, 1982, p. 72).
However, at point A, the nonlinear technical progress function may be approximated by a
linear function, T'T', namely:
�� = � + �(�� − ��) (2)
where λ is exogenous technical progress, determined by the dynamism of the economy and α
is a constant.
Ironically, the steady-state equilibrium growth conditions turn out to be exactly the same as in
the Solow neoclassical growth model. The growth of output equals the growth of the capital
stock and the growth of productivity is entirely determined by the rate of exogenous technical
progress (pt= λ/(1-α)) and, as in the Solow model, is not a function of the share of investment in
output.
Furthermore, the linear technical progress function, equation (2) may be integrated to give a
conventional Cobb-Douglas production function, i.e.,
�� = �����(�� ��⁄ )� or !� = ����������("#�) (3)
where the upper case notation denotes levels. The parameters α and (1-α) are the output
elasticities of capital and labour.
7
This was pointed out, inter alios, by Green (1960), Black (1962) and Eltis (1971), although
Kaldor (1961, p. 215, fn. 1) was well aware of the problem, having had it pointed out to him by
Hahn and Meade.
However, as Black (1962) has shown, the non-linear version cannot be integrated to give a
conventional aggregate Cobb-Douglas production function. He demonstrates that the non-linear
version of the technical progress function is novel in that it introduces “path dependence”. Let
us take an initial point A on the technical progress function, which shows diminishing returns.
The slope of the technical progress function at this point is given by α(1+ψ) where α is the
slope of the linear approximation at A and ψ is the elasticity of dP/d(K/L) with respect to
changes in k - l. The condition that ψ < 0 shows that the slope diminishes as k - l increases.
This has the result that if we start with any initial point on the technical progress function (say,
at time t = 0) then as K/L increases to a value at t =1, there is a whole set of possibilities for the
value of Q/L, the level of productivity, depending upon the time path of investment over this
period. The greatest possible level of productivity is achieved if the rate of investment over all
time periods is constant. If investment is bunched in a few of the periods, because of the
curvature of the technical progress function, the level of productivity will be less than if the
investment had been evenly spread. In these circumstances, it is not possible to integrate the
technical progress function into a production function.
Probably because of these problems, Kaldor (with Mirrlees) in 1962 proposed a second
version of the technical progress function. This was specified as a vintage growth model,
namely the growth of productivity on newly installed equipment and the rate of growth of gross
investment. In fact, in the steady-state growth rate this becomes identical to the rate of growth of
productivity in the whole economy. The motivation for this change seems to be twofold. First,
the function clearly cannot be integrated into a conventional aggregate production function.
Secondly, it sidesteps the problems of the measurement of capital. “Since, under continuous
technical progress and obsolescence, there is no way of measuring the ‘stock of capital’
(measurement in terms of the historical cost of the surviving capital equipment is

8
irrelevant)...the model avoids the notion of a quantity of capital, and its corollary, the rate of
capital accumulation, as variables of the system; it operates solely with the value of current
gross investment (gross (fixed) capital expenditure per unit of time) and its rate of change in
time” (Kaldor and Mirrlees, 1962, p.174). This has much in common with Salter’s (1960)
vintage approach and also anticipates Foley and Michl’s (1999) formulation of a non-
neoclassical “fossil production function”.
This version of the technical progress function is specified as:
�$� = � %&'() &�⁄'()
* , �(0) > 0, �� > 0 ��� ��� < 0 (4)
where I is the amount of investment per worker and j denotes the latest vintage. The relationship
is the same as in Figure 1, except the growth of investment per worker is now on the horizontal
axis. However, in steady-state growth, the investment-output ratio remains constant, so the
growth of investment equals the growth of output, which in turn equals the growth of the capital
stock, and we are back with the original version of the technical progress function and its
limitations.2
It is difficult not to agree with Scott (1989, p. 111) when he comments that it was
never Kaldor’s intention that his model should turn out to be equivalent to the Cobb-Douglas or
that the rate of productivity growth should be independent of the investment-output ratio.
“Hence the proposed technical progress function cannot be regarded as a satisfactory way of
giving effect to the relationships that Kaldor had in mind”.
3. Verdoorn’s Law, the Technical Progress Function and the Aggregate Production
Function.
According to Verdoorn’s law, a faster growth in output increases productivity growth as a
result of increasing returns, broadly defined to also include induced technical progress. See the
collection of essays in McCombie et al., (2002) for a discussion of many aspects of Verdoorn’s
law.3
While Kaldor did not explicitly relate Verdoorn’s law to his technical progress function, it is
clear that he regarded the former as a production relationship, expressed in growth rates. As

9
Kaldor (1966, emphasis in the original) noted in his inaugural lecture where he first drew
attention to this relationship, “it is a dynamic rather than a static relationship – between the rates
of change of productivity and of output, rather than between the level of productivity and the
scale of output – primarily because technological progress enters into it, and is not just a
reflection of the economies of large-scale production”. He also made reference to Arrow’s
(1962) learning-by-doing model. Dixon and Thirlwall (1975), in their formalisation of Kaldor’s
cumulative causation growth model, do make a direct comparison between the technical
progress function and Verdoorn’s law.
As will be shown, there are many similarities between the (linear) technical progress function
and Verdoorn’s law. Ironically, the law may also be derived for the ith region (or country) from
an aggregate Cobb-Douglas production function (always assuming that it exists) as follow:
!+� = ������+���+�,
(5)
with the same notation as before.
It is assumed that (� + -) = . /� ′ + 01 − � ′23, where γ is a measure of the degree of static
returns to scale. A key assumption of Verdoorn’s law is that the rate of technological progress is
largely endogenously determined by growth of the weighted factor inputs and this relationship
may be expressed as:
�� = �� + 45��+� + -�+�6 (6)
where 4 is the elasticity of induced technical progress with respect to the weighted growth of the
inputs and � and � are again the growth rates of capital and labour, respectively. �� is the rate of
exogenous total factor productivity growth. This “postulates a relationship between the rate of
increase of capital [per worker] and the rate of increase in output [per worker] which embodies
the effect of constantly improving knowledge and know-how, as well as the effect of increasing
capital per man, without any attempt to isolate one from the other” (Kaldor, 1961, pp. 207-8).
Taking logarithms of equation (5), differentiating with respect to time, using equation (6) and
rearranging gives:
7+� = �� + .(1 + 4)5���+� + (1 − ��)�+�6 (7)

10
where .(1 + 4) = 8 is an encompassing measure of the degree of dynamic and static returns to
scale. This is assumed to be constant across regions. Re-arranging equation (7) yields the
dynamic Verdoorn’s law (i.e., the relationship expressed in terms of growth rates):
9��+� = �:; + /1 − "
;3 7+� (8)
where 9�� is the growth of total factor productivity and is defined as:
9��+� = 7+� − 5�′�+� + (1 − �′)�+�6 (9)
For expositional reasons only, let us assume Kaldor’s stylised fact that the growth of capital
equals the growth of output. This gives Verdoorn’s law as:
�+� = �:;("#�:) + / ;#"
;("#�:)3 7+� (10)
A typical value for the Verdoorn coefficient is about 0.5 and this, together with a commonly
found value of 0.75 for (1- α'), implies an encompassing degree of returns to scale (i.e., the
effect of induced technical progress and dynamic and static economies of scale) of 1.6.
There are two important differences between this and Kaldor’s technical progress function.
First, the (linear) technical progress function, if it is derived from a Cobb-Douglas production
function, exhibits constant returns to scale. Verdoorn’s law allows for increasing returns to
scale, as well as induced technical progress. As we have seen, this reflects Kaldor’s shift away
from merely emphasizing the impossibility of dichotomising productivity growth into that due
to the growth of factor inputs and that due to the rate of technical change. It captures his later
emphasis on the importance of economies of scale, broadly defined, and the resulting
cumulative causation nature of growth (Kaldor, 1970, 1972, 1981).
4. Aggregation Problems, the Accounting Identity and the Aggregate Production Function
Does the aggregate production function, including the technical progress function and
Verdoorn’s law, theoretically exist? The answer according to Fisher (1987, 1992, 2005), who
has done more work on the aggregation problem than most, is emphatically ‘no’, not even as an
approximation.
11
Further problems arise from the Cambridge capital theory controversies of the 1960s and
1970s, although the issue was first given prominence by Joan Robinson (1953-54). This showed
clearly how none of the results of the “neoclassical parable” held once one moved out of a one-
commodity world (Cohen and Harcourt, 2003a). The two critiques are related, although Cohen
and Harcourt (2003b, p. 232, emphasis in the original) agree with Fisher (1971) that “the
aggregation debate is a development within neoclassical theory and its applications, whereas
much of the Cambridge, England, critique is from without, regarding the basic neoclassical
intuition, robustness in more general models and appropriate methods”. Nevertheless, both
critiques serve to show just how flimsy are the foundations of the aggregate production
function. While both these criticisms were briefly acknowledged in textbooks and surveys in the
1960s and1970s, any reference to them has now completely disappeared from the current
literature.
Kaldor, of course, was very well aware of the capital theory problems and commented:
In the absence of any reliable measure of the quantity of capital (in a world where
the technical specifications of capital goods is constantly changing, new kinds of
goods constantly appear and others disappear) the very notion of “the amount of
capital” loses precision. The terms “income” or “capital” no longer have any
precise meaning; they are essentially accounting magnitudes, which merely serve
as the basis for calculations in business planning; the assumption that money has
a stable value in terms of some price index enables us to think of “income” and
“capital” as real magnitudes only in a limited, and not precisely definable, sense.
(Kaldor, 1961, p.203, emphasis added.)
But nevertheless these reservations did not prevent him from using a measure of capital as a
homogeneous physical quantity in his theoretical models.
So why is the aggregate production function so widely and uncritically used? The answer
seems to involve a form of Friedman’s (1953) methodological instrumentalism. All theories, so
the argument goes, involve heroic abstraction and unrealistic assumptions, but what matters is
their predictive ability. The aggregate production function passes this test with flying colours, or
so it seems. The problem with this defence is that the estimation of a putative aggregate
production function using constant-price monetary data cannot provide any inferences about the
12
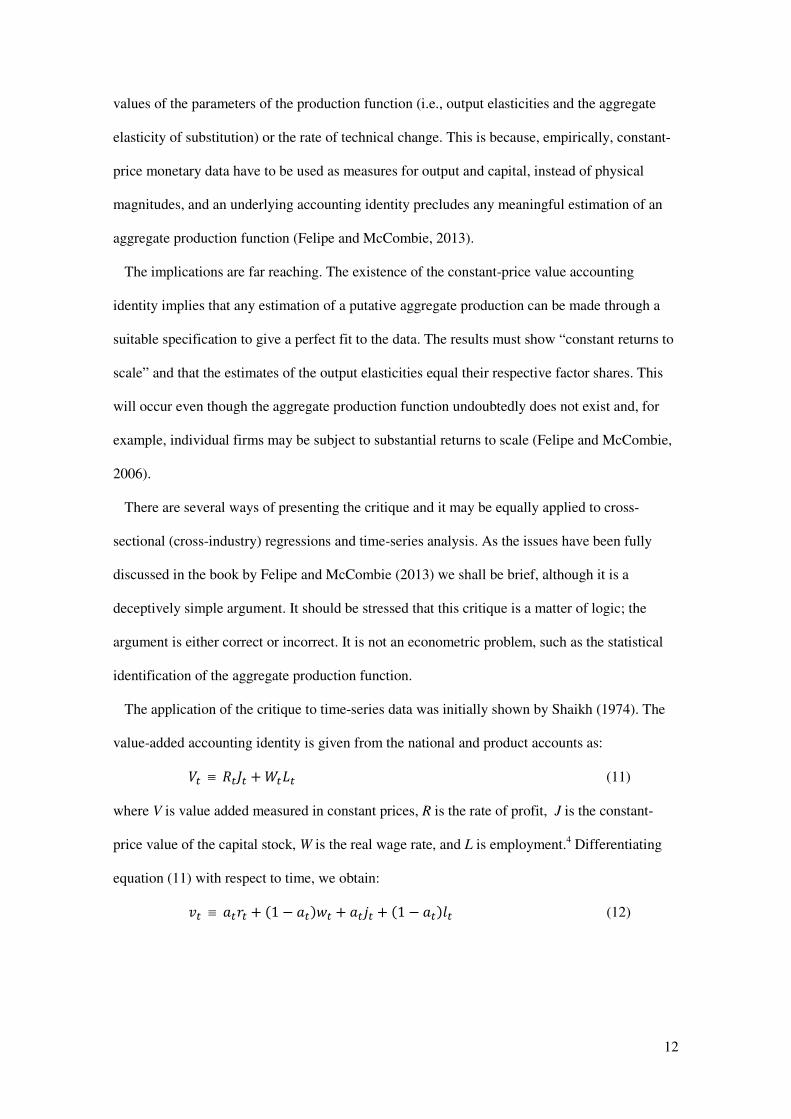
values of the parameters of the production function (i.e., output elasticities and the aggregate
elasticity of substitution) or the rate of technical change. This is because, empirically, constant-
price monetary data have to be used as measures for output and capital, instead of physical
magnitudes, and an underlying accounting identity precludes any meaningful estimation of an
aggregate production function (Felipe and McCombie, 2013).
The implications are far reaching. The existence of the constant-price value accounting
identity implies that any estimation of a putative aggregate production can be made through a
suitable specification to give a perfect fit to the data. The results must show “constant returns to
scale” and that the estimates of the output elasticities equal their respective factor shares. This
will occur even though the aggregate production function undoubtedly does not exist and, for
example, individual firms may be subject to substantial returns to scale (Felipe and McCombie,
2006).
There are several ways of presenting the critique and it may be equally applied to cross-
sectional (cross-industry) regressions and time-series analysis. As the issues have been fully
discussed in the book by Felipe and McCombie (2013) we shall be brief, although it is a
deceptively simple argument. It should be stressed that this critique is a matter of logic; the
argument is either correct or incorrect. It is not an econometric problem, such as the statistical
identification of the aggregate production function.
The application of the critique to time-series data was initially shown by Shaikh (1974). The
value-added accounting identity is given from the national and product accounts as:
=� ≡ >�?� + @��� (11)
where V is value added measured in constant prices, R is the rate of profit, J is the constant-
price value of the capital stock, W is the real wage rate, and L is employment.4 Differentiating
equation (11) with respect to time, we obtain:
A� ≡ ��B� + (1 − ��)C� + ��D� + (1 − ��)�� (12)

13
where v, r, w, j and l denote exponential growth rates of the various variables. The variable
�� ≡ >�?� =�⁄ is capital’s share in output and (1 − ��) ≡ @��� =�⁄ is labour’s share. Assuming
that factor shares are constant and integrating equation (12), we obtain:5
=�≡ F>�G@�("#G)?�G��
("#G) (13)
where the constant of integration is)a1(a
)a1(aB−−− −= . Let us assume that the growth of the
wage rate occurs at a roughly constant rate ( wwt = ) and the rate of profit shows no secular
growth ( 0=r ), both of which may be regarded as stylised facts. Consequently,
�B� + (1 − �)C ≈ (1 − �)�C = �, a constant, and so equation (13) becomes the familiar
Cobb-Douglas with exogenous technical change, namely:
=� = �����?�G��("#G)
(14)
but where the exponents are the factor shares. This is a prediction of the marginal productivity
theory of factor pricing but must occur, even though none of the neoclassical assumptions hold.
The use of time-series data sometimes produces implausible estimates of the parameters of the
supposed aggregate production function, with, for example, the estimate of the ‘output elasticity
of capital’ often taking a negative value. Sylos Labini (1995, Table 1, p.490) provides a useful
summary of a number of time-series studies that give poor statistical results. This may ironically
give the impression that the estimated equation is actually a behavioural relationship. However,
the failure to obtain plausible estimates of the parameters will occur if (i) either the factor shares
are not sufficiently constant or (ii) the approximations ��B� + (1 − ��)C� ≅ � (i.e., a constant)
and ����>� + (1 − ��)��@� ≅ �9 are not sufficiently accurate, or both. It is usually found that
the rate of profit, especially, has a pronounced cyclical component and so proxying the weighted
growth rates of R and W by a constant (or the sum of the weighted logarithms of R and W by a
linear time trend) biases the estimated coefficients of lnL and lnJ (McCombie, 2000-2001;
Felipe and Holz, 2001; and Felipe and McCombie, 2013).6 This requires either a complex non-
linear time trend or the capital stock to be adjusted for changes in “capacity utilization”, which

14
reduces the cyclical fluctuation in r so that a linear time trend gives a good statistical fit to the
accounting identity.
However, it must be emphasized that the critique does not apply to just the Cobb- Douglas
production function, but to any specification of an aggregate production function.
The accounting identity may be expressed as follows:
=� ≡ >�?�+ @��� ⇒ A� ≡ ��B� + (1 − ��)C� + ��D� + (1 − ��)��
⇒ A� ≡ �� + ��D� + -��� ⇒ =� = �(?� , ��, 9) (15)
with the arrows showing the “direction of causation”. This implies that at ≡ tα and (1-at) ≡ βt ≡
(1- tα ). Attempts are made to fit different functional forms to the underlying data generating
equation (15). In other words, the aim is to find a specific functional form for Vt = f(Jt , Lt, t). If
factor shares change, then either the CES or the translog ‘production function’ may give a better
statistical fit to the underlying accounting identity than the Cobb-Douglas. But these cannot be
interpreted as aggregate production functions.
5. Does the Accounting Identity Invalidate Verdoorn’s Law?
Not surprisingly, the accounting identity also poses problems for estimating the technical
progress function empirically. As far as we are aware, there have only been two attempts to test
the function empirically, namely Bairam (1995) and Hansen (1995), and they both use the same
methodology. This is the Box-Cox specification. While Bairam found the best estimate gave a
convex function, Hansen found a better specification was a linear function. The difference
between the two results was due to Bairam proxying the growth of the capital stock by the
initial investment-output ratio, while Hansen used the more appropriate estimates of the growth
of the capital stock, calculated by the perpetual inventory method.
The nonlinear technical progress function with diminishing returns to growth in the capital-
labour ratio may, for example, be expressed as:
�� = ��� + J(�� − ��) + K(�� − ��)L (16)
where ρ > 0 and δ < 0.

15
However, when factor shares are constant, the accounting identity may be expressed as:
��≡ �B� + (1 − �)C� + �(D� − ��) (17)
Consequently, the best statistical fit to the technical progress function will be given by the
linear function, because the underlying identity expressed as equation (17) must always hold, by
definition. Consequently, ρ = a and δ = 0. In the light of this, Hansen’s result is hardly
surprising. The technical progress function could, in turn, be erroneously interpreted as being
derived from the aggregate Cobb-Douglas production function, which, we have shown, does not
exist.
When we consider further the empirical relationship between the technical progress function,
Verdoorn’s law and the accounting identity, a paradox arises. We have seen that the accounting
identity must hold, even though a well-defined aggregate production function does not exist.
Furthermore, the best statistical fit will occur when the estimated parameters, or “output
elasticities”, equal their respective factor shares. If we assume for expositional ease that these
are constant, then estimating the equation
A� = M"B� + MLC� + MND� + MO�� (18)
must give estimates of the coefficients M" and MN that equal labour’s share and those of ML and
MO that equal capital’s share. The sum of the estimates of the coefficients of MN and MO will, by
definition, equal unity. But the results of estimating Verdoorn’s law implicitly suggests that
these will sum to greater than unity, even though value data is used. This is because the
Verdoorn coefficient is often statistically greater than zero. Thus, the estimates of Verdoorn’s
law have generally been interpreted as showing substantial increasing returns to scale.
Consequently, two questions arise. First, why does the estimation of Verdoorn’s law using
value data suggest increasing returns to scale, when the accounting identity suggests the law
should exhibit constant returns to scale? Secondly, given that we are using value data and an
underlying identity, do the statistical results have any economic interpretation?
5.1 A Simulation Experiment

16
In order to answer these two questions, we assume for expositional ease Kaldor’s stylized fact
that the growth of the capital stock equals the growth of output (i.e., the capital-output ratio is
constant). As a consequence of also assuming that shares are constant, this implies that the
growth in the rate of profit is zero. It should be emphasized that nothing hangs on these
assumptions; they just make the exposition easier. We could relax them if necessary without
materially affecting the argument.
It is useful to answer the above two questions using some hypothetical data, as this has the
advantage that we know by construct what are the true underlying relationships. The above
assumptions also have the advantage of simplifying the interpretation of the results.
From the accounting identity given by equation (12) and the two assumptions, or stylized
facts, we can derive the relationship that:
�+� ≡ A+� − �+� ≡ C+� + 0. A+� (19)
where i denotes the region (or country). In other words, the growth of productivity is
definitionally equal to the growth of the real wage, which varies both with time and between
regions. It can be seen that if, using average growth rates over a single period, denoted below by
the subscript t, and cross-regional (or country) data, we were to estimate Verdoorn’s law as:
�+� = Q+ + MRA+� (20)
where the intercept is allowed to vary between the regions, the estimate of the Verdoorn
coefficient (MR) could be not statistically significantly different from zero. (The estimation of
equation (20) could be done either by using regional intercept dummies or by estimating a
fixed-effects model.)
In other words, the conventional interpretation would be that the null hypothesis of increasing
returns to scale should be rejected. As equations (19) and (20) are derived from the identity,
they will always give the best statistical fit. However, it has been shown above that this must
always be the case, irrespective of whether or not the true underlying microeconomic production
relationships (measured in physical units) show increasing returns to scale.

17
But in all studies estimating Verdoorn’s law, a common intercept is specified in the model and
equation (21) below is estimated.
�+� = Q + MRA+� (21)
The intercept is interpreted as the common rate of exogenous productivity growth. As we have
noted above, in most studies using cross-regional or cross-country data, a statistically significant
coefficient of about one-half is found. To illustrate why this occurs, we constructed two
hypothetical data sets for the above variables, namely, p, w, and v to estimate the above
equations. It should, nevertheless, be emphasized that this is merely illustrating the theoretical
argument.
There are 15 hypothetical regions, each region with growth rates calculated over ten periods
giving 150 observations in total. We assumed that the growth rates of each individual region did
not vary greatly over the ten periods. In other words, for region (country) i the growth rate of
output was x per cent per period for each of the ten periods with a small random term added to
prevent perfect multicollinearity. Consequently, there was little difference in the growth of
productivity and output between the different periods for each individual region. This is what is
normally found in much of the regional data: growth rates do not show great differences over
time. However, the data were constructed such that there was a significant difference in the
productivity and output growth rates between the different regions. Some regions grew
persistently faster than others.
The model given by equation (21) was first estimated using intercept dummies in order to
allow the regional intercepts to vary. The regression results are as follows:
pit = c0 + dummies +0.044vit R2 = 0.989
(0.96)
where c0 is the baseline intercept. The regression is controlled for heteroskedasticity. The values
of the regional intercepts range from 0.941 per cent per period (38.42) to 3.481 (11.41). The
figures in parentheses are the t-statistics. The coefficient of the growth of output is not

18
significantly different from zero. (Using the fixed-effects estimator gives an identical estimate
for the Verdoorn coefficient.)
Consequently, and not surprisingly, the results confirm equations (19) and (20), namely,
because of the identity, there is no relationship between productivity and output growth. Hence,
if we were to interpret the equation as a behavioural equation, we would reject the null
hypothesis of increasing returns to scale. But, as we noted above, the traditional specification of
Verdoorn’s law assumes that all regions have the same rate of exogenous productivity growth.
When we impose a common intercept in the regression the following result is obtained:
pi t = 1.128 + 0.445vit R2 = 0.955
(35.15) (39.44)
In other words, a statistically significant Verdoorn coefficient is found with a value of about
one-half, suggesting the existence of substantial increasing returns to scale.
The reason for this may be seen in Figure 2(a) that is a stylized representation of the data. The
relationship given by the accounting identity is shown by the three solid lines, AA, BB, and CC.
Thus, for each of the regions, the Verdoorn coefficient is statistically insignificant and the
within-R2, i.e. the correlation provided by the data within each region, is negligible. The overall
R2
is large because the dummies are again explaining nearly all the variation in pit. However,
when the intercept is held constant, and we consider the cross-section regression results, a faster
growth of output leads to a faster growth of productivity (shown by the dashed line). This may
be regarded as an auxiliary relationship of the identity and is a behavioural relationship. There is
no theoretical reason arising from the identity as to why we should necessarily find this
Verdoorn relationship.
The argument is more general than this because in terms of Figure 2(a) the relationships given
by AA, BB and CC could be comprised of a mixture of different regions, with approximately
the same productivity and output growth rates. The best statistical fit will be given when the
fixed effects capture these groupings by productivity growth and the regression estimates are of

19
the solid lines, as depicted in the figure. For expositional ease, we assumed above that the
observations given by AA etc., were simply for one region each.
[Figure 2 (a) and (b). The Accounting Identity and Verdoorn’s Law, about here]
The fact that there may be no cross-sectional Verdoorn law is confirmed by a second
hypothetical data set. This was constructed similarly to the first data set, with the exception that
for any given productivity growth rates of a particular region, the output growth rates were
random. The results of estimating Verdoorn’s law using regional dummies, not surprisingly,
gave similar results to before.
pit = c0 + dummies - 0.008vit R2 = 0.980
(-0.16)
The Verdoorn coefficient is again not statistically significant, while the estimates of the
regional intercepts (i.e., the regional real wage, or productivity, growth rates) are all highly
significant.
The range of the intercepts are from 2.287 per cent per period (26.27) to 7.742 (84.38), with
the t-statistics again in parentheses. It can be seen that, as we should expect, the regional
dummies are explaining nearly all the variation in the regional productivity growth rates.
It should be emphasized that the difference in the statistical goodness of fit between the two
simulation exercises is simply due to the size of the error term introduced to prevent perfect
multicollinearity and is, to this extent, arbitrary.
However, when, using this data set, we estimate the law with a common intercept, Verdoorn’s
law is now statistically insignificant.
pit = 4.738+ 0.093vit R2 = 0.0008
(30.79) (0.34)
This is shown in Figure 2(b). It can be seen that now the slope of the cross-sectional Verdoorn
law given by the dashed line is not significantly different from zero. Hence, the cross-sectional
20
Verdoorn law (i.e., with a common intercept) is an empirical relationship and is unaffected by
the identity.
There is one further issue with the above regressions. This is that equation (20) suffers from
the problem that p (or w) is itself definitionally related to v. However, this does not invalidate
the argument as from the identity we have �+ ≡ C+ + 0. �+. It follows that:
�+ = Q + MRA+ = S(STUV) Q + UV
(STUV) �+ (22)
Consequently, Verdoorn’s law also implies that a faster growth of employment causes a faster
growth of the real wage or productivity. Thus, it can be seen that Verdoorn’s law with a
common intercept imposed does not suffer from the problem merely reflecting an identity, as w
is not definitionally related to l.
However, as Verdoorn’s law with a common intercept is a behavioural relationship,
econometric issues come into play, such as possible problems of simultaneous equations bias
and the need for spatial econometric estimation methods. The use of the growth of factor inputs
as the regressors assumes a different error structure to the use of output growth, but we shall not
pursue such econometric issues here.
What are the implications of these regression results for the interpretation of Verdoorn’s law?
The first is that the growth of the real wage may be interpreted broadly as the growth of the
efficiency in production of each worker. But Verdoorn’s law relationship does not reflect a
conventional aggregate production function, which in all likelihood does not exist.
Consequently, the intercept cannot, and should not, be interpreted, as the separate contribution
to economic growth of the rate of exogenous technical change.
The Verdoorn coefficient also should not be interpreted as a measure of increasing returns to
scale, per se. Both these interpretations require the existence of an underlying aggregate
production function. All that can be said is that the faster growth of output measured in
constant-price monetary terms, for a variety of unspecified reasons, leads to a faster growth of
the real wage. This could be because of some combination of increasing returns to scale,
induced and exogenous technical change, greater efficiency in the use of resources (such as

21
reduction in x-inefficiency), and the intersectoral reallocation of resources. But it is not possible
even, in principle, to quantify their effects, such as in the neoclassical growth accounting
approach of Denison (1967), which assumes the existence of an aggregate production function.
Thus, growth does occur in a cumulative causation manner. It is ironical that this provides a
justification for Kaldor’s scepticism in undertaking such an exercise of disaggregating the
causes of economic growth in terms of an aggregate production function. Hence, it provides a
rationale for his unsuccessful attempt to remedy this through the concept of the technical
progress function.
6. Fabricant’s Law: A Further Illustration
In this section, we use the detailed real-world, instead of hypothetical, data from Oulton and
O’Mahony (1994) to provide a further illustration of the problem that the identity poses. We
show how the arguments apply equally to Fabricant’s law, which is simply Verdoorn’s law
estimated using cross-industry data, rather than international, or regional, data. The
conventional interpretation of Fabricant’s law is the same as that of Verdoorn’s law.
Oulton and O’Mahony (1994) constructed a database for UK manufacturing industries of the
growth rates of gross output, capital, labour, materials and the growth of the real wage rate, the
rate of profit and the relative price of materials. The data are for individual industries at the 3-
digit Minimum List Heading for five periods from 1954 to 1986, with 1979-82 being somewhat
anomalous due the deep recession during these years. This gives over a thousand observations.
Assuming an aggregate production function and using the growth accounting approach
together with its neoclassical assumptions, Oulton and O’Mahony define the growth of
multifactor productivity, mfp, as:
W��+� = X+� − 0YZ+�D+� + Y[+��+� + Y\+�W+�2 (23)
where ititit l,j,y and itm are the growth rates of gross output, the constant price value of the
capital stock, employment, and materials of the ith industry in period t. θ denotes the factor
share of the relevant variable in gross output. The implicit assumptions underlying this

22
approach, in addition to the existence of an aggregate production function, are the usual
neoclassical ones of the marginal productivity theory of distribution and perfect competition and
uses the theoretical result that the values of the factor shares equal the respective output
elasticities. Consequently, rather than using (labour) productivity growth, they use the growth of
the productivity of capital, labour and materials, each weighted by its factor shares. This is
because they use gross output, rather than value added.
They estimate Fabricant’s law, which as we have noted, is the specification of Verdoorn’s law
but using cross- industry (rather than cross-region or international) data. This is given by:
W��+� = Q + M]X+� (24)
Oulton and O’Mahony estimate the law for the five individual periods and for longer periods
(1954-73 and 1973-86). They introduce a number of industry characteristic variables. Generally
speaking, they find a statistically significantly Fabricant (Verdoorn) coefficient ranging from
0.125 (1954-73) to 0.482 (1973-76) with a t-statistic of 4.83 and 3.80 respectively. (Oulton and
O’Mahony, 1994, Table 7.5, p.169). They discuss the results in terms of the presence of static
and dynamic increasing returns to scale and labour hoarding. The fact that value data are used
presents the same problem as in Verdoorn’s law discussed above.
From the accounting identity, we know that:
W��+� ≡ 0ΘZ+�B+� + Θ[+�C+� + Θ\+��B\+�2
≡ X+� − 0ΘZ+�D+� + Θ[+��+� + Θ\+�W+�2 (25)
where prM is the growth of the price of the material inputs and mfp is definitionally equal to the
weighted growth of factor prices, wgfp, namely,
C_��+� ≡ 0YZ+�B+� + Y[+�C+� + Y\+��B\+�2 (26)
Consequently, it follows that:
W��+�≡C_��+� + 0. X+� (27)
Hence, if we were to estimate equation (27), allowing the intercept to vary using a grouped
dummies estimator, then, all we would be doing is picking up the underlying identity and the
coefficient M] in equation (24) could not be statistically significantly different from zero. This is

23
precisely what happens. The regression results using all periods pooled and intercept dummies
with 1040 observations are:
mfpit = co+ dummies +0.003 ity
R2 =0.985
(1.14)
The individual intercepts range from -12.204 (-13.84) to 11.604 (14.05); t-statistics in
parentheses. (The standard errors are robust, i.e., after heteroskedasticity has been controlled
for.)
The above regression was estimated using 19 bands, or groups, of industries, with each
covering a range of the growth of multifactor productivity of one percentage point. An
exception is the two extreme tails of the distribution of output growth rates, which consist of 4
or 5 observations and were grouped in two separate bands. These bands turn out to be greater
than one percentage point in width. (Time period dummies were also included.) The width of
one percentage point growth rate allows enough variation in the growth of output for the
coefficients to be estimated. One band and one time dummy had to be omitted because of
multicollinearity.
If we impose a common intercept on the regression we obtain the result that:
mfpit = -0.103 + 0.230yit R2 = 0.248
(-1.31) (14.07)
This result is very similar to those of the various different sample sizes and periods that
Oulton and Mahony use, as noted above.
It can be seen that in this case, the explanatory power in terms of the R2 is, not surprisingly,
considerably lower in the estimation of Fabricant’s law than the identity. Nevertheless,
Fabricant’s law, like Verdoorn’s law, is a behavioural relationship and shows that a faster
growth of gross output is associated with a faster growth of the weighted real factor prices.
There are a number of explanations for this. It could be that the fastest growing industries are
the ones where their relative prices are growing the slowest, where output growth is the fastest
and this reflects a demand side phenomenon. Oulton and O’Mahony rule this out after

24
statistically testing the hypothesis. Another explanation is that it does reflect dynamic increasing
returns to scale. A faster growth of output leads to a faster growth of induced multifactor
productivity growth, but like Verdoorn’s law it is not possible even in principle to quantify the
various components of the growth rate.
7. Conclusions
In this paper we have examined the relationship between Kaldor’s technical progress function
and Verdoorn’s law. It was shown that while the non-linear technical progress function cannot
be integrated into a conventional aggregate production function, the linear version can be. The
non-linear version has some interesting theoretical properties such as the path-dependence
nature of a productivity and capital accumulation. However, while the technical progress
function was an attempt by Kaldor to remove the dichotomy between growth due to technical
change and that due to capital accumulation, it never really succeeds. The steady-state growth
was the same as that in Solow’s neoclassical growth model. It was shown how Verdoorn’s law
could be regarded as a specification of the linear technical progress function, but allowing for
the possibility of increasing returns to scale. Both can be derived from an aggregate Cobb-
Douglas production function.
But there is a conundrum in that theoretically the aggregate production function does not exist
and all that estimations of supposed production functions are capturing are an underlying
identity. Yet, estimates of Verdoorn’s law generally find that the coefficient of the growth of
output is positive and statistically significantly different from zero, whereas the underlying
identity implies that it should not be. We provided an explanation of this paradox both
theoretically and illustrated it with hypothetical data.
It was shown that when regional growth rates are used in a pooled regression, and dummy
variables (or a fixed-effects estimator) are used to allow for differences in the intercept, the
Verdoorn coefficient will always take a value that is not significantly different from zero. This
reflects the influence of the accounting identity. However, when a common intercept is

25
imposed, then the Verdoorn coefficient may take the statistically significant value of one half.
However, this is a behavioural result and has nothing to do with the underlying identity, as the
use of a second hypothetical data set confirms. We also used actual data for individual UK
industries and confirmed the first case for Fabricant’s law. Imposing a common intercept does
give a statistically significant coefficient on the growth of (gross) output but the use of industry
dummies ensures that the coefficient is not statistically different from zero.
How are these results to be interpreted? The intercept is the growth of the real wage rate that
reflects broadly the increase in the efficiency of the economy over time. Thus, in the first case a
faster growth of output (measured in value terms) leads to an increase in greater efficiency. But
as the relationship is not an aggregate production function in the neoclassical sense of the term,
it makes no sense to try to determine the contributions of the various factors that determine
growth. Neither does it make any sense to talk about the aggregate elasticity of substitution
between capital and labour, or to test the marginal productivity theory of distribution.
All this is in accord with Kaldor’s vision of the economic system and its growth, although
perhaps viewed from a different perspective.
References
Angeriz, A., McCombie, J. S. L. and Roberts, M. 2008. New estimates of returns to scale and
spatial spillovers for EU regional manufacturing, 1986-2002, International Regional Science
Review, vol. 31, no. 1, 62–87.
Arrow, K. J. 1962. The economic implications of learning by doing, Review of Economic
Studies, vol. 29, no. 3, 155-173.
Bairam, E. I. 1995. Kaldor’s technical pogress function revisied, Applied Economis Letters, vol.
2, no. 9, 302-304.
Black, J. 1962. The technical progress function and the production function, Economica, vol.
29, no. 114, 166-170.

26
Blankenburg, S. and Harcourt, G. C. 2007. The representative firm and increasing returns: then
and now, in Arestis, P., Baddeley, M. C. and McCombie, J. S. L. (eds), Economic Growth:
New Directions in Theory and Policy, Cheltenham UK and Northampton MA, Edward Elgar,
44-64.
Cohen, A. and Harcourt, G. C. 2003a. Retrospectives: Whatever happened to the Cambridge
capital theory controversies?, Journal of Economic Perspectives, vol. 17, no. 1, 199-214.
Cohen, A. and Harcourt, G. C. 2003b. [Cambridge Capital Controversies] Response. Journal of
Economic Perspectives, vol. 17, no. 4, 227-232.
Denison, E. F. 1967. Why Growth Rates Differ: Postwar Experience in Nine Western Countries,
Washington D.C.: The Brookings Institution.
Dixon, R., and Thirlwall, A. P. 1975. A model of regional growth-rate differences on Kaldorian
lines, Oxford Economic Papers, vol. 27, no. 2, pp. 201-214.
Eltis, W. A. 1971. The determination of the rate of technical progress, Economic Journal, vol. 81,
no. 323, 502-524.
Felipe, J. and Holz, C. 2001. Why do aggregate production functions work? Fisher’s simulations,
Shaikh’s identity, and some new results, International Review of Applied Economics, vol. 15,
no. 3, 261-285.
Felipe, J. and McCombie, J. S. L. 2006. The tyranny of the identity. Growth accounting revisited,
International Review of Applied Economics, vol. 20, no. 3, 283-299.
Felipe, J. and McCombie, J. S. L. 2013. The Aggregate Production Function and Technical
Change: “Not Even Wrong”, Cheltenham, Edward Elgar.
Fisher, F. M. 1971. Aggregate production functions and the explanation of wages: a simulation
experiment, Review of Economics and Statistics, vol. 53, no. 4, 305-25.
Fisher, F. M. 1987. Aggregation problem, in Eatwell, J. L., Milgate M. and Newman, P. (eds.),
The New Palgrave. A Dictionary of Economics, Basingstoke: Macmillan.

27
Fisher, F. M. 1992. Aggregation. Aggregate Production Functions and Related Topics. (Monz,
J., eds.) London: Harvester Wheatsheaf.
Fisher, F. M. 2005. Aggregate production functions – A pervasive, but unpersuasive, fairytale,
Eastern Economic Journal, vol. 31, no. 3, 489-491.
Foley, D. K. and Michl, T. R. 1999. Growth and Distribution. Cambridge, Mass.: Harvard
University Press.
Friedman, M. 1953. the methodology of positive economics, in Friedman, M. (ed.), Essays in
Positive Economics, Chicago: Chicago University Press.
Green, H. A. J. 1960. Growth models, capital and stability, Economic Journal, vol. 70, no. 277,
57-73.
Hansen, P. 1995. Kaldor’s technical progress function: a comment, Applied Economics Letters, vol.
3, no. 11, 729-731
Harcourt , G.C. 1963. A critique of Mr. Kaldor’s model of income distribution and economic
Growth, Australian Economic Papers, vol. 2, no.1. 20-36, reprinted in P. Kerr (ed.) 1982. The
Social Science Imperialists. Selected Essays of G.C. Harcourt. London: Routledge and Kegan
Paul.
Kaldor, N. 1957. A model of economic growth, Economic Journal, vol. 67, no. 268, 591-624.
Kaldor, N. 1961. Capital accumulation and economic growth, in Lutz, F. And Hague, D.C.
(eds), The Theory of Capital, London: Macmillan.
Kaldor, N. 1966. The Causes of the Slow Rate of Economic Growth of the United Kingdom. An
Inaugural Lecture, Cambridge: CUP.
Kaldor, N. 1970. The case for regional policies, Scottish Journal of Political Economy, vol. 17,
no. 3, 337-348.
Kaldor, N. 1972. The irrelevance of equilibrium economics, Economic Journal, vol. 82, no.
328, 1237-1255.

28
Kaldor, N. 1981. The role of increasing returns, technical progress and cumulative causation in
the theory of international trade and economic growth, Economie Appliquée, vol. 34, no. 4,
593-617.
Kaldor, N. and Mirrlees, J. A. 1962. A new model of economic growth, Review of Economic
Studies, vol. 29, no. 3, 174-192.
Kennedy, C. 1964. Induced bias in innovation and the theory of distribution, Economic Journal,
vol. 74, no. 295, 541-547.
McCombie, J. S. L. 2000-2001. The Solow residual, technical change and aggregate production
functions, Journal of Post Keynesian Economics, vol. 23, no. 2, 267-297. (Errata, vol. 23, no.
3, 544.)
McCombie, J. S. L., Pugno, M. and Soro, B. (eds). 2002. Productivity Growth and Economic
Performance: Essays on Verdoorn's Law, Basingstoke: Palgrave Macmillan.
Oulton, N. and O’Mahony, M. 1994. Productivity and Growth. A Study of British Industry,
1954-1986, Cambridge: Cambridge University Press.
Robinson, J. V. 1953-54. The production function and the theory of capital, Review of Economic
Studies, vol. 21, no. 55, 81-106.
Salter, W. E. G. 1960. Productivity and Technical Change, Cambridge: Cambridge University
Press, 2nd
edn., 1966.
Scott, M. FG. 1989. A New View of Economic Growth, Oxford: Clarendon Press.
Shaikh, A. 1974. Laws of production and laws of algebra, the Humbug production function,
Review of Economics and Statistics, vol. 56, no. 1, 115-120.
Shaikh, A. 1980. Laws of production and laws of algebra: Humbug II, in E. J. Nell (ed.),
Growth, Profits and Property. Essays in the Revival of Political Economy, 80-95.
Solow, R. M. 1956. A contribution to the theory of economic growth, Quarterly Journal of
Economics, vol. 70, no. 1, 65-94.

29
Solow, R. M. 1957. Technical change and the aggregate production function, Review of
Economics and Statistics, vol. 39, no. 3, 312-320.
Solow, R. M. 1974. Laws of production and laws of algebra: the Humbug production function: a
comment, Review of Economics and Statistics, vol. 56, no. 1, 121.
Swan, T. W. 1956. Economic growth and capital accumulation, Economic Record, vol. 32 no. 2,
334-361.
Sylos Labini, P. 1995. Why the interpretation of the Cobb-Douglas production function must be
radically changed, Structural Change and Economic Dynamics, vol. 6, no. 4, 485-504.
Velupillai, K.V. 2013. ‘Introduction to the special issue. Surrogates, Humbugs and other
aggregate parables. Half-a-century of the ′surrogate production function′. In honour of Anwar
Shaikh’, Global and Local Economic Review, vol. 17, no.1, 5-9.
Young, A. A. 1928. Increasing returns and economic progress, Economic Journal, vol. 38, no.
152, 527-542.
Footnotes
1. Kaldor (1961, p.205, emphasis in the original) correctly anticipated that Solow’s (1957) growth
accounting procedure was a classic case of circular reasoning. “Since the slope of the curve [of the
production function] ... is supposed to determine the share of profits in income, the share of profits is
taken to be an indication of its slope, and the residual is then attributed to the shift of the curve! There
could be no better example of post hoc propter hoc”. In 1974, Solow, in response to a criticism of his
method by Shaikh (1974), eventually admitted that his procedure was a tautology, although this was not
the impression given in the 1974 paper. In that paper, regression analysis was used to estimate various
specifications of the aggregate production function and Solow commented on the very good statistical fits
they all gave. Why was this necessary if they were based on a tautology? See also Shaikh’s (1980)
rejoinder to Solow (1974) and the symposium on Shaikh’s (1974) critique in volume 17, issue 1, of
Global and Local Economic Review (Velupillai, 2013).
30
2. Kennedy ‘s (1964) model of induced bias in innovation and the innovation possibility function will
generate a relationship similar to the technical progress function without any learning involved.
3. The estimation of Verdoorn’s law has become progressively more sophisticated over the years. Angeriz
et al., (2008), for example, estimate the augmented Verdoorn law using spatial econometric methods and
including variables to capture the effect of the diffusion of innovations and the density of production
together with spatial spillover effects.
4. We use V and J for the constant price value measures and reserve the notation Q and K for the physical
quantities.
5. Strictly speaking, we do not need explicitly to make this assumption as if we integrate equation (12) at
any one point in time, as then the factor shares must be constant. Thus, for, say, any one year, equations
(11) and (13) are exactly equivalent. It is only when we use different observations to estimate the Cobb-
Douglas “production function”, using either cross-sectional or time-series data, is it necessary to assume
that the “output elasticities” do not change.
6. As we are dealing with an identity, we treat the regressions using either logarithms of the levels or
exponential growth rates as equivalent.
31
Figure 1. The Technical Progress Function (Mark 1)
(k – l)
45°
T
T′
T′
0
T
A
p

32
C
0 q
p
B
A
C
B
A
⦁ ⦁ ⦁
⦁ ⦁ ⦁
⦁ ⦁ ⦁
⦁ ⦁ ⦁
⦁ ⦁ ⦁
⦁ ⦁ ⦁
(a)
(b)
Figure 2 (a) and (b). Statistical Estimates of the Verdoorn Law
0 q
C
B
A⦁ ⦁
⦁ ⦁ ⦁ ⦁
⦁ ⦁ ⦁
⦁ ⦁ ⦁
⦁ ⦁ ⦁
⦁ ⦁ ⦁
C
p
B
A