kaleida health global heart and vascular institute ... · william mcdevitt kaleida health –...
TRANSCRIPT
Table of Contents
Executive Summary .......................................................................................................4
Acknowledgements ........................................................................................................5
Introduction ....................................................................................................................6
Existing Structural System Overview ............................................................................7
Foundation ...............................................................................................................7 Floor System ............................................................................................................7 Gravity System.........................................................................................................7
Lateral System .........................................................................................................8 Codes and References ....................................................................................................9
Original Design Codes .............................................................................................9 Thesis Design Codes ................................................................................................9
Materials ......................................................................................................................10
Computer Model .......................................................... Error! Bookmark not defined.
Problem Statement .......................................................................................................11
Proposed Solution ........................................................................................................12
Building Loads .............................................................................................................14
Floor Dead Loads ...................................................................................................14
Floor Live Loads ....................................................................................................14
Wind Loads ............................................................................................................15 Seismic Loads ........................................................................................................18 Snow Loads ............................................................................................................19
Load Combinations ................................................................................................19 Gravity System Redesign .............................................................................................21
Flat Slab with Drop Panel Design ..........................................................................21 Column Design ......................................................................................................24
Lateral System Redesign..............................................................................................30
Shear Wall Design .................................................................................................30 Drift Analysis .........................................................................................................32
Overturning and Impact on Foundation .................................................................37 Vibration Analysis .......................................................................................................38
Construction Management Breadth .............................................................................41
Detailed Cost Analysis ...........................................................................................41 Schedule Analysis ..................................................................................................43
Mechanical Breadth .....................................................................................................46
MAE Requirements .....................................................................................................49
Conclusion ...................................................................................................................50
Appendix ......................................................................................................................51
Kaleida Health – Global Heart and Vascular Institute University at Buffalo – CTRC/Incubator
Buffalo, New York
Final Report
William McDevitt Structural Option Dr. Richard Behr
April 7, 2011
William McDevitt Kaleida Health – Global Heart and Vascular Institute
Structural Option University at Buffalo - CTRC/Incubator
Dr. Richard Behr 100 High Street, Buffalo, New York
Final Report
- 2 -
Table of Contents
Executive Summary .....................................................................................................4
Acknowledgements ......................................................................................................5
Introduction ..................................................................................................................6
Existing Structural System Overview ........................................................................7
Foundation ...............................................................................................................7
Floor System ............................................................................................................7
Gravity System.........................................................................................................7
Lateral System .........................................................................................................8
Codes and References ..................................................................................................9
Original Design Codes .............................................................................................9
Thesis Design Codes ................................................................................................9
Materials .....................................................................................................................10
Problem Statement.....................................................................................................11
Proposed Solution ......................................................................................................12
Structural Depth .....................................................................................................12
Breadth Topic 1 – Cost and Schedule Analysis .....................................................13
Breadth Topic 2 – Building Envelope and Façade Study ......................................13
MAE Requirements ...............................................................................................13
Building Loads ...........................................................................................................14
Floor Dead Loads ...................................................................................................14
Floor Live Loads ....................................................................................................14
Wind Loads ............................................................................................................15
Seismic Loads ........................................................................................................18
Snow Loads ............................................................................................................19
Load Combinations ................................................................................................19
Gravity System Redesign ..........................................................................................21
Flat Slab with Drop Panel Design ..........................................................................21
Column Design ......................................................................................................25
Lateral System Redesign ...........................................................................................30
Shear Wall Design .................................................................................................30
Drift Analysis .........................................................................................................33
Relative Stiffness Check ........................................................................................36
Overturning and Impact on Foundation .................................................................37
Vibration Analysis .....................................................................................................38
William McDevitt Kaleida Health – Global Heart and Vascular Institute
Structural Option University at Buffalo - CTRC/Incubator
Dr. Richard Behr 100 High Street, Buffalo, New York
Final Report
- 3 -
Construction Management Breadth .........................................................................41
Detailed Cost Analysis ...........................................................................................41
Schedule Analysis ..................................................................................................43
Mechanical Breadth ...................................................................................................46
Scope ......................................................................................................................46
Procedure ...............................................................................................................47
Results ....................................................................................................................48
MAE Requirements ...................................................................................................49
Conclusion ..................................................................................................................50
Appendix .....................................................................................................................51
Appendix A: Typical Floor Plans and Elevations..................................................52
Appendix B: Wind Analysis ..................................................................................56
Appendix C: Seismic Analysis ..............................................................................64
Appendix D: Snow Loading ..................................................................................67
Appendix E: Gravity System Redesign .................................................................68
Appendix F: Lateral System Redesign ..................................................................77
Appendix G: Vibration Analysis ...........................................................................80
Appendix H: Construction Management Breadth – Steel Takeoff Examples .......81
Appendix I: Construction Management Breadth – Concrete Takeoff Examples ..82
Appendix J: Mechanical Breadth ...........................................................................84
William McDevitt Kaleida Health – Global Heart and Vascular Institute
Structural Option University at Buffalo - CTRC/Incubator
Dr. Richard Behr 100 High Street, Buffalo, New York
Final Report
- 4 -
Executive Summary
The following document is the final report for senior thesis and includes information
regarding the Kaleida Health and University at Buffalo, Global Heart and Vascular
Institute. This project will be referred to throughout this report simply as GHVI. This
report includes information regarding the building‟s existing structural system, a gravity
and lateral system concrete redesign, a vibration analysis, a construction management
breadth, and a mechanical breadth.
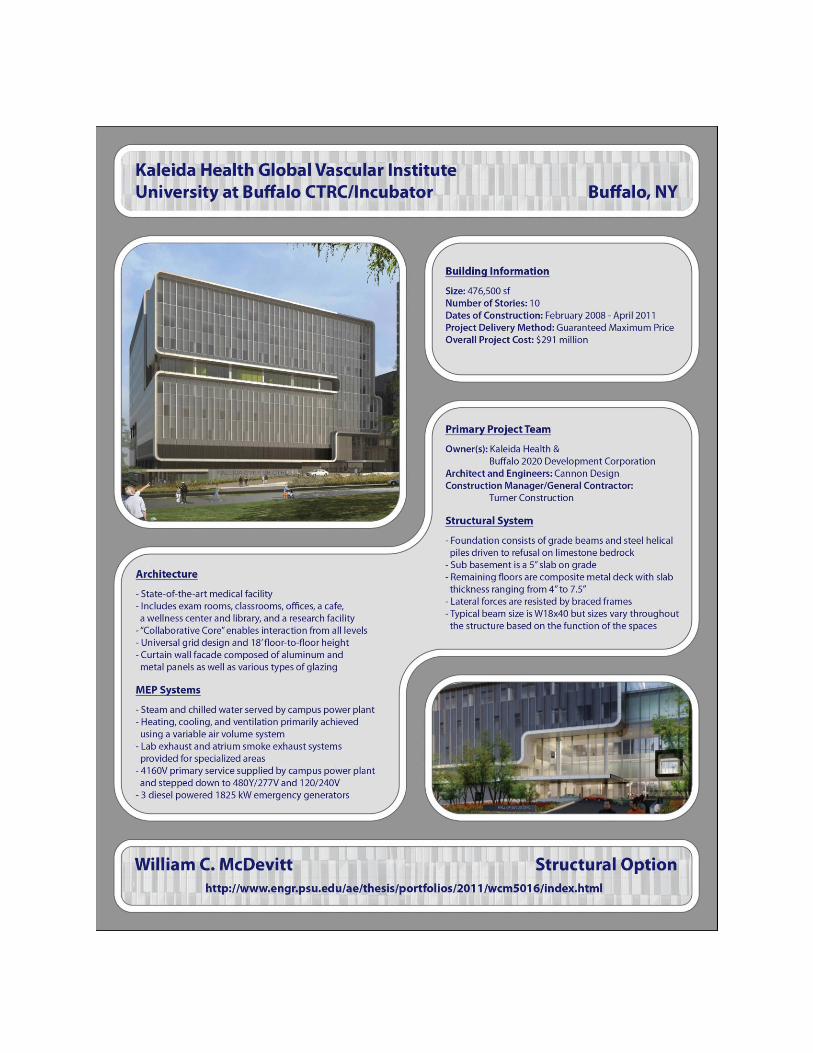
GHVI is a ten story medical facility in the city of Buffalo, NY. The building is square in
shape with a length and width of 221 feet, and a height of 185 feet. The foundation is
made of grade beams and steel helical piles that are driven 82 to 87 feet deep. Floor
construction entails composite metal deck resting on steel superstructure. A standard bay
size of 31‟-6” by 31‟-6” is used throughout the building, utilizing W14 columns of
varying weight to make up the gravity system. The lateral system is comprised of braced
frames which are located near the perimeter of the building.
As part of the gravity system redesign, the three alternative floor systems explored in
Technical Report 2 were reevaluated, and the flat slab system with drop panels was
chosen as the best option. This system was designed to meet ACI minimum thickness
requirements and resist all instances of punching shear. The second part of the gravity
redesign was conducted, using RAM Structural System, spColumn, and hand calculations
to determine column sizes and reinforcing. The lateral system was redesigned using
reinforced concrete shear walls, and drift and relative stiffness checks were performed
with the help of an ETABS model.
Due to the large amount of laboratory and procedural space in the building, GHVI is
currently designed to meet minimum vibrational velocities. As a part of this thesis, the
redesigned concrete floor slab was analyzed using SAP2000 to determine if it did in fact
meet those velocity requirements.
A construction management breadth was undertaken for the purpose of comparing the
existing steel structure with the redesigned concrete structure. A detailed cost estimate
and a schedule analysis were performed for both materials to determine if the concrete
building would in fact be more cost effective than the steel building.
In order to reduce the cooling loads of the building and create a more sustainable facility,
a mechanical breadth study was performed. Various glazing configurations were
investigated and modeled using Trace 700.
William McDevitt Kaleida Health – Global Heart and Vascular Institute
Structural Option University at Buffalo - CTRC/Incubator
Dr. Richard Behr 100 High Street, Buffalo, New York
Final Report
- 5 -
Acknowledgements
Thank you to the following people for their help and support throughout the adventure
of senior thesis:
Thank you to all of the AE Faculty and Staff, who have shared their wisdom and
knowledge with me over these last five years, especially,
Dr. Richard Behr – Thesis Advisor
Dr. Linda Hanagan
Professor Kevin Parfitt
Professor Robert Holland
Thank you to Cannon Design, for all of the help in obtaining a building for thesis and for
answering my countless emails and questions, especially,
Rachel Chicchi
Chip Barry
Thank you to Kaleida Health, for granting me permission to use this building for my
senior thesis, especially,
Mickey Mariacher
And a special thanks to my family and friends. Without your love and support it would
have been impossible to make it through these last five years.
Finally, I dedicate this report to my mother. Among other things, you taught me to never
give up, even when things become difficult. I love you. I miss you.
William McDevitt Kaleida Health – Global Heart and Vascular Institute
Structural Option University at Buffalo - CTRC/Incubator
Dr. Richard Behr 100 High Street, Buffalo, New York
Final Report
- 6 -
Introduction
GHVI is a state-of-the-art medical facility and a fundamental component in a joint
undertaking between Kaleida Health Systems and the University at Buffalo School of
Medicine. The building spans ten levels and includes exam rooms, classrooms, offices, a
café, a wellness center and library, and a research facility. It is intended to bring patients,
surgeons, and researchers together to collaborate in an unprecedented way.
Key themes considered throughout the design were collaboration, flexibility, and
comfort. Kaleida Health Systems sought a structure that would link clinical and research
work and combine all vascular disciplines. A spirit of collaboration was the driving force
behind bringing both Kaleida and the University at Buffalo together in a single structure.
Keeping this in mind, the design team developed the facility with a “collaborative core”
which enables interaction among those working within the facility. This collaborative
learning environment brings together research, ideas, and solutions and results in better
patient care.
A universal grid design increases the flexibility of space and achieves measurable
advantage in initial capital cost, speed to market, operating economy, and future
adaptability. The universal grid is comprised of three 10‟-6” building modules and forms
a 31‟-6” x 31‟-6” structural grid capable of integrating the building‟s diverse functions.
When combined with an 18‟ floor-to-floor height, the flexible grid creates an open plan
capable of adapting to present and future healthcare needs. The building will be able to
incorporate unknown, but rapidly changing technological developments within the
industry, also giving it longevity through its adaptability.
With comfort in mind, a separate “hotel” level was designed on the second floor and
separated from the procedural floors. Functionally, the “hotel” is comprised of private
patient rooms and a small lounge area. Other family lounges are also provided and the
perimeter of the building is shaped to bring in as much natural daylight as possible. The
vision of GHVI is to create an atmosphere that is more than a simple hospital, but instead
a facility for world-class treatment and state-of-the-art technology.
William McDevitt Kaleida Health – Global Heart and Vascular Institute
Structural Option University at Buffalo - CTRC/Incubator
Dr. Richard Behr 100 High Street, Buffalo, New York
Final Report
- 7 -
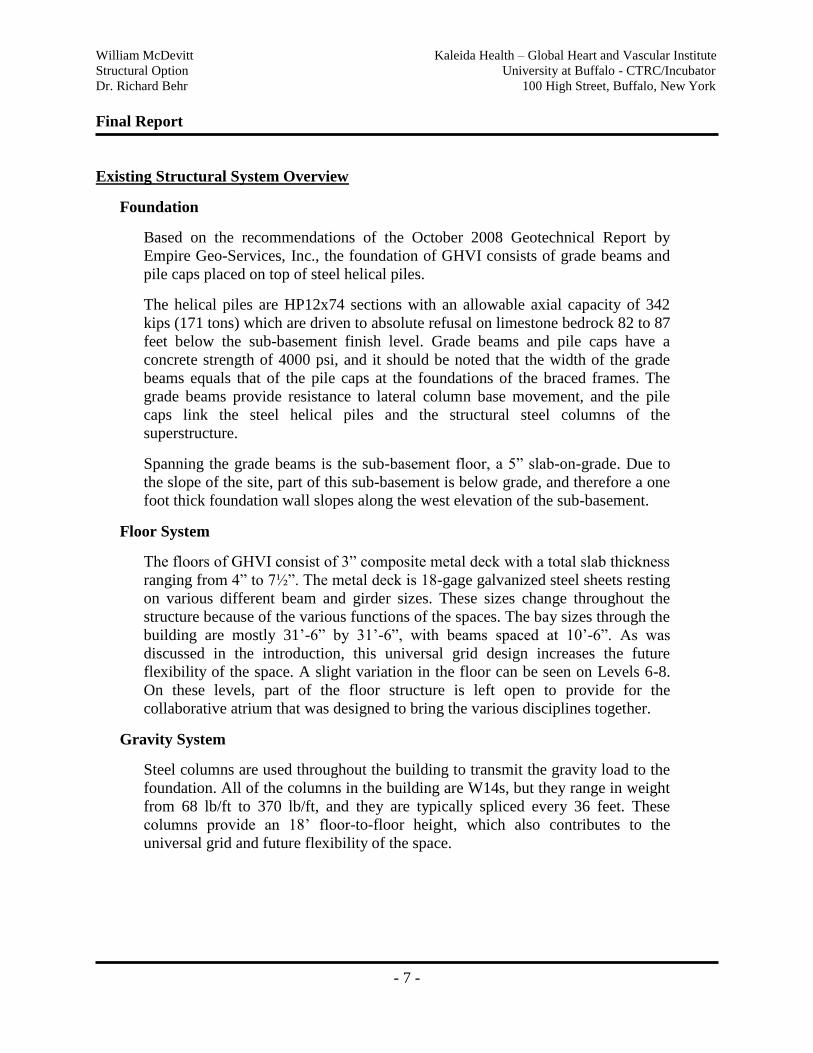
Existing Structural System Overview
Foundation
Based on the recommendations of the October 2008 Geotechnical Report by
Empire Geo-Services, Inc., the foundation of GHVI consists of grade beams and
pile caps placed on top of steel helical piles.
The helical piles are HP12x74 sections with an allowable axial capacity of 342
kips (171 tons) which are driven to absolute refusal on limestone bedrock 82 to 87
feet below the sub-basement finish level. Grade beams and pile caps have a
concrete strength of 4000 psi, and it should be noted that the width of the grade
beams equals that of the pile caps at the foundations of the braced frames. The
grade beams provide resistance to lateral column base movement, and the pile
caps link the steel helical piles and the structural steel columns of the
superstructure.
Spanning the grade beams is the sub-basement floor, a 5” slab-on-grade. Due to
the slope of the site, part of this sub-basement is below grade, and therefore a one
foot thick foundation wall slopes along the west elevation of the sub-basement.
Floor System
The floors of GHVI consist of 3” composite metal deck with a total slab thickness
ranging from 4” to 7½”. The metal deck is 18-gage galvanized steel sheets resting
on various different beam and girder sizes. These sizes change throughout the
structure because of the various functions of the spaces. The bay sizes through the
building are mostly 31‟-6” by 31‟-6”, with beams spaced at 10‟-6”. As was
discussed in the introduction, this universal grid design increases the future
flexibility of the space. A slight variation in the floor can be seen on Levels 6-8.
On these levels, part of the floor structure is left open to provide for the
collaborative atrium that was designed to bring the various disciplines together.
Gravity System
Steel columns are used throughout the building to transmit the gravity load to the
foundation. All of the columns in the building are W14s, but they range in weight
from 68 lb/ft to 370 lb/ft, and they are typically spliced every 36 feet. These
columns provide an 18‟ floor-to-floor height, which also contributes to the
universal grid and future flexibility of the space.
William McDevitt Kaleida Health – Global Heart and Vascular Institute
Structural Option University at Buffalo - CTRC/Incubator
Dr. Richard Behr 100 High Street, Buffalo, New York
Final Report
- 8 -
Lateral System
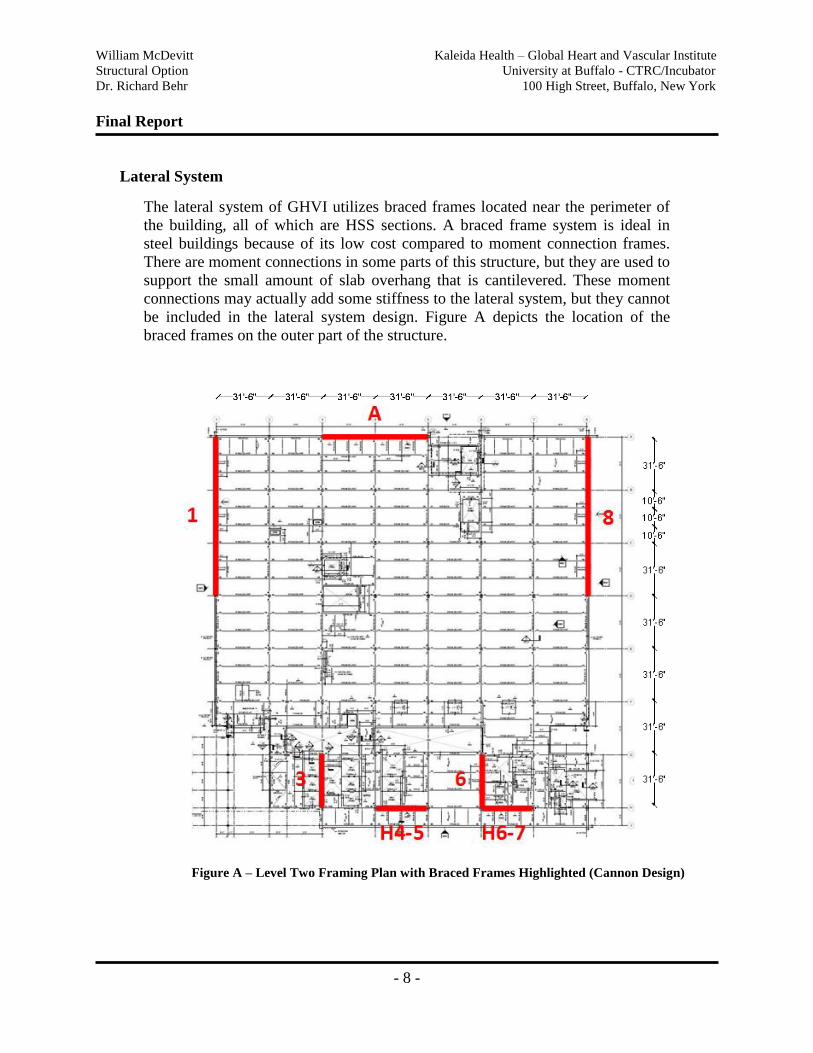
The lateral system of GHVI utilizes braced frames located near the perimeter of
the building, all of which are HSS sections. A braced frame system is ideal in
steel buildings because of its low cost compared to moment connection frames.
There are moment connections in some parts of this structure, but they are used to
support the small amount of slab overhang that is cantilevered. These moment
connections may actually add some stiffness to the lateral system, but they cannot
be included in the lateral system design. Figure A depicts the location of the
braced frames on the outer part of the structure.
Figure A – Level Two Framing Plan with Braced Frames Highlighted (Cannon Design)
William McDevitt Kaleida Health – Global Heart and Vascular Institute
Structural Option University at Buffalo - CTRC/Incubator
Dr. Richard Behr 100 High Street, Buffalo, New York
Final Report
- 9 -
Codes and References
Original Design Codes
Model Building Code:
Building Code of New York State 2007
Design Codes:
"Load and Resistance Factor Design Specification for Structural Steel
Buildings," AISC
"Code of Standard Practice for Steel Buildings and Bridges", AISC
"Manual of Steel Construction - Load and Resistance Factor Design," AISC
ACI 318-05, Building Code Requirements for Structural Concrete
American Society of Civil Engineers, ASCE/SEI 7-02,
Minimum Design Loads for Buildings and Other Structures
Thesis Design Codes
National Model Building Code:
2009 International Building Code
Design Codes:
Steel Construction Manual 13th
edition, AISC
ACI 318-05, Building Code Requirements for Structural Concrete
PCI Design Handbook, 6th
Edition
RSMeans Building Construction Cost Data
American Society of Civil Engineers, ASCE/SEI 7-10,
Minimum Design Loads for Buildings and Other Structures
AISC/CISC, Design Guide 11, Floor Vibrations due to Human Activity
References:
Vibration Design of Concrete Floors for Serviceability, ADAPT,
Bijan O Aalami, 2008
Reinforced Concrete: Mechanics and Design, Macgregor, 2009
Deflection Criteria:
Allowable Building Drift (Wind) = H/400
Allowable Story Drift (Seismic) = 0.010hsx
William McDevitt Kaleida Health – Global Heart and Vascular Institute
Structural Option University at Buffalo - CTRC/Incubator
Dr. Richard Behr 100 High Street, Buffalo, New York
Final Report
- 10 -
Materials
Original Design
Structural Steel: Type Standard Grade
Wide Flange Shapes, WT's ASTM A-992
Channels & Angles ASTM A-36
Pipe ASTM A-53 Grade B
Hollow Structural Sections (Rectangular & Round) ASTM A-500 Grade B
Base Plates ASTM A-572 Grade 42
All Other Steel Members ASTM A-36
Concrete:
Type f'c (psi) Unit Weight (pcf)
Pile Caps 4000 150
Grade Beams 4000 150
All Other Concrete 4000 150
Slabs-On-Grade 3000 150
Foundation Walls 4000 150
Reinforcing:
Type Standard Grade
Typical Bars ASTM A-615 60
Welded Bars ASTM A-706 60
Welded Wire Fabric ASTM A-185
Steel Fibers ASTM A-820 Type 1
Bars Noted To Be Field Bent ASTM A-615 40
Connectors:
Type Standard
High Strength Bolts, Nuts, & Washers ASTM A-325 or A-490 (min. 3/4 Diameter)
Anchor Rods ASTM F1554
Welding Electrode E70XX
Steel Deck Welding Electrode E60XX min.
Redesign
Concrete:
Type f'c (psi) Unit Weight (pcf)
Columns 6000 150
Slabs 6000 150
Drop Panels 6000 150
Reinforcing:
Type Standard Grade
Typical Bars ASTM A-615 60
William McDevitt Kaleida Health – Global Heart and Vascular Institute
Structural Option University at Buffalo - CTRC/Incubator
Dr. Richard Behr 100 High Street, Buffalo, New York
Final Report
- 11 -
Problem Statement
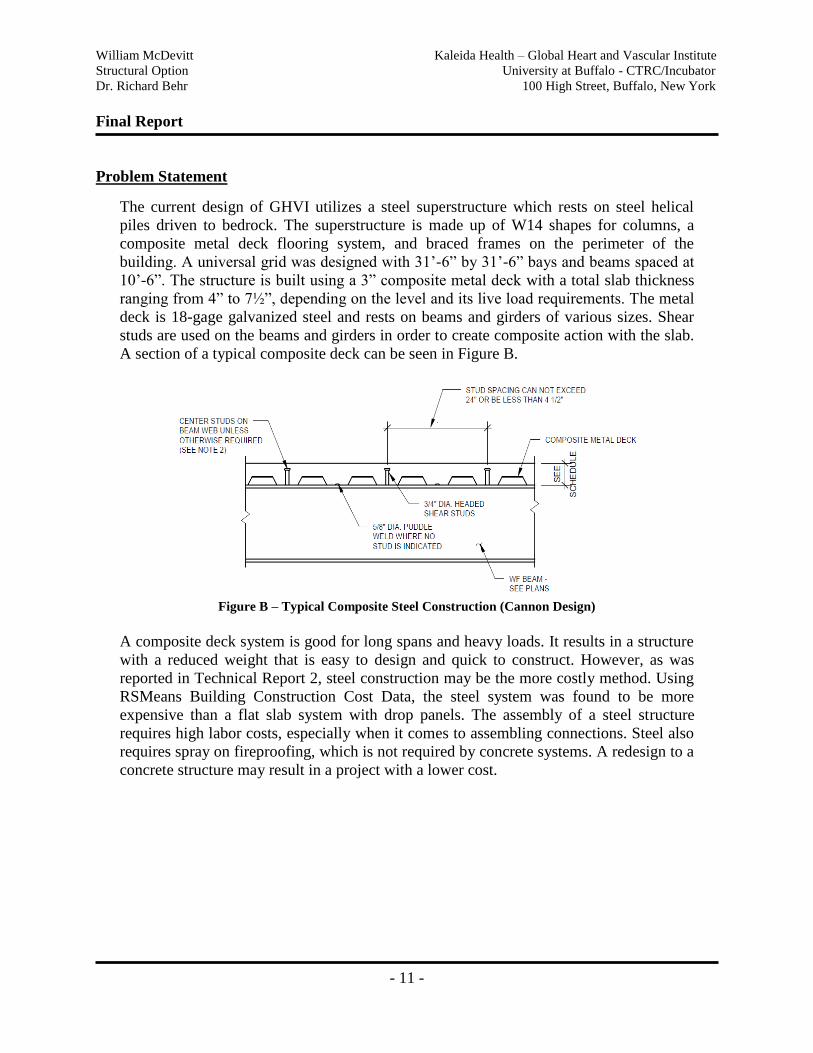
The current design of GHVI utilizes a steel superstructure which rests on steel helical
piles driven to bedrock. The superstructure is made up of W14 shapes for columns, a
composite metal deck flooring system, and braced frames on the perimeter of the
building. A universal grid was designed with 31‟-6” by 31‟-6” bays and beams spaced at
10‟-6”. The structure is built using a 3” composite metal deck with a total slab thickness
ranging from 4” to 7½”, depending on the level and its live load requirements. The metal
deck is 18-gage galvanized steel and rests on beams and girders of various sizes. Shear
studs are used on the beams and girders in order to create composite action with the slab.
A section of a typical composite deck can be seen in Figure B.
Figure B – Typical Composite Steel Construction (Cannon Design)
A composite deck system is good for long spans and heavy loads. It results in a structure
with a reduced weight that is easy to design and quick to construct. However, as was
reported in Technical Report 2, steel construction may be the more costly method. Using
RSMeans Building Construction Cost Data, the steel system was found to be more
expensive than a flat slab system with drop panels. The assembly of a steel structure
requires high labor costs, especially when it comes to assembling connections. Steel also
requires spray on fireproofing, which is not required by concrete systems. A redesign to a
concrete structure may result in a project with a lower cost.
William McDevitt Kaleida Health – Global Heart and Vascular Institute
Structural Option University at Buffalo - CTRC/Incubator
Dr. Richard Behr 100 High Street, Buffalo, New York
Final Report
- 12 -
Proposed Solution
Structural Depth
In an attempt to reduce the current cost of GHVI, the building will be redesigned
using one of the three reinforced concrete systems explored in Technical Report
2. In that report, it was concluded that a flat slab system with drop panels was
most likely the most efficient and cost effective option to replace the current
system. This design would require a slab thickness of 11” to meet ACI 9.5.3.2,
and would employ 3½” drop panels to resist the large live loads of GHVI. A flat
slab system would not result in a change to the current bay size, and would allow
for a relatively flat ceiling.
The second alternative system is a one-way pan joist and beam system. This will
be considered because it is normally adequate for long spans and heavy live loads.
A 4½” slab will be used to meet a two hour fire rating. A 72” pan joist module
will be implemented, consisting of 66” pans and 6” ribs as prescribed by ACI
requirements. The ribs will be 16” deep, making the total structure thickness
20½”. Although this system can carry heavy live loads, it would require an
adjustment to the current bay size and column grid, and would entail the use of
complex formwork.
The final system to be considered is a pre-cast hollow core plank design. Because
the pre-cast planks come in 4‟ sections, the standard bay size of the building
would be altered from 31‟-6” by 31‟-6” to 32‟ by 32‟. This change is minimal,
would be easy to implement, and would have a lower cost than ordering specially
designed pre-cast planks. Using the PCI Design Handbook, it was found that 4‟-
0” by 10” planks with 2” of topping would be sufficient. It may also be necessary
to design this system using post-tensioned strands.
After these systems are compared and the best is chosen, it will be necessary to
redesign the columns and the lateral force system. First, the column grid layout
will be revised if necessary, and then columns throughout the structure will be
redesigned. It must also be investigated whether or not the inherent moment
connections of the reinforced concrete structures will be enough to resist the
lateral load. If this is not true, shear walls will need to be placed throughout the
structure. This must be carefully planned so as to not disrupt the flow of the
current structure. A vibration study will be conducted to assure that the new
design meets the standards of the current building.
William McDevitt Kaleida Health – Global Heart and Vascular Institute
Structural Option University at Buffalo - CTRC/Incubator
Dr. Richard Behr 100 High Street, Buffalo, New York
Final Report
- 13 -
Breadth Topic 1 – Cost and Schedule Analysis
An in-depth cost and schedule analysis will be conducted on the redesigned
reinforced concrete system. The first step in this analysis will be to determine the
cost of the current steel structure using RSMeans Building Construction Cost
Data, and to find or develop a schedule for the current construction process. The
purpose of developing both of these items will be to create a baseline for
equivalent comparison after the concrete design is completed. As soon as the
concrete structure has been completed, a detailed cost breakdown and schedule
will be developed. This breakdown will then be compared to the original cost and
schedule information to determine if the proposed structural redesign is in fact
more efficient.
Breadth Topic 2 – Building Envelope and Façade Study
A mechanical breadth into the building envelope and façade will also be
performed as a part of this thesis. The current curtain wall designs will be
obtained from Cannon Design, and research will be conducted to determine a
more efficient type of glazing, with the intent of creating a more sustainable
facility. Thermal calculations will be performed for a room on each of the four
façades, and the effects on the lighting of the building will also be considered.
MAE Requirements
MAE Requirements for this thesis will be met using methods from both AE 597A,
Computer Modeling of Building Structures, and AE 542, Building Enclosure
Science and Design. By building a detailed computer model in ETABS, material
taught in AE 597A will be applied to this thesis. The building envelope and
façade breadth will also implement material that is covered in AE 542, including
glass type and thickness, as well as thermal, lighting, and acoustic considerations.
Finally, the vibration research and analysis will constitute a MAE level of work.
William McDevitt Kaleida Health – Global Heart and Vascular Institute
Structural Option University at Buffalo - CTRC/Incubator
Dr. Richard Behr 100 High Street, Buffalo, New York
Final Report
- 14 -
Building Loads
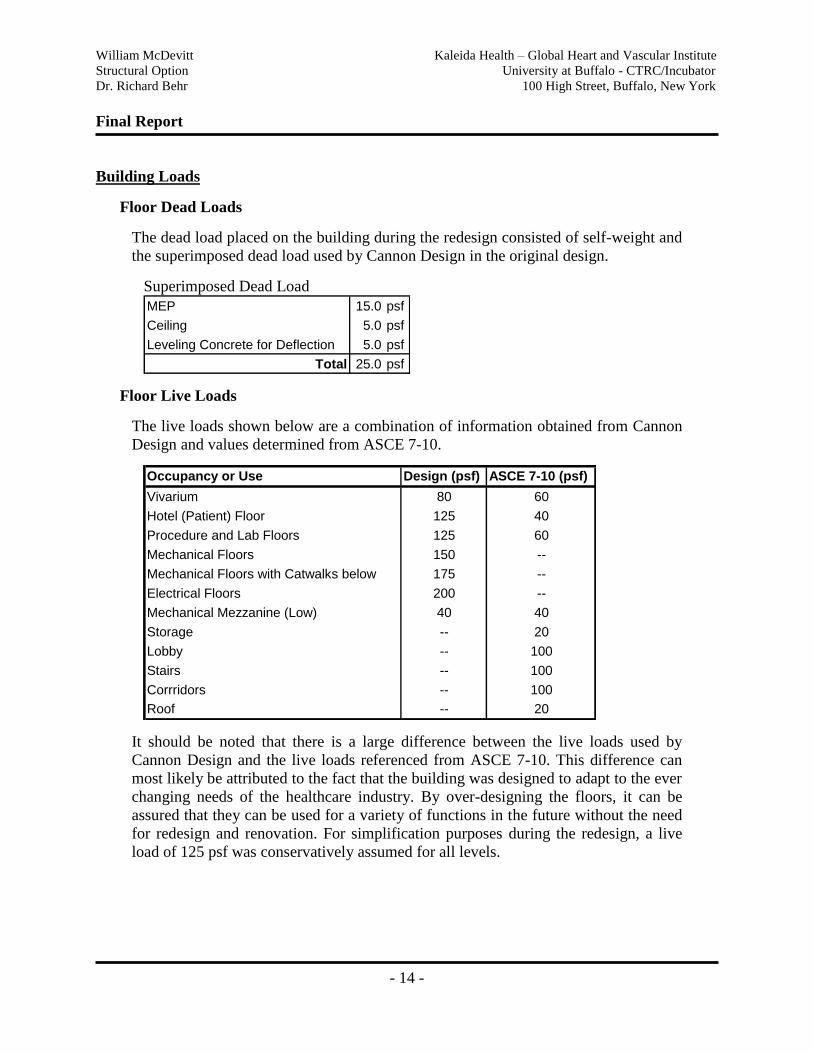
Floor Dead Loads
The dead load placed on the building during the redesign consisted of self-weight and
the superimposed dead load used by Cannon Design in the original design.
Superimposed Dead Load
MEP 15.0 psf
Ceiling 5.0 psf
Leveling Concrete for Deflection 5.0 psf
Total 25.0 psf
Floor Live Loads
The live loads shown below are a combination of information obtained from Cannon
Design and values determined from ASCE 7-10.
Occupancy or Use Design (psf) ASCE 7-10 (psf)
Vivarium 80 60
Hotel (Patient) Floor 125 40
Procedure and Lab Floors 125 60
Mechanical Floors 150 --
Mechanical Floors with Catwalks below 175 --
Electrical Floors 200 --
Mechanical Mezzanine (Low) 40 40
Storage -- 20
Lobby -- 100
Stairs -- 100
Corrridors -- 100
Roof -- 20
It should be noted that there is a large difference between the live loads used by
Cannon Design and the live loads referenced from ASCE 7-10. This difference can
most likely be attributed to the fact that the building was designed to adapt to the ever
changing needs of the healthcare industry. By over-designing the floors, it can be
assured that they can be used for a variety of functions in the future without the need
for redesign and renovation. For simplification purposes during the redesign, a live
load of 125 psf was conservatively assumed for all levels.
William McDevitt Kaleida Health – Global Heart and Vascular Institute
Structural Option University at Buffalo - CTRC/Incubator
Dr. Richard Behr 100 High Street, Buffalo, New York
Final Report
- 15 -
Wind Loads
The wind loads for GHVI were analyzed using Chapters 26 and 27 of ASCE 7-10.
Wind loads for the Main Wind-Force Resisting System were determined using the
directional procedure for buildings of all heights. Based on an occupancy category
of IV, a basic wind speed of 120 mph was used to find the windward and leeward
pressures. By code, flexible buildings can be affected by wind gusts and have the
potential for resonance response. Because this building is considered flexible, a
gust-effect factor also had to be determined. Detailed calculations including the
initial parameters, an effective length check, gust-effect factor calculations, and
wind pressure coefficients can be found in Appendix B.
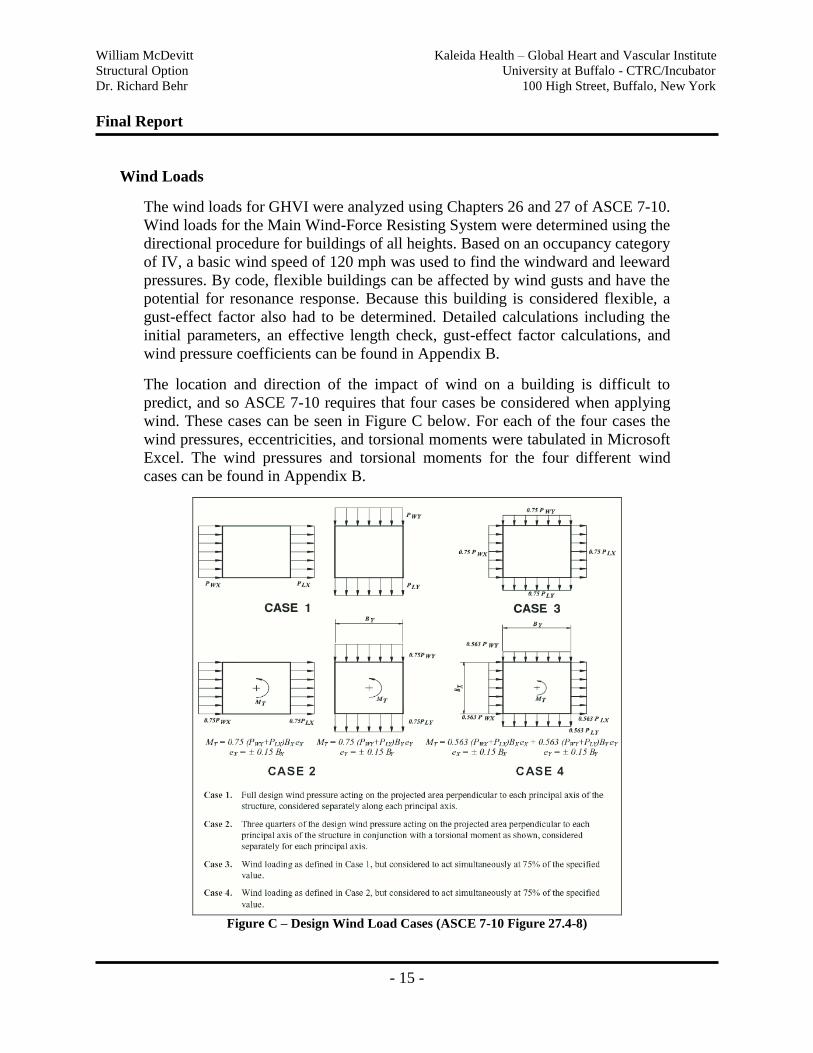
The location and direction of the impact of wind on a building is difficult to
predict, and so ASCE 7-10 requires that four cases be considered when applying
wind. These cases can be seen in Figure C below. For each of the four cases the
wind pressures, eccentricities, and torsional moments were tabulated in Microsoft
Excel. The wind pressures and torsional moments for the four different wind
cases can be found in Appendix B.
Figure C – Design Wind Load Cases (ASCE 7-10 Figure 27.4-8)
William McDevitt Kaleida Health – Global Heart and Vascular Institute
Structural Option University at Buffalo - CTRC/Incubator
Dr. Richard Behr 100 High Street, Buffalo, New York
Final Report
- 16 -
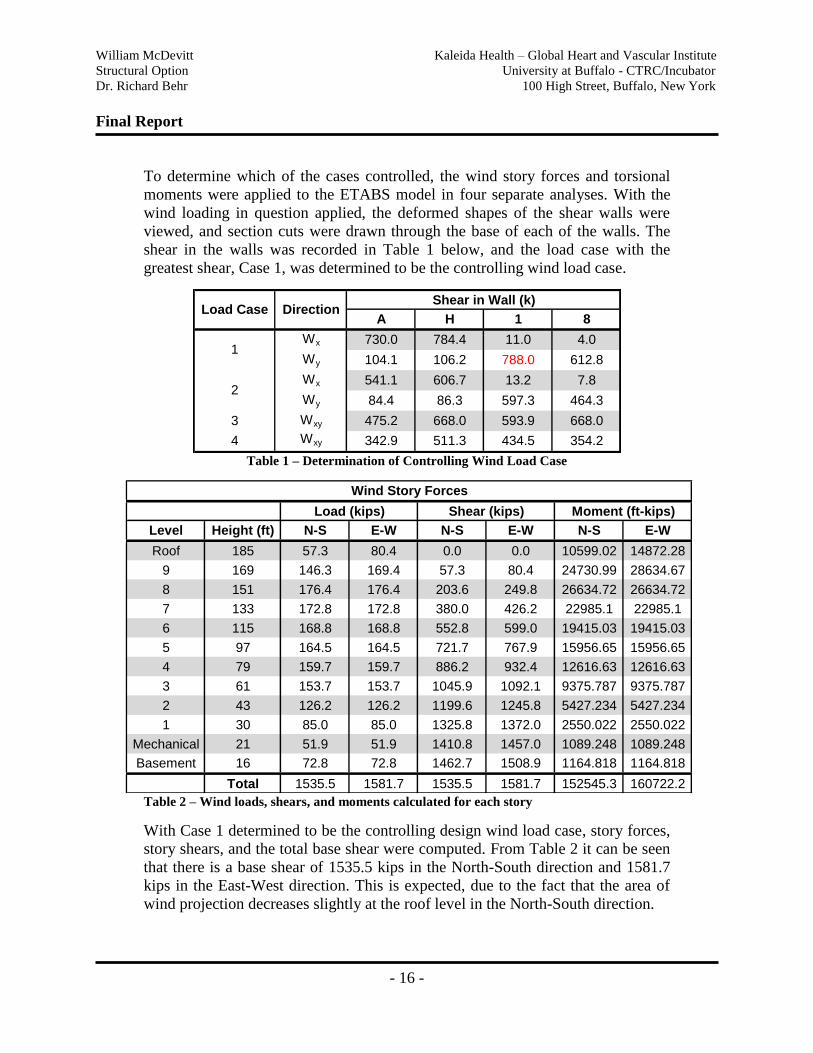
To determine which of the cases controlled, the wind story forces and torsional
moments were applied to the ETABS model in four separate analyses. With the
wind loading in question applied, the deformed shapes of the shear walls were
viewed, and section cuts were drawn through the base of each of the walls. The
shear in the walls was recorded in Table 1 below, and the load case with the
greatest shear, Case 1, was determined to be the controlling wind load case.
A H 1 8
Wx 730.0 784.4 11.0 4.0
Wy 104.1 106.2 788.0 612.8
Wx 541.1 606.7 13.2 7.8
Wy 84.4 86.3 597.3 464.3
3 Wxy 475.2 668.0 593.9 668.0
4 Wxy 342.9 511.3 434.5 354.2
Shear in Wall (k)
1
2
Load Case Direction
Table 1 – Determination of Controlling Wind Load Case
Level Height (ft) N-S E-W N-S E-W N-S E-W
Roof 185 57.3 80.4 0.0 0.0 10599.02 14872.28
9 169 146.3 169.4 57.3 80.4 24730.99 28634.67
8 151 176.4 176.4 203.6 249.8 26634.72 26634.72
7 133 172.8 172.8 380.0 426.2 22985.1 22985.1
6 115 168.8 168.8 552.8 599.0 19415.03 19415.03
5 97 164.5 164.5 721.7 767.9 15956.65 15956.65
4 79 159.7 159.7 886.2 932.4 12616.63 12616.63
3 61 153.7 153.7 1045.9 1092.1 9375.787 9375.787
2 43 126.2 126.2 1199.6 1245.8 5427.234 5427.234
1 30 85.0 85.0 1325.8 1372.0 2550.022 2550.022
Mechanical 21 51.9 51.9 1410.8 1457.0 1089.248 1089.248
Basement 16 72.8 72.8 1462.7 1508.9 1164.818 1164.818
Total 1535.5 1581.7 1535.5 1581.7 152545.3 160722.2
Load (kips) Shear (kips) Moment (ft-kips)
Wind Story Forces
Table 2 – Wind loads, shears, and moments calculated for each story
With Case 1 determined to be the controlling design wind load case, story forces,
story shears, and the total base shear were computed. From Table 2 it can be seen
that there is a base shear of 1535.5 kips in the North-South direction and 1581.7
kips in the East-West direction. This is expected, due to the fact that the area of
wind projection decreases slightly at the roof level in the North-South direction.
William McDevitt Kaleida Health – Global Heart and Vascular Institute
Structural Option University at Buffalo - CTRC/Incubator
Dr. Richard Behr 100 High Street, Buffalo, New York
Final Report
- 17 -
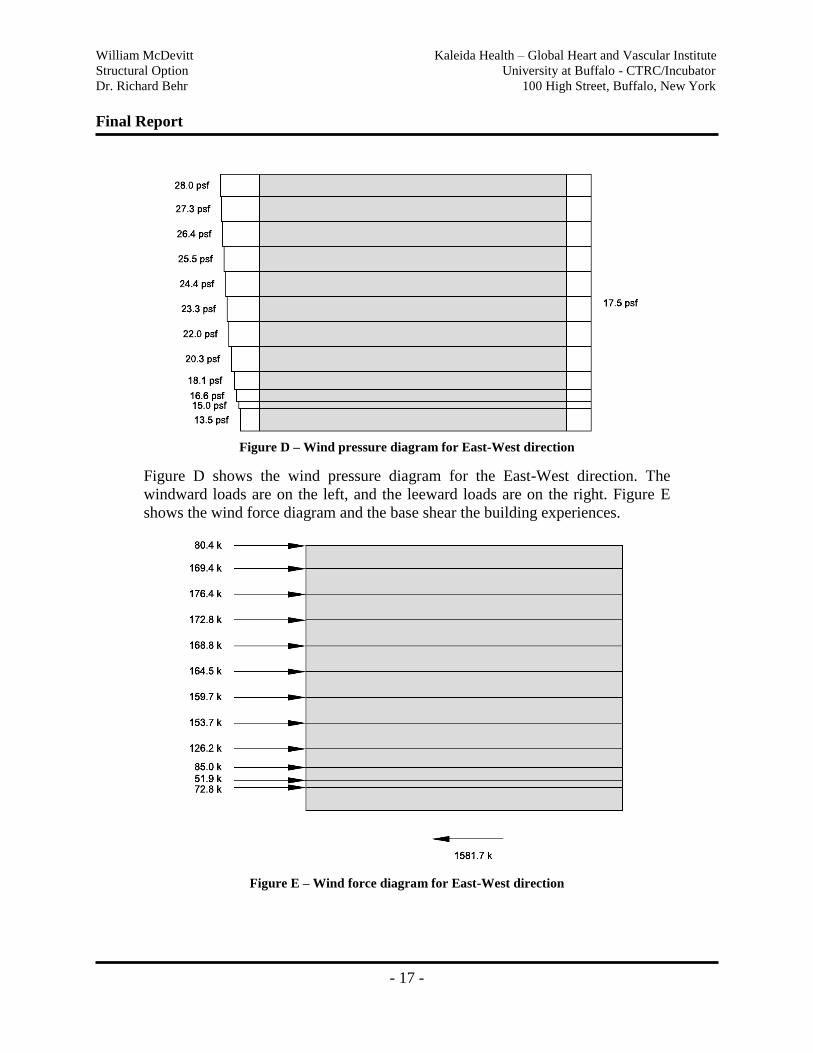
Figure D – Wind pressure diagram for East-West direction
Figure D shows the wind pressure diagram for the East-West direction. The
windward loads are on the left, and the leeward loads are on the right. Figure E
shows the wind force diagram and the base shear the building experiences.
Figure E – Wind force diagram for East-West direction
William McDevitt Kaleida Health – Global Heart and Vascular Institute
Structural Option University at Buffalo - CTRC/Incubator
Dr. Richard Behr 100 High Street, Buffalo, New York
Final Report
- 18 -
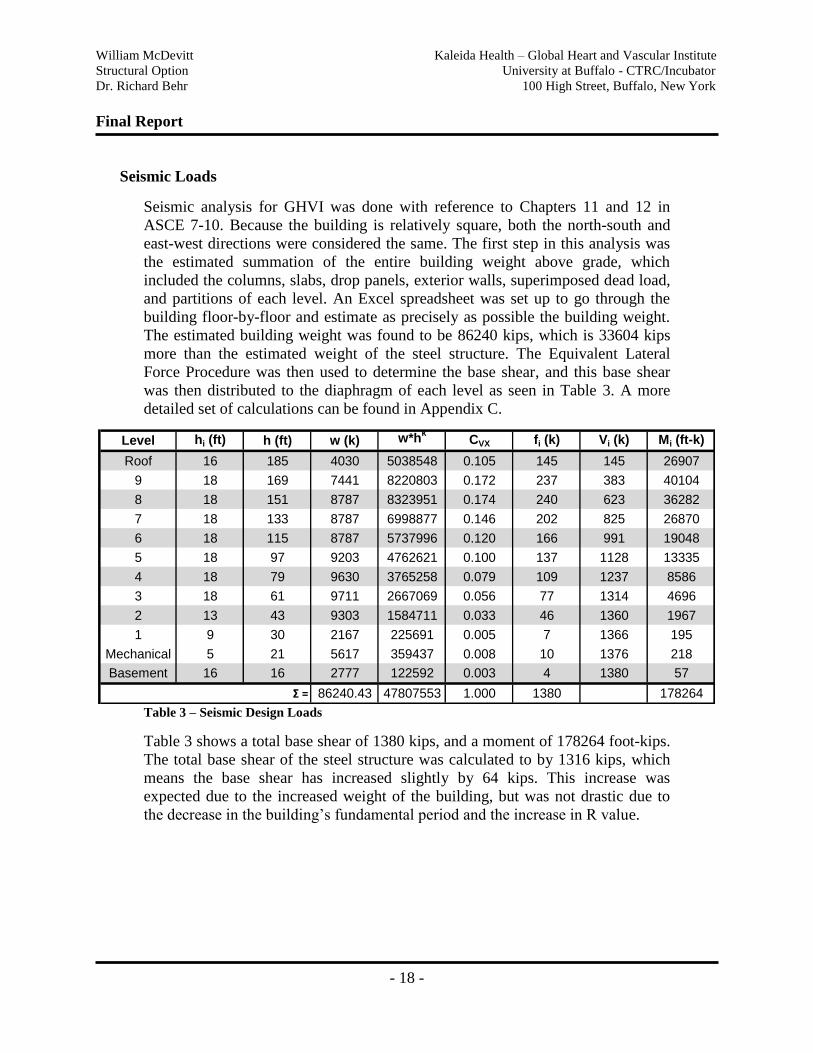
Seismic Loads
Seismic analysis for GHVI was done with reference to Chapters 11 and 12 in
ASCE 7-10. Because the building is relatively square, both the north-south and
east-west directions were considered the same. The first step in this analysis was
the estimated summation of the entire building weight above grade, which
included the columns, slabs, drop panels, exterior walls, superimposed dead load,
and partitions of each level. An Excel spreadsheet was set up to go through the
building floor-by-floor and estimate as precisely as possible the building weight.
The estimated building weight was found to be 86240 kips, which is 33604 kips
more than the estimated weight of the steel structure. The Equivalent Lateral
Force Procedure was then used to determine the base shear, and this base shear
was then distributed to the diaphragm of each level as seen in Table 3. A more
detailed set of calculations can be found in Appendix C.
Level hi (ft) h (ft) w (k) w*hk
CVX fi (k) Vi (k) Mi (ft-k)
Roof 16 185 4030 5038548 0.105 145 145 26907
9 18 169 7441 8220803 0.172 237 383 40104
8 18 151 8787 8323951 0.174 240 623 36282
7 18 133 8787 6998877 0.146 202 825 26870
6 18 115 8787 5737996 0.120 166 991 19048
5 18 97 9203 4762621 0.100 137 1128 13335
4 18 79 9630 3765258 0.079 109 1237 8586
3 18 61 9711 2667069 0.056 77 1314 4696
2 13 43 9303 1584711 0.033 46 1360 1967
1 9 30 2167 225691 0.005 7 1366 195
Mechanical 5 21 5617 359437 0.008 10 1376 218
Basement 16 16 2777 122592 0.003 4 1380 57
Σ = 86240.43 47807553 1.000 1380 178264 Table 3 – Seismic Design Loads
Table 3 shows a total base shear of 1380 kips, and a moment of 178264 foot-kips.
The total base shear of the steel structure was calculated to by 1316 kips, which
means the base shear has increased slightly by 64 kips. This increase was
expected due to the increased weight of the building, but was not drastic due to
the decrease in the building‟s fundamental period and the increase in R value.
William McDevitt Kaleida Health – Global Heart and Vascular Institute
Structural Option University at Buffalo - CTRC/Incubator
Dr. Richard Behr 100 High Street, Buffalo, New York
Final Report
- 19 -
Snow Loads
Snow loading for GHVI was calculated based on Chapter 7 in ASCE 7-10. A
ground snow load of 50 psf was determined from a site-specific case study
provided by Cannon Design. The exposure factor, thermal factor, and importance
factor were then obtained from the code and used to calculate the flat roof snow
load of 42 psf, which matched the value obtained by the design engineers.
Because part of the roof is lower than the rest of the building, drift calculations
were performed to find the maximum snow loading in these areas. The detailed
calculations for snow loading can be found in Appendix D.
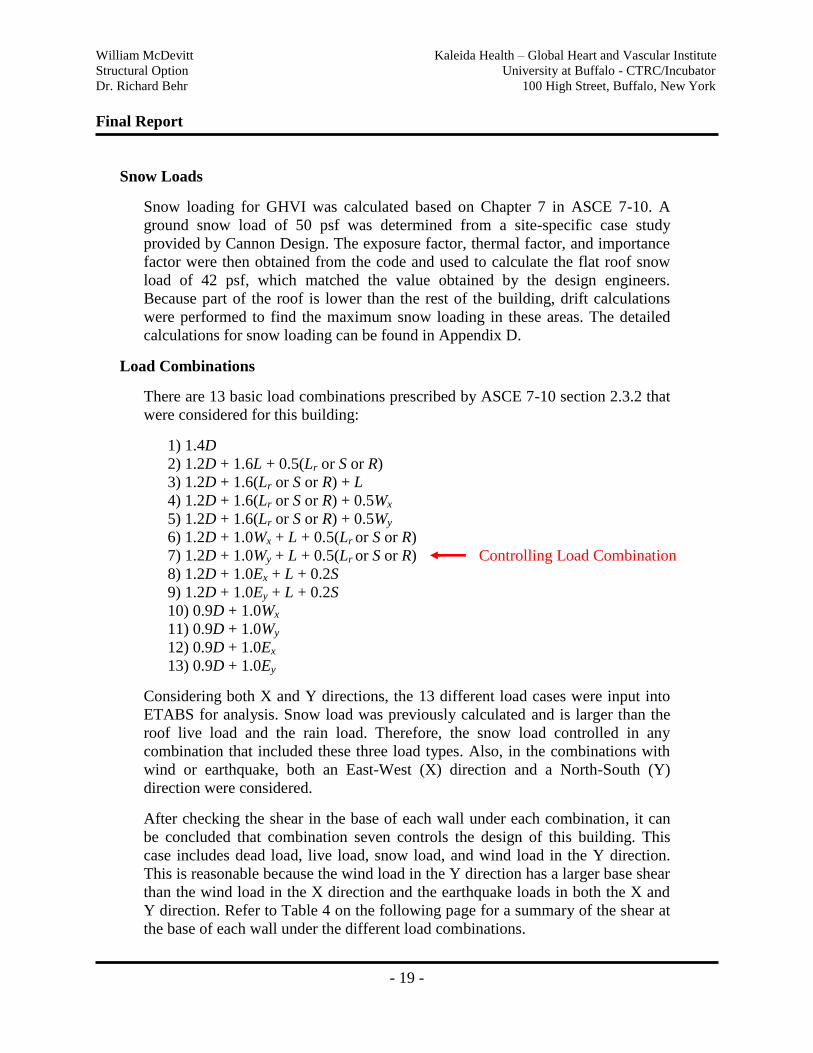
Load Combinations
There are 13 basic load combinations prescribed by ASCE 7-10 section 2.3.2 that
were considered for this building:
1) 1.4D
2) 1.2D + 1.6L + 0.5(Lr or S or R)
3) 1.2D + 1.6(Lr or S or R) + L
4) 1.2D + 1.6(Lr or S or R) + 0.5Wx
5) 1.2D + 1.6(Lr or S or R) + 0.5Wy
6) 1.2D + 1.0Wx + L + 0.5(Lr or S or R)
7) 1.2D + 1.0Wy + L + 0.5(Lr or S or R) Controlling Load Combination
8) 1.2D + 1.0Ex + L + 0.2S
9) 1.2D + 1.0Ey + L + 0.2S
10) 0.9D + 1.0Wx
11) 0.9D + 1.0Wy
12) 0.9D + 1.0Ex
13) 0.9D + 1.0Ey
Considering both X and Y directions, the 13 different load cases were input into
ETABS for analysis. Snow load was previously calculated and is larger than the
roof live load and the rain load. Therefore, the snow load controlled in any
combination that included these three load types. Also, in the combinations with
wind or earthquake, both an East-West (X) direction and a North-South (Y)
direction were considered.
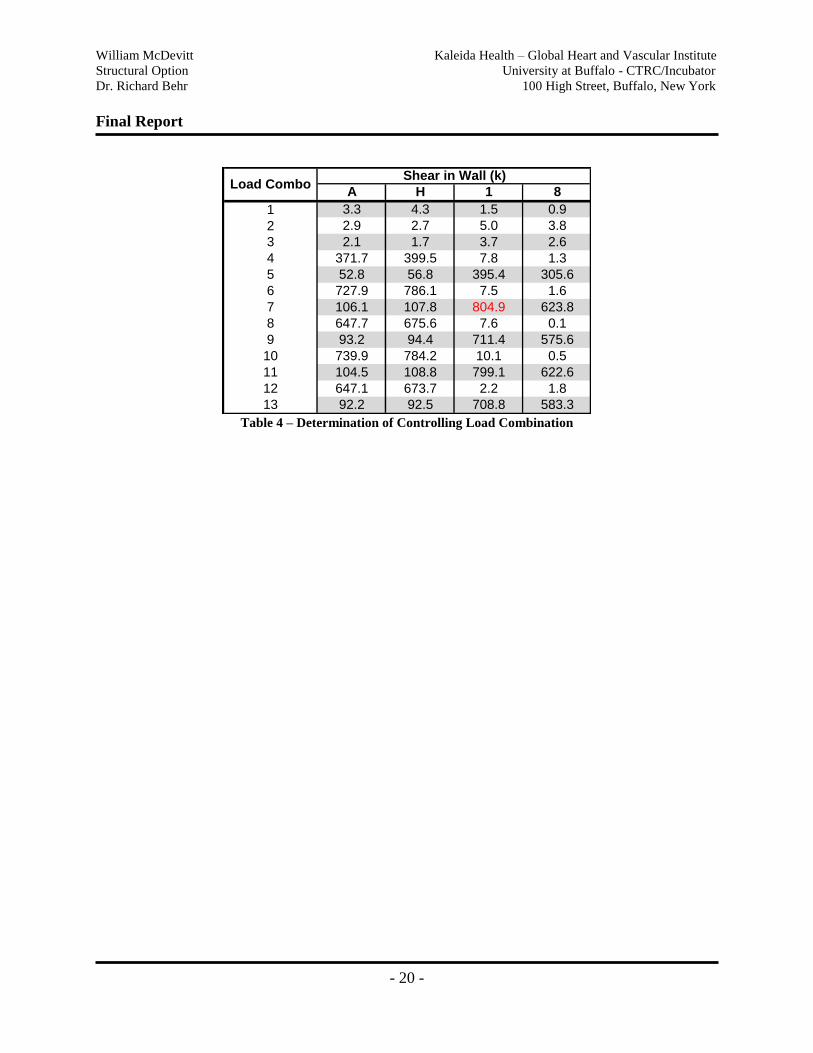
After checking the shear in the base of each wall under each combination, it can
be concluded that combination seven controls the design of this building. This
case includes dead load, live load, snow load, and wind load in the Y direction.
This is reasonable because the wind load in the Y direction has a larger base shear
than the wind load in the X direction and the earthquake loads in both the X and
Y direction. Refer to Table 4 on the following page for a summary of the shear at
the base of each wall under the different load combinations.
William McDevitt Kaleida Health – Global Heart and Vascular Institute
Structural Option University at Buffalo - CTRC/Incubator
Dr. Richard Behr 100 High Street, Buffalo, New York
Final Report
- 20 -
A H 1 8
1 3.3 4.3 1.5 0.9
2 2.9 2.7 5.0 3.8
3 2.1 1.7 3.7 2.6
4 371.7 399.5 7.8 1.3
5 52.8 56.8 395.4 305.6
6 727.9 786.1 7.5 1.6
7 106.1 107.8 804.9 623.8
8 647.7 675.6 7.6 0.1
9 93.2 94.4 711.4 575.6
10 739.9 784.2 10.1 0.5
11 104.5 108.8 799.1 622.6
12 647.1 673.7 2.2 1.8
13 92.2 92.5 708.8 583.3
Shear in Wall (k)Load Combo
Table 4 – Determination of Controlling Load Combination
William McDevitt Kaleida Health – Global Heart and Vascular Institute
Structural Option University at Buffalo - CTRC/Incubator
Dr. Richard Behr 100 High Street, Buffalo, New York
Final Report
- 21 -
Gravity System Redesign
Flat Slab with Drop Panel Design
After exploring three alternative floor systems in Technical Report 2 and
reinvestigating those systems for this thesis, a flat slab system with drop panels
was chosen for the redesign of this structure. Not only did the flat slab system
have the lowest cost, but it will not disrupt the building architecture because it
will utilize the current bay size and will allow for a relatively flat ceiling.
The first step in the design of this system was a set of hand calculations to
determine approximate sizes and the amount of reinforcing that would be
necessary. An interior bay of the building with 32” by 32” columns was designed.
Referencing ACI 9.5.3.2, for a slab without interior beams and with drop panels,
an interior span requires a minimum thickness of 9.6” and an exterior span a
thickness of 10½”. An 11” slab was chosen to meet both of these requirements.
Next it was determined that the direct design method could be used for computing
the slab design moments. These moments were calculated and distributed to the
column strip and middle strip. It was then possible to design the top and bottom
reinforcing for both the column and middle strips, and because the bay is square,
this reinforcing was applied in both directions. The slab was checked for shear,
and it was determined that punching shear would occur at the columns, so drop
panels were necessary. Drop panels were sized at 10½‟ by 10½‟ with a trial depth
of 3½”. Checking this depth, it was determined that a 5½" drop would be
required, or the strength of the concrete needed to be increased to 6000 psi. This
would play an important part in the later decision to design the building using
6000 psi concrete. A copy of these hand calculations can be found in Appendix E.
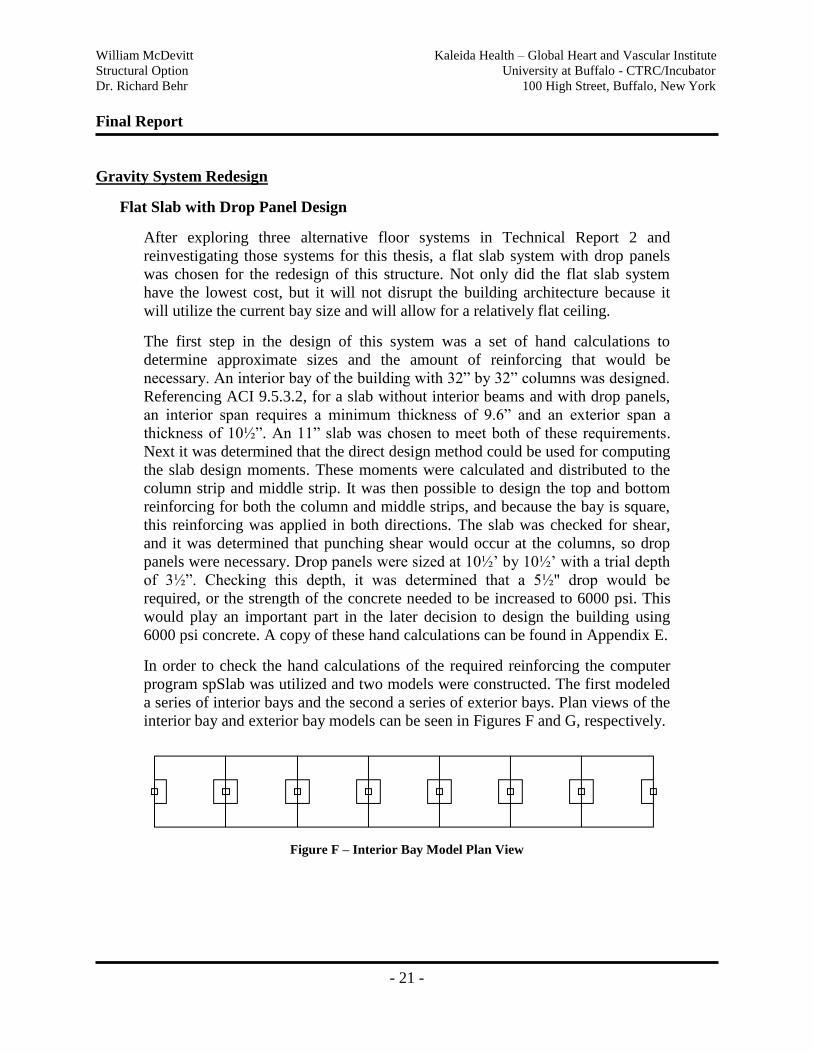
In order to check the hand calculations of the required reinforcing the computer
program spSlab was utilized and two models were constructed. The first modeled
a series of interior bays and the second a series of exterior bays. Plan views of the
interior bay and exterior bay models can be seen in Figures F and G, respectively.
Figure F – Interior Bay Model Plan View
William McDevitt Kaleida Health – Global Heart and Vascular Institute
Structural Option University at Buffalo - CTRC/Incubator
Dr. Richard Behr 100 High Street, Buffalo, New York
Final Report
- 22 -
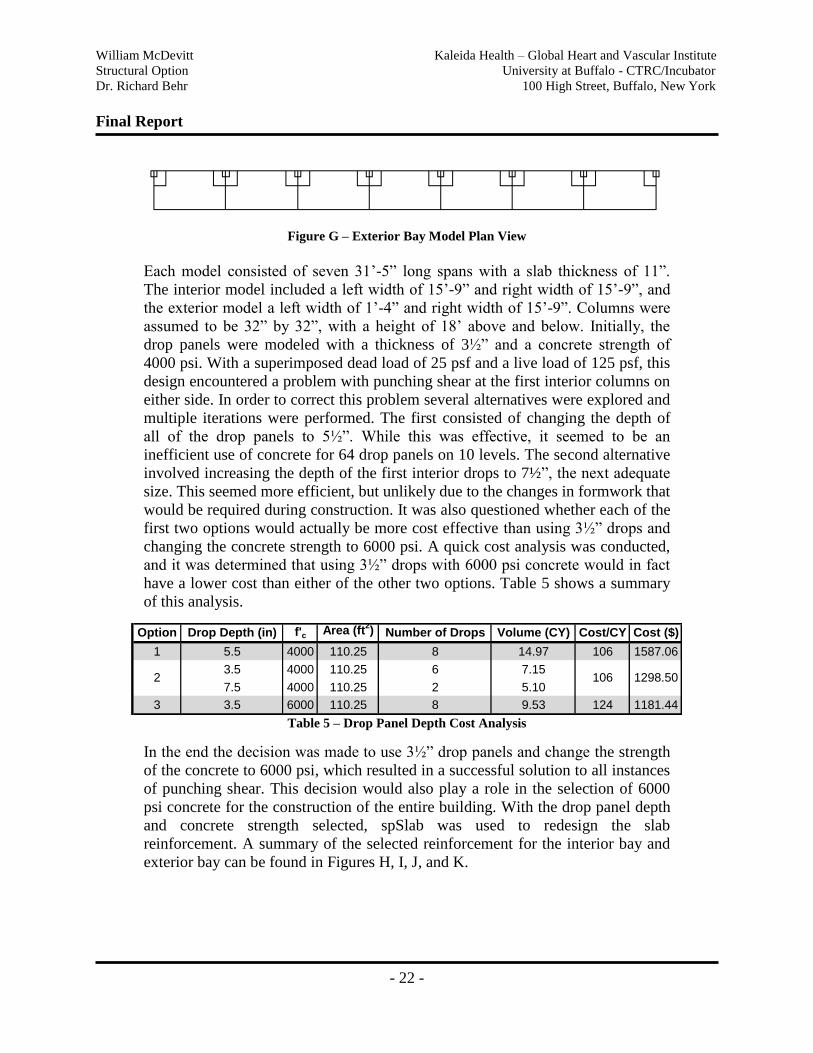
Figure G – Exterior Bay Model Plan View
Each model consisted of seven 31‟-5” long spans with a slab thickness of 11”.
The interior model included a left width of 15‟-9” and right width of 15‟-9”, and
the exterior model a left width of 1‟-4” and right width of 15‟-9”. Columns were
assumed to be 32” by 32”, with a height of 18‟ above and below. Initially, the
drop panels were modeled with a thickness of 3½” and a concrete strength of
4000 psi. With a superimposed dead load of 25 psf and a live load of 125 psf, this
design encountered a problem with punching shear at the first interior columns on
either side. In order to correct this problem several alternatives were explored and
multiple iterations were performed. The first consisted of changing the depth of
all of the drop panels to 5½”. While this was effective, it seemed to be an
inefficient use of concrete for 64 drop panels on 10 levels. The second alternative
involved increasing the depth of the first interior drops to 7½”, the next adequate
size. This seemed more efficient, but unlikely due to the changes in formwork that
would be required during construction. It was also questioned whether each of the
first two options would actually be more cost effective than using 3½” drops and
changing the concrete strength to 6000 psi. A quick cost analysis was conducted,
and it was determined that using 3½” drops with 6000 psi concrete would in fact
have a lower cost than either of the other two options. Table 5 shows a summary
of this analysis.
Option Drop Depth (in) f'c Area (ft2) Number of Drops Volume (CY) Cost/CY Cost ($)
1 5.5 4000 110.25 8 14.97 106 1587.06
3.5 4000 110.25 6 7.15
7.5 4000 110.25 2 5.10
3 3.5 6000 110.25 8 9.53 124 1181.44
2 106 1298.50
Table 5 – Drop Panel Depth Cost Analysis
In the end the decision was made to use 3½” drop panels and change the strength
of the concrete to 6000 psi, which resulted in a successful solution to all instances
of punching shear. This decision would also play a role in the selection of 6000
psi concrete for the construction of the entire building. With the drop panel depth
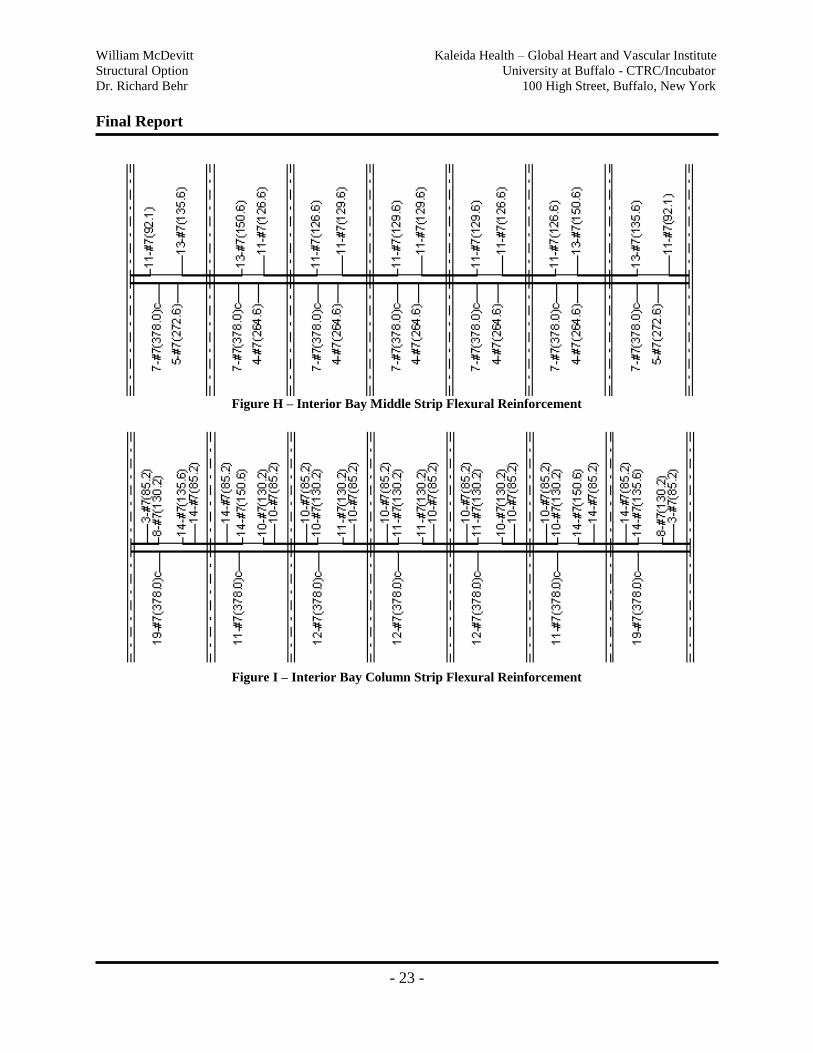
and concrete strength selected, spSlab was used to redesign the slab
reinforcement. A summary of the selected reinforcement for the interior bay and
exterior bay can be found in Figures H, I, J, and K.
William McDevitt Kaleida Health – Global Heart and Vascular Institute
Structural Option University at Buffalo - CTRC/Incubator
Dr. Richard Behr 100 High Street, Buffalo, New York
Final Report
- 23 -
Figure H – Interior Bay Middle Strip Flexural Reinforcement
Figure I – Interior Bay Column Strip Flexural Reinforcement
William McDevitt Kaleida Health – Global Heart and Vascular Institute
Structural Option University at Buffalo - CTRC/Incubator
Dr. Richard Behr 100 High Street, Buffalo, New York
Final Report
- 24 -
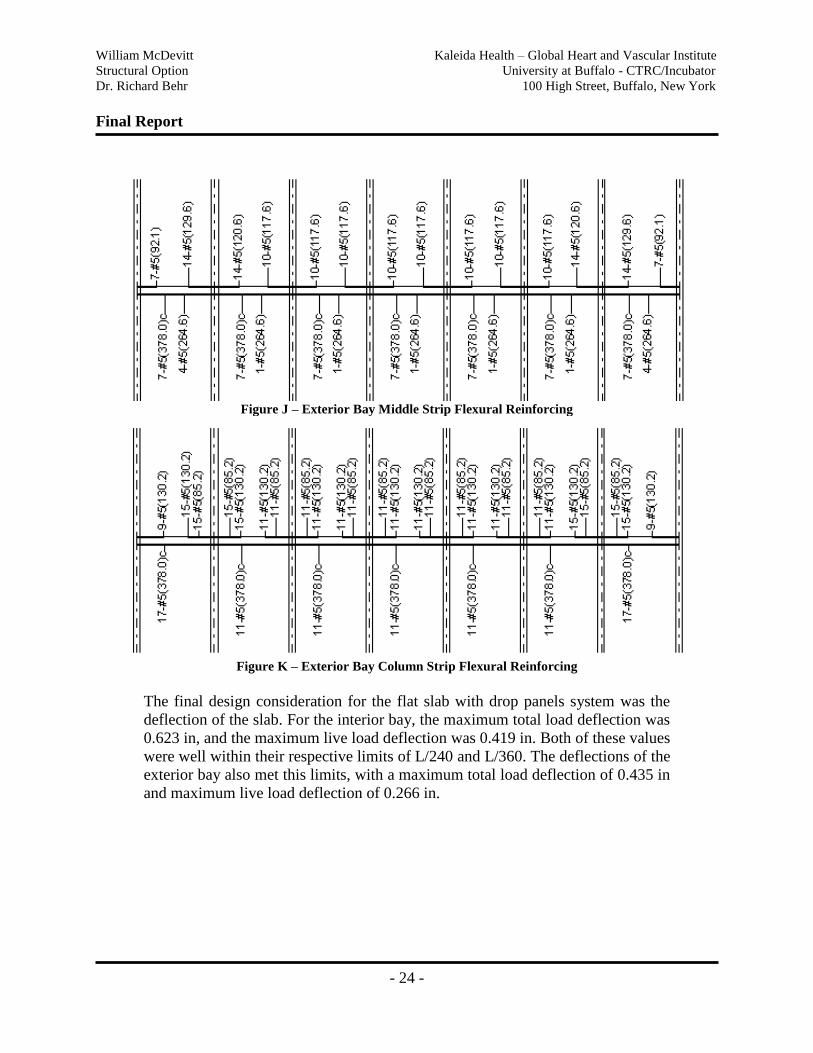
Figure J – Exterior Bay Middle Strip Flexural Reinforcing
Figure K – Exterior Bay Column Strip Flexural Reinforcing
The final design consideration for the flat slab with drop panels system was the
deflection of the slab. For the interior bay, the maximum total load deflection was
0.623 in, and the maximum live load deflection was 0.419 in. Both of these values
were well within their respective limits of L/240 and L/360. The deflections of the
exterior bay also met this limits, with a maximum total load deflection of 0.435 in
and maximum live load deflection of 0.266 in.
William McDevitt Kaleida Health – Global Heart and Vascular Institute
Structural Option University at Buffalo - CTRC/Incubator
Dr. Richard Behr 100 High Street, Buffalo, New York
Final Report
- 25 -
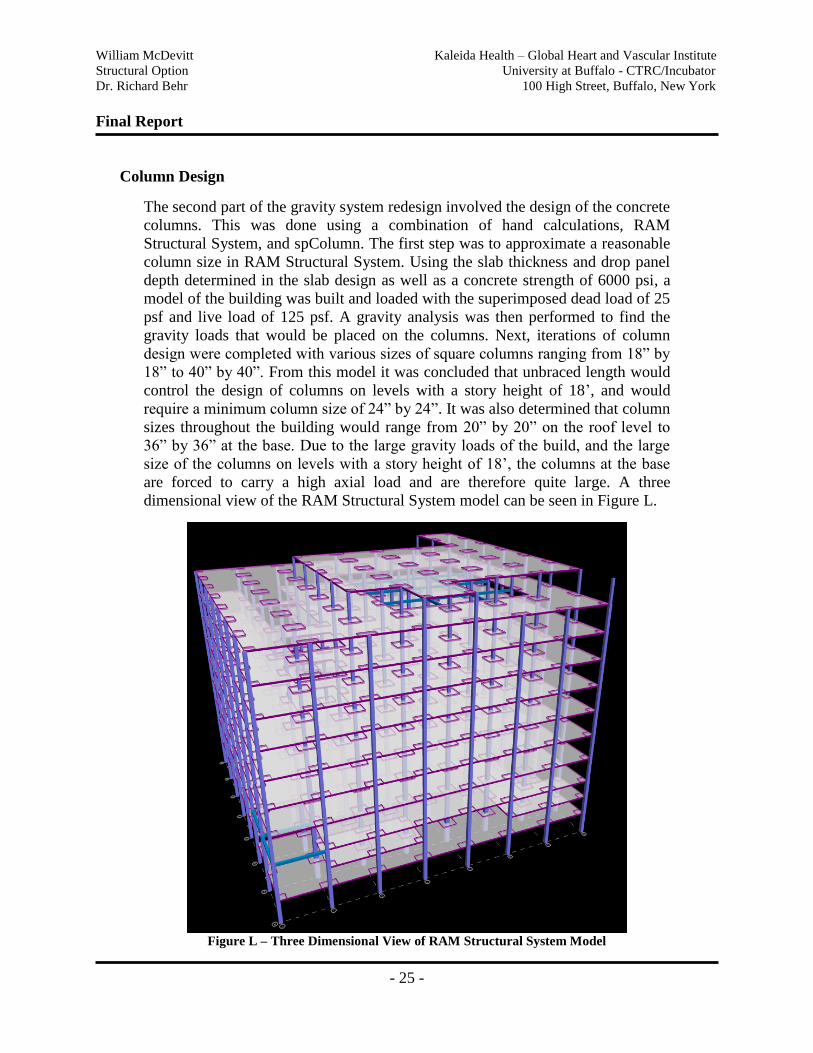
Column Design
The second part of the gravity system redesign involved the design of the concrete
columns. This was done using a combination of hand calculations, RAM
Structural System, and spColumn. The first step was to approximate a reasonable
column size in RAM Structural System. Using the slab thickness and drop panel
depth determined in the slab design as well as a concrete strength of 6000 psi, a
model of the building was built and loaded with the superimposed dead load of 25
psf and live load of 125 psf. A gravity analysis was then performed to find the
gravity loads that would be placed on the columns. Next, iterations of column
design were completed with various sizes of square columns ranging from 18” by
18” to 40” by 40”. From this model it was concluded that unbraced length would
control the design of columns on levels with a story height of 18‟, and would
require a minimum column size of 24” by 24”. It was also determined that column
sizes throughout the building would range from 20” by 20” on the roof level to
36” by 36” at the base. Due to the large gravity loads of the build, and the large
size of the columns on levels with a story height of 18‟, the columns at the base
are forced to carry a high axial load and are therefore quite large. A three
dimensional view of the RAM Structural System model can be seen in Figure L.
Figure L – Three Dimensional View of RAM Structural System Model
William McDevitt Kaleida Health – Global Heart and Vascular Institute
Structural Option University at Buffalo - CTRC/Incubator
Dr. Richard Behr 100 High Street, Buffalo, New York
Final Report
- 26 -
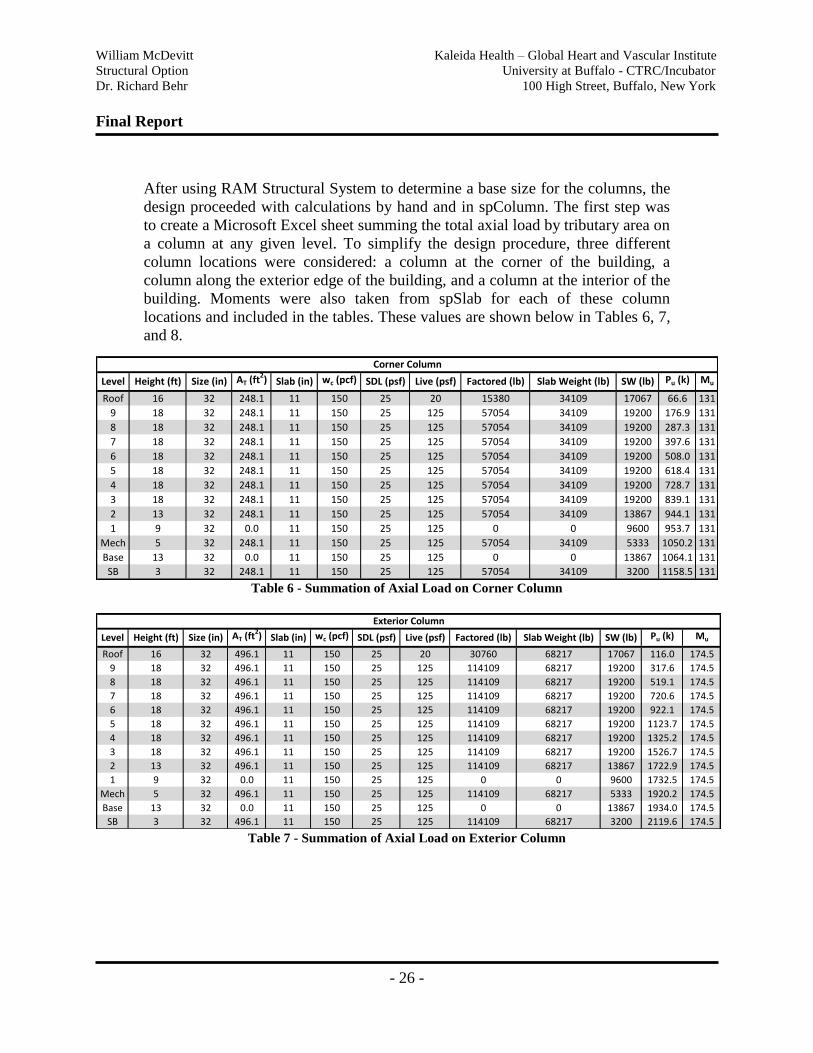
After using RAM Structural System to determine a base size for the columns, the
design proceeded with calculations by hand and in spColumn. The first step was
to create a Microsoft Excel sheet summing the total axial load by tributary area on
a column at any given level. To simplify the design procedure, three different
column locations were considered: a column at the corner of the building, a
column along the exterior edge of the building, and a column at the interior of the
building. Moments were also taken from spSlab for each of these column
locations and included in the tables. These values are shown below in Tables 6, 7,
and 8.
Level Height (ft) Size (in) AT (ft2) Slab (in) wc (pcf) SDL (psf) Live (psf) Factored (lb) Slab Weight (lb) SW (lb) Pu (k) Mu
Roof 16 32 248.1 11 150 25 20 15380 34109 17067 66.6 131
9 18 32 248.1 11 150 25 125 57054 34109 19200 176.9 131
8 18 32 248.1 11 150 25 125 57054 34109 19200 287.3 131
7 18 32 248.1 11 150 25 125 57054 34109 19200 397.6 131
6 18 32 248.1 11 150 25 125 57054 34109 19200 508.0 131
5 18 32 248.1 11 150 25 125 57054 34109 19200 618.4 131
4 18 32 248.1 11 150 25 125 57054 34109 19200 728.7 131
3 18 32 248.1 11 150 25 125 57054 34109 19200 839.1 131
2 13 32 248.1 11 150 25 125 57054 34109 13867 944.1 131
1 9 32 0.0 11 150 25 125 0 0 9600 953.7 131
Mech 5 32 248.1 11 150 25 125 57054 34109 5333 1050.2 131
Base 13 32 0.0 11 150 25 125 0 0 13867 1064.1 131
SB 3 32 248.1 11 150 25 125 57054 34109 3200 1158.5 131
Corner Column
Table 6 - Summation of Axial Load on Corner Column
Level Height (ft) Size (in) AT (ft2) Slab (in) wc (pcf) SDL (psf) Live (psf) Factored (lb) Slab Weight (lb) SW (lb) Pu (k) Mu
Roof 16 32 496.1 11 150 25 20 30760 68217 17067 116.0 174.5
9 18 32 496.1 11 150 25 125 114109 68217 19200 317.6 174.5
8 18 32 496.1 11 150 25 125 114109 68217 19200 519.1 174.5
7 18 32 496.1 11 150 25 125 114109 68217 19200 720.6 174.5
6 18 32 496.1 11 150 25 125 114109 68217 19200 922.1 174.5
5 18 32 496.1 11 150 25 125 114109 68217 19200 1123.7 174.5
4 18 32 496.1 11 150 25 125 114109 68217 19200 1325.2 174.5
3 18 32 496.1 11 150 25 125 114109 68217 19200 1526.7 174.5
2 13 32 496.1 11 150 25 125 114109 68217 13867 1722.9 174.5
1 9 32 0.0 11 150 25 125 0 0 9600 1732.5 174.5
Mech 5 32 496.1 11 150 25 125 114109 68217 5333 1920.2 174.5
Base 13 32 0.0 11 150 25 125 0 0 13867 1934.0 174.5
SB 3 32 496.1 11 150 25 125 114109 68217 3200 2119.6 174.5
Exterior Column
Table 7 - Summation of Axial Load on Exterior Column

William McDevitt Kaleida Health – Global Heart and Vascular Institute
Structural Option University at Buffalo - CTRC/Incubator
Dr. Richard Behr 100 High Street, Buffalo, New York
Final Report
- 27 -
Level Height (ft) Size (in) AT (ft2) Slab (in) wc (pcf) SDL (psf) Live (psf) Factored (lb) Slab Weight (lb) SW (lb) Pu (k) Mu
Roof 16 32 992.3 11 150 25 20 61520 136434 17067 215.0 117.5
9 18 32 992.3 11 150 25 125 228218 136434 19200 598.9 117.5
8 18 32 992.3 11 150 25 125 228218 136434 19200 982.7 117.5
7 18 32 992.3 11 150 25 125 228218 136434 19200 1366.6 117.5
6 18 32 992.3 11 150 25 125 228218 136434 19200 1750.4 117.5
5 18 32 992.3 11 150 25 125 228218 136434 19200 2134.3 117.5
4 18 32 992.3 11 150 25 125 228218 136434 19200 2518.1 117.5
3 18 32 992.3 11 150 25 125 228218 136434 19200 2902.0 117.5
2 13 32 992.3 11 150 25 125 228218 136434 13867 3280.5 117.5
1 9 32 0.0 11 150 25 125 0 0 9600 3290.1 117.5
Mech 5 32 992.3 11 150 25 125 228218 136434 5333 3660.1 117.5
Base 13 32 0.0 11 150 25 125 0 0 13867 3674.0 117.5
SB 3 32 992.3 11 150 25 125 228218 136434 3200 4041.8 117.5
Interior Column
Table 8 - Summation of Axial Load on Interior Column
When the summation of axial forces was complete, a sample column was
designed by hand. The first step of this design was to check if the 36” by 36”
column was part of a sway or non-sway frame. With reference to ACI 10.10.5.2,
Q was calculated to be less than 0.05, meaning that the column is part of a non-
sway frame. Next, a slenderness check showed the column to be slightly above
the slenderness limit, requiring that the moment magnification factor be
calculated. This was done, and the moment magnification factor was determined
to be less than one, meaning that moment magnification does not influence the
column behavior, and the predetermined moment could be used for the column
design. The design of the 36” by 36” subbasement column continued using an
axial load of 4042 kips and a moment of 118 foot-kips. Considering a concrete
strength of 6000 psi and a steel strength of 60000 psi, and using the column
design tables in the back of Macgregor‟s „Reinforced Concrete: Mechanics and
Design‟ textbook, the required area of steel was calculated to be 28.5 in2.
Utilizing 24 number 10 bars in a square pattern would satisfy this requirement
with an area of steel equal to 29.2 in2. To view these hand calculations refer to
Appendix E.
In order to check the hand design of the subbasement level 36” by 36” column, it
was modeled in spColumn. Again a concrete strength of 6000 psi and steel
strength of 60000 psi were used, and reinforcement was assumed to be equal on
all sides. The axial load of 4042 kips and moment of 118 foot-kips were applied
to the model, and the solution was executed. Slightly differing from the hand
design, spColumn suggested that 20 number 10 bars be used with an area of steel
of 25.4 in2. This is adequately close, and the small difference could be attributed
to the accuracy of reading the rho value off the Macgregor chart. For the column
design summary, as well as the design interaction diagram, refer to Appendix E.
William McDevitt Kaleida Health – Global Heart and Vascular Institute
Structural Option University at Buffalo - CTRC/Incubator
Dr. Richard Behr 100 High Street, Buffalo, New York
Final Report
- 28 -
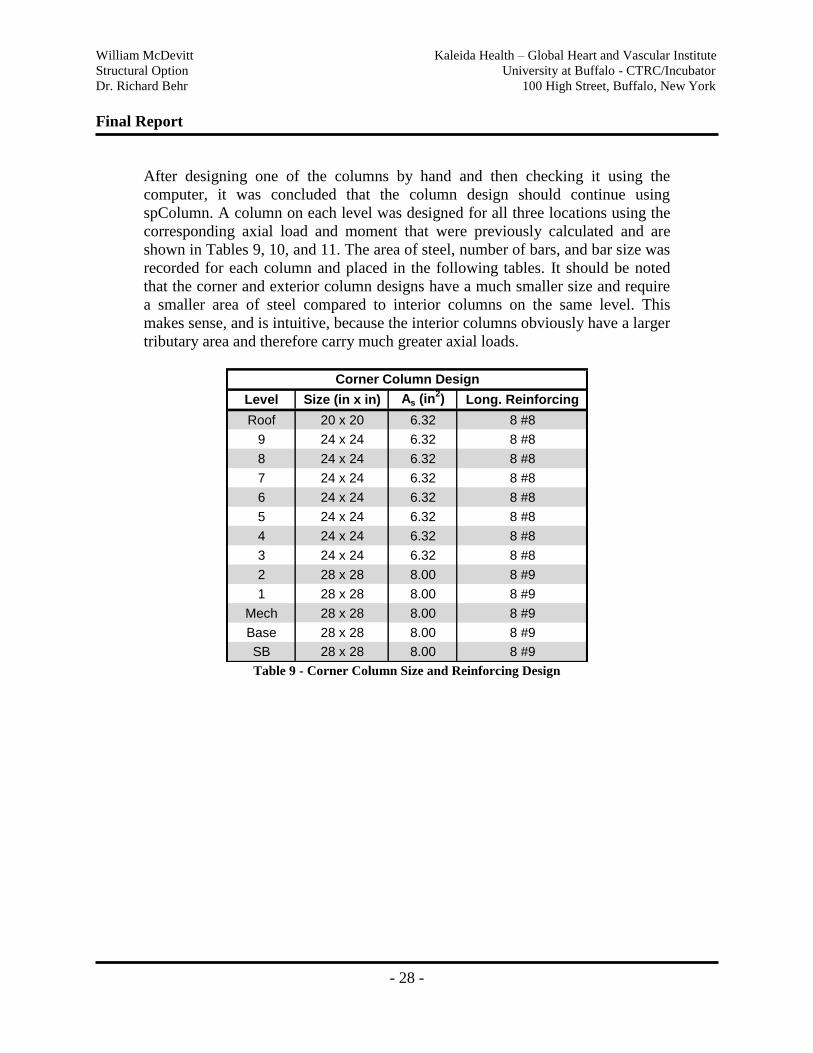
After designing one of the columns by hand and then checking it using the
computer, it was concluded that the column design should continue using
spColumn. A column on each level was designed for all three locations using the
corresponding axial load and moment that were previously calculated and are
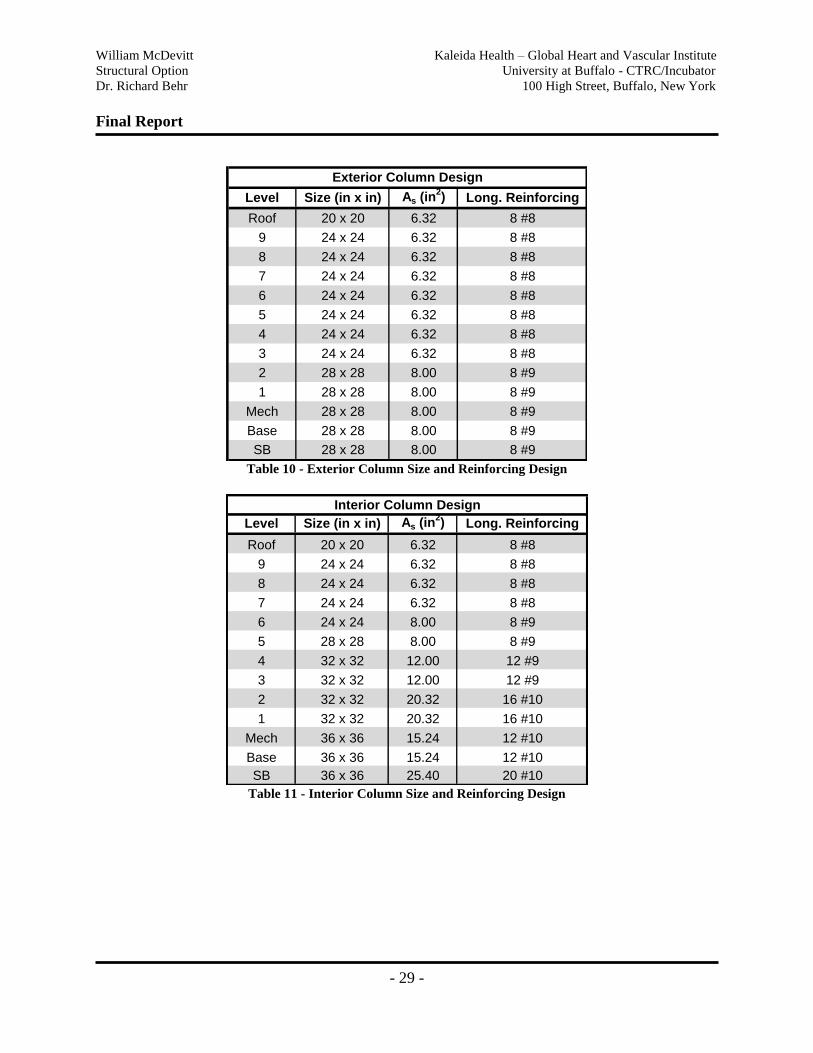
shown in Tables 9, 10, and 11. The area of steel, number of bars, and bar size was
recorded for each column and placed in the following tables. It should be noted
that the corner and exterior column designs have a much smaller size and require
a smaller area of steel compared to interior columns on the same level. This
makes sense, and is intuitive, because the interior columns obviously have a larger
tributary area and therefore carry much greater axial loads.
Level Size (in x in) As (in2) Long. Reinforcing
Roof 20 x 20 6.32 8 #8
9 24 x 24 6.32 8 #8
8 24 x 24 6.32 8 #8
7 24 x 24 6.32 8 #8
6 24 x 24 6.32 8 #8
5 24 x 24 6.32 8 #8
4 24 x 24 6.32 8 #8
3 24 x 24 6.32 8 #8
2 28 x 28 8.00 8 #9
1 28 x 28 8.00 8 #9
Mech 28 x 28 8.00 8 #9
Base 28 x 28 8.00 8 #9
SB 28 x 28 8.00 8 #9
Corner Column Design
Table 9 - Corner Column Size and Reinforcing Design
William McDevitt Kaleida Health – Global Heart and Vascular Institute
Structural Option University at Buffalo - CTRC/Incubator
Dr. Richard Behr 100 High Street, Buffalo, New York
Final Report
- 29 -
Level Size (in x in) As (in2) Long. Reinforcing
Roof 20 x 20 6.32 8 #8
9 24 x 24 6.32 8 #8
8 24 x 24 6.32 8 #8
7 24 x 24 6.32 8 #8
6 24 x 24 6.32 8 #8
5 24 x 24 6.32 8 #8
4 24 x 24 6.32 8 #8
3 24 x 24 6.32 8 #8
2 28 x 28 8.00 8 #9
1 28 x 28 8.00 8 #9
Mech 28 x 28 8.00 8 #9
Base 28 x 28 8.00 8 #9
SB 28 x 28 8.00 8 #9
Exterior Column Design
Table 10 - Exterior Column Size and Reinforcing Design
Level Size (in x in) As (in2) Long. Reinforcing
Roof 20 x 20 6.32 8 #8
9 24 x 24 6.32 8 #8
8 24 x 24 6.32 8 #8
7 24 x 24 6.32 8 #8
6 24 x 24 8.00 8 #9
5 28 x 28 8.00 8 #9
4 32 x 32 12.00 12 #9
3 32 x 32 12.00 12 #9
2 32 x 32 20.32 16 #10
1 32 x 32 20.32 16 #10
Mech 36 x 36 15.24 12 #10
Base 36 x 36 15.24 12 #10
SB 36 x 36 25.40 20 #10
Interior Column Design
Table 11 - Interior Column Size and Reinforcing Design
William McDevitt Kaleida Health – Global Heart and Vascular Institute
Structural Option University at Buffalo - CTRC/Incubator
Dr. Richard Behr 100 High Street, Buffalo, New York
Final Report
- 30 -
Lateral System Redesign
Shear Wall Design
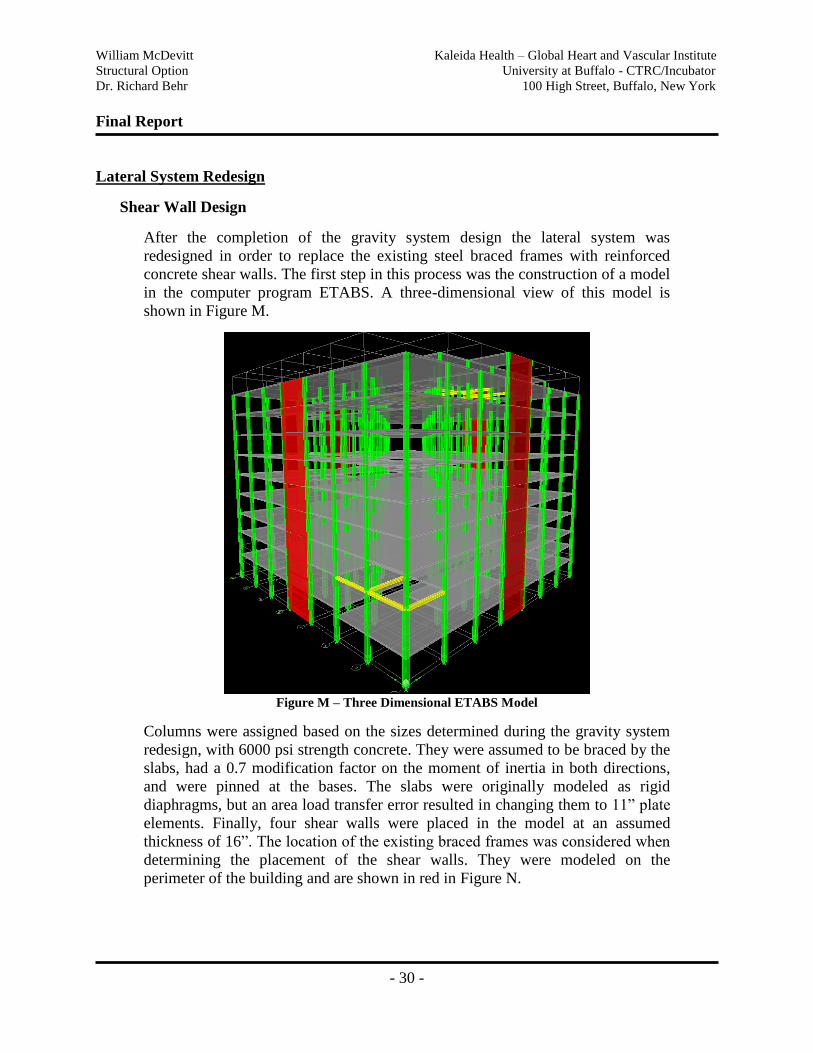
After the completion of the gravity system design the lateral system was
redesigned in order to replace the existing steel braced frames with reinforced
concrete shear walls. The first step in this process was the construction of a model
in the computer program ETABS. A three-dimensional view of this model is
shown in Figure M.
Figure M – Three Dimensional ETABS Model
Columns were assigned based on the sizes determined during the gravity system
redesign, with 6000 psi strength concrete. They were assumed to be braced by the
slabs, had a 0.7 modification factor on the moment of inertia in both directions,
and were pinned at the bases. The slabs were originally modeled as rigid
diaphragms, but an area load transfer error resulted in changing them to 11” plate
elements. Finally, four shear walls were placed in the model at an assumed
thickness of 16”. The location of the existing braced frames was considered when
determining the placement of the shear walls. They were modeled on the
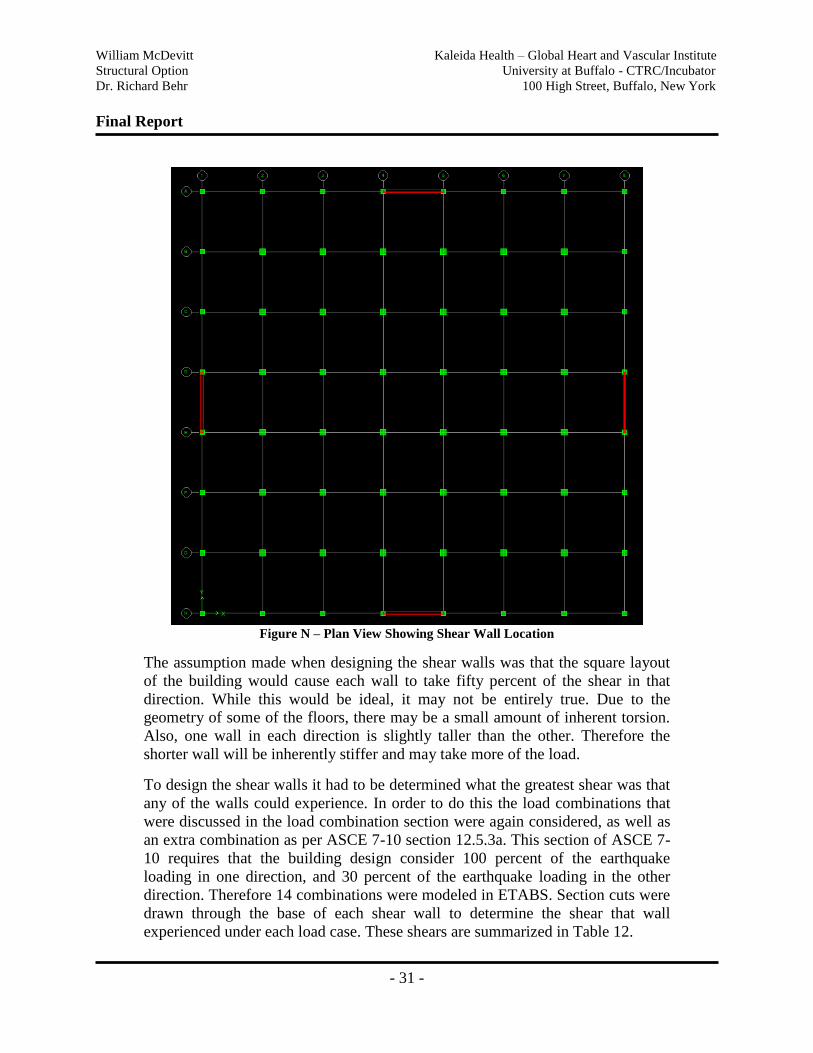
perimeter of the building and are shown in red in Figure N.
William McDevitt Kaleida Health – Global Heart and Vascular Institute
Structural Option University at Buffalo - CTRC/Incubator
Dr. Richard Behr 100 High Street, Buffalo, New York
Final Report
- 31 -
Figure N – Plan View Showing Shear Wall Location
The assumption made when designing the shear walls was that the square layout
of the building would cause each wall to take fifty percent of the shear in that
direction. While this would be ideal, it may not be entirely true. Due to the
geometry of some of the floors, there may be a small amount of inherent torsion.
Also, one wall in each direction is slightly taller than the other. Therefore the
shorter wall will be inherently stiffer and may take more of the load.
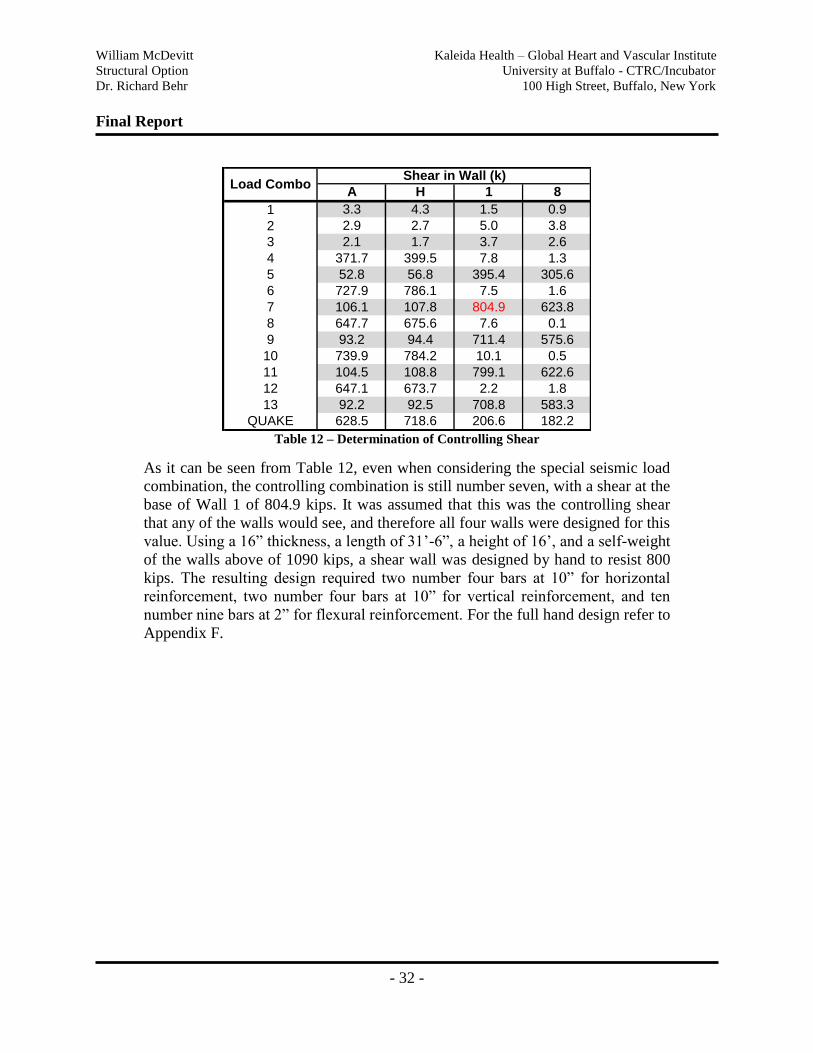
To design the shear walls it had to be determined what the greatest shear was that
any of the walls could experience. In order to do this the load combinations that
were discussed in the load combination section were again considered, as well as
an extra combination as per ASCE 7-10 section 12.5.3a. This section of ASCE 7-
10 requires that the building design consider 100 percent of the earthquake
loading in one direction, and 30 percent of the earthquake loading in the other
direction. Therefore 14 combinations were modeled in ETABS. Section cuts were
drawn through the base of each shear wall to determine the shear that wall
experienced under each load case. These shears are summarized in Table 12.
William McDevitt Kaleida Health – Global Heart and Vascular Institute
Structural Option University at Buffalo - CTRC/Incubator
Dr. Richard Behr 100 High Street, Buffalo, New York
Final Report
- 32 -
A H 1 8
1 3.3 4.3 1.5 0.9
2 2.9 2.7 5.0 3.8
3 2.1 1.7 3.7 2.6
4 371.7 399.5 7.8 1.3
5 52.8 56.8 395.4 305.6
6 727.9 786.1 7.5 1.6
7 106.1 107.8 804.9 623.8
8 647.7 675.6 7.6 0.1
9 93.2 94.4 711.4 575.6
10 739.9 784.2 10.1 0.5
11 104.5 108.8 799.1 622.6
12 647.1 673.7 2.2 1.8
13 92.2 92.5 708.8 583.3
QUAKE 628.5 718.6 206.6 182.2
Shear in Wall (k)Load Combo
Table 12 – Determination of Controlling Shear
As it can be seen from Table 12, even when considering the special seismic load
combination, the controlling combination is still number seven, with a shear at the
base of Wall 1 of 804.9 kips. It was assumed that this was the controlling shear
that any of the walls would see, and therefore all four walls were designed for this
value. Using a 16” thickness, a length of 31‟-6”, a height of 16‟, and a self-weight
of the walls above of 1090 kips, a shear wall was designed by hand to resist 800
kips. The resulting design required two number four bars at 10” for horizontal
reinforcement, two number four bars at 10” for vertical reinforcement, and ten
number nine bars at 2” for flexural reinforcement. For the full hand design refer to
Appendix F.
William McDevitt Kaleida Health – Global Heart and Vascular Institute
Structural Option University at Buffalo - CTRC/Incubator
Dr. Richard Behr 100 High Street, Buffalo, New York
Final Report
- 33 -
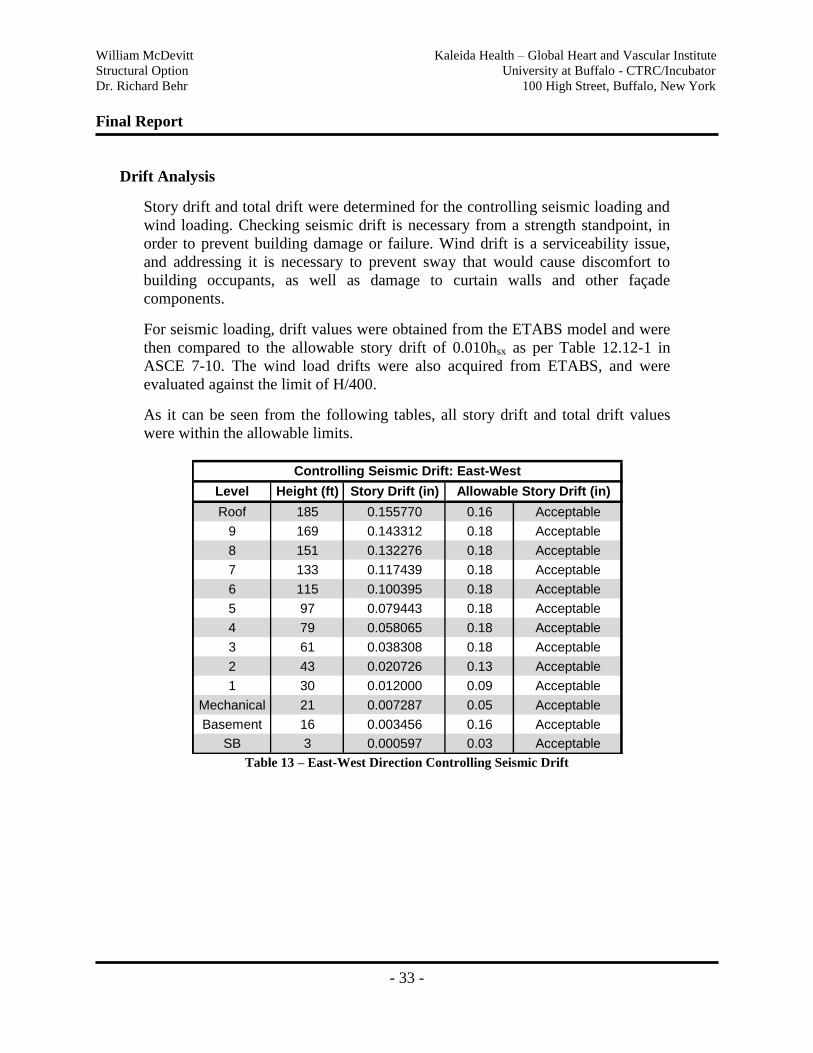
Drift Analysis
Story drift and total drift were determined for the controlling seismic loading and
wind loading. Checking seismic drift is necessary from a strength standpoint, in
order to prevent building damage or failure. Wind drift is a serviceability issue,
and addressing it is necessary to prevent sway that would cause discomfort to
building occupants, as well as damage to curtain walls and other façade
components.
For seismic loading, drift values were obtained from the ETABS model and were
then compared to the allowable story drift of 0.010hsx as per Table 12.12-1 in
ASCE 7-10. The wind load drifts were also acquired from ETABS, and were
evaluated against the limit of H/400.
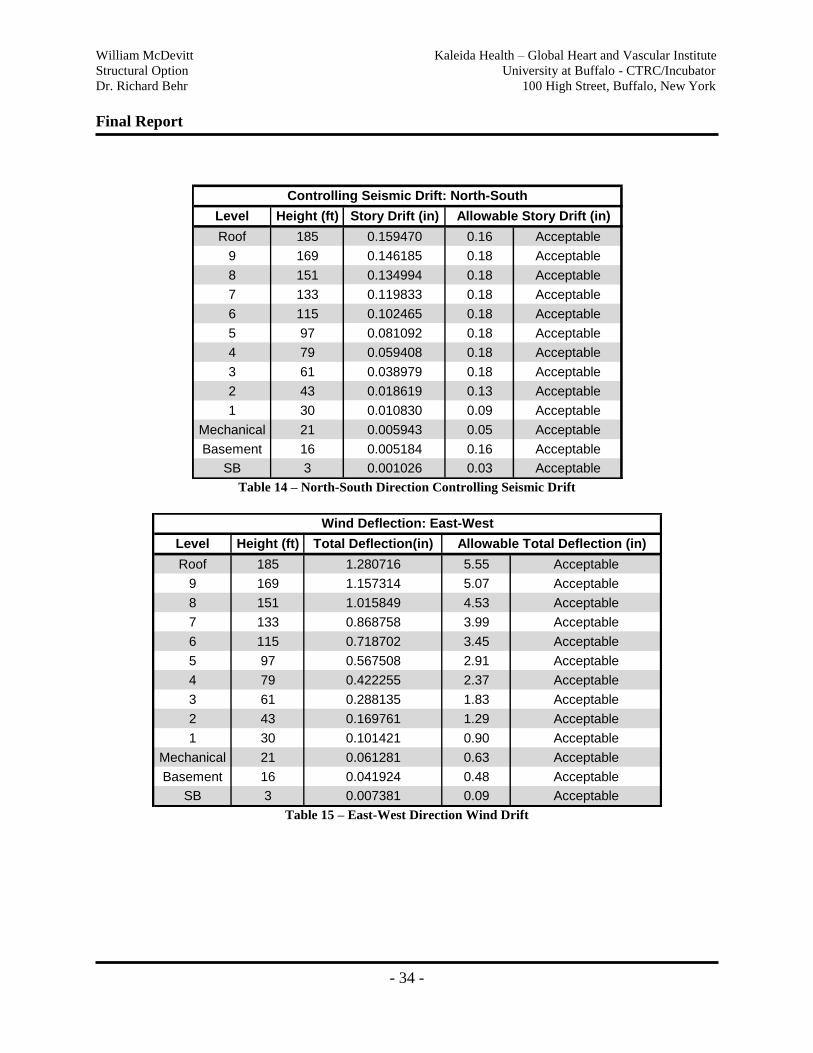
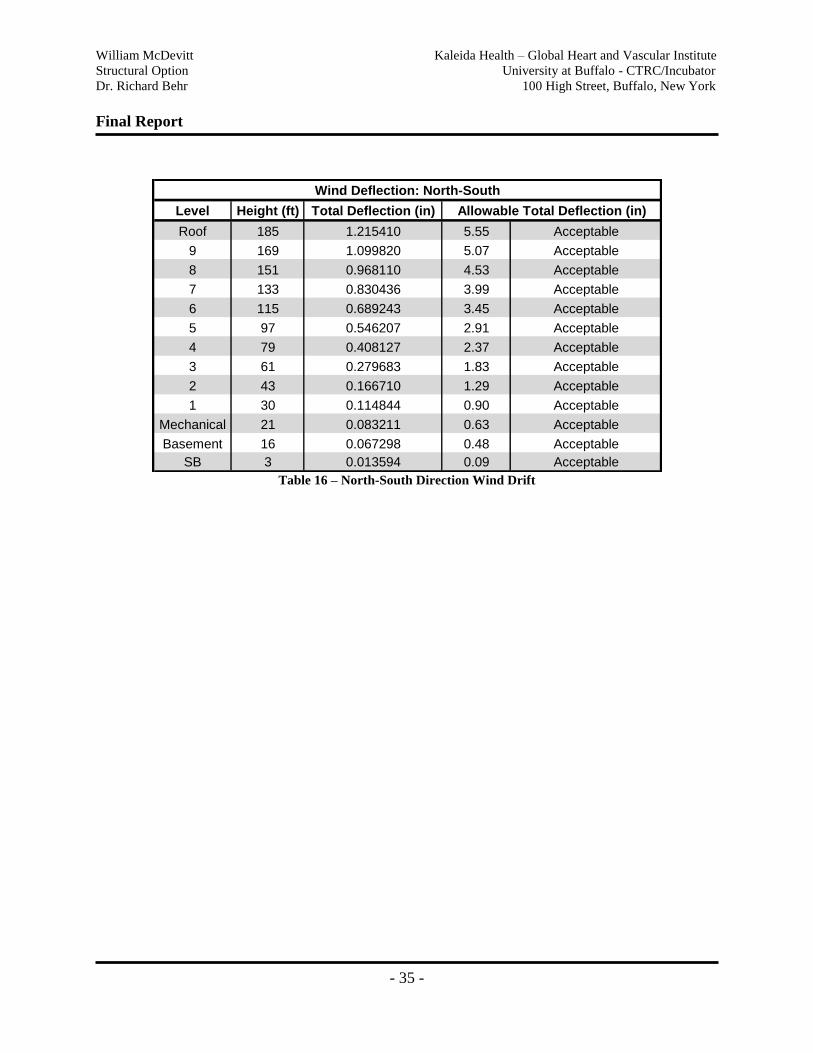
As it can be seen from the following tables, all story drift and total drift values
were within the allowable limits.
Level Height (ft) Story Drift (in)
Roof 185 0.155770 0.16 Acceptable
9 169 0.143312 0.18 Acceptable
8 151 0.132276 0.18 Acceptable
7 133 0.117439 0.18 Acceptable
6 115 0.100395 0.18 Acceptable
5 97 0.079443 0.18 Acceptable
4 79 0.058065 0.18 Acceptable
3 61 0.038308 0.18 Acceptable
2 43 0.020726 0.13 Acceptable
1 30 0.012000 0.09 Acceptable
Mechanical 21 0.007287 0.05 Acceptable
Basement 16 0.003456 0.16 Acceptable
SB 3 0.000597 0.03 Acceptable
Controlling Seismic Drift: East-West
Allowable Story Drift (in)
Table 13 – East-West Direction Controlling Seismic Drift
William McDevitt Kaleida Health – Global Heart and Vascular Institute
Structural Option University at Buffalo - CTRC/Incubator
Dr. Richard Behr 100 High Street, Buffalo, New York
Final Report
- 34 -
Level Height (ft) Story Drift (in)
Roof 185 0.159470 0.16 Acceptable
9 169 0.146185 0.18 Acceptable
8 151 0.134994 0.18 Acceptable
7 133 0.119833 0.18 Acceptable
6 115 0.102465 0.18 Acceptable
5 97 0.081092 0.18 Acceptable
4 79 0.059408 0.18 Acceptable
3 61 0.038979 0.18 Acceptable
2 43 0.018619 0.13 Acceptable
1 30 0.010830 0.09 Acceptable
Mechanical 21 0.005943 0.05 Acceptable
Basement 16 0.005184 0.16 Acceptable
SB 3 0.001026 0.03 Acceptable
Controlling Seismic Drift: North-South
Allowable Story Drift (in)
Table 14 – North-South Direction Controlling Seismic Drift
Level Height (ft) Total Deflection(in)
Roof 185 1.280716 5.55 Acceptable
9 169 1.157314 5.07 Acceptable
8 151 1.015849 4.53 Acceptable
7 133 0.868758 3.99 Acceptable
6 115 0.718702 3.45 Acceptable
5 97 0.567508 2.91 Acceptable
4 79 0.422255 2.37 Acceptable
3 61 0.288135 1.83 Acceptable
2 43 0.169761 1.29 Acceptable
1 30 0.101421 0.90 Acceptable
Mechanical 21 0.061281 0.63 Acceptable
Basement 16 0.041924 0.48 Acceptable
SB 3 0.007381 0.09 Acceptable
Wind Deflection: East-West
Allowable Total Deflection (in)
Table 15 – East-West Direction Wind Drift
William McDevitt Kaleida Health – Global Heart and Vascular Institute
Structural Option University at Buffalo - CTRC/Incubator
Dr. Richard Behr 100 High Street, Buffalo, New York
Final Report
- 35 -
Level Height (ft) Total Deflection (in)
Roof 185 1.215410 5.55 Acceptable
9 169 1.099820 5.07 Acceptable
8 151 0.968110 4.53 Acceptable
7 133 0.830436 3.99 Acceptable
6 115 0.689243 3.45 Acceptable
5 97 0.546207 2.91 Acceptable
4 79 0.408127 2.37 Acceptable
3 61 0.279683 1.83 Acceptable
2 43 0.166710 1.29 Acceptable
1 30 0.114844 0.90 Acceptable
Mechanical 21 0.083211 0.63 Acceptable
Basement 16 0.067298 0.48 Acceptable
SB 3 0.013594 0.09 Acceptable
Wind Deflection: North-South
Allowable Total Deflection (in)
Table 16 – North-South Direction Wind Drift
William McDevitt Kaleida Health – Global Heart and Vascular Institute
Structural Option University at Buffalo - CTRC/Incubator
Dr. Richard Behr 100 High Street, Buffalo, New York
Final Report
- 36 -
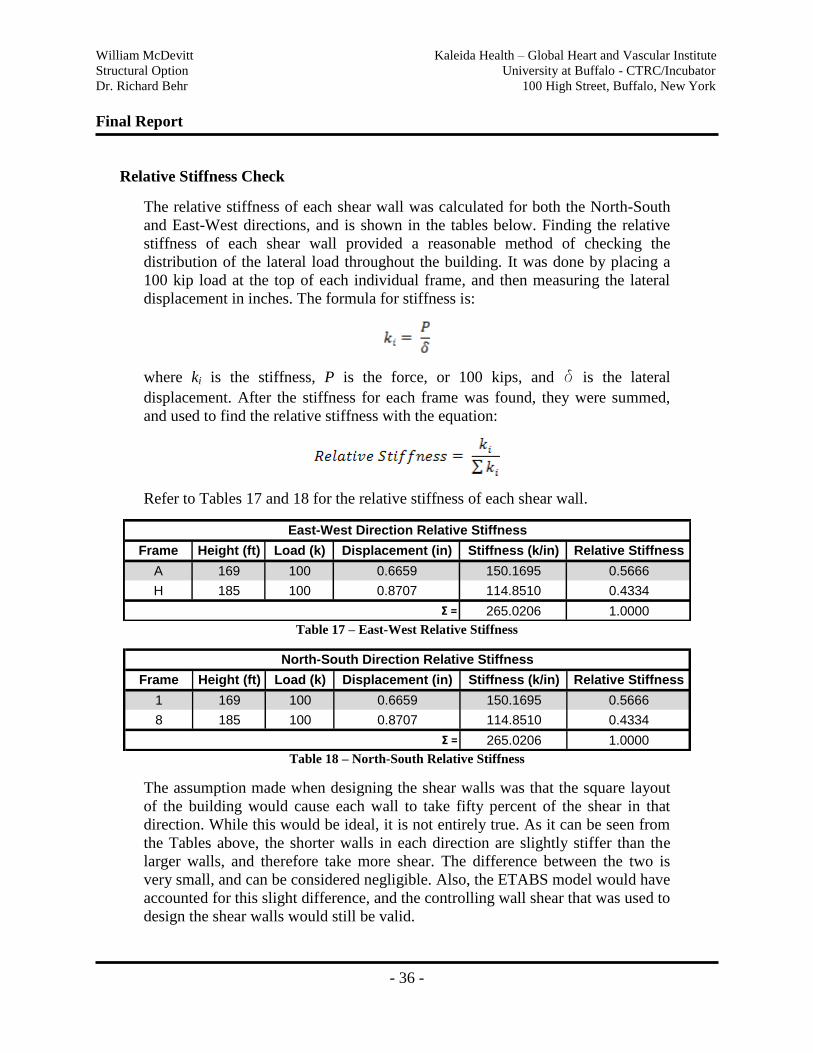
Relative Stiffness Check
The relative stiffness of each shear wall was calculated for both the North-South
and East-West directions, and is shown in the tables below. Finding the relative
stiffness of each shear wall provided a reasonable method of checking the
distribution of the lateral load throughout the building. It was done by placing a
100 kip load at the top of each individual frame, and then measuring the lateral
displacement in inches. The formula for stiffness is:
where ki is the stiffness, P is the force, or 100 kips, and d is the lateral
displacement. After the stiffness for each frame was found, they were summed,
and used to find the relative stiffness with the equation:
Refer to Tables 17 and 18 for the relative stiffness of each shear wall.
Frame Height (ft) Load (k) Displacement (in) Stiffness (k/in) Relative Stiffness
A 169 100 0.6659 150.1695 0.5666
H 185 100 0.8707 114.8510 0.4334
Σ = 265.0206 1.0000
East-West Direction Relative Stiffness
Table 17 – East-West Relative Stiffness
Frame Height (ft) Load (k) Displacement (in) Stiffness (k/in) Relative Stiffness
1 169 100 0.6659 150.1695 0.5666
8 185 100 0.8707 114.8510 0.4334
Σ = 265.0206 1.0000
North-South Direction Relative Stiffness
Table 18 – North-South Relative Stiffness
The assumption made when designing the shear walls was that the square layout
of the building would cause each wall to take fifty percent of the shear in that
direction. While this would be ideal, it is not entirely true. As it can be seen from
the Tables above, the shorter walls in each direction are slightly stiffer than the
larger walls, and therefore take more shear. The difference between the two is
very small, and can be considered negligible. Also, the ETABS model would have
accounted for this slight difference, and the controlling wall shear that was used to
design the shear walls would still be valid.
William McDevitt Kaleida Health – Global Heart and Vascular Institute
Structural Option University at Buffalo - CTRC/Incubator
Dr. Richard Behr 100 High Street, Buffalo, New York
Final Report
- 37 -
Overturning and Impact on Foundation
Overturning moments are a result of wind and seismic loading, and cause the
building to try and „topple over‟. This „toppling‟ produces uplift in the foundation,
and the foundation must be able to resist this uplift. The foundation of GHVI
consists of steel helical piles with an allowable axial capacity of 342 kips. These
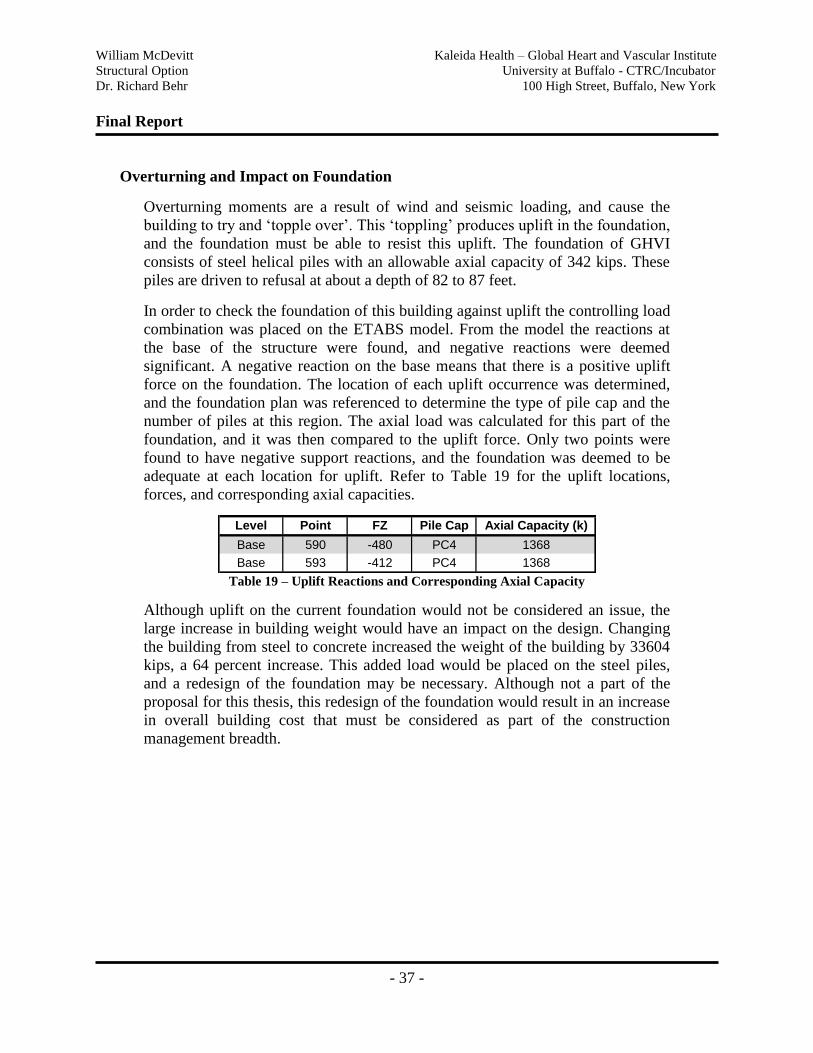
piles are driven to refusal at about a depth of 82 to 87 feet. In order to check the foundation of this building against uplift the controlling load
combination was placed on the ETABS model. From the model the reactions at
the base of the structure were found, and negative reactions were deemed
significant. A negative reaction on the base means that there is a positive uplift
force on the foundation. The location of each uplift occurrence was determined,
and the foundation plan was referenced to determine the type of pile cap and the
number of piles at this region. The axial load was calculated for this part of the
foundation, and it was then compared to the uplift force. Only two points were
found to have negative support reactions, and the foundation was deemed to be
adequate at each location for uplift. Refer to Table 19 for the uplift locations,
forces, and corresponding axial capacities.
Level Point FZ Pile Cap Axial Capacity (k)
Base 590 -480 PC4 1368
Base 593 -412 PC4 1368 Table 19 – Uplift Reactions and Corresponding Axial Capacity
Although uplift on the current foundation would not be considered an issue, the
large increase in building weight would have an impact on the design. Changing
the building from steel to concrete increased the weight of the building by 33604
kips, a 64 percent increase. This added load would be placed on the steel piles,
and a redesign of the foundation may be necessary. Although not a part of the
proposal for this thesis, this redesign of the foundation would result in an increase
in overall building cost that must be considered as part of the construction
management breadth.
William McDevitt Kaleida Health – Global Heart and Vascular Institute
Structural Option University at Buffalo - CTRC/Incubator
Dr. Richard Behr 100 High Street, Buffalo, New York
Final Report
- 38 -
Vibration Analysis
After the completion of the gravity system and lateral system designs, the structure was
analyzed for vibration to determine if the vibrational velocities of the existing design
were achieved with the redesigned structure. Currently, the building is designed to meet
four different criteria based on a moderate walking pace of 75 steps/minute. Typical lab
and surgery areas throughout the building, utilizing bench microscopes up to 100x
magnification, are required to meet a velocity of 4,000 µ in/sec. Laboratory areas near
corridors must meet a velocity of 2,000 µ in/sec, for bench microscopes up to 400x
magnification. Central lab areas are designed to house 3-micron photography equipment
and sensitive systems with a maximum vibrational velocity of 1,000 µ in/sec. Finally,
extremely sensitive areas call for a vibrational velocity that will not exceed 500 µ in/sec.
In order to complete this analysis, research was conducted to determine how to analyze a
concrete structure for vibration. A majority of information for this study was found from
a technical note published by Bijan O Aalami from ADAPT, titled „Vibration Design of
Concrete Floors for Serviceability‟, and from AISC and CISC‟s Design Guide 11, „Floor
Vibrations due to Human Activity‟.
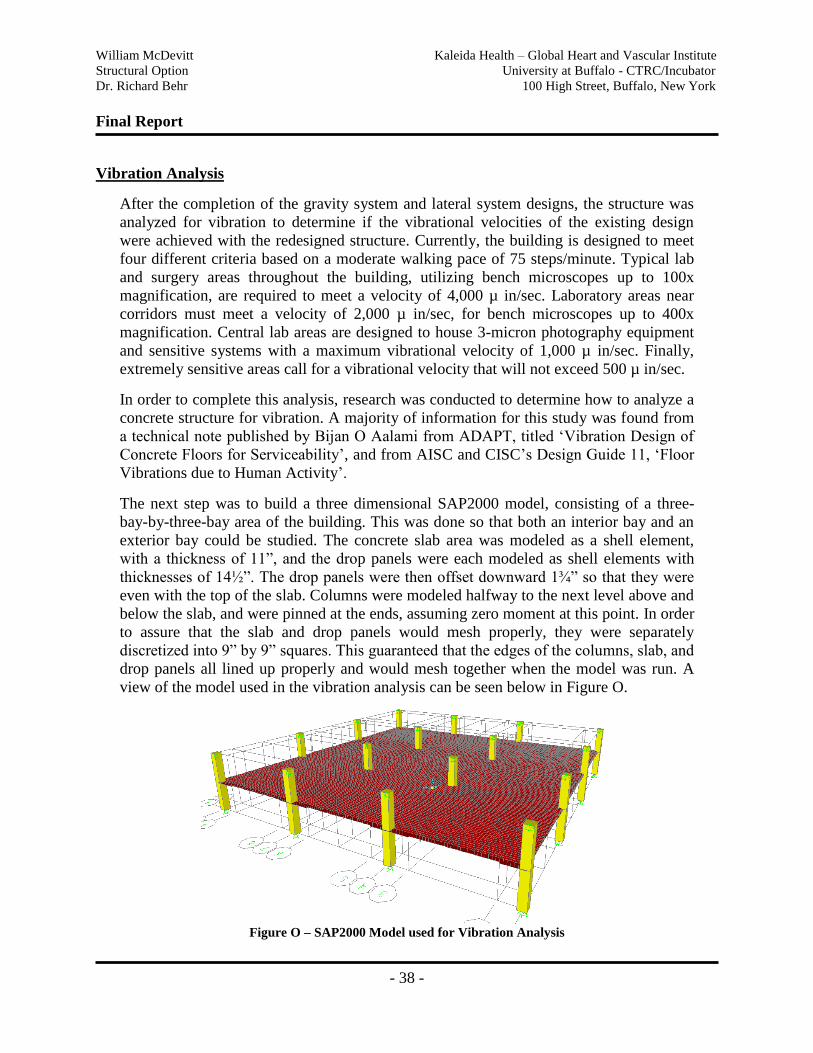
The next step was to build a three dimensional SAP2000 model, consisting of a three-
bay-by-three-bay area of the building. This was done so that both an interior bay and an
exterior bay could be studied. The concrete slab area was modeled as a shell element,
with a thickness of 11”, and the drop panels were each modeled as shell elements with
thicknesses of 14½”. The drop panels were then offset downward 1¾” so that they were
even with the top of the slab. Columns were modeled halfway to the next level above and
below the slab, and were pinned at the ends, assuming zero moment at this point. In order
to assure that the slab and drop panels would mesh properly, they were separately
discretized into 9” by 9” squares. This guaranteed that the edges of the columns, slab, and
drop panels all lined up properly and would mesh together when the model was run. A
view of the model used in the vibration analysis can be seen below in Figure O.
Figure O – SAP2000 Model used for Vibration Analysis
William McDevitt Kaleida Health – Global Heart and Vascular Institute
Structural Option University at Buffalo - CTRC/Incubator
Dr. Richard Behr 100 High Street, Buffalo, New York
Final Report
- 39 -
Several assumptions were made with regards to the strength and cracked section
properties of the concrete members. The value of elastic modulus, Ec, for the columns,
slab, and drops was multiplied by 1.2 to account for dynamic loading. Also, the cracked
section properties from ACI 10.10.4.1 were taken into account, including 0.7Ig for the
columns, and 0.25Ig for the slab and drops.
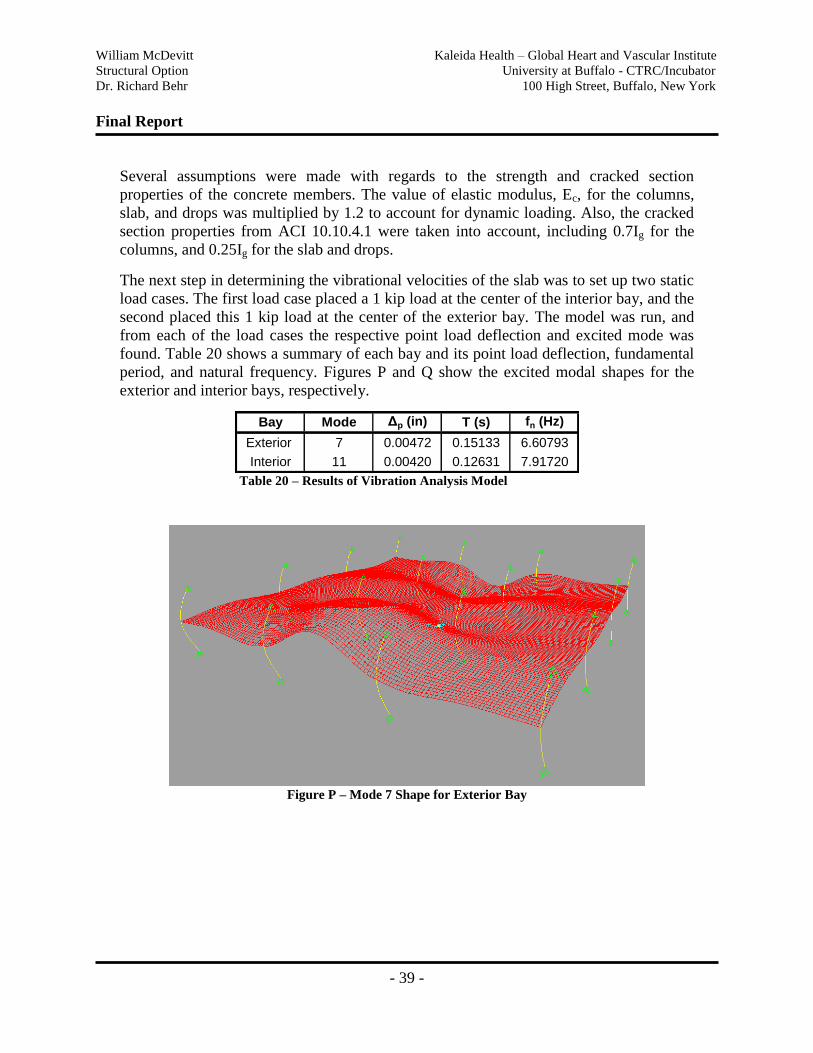
The next step in determining the vibrational velocities of the slab was to set up two static
load cases. The first load case placed a 1 kip load at the center of the interior bay, and the
second placed this 1 kip load at the center of the exterior bay. The model was run, and
from each of the load cases the respective point load deflection and excited mode was
found. Table 20 shows a summary of each bay and its point load deflection, fundamental
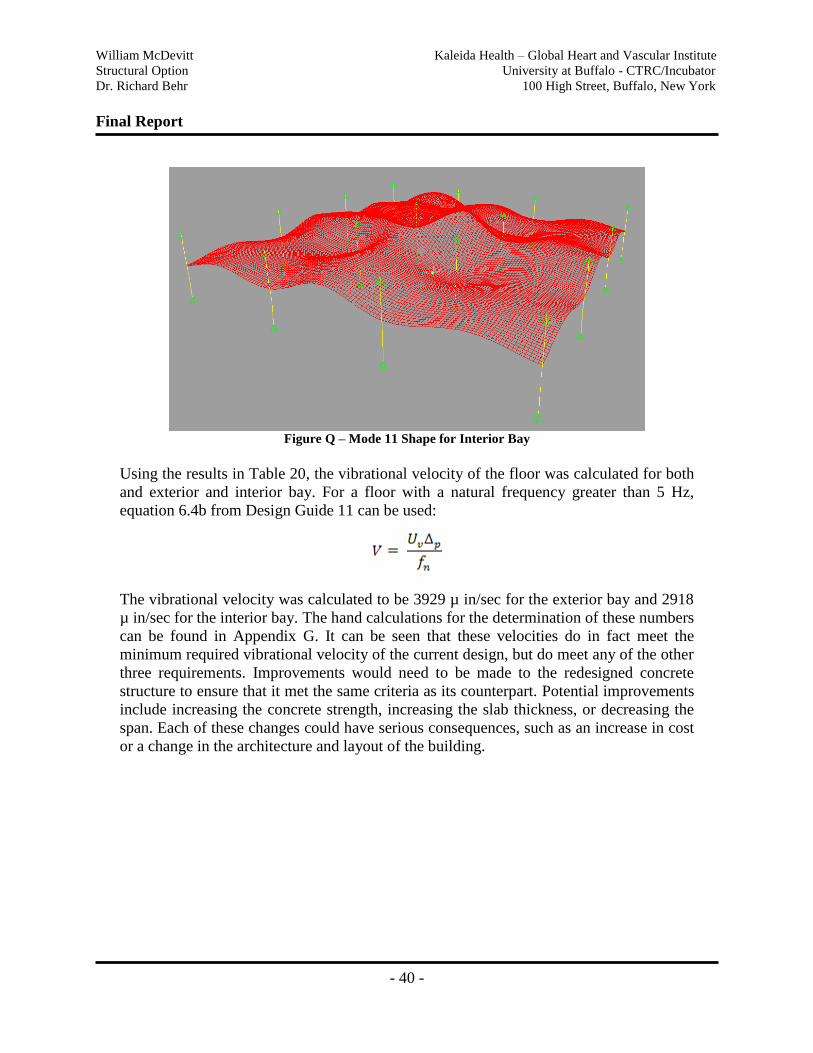
period, and natural frequency. Figures P and Q show the excited modal shapes for the
exterior and interior bays, respectively.
Bay Mode Δp (in) T (s) fn (Hz)
Exterior 7 0.00472 0.15133 6.60793
Interior 11 0.00420 0.12631 7.91720 Table 20 – Results of Vibration Analysis Model
Figure P – Mode 7 Shape for Exterior Bay
William McDevitt Kaleida Health – Global Heart and Vascular Institute
Structural Option University at Buffalo - CTRC/Incubator
Dr. Richard Behr 100 High Street, Buffalo, New York
Final Report
- 40 -
Figure Q – Mode 11 Shape for Interior Bay
Using the results in Table 20, the vibrational velocity of the floor was calculated for both
and exterior and interior bay. For a floor with a natural frequency greater than 5 Hz,
equation 6.4b from Design Guide 11 can be used:
The vibrational velocity was calculated to be 3929 µ in/sec for the exterior bay and 2918
µ in/sec for the interior bay. The hand calculations for the determination of these numbers
can be found in Appendix G. It can be seen that these velocities do in fact meet the
minimum required vibrational velocity of the current design, but do meet any of the other
three requirements. Improvements would need to be made to the redesigned concrete
structure to ensure that it met the same criteria as its counterpart. Potential improvements
include increasing the concrete strength, increasing the slab thickness, or decreasing the
span. Each of these changes could have serious consequences, such as an increase in cost
or a change in the architecture and layout of the building.
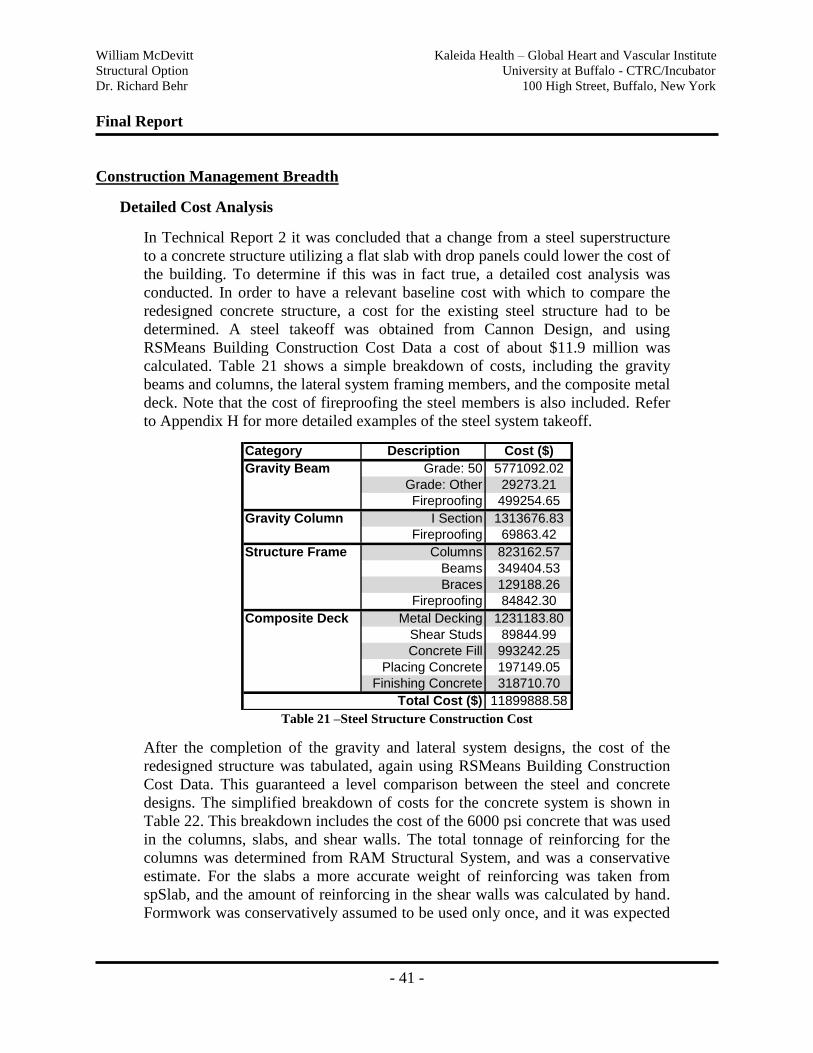
William McDevitt Kaleida Health – Global Heart and Vascular Institute
Structural Option University at Buffalo - CTRC/Incubator
Dr. Richard Behr 100 High Street, Buffalo, New York
Final Report
- 41 -
Construction Management Breadth
Detailed Cost Analysis
In Technical Report 2 it was concluded that a change from a steel superstructure
to a concrete structure utilizing a flat slab with drop panels could lower the cost of
the building. To determine if this was in fact true, a detailed cost analysis was
conducted. In order to have a relevant baseline cost with which to compare the
redesigned concrete structure, a cost for the existing steel structure had to be
determined. A steel takeoff was obtained from Cannon Design, and using
RSMeans Building Construction Cost Data a cost of about $11.9 million was
calculated. Table 21 shows a simple breakdown of costs, including the gravity
beams and columns, the lateral system framing members, and the composite metal
deck. Note that the cost of fireproofing the steel members is also included. Refer
to Appendix H for more detailed examples of the steel system takeoff.
Category Description Cost ($)
Gravity Beam Grade: 50 5771092.02
Grade: Other 29273.21
Fireproofing 499254.65
Gravity Column I Section 1313676.83
Fireproofing 69863.42
Structure Frame Columns 823162.57
Beams 349404.53
Braces 129188.26
Fireproofing 84842.30
Composite Deck Metal Decking 1231183.80
Shear Studs 89844.99
Concrete Fill 993242.25
Placing Concrete 197149.05
Finishing Concrete 318710.70
Total Cost ($) 11899888.58 Table 21 –Steel Structure Construction Cost
After the completion of the gravity and lateral system designs, the cost of the
redesigned structure was tabulated, again using RSMeans Building Construction
Cost Data. This guaranteed a level comparison between the steel and concrete
designs. The simplified breakdown of costs for the concrete system is shown in
Table 22. This breakdown includes the cost of the 6000 psi concrete that was used
in the columns, slabs, and shear walls. The total tonnage of reinforcing for the
columns was determined from RAM Structural System, and was a conservative
estimate. For the slabs a more accurate weight of reinforcing was taken from
spSlab, and the amount of reinforcing in the shear walls was calculated by hand.
Formwork was conservatively assumed to be used only once, and it was expected
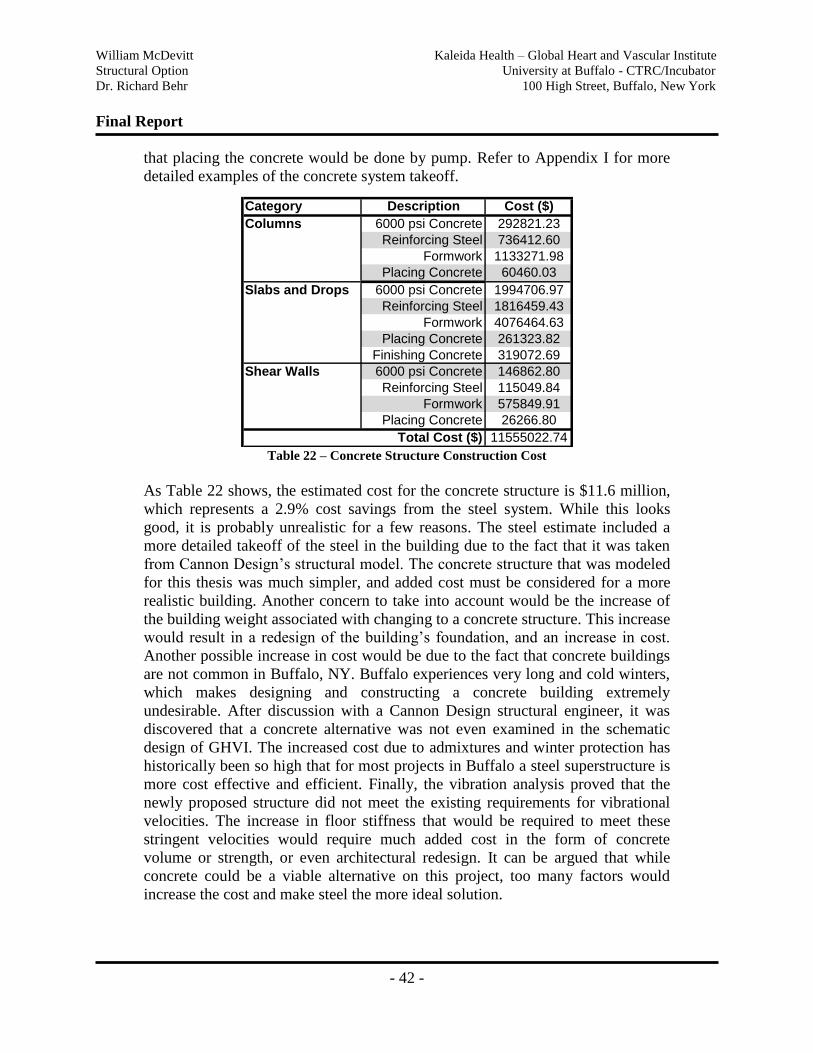
William McDevitt Kaleida Health – Global Heart and Vascular Institute
Structural Option University at Buffalo - CTRC/Incubator
Dr. Richard Behr 100 High Street, Buffalo, New York
Final Report
- 42 -
that placing the concrete would be done by pump. Refer to Appendix I for more
detailed examples of the concrete system takeoff.
Category Description Cost ($)
Columns 6000 psi Concrete 292821.23
Reinforcing Steel 736412.60
Formwork 1133271.98
Placing Concrete 60460.03
Slabs and Drops 6000 psi Concrete 1994706.97
Reinforcing Steel 1816459.43
Formwork 4076464.63
Placing Concrete 261323.82
Finishing Concrete 319072.69
Shear Walls 6000 psi Concrete 146862.80
Reinforcing Steel 115049.84
Formwork 575849.91
Placing Concrete 26266.80
11555022.74Total Cost ($) Table 22 – Concrete Structure Construction Cost
As Table 22 shows, the estimated cost for the concrete structure is $11.6 million,
which represents a 2.9% cost savings from the steel system. While this looks
good, it is probably unrealistic for a few reasons. The steel estimate included a
more detailed takeoff of the steel in the building due to the fact that it was taken
from Cannon Design‟s structural model. The concrete structure that was modeled
for this thesis was much simpler, and added cost must be considered for a more
realistic building. Another concern to take into account would be the increase of
the building weight associated with changing to a concrete structure. This increase
would result in a redesign of the building‟s foundation, and an increase in cost.
Another possible increase in cost would be due to the fact that concrete buildings
are not common in Buffalo, NY. Buffalo experiences very long and cold winters,
which makes designing and constructing a concrete building extremely
undesirable. After discussion with a Cannon Design structural engineer, it was
discovered that a concrete alternative was not even examined in the schematic
design of GHVI. The increased cost due to admixtures and winter protection has
historically been so high that for most projects in Buffalo a steel superstructure is
more cost effective and efficient. Finally, the vibration analysis proved that the
newly proposed structure did not meet the existing requirements for vibrational
velocities. The increase in floor stiffness that would be required to meet these
stringent velocities would require much added cost in the form of concrete
volume or strength, or even architectural redesign. It can be argued that while
concrete could be a viable alternative on this project, too many factors would
increase the cost and make steel the more ideal solution.
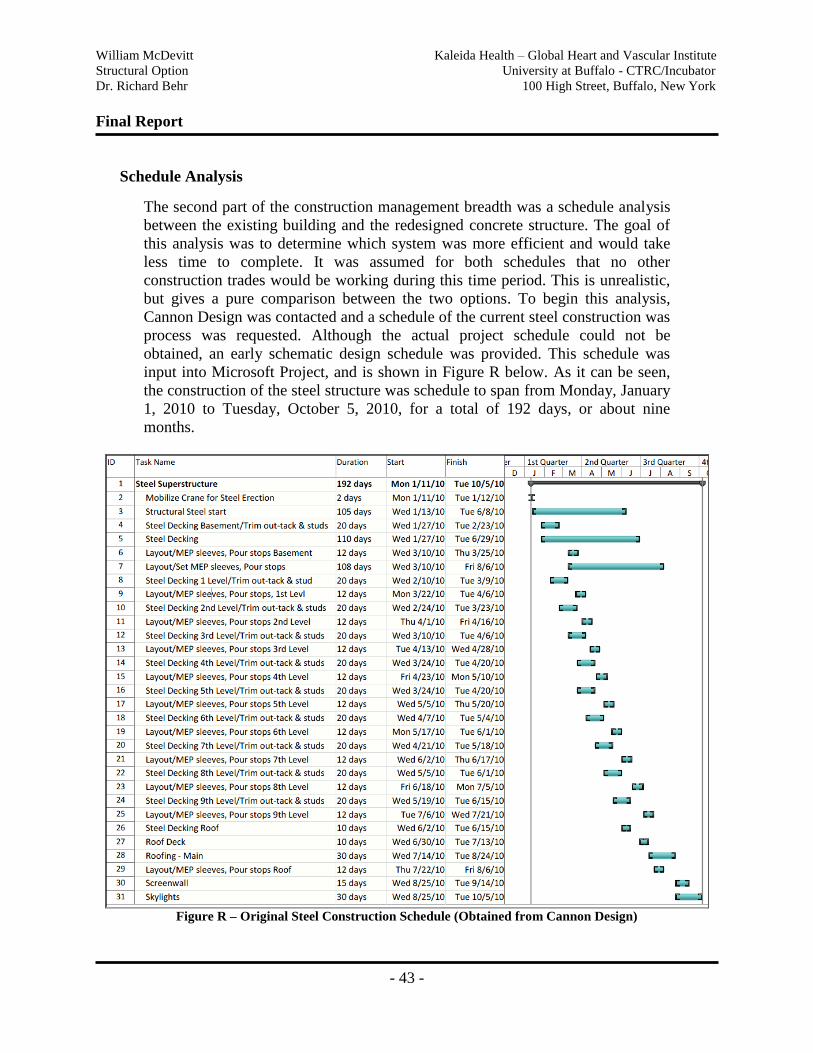
William McDevitt Kaleida Health – Global Heart and Vascular Institute
Structural Option University at Buffalo - CTRC/Incubator
Dr. Richard Behr 100 High Street, Buffalo, New York
Final Report
- 43 -
Schedule Analysis
The second part of the construction management breadth was a schedule analysis
between the existing building and the redesigned concrete structure. The goal of
this analysis was to determine which system was more efficient and would take
less time to complete. It was assumed for both schedules that no other
construction trades would be working during this time period. This is unrealistic,
but gives a pure comparison between the two options. To begin this analysis,
Cannon Design was contacted and a schedule of the current steel construction was
process was requested. Although the actual project schedule could not be
obtained, an early schematic design schedule was provided. This schedule was
input into Microsoft Project, and is shown in Figure R below. As it can be seen,
the construction of the steel structure was schedule to span from Monday, January
1, 2010 to Tuesday, October 5, 2010, for a total of 192 days, or about nine
months.
Figure R – Original Steel Construction Schedule (Obtained from Cannon Design)
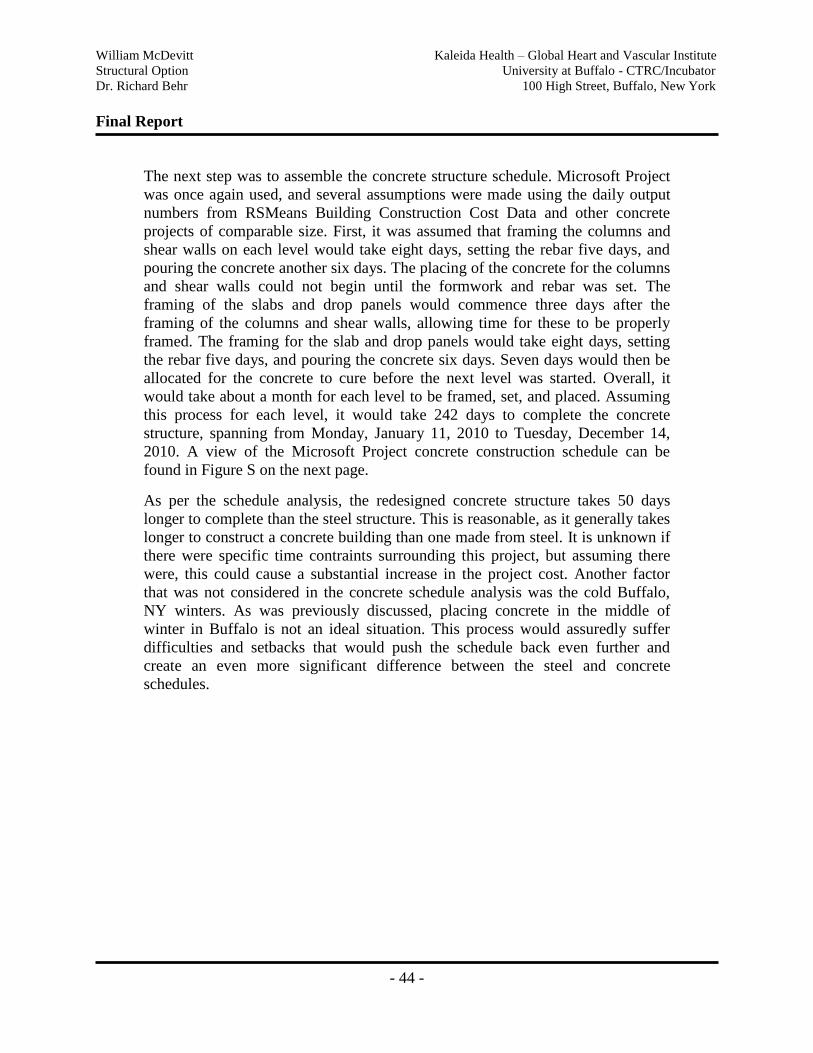
William McDevitt Kaleida Health – Global Heart and Vascular Institute
Structural Option University at Buffalo - CTRC/Incubator
Dr. Richard Behr 100 High Street, Buffalo, New York
Final Report
- 44 -
The next step was to assemble the concrete structure schedule. Microsoft Project
was once again used, and several assumptions were made using the daily output
numbers from RSMeans Building Construction Cost Data and other concrete
projects of comparable size. First, it was assumed that framing the columns and
shear walls on each level would take eight days, setting the rebar five days, and
pouring the concrete another six days. The placing of the concrete for the columns
and shear walls could not begin until the formwork and rebar was set. The
framing of the slabs and drop panels would commence three days after the
framing of the columns and shear walls, allowing time for these to be properly
framed. The framing for the slab and drop panels would take eight days, setting
the rebar five days, and pouring the concrete six days. Seven days would then be
allocated for the concrete to cure before the next level was started. Overall, it
would take about a month for each level to be framed, set, and placed. Assuming
this process for each level, it would take 242 days to complete the concrete
structure, spanning from Monday, January 11, 2010 to Tuesday, December 14,
2010. A view of the Microsoft Project concrete construction schedule can be
found in Figure S on the next page.
As per the schedule analysis, the redesigned concrete structure takes 50 days
longer to complete than the steel structure. This is reasonable, as it generally takes
longer to construct a concrete building than one made from steel. It is unknown if
there were specific time contraints surrounding this project, but assuming there
were, this could cause a substantial increase in the project cost. Another factor
that was not considered in the concrete schedule analysis was the cold Buffalo,
NY winters. As was previously discussed, placing concrete in the middle of
winter in Buffalo is not an ideal situation. This process would assuredly suffer
difficulties and setbacks that would push the schedule back even further and
create an even more significant difference between the steel and concrete
schedules.
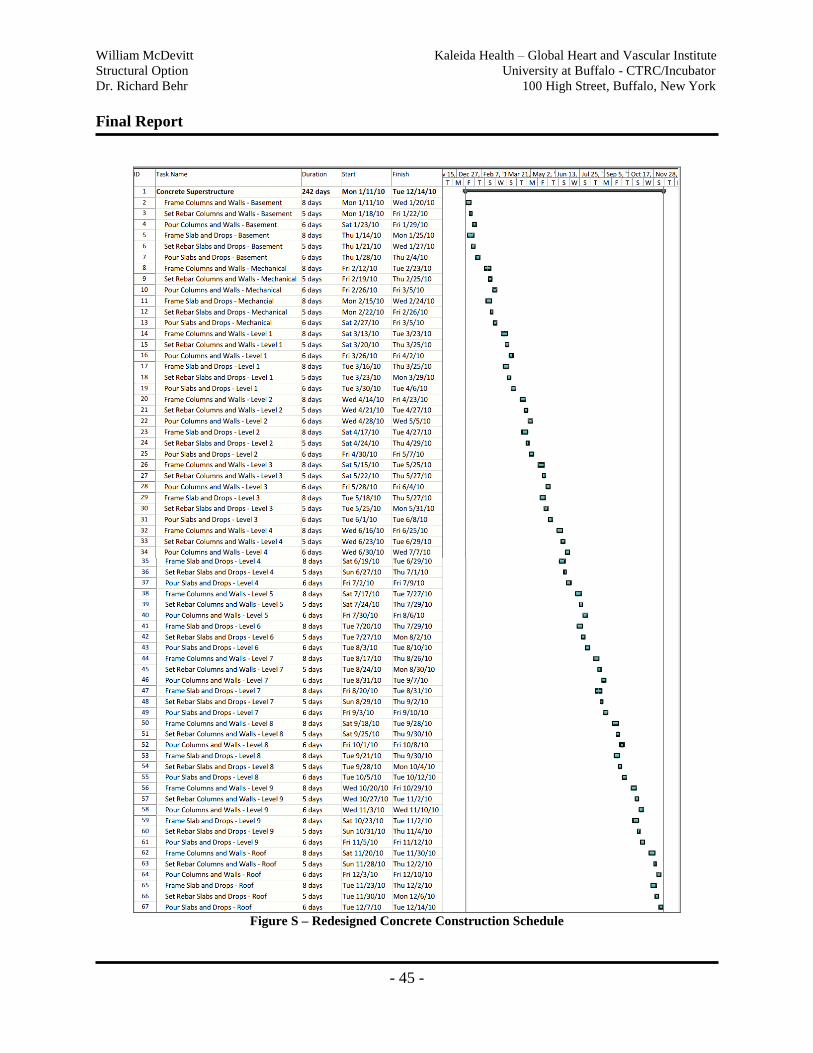
William McDevitt Kaleida Health – Global Heart and Vascular Institute
Structural Option University at Buffalo - CTRC/Incubator
Dr. Richard Behr 100 High Street, Buffalo, New York
Final Report
- 45 -
Figure S – Redesigned Concrete Construction Schedule
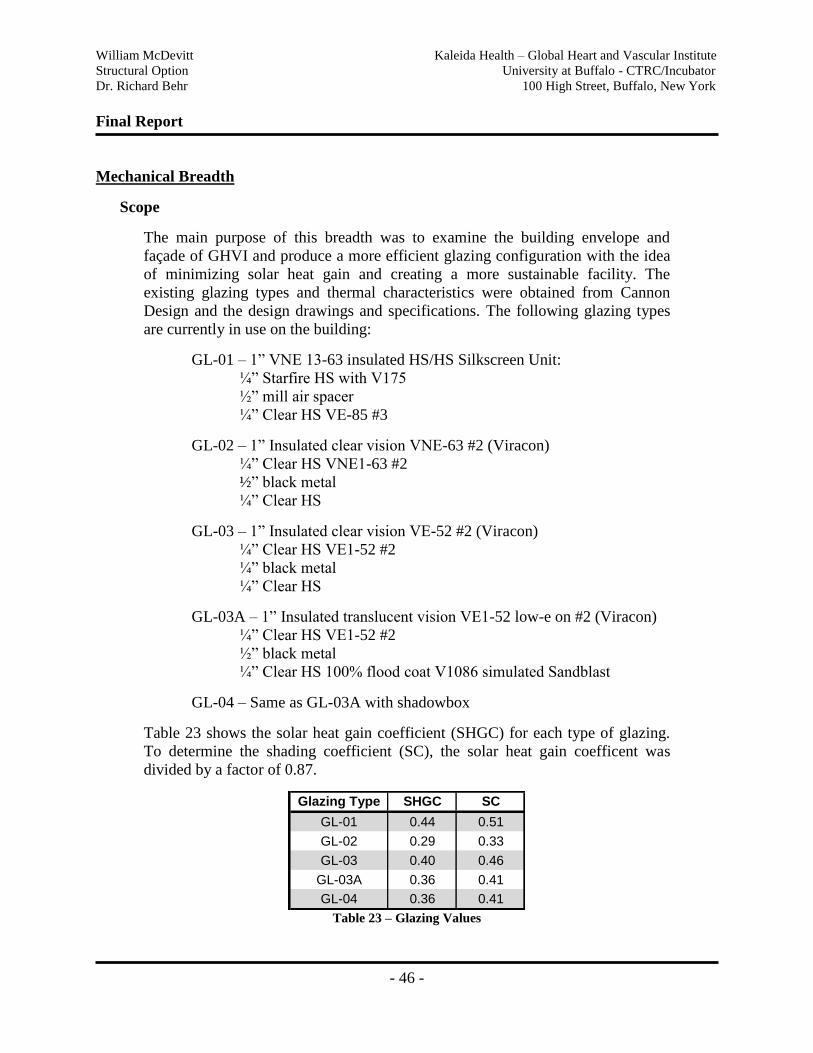
William McDevitt Kaleida Health – Global Heart and Vascular Institute
Structural Option University at Buffalo - CTRC/Incubator
Dr. Richard Behr 100 High Street, Buffalo, New York
Final Report
- 46 -
Mechanical Breadth
Scope
The main purpose of this breadth was to examine the building envelope and
façade of GHVI and produce a more efficient glazing configuration with the idea
of minimizing solar heat gain and creating a more sustainable facility. The
existing glazing types and thermal characteristics were obtained from Cannon
Design and the design drawings and specifications. The following glazing types
are currently in use on the building:
GL-01 – 1” VNE 13-63 insulated HS/HS Silkscreen Unit:
¼” Starfire HS with V175
½” mill air spacer
¼” Clear HS VE-85 #3
GL-02 – 1” Insulated clear vision VNE-63 #2 (Viracon)
¼” Clear HS VNE1-63 #2
½” black metal
¼” Clear HS
GL-03 – 1” Insulated clear vision VE-52 #2 (Viracon)
¼” Clear HS VE1-52 #2
¼” black metal
¼” Clear HS
GL-03A – 1” Insulated translucent vision VE1-52 low-e on #2 (Viracon)
¼” Clear HS VE1-52 #2
½” black metal
¼” Clear HS 100% flood coat V1086 simulated Sandblast
GL-04 – Same as GL-03A with shadowbox
Table 23 shows the solar heat gain coefficient (SHGC) for each type of glazing.
To determine the shading coefficient (SC), the solar heat gain coefficent was
divided by a factor of 0.87.
Glazing Type SHGC SC
GL-01 0.44 0.51
GL-02 0.29 0.33
GL-03 0.40 0.46
GL-03A 0.36 0.41
GL-04 0.36 0.41 Table 23 – Glazing Values
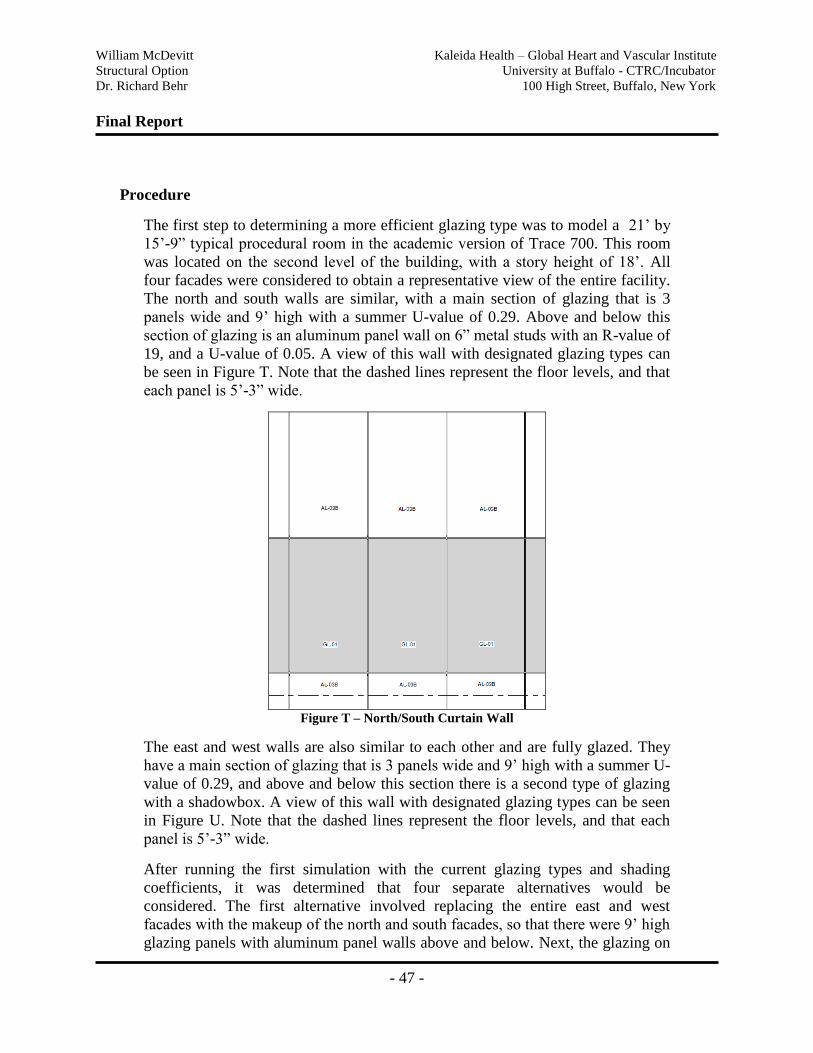
William McDevitt Kaleida Health – Global Heart and Vascular Institute
Structural Option University at Buffalo - CTRC/Incubator
Dr. Richard Behr 100 High Street, Buffalo, New York
Final Report
- 47 -
Procedure
The first step to determining a more efficient glazing type was to model a 21‟ by
15‟-9” typical procedural room in the academic version of Trace 700. This room
was located on the second level of the building, with a story height of 18‟. All
four facades were considered to obtain a representative view of the entire facility.
The north and south walls are similar, with a main section of glazing that is 3
panels wide and 9‟ high with a summer U-value of 0.29. Above and below this
section of glazing is an aluminum panel wall on 6” metal studs with an R-value of
19, and a U-value of 0.05. A view of this wall with designated glazing types can
be seen in Figure T. Note that the dashed lines represent the floor levels, and that
each panel is 5‟-3” wide.
Figure T – North/South Curtain Wall
The east and west walls are also similar to each other and are fully glazed. They
have a main section of glazing that is 3 panels wide and 9‟ high with a summer U-
value of 0.29, and above and below this section there is a second type of glazing
with a shadowbox. A view of this wall with designated glazing types can be seen
in Figure U. Note that the dashed lines represent the floor levels, and that each
panel is 5‟-3” wide.
After running the first simulation with the current glazing types and shading
coefficients, it was determined that four separate alternatives would be
considered. The first alternative involved replacing the entire east and west
facades with the makeup of the north and south facades, so that there were 9‟ high
glazing panels with aluminum panel walls above and below. Next, the glazing on
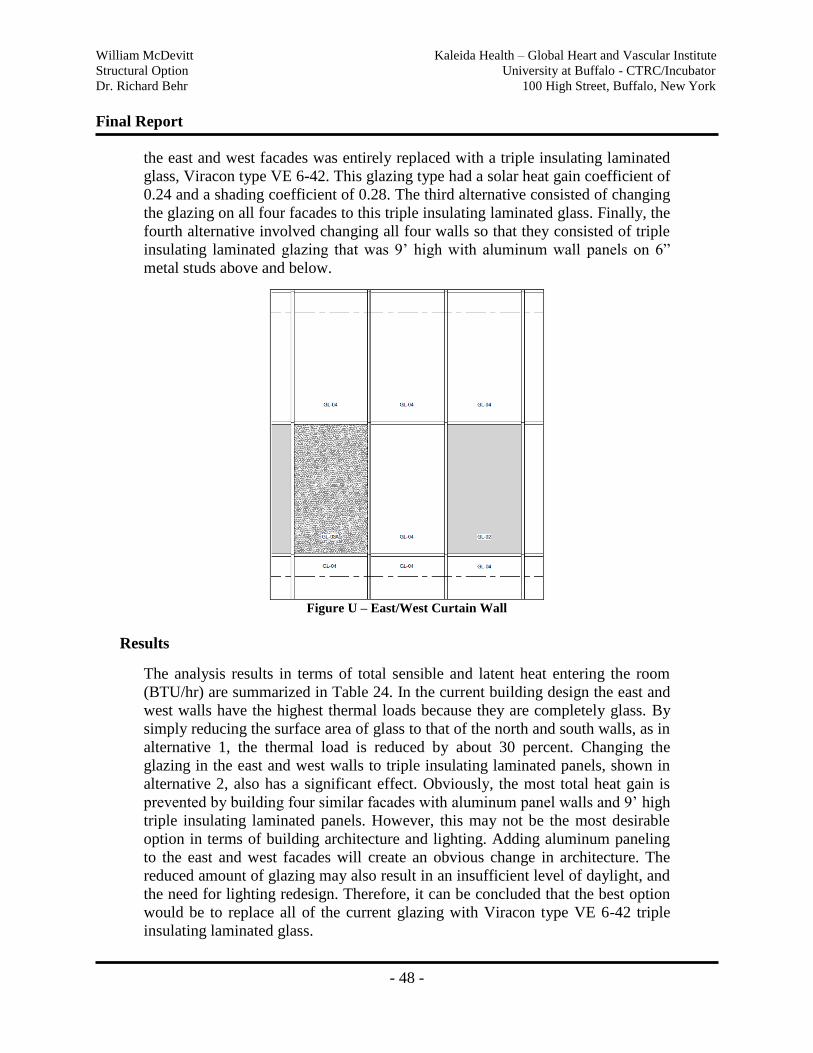
William McDevitt Kaleida Health – Global Heart and Vascular Institute
Structural Option University at Buffalo - CTRC/Incubator
Dr. Richard Behr 100 High Street, Buffalo, New York
Final Report
- 48 -
the east and west facades was entirely replaced with a triple insulating laminated
glass, Viracon type VE 6-42. This glazing type had a solar heat gain coefficient of
0.24 and a shading coefficient of 0.28. The third alternative consisted of changing
the glazing on all four facades to this triple insulating laminated glass. Finally, the
fourth alternative involved changing all four walls so that they consisted of triple
insulating laminated glazing that was 9‟ high with aluminum wall panels on 6”
metal studs above and below.
Figure U – East/West Curtain Wall
Results
The analysis results in terms of total sensible and latent heat entering the room
(BTU/hr) are summarized in Table 24. In the current building design the east and
west walls have the highest thermal loads because they are completely glass. By
simply reducing the surface area of glass to that of the north and south walls, as in
alternative 1, the thermal load is reduced by about 30 percent. Changing the
glazing in the east and west walls to triple insulating laminated panels, shown in
alternative 2, also has a significant effect. Obviously, the most total heat gain is
prevented by building four similar facades with aluminum panel walls and 9‟ high
triple insulating laminated panels. However, this may not be the most desirable
option in terms of building architecture and lighting. Adding aluminum paneling
to the east and west facades will create an obvious change in architecture. The
reduced amount of glazing may also result in an insufficient level of daylight, and
the need for lighting redesign. Therefore, it can be concluded that the best option
would be to replace all of the current glazing with Viracon type VE 6-42 triple
insulating laminated glass.
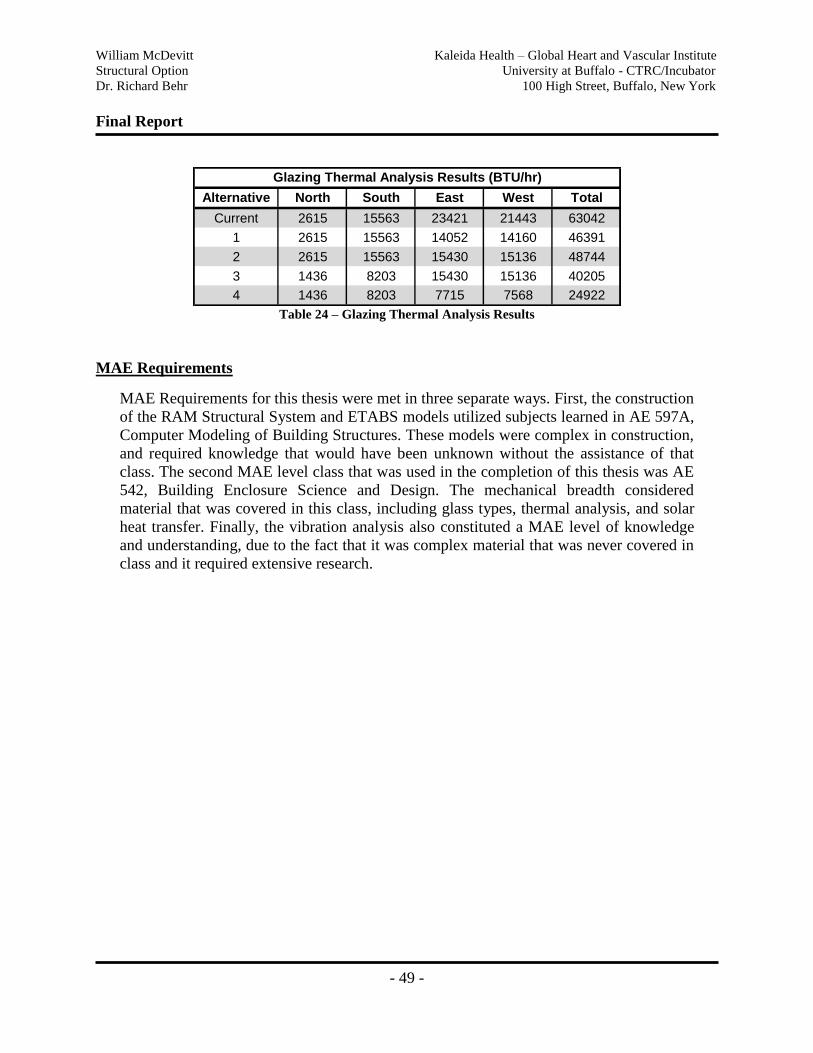
William McDevitt Kaleida Health – Global Heart and Vascular Institute
Structural Option University at Buffalo - CTRC/Incubator
Dr. Richard Behr 100 High Street, Buffalo, New York
Final Report
- 49 -
Alternative North South East West Total
Current 2615 15563 23421 21443 63042
1 2615 15563 14052 14160 46391
2 2615 15563 15430 15136 48744
3 1436 8203 15430 15136 40205
4 1436 8203 7715 7568 24922
Glazing Thermal Analysis Results (BTU/hr)
Table 24 – Glazing Thermal Analysis Results
MAE Requirements
MAE Requirements for this thesis were met in three separate ways. First, the construction
of the RAM Structural System and ETABS models utilized subjects learned in AE 597A,
Computer Modeling of Building Structures. These models were complex in construction,
and required knowledge that would have been unknown without the assistance of that
class. The second MAE level class that was used in the completion of this thesis was AE
542, Building Enclosure Science and Design. The mechanical breadth considered
material that was covered in this class, including glass types, thermal analysis, and solar
heat transfer. Finally, the vibration analysis also constituted a MAE level of knowledge
and understanding, due to the fact that it was complex material that was never covered in
class and it required extensive research.
William McDevitt Kaleida Health – Global Heart and Vascular Institute
Structural Option University at Buffalo - CTRC/Incubator
Dr. Richard Behr 100 High Street, Buffalo, New York
Final Report
- 50 -
Conclusion
The main goal of this thesis was to complete the design process of a concrete building
in the hope that it would prove to be a more cost effective alternative to its steel
counterpart. Although the concrete structure was found to be about $300,000 less
expensive, several factors must be considered before making a conclusion.
First, the redesigned structure was found to be inadequate when it came to the
vibrational velocity requirements. Fixing this problem could impose quite a large
cost.
Second, the schedule for the concrete building was almost two months longer than the
schedule for the steel building. Any deadlines that would not be met could result in
substantial fines.
And last of all, concrete construction is extremely difficult during the long, cold
winters in Buffalo, NY. Added cost would almost certainly be accrued due to the
demands of cold weather concreting.
In the end, it seems as though the current steel building is the more economical
design, and the correct solution for this Buffalo hospital. Although the main thesis
goal was not accomplished, the entire process in itself was insightful and enjoyable,
and should therefore be labeled a success.
William McDevitt Kaleida Health – Global Heart and Vascular Institute
Structural Option University at Buffalo - CTRC/Incubator
Dr. Richard Behr 100 High Street, Buffalo, New York
Final Report
- 51 -
Appendix
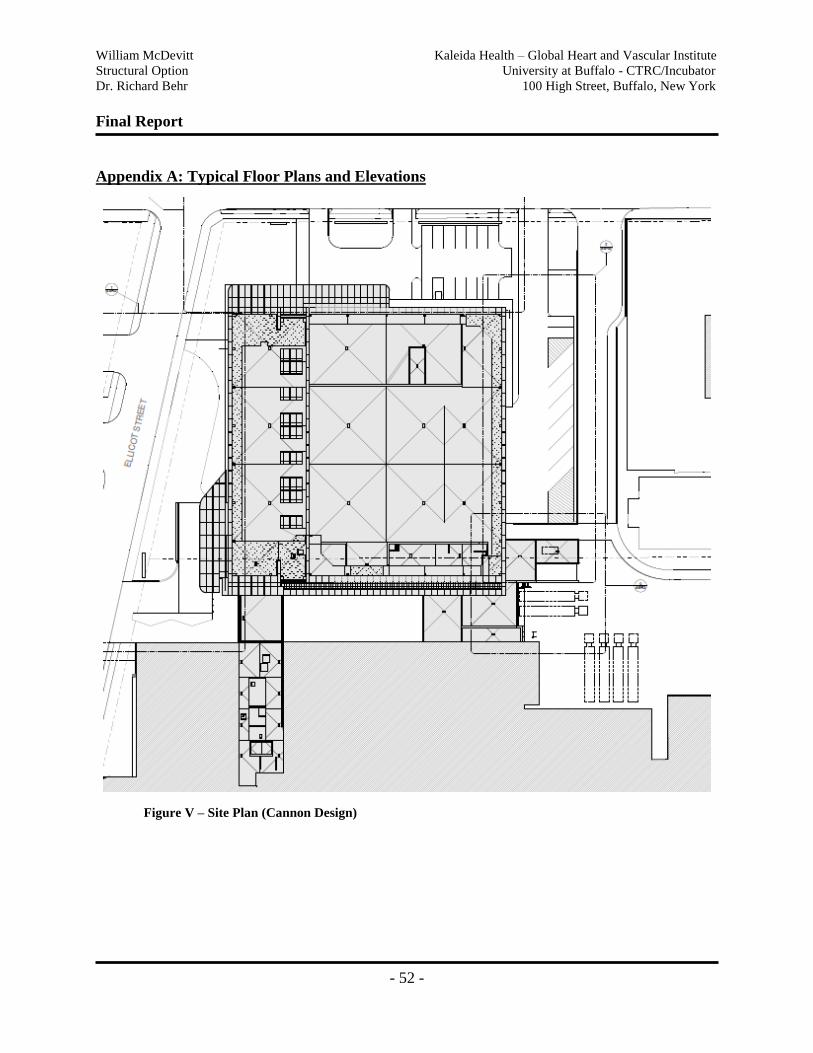
William McDevitt Kaleida Health – Global Heart and Vascular Institute
Structural Option University at Buffalo - CTRC/Incubator
Dr. Richard Behr 100 High Street, Buffalo, New York
Final Report
- 52 -
Appendix A: Typical Floor Plans and Elevations
Figure V – Site Plan (Cannon Design)
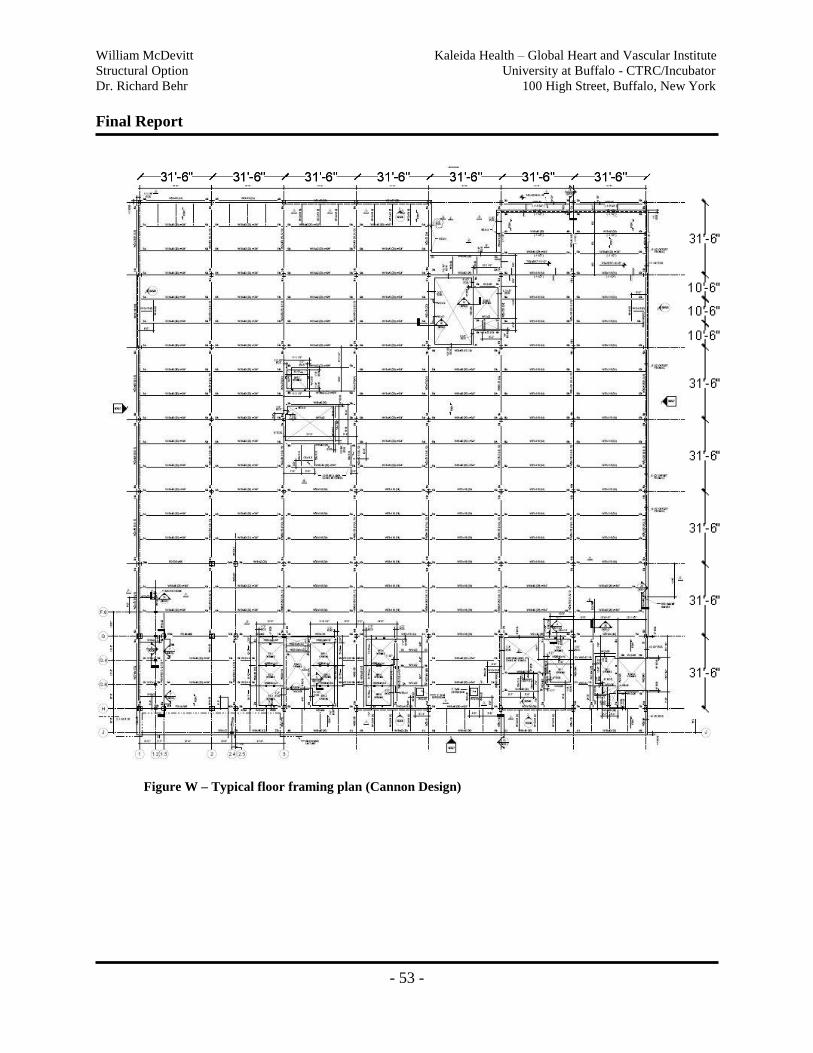
William McDevitt Kaleida Health – Global Heart and Vascular Institute
Structural Option University at Buffalo - CTRC/Incubator
Dr. Richard Behr 100 High Street, Buffalo, New York
Final Report
- 53 -
Figure W – Typical floor framing plan (Cannon Design)
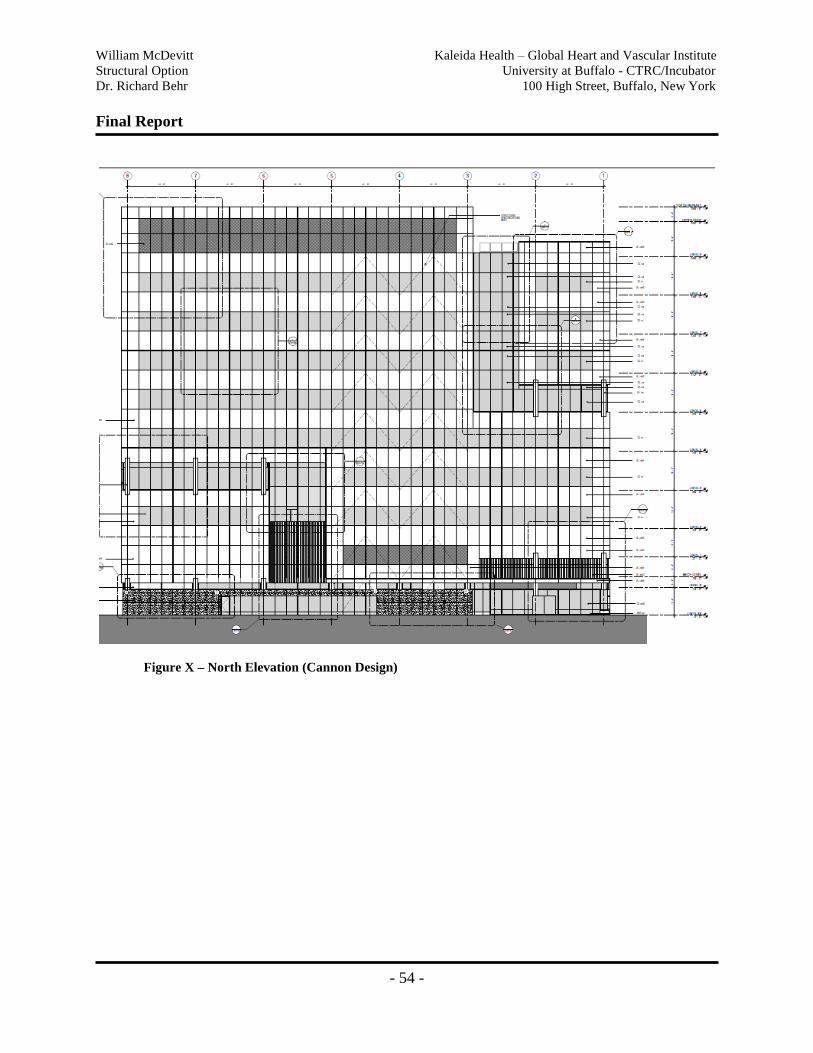
William McDevitt Kaleida Health – Global Heart and Vascular Institute
Structural Option University at Buffalo - CTRC/Incubator
Dr. Richard Behr 100 High Street, Buffalo, New York
Final Report
- 54 -
Figure X – North Elevation (Cannon Design)
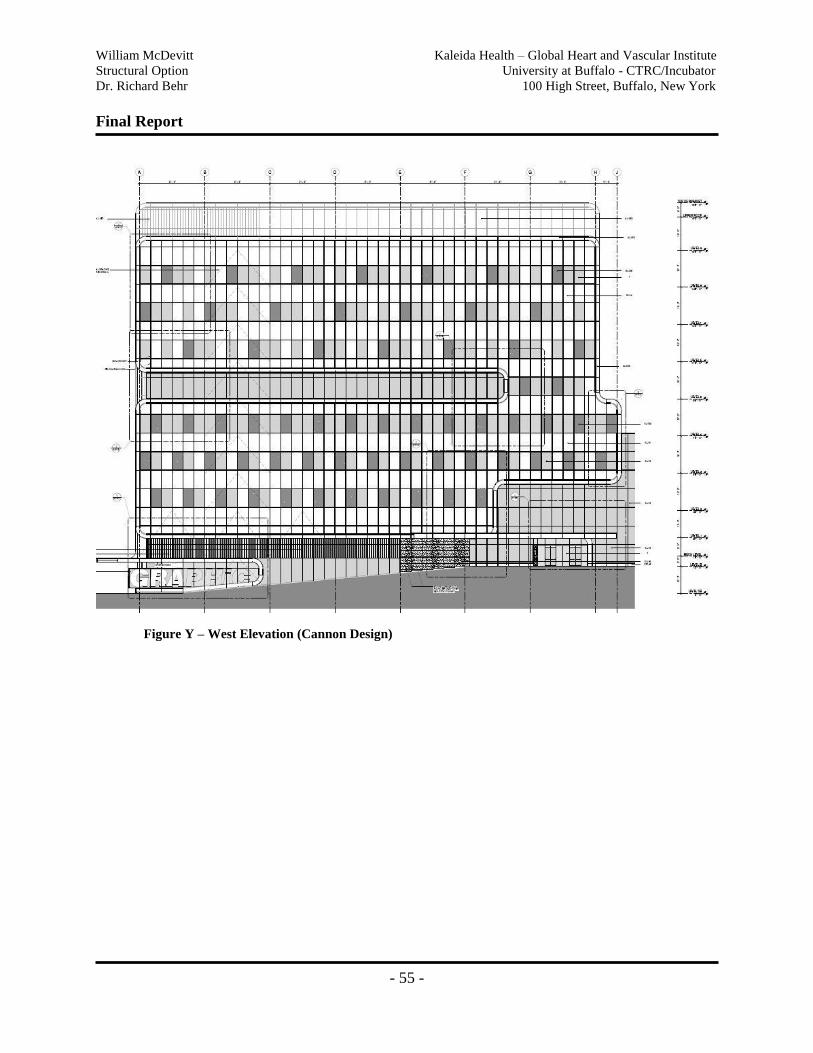
William McDevitt Kaleida Health – Global Heart and Vascular Institute
Structural Option University at Buffalo - CTRC/Incubator
Dr. Richard Behr 100 High Street, Buffalo, New York
Final Report
- 55 -
Figure Y – West Elevation (Cannon Design)
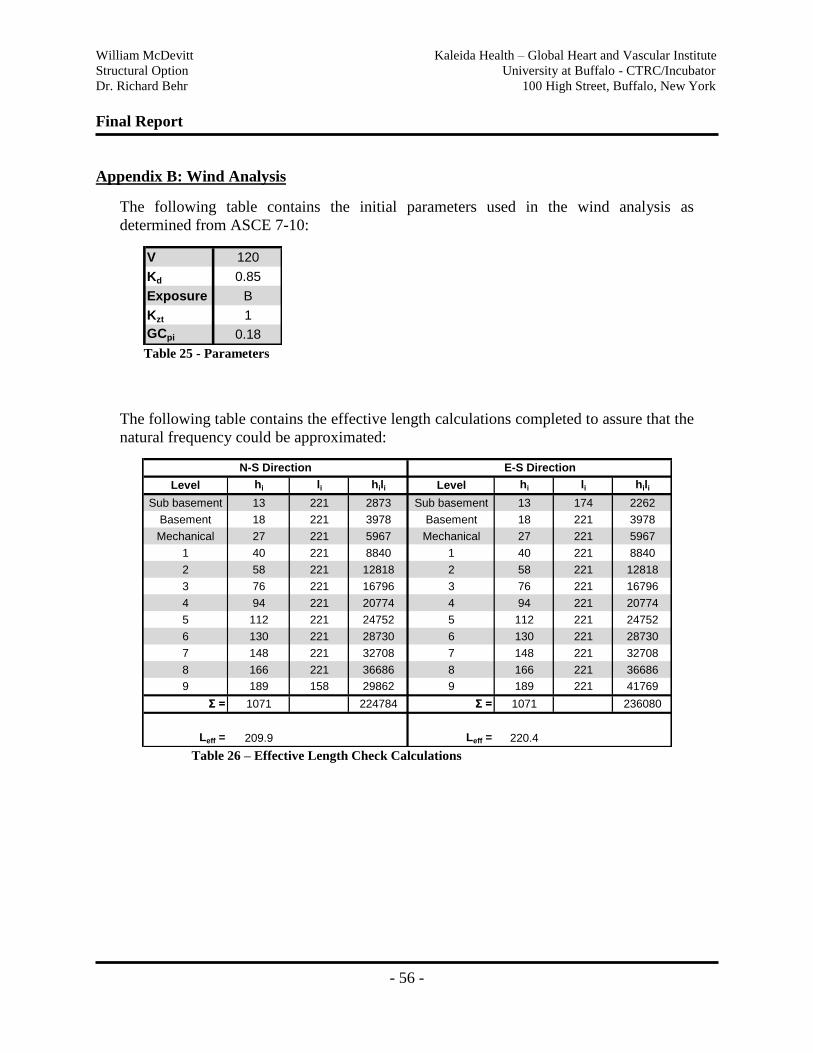
William McDevitt Kaleida Health – Global Heart and Vascular Institute
Structural Option University at Buffalo - CTRC/Incubator
Dr. Richard Behr 100 High Street, Buffalo, New York
Final Report
- 56 -
Appendix B: Wind Analysis
The following table contains the initial parameters used in the wind analysis as
determined from ASCE 7-10:
V 120
Kd 0.85
Exposure B
Kzt 1
GCpi 0.18 Table 25 - Parameters
The following table contains the effective length calculations completed to assure that the
natural frequency could be approximated:
Level hi li hili Level hi li hili
Sub basement 13 221 2873 Sub basement 13 174 2262
Basement 18 221 3978 Basement 18 221 3978
Mechanical 27 221 5967 Mechanical 27 221 5967
1 40 221 8840 1 40 221 8840
2 58 221 12818 2 58 221 12818
3 76 221 16796 3 76 221 16796
4 94 221 20774 4 94 221 20774
5 112 221 24752 5 112 221 24752
6 130 221 28730 6 130 221 28730
7 148 221 32708 7 148 221 32708
8 166 221 36686 8 166 221 36686
9 189 158 29862 9 189 221 41769
Σ = 1071 224784 Σ = 1071 236080
Leff = 209.9 Leff = 220.4
N-S Direction E-S Direction
Table 26 – Effective Length Check Calculations
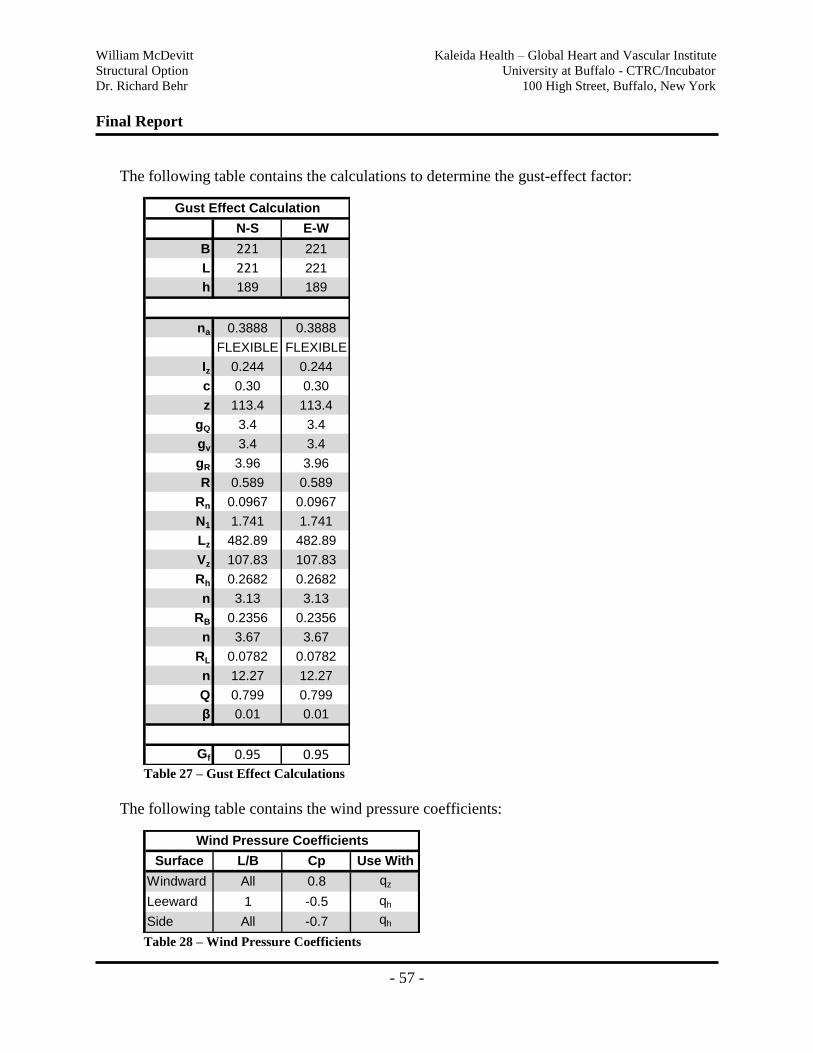
William McDevitt Kaleida Health – Global Heart and Vascular Institute
Structural Option University at Buffalo - CTRC/Incubator
Dr. Richard Behr 100 High Street, Buffalo, New York
Final Report
- 57 -
The following table contains the calculations to determine the gust-effect factor:
N-S E-W
B 221 221
L 221 221
h 189 189
na 0.3888 0.3888
FLEXIBLE FLEXIBLE
Iz 0.244 0.244
c 0.30 0.30
z 113.4 113.4
gQ 3.4 3.4
gv 3.4 3.4
gR 3.96 3.96
R 0.589 0.589
Rn 0.0967 0.0967
N1 1.741 1.741
Lz 482.89 482.89
Vz 107.83 107.83
Rh 0.2682 0.2682
n 3.13 3.13
RB 0.2356 0.2356
n 3.67 3.67
RL 0.0782 0.0782
n 12.27 12.27
Q 0.799 0.799
β 0.01 0.01
Gf 0.95 0.95
Gust Effect Calculation
Table 27 – Gust Effect Calculations
The following table contains the wind pressure coefficients:
Surface L/B Cp Use With
Windward All 0.8 qz
Leeward 1 -0.5 qh
Side All -0.7 qh
Wind Pressure Coefficients
Table 28 – Wind Pressure Coefficients
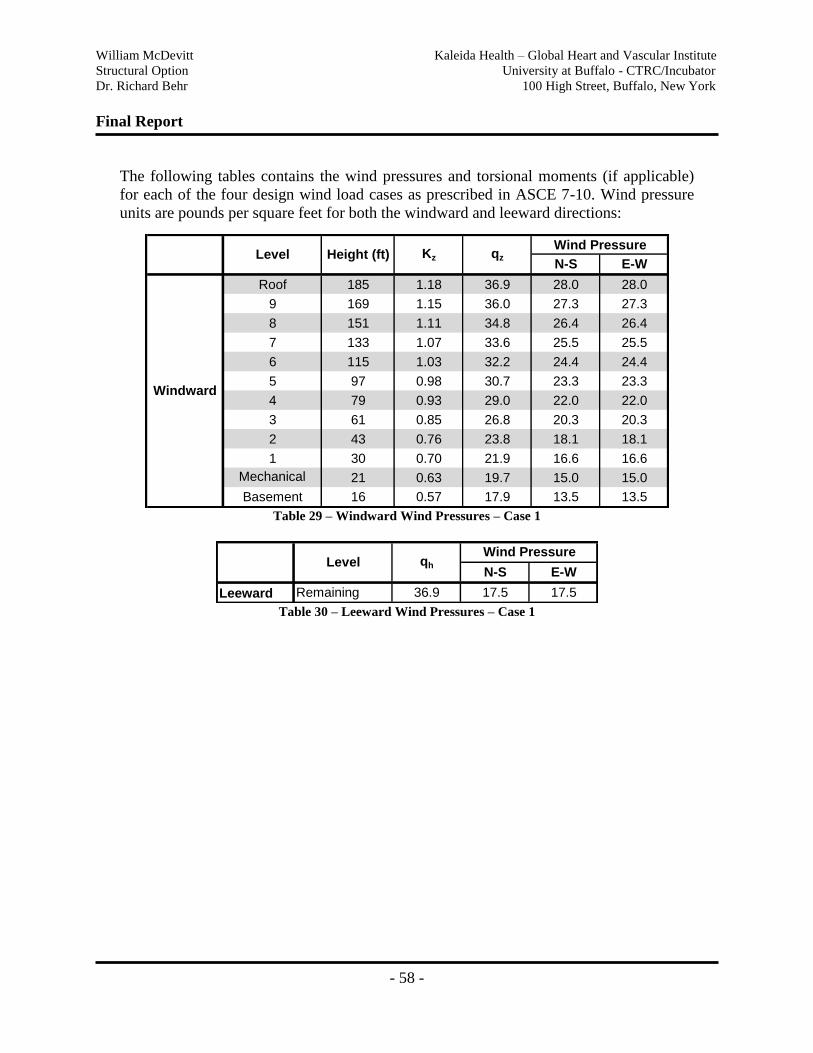
William McDevitt Kaleida Health – Global Heart and Vascular Institute
Structural Option University at Buffalo - CTRC/Incubator
Dr. Richard Behr 100 High Street, Buffalo, New York
Final Report
- 58 -
The following tables contains the wind pressures and torsional moments (if applicable)
for each of the four design wind load cases as prescribed in ASCE 7-10. Wind pressure
units are pounds per square feet for both the windward and leeward directions:
N-S E-W
Roof 185 1.18 36.9 28.0 28.0
9 169 1.15 36.0 27.3 27.3
8 151 1.11 34.8 26.4 26.4
7 133 1.07 33.6 25.5 25.5
6 115 1.03 32.2 24.4 24.4
5 97 0.98 30.7 23.3 23.3
4 79 0.93 29.0 22.0 22.0
3 61 0.85 26.8 20.3 20.3
2 43 0.76 23.8 18.1 18.1
1 30 0.70 21.9 16.6 16.6
Mechanical 21 0.63 19.7 15.0 15.0
Basement 16 0.57 17.9 13.5 13.5
Wind Pressure
Windward
Level Height (ft) Kz qz
Table 29 – Windward Wind Pressures – Case 1
N-S E-W
Leeward Remaining 36.9 17.5 17.5
Level qh
Wind Pressure
Table 30 – Leeward Wind Pressures – Case 1
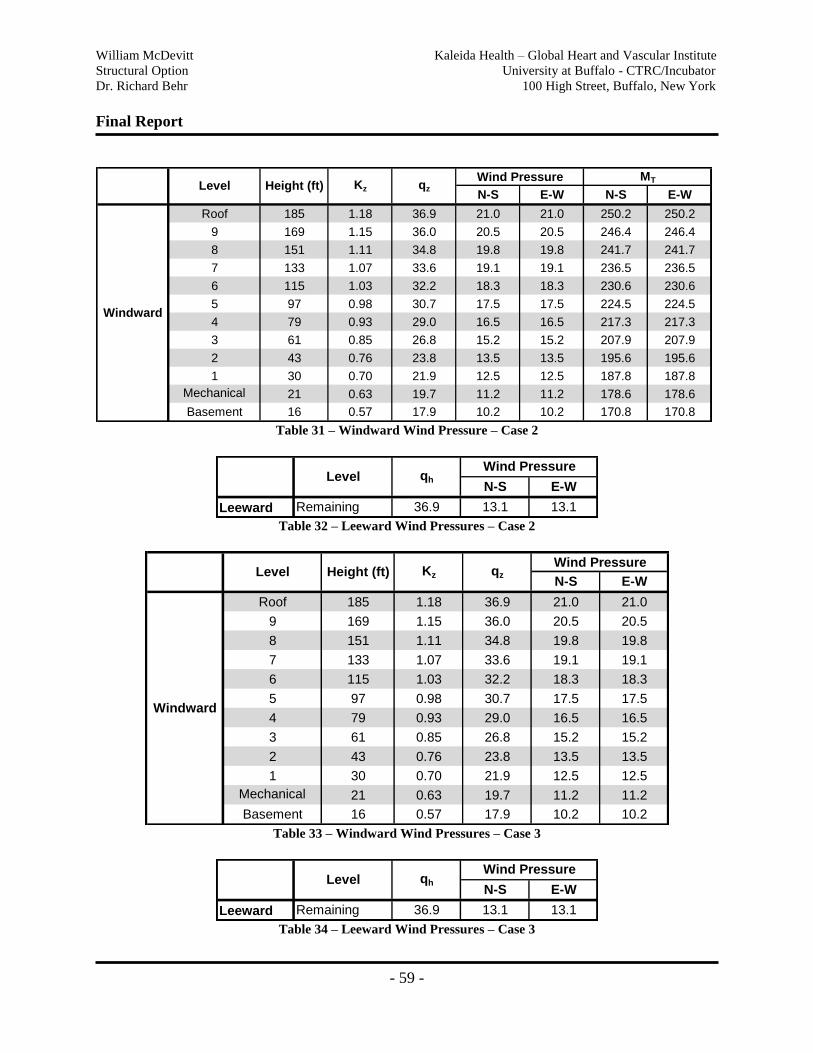
William McDevitt Kaleida Health – Global Heart and Vascular Institute
Structural Option University at Buffalo - CTRC/Incubator
Dr. Richard Behr 100 High Street, Buffalo, New York
Final Report
- 59 -
N-S E-W N-S E-W
Roof 185 1.18 36.9 21.0 21.0 250.2 250.2
9 169 1.15 36.0 20.5 20.5 246.4 246.4
8 151 1.11 34.8 19.8 19.8 241.7 241.7
7 133 1.07 33.6 19.1 19.1 236.5 236.5
6 115 1.03 32.2 18.3 18.3 230.6 230.6
5 97 0.98 30.7 17.5 17.5 224.5 224.5
4 79 0.93 29.0 16.5 16.5 217.3 217.3
3 61 0.85 26.8 15.2 15.2 207.9 207.9
2 43 0.76 23.8 13.5 13.5 195.6 195.6
1 30 0.70 21.9 12.5 12.5 187.8 187.8
Mechanical 21 0.63 19.7 11.2 11.2 178.6 178.6
Basement 16 0.57 17.9 10.2 10.2 170.8 170.8
MTWind Pressure
Windward
Level Height (ft) Kz qz
Table 31 – Windward Wind Pressure – Case 2
N-S E-W
Leeward Remaining 36.9 13.1 13.1
Level qh
Wind Pressure
Table 32 – Leeward Wind Pressures – Case 2
N-S E-W
Roof 185 1.18 36.9 21.0 21.0
9 169 1.15 36.0 20.5 20.5
8 151 1.11 34.8 19.8 19.8
7 133 1.07 33.6 19.1 19.1
6 115 1.03 32.2 18.3 18.3
5 97 0.98 30.7 17.5 17.5
4 79 0.93 29.0 16.5 16.5
3 61 0.85 26.8 15.2 15.2
2 43 0.76 23.8 13.5 13.5
1 30 0.70 21.9 12.5 12.5
Mechanical 21 0.63 19.7 11.2 11.2
Basement 16 0.57 17.9 10.2 10.2
Wind Pressure
Windward
Level Height (ft) Kz qz
Table 33 – Windward Wind Pressures – Case 3
N-S E-W
Leeward Remaining 36.9 13.1 13.1
Level qh
Wind Pressure
Table 34 – Leeward Wind Pressures – Case 3
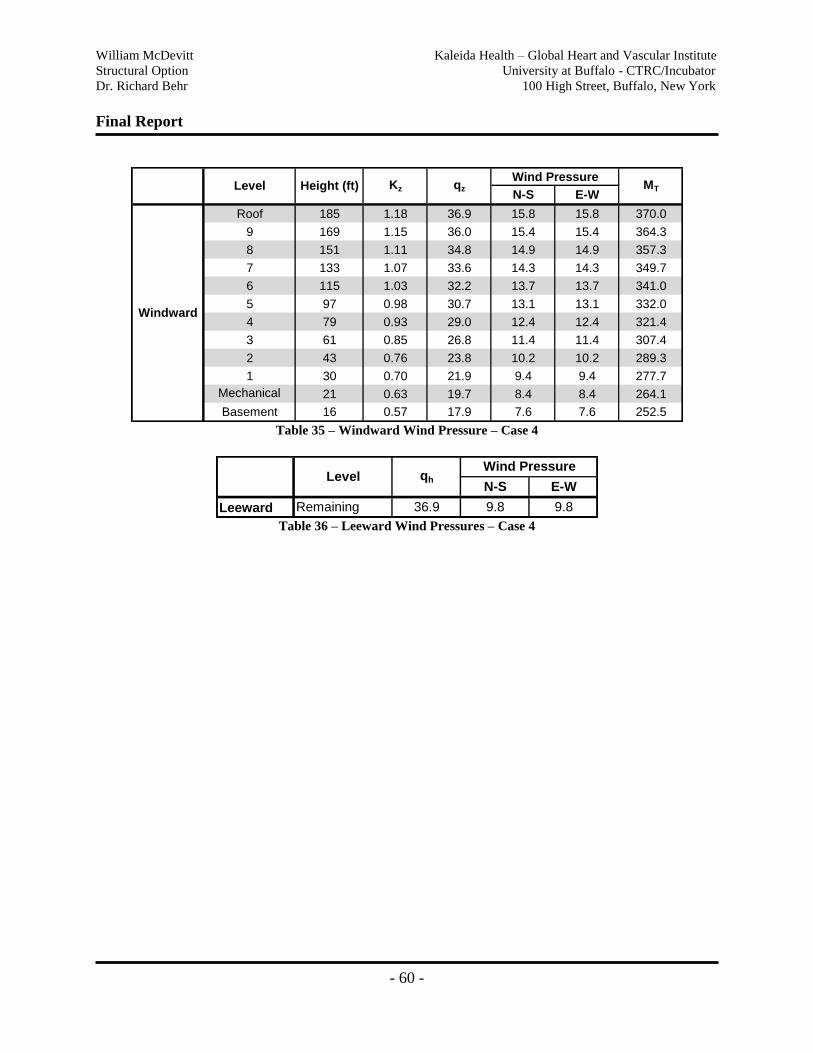
William McDevitt Kaleida Health – Global Heart and Vascular Institute
Structural Option University at Buffalo - CTRC/Incubator
Dr. Richard Behr 100 High Street, Buffalo, New York
Final Report
- 60 -
N-S E-W
Roof 185 1.18 36.9 15.8 15.8 370.0
9 169 1.15 36.0 15.4 15.4 364.3
8 151 1.11 34.8 14.9 14.9 357.3
7 133 1.07 33.6 14.3 14.3 349.7
6 115 1.03 32.2 13.7 13.7 341.0
5 97 0.98 30.7 13.1 13.1 332.0
4 79 0.93 29.0 12.4 12.4 321.4
3 61 0.85 26.8 11.4 11.4 307.4
2 43 0.76 23.8 10.2 10.2 289.3
1 30 0.70 21.9 9.4 9.4 277.7
Mechanical 21 0.63 19.7 8.4 8.4 264.1
Basement 16 0.57 17.9 7.6 7.6 252.5
MT
Wind Pressure
Windward
Level Height (ft) Kz qz
Table 35 – Windward Wind Pressure – Case 4
N-S E-W
Leeward Remaining 36.9 9.8 9.8
Level qh
Wind Pressure
Table 36 – Leeward Wind Pressures – Case 4
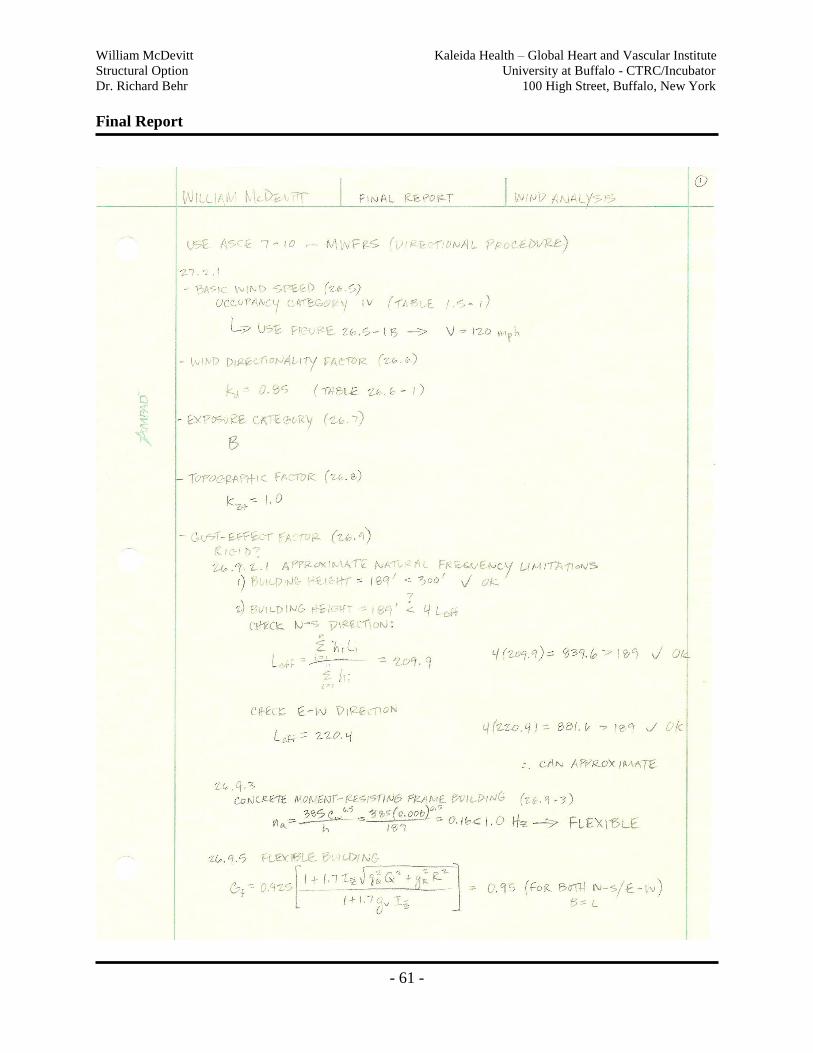
William McDevitt Kaleida Health – Global Heart and Vascular Institute
Structural Option University at Buffalo - CTRC/Incubator
Dr. Richard Behr 100 High Street, Buffalo, New York
Final Report
- 61 -
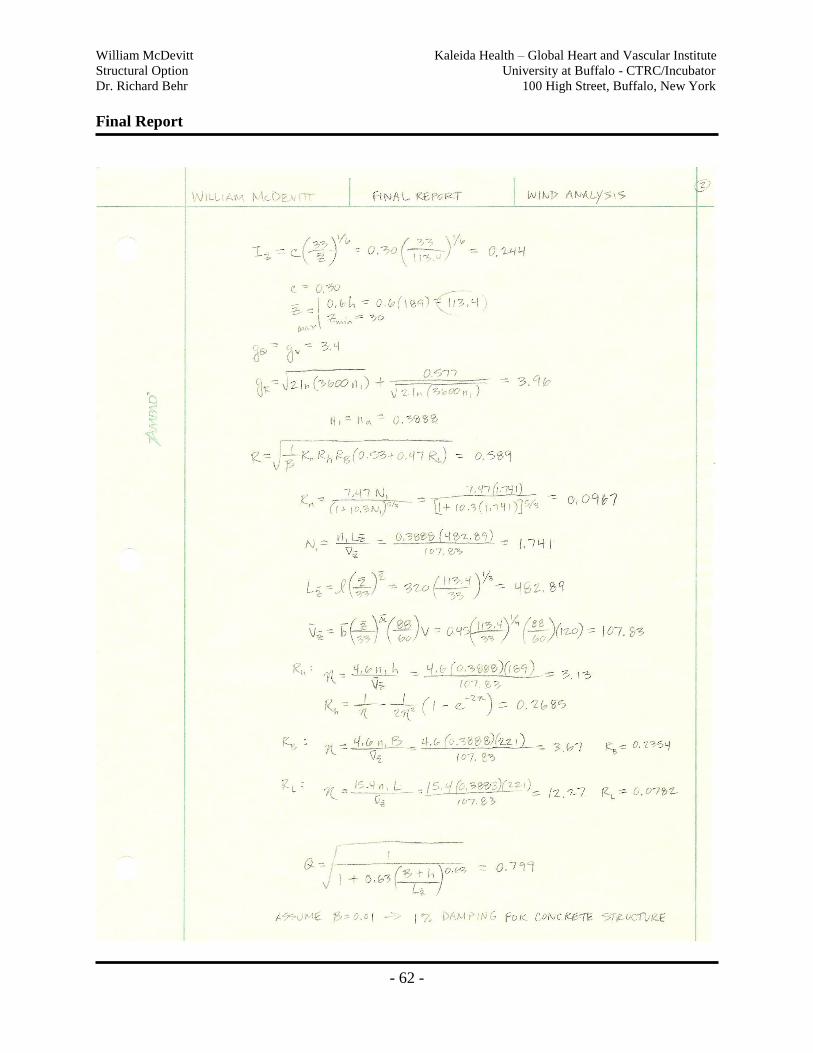
William McDevitt Kaleida Health – Global Heart and Vascular Institute
Structural Option University at Buffalo - CTRC/Incubator
Dr. Richard Behr 100 High Street, Buffalo, New York
Final Report
- 62 -
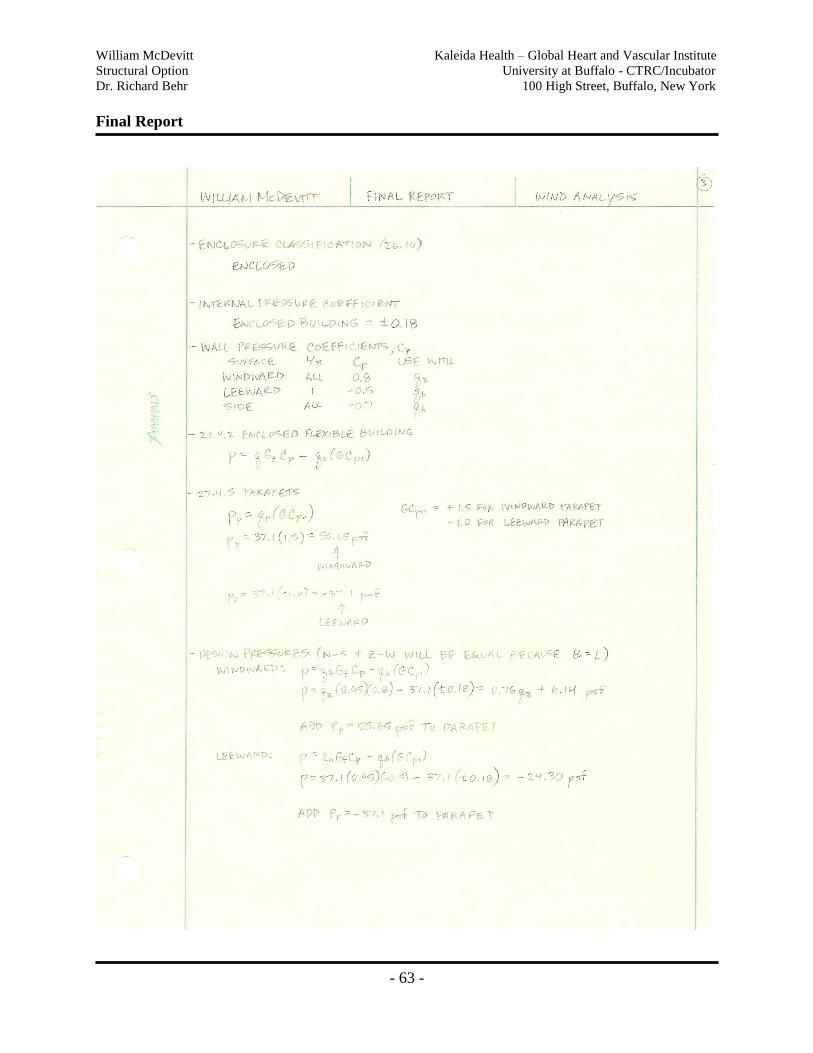
William McDevitt Kaleida Health – Global Heart and Vascular Institute
Structural Option University at Buffalo - CTRC/Incubator
Dr. Richard Behr 100 High Street, Buffalo, New York
Final Report
- 63 -
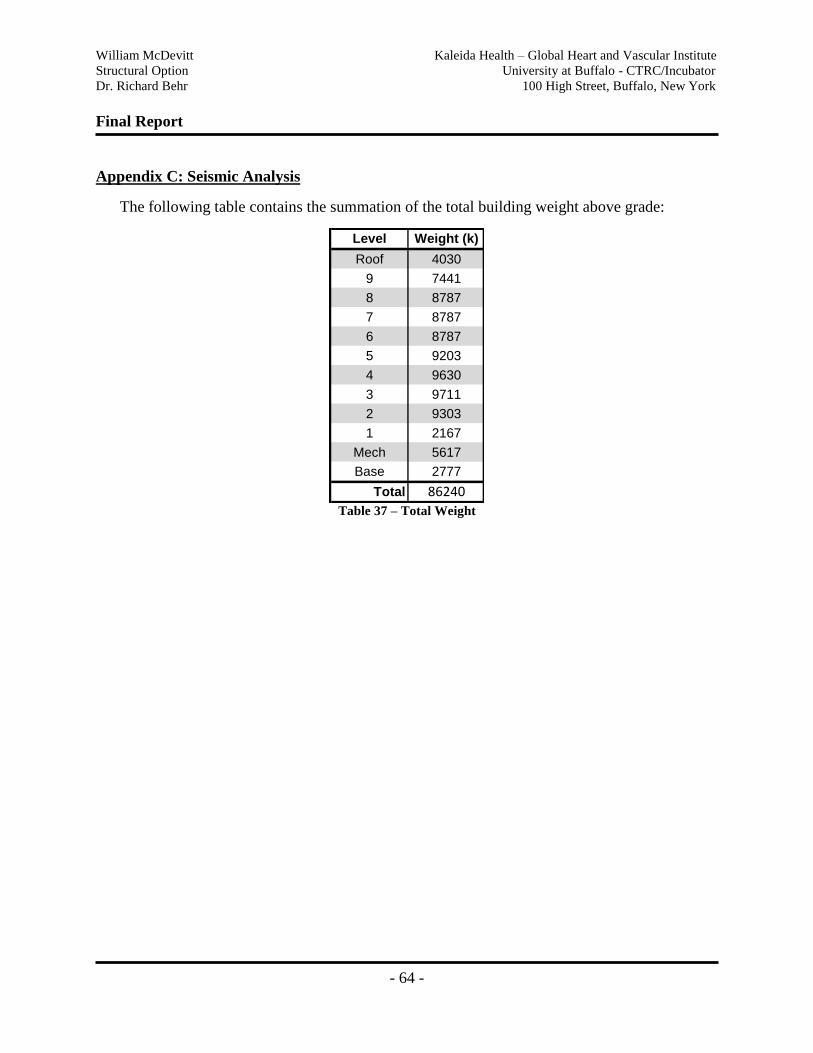
William McDevitt Kaleida Health – Global Heart and Vascular Institute
Structural Option University at Buffalo - CTRC/Incubator
Dr. Richard Behr 100 High Street, Buffalo, New York
Final Report
- 64 -
Appendix C: Seismic Analysis
The following table contains the summation of the total building weight above grade:
Level Weight (k)
Roof 4030
9 7441
8 8787
7 8787
6 8787
5 9203
4 9630
3 9711
2 9303
1 2167
Mech 5617
Base 2777
Total 86240 Table 37 – Total Weight
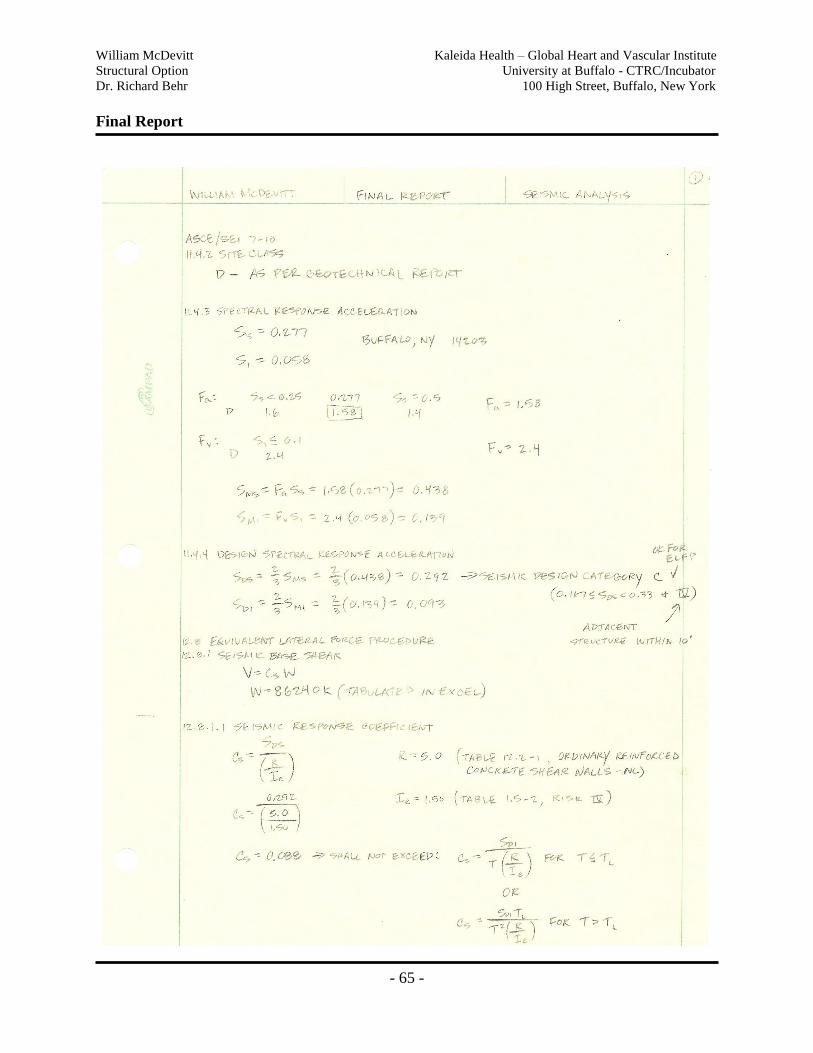
William McDevitt Kaleida Health – Global Heart and Vascular Institute
Structural Option University at Buffalo - CTRC/Incubator
Dr. Richard Behr 100 High Street, Buffalo, New York
Final Report
- 65 -
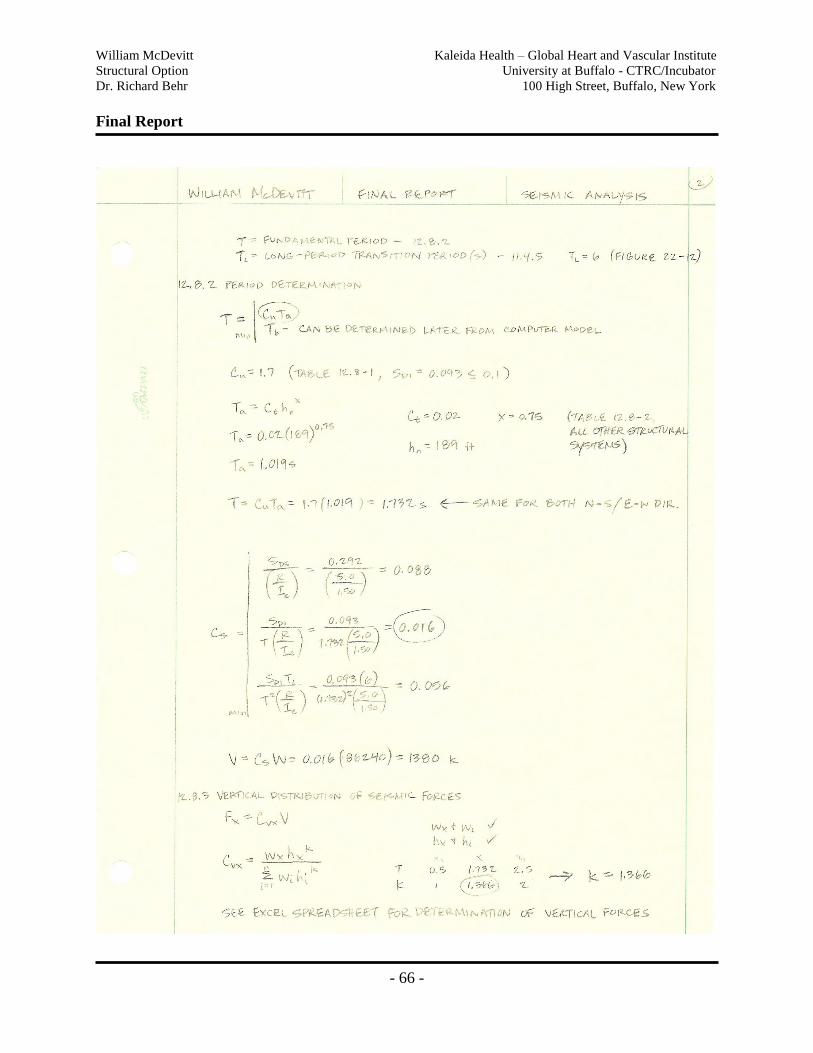
William McDevitt Kaleida Health – Global Heart and Vascular Institute
Structural Option University at Buffalo - CTRC/Incubator
Dr. Richard Behr 100 High Street, Buffalo, New York
Final Report
- 66 -
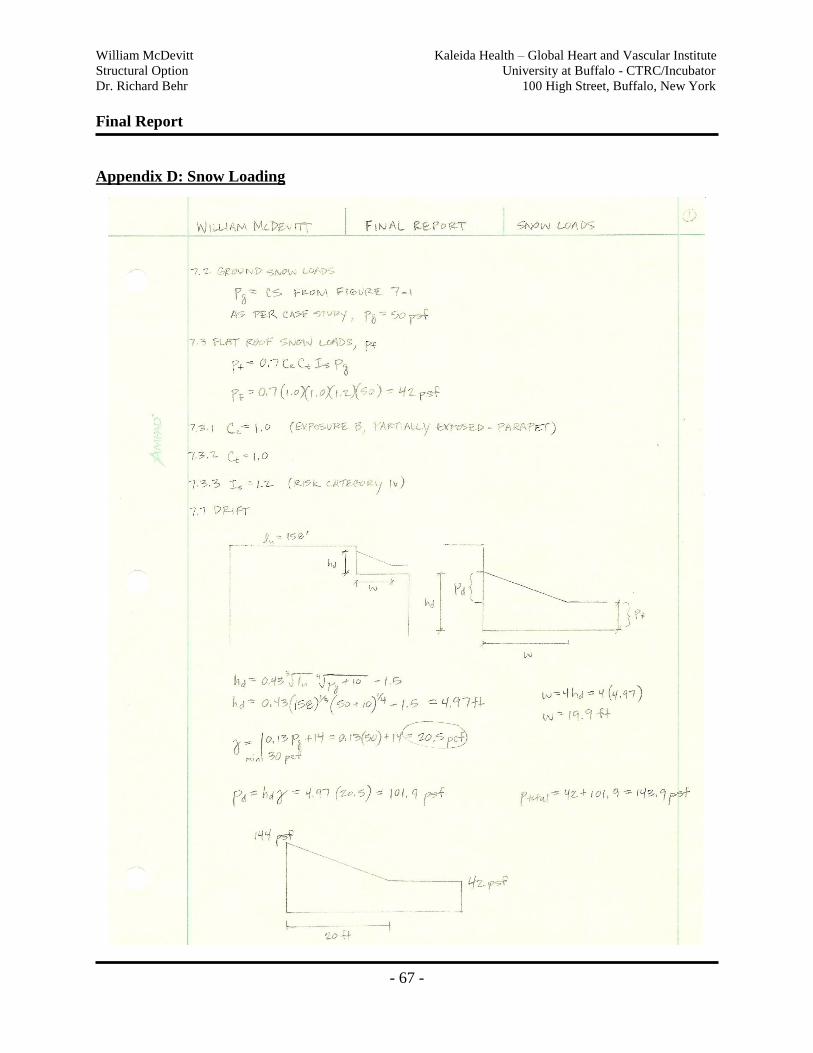
William McDevitt Kaleida Health – Global Heart and Vascular Institute
Structural Option University at Buffalo - CTRC/Incubator
Dr. Richard Behr 100 High Street, Buffalo, New York
Final Report
- 67 -
Appendix D: Snow Loading
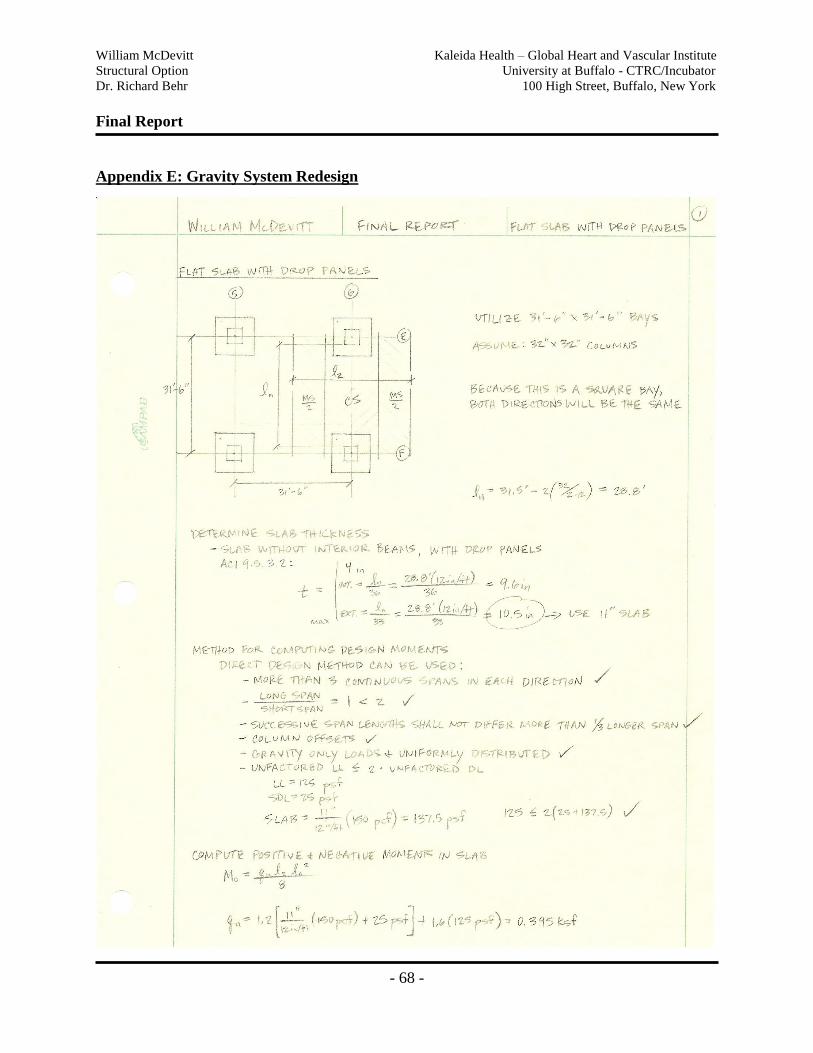
William McDevitt Kaleida Health – Global Heart and Vascular Institute
Structural Option University at Buffalo - CTRC/Incubator
Dr. Richard Behr 100 High Street, Buffalo, New York
Final Report
- 68 -
Appendix E: Gravity System Redesign
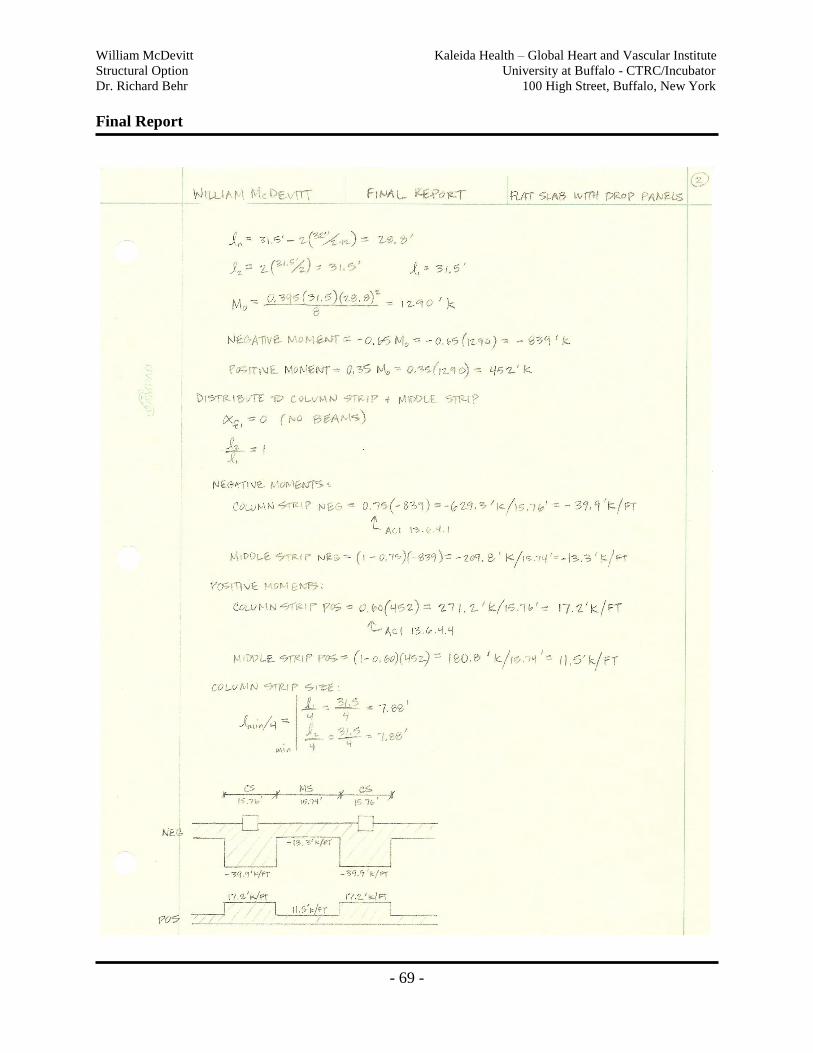
William McDevitt Kaleida Health – Global Heart and Vascular Institute
Structural Option University at Buffalo - CTRC/Incubator
Dr. Richard Behr 100 High Street, Buffalo, New York
Final Report
- 69 -
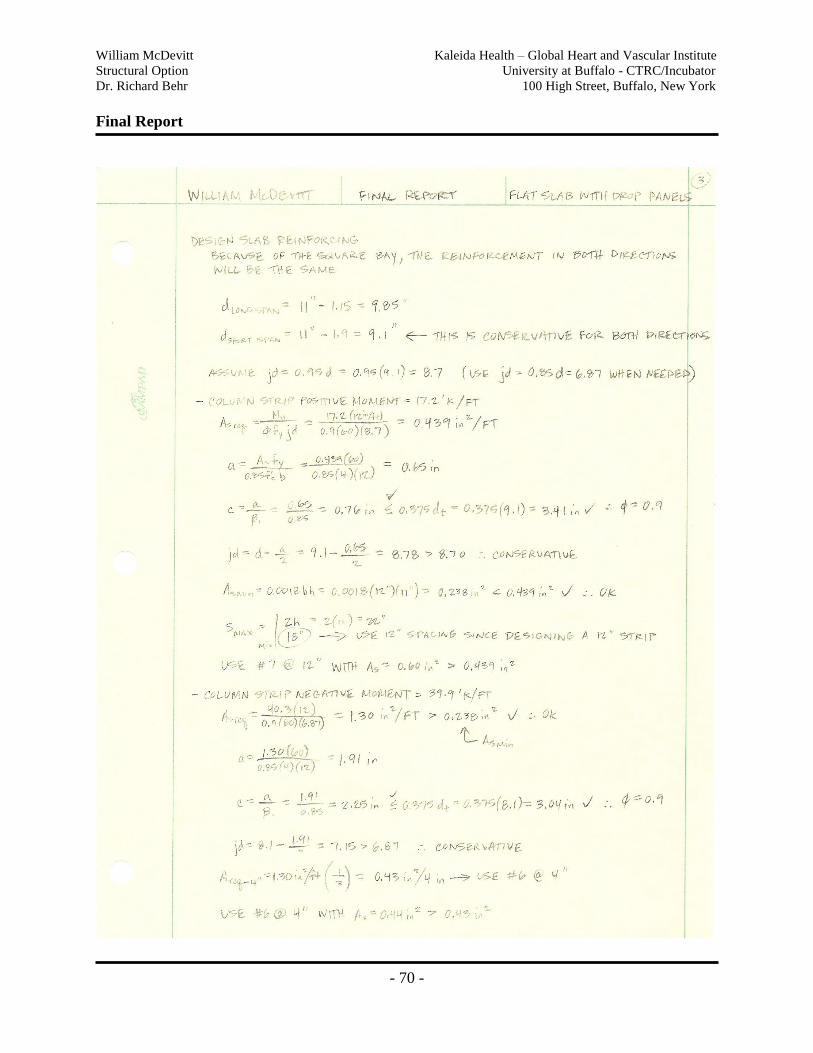
William McDevitt Kaleida Health – Global Heart and Vascular Institute
Structural Option University at Buffalo - CTRC/Incubator
Dr. Richard Behr 100 High Street, Buffalo, New York
Final Report
- 70 -
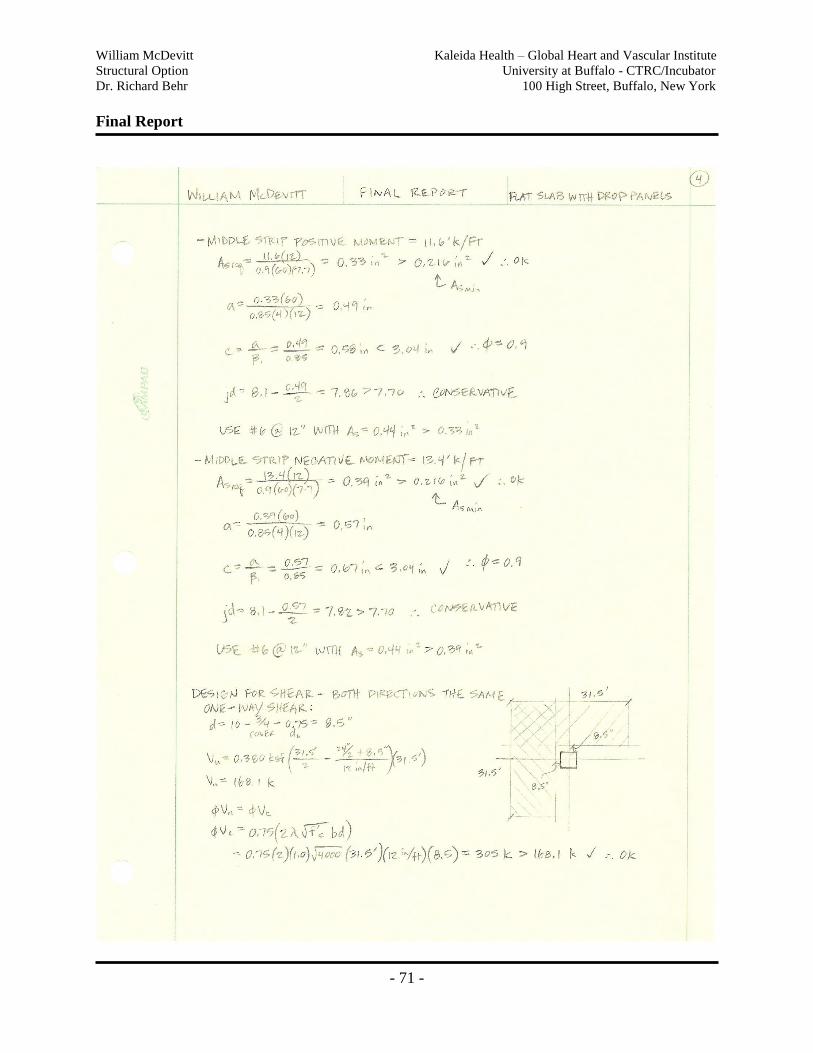
William McDevitt Kaleida Health – Global Heart and Vascular Institute
Structural Option University at Buffalo - CTRC/Incubator
Dr. Richard Behr 100 High Street, Buffalo, New York
Final Report
- 71 -
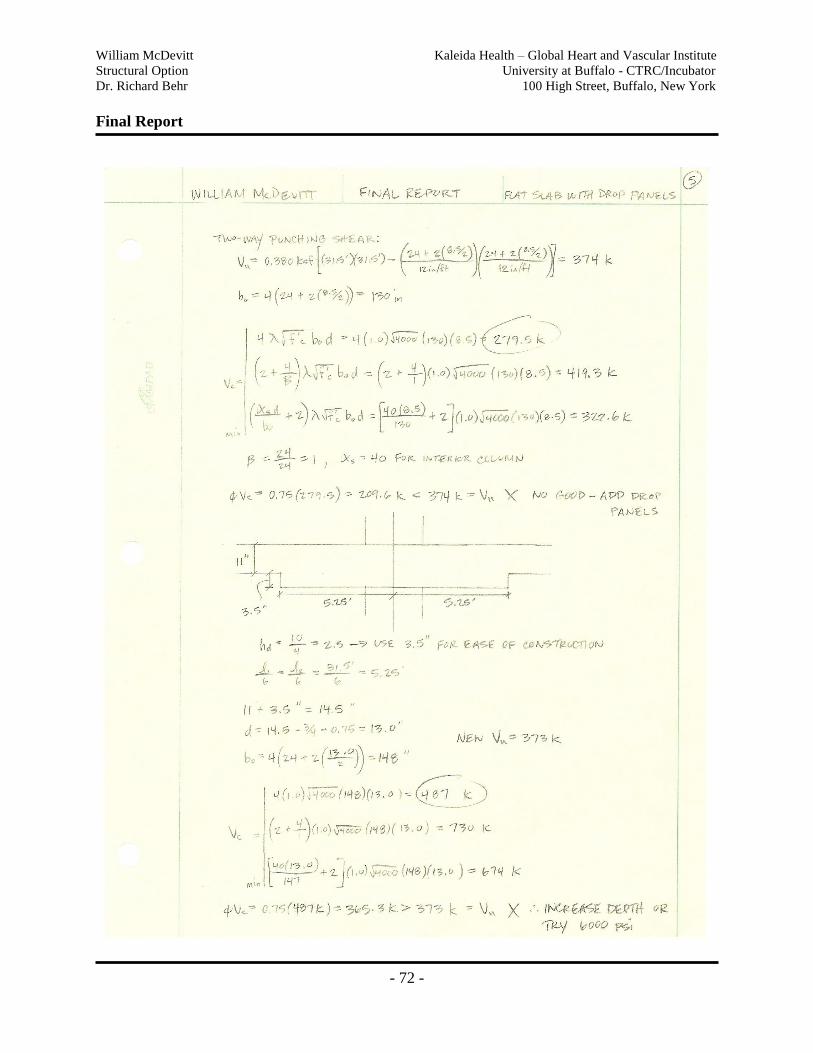
William McDevitt Kaleida Health – Global Heart and Vascular Institute
Structural Option University at Buffalo - CTRC/Incubator
Dr. Richard Behr 100 High Street, Buffalo, New York
Final Report
- 72 -
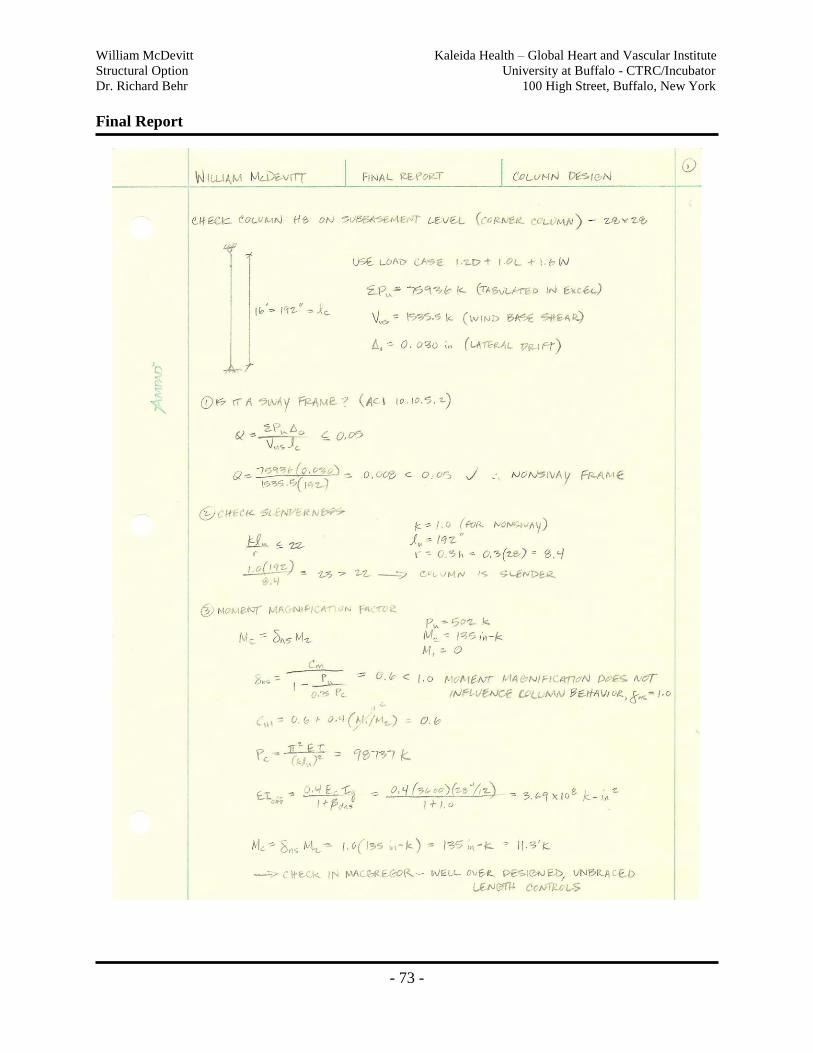
William McDevitt Kaleida Health – Global Heart and Vascular Institute
Structural Option University at Buffalo - CTRC/Incubator
Dr. Richard Behr 100 High Street, Buffalo, New York
Final Report
- 73 -
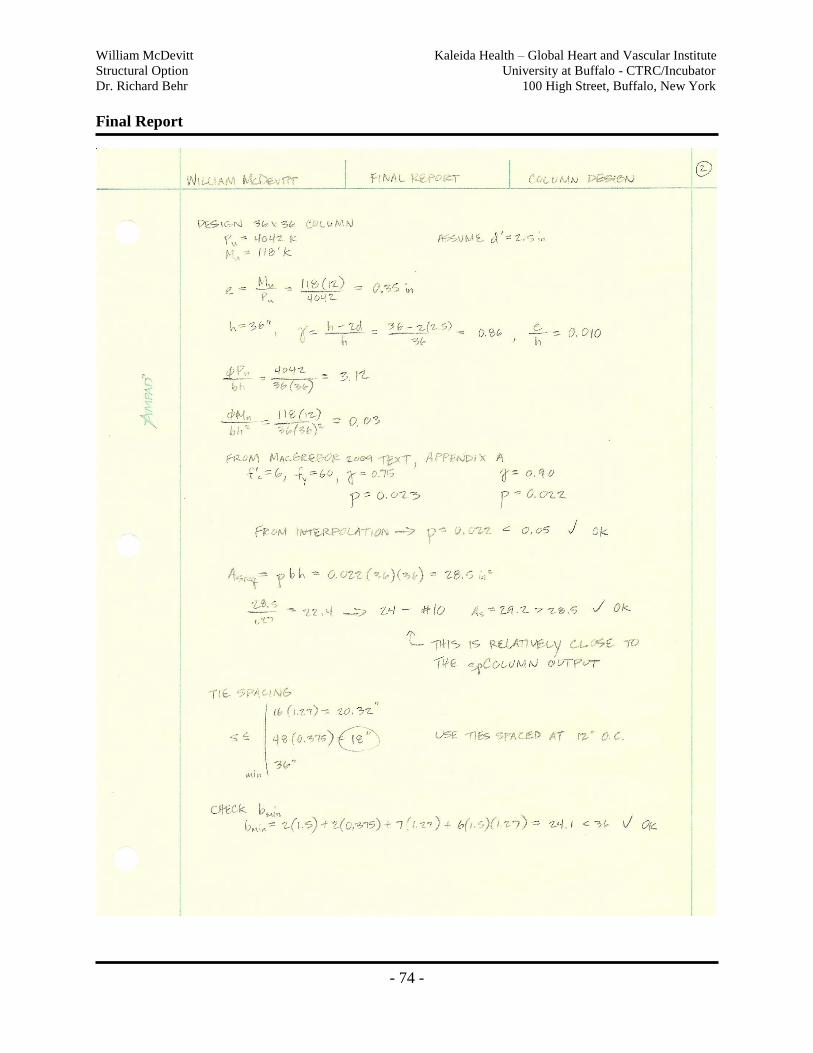
William McDevitt Kaleida Health – Global Heart and Vascular Institute
Structural Option University at Buffalo - CTRC/Incubator
Dr. Richard Behr 100 High Street, Buffalo, New York
Final Report
- 74 -
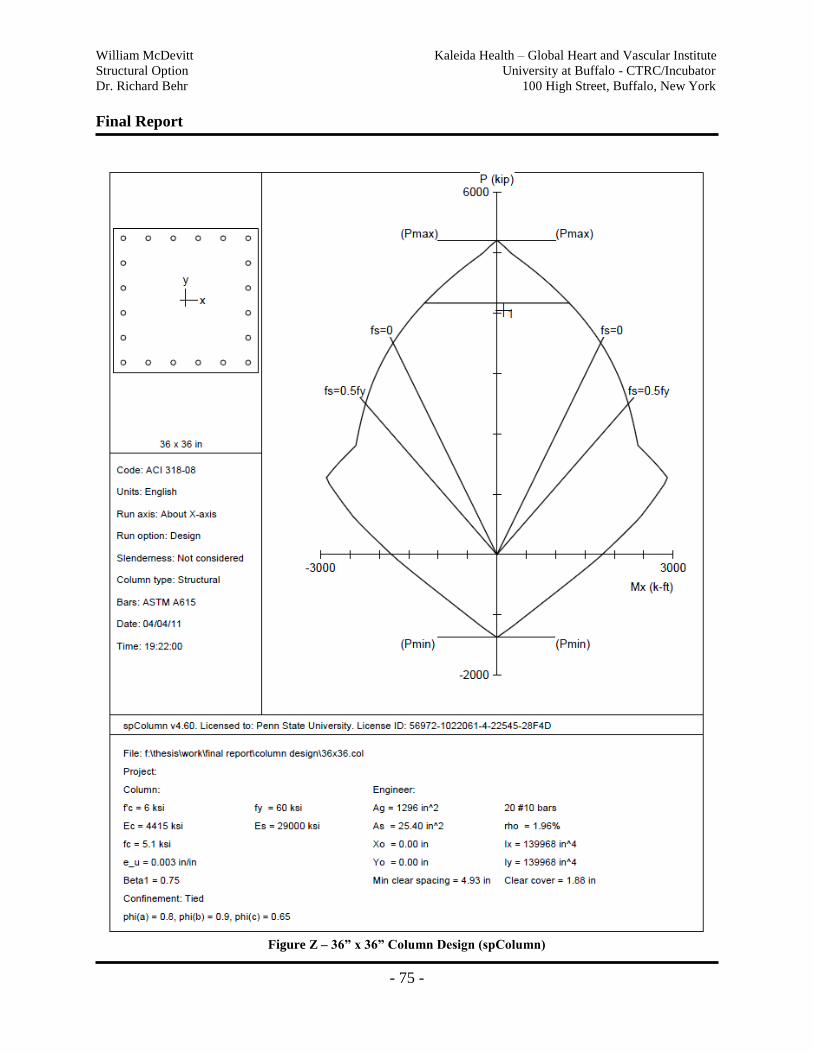
William McDevitt Kaleida Health – Global Heart and Vascular Institute
Structural Option University at Buffalo - CTRC/Incubator
Dr. Richard Behr 100 High Street, Buffalo, New York
Final Report
- 75 -
Figure Z – 36” x 36” Column Design (spColumn)
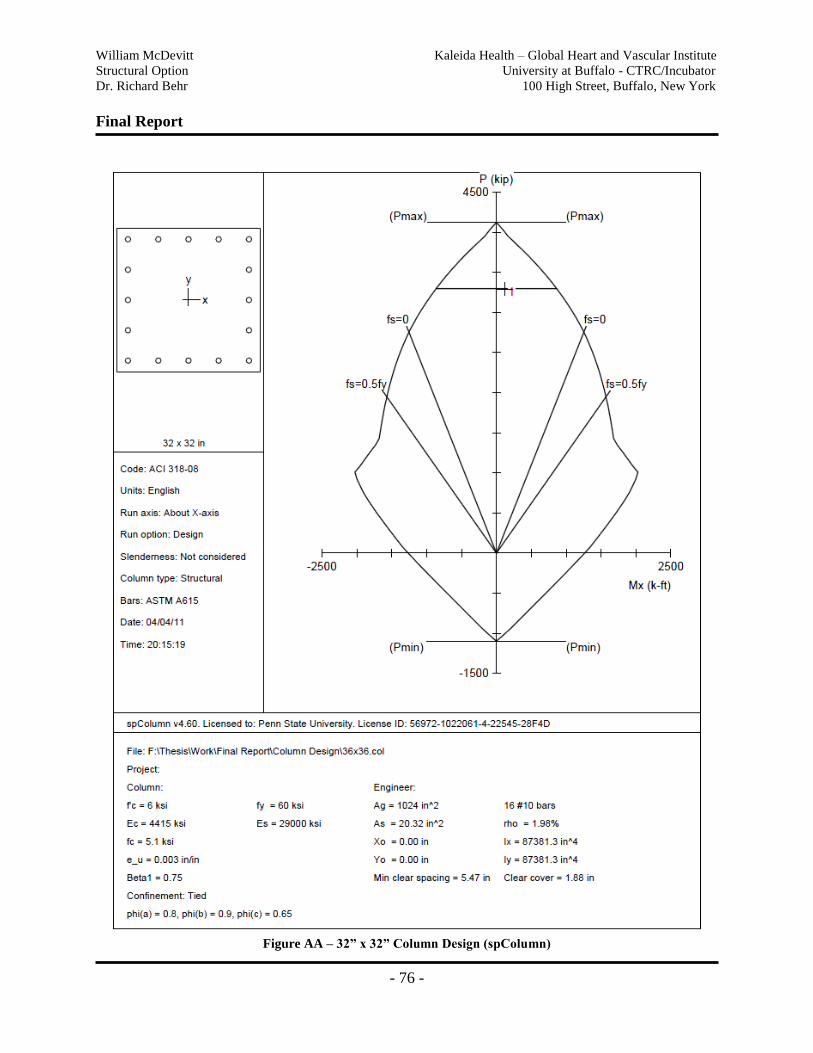
William McDevitt Kaleida Health – Global Heart and Vascular Institute
Structural Option University at Buffalo - CTRC/Incubator
Dr. Richard Behr 100 High Street, Buffalo, New York
Final Report
- 76 -
Figure AA – 32” x 32” Column Design (spColumn)

William McDevitt Kaleida Health – Global Heart and Vascular Institute
Structural Option University at Buffalo - CTRC/Incubator
Dr. Richard Behr 100 High Street, Buffalo, New York
Final Report
- 77 -
Appendix F: Lateral System Redesign
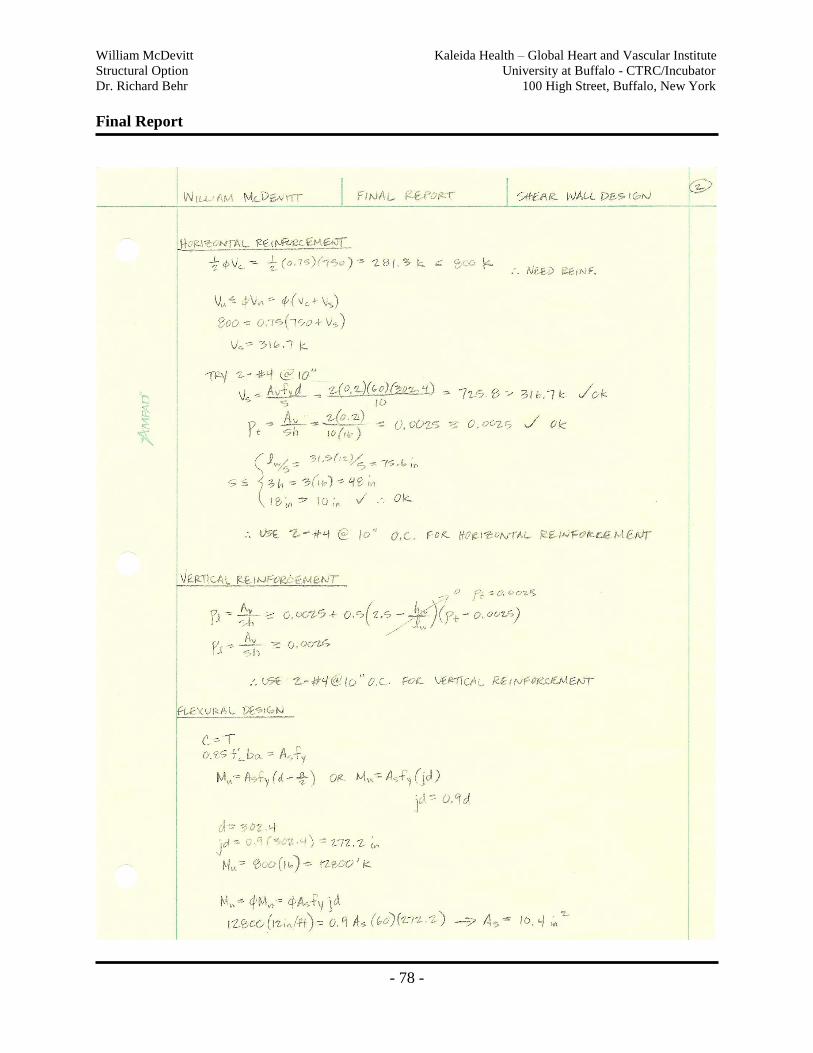
William McDevitt Kaleida Health – Global Heart and Vascular Institute
Structural Option University at Buffalo - CTRC/Incubator
Dr. Richard Behr 100 High Street, Buffalo, New York
Final Report
- 78 -
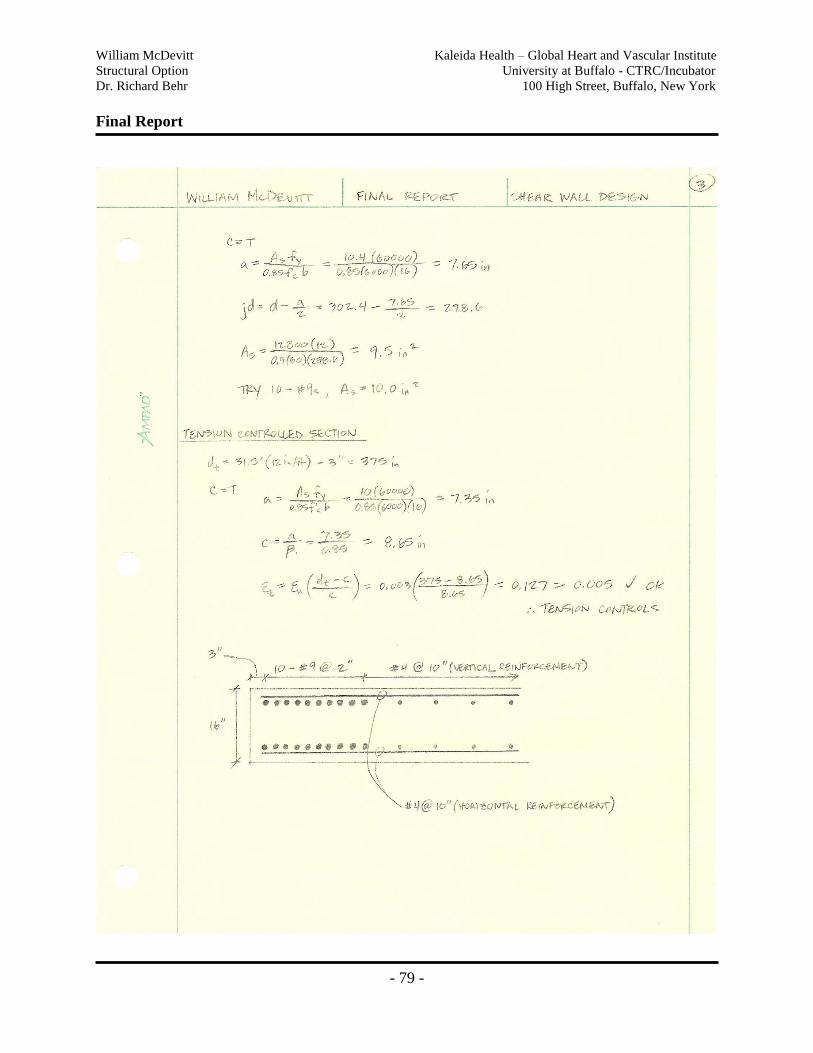
William McDevitt Kaleida Health – Global Heart and Vascular Institute
Structural Option University at Buffalo - CTRC/Incubator
Dr. Richard Behr 100 High Street, Buffalo, New York
Final Report
- 79 -
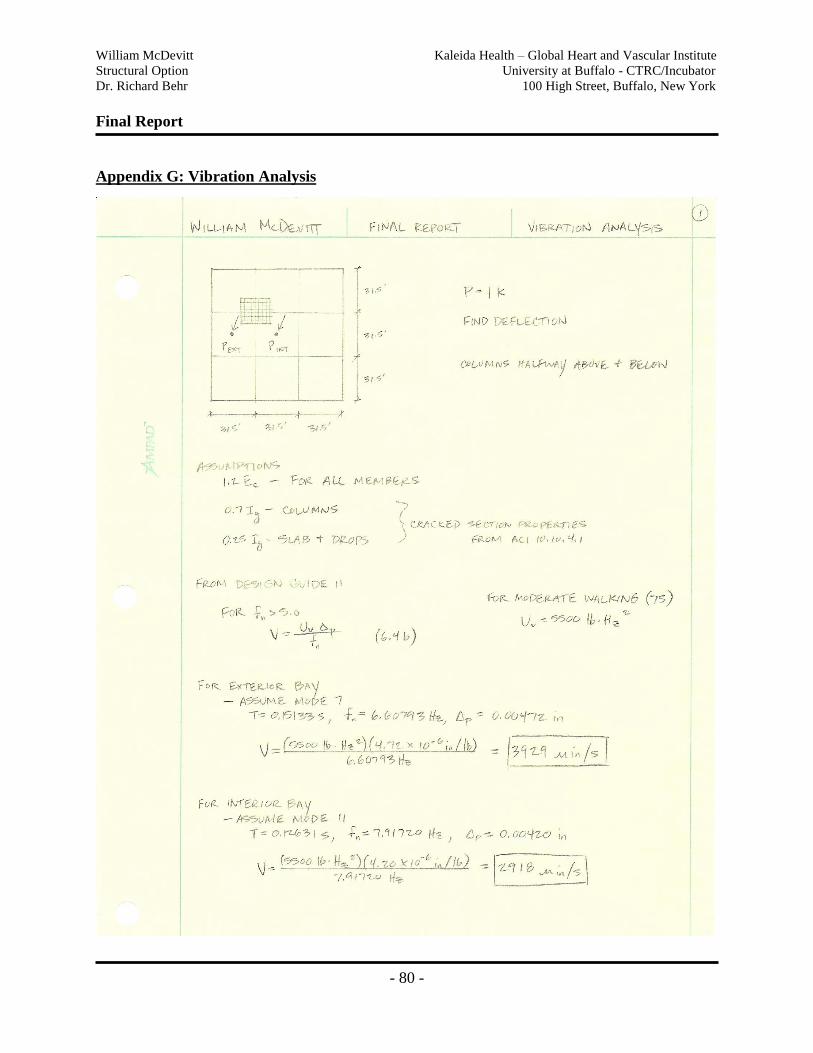
William McDevitt Kaleida Health – Global Heart and Vascular Institute
Structural Option University at Buffalo - CTRC/Incubator
Dr. Richard Behr 100 High Street, Buffalo, New York
Final Report
- 80 -
Appendix G: Vibration Analysis
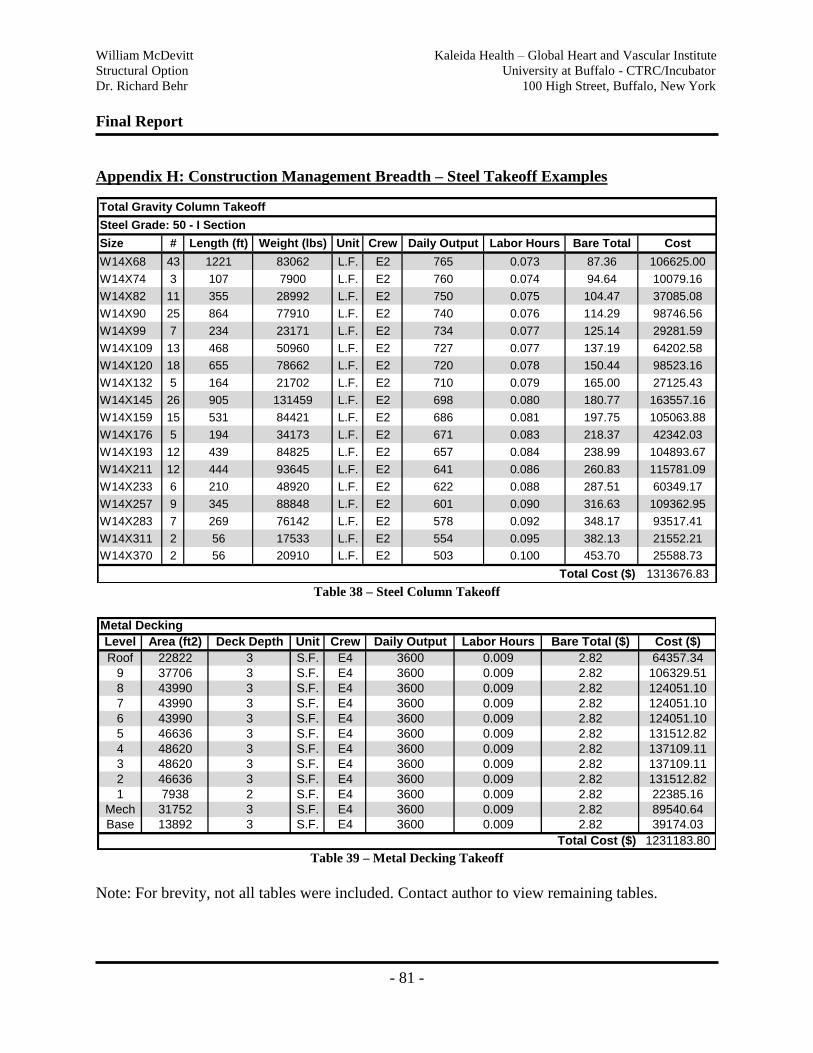
William McDevitt Kaleida Health – Global Heart and Vascular Institute
Structural Option University at Buffalo - CTRC/Incubator
Dr. Richard Behr 100 High Street, Buffalo, New York
Final Report
- 81 -
Appendix H: Construction Management Breadth – Steel Takeoff Examples
Size # Length (ft) Weight (lbs) Unit Crew Daily Output Labor Hours Bare Total Cost
W14X68 43 1221 83062 L.F. E2 765 0.073 87.36 106625.00
W14X74 3 107 7900 L.F. E2 760 0.074 94.64 10079.16
W14X82 11 355 28992 L.F. E2 750 0.075 104.47 37085.08
W14X90 25 864 77910 L.F. E2 740 0.076 114.29 98746.56
W14X99 7 234 23171 L.F. E2 734 0.077 125.14 29281.59
W14X109 13 468 50960 L.F. E2 727 0.077 137.19 64202.58
W14X120 18 655 78662 L.F. E2 720 0.078 150.44 98523.16
W14X132 5 164 21702 L.F. E2 710 0.079 165.00 27125.43
W14X145 26 905 131459 L.F. E2 698 0.080 180.77 163557.16
W14X159 15 531 84421 L.F. E2 686 0.081 197.75 105063.88
W14X176 5 194 34173 L.F. E2 671 0.083 218.37 42342.03
W14X193 12 439 84825 L.F. E2 657 0.084 238.99 104893.67
W14X211 12 444 93645 L.F. E2 641 0.086 260.83 115781.09
W14X233 6 210 48920 L.F. E2 622 0.088 287.51 60349.17
W14X257 9 345 88848 L.F. E2 601 0.090 316.63 109362.95
W14X283 7 269 76142 L.F. E2 578 0.092 348.17 93517.41
W14X311 2 56 17533 L.F. E2 554 0.095 382.13 21552.21
W14X370 2 56 20910 L.F. E2 503 0.100 453.70 25588.73
1313676.83
Total Gravity Column Takeoff
Steel Grade: 50 - I Section
Total Cost ($) Table 38 – Steel Column Takeoff
Level Area (ft2) Deck Depth Unit Crew Daily Output Labor Hours Bare Total ($) Cost ($)
Roof 22822 3 S.F. E4 3600 0.009 2.82 64357.34
9 37706 3 S.F. E4 3600 0.009 2.82 106329.51
8 43990 3 S.F. E4 3600 0.009 2.82 124051.10
7 43990 3 S.F. E4 3600 0.009 2.82 124051.10
6 43990 3 S.F. E4 3600 0.009 2.82 124051.10
5 46636 3 S.F. E4 3600 0.009 2.82 131512.82
4 48620 3 S.F. E4 3600 0.009 2.82 137109.11
3 48620 3 S.F. E4 3600 0.009 2.82 137109.11
2 46636 3 S.F. E4 3600 0.009 2.82 131512.82
1 7938 2 S.F. E4 3600 0.009 2.82 22385.16
Mech 31752 3 S.F. E4 3600 0.009 2.82 89540.64
Base 13892 3 S.F. E4 3600 0.009 2.82 39174.03
1231183.80
Metal Decking
Total Cost ($) Table 39 – Metal Decking Takeoff
Note: For brevity, not all tables were included. Contact author to view remaining tables.
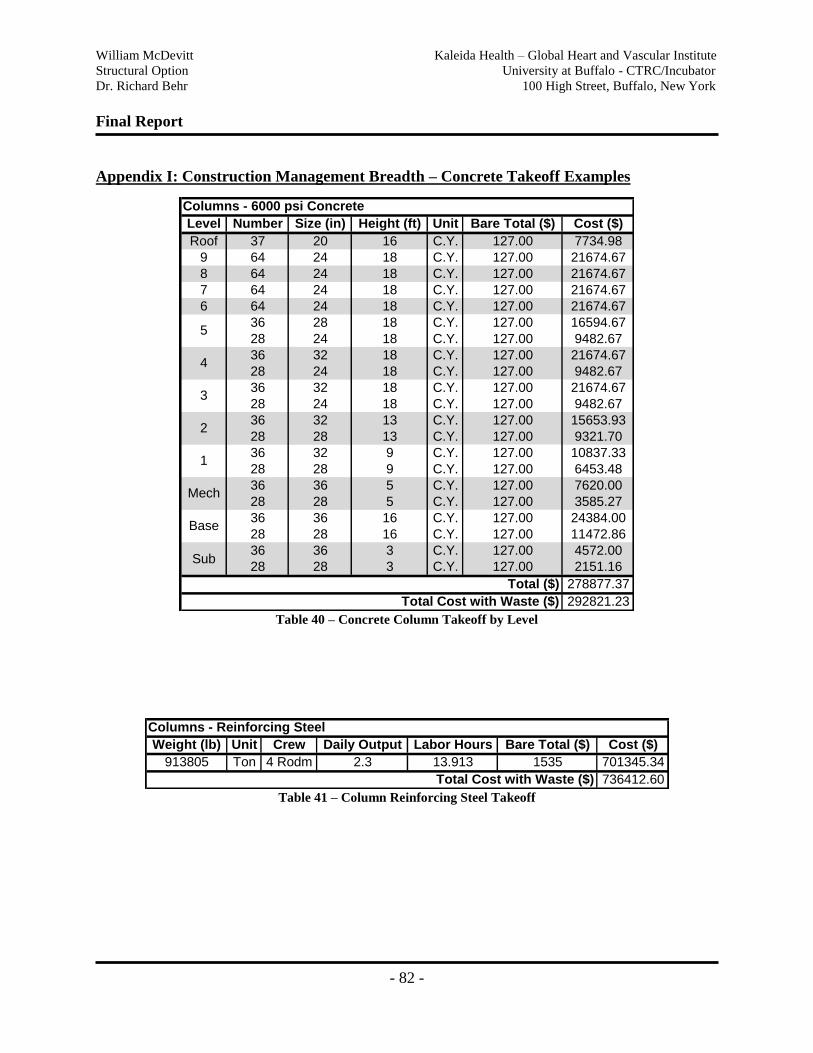
William McDevitt Kaleida Health – Global Heart and Vascular Institute
Structural Option University at Buffalo - CTRC/Incubator
Dr. Richard Behr 100 High Street, Buffalo, New York
Final Report
- 82 -
Appendix I: Construction Management Breadth – Concrete Takeoff Examples
Level Number Size (in) Height (ft) Unit Bare Total ($) Cost ($)
Roof 37 20 16 C.Y. 127.00 7734.98
9 64 24 18 C.Y. 127.00 21674.67
8 64 24 18 C.Y. 127.00 21674.67
7 64 24 18 C.Y. 127.00 21674.67
6 64 24 18 C.Y. 127.00 21674.67
36 28 18 C.Y. 127.00 16594.67
28 24 18 C.Y. 127.00 9482.67
36 32 18 C.Y. 127.00 21674.67
28 24 18 C.Y. 127.00 9482.67
36 32 18 C.Y. 127.00 21674.67
28 24 18 C.Y. 127.00 9482.67
36 32 13 C.Y. 127.00 15653.93
28 28 13 C.Y. 127.00 9321.70
36 32 9 C.Y. 127.00 10837.33
28 28 9 C.Y. 127.00 6453.48
36 36 5 C.Y. 127.00 7620.00
28 28 5 C.Y. 127.00 3585.27
36 36 16 C.Y. 127.00 24384.00
28 28 16 C.Y. 127.00 11472.86
36 36 3 C.Y. 127.00 4572.00
28 28 3 C.Y. 127.00 2151.16
278877.37
292821.23
1
Columns - 6000 psi Concrete
5
4
3
2
Mech
Base
Sub
Total ($)
Total Cost with Waste ($) Table 40 – Concrete Column Takeoff by Level
Weight (lb) Unit Crew Daily Output Labor Hours Bare Total ($) Cost ($)
913805 Ton 4 Rodm 2.3 13.913 1535 701345.34
736412.60
Columns - Reinforcing Steel
Total Cost with Waste ($) Table 41 – Column Reinforcing Steel Takeoff
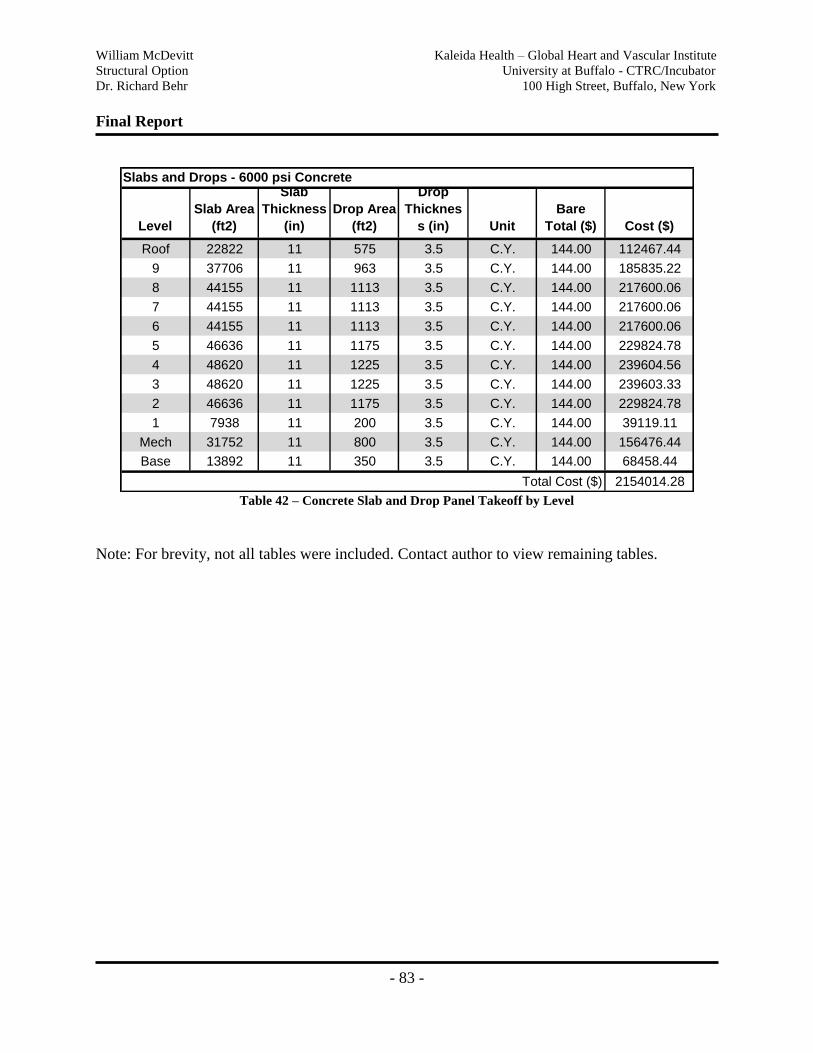
William McDevitt Kaleida Health – Global Heart and Vascular Institute
Structural Option University at Buffalo - CTRC/Incubator
Dr. Richard Behr 100 High Street, Buffalo, New York
Final Report
- 83 -
Level
Slab Area
(ft2)
Slab
Thickness
(in)
Drop Area
(ft2)
Drop
Thicknes
s (in) Unit
Bare
Total ($) Cost ($)
Roof 22822 11 575 3.5 C.Y. 144.00 112467.44
9 37706 11 963 3.5 C.Y. 144.00 185835.22
8 44155 11 1113 3.5 C.Y. 144.00 217600.06
7 44155 11 1113 3.5 C.Y. 144.00 217600.06
6 44155 11 1113 3.5 C.Y. 144.00 217600.06
5 46636 11 1175 3.5 C.Y. 144.00 229824.78
4 48620 11 1225 3.5 C.Y. 144.00 239604.56
3 48620 11 1225 3.5 C.Y. 144.00 239603.33
2 46636 11 1175 3.5 C.Y. 144.00 229824.78
1 7938 11 200 3.5 C.Y. 144.00 39119.11
Mech 31752 11 800 3.5 C.Y. 144.00 156476.44
Base 13892 11 350 3.5 C.Y. 144.00 68458.44
2154014.28
Slabs and Drops - 6000 psi Concrete
Total Cost ($) Table 42 – Concrete Slab and Drop Panel Takeoff by Level
Note: For brevity, not all tables were included. Contact author to view remaining tables.
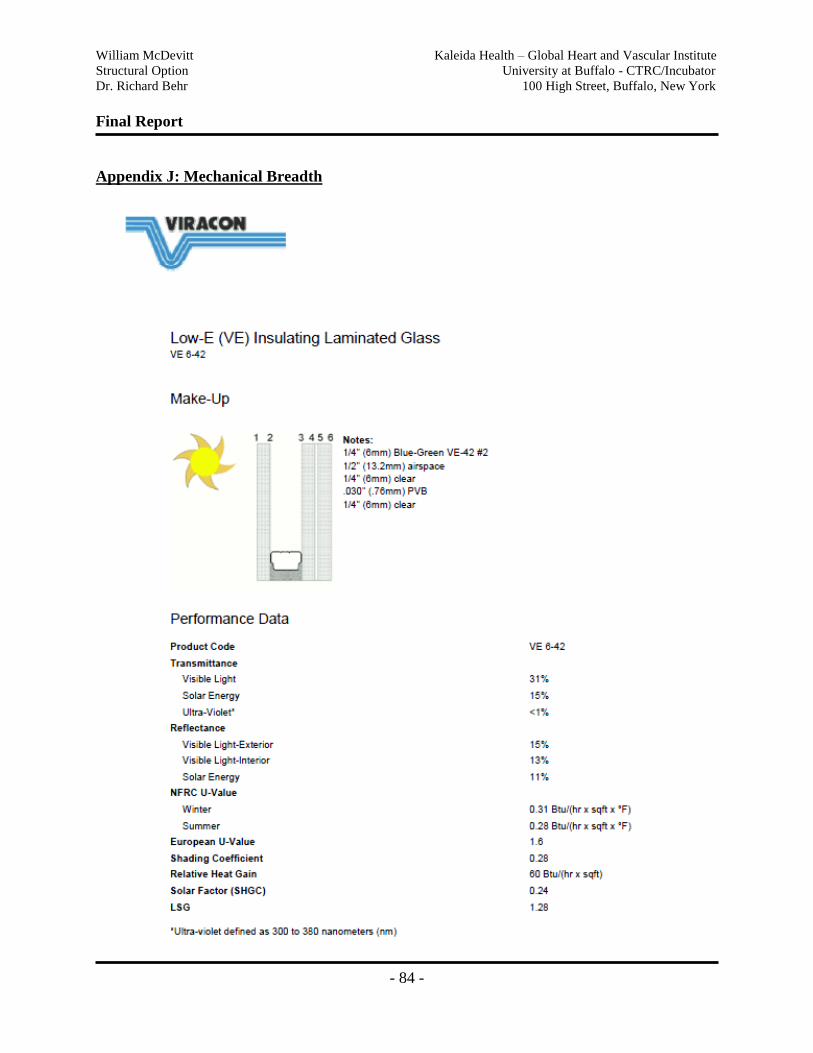
William McDevitt Kaleida Health – Global Heart and Vascular Institute
Structural Option University at Buffalo - CTRC/Incubator
Dr. Richard Behr 100 High Street, Buffalo, New York
Final Report
- 84 -
Appendix J: Mechanical Breadth