kanana informal settlement pocket - western cape · enumeration report: kanana informal settlement...
TRANSCRIPT

Kanana Informal Settlement Pocket
Enumeration Report
DECEMBER 2016
A member of the SA SDI Alliance
Enumeration Report: Kanana Informal Settlement Pocket
2
CONTENTSLIST OF TABLES 3
LIST OF FIGURES 3
LIST OF ACRONYMS AND ABBREVIATIONS 4
GLOSSARY 4
PREFACE 5
EXECUTIVE SUMMARY 6
1. INTRODUCTION 8
2. LOCATION AND CONTEXT OF THE SETTLEMENT 11
3. METHODOLOGY 153.1. Stakeholder participation and engagement 15
3.2. Pre-implementation and field work 16
3.3. Value add to the project – employment opportunities 17
4. COVERAGE OF THE ENUMERATION AND RESPONSE RATES 184.1. Coverage of the enumeration 19
4.2. Response rates 23
5. SUMMARY FINDINGS 24
6. ANALYSIS 256.1. Structure analysis 25
6.2. Demographics of Kanana population 32
6.2.1. Age distribution 32
6.2.1.1 A profile of youth 33
6.2.2. Gender breakdown 34
6.2.3. Education enrolment and school attendance 36
6.2.4. Employment 37
6.2.5. Household income and expenditure 40
6.3. Access to services 42
6.3.1. Water access 43
6.3.2. Sanitation 45
6.3.3. Electricity 47
6.3.4. Community services and local business 49
6.4. Health and disasters 51
6.5. Settlement dynamics 52
6.6. Settlement priorities 53
6.7. Implications of findings for human settlements 55
6.7.1. Planning considerations 55
6.7.2. Pathway to qualification 57
7. CONCLUSION 62
REFERENCES 63
LIST OF CORE TEAM MEMBERS 64
Enumeration Report: Kanana Informal Settlement Pocket
3
LIST OF TABLES
LIST OF FIGURES
Table 1: Total population of Kanana derived from stated number of people living inside each structure 22
Table 2: Total population of Kanana based on actual number of persons enumerated per structure 23
Table 3: Total households for Kanana derived from stated number of households 23
Table 4: Number of rooms per structure 27
Table 5: Number of people per structure 28
Table 6a: Square metres of floor space 29
Table 6b: Square metres of floor space categorised available per person excluding structures with one occupant 30
Table 7: Main use of structures 31
Table 8: Age distribution of single person households 34
Table 9: Employment status by gender for Kanana residents aged 19 to 30 years 34
Table 10: Income distribution for age cohort 19 to 30 years old 35
Table 11: Number of people enumerated per structure by gender of household heads (column percentages) 36
Table 12: Employment status by gender for respondents 16 years & older (row percentages) 36
Table 13: Age categorised by school enrolment for individuals aged 0 to 18 years old 37
Table 14: Age by employment status (row frequencies & percentages) 38
Table 15: Employment status by gender for respondents 16 years & older (Column percentages) 39
Table 16: Travel time to work 41
Table 17: Income distribution 41
Table 18: Expenses distribution 42
Table 19: Percentage distribution of sanitation access 46
Table 20: Accessing community facilities inside or within walking distance to settlement 51
Table 21: First port of call for medical assistance 52
Table 22: Main household priorities by ranking (row percentages) 54
Table 23: Reasons to move out of settlement by ranking order 55
Table 24: Reasons to move out of settlement by ranking (row percentages) 55
Table 25: Marital status of single-person households 56
Table 26: Age distribution of single-person households 56
Table 27: Kanana age profile 57
Figure 1: SA SDI Alliance stakeholder participation & engagement strategy 16
Figure 2: Pre-implementation and field work process flow chart 17
Figure 3: Map of all structures in Kanana, indicating the coverage of the enumeration 20
Figure 4: Percentage breakdown per respondent type for Kanana informal settlement 21
Figure 5: Percentage breakdown of structure ownership 26
Figure 6: Percentage breakdown for square metres per person of floor area provided by a structure, categorised 29
Figure 7: Map indicating age of structures categorised 32
Figure 8: Age distribution of Kanana population 33
Figure 9: Gender breakdown 35
Figure 10: Percentage breakdown of main transport type to work 40
Figure 11: Percentage distribution of grant type 42
Figure 12: Kanana amenities 43
Figure 13: Map of Kanana water points with 25m radius 44
Figure 14: Map showing sanitation access with 25m radius 47
Figure 15: Percentage breakdown of electricity access 48
Figure 16: Map showing electricity access in Kanana 49
Figure 17: Number of years lived in Kanana categorised 53
Enumeration Report: Kanana Informal Settlement Pocket
4
LIST OF ACRONYMS AND ABBREVIATIONS
GLOSSARY
CoCT – City of Cape Town (refers to the municipality)
CORC – Community Organisation Resource Centre
The Department – Department of Human Settlements
EPWP - Expanded Public Works Programme
FEDUP – Federation of the Urban and Rural Poor
GIS – Geographical Information Systems
GPS – Global Positioning System
ISN – Informal Settlement Network
MEC – Member of the Executive Council
NGO – Non-Governmental Organisation
Province – The Western Cape Government
PSC – Project Steering Committee
SC – Sub-Council
SA SDI Alliance – South African Slum Dwellers International Alliance
SDI – Slum Dwellers International
StatsSA – Statistics South Africa
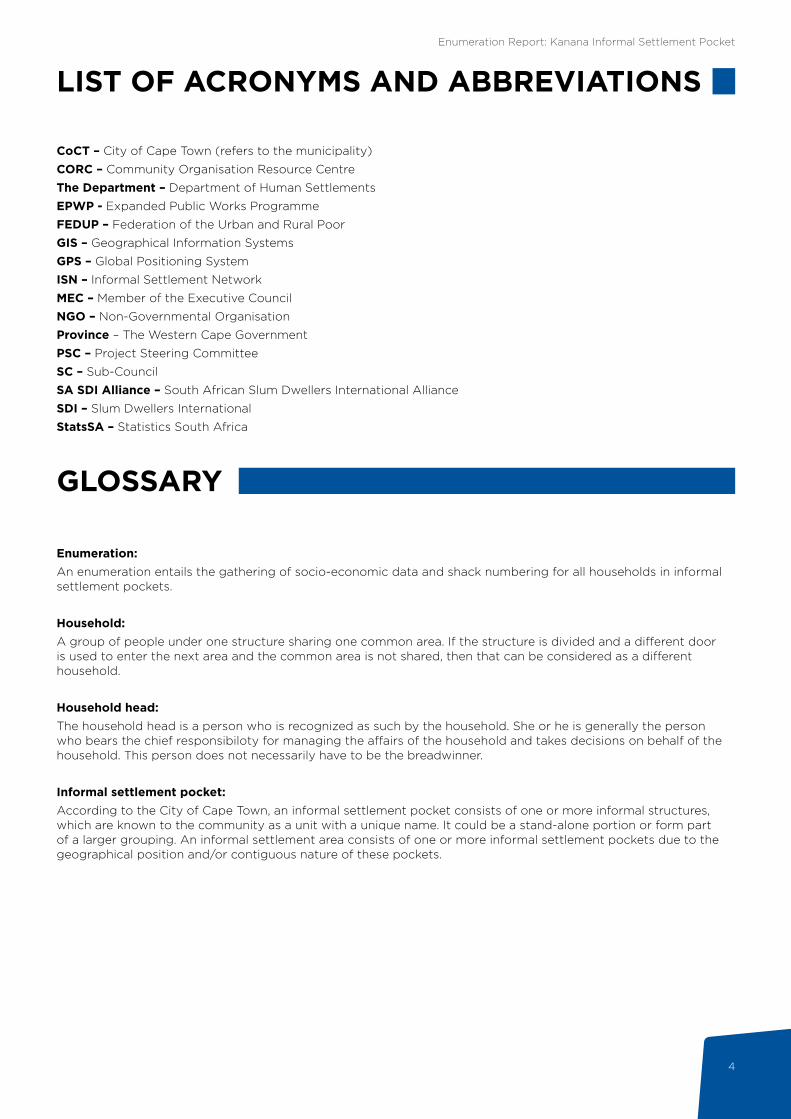
Enumeration: An enumeration entails the gathering of socio-economic data and shack numbering for all households in informal settlement pockets.
Household: A group of people under one structure sharing one common area. If the structure is divided and a different door is used to enter the next area and the common area is not shared, then that can be considered as a different household.
Household head:The household head is a person who is recognized as such by the household. She or he is generally the person who bears the chief responsibiloty for managing the affairs of the household and takes decisions on behalf of the household. This person does not necessarily have to be the breadwinner.
Informal settlement pocket:According to the City of Cape Town, an informal settlement pocket consists of one or more informal structures, which are known to the community as a unit with a unique name. It could be a stand-alone portion or form part of a larger grouping. An informal settlement area consists of one or more informal settlement pockets due to the geographical position and/or contiguous nature of these pockets.

Enumeration Report: Kanana Informal Settlement Pocket
5
PREFACE
The Community Organisation Resource Centre (CORC) is a support NGO linked to the global network of the urban poor known as Slum Dwellers International (SDI). In its role as a support NGO, CORC supports the social processes of two poor-people’s movements, the Federation of the Urban and Rural Poor (FEDUP) and the Informal Settlement Network (ISN). CORC assists FEDUP & ISN to develop strategies for inclusive cities. This includes facilitating engagements with formal roleplayers like the state and supporting the development of savings, information-gathering and community-led development strategies. A second NGO, the uTshani Fund, provides finance for the urban poor. Together, these two social movements, along with the two support NGOs, form the South African SDI Alliance. One of the alliance’s most important tools over the last two decades has been information collection through the profiling and enumeration of informal settlements. This report is a reflection of community-driven data collection processes implemented by the alliance that have proven to be far more effective in gathering accurate data about informal settlements.
Residents walk from Kanana to the N2 highway

Enumeration Report: Kanana Informal Settlement Pocket
6
EXECUTIVE SUMMARY
A dense concentration of informal settlements is located along the N2 between Borcherds Quarry and Airport Approach Road. These include Kanana and neighbouring settlements Barcelona, Europe and Vukuzenzele. Kanana extends over 23,14 hectares at a density of 159 dwellings per hectare, and is bounded by the N2 highway to the north, Steve Biko Street to the west, and NY111 along the south west. In Kanana, 6697 residents make up 3036 households; an average household size of 2,1 people per household. In 1989 backyarders from Gugulethu first erected dwellings on a discontinued landfill site, and the settlement has grown rapidly over the past 27 years.
The Western Cape Government Department of Human Settlements appointed the Community Organisation Resource Centre (CORC), through a competitive tender process, to conduct an in-depth enumeration of Kanana, which forms part of the Airport Informal Settlement Precinct consisting of ten (10) informal settlements, namely; Barcelona, Gxagxa, Lusaka, Kanana, Vukuzenzele, Europe, Thabo Mbeki, KTC, Tsunami IDA/TRA, and Hlazo Village. Kosovo was also enumerated as a priority project in the southern corridor. CORC works in partnership with the Federation of the Urban and Rural Poor and the Informal Settlement Network, who mobilised, trained and provided on-going support to Kanana community members to act as enumerators in this study.
Data collection took place over two phases due to local government elections: 20 days in June and 20 days in September 2016. This was followed by a verification and analysis of the data collected. The methodology included the use of locally trained fieldworkers and the utilisation of Trimble devices to ensure a level of geographic accuracy. Through CORC employment and the Expanded Public Works Programme of the City of Cape Town, 64 short-term employment opportunities were created in Kanana during this study.
3415 dwellings were numbered of which 3036 dwellings were enumerated, resulting in a response rate of 91%. During the enumeration, eight out of ten times household heads were the primary respondent to questions, followed by those closely associated to the affairs of the household such as boarders (7,4%) and spouse or partner (5,7%). This means that the most reliable sources of information related to households were obtained.
Single people account for 48% of all households, of which 66% are male, 75% are younger than 35 years old, and 90% have never been married (and are potentially without dependents). The dwellings of single households in Kanana can be characterised as small (59% of all dwellings are less than 30 square metres), single room (41% of all dwellings), and recently occupied (33% of residents reported to have lived in their dwellings for less than five years). When considering all dwellings only 15% of households enjoy shelters of 35 to 60 square meters. Although 78% of respondents asserted to own the dwelling they live in, 638 households (21% of total households) are subordinate to a lessor. It is therefore important to take the informal property market into account when planning settlement upgrading.
The majority of Kanana residents face economic hardship, and the unemployment rate is 53% according to community responses. The majority of households (95%) earn less than R3,500 per month, while 26% of households report to have no income at all. 31 to 35 year-olds are the most economically active, followed by 41 to 50 year-olds. Youth aged 19 to 30 years make up 29% of the total population and are particularly affected. 61 in every 100 youth are unemployed. Women are particularly affected by the shocks related to unemployment since 62% of the unemployed youth are female. Only 2,6% of youth are reportedly self-employed and 36% of youth earn no income. According to the enumeration data, 2049 people receive the Child Support Grant, 136 pensioners receive the old age grant and 56 people receive the disablility grant.
Kanana’s proximity to the N2 highway
Enumeration Report: Kanana Informal Settlement Pocket
7
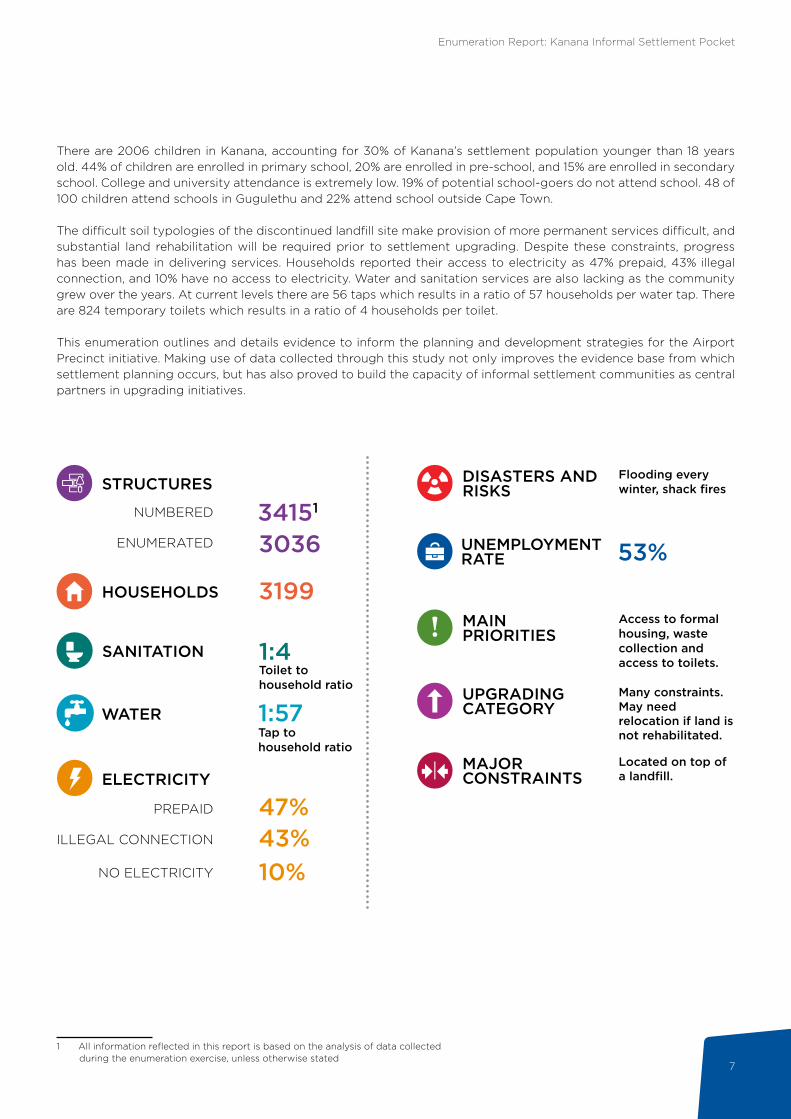
There are 2006 children in Kanana, accounting for 30% of Kanana’s settlement population younger than 18 years old. 44% of children are enrolled in primary school, 20% are enrolled in pre-school, and 15% are enrolled in secondary school. College and university attendance is extremely low. 19% of potential school-goers do not attend school. 48 of 100 children attend schools in Gugulethu and 22% attend school outside Cape Town.
The difficult soil typologies of the discontinued landfill site make provision of more permanent services difficult, and substantial land rehabilitation will be required prior to settlement upgrading. Despite these constraints, progress has been made in delivering services. Households reported their access to electricity as 47% prepaid, 43% illegal connection, and 10% have no access to electricity. Water and sanitation services are also lacking as the community grew over the years. At current levels there are 56 taps which results in a ratio of 57 households per water tap. There are 824 temporary toilets which results in a ratio of 4 households per toilet.
This enumeration outlines and details evidence to inform the planning and development strategies for the Airport Precinct initiative. Making use of data collected through this study not only improves the evidence base from which settlement planning occurs, but has also proved to build the capacity of informal settlement communities as central partners in upgrading initiatives.
34151
1 All information reflected in this report is based on the analysis of data collected during the enumeration exercise, unless otherwise stated
MAIN PRIORITIES
UPGRADING CATEGORY
MAJOR CONSTRAINTS
STRUCTURES
NUMBERED
ENUMERATED 3036
HOUSEHOLDS 3199Access to formal housing, waste collection and access to toilets.
Many constraints. May need relocation if land is not rehabilitated.
Located on top of a landfill.
1:4Toilet to household ratio
SANITATION
Tap to household ratio
1:57WATER
PREPAID
ILLEGAL CONNECTION
NO ELECTRICITY
47%43%10%
ELECTRICITY
53%UNEMPLOYMENT RATE
DISASTERS AND RISKS
Flooding every winter, shack fires

Enumeration Report: Kanana Informal Settlement Pocket
8
1. INTRODUCTION
Introduction01South Africa, like other developing countries, has seen a rapid rise of informal settlements in major cities.2 This increase is attributed to a number of factors which can be grouped under two broad categories i.e. urbanisation and population growth. In terms of urbanisation, people migrate into cities in search of greener pastures. Upon arrival, they find it near impossible to secure affordable housing and are often forced to find accommodation in informal settlements. With respect to population growth, Census figures have shown a consistent increase in the population size and growth rates of the country. In addition, there is a growing phenomenon of young adults who split from families in order to set up home elsewhere in pursuit of independence. This further compounds the problems associated with housing demand.3
It is expected that housing would be affected by increases in population size and the decline of household size, which puts an additional strain on the state’s available resources to provide adequate housing for the population.
Trends in population increase and growth in informal settlementsThe Western Cape Province accounts for 11.2 % of South Africa’s total population with 5 823 000 residents; of this the City of Cape Town metropolitan area is home to 64% of the Province’s residents (StatsSA: 2011). The population size in the Province increased by 2.6% per year between 2001 and 2011 while the average household size declined from 4 in 1990 to 3.4 in 2011, placing increased pressure on the demand for services and housing.
Informal settlements are home to millions of people in developing countries. Between 1994 and 2011, the number of informal settlements in South Africa increased from approximately 300 to about 2 700 and it is estimated that 1.25 million households live in these settlements (NDHS, 2014). According to Statistics South Africa (Stats SA), 142 706 households lived in shacks (not in backyards) and informal residential areas in the Western Cape at the time of the 2001 Census. This figure is compared to 191 668 at the time of the 2011 Census (HDA, 2013:11). In 2013, approximately 193 000 households lived in 204 informal settlement areas in
2 HDA. 2013b. South Africa: Informal Settlements Status. 3 Todes, A. et al. 2010. Contemporary South African Urbanisation Dynamics.
Urban Forum, 21:331–348
Entry to Kanana from N2 highway
Enumeration Report: Kanana Informal Settlement Pocket
9
Introduction01the City of Cape Town and this number increases each year. These statistics clearly illustrate that government needs to address informality as a matter of priority. As a starting point, policy and implementation need to align to the Western Cape Department of Human Settlements’ strategic direction of allocating more resources to the Upgrading of Informal Settlements Programme (UISP) in order to improve the living conditions of informal settlement dwellers and those living in backyards who continue to wait for a housing opportunity.
Catalytic projects – creating opportunities at scaleIn 2014, the national Minister of Human Settlements announced that the Department would embark on the delivery of catalytic human settlements projects to capitalise on the economies of scale of such projects. Subsequently, the Minister of the Western Cape Department of Human Settlements (WCDHS), Bonginkosi Madikizela announced in his 2015 Budget Speech that the Department had identified 5 catalytic and 9 priority projects in the province, which would be funded and jointly implemented with the National Department of Human Settlements (NDHS).
The Southern Corridor Integrated Human Settlements Project is one of the catalytic projects and is comprised of several projects within the City of Cape Town’s area of jurisdiction. The Airport Informal Settlement Precinct and Kosovo are two projects that will be implemented through the Southern Corridor Integrated Human Settlements Project.
The Airport Informal Settlement Precinct consists of ten (10) informal settlements, namely; Barcelona, Gxagxa, Lusaka, Kanana, Vukuzenzele, Europe, Thabo Mbeki, KTC, Tsunami IDA/TRA, and Hlazo Village. These settlements form a strip of between 200 and 500 metres wide along the southern border of the N2. The majority of settlements border Steve Biko Street to the northwest and Borcherds Quarry Road to the southeast, stretching 2.5km in a northwest-southeast direction. Barcelona, Gxagxa, Lusaka, Kanana, Vukuzenzele and Europe were enumerated in the first phase of the contract. Thabo Mbeki, KTC, Tsunami IDA/TRA, and Hlazo Village were enumerated in the second phase. Kosovo was also enumerated in this government contract as a priority project in the Southern Corridor.
It is in this context that the Department commissioned an enumeration study across each of these informal settlement pockets, appointing the Community Organisation Resource Centre (CORC) through a competitive bidding process, to undertake this task.
Overall purpose of the studyThe overall purpose of the enumeration study was to gather data and information at household level in order to understand the profile of the households, social networks and the level of services in the informal settlement pockets that form part of the Southern Corridor. The data and information gathered will assist the Department in understanding the status quo of each informal settlement pocket in order to develop credible settlement profiles which will assist with determining human settlement needs per household, informing decision making, and future planning for the informal settlement pockets.

Enumeration Report: Kanana Informal Settlement Pocket
10
Introduction01
The project deliverables of the study were to:• Negotiate, design, implement and manage a stakeholder participatory process• Conduct a household level enumeration exercise• Conduct GIS mapping of all households• Analyse the data collected for each settlement• Record existing social infrastructure and socio-economic opportunities• Develop a database which will provide a profile of each household and each
informal settlement
Process undertaken in the enumeration of KananaThe study was conducted by CORC. The Kanana enumeration process unfolded over a period of three months and started with shack numbering and mapping, which was conducted in May 2016. The enumeration training occurred on 3 June 2016. Data collection occurred in two phases, namely before and after local elections. The first phase took place from 4 - 28 June 2016 and lasted for 20 days. The second phase occurred from 6 – 29 September 2016 and lasted for 20 days. Each of the eleven settlements were exposed to the same methodology. The only difference related to the length of time required for gathering data, which was based on the settlements’ varying sizes. The use of a common methodology ensured that information and data across the settlements studied could be compared. This particular report is the outcome of a community-led data collection process that will better equip the CoCT and the Province through updated information about Kanana informal settlement pocket.
Residents capture anecdotes of life in Kanana
Enumeration Report: Kanana Informal Settlement Pocket
11
2. LOCATION AND CONTEXT OF THE SETTLEMENT
Location and context of the settlement
02
COMUNITY VOICES
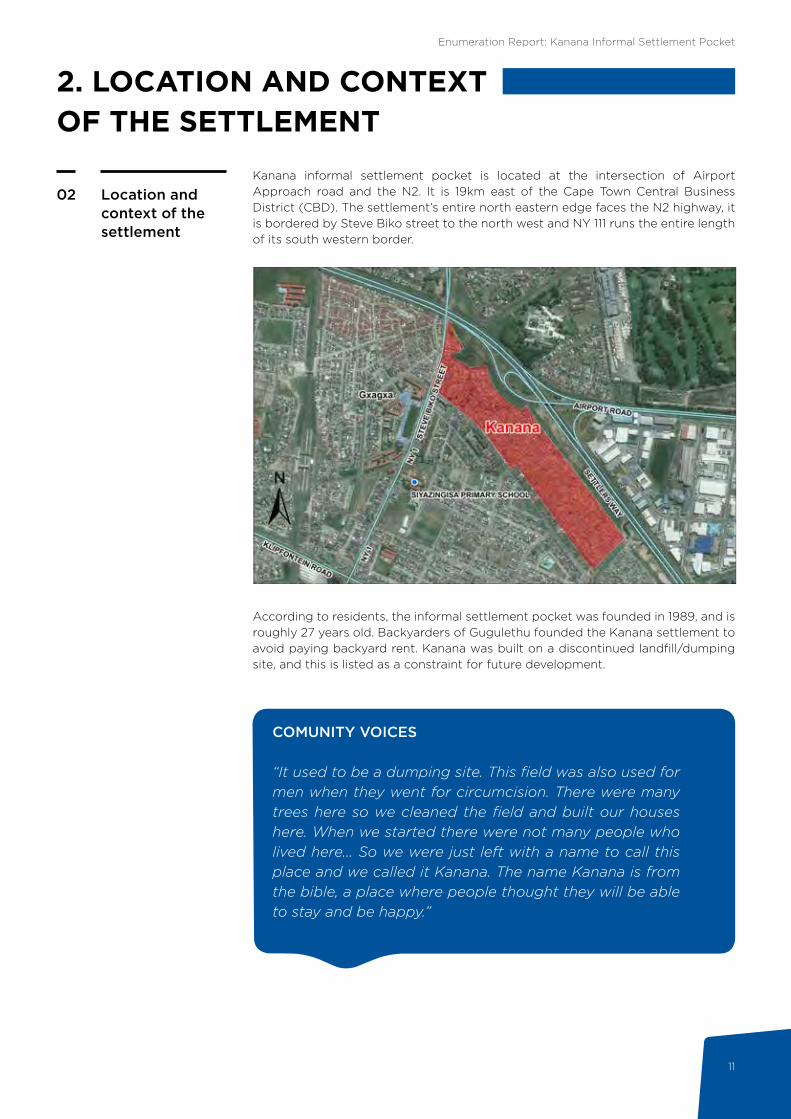
“It used to be a dumping site. This field was also used for men when they went for circumcision. There were many trees here so we cleaned the field and built our houses here. When we started there were not many people who lived here... So we were just left with a name to call this place and we called it Kanana. The name Kanana is from the bible, a place where people thought they will be able to stay and be happy.”
Kanana informal settlement pocket is located at the intersection of Airport Approach road and the N2. It is 19km east of the Cape Town Central Business District (CBD). The settlement’s entire north eastern edge faces the N2 highway, it is bordered by Steve Biko street to the north west and NY 111 runs the entire length of its south western border.
According to residents, the informal settlement pocket was founded in 1989, and is roughly 27 years old. Backyarders of Gugulethu founded the Kanana settlement to avoid paying backyard rent. Kanana was built on a discontinued landfill/dumping site, and this is listed as a constraint for future development.

Enumeration Report: Kanana Informal Settlement Pocket
12
Location and context of the settlement
02The community has a leadership structure of 11 members:
• Chairperson – Mzingisi Khwetshube• Deputy chairperson – Loyisi Sityebi• Treasurer – Lizo Majezi• Secretary – Thuliswa Bulana• Additional member – Chwayita Gaqa• Additional member – Vivian Swaartbooi• Additional member – Nomfesane Qwane• Additional member – Monwabisi Mtshakaza• Additional member – Nombulelo Ketani• Additional member – Tshilelwa Mfaca• Additional member – Nosiphiwo Mapuso
During the initial engagements with Kanana, before the local elections, Councillor Mzwakhe Nqavashe was the Councillor for Ward 40, which incorporates the area South of the N2, East of the railway line, Hlungulu Walk and Steve Biko Drive, North of Klipfontein road. The area is also part of Sub- Council (SC) 11, where Kayise Nombakuse is the Sub-Council manager. As part of accessing the area, CORC engaged Nqavashe and Nombakuse. Nqavashe served as the critical contact to the area and was instrumental in introducing the CORC engagement team to the leadership committee mentioned above. The leadership committee meets several times a month and discusses various issues related to the pocket. After the August 2016 local elections, Nqavashe was replaced by Councillor Bongani Ngcombolo who was also instrumental in rounding off the enumeration exercise in Kanana.
Some residents and leaders in Kanana

Enumeration Report: Kanana Informal Settlement Pocket
13
Location and context of the settlement
02
Kanana 2001 Kanana 2002 Kanana 2003
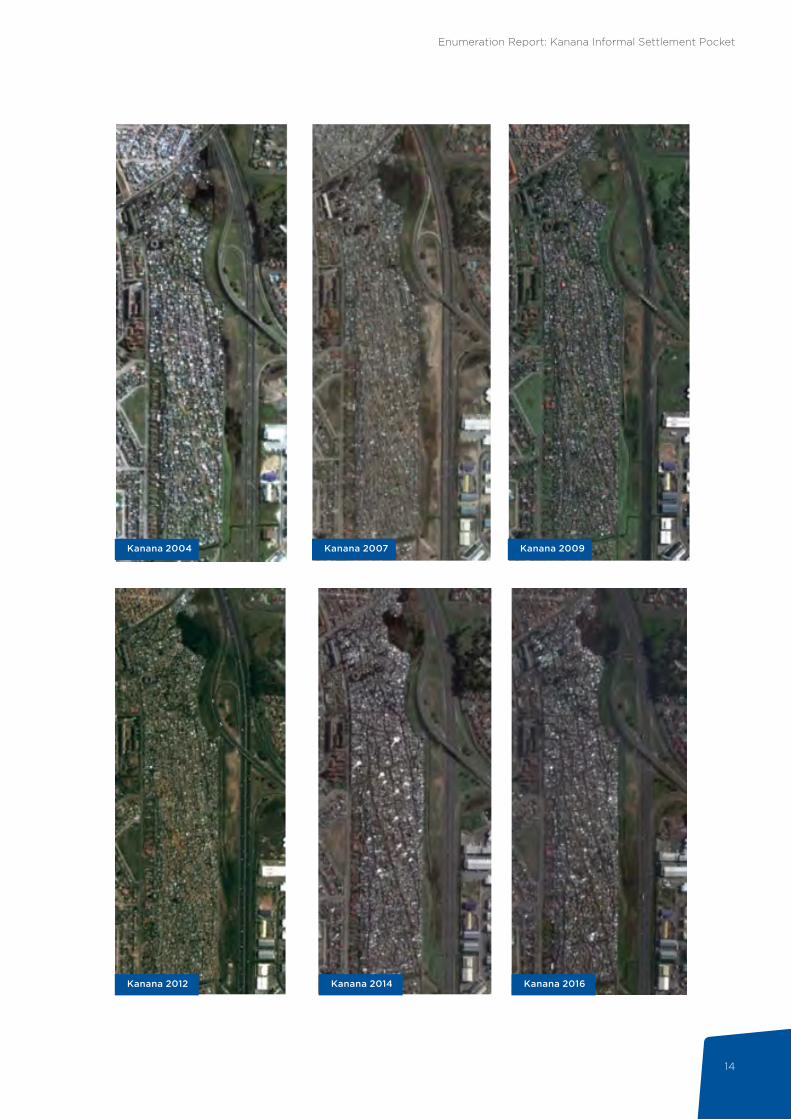
There are a number of leadership committees in Kanana. Firstly, there is an area committee which consists of 16 members. There are also block-level committees for each of the sections in Kanana namely sections A to J. Any identified settlement conflicts are resolved in the area committee. Secondly, there is a SANCO committee that has 15 members. The SANCO committee deals with more complicated problems associated with crime, service delivery, and public services, this they do in partnership with government agencies. The growth of Kanana informal settlement pocket is illustrated in the Google Earth satellite images below. Tracing the settlement growth from earliest images available (2001), it is clear that Gugulethu backyarders occupied the open land and grew eastwards toward the N2. From 2002 to 2007, the remaining open land near the northern part of the settlement, was occupied. Internal footpaths have created north-south and east-west access routes. Between 2005 and 2009, the remaining ecologically sensitive land was occupied on the eastern fringe of the settlement. Between 2012 to 2016, the growth of structures in the centre of the settlement has increased the density. Today, the settlement covers 23,14ha at a density of 159 households per hectare, which is significantly higher than the average citywide density of 5.26 dwelling units per hectare.
Enumeration Report: Kanana Informal Settlement Pocket
14
Kanana 2004 Kanana 2007 Kanana 2009
Kanana 2012 Kanana 2014 Kanana 2016

Enumeration Report: Kanana Informal Settlement Pocket
15
3. METHODOLOGY
Methodology03
Figure 1: SA SDI Alliance stakeholder participation & engagement strategy
3.1. STAKEHOLDER PARTICIPATION AND ENGAGEMENT
The first phase of the study involved stakeholder engagement and developing deep participation with regard to community structures4. This is summarised in figure 1:
4 A detailed stakeholder participation and engagement plan has been prepared by CORC and contains the details of this phase of the project.
Enumeration Report: Kanana Informal Settlement Pocket
16
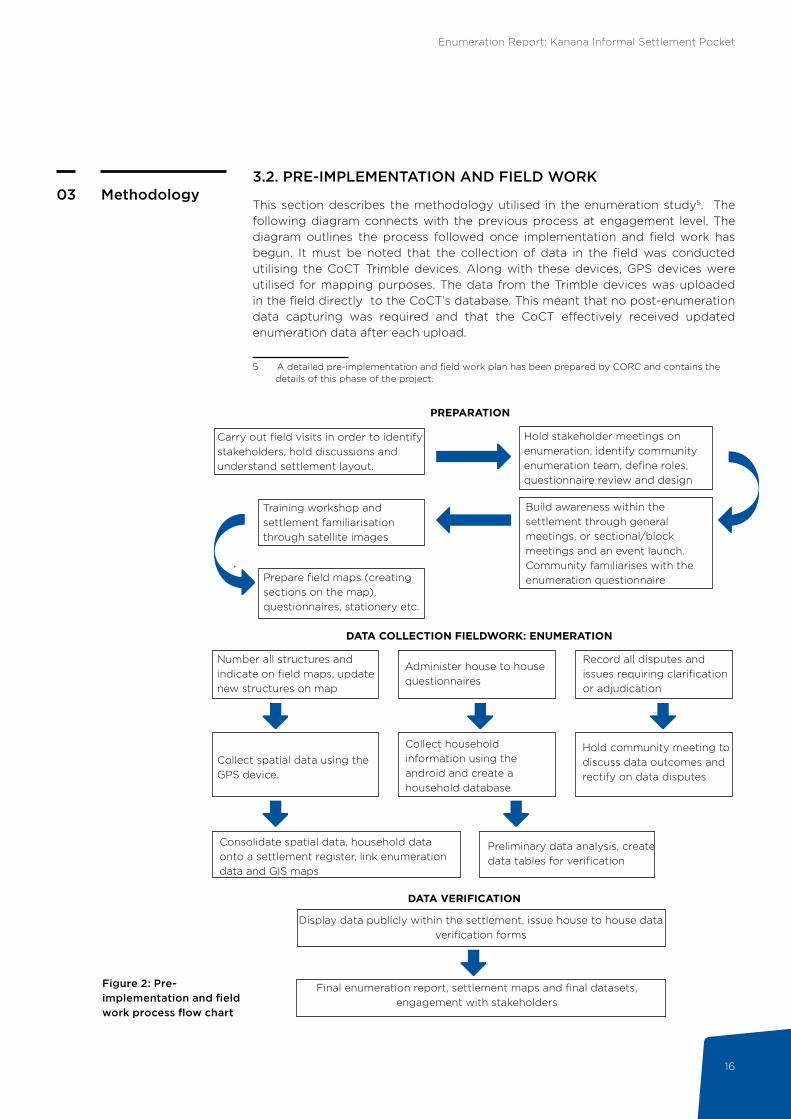
Methodology033.2. PRE-IMPLEMENTATION AND FIELD WORK
This section describes the methodology utilised in the enumeration study5. The following diagram connects with the previous process at engagement level. The diagram outlines the process followed once implementation and field work has begun. It must be noted that the collection of data in the field was conducted utilising the CoCT Trimble devices. Along with these devices, GPS devices were utilised for mapping purposes. The data from the Trimble devices was uploaded in the field directly to the CoCT’s database. This meant that no post-enumeration data capturing was required and that the CoCT effectively received updated enumeration data after each upload.
5 A detailed pre-implementation and field work plan has been prepared by CORC and contains the details of this phase of the project.
Figure 2: Pre-implementation and field work process flow chart
Final enumeration report, settlement maps and final datasets, engagement with stakeholders
DATA COLLECTION FIELDWORK: ENUMERATION
PREPARATION
Carry out field visits in order to identify stakeholders, hold discussions and understand settlement layout.
Training workshop and settlement familiarisation through satellite images
Prepare field maps (creating sections on the map), questionnaires, stationery etc.
Number all structures and indicate on field maps, update new structures on map
Collect spatial data using the GPS device.
Consolidate spatial data, household data onto a settlement register, link enumeration data and GIS maps
Hold stakeholder meetings on enumeration, identify community enumeration team, define roles, questionnaire review and design
Build awareness within the settlement through general meetings, or sectional/block meetings and an event launch. Community familiarises with the enumeration questionnaire
Administer house to house questionnaires
Record all disputes and issues requiring clarification or adjudication
Hold community meeting to discuss data outcomes and rectify on data disputes
Collect household information using the android and create a household database
Preliminary data analysis, create data tables for verification
Display data publicly within the settlement, issue house to house data verification forms
DATA VERIFICATION
Enumeration Report: Kanana Informal Settlement Pocket
17
Methodology03
COMMUNITY VOICES
“I would change the nature of structures here in Kanana, the streets, the drains and the lights so that people can feel the democracy.”
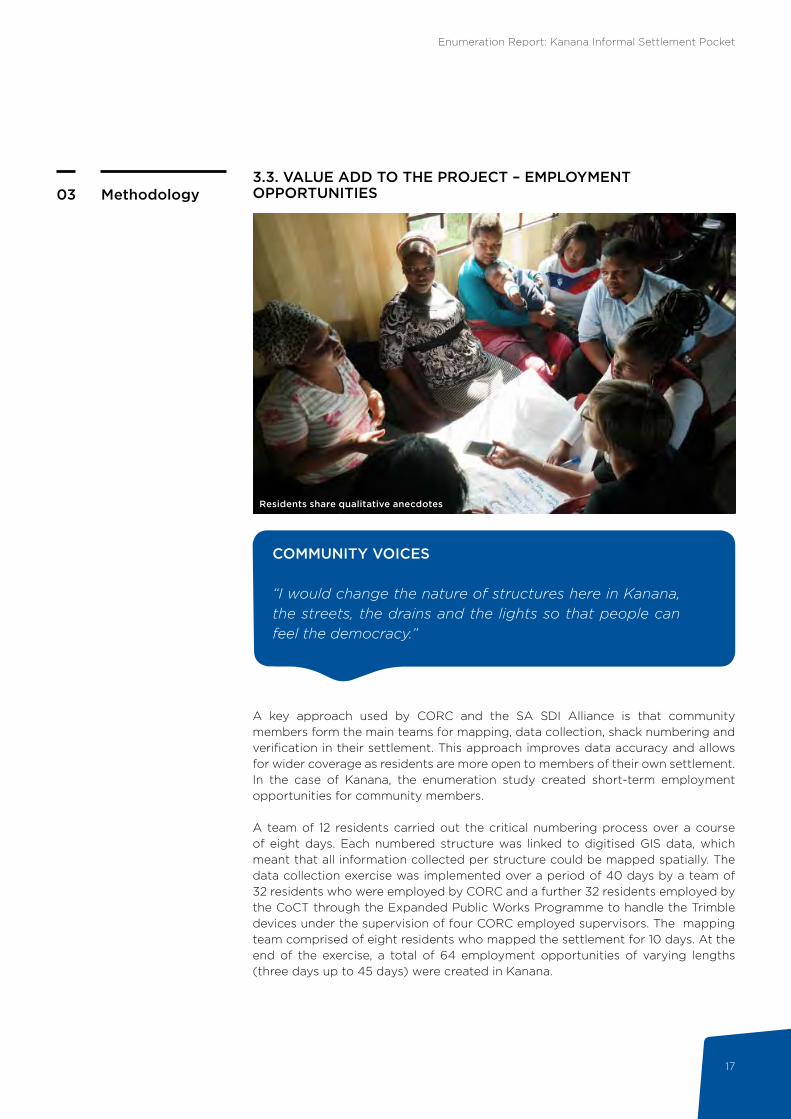
3.3. VALUE ADD TO THE PROJECT – EMPLOYMENT OPPORTUNITIES
A key approach used by CORC and the SA SDI Alliance is that community members form the main teams for mapping, data collection, shack numbering and verification in their settlement. This approach improves data accuracy and allows for wider coverage as residents are more open to members of their own settlement. In the case of Kanana, the enumeration study created short-term employment opportunities for community members.
A team of 12 residents carried out the critical numbering process over a course of eight days. Each numbered structure was linked to digitised GIS data, which meant that all information collected per structure could be mapped spatially. The data collection exercise was implemented over a period of 40 days by a team of 32 residents who were employed by CORC and a further 32 residents employed by the CoCT through the Expanded Public Works Programme to handle the Trimble devices under the supervision of four CORC employed supervisors. The mapping team comprised of eight residents who mapped the settlement for 10 days. At the end of the exercise, a total of 64 employment opportunities of varying lengths (three days up to 45 days) were created in Kanana.
Residents share qualitative anecdotes
Enumeration Report: Kanana Informal Settlement Pocket
18
4. COVERAGE OF THE ENUMERATION AND RESPONSE RATES
Coverage of the enumeration and response rates
04
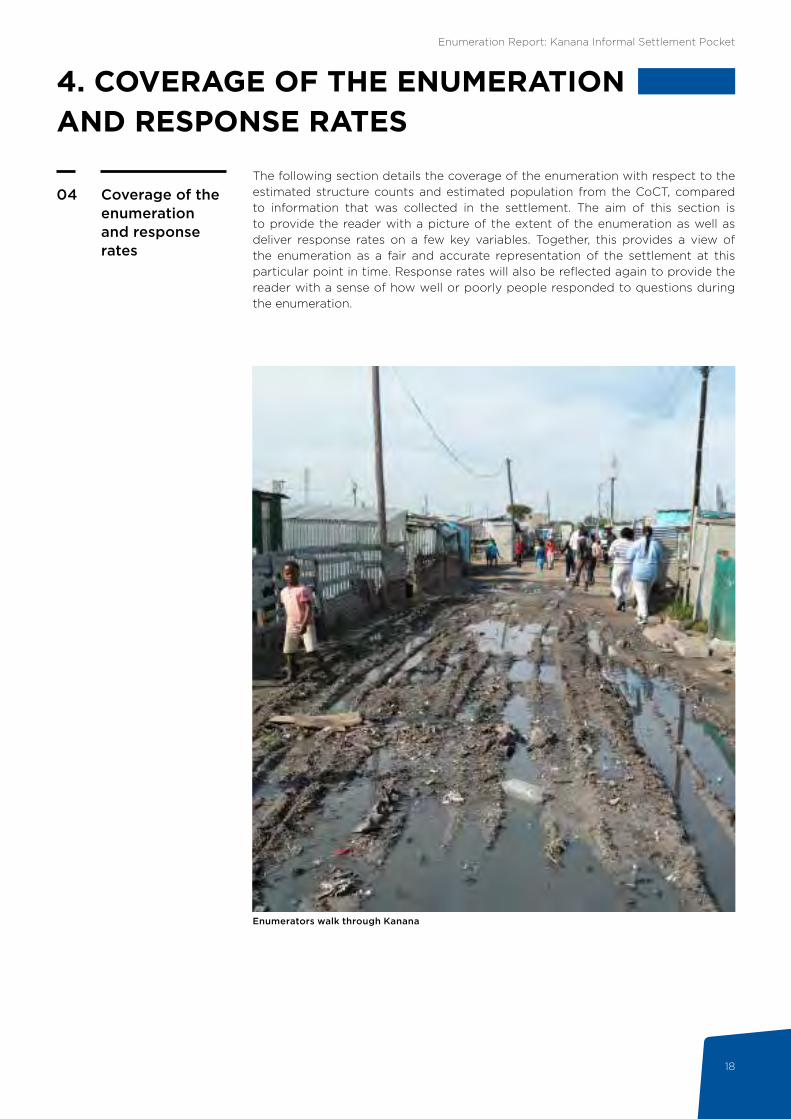
Enumerators walk through Kanana
The following section details the coverage of the enumeration with respect to the estimated structure counts and estimated population from the CoCT, compared to information that was collected in the settlement. The aim of this section is to provide the reader with a picture of the extent of the enumeration as well as deliver response rates on a few key variables. Together, this provides a view of the enumeration as a fair and accurate representation of the settlement at this particular point in time. Response rates will also be reflected again to provide the reader with a sense of how well or poorly people responded to questions during the enumeration.
Enumeration Report: Kanana Informal Settlement Pocket
19
Coverage of the enumeration and response rates
04
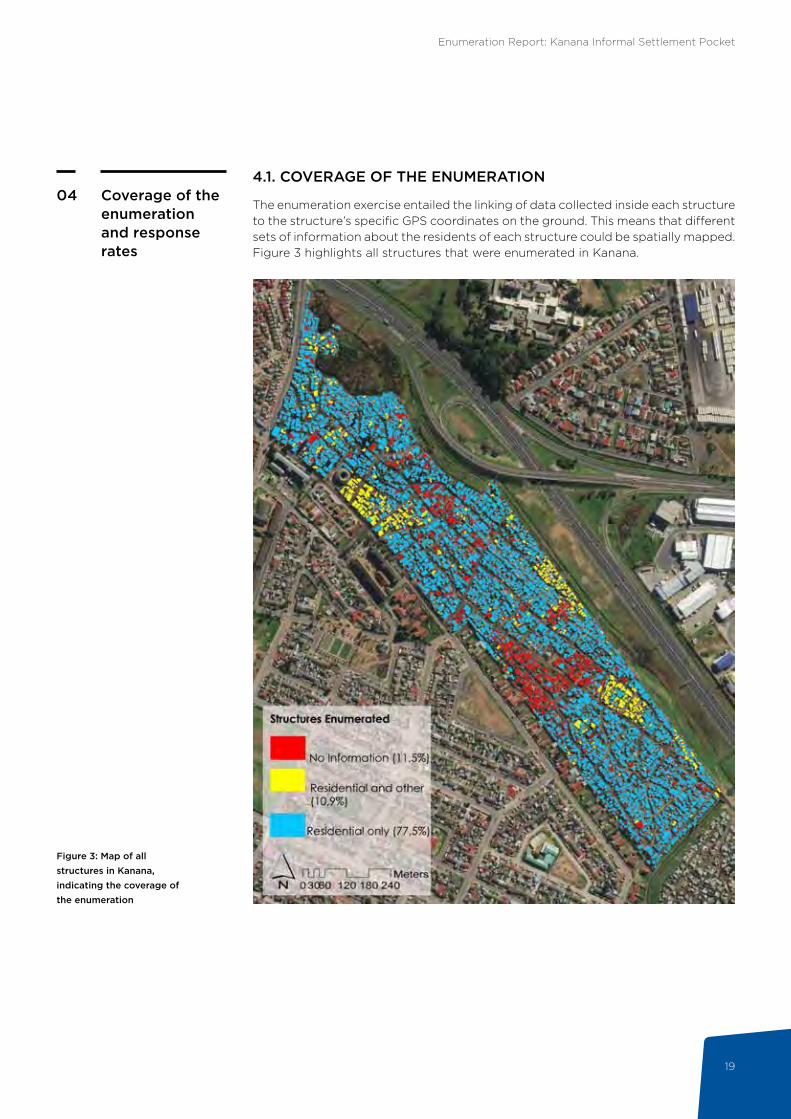
Figure 3: Map of all structures in Kanana, indicating the coverage of the enumeration
4.1. COVERAGE OF THE ENUMERATION
The enumeration exercise entailed the linking of data collected inside each structure to the structure’s specific GPS coordinates on the ground. This means that different sets of information about the residents of each structure could be spatially mapped. Figure 3 highlights all structures that were enumerated in Kanana.
Enumeration Report: Kanana Informal Settlement Pocket
20
Coverage of the enumeration and response rates
04
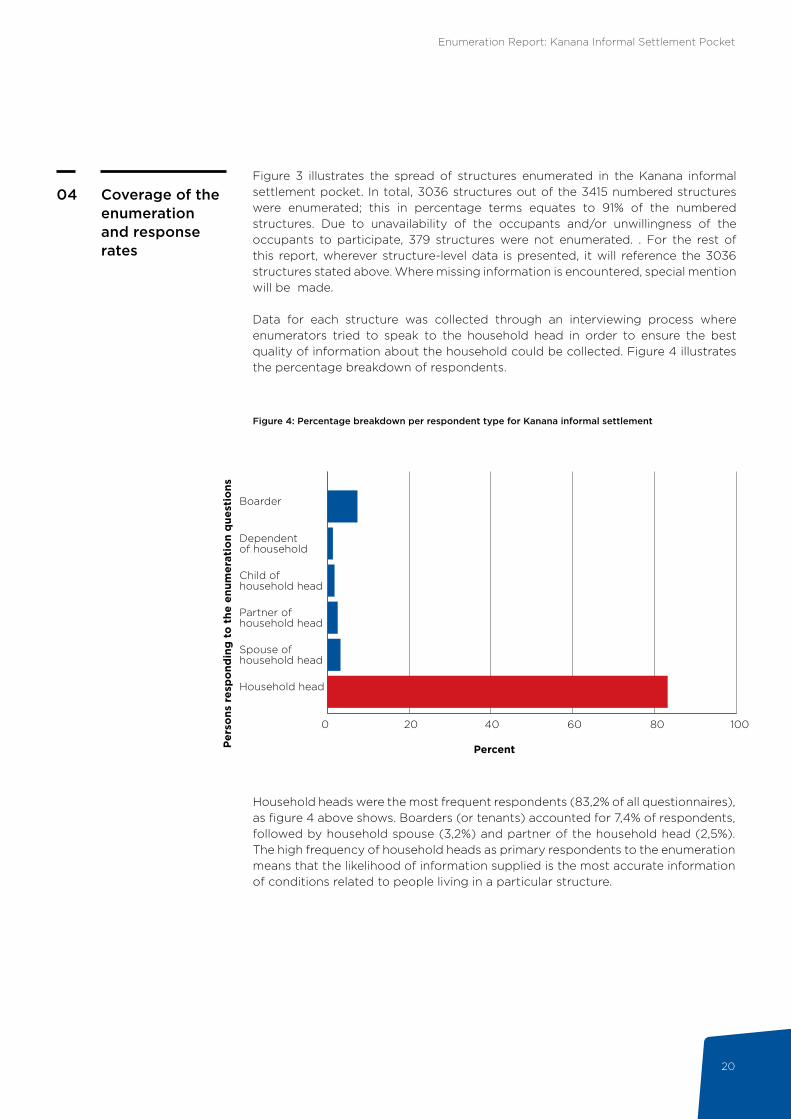
Figure 4: Percentage breakdown per respondent type for Kanana informal settlement
Per
sons
res
po
ndin
g t
o t
he e
num
erat
ion
que
stio
ns
0 20 40 60 80 100
Boarder
Dependent of household
Child of household head
Partner of household head
Spouse of household head
Household head
Percent
Figure 3 illustrates the spread of structures enumerated in the Kanana informal settlement pocket. In total, 3036 structures out of the 3415 numbered structures were enumerated; this in percentage terms equates to 91% of the numbered structures. Due to unavailability of the occupants and/or unwillingness of the occupants to participate, 379 structures were not enumerated. . For the rest of this report, wherever structure-level data is presented, it will reference the 3036 structures stated above. Where missing information is encountered, special mention will be made.
Data for each structure was collected through an interviewing process where enumerators tried to speak to the household head in order to ensure the best quality of information about the household could be collected. Figure 4 illustrates the percentage breakdown of respondents.
Household heads were the most frequent respondents (83,2% of all questionnaires), as figure 4 above shows. Boarders (or tenants) accounted for 7,4% of respondents, followed by household spouse (3,2%) and partner of the household head (2,5%). The high frequency of household heads as primary respondents to the enumeration means that the likelihood of information supplied is the most accurate information of conditions related to people living in a particular structure.
Enumeration Report: Kanana Informal Settlement Pocket
21
Coverage of the enumeration and response rates
04
People living in structure
stated
Frequency count
PercentCumulative
percentPeople
count
1 1458 48,02 48,02 1458
2 552 18,18 66,21 1104
3 422 13,90 80,11 1266
4 309 10,18 90,28 1236
5 179 5,90 96,18 895
6 69 2,27 98,45 414
7 23 0,76 99,21 161
8 16 0,53 99,74 128
9 3 0,10 99,84 27
10 5 0,16 100 50
Total 3036 100 6739
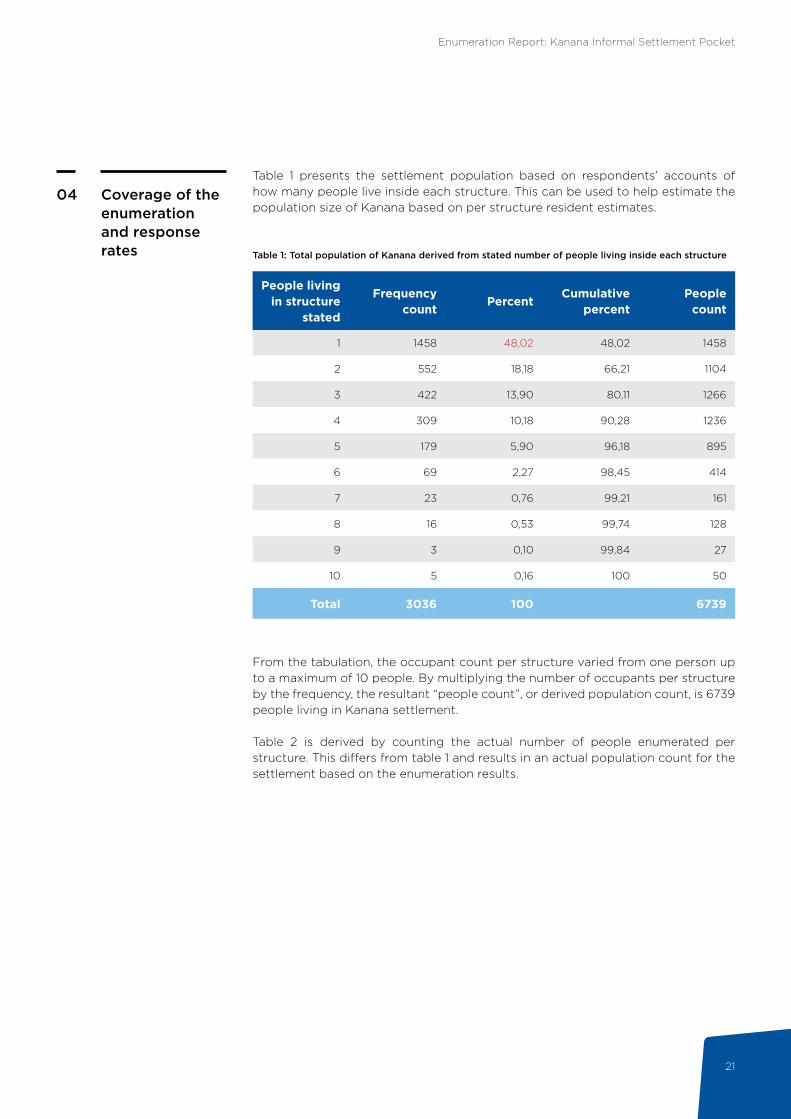
Table 1: Total population of Kanana derived from stated number of people living inside each structure
Table 1 presents the settlement population based on respondents’ accounts of how many people live inside each structure. This can be used to help estimate the population size of Kanana based on per structure resident estimates.
From the tabulation, the occupant count per structure varied from one person up to a maximum of 10 people. By multiplying the number of occupants per structure by the frequency, the resultant “people count”, or derived population count, is 6739 people living in Kanana settlement.
Table 2 is derived by counting the actual number of people enumerated per structure. This differs from table 1 and results in an actual population count for the settlement based on the enumeration results.

Enumeration Report: Kanana Informal Settlement Pocket
22
Coverage of the enumeration and response rates
04 People enumerated
Frequency count
PercentCumulative
percentPeople
count
1 1452 47,83 47,83 1452
2 579 19,07 66,90 1158
3 413 13,60 80,50 1239
4 312 10,28 90,78 1248
5 165 5,43 96,21 825
6 62 2,04 98,25 372
7 31 1,02 99,28 217
8 15 0,49 99,77 120
9 4 0,13 99,90 36
10 3 0,10 100,00 30
Total 3036 100 6697
Households stated
Frequency count
PercentCumulative
percentHousehold
count
1 2896 95,39 95,39 2896
2 117 3,85 3,85 234
3 23 0,76 0,76 69
Total 3036 100 3199
Table 2: Total population of Kanana based on actual number of persons enumerated per structure
Table 3: Total households for Kanana derived from stated number of households
Table 2 above illustrates the actual number of people recorded in the enumeration is 6697. A small variance of 0,6% is observed between the number of occupants per structure (6739) and the number of people recorded (6697). This small variance can be attributed to respondents incorrectly indicating the number of occupants per structure. For the purposes of this analysis, the figures and population count reflected in table 2 will be used, which confirms the population of Kanana to be 6697 people.
Each respondent was asked to indicate how many households live inside each structure. This was based on the definition of a household being a group of people living in a structure sharing one common area or eating from the same pot. This method allows for the recording of more than one household per structure. Household count is presented in table 3.
According to residents, 3199 households reside in 3036 structures. Single households are most prevalent and constitute 95,4% of households in the pocket. There are 140 structures that indicate the presence of more than one household.

Enumeration Report: Kanana Informal Settlement Pocket
23
Coverage of the enumeration and response rates
04
Kanana household enumeration
4.2. RESPONSE RATES
A majority of respondents were the head of the household. 83% of respondents6 defined themselves as household heads, and a further 5,8% were closely associated with the household head (spouse or partner). This means that the best possible data was collected at the household level.
Questions around structure ownership, main reasons for moving to the settlement, main use of the structure, electricity supply, sanitation usage, water access, health access and number of people and households had 100% response rates. Other questions were not fully responded to:
80% responded to questions related to reasons why people have moved out of the settlement96% responded to the question household income99,4% responded to grants question99,4% responded to current educational enrolment99,4% responded to marital status
6 It must be noted that for certain variables the term “respondent” is used. This specifically refers to a person responding to questions. These questions could be individual in nature but where they refer to household-level information, this data shall be referenced as such.

Enumeration Report: Kanana Informal Settlement Pocket
24
Summary findings
05
KANANA SUMMARY FINDINGS
Age of settlement 27 years (founded in 1989)
Types of structures Shacks built predominantly from zinc, wood and plastic
Total land occupied 23,14ha
Population density 159 households per hectare
Population 6697
Average household size 2,1
Total structures numbered 3415
Total structures enumerated 3036
Total males 2930
Total females 3723 (44 instances of gender not recorded)
Female household heads 43,9%
Total children under 18 years of age 1929
Number of toilets 824
Toilet to people ratio 1:8
Toilet to household ratio 1:4
Number of taps 56
Tap to people ratio 1:120
Tap to household ratio 1:57
Electricity coverage 47% prepaid meters, 43% connection to neighbours’ meters and the balance with no electricity
Unemployment rate 53% (expanded definition)
Main priorities Access to formal housing, waste collection, access to toilets
Disasters experienced by residents Flooding every winter, shack fires
South African residents 97%
Non-South African residents 3%
5. SUMMARY FINDINGS
This section presents a high-level summary of the findings and the analysis of the data gathered in the enumeration study.
Residents refer to toilets in Kanana as bucket system toilets. These are equivalent to what the City of Cape Town calls container toilets, which are installed by contractors and serviced three times a week. They are used in areas where there is no vehicle access and no scope to install waterborne infrastructure.
Ratios in this table can be read in terms of the national standard for households per toilet (5:1) and households per tap (25:1). National norms for adequate service levels must ensure the health and safety of household users and include: access to a standpipe that supplies 25 litres of potable water per person per day within 200m of a dwelling; VIP or equivalent toilets in rural or low density urban areas; waterborne or equivalent sanitation in dense urban areas; and either pre-paid or metered systems in terms of electricity.7
7 COGTA 2005

Enumeration Report: Kanana Informal Settlement Pocket
25
Analysis06
Figure 5: Percentage breakdown of structure ownership
8.1
13.9
78.1
78.1%Own the structure
8.1%Pay rent
13.9%Living rent free
6. ANALYSIS
In this section, a more detailed analysis of the enumeration data for Kanana informal settlement pocket is presented. The focus of this section is on data collected at the individual level, priorities and migration. Data on access to various basic services and ranking of priorities is also presented. Finally, the last part of this section presents data on demographics of the population and potential implications for human settlements.
6.1. STRUCTURE ANALYSIS
The study sought to determine structure ownership levels within the settlement. Each respondent was asked to indicate whether they owned the structure, paid rent or lived in it rent-free.
Figure 5 illustrates that 78,1% of respondents reported that current occupants own their structures, that 8,1% pay rent and that 13,9% reported living rent-free. Just over a fifth (21,9%) of Kanana residents, or 666 households, are subordinate to a lessor, which might translate into a precarious security of occupation. It could also mean that those living rent-free are members of the household head’s family or a dependent.
To better understand the living arrangements for residents, a question was asked around number of rooms in the structure. Table 4 provides an overview of rooms per structure.

Enumeration Report: Kanana Informal Settlement Pocket
26
Analysis06Table 4: Number of rooms per structure
Number of rooms
Frequency count PercentCumulative
percent
1 1274 41,96 41,96
2 890 29,31 71,28
3 528 17,39 88,67
4 275 9,06 97,73
5 45 1,48 99,21
6 16 0,53 99,74
7 4 0,13 99,87
8 4 0,13 100
Total 3036 100
Structures in Kanana
A high variability in the composition of living spaces in shacks was reported. Table 4 above reveals that less than half of the structures (42,%) had one room, and that 29% reported having two or three (17,4%) rooms. This variability can be explained by the age of the settlement, which is estimated to be between 27 and 35 years old. Typically, the first occupants claim larger spaces and build larger rooms. Newer arrivals are often left with no choice but to build smaller sized one-room shacks. The quality of open spaces for children to play is also restricted, and they tend to play in the streets and on informal footpaths.
Enumeration Report: Kanana Informal Settlement Pocket
27
Analysis06
Table 5: Number of people per structure
People enumerated
Frequency count
PercentCumulative
peopleCumulative
percent
1 1452 47,83 1452 47,83
2 579 19,07 2610 66,90
3 413 13,60 3849 80,50
4 312 10,28 5097 90,78
5 165 5,43 5922 96,21
6 62 2,04 6294 98,25
7 31 1,02 6511 99,28
8 15 0,49 6631 99,77
9 4 0,13 6667 99,90
10 3 0,10 6697 100,00
Total 3036 100
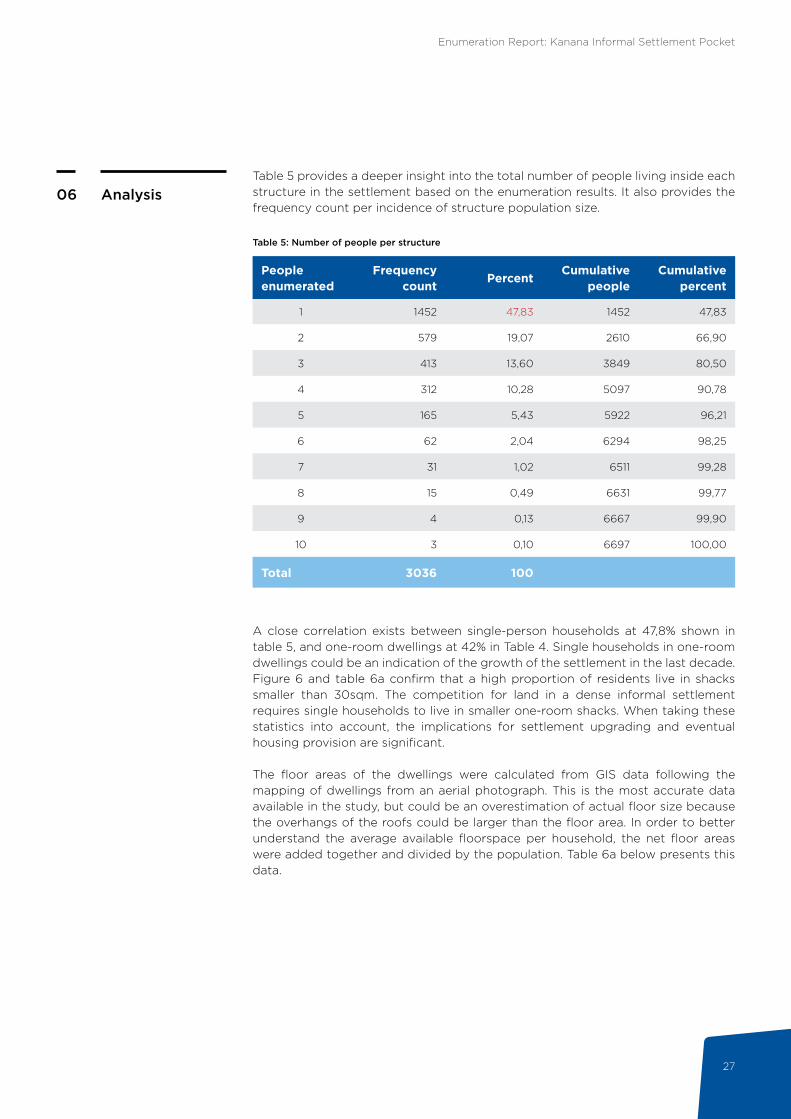
Table 5 provides a deeper insight into the total number of people living inside each structure in the settlement based on the enumeration results. It also provides the frequency count per incidence of structure population size.
A close correlation exists between single-person households at 47,8% shown in table 5, and one-room dwellings at 42% in Table 4. Single households in one-room dwellings could be an indication of the growth of the settlement in the last decade. Figure 6 and table 6a confirm that a high proportion of residents live in shacks smaller than 30sqm. The competition for land in a dense informal settlement requires single households to live in smaller one-room shacks. When taking these statistics into account, the implications for settlement upgrading and eventual housing provision are significant.
The floor areas of the dwellings were calculated from GIS data following the mapping of dwellings from an aerial photograph. This is the most accurate data available in the study, but could be an overestimation of actual floor size because the overhangs of the roofs could be larger than the floor area. In order to better understand the average available floorspace per household, the net floor areas were added together and divided by the population. Table 6a below presents this data.

Enumeration Report: Kanana Informal Settlement Pocket
28
Analysis06
Figure 6: Percentage breakdown for square metres per person of floor area provided by a structure, categorised
greater than 60sqm
50.01 - 60sqm
40.01 - 50sqm
35.01 - 40sqm
30.01 - 35sqm
25.01 - 30sqm
20.01 - 25sqm
15.01 - 20sqm
10.01 - 15sqm
5.01 - 10sqm
2.01 - 5sqm
2sqm or less
0.00 5.00 10.00 15.00Percent
Squa
re m
etre
s p
er p
erso
n ca
teg
ori
sed
In Kanana, 59% of all residents live in structures smaller than 30sqm. Another 23% of households enjoy shelters of 35 to 60sqm. This data however does not take into account the number of occupants per structure, which can be a measure of overcrowding. In Figure 6, total floor space per dwelling was divided by the number of occupants to arrive at a floor space per person ratio.
Table 6a: Square metres of floor space
Square metres of floor space per person categorised
Frequency count
PercentCumulative
percent
5.01 - 10sqm 65 2,14 2,14
10.01 - 15sqm 460 15,15 17,29
15.01 - 20sqm 442 14,56 31,85
20.01 - 25sqm 452 14,89 46,74
25.01 - 30sqm 382 12,58 59,32
30.01 - 35sqm 268 8,83 68,15
35.01 - 40sqm 222 7,31 75,46
40.01 - 50sqm 313 10,31 85,77
50.01 - 60sqm 170 5,60 91,37
greater than 60sqm 262 8,63 100,00
Total 3036 100

Enumeration Report: Kanana Informal Settlement Pocket
29
Analysis06
Table 6b: Square metres of floor space categorised available per person excluding structures with one occupant
Square metres of floor space per person categorised
Frequency count PercentCumulative
percent
2sqm or less 12 0,76 0,76
2.01 - 5sqm 320 20,20 20,96
5.01 - 10sqm 570 35,98 56,94
10.01 - 15sqm 330 20,83 77,78
15.01 - 20sqm 152 9,60 87,37
20.01 - 25sqm 99 6,25 93,62
25.01 - 30sqm 35 2,21 95,83
30.01 - 35sqm 32 2,02 97,85
35.01 - 40sqm 14 0,88 98,74
40.01 - 50sqm 7 0,44 99,18
50.01 - 60sqm 4 0,25 99,43
Greater than 60sqm 9 0,57 100
Total 1584 100
When the total floor space of a dwelling is divided by the number of occupants, more than half of all residents excluding single person households have about 5 to 15 sqm to themselves. Further analysis of the floor areas is presented above in table 6b which indicates that 77,7% of all residents have access to less than 15sqm and that 35% of residents have access to 5 to 10sqm. The concentration of small shacks separated by informal roads and footpaths should be considered for any future settlement upgrade and eventual housing.
Respondents were asked about the main use of their structure. Where they indicated uses other than residential, this was recorded in the database but is not reflected in this analysis. Table 7 provides the breakdown of structure use.
This analysis indicates that 49% of residents have access to less that 15sqm floorspace, and 20% of residents have access to 5 to 10sqm floorspace. Table 6b excludes structures with only one occupant to better reflect square metres per person in structures with multiple occupants.

Enumeration Report: Kanana Informal Settlement Pocket
30
Table 7: Main use of structures
Structure main useFrequency
countPercent
Residential only 2661 87,65
Residential and Other 375 12,35
Total 3036 100
Analysis06
Container used as community hall
Structure used as spaza shop
The majority of respondents indicated that their dwellings were used for residential purposes only. Secondary use of dwellings ranged from spaza shops, places of worship, crèches, shebeens and hairdressers.
Enumeration Report: Kanana Informal Settlement Pocket
31
Analysis06
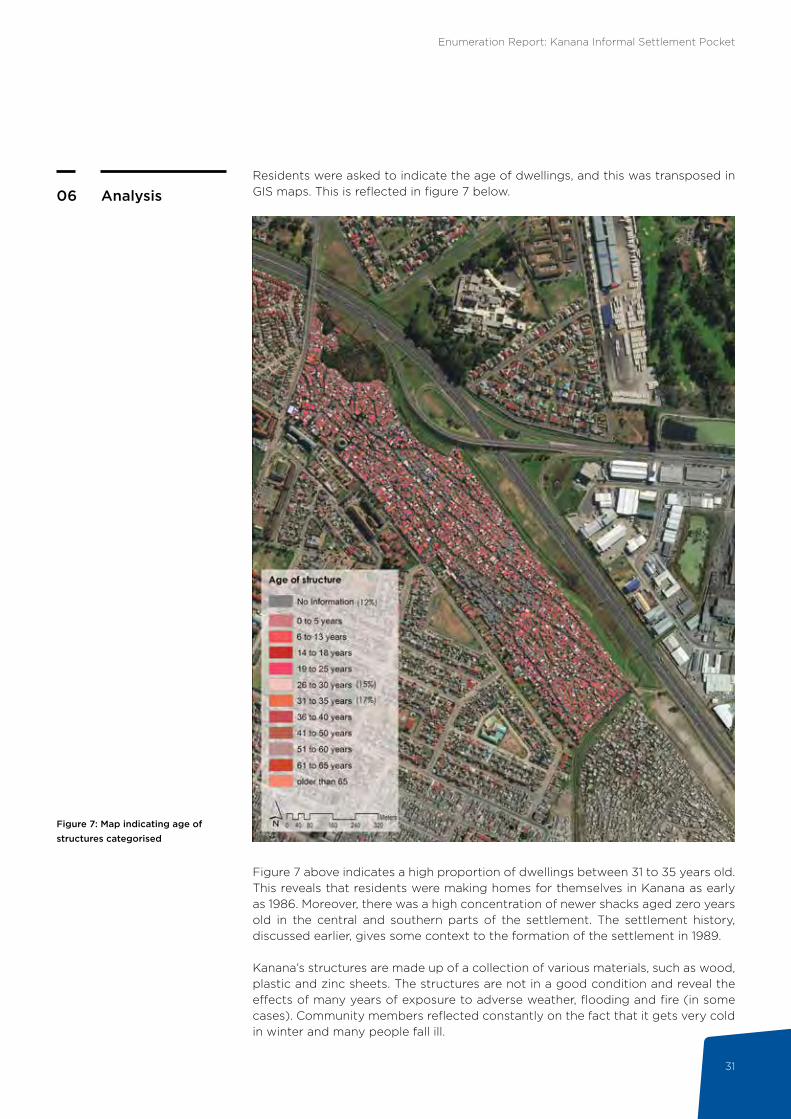
Figure 7: Map indicating age of structures categorised
Residents were asked to indicate the age of dwellings, and this was transposed in GIS maps. This is reflected in figure 7 below.
Figure 7 above indicates a high proportion of dwellings between 31 to 35 years old. This reveals that residents were making homes for themselves in Kanana as early as 1986. Moreover, there was a high concentration of newer shacks aged zero years old in the central and southern parts of the settlement. The settlement history, discussed earlier, gives some context to the formation of the settlement in 1989.
Kanana’s structures are made up of a collection of various materials, such as wood, plastic and zinc sheets. The structures are not in a good condition and reveal the effects of many years of exposure to adverse weather, flooding and fire (in some cases). Community members reflected constantly on the fact that it gets very cold in winter and many people fall ill.
Enumeration Report: Kanana Informal Settlement Pocket
32
Analysis06
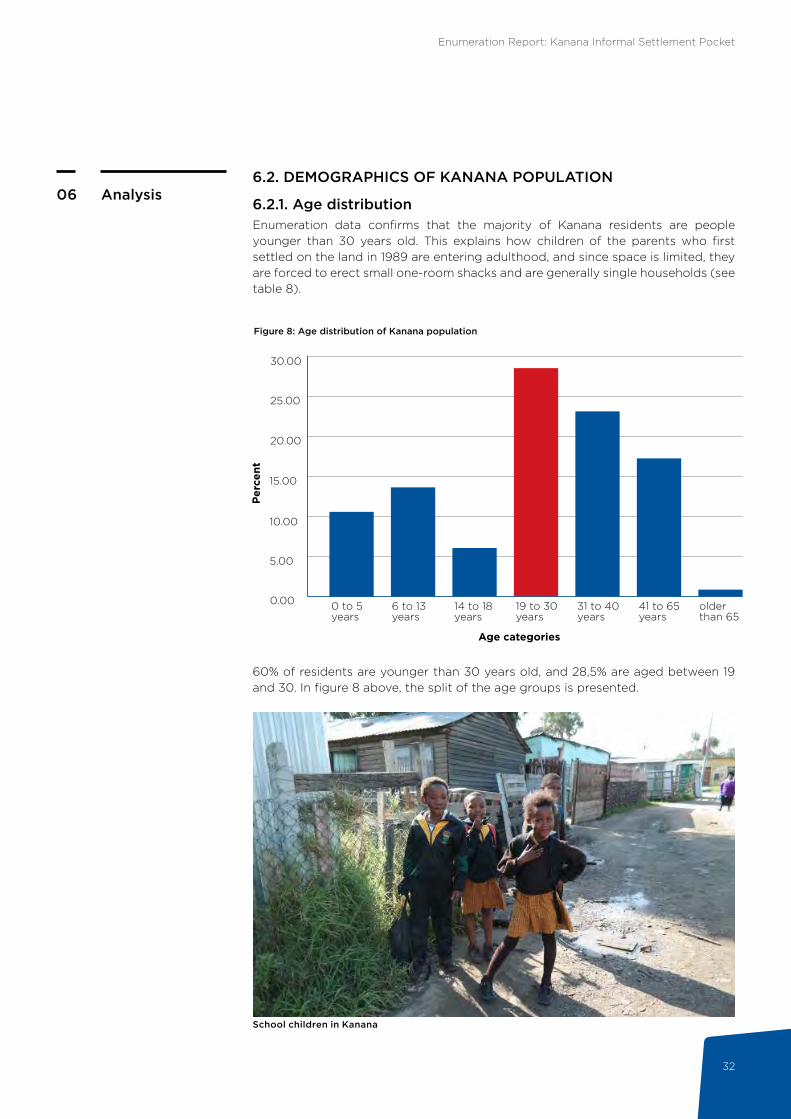
Figure 8: Age distribution of Kanana population
0.00
5.00
10.00
15.00
20.00
25.00
30.00
0 to 5 years
6 to 13 years
14 to 18 years
19 to 30 years
31 to 40 years
41 to 65 years
older than 65
Age categories
Per
cent
School children in Kanana
6.2. DEMOGRAPHICS OF KANANA POPULATION
6.2.1. Age distributionEnumeration data confirms that the majority of Kanana residents are people younger than 30 years old. This explains how children of the parents who first settled on the land in 1989 are entering adulthood, and since space is limited, they are forced to erect small one-room shacks and are generally single households (see table 8).
60% of residents are younger than 30 years old, and 28,5% are aged between 19 and 30. In figure 8 above, the split of the age groups is presented.
Enumeration Report: Kanana Informal Settlement Pocket
33
Age CategoriesFrequency
countPercent
Cumulative percent
14 to 18 years 14 1,00 1,00
19 to 25 years 326 23,19 24,18
26 to 30 years 305 21,69 45,87
31 to 35 years 287 20,41 66,29
36 to 40 years 190 13,51 79,80
41 to 50 years 168 11,95 91,75
51 to 60 years 83 5,90 97,65
61 to 65 years 18 1,28 98,93
older than 65 years 15 1,07 100
Total 1406 100
Analysis06
Table 8: Age distribution of single person households
Table 9: Employment status by gender for Kanana residents aged 19 to 30 years
Employment status Male Female Total
Employed 407 263 670
Self-employed 32 18 50
Unemployed 435 721 1156
Total 874 1002 1876
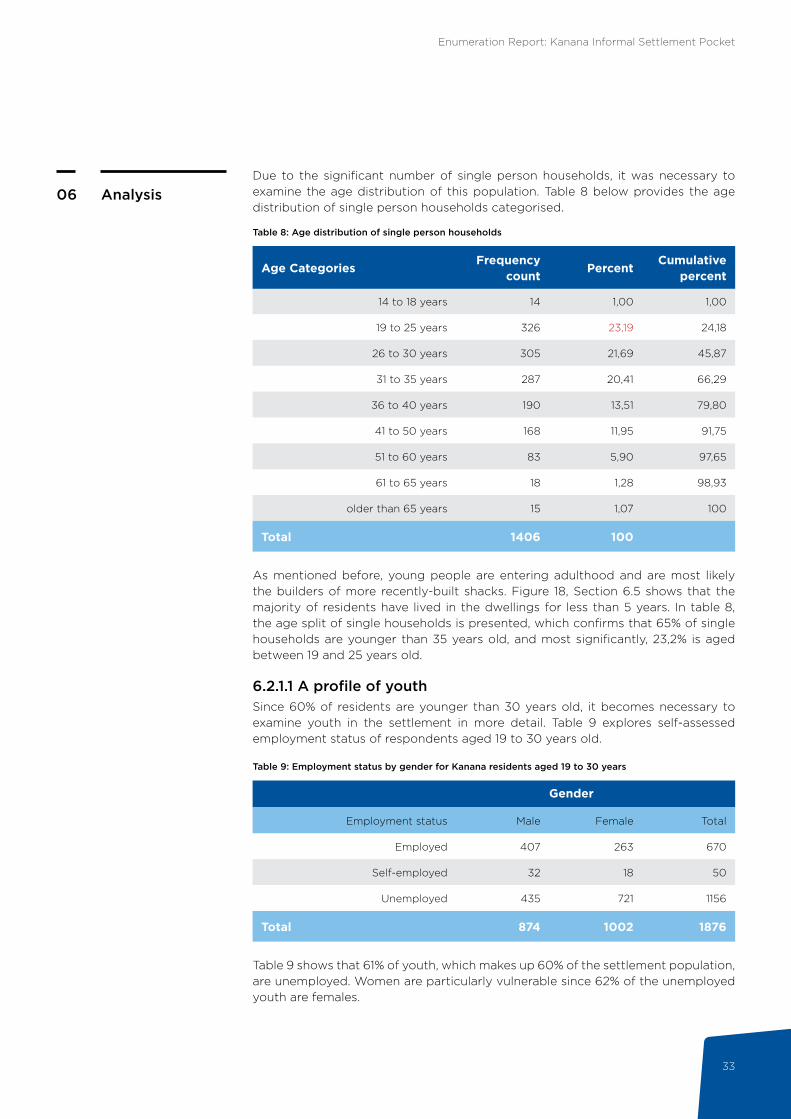
Due to the significant number of single person households, it was necessary to examine the age distribution of this population. Table 8 below provides the age distribution of single person households categorised.
As mentioned before, young people are entering adulthood and are most likely the builders of more recently-built shacks. Figure 18, Section 6.5 shows that the majority of residents have lived in the dwellings for less than 5 years. In table 8, the age split of single households is presented, which confirms that 65% of single households are younger than 35 years old, and most significantly, 23,2% is aged between 19 and 25 years old.
6.2.1.1 A profile of youthSince 60% of residents are younger than 30 years old, it becomes necessary to examine youth in the settlement in more detail. Table 9 explores self-assessed employment status of respondents aged 19 to 30 years old.
Table 9 shows that 61% of youth, which makes up 60% of the settlement population, are unemployed. Women are particularly vulnerable since 62% of the unemployed youth are females.
Gender

Enumeration Report: Kanana Informal Settlement Pocket
34
Analysis06
Table 10: Income distribution for age cohort 19 to 30 years old
Figure 9: Gender breakdown
55.9644.04%
55.96%
44.04%
Female
Male
A young population, high unemployment, and precarious livelihoods create conditions of high vulnerability, especially for women. In other circumstances, this could be an opportunity for entrepreneurial activity, but only 2% of working youth reported being self-employed. This is further explored in table 10 where the income distribution of youth aged 19 to 30 years old is analysed.
Table 10 shows that more than 70% of the working youth aged between 19 and 30 years old earn less than R1500 per month, and almost 23% earn between R1501 – and R3500. 36% of youth earn no income.
6.2.2. Gender breakdownThe enumeration covered a broad spectrum of demographic data. Figure 9 provides us with the gender breakdown of the settlement population.
56 out of every 100 people are women, as figure 9 illustrates. This is slightly higher than the national average of 52 women per every 100 people (StatsSA, Census 2011).
Income categories
Frequency count PercentCumulative
percent
No Income 458 36,15 36,15
R1 - R400 61 4,81 40,96
R401 - R800 119 9,39 50,36
R801 - R1500 272 21,47 71,82
R1501 - R3500 291 22,97 94,79
R3501 - R7500 57 4,50 99,29
R7501 - R15000 8 0,63 99,92
above R15000 1 0,08 100
Total 1267 100
Enumeration Report: Kanana Informal Settlement Pocket
35
Analysis06
Table 11: Number of people enumerated per structure by gender of household heads (column percentages)
Number of people enumerated per structure
Employment status Male (%) Female (%) Total
1 50,87 34,65 43,75
2 17,62 22,38 19,71
3 11,34 18,36 14,42
4 10,12 12,71 11,26
5 6,16 6,1 6,13
6 2,5 2,75 2,61
7 0,93 1,56 1,21
8 0,35 0,82 0,55
9 0,12 0,3 0,2
10 0 0,37 0,16
Total 100 100 100
n=3067
Table 12: Employment status by gender for respondents 16 years & older (row percentages)
Employment status 16 years and older
Male Female Total
Employed 58,89 41,11 100
Self-employed 57,4 42,6 100
Unemployed 36,31 63,69 100
Total 46,72 53,28 100
n=4867
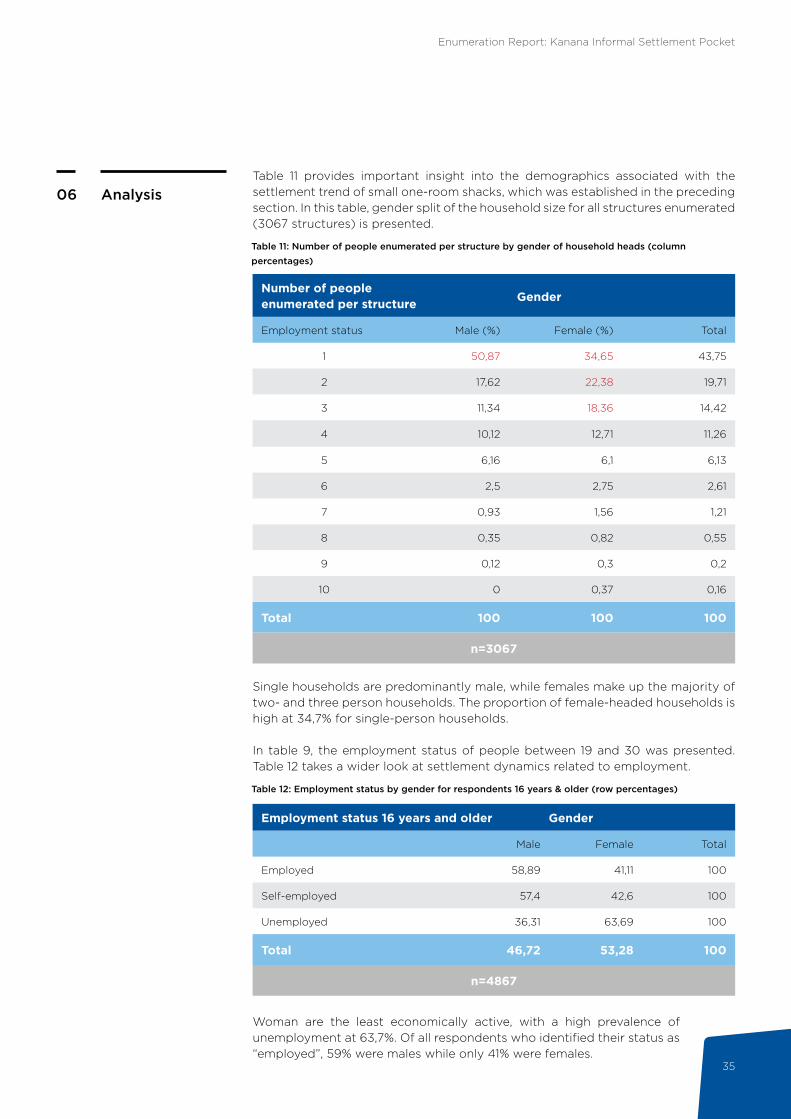
Table 11 provides important insight into the demographics associated with the settlement trend of small one-room shacks, which was established in the preceding section. In this table, gender split of the household size for all structures enumerated (3067 structures) is presented.
Single households are predominantly male, while females make up the majority of two- and three person households. The proportion of female-headed households is high at 34,7% for single-person households.
In table 9, the employment status of people between 19 and 30 was presented. Table 12 takes a wider look at settlement dynamics related to employment.
Woman are the least economically active, with a high prevalence of unemployment at 63,7%. Of all respondents who identified their status as “employed”, 59% were males while only 41% were females.
Gender
Gender
Enumeration Report: Kanana Informal Settlement Pocket
36
Analysis06
Table 13: Age categorised by school enrolment for individuals aged 0 to 18 years old
Age categorised
Pre-school
Primary school
Secondary school
College UniversityNot
in any school
Total
0 to 5 years 364 10 0 0 0 329 703
6 to 13 years 54 805 18 0 0 22 899
14 to 18 years 0 77 285 5 2 35 404
Total 418 892 303 5 2 386 2006
COMMUNITY VOICES
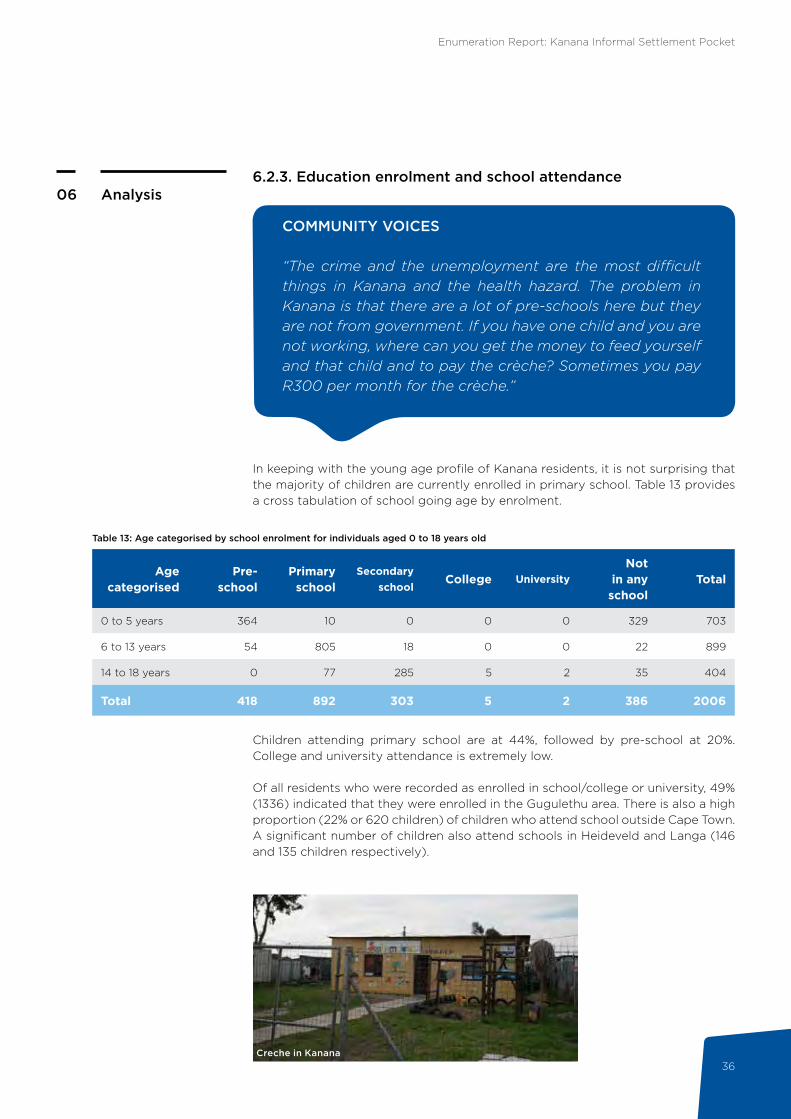
“The crime and the unemployment are the most difficult things in Kanana and the health hazard. The problem in Kanana is that there are a lot of pre-schools here but they are not from government. If you have one child and you are not working, where can you get the money to feed yourself and that child and to pay the crèche? Sometimes you pay R300 per month for the crèche.”
6.2.3. Education enrolment and school attendance
In keeping with the young age profile of Kanana residents, it is not surprising that the majority of children are currently enrolled in primary school. Table 13 provides a cross tabulation of school going age by enrolment.
Children attending primary school are at 44%, followed by pre-school at 20%. College and university attendance is extremely low.
Of all residents who were recorded as enrolled in school/college or university, 49% (1336) indicated that they were enrolled in the Gugulethu area. There is also a high proportion (22% or 620 children) of children who attend school outside Cape Town. A significant number of children also attend schools in Heideveld and Langa (146 and 135 children respectively).
Creche in Kanana

Enumeration Report: Kanana Informal Settlement Pocket
37
Analysis06
Table 14: Age by employment status (row frequencies & percentages)
Age categories EmployedSelf-
employedUn-
employedTotal
14 to 18 years 4 2 245 251
Row % 1.59 0.80 97.61 100.00
19 to 25 years 271 28 734 1033
Row % 26.23 2.71 71.06 100.00
26 to 30 years 399 22 423 844
Row % 47.27 2.61 50.12 100.00
31 to 35 years 452 34 355 841
Row % 53.75 4.04 42.21 100.00
36 to 40 years 395 23 263 681
Row % 58.00 3.38 38.62 100.00
41 to 50 years 416 44 322 782
Row % 53.20 5.63 41.18 100.00
51 to 60 years 137 11 144 292
Row % 46.92 3.77 49.32 100.00
61 to 65 years 7 4 54 65
Row % 10.77 6.15 83.08 100.00
Total 2081 168 2540 4789
Row % 43.45 3.51 53.04 100.00
6.2.4. EmploymentIn Kanana there are 4538 individuals who would be classified as working age (19 years old to 64 years old). The majority of residents are unemployed with the remaining 47% of residents either employed or self-employed. Unemployment in Kanana is double the national figure of 26.7%8.
In table 9, it was established that youth unemployment is extremely worrying as more than 60% of people aged 19 to 30 years old are unemployed. Table 14 provides a cross tabulation of age by self-assessed employment status to better understand unemployment trends within different age cohorts.
8 StatsSA, 2016
Enumeration Report: Kanana Informal Settlement Pocket
38
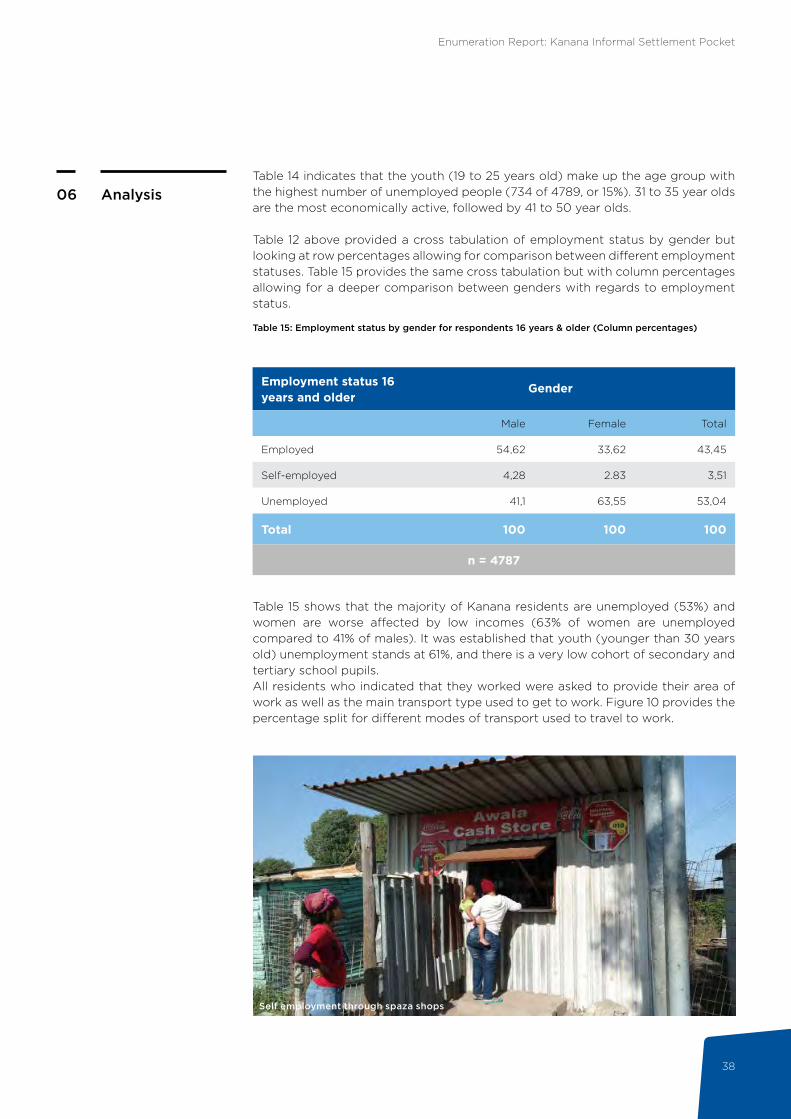
Analysis06Table 14 indicates that the youth (19 to 25 years old) make up the age group with the highest number of unemployed people (734 of 4789, or 15%). 31 to 35 year olds are the most economically active, followed by 41 to 50 year olds. Table 12 above provided a cross tabulation of employment status by gender but looking at row percentages allowing for comparison between different employment statuses. Table 15 provides the same cross tabulation but with column percentages allowing for a deeper comparison between genders with regards to employment status.
Table 15: Employment status by gender for respondents 16 years & older (Column percentages)
Employment status 16 years and older
Male Female Total
Employed 54,62 33,62 43,45
Self-employed 4,28 2.83 3,51
Unemployed 41,1 63,55 53,04
Total 100 100 100
n = 4787
Table 15 shows that the majority of Kanana residents are unemployed (53%) and women are worse affected by low incomes (63% of women are unemployed compared to 41% of males). It was established that youth (younger than 30 years old) unemployment stands at 61%, and there is a very low cohort of secondary and tertiary school pupils. All residents who indicated that they worked were asked to provide their area of work as well as the main transport type used to get to work. Figure 10 provides the percentage split for different modes of transport used to travel to work.
Self employment through spaza shops
Gender

Enumeration Report: Kanana Informal Settlement Pocket
39
Analysis06
Figure 10: Percentage breakdown of main transport type to work
Earlier, it was observed that Kanana enjoys close proximity to the Airport Industria. Other areas of employment include Epping. The majority of commuters travel by train, followed by minibus taxi and walking.
All residents who indicated that they worked were also asked to estimate the travel time to their place of employment. Table 16 provides a breakdown of this estimation.
Other 1.37%
3.70%
2.12%
0.22%
16.62%
6.52%
12.83%
56.63%
Percent
Tran
spo
rt
Other car
Own car
Bicycle
Mini taxi bus
Train
Bus
Walk
0 10 20 30 40 50 60
COMMUNITY VOICES
“The advantages to be in Kanana are for work. There is this airport industria where most of the people of Kanana are working. We also have malls where some people are working. The train is not far from Kanana so some people take the train to go to Epping.”
Temporary work through EPWP
Enumeration Report: Kanana Informal Settlement Pocket
40
Analysis06Table 16: Travel time to work
Travel time to workFrequency
countPercent
Cumulative percent
Less than 15 minutes 185 8,16 8,16
15 to 29 minutes (just under half an hour) 791 34,89 43,05
30 to 59 minutes (just under an hour) 968 42,70 85,75
60 to 89 minutes (just under an hour and a half) 239 10,54 96,29
90 minutes and more 72 3,18 99,47
Don't know 12 0,53 100
Total 2267 100
Table 16 illustrates that largest number of commuters travel between 30 minutes and an hour, while a large proportion travel less than that.
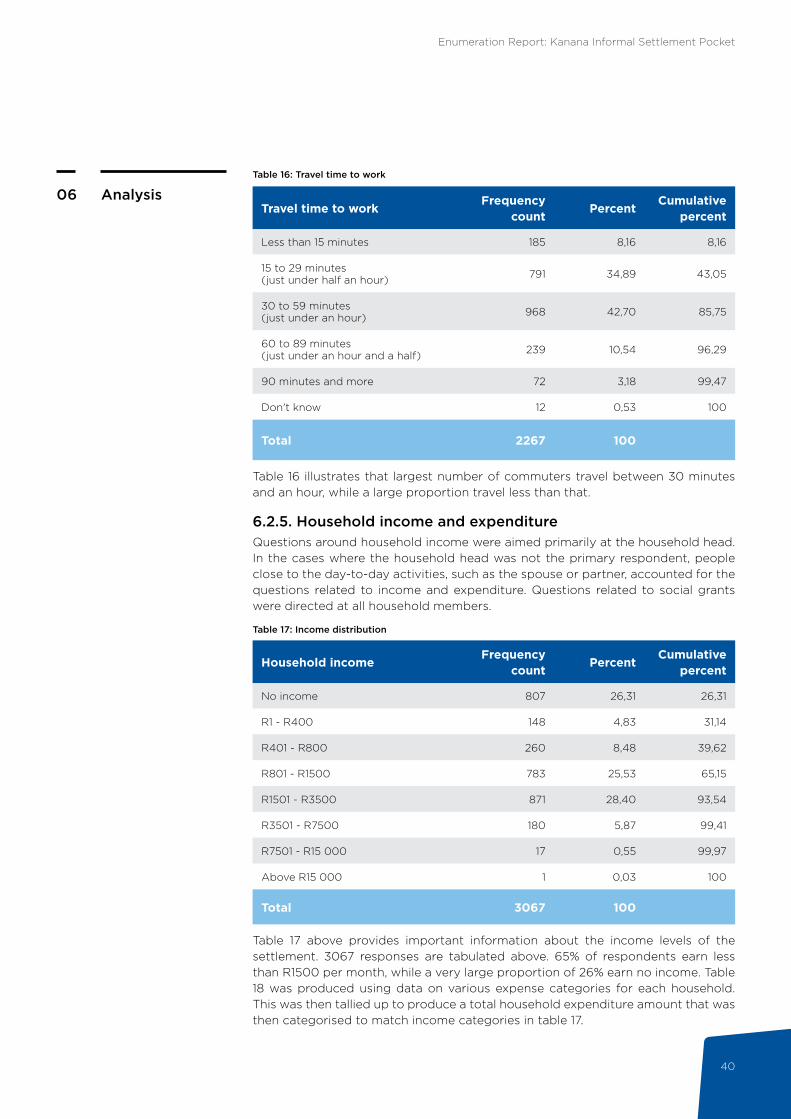
6.2.5. Household income and expenditureQuestions around household income were aimed primarily at the household head. In the cases where the household head was not the primary respondent, people close to the day-to-day activities, such as the spouse or partner, accounted for the questions related to income and expenditure. Questions related to social grants were directed at all household members.
Table 17: Income distribution
Household incomeFrequency
countPercent
Cumulative percent
No income 807 26,31 26,31
R1 - R400 148 4,83 31,14
R401 - R800 260 8,48 39,62
R801 - R1500 783 25,53 65,15
R1501 - R3500 871 28,40 93,54
R3501 - R7500 180 5,87 99,41
R7501 - R15 000 17 0,55 99,97
Above R15 000 1 0,03 100
Total 3067 100
Table 17 above provides important information about the income levels of the settlement. 3067 responses are tabulated above. 65% of respondents earn less than R1500 per month, while a very large proportion of 26% earn no income. Table 18 was produced using data on various expense categories for each household. This was then tallied up to produce a total household expenditure amount that was then categorised to match income categories in table 17.

Enumeration Report: Kanana Informal Settlement Pocket
41
Analysis06Table 18: Expenses distribution
Expenses categorisedFrequency
countPercent
Cumulative percent
No expenses 696 22,69 7,82
R1 - R400 192 6,26 14,16
R401 - R800 460 15,00 36,58
R801 - R1500 789 25,73 65,54
R1501 - R3500 814 26,54 92,81
R3501 - R7500 106 3,46 99,58
Greater than R7500 10 0,33 100
Total 3067 100
The majority of respondents (65%) reported spending up to R1500 per month. There is a close connection with the previous data set in table 18, and therefore it is likely that Kanana residents break even every month, with no money left over for savings. It should be noted that 696 households reported to have no expenses could be seen as an indicator that such households could be dependent on other households for basic goods.
Figure 11 shows that a high proportion of residents receive a child support grant from government. 2049 people reported receiving the monthly grant. There are 1609 children (24% of the total settlement population) in Kanana under the age of 13 years old. The child support grant is R350 per child per month, the foster child grant is R890, the disability grant is up to R1500 and the old age pension grant is R1500. According to the enumeration data, there are only 136 pensioners (2% of population) who receive the old age grant.
Percent
Figure 11: Percentage distribution of grant type
0.00
None
Old Age Pension
Child Support
Gra
nt T
ype
Disability Grant
Foster Care
10.00
0.08
0.84
30.74
2.04
66.30
20.00 30.00 40.00 50.00 60.00 70.00
Enumeration Report: Kanana Informal Settlement Pocket
42
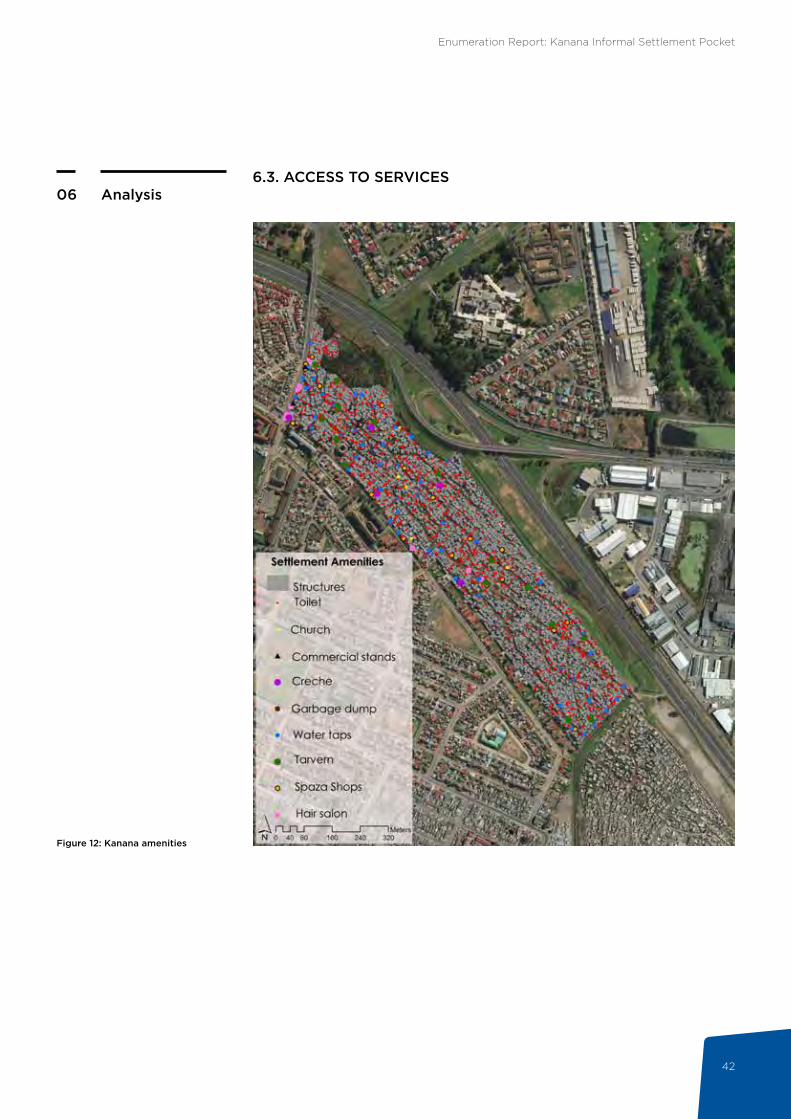
Analysis066.3. ACCESS TO SERVICES
Figure 12: Kanana amenities

Enumeration Report: Kanana Informal Settlement Pocket
43
Analysis066.3.1. Water accessIn Kanana settlement, 56 taps have been mapped. This results in a ratio of 57 households per tap. The City of Cape Town has a standard of one water tap for 25 households. Kanana is underserviced in terms of access to clean water. Water points are marked in blue with a 25m radius circle in figure 12 above and figure 13 below. It is clear from the spatial analysis that there is a need for access to clean water in the eastern and south-central parts of the settlement, where very few services are located.
Figure 13: Map of Kanana water points with 25m radius
The spatial analysis and ratios clearly illustrate that access to clean water is a challenge in Kanana.

Enumeration Report: Kanana Informal Settlement Pocket
44
Analysis06
COMMUNITY VOICES
“In Kanana people are not allowed to do their washing next to the taps. They can only take water from the tap and do their washing inside their houses because there are no drains.”
Fetching water in Kanana

Enumeration Report: Kanana Informal Settlement Pocket
45
Analysis066.3.2. Sanitation
In Kanana, 824 toilets were mapped during the enumeration, which is a ratio of 4 households per toilet. 99% of respondents said their primary toilet was a chemical or temporary toilet. The CoCT aims to provide one toilet between five households. Despite this coverage, there are concerns that chemical/temporary toilets are not well serviced. The typology of the land and soil conditions (that being a discontinued dumpsite) makes it difficult to provide permanent services to all households. This remains a major challenge for long-term settlement upgrading.
Table 19: Percentage distribution of sanitation access
Access to toiletsFrequency
countPercent
Cumulative percent
Communal use 1475 48,58 48,58
Household use only 725 23,88 72,46
Limited to a few families 836 27,54 100
Total 3036 100
Table 19 provides interesting perspectives into the usage of toilet facilities. While the majority of residents share toilets, there is a high proportion of households who have secured exclusive use of toilets (24%) and also a high proportion of households who share (27%). The exclusivity of toilet use is positive and negative. On the positive side, households who retain control over the use of the toilets can maintain it better, while on the negative side, conditions might arise where some households are denied access to decent sanitation, which can cause considerable conflict.
COMMUNITY VOICES
“Sometimes they (the service provider) take the buckets, forexample on Sunday and (only) bring them back on Monday.Then you have to walk and look for your bucket and for twodays, you can be without a toilet. These buckets are terrible.It is painful. We are really not satisfied with the buckets. Weneed flush toilets.”
Bucket toilet in Kanana Bucket removed from cubicle

Enumeration Report: Kanana Informal Settlement Pocket
46
Analysis06
Figure 14: Map showing sanitation access with 25m radius
The location of toilets is presented in figure 14, with the same 25m radius circles. This shows that Kanana residents have better access to sanitation than water services. It could be an option to install standpipes in close proximity to clusters of toilets, and the perimeter can be secured through adequate lighting and other safety measures.
Enumeration Report: Kanana Informal Settlement Pocket
47
Analysis066.3.3. Electricity
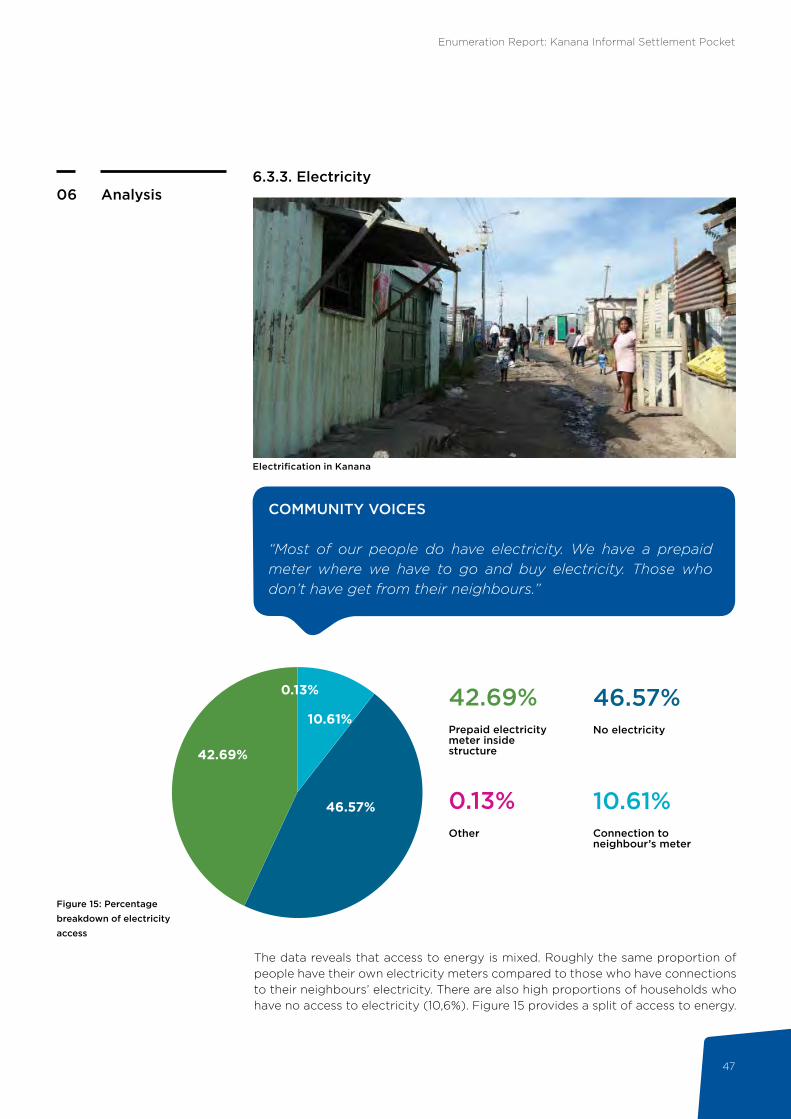
Figure 15: Percentage breakdown of electricity access
The data reveals that access to energy is mixed. Roughly the same proportion of people have their own electricity meters compared to those who have connections to their neighbours’ electricity. There are also high proportions of households who have no access to electricity (10,6%). Figure 15 provides a split of access to energy.
COMMUNITY VOICES
“Most of our people do have electricity. We have a prepaid meter where we have to go and buy electricity. Those who don’t have get from their neighbours.”
42.69%
10.61%
46.57%
0.13%
No electricityPrepaid electricity meter inside structure
Connection to neighbour’s meter
Other
42.69% 46.57%
10.61%0.13%
Electrification in Kanana

Enumeration Report: Kanana Informal Settlement Pocket
48
Analysis06
Figure 16: Map showing electricity access in Kanana
The electricity grid has been extended deep into Kanana, as the spatial analysis in figure 16 illustrates. Some central areas reported no access to electricity, while the proportion of those with electricity boxes and those with connections are mixed throughout. To summarise, more than 90% of Kanana households have access to v, but only 46,6% have an electricity box.
Enumeration Report: Kanana Informal Settlement Pocket
49
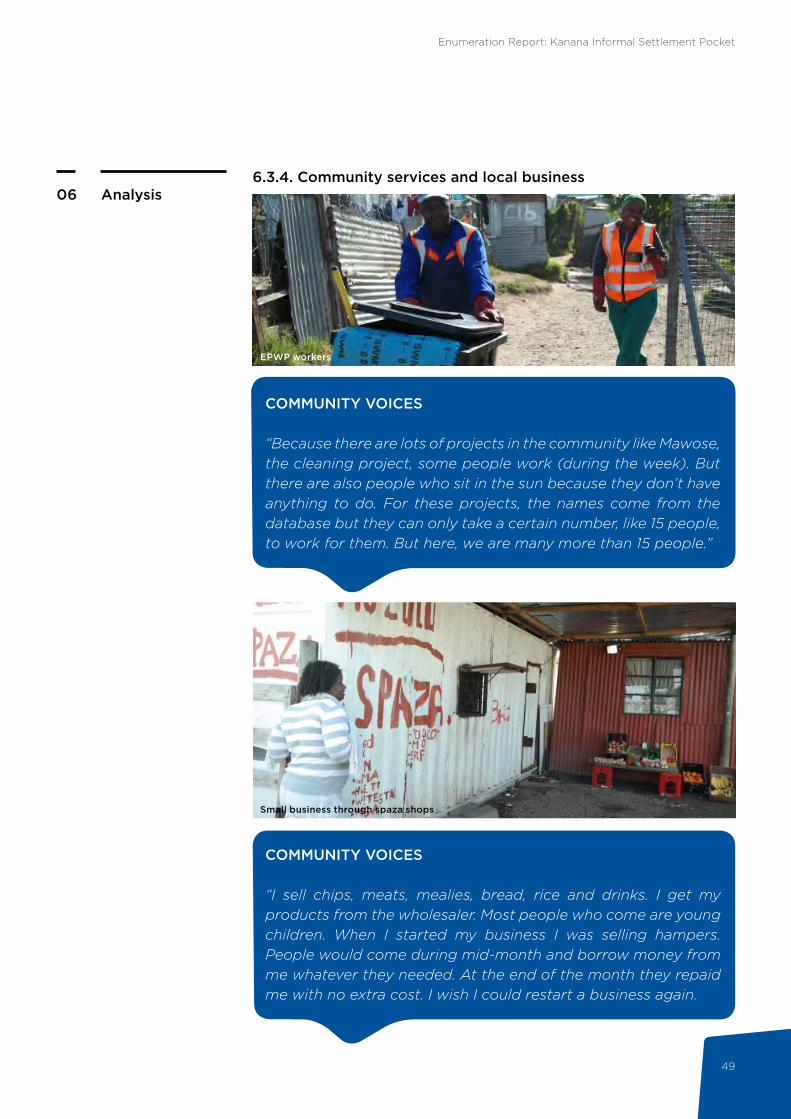
6.3.4. Community services and local businessAnalysis06
COMMUNITY VOICES
“Because there are lots of projects in the community like Mawose, the cleaning project, some people work (during the week). But there are also people who sit in the sun because they don’t have anything to do. For these projects, the names come from the database but they can only take a certain number, like 15 people, to work for them. But here, we are many more than 15 people.”
COMMUNITY VOICES
“I sell chips, meats, mealies, bread, rice and drinks. I get my products from the wholesaler. Most people who come are young children. When I started my business I was selling hampers. People would come during mid-month and borrow money from me whatever they needed. At the end of the month they repaid me with no extra cost. I wish I could restart a business again.
EPWP workers
Small business through spaza shops

Enumeration Report: Kanana Informal Settlement Pocket
50
Analysis06
Table 20: Accessing community facilities inside or within walking distance to settlement
Type of service accessedNumber of structures accessing
Percentage of structures
Structures with occupants accessing community halls 2952 97,2
Structures with occupants accessing creche 2581 85,0
Structures with occupants accessing spaza shops 2963 97,6
Structures with occupants accessing shebeens 2557 84,2
Structures with occupants accessing sport grounds 267 8,8
Structures with occupants accessing playgrounds 205 6,8
Structures with occupants accessing religious structures 1986 65,4
Structures with occupants accessing health facilities 650 21,4
The informal economy is a significant economic force in a settlement characterised by such high unemployment. The residents’ comments reflect the competition for customers and how residents sometimes sell liquor without licences.
Figure 13, presented earlier, indicated a high proportion of shebeens in the northern and southern parts of the settlement. 16 shebeens were counted during the enumeration. It is also worth noting, from figure 13, that other commercial uses, such as beauty salons, were located on Steve Biko Street, where the greatest catchment of customers is possible. Other community uses, such as crèches and churches, were well distributed across the settlement.
Table 20 below shows that the majority of residents are able to access local services by foot. It is also clear that the density of the settlement does not allow for ease of access to sports/playgrounds.
Enumeration Report: Kanana Informal Settlement Pocket
51
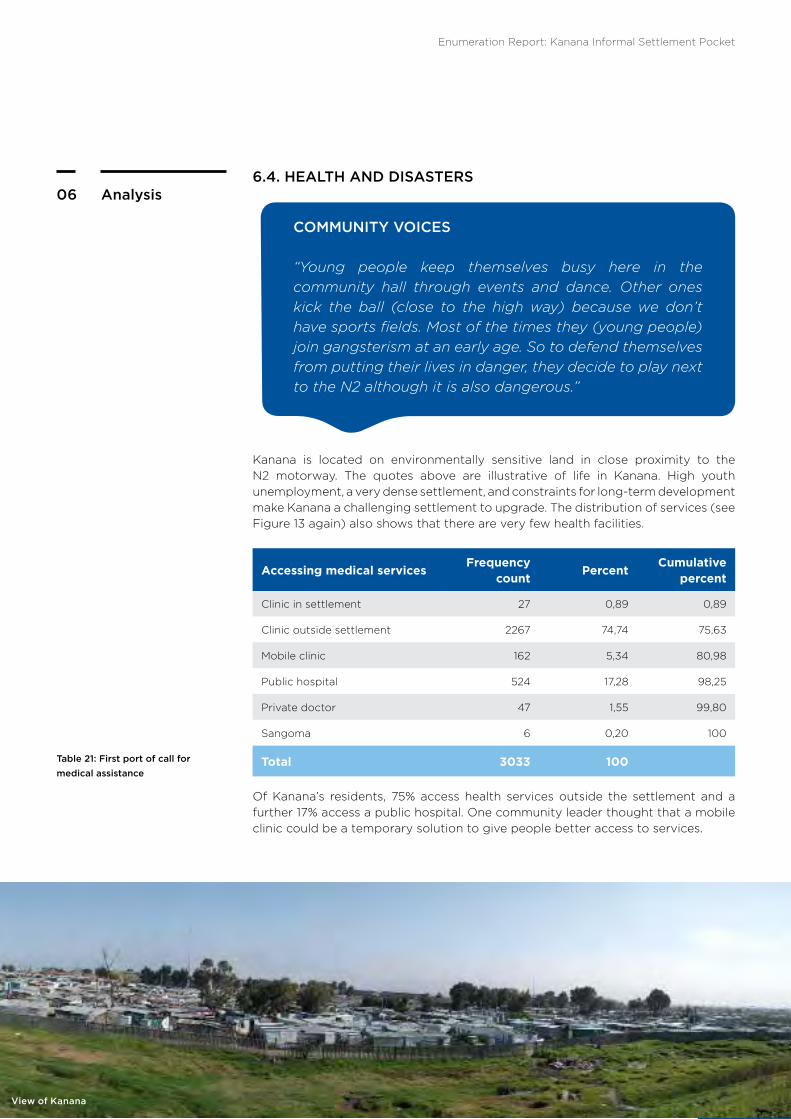
Analysis066.4. HEALTH AND DISASTERS
Kanana is located on environmentally sensitive land in close proximity to the N2 motorway. The quotes above are illustrative of life in Kanana. High youth unemployment, a very dense settlement, and constraints for long-term development make Kanana a challenging settlement to upgrade. The distribution of services (see Figure 13 again) also shows that there are very few health facilities.
Table 21: First port of call for medical assistance
Of Kanana’s residents, 75% access health services outside the settlement and a further 17% access a public hospital. One community leader thought that a mobile clinic could be a temporary solution to give people better access to services.
Accessing medical servicesFrequency
countPercent
Cumulative percent
Clinic in settlement 27 0,89 0,89
Clinic outside settlement 2267 74,74 75,63
Mobile clinic 162 5,34 80,98
Public hospital 524 17,28 98,25
Private doctor 47 1,55 99,80
Sangoma 6 0,20 100
Total 3033 100
COMMUNITY VOICES
“Young people keep themselves busy here in the community hall through events and dance. Other ones kick the ball (close to the high way) because we don’t have sports fields. Most of the times they (young people) join gangsterism at an early age. So to defend themselves from putting their lives in danger, they decide to play next to the N2 although it is also dangerous.”
View of Kanana

Enumeration Report: Kanana Informal Settlement Pocket
52
Analysis06
6.5. SETTLEMENT DYNAMICS
An analysis of the number of years people have lived in Kanana confirms a central trend in this report: young people have recently moved away from their parents’ dwellings and are forced to live in small one-room shacks. Figure 17 provides an overview of the number of years lived in the settlement. This was asked of every structure occupant.
The majority of residents indicated that they have lived in their shelters for less than five years. After the backyarders of Gugulethu occupied the land in 1989, the children grew up and are now erecting shacks in all the vacant spaces in Kanana. A minority of respondents have lived in their shelter for longer than 20 years. Table 24 below indicates that a high proportion of residents believe that their move into Kanana settlement will provide them with a formal housing opportunity.
Frequency
Figure 17: Number of years lived in Kanana categorised
518More than 25 years
21 - 25 years
16 - 20 years
11 - 15 years
6 - 10 years
0 - 5 years
598
1140
1016
0 500 1000 1500 2000
1518
1914
Year
s liv
ed in
Kan
ana
COMMUNITY VOICES
“We need to teach our children at the early stage about hygiene and health. We don’t have a clinic and we need a mobile clinic. For example, when some people get TB, they will use a mask at the hospital but when they get home they don’t care.”
Conditions affecting quality of health

Enumeration Report: Kanana Informal Settlement Pocket
53
6.6. SETTLEMENT PRIORITIES
Respondents in Kanana were asked to identify their current main priorities in the settlement. They were asked to do this by ranking these priorities in order of importance. This was designed to determine which physical factors needed urgent addressing and could point to values that residents had around their needs. Table 22 provides an overview of the priorities of Kanana residents as ranked by the structure level respondents.
Analysis06
Table 22: Main household priorities by ranking (row percentages)
Household main priorities 1 2 3 4 5 Total
Waste collection 40,54 18,32 13,78 9,69 17,67 100
Access to toilets 14,33 44,82 17,02 12,49 11,35 100
Access to formal housing 50,13 16,39 25,23 4,77 3,48 100
Access to water 5,74 15,59 27,02 39,29 12,37 100
Access to health care 7,04 12,90 20,78 24,95 34,33 100
Addressing crime 10,49 13,31 19,75 27,98 28,46 100
Access to electricity 5,36 16,09 15,21 27,70 35,63 100
Addressing flooding 6,73 14,79 20,35 25,33 32,80 100
Preventing shack fires 12,16 10,00 14,32 24,05 39,46 100
Addressing evictions 12,90 6,45 12,90 9,68 58,06 100
Total 20,57 20,08 20,13 19,67 19,55 100
Access to formal housing appears as a major priority having been ranked at number one 50% of the time, trailed closely by waste collection services at 40%. Secondly, access to better sanitation features highly. It was established earlier that the current coverage is 1:8 toilets per household, which is slightly lower than the City’s ideal standard of 1:5. Concerns have been raised with regard to the quality of services, the safety of units, and the exclusivity that some households enjoy at the expense of others.
The third-highest priority is access to water. Only 27% of respondents deemed this their third priority, but taking into account that the current ratio for this service is 1:119 taps per person, it is understandable that access to clean water features as the third-highest priority. Crime and shack fires only feature as fourth and fifth priorities. Concerns about evictions also feature as the fifth priority.
Waste pollution Flooding
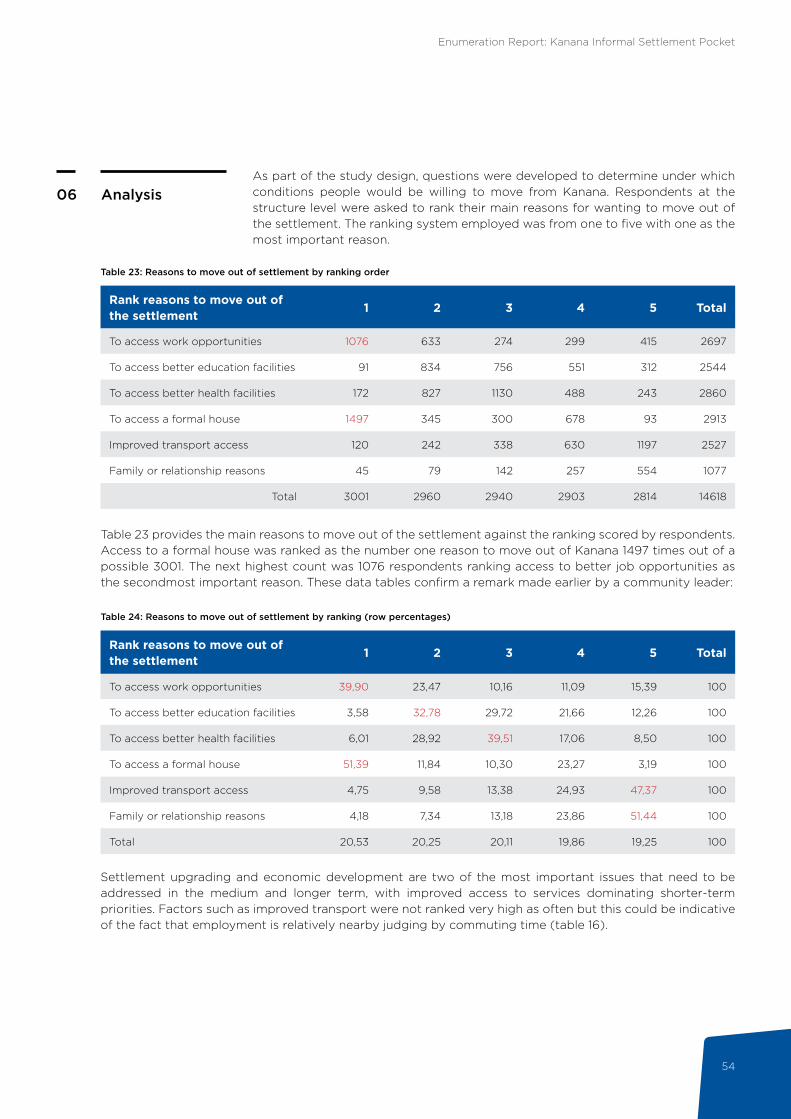
Enumeration Report: Kanana Informal Settlement Pocket
54
Analysis06
Table 23: Reasons to move out of settlement by ranking order
Rank reasons to move out of the settlement
1 2 3 4 5 Total
To access work opportunities 1076 633 274 299 415 2697
To access better education facilities 91 834 756 551 312 2544
To access better health facilities 172 827 1130 488 243 2860
To access a formal house 1497 345 300 678 93 2913
Improved transport access 120 242 338 630 1197 2527
Family or relationship reasons 45 79 142 257 554 1077
Total 3001 2960 2940 2903 2814 14618
Table 23 provides the main reasons to move out of the settlement against the ranking scored by respondents. Access to a formal house was ranked as the number one reason to move out of Kanana 1497 times out of a possible 3001. The next highest count was 1076 respondents ranking access to better job opportunities as the secondmost important reason. These data tables confirm a remark made earlier by a community leader:
As part of the study design, questions were developed to determine under which conditions people would be willing to move from Kanana. Respondents at the structure level were asked to rank their main reasons for wanting to move out of the settlement. The ranking system employed was from one to five with one as the most important reason.
Table 24: Reasons to move out of settlement by ranking (row percentages)
Rank reasons to move out of the settlement
1 2 3 4 5 Total
To access work opportunities 39,90 23,47 10,16 11,09 15,39 100
To access better education facilities 3,58 32,78 29,72 21,66 12,26 100
To access better health facilities 6,01 28,92 39,51 17,06 8,50 100
To access a formal house 51,39 11,84 10,30 23,27 3,19 100
Improved transport access 4,75 9,58 13,38 24,93 47,37 100
Family or relationship reasons 4,18 7,34 13,18 23,86 51,44 100
Total 20,53 20,25 20,11 19,86 19,25 100
Settlement upgrading and economic development are two of the most important issues that need to be addressed in the medium and longer term, with improved access to services dominating shorter-term priorities. Factors such as improved transport were not ranked very high as often but this could be indicative of the fact that employment is relatively nearby judging by commuting time (table 16).
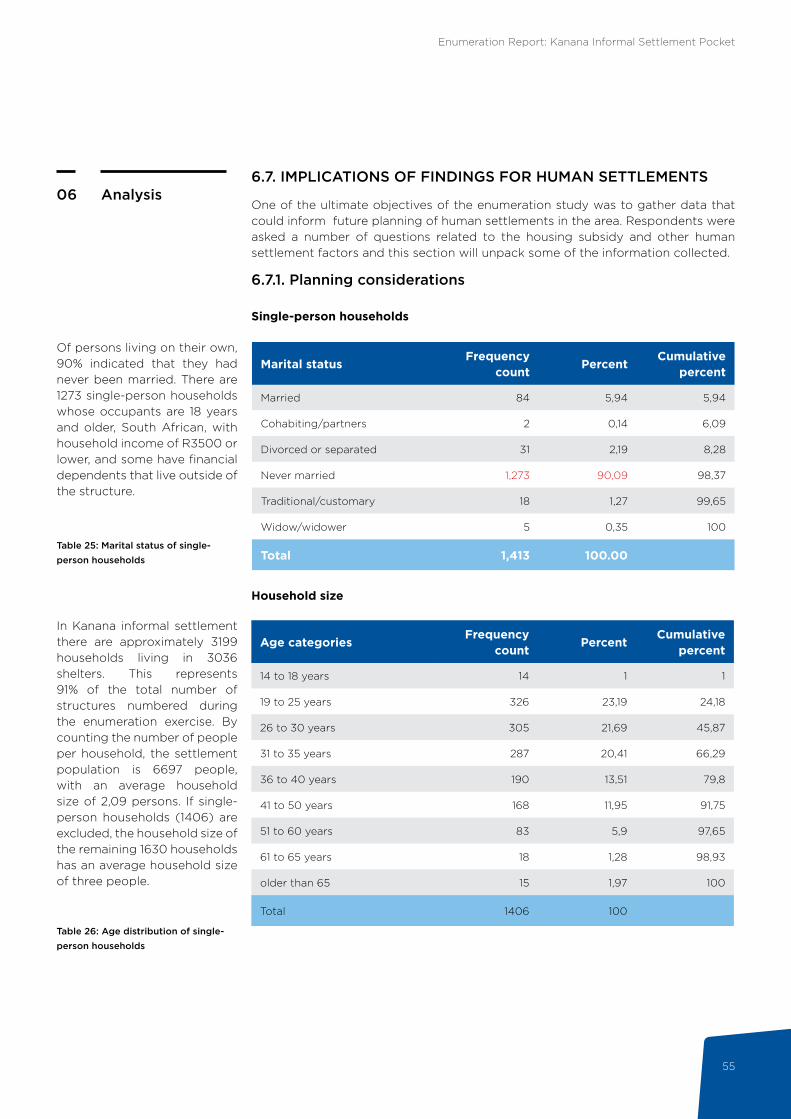
Enumeration Report: Kanana Informal Settlement Pocket
55
Analysis066.7. IMPLICATIONS OF FINDINGS FOR HUMAN SETTLEMENTS
One of the ultimate objectives of the enumeration study was to gather data that could inform future planning of human settlements in the area. Respondents were asked a number of questions related to the housing subsidy and other human settlement factors and this section will unpack some of the information collected.
Table 25: Marital status of single-person households
Marital statusFrequency
countPercent
Cumulative percent
Married 84 5,94 5,94
Cohabiting/partners 2 0,14 6,09
Divorced or separated 31 2,19 8,28
Never married 1,273 90,09 98,37
Traditional/customary 18 1,27 99,65
Widow/widower 5 0,35 100
Total 1,413 100.00
Of persons living on their own, 90% indicated that they had never been married. There are 1273 single-person households whose occupants are 18 years and older, South African, with household income of R3500 or lower, and some have financial dependents that live outside of the structure.
Table 26: Age distribution of single-person households
Age categoriesFrequency
countPercent
Cumulative percent
14 to 18 years 14 1 1
19 to 25 years 326 23,19 24,18
26 to 30 years 305 21,69 45,87
31 to 35 years 287 20,41 66,29
36 to 40 years 190 13,51 79,8
41 to 50 years 168 11,95 91,75
51 to 60 years 83 5,9 97,65
61 to 65 years 18 1,28 98,93
older than 65 15 1,97 100
Total 1406 100
In Kanana informal settlement there are approximately 3199 households living in 3036 shelters. This represents 91% of the total number of structures numbered during the enumeration exercise. By counting the number of people per household, the settlement population is 6697 people, with an average household size of 2,09 persons. If single-person households (1406) are excluded, the household size of the remaining 1630 households has an average household size of three people.
Household size
6.7.1. Planning considerations
Single-person households
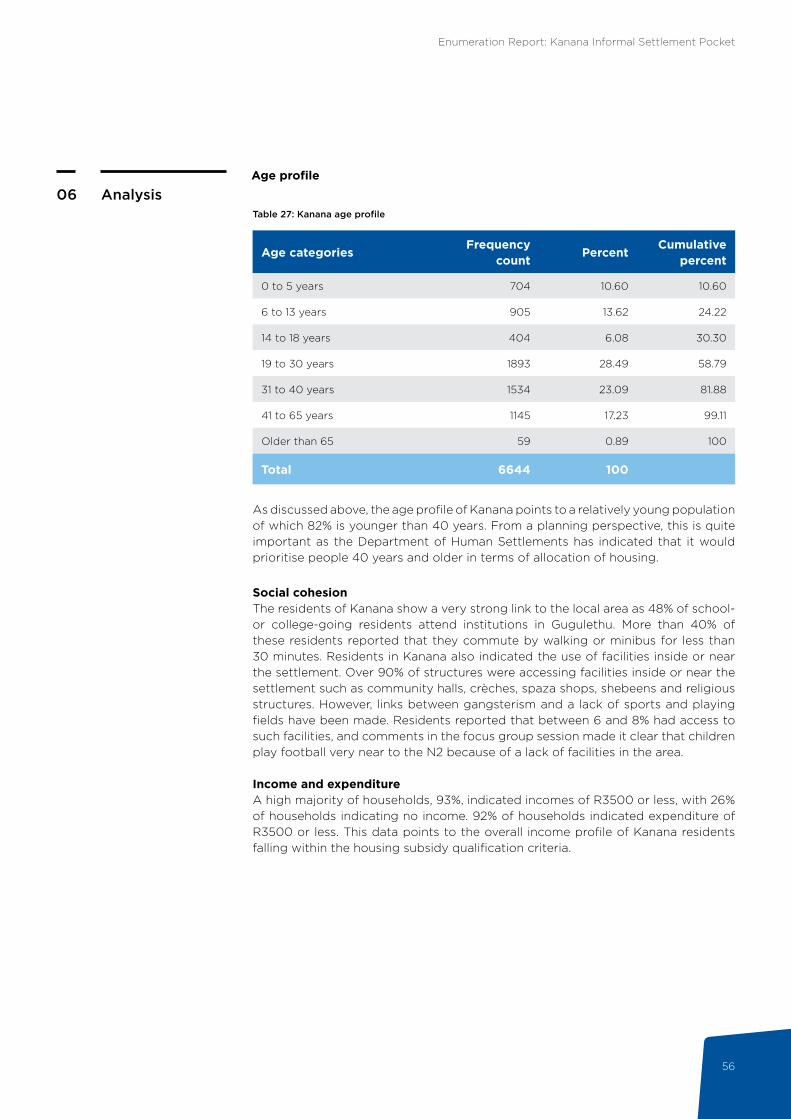
Enumeration Report: Kanana Informal Settlement Pocket
56
Analysis06Age profile
Table 27: Kanana age profile
Age categoriesFrequency
countPercent
Cumulative percent
0 to 5 years 704 10.60 10.60
6 to 13 years 905 13.62 24.22
14 to 18 years 404 6.08 30.30
19 to 30 years 1893 28.49 58.79
31 to 40 years 1534 23.09 81.88
41 to 65 years 1145 17.23 99.11
Older than 65 59 0.89 100
Total 6644 100
As discussed above, the age profile of Kanana points to a relatively young population of which 82% is younger than 40 years. From a planning perspective, this is quite important as the Department of Human Settlements has indicated that it would prioritise people 40 years and older in terms of allocation of housing.
Social cohesion The residents of Kanana show a very strong link to the local area as 48% of school- or college-going residents attend institutions in Gugulethu. More than 40% of these residents reported that they commute by walking or minibus for less than 30 minutes. Residents in Kanana also indicated the use of facilities inside or near the settlement. Over 90% of structures were accessing facilities inside or near the settlement such as community halls, crèches, spaza shops, shebeens and religious structures. However, links between gangsterism and a lack of sports and playing fields have been made. Residents reported that between 6 and 8% had access to such facilities, and comments in the focus group session made it clear that children play football very near to the N2 because of a lack of facilities in the area.
Income and expenditureA high majority of households, 93%, indicated incomes of R3500 or less, with 26% of households indicating no income. 92% of households indicated expenditure of R3500 or less. This data points to the overall income profile of Kanana residents falling within the housing subsidy qualification criteria.

Enumeration Report: Kanana Informal Settlement Pocket
57
6.7.2. Pathway to qualificationThis section provides information on the process for subsidy qualification and highlights what criteria is considered by the Department of Human Settlements.
Subsidy qualification criteria
AnalysisPathway to Qualification
06
Housing and services are delivered under subsidy programmes. Potential beneficiaries may apply directly to the Department for an individual subsidy or a Finance Linked Individual Subsidy (FLISP).
Subsidy ProgrammeGross Monthly
Household IncomeCategory
Subsidy Amount
Individual Subsidy
The subsidy can be used to:• Buy an existing house• Buy a house on a plot-and-• plan basis; or• To finish an incomplete house
You must have been on the municipal housing demand database for a minimum period of 10 years.
R0 - R3 500
Aged, disabled or medical condition:
R0 - R3 500
R160 573
Purchase price up to R160 573
plus disability variance
Finance Linked Individual Subsidy (FLISP)
• Assists you by providing a subsidy to reduce your home loan and therefore makes your monthly instalment lower.
• Please refer to the table at the end of the document for the FLISP scales.
R3 501 - R15 000 R20 000 - R87 000
on a fixed scale, depending on your
income.
Potential beneficiaries cannot apply directly to the Department for subsidies for the programmes below. These programmes are used by a developer (who may either be the Municipality or the Province) to deliver houses and services. Grant funding is made available to the developer for each project. The developer will apply for a subsidy on behalf of the beneficiaries.
UPGRADING OF INFORMAL SETTLEMENTS PROGRAMME (UISP)
This programme seeks to upgrade the living conditions of poor families living in informal settlements by providing secure tenure and access to basic services and housing.
You qualify for a housing subsidy if:• You are a South African citizen or have a permanent residence permit.• You are 18 years or older.• You are married or living with a partner.• You are single or divorced, and have proven financial dependants
permanently residing with you (military veterans without any financial dependants can apply).
• Your maximum monthly household income is R3 500 or less before deductions (military veterans earning up to R10 416 per month can apply).
• You or your partner are not current or previous property owners.• You or your partner have never received a subsidy from the government.
Subsidy programmes

Enumeration Report: Kanana Informal Settlement Pocket
58
Subsidy ProgrammeGross Monthly
Household IncomeCategory
Subsidy Amount
Individual Subsidy
• It provides funding for the construction of houses on those serviced sites that were received before 1994.
• You can apply for this subsidy if you already own a serviced site and wish to construct a house, or upgrade/complete a non- subsidised house.
• An application must be done on a project basis via your municipality.
R0 - R3 500 R109 947
Enhanced Peoples Housing Process (EPHP)
• Assists households who want to participate in building their own home.
• The consolidation subsidy (see above) can be accessed through EPHP.
• Community contribution before and during the project includes, but is not limited to sweat equity.
• Technical assistance to build the house is available as facilitation and establishment grants.
R0 - R3 500 R110 947
Integrated Residential Development Programme (IRDP)
• Provides for the acquisition of land, servicing of stands and construction of houses.
R0 – R3 500(abled
persons)
R160 573 – qualifyfor a serviced
site and a 40 m2house.
R0 – R3 500
(disabledpersons)
R160 573plus disability
variance– qualifyfor a serviced
site and a 45 m2house.
R3 501 – R7 000 Persons who areunable to qualifyfor a home loanmay receive a
free serviced site.

Enumeration Report: Kanana Informal Settlement Pocket
59
Subsidy ProgrammeGross Monthly
Household IncomeCategory
Subsidy Amount
Military Veterans Subsidy
• This programme is a joint venture between the Departments of Human Settlements and Military Veterans.
• You must be on the Department of Military Veterans’ (DMV) database.
R0 - R10 416 R188 884
(R110 947 + DMVcontribution)
Enhanced Extended Discount Benefit Scheme (EEDBS)
Supports the transfer of pre-1994 housing stock to qualifying occupants that:
• have a direct housing arrangement with the provincial department or municipality;
• have not benefited from any other housing subsidy or programme; or
• have an outstanding debt with the municipality or the provincial department.
R0 - R3 500
R3 501 - R7 000
R 7001 - R15 000
The entire debt is written off.
R7 500 + 50% of the debit is written
off.
A maximum of R7 500 is written off.
Social, Institutional and Community Residential Unit Programmes
• These programmes cater for persons opting to rent.
• Institutional programme makes provision for a rent-to-buy option.
R1 501 - R7 500 Rental amount varies in terms of programme
and income.

Enumeration Report: Kanana Informal Settlement Pocket
60
Step Increment band
Lower Higher Amount
1 3 501 3 700 87 000
2 3 701 3 900 85 825
3 3 901 4 100 84 650
4 4 101 4 300 83 475
5 4 301 4 500 82 300
6 4 501 4 700 81 125
7 4 701 4 900 79 950
8 4 901 5 100 78 775
9 5 101 5 300 77 600
10 5 301 5 500 76 425
11 5 501 5 700 75 250
12 5 701 5 900 74 075
13 5 901 6 100 72 900
14 6 101 6 300 71 725
15 6 301 6 500 70 550
16 6 501 6 700 69 375
17 6 701 6 900 68 200
18 6 901 7 100 67 025
19 7 101 7 300 65 850
20 7 301 7 500 64 675
21 7 501 7 700 63 500
22 7 701 7 900 62 325
23 7 901 8 100 61 150
24 8 101 8 300 59 975
25 8 301 8 500 58 800
26 8 501 8 700 57 625
27 8 701 8 900 56 450
FLISP scale:
Upper limit R 87 000
Lower limit R 20 000
Subsidy increment R 1 175

Enumeration Report: Kanana Informal Settlement Pocket
61
Step Increment band
Lower Higher Amount
28 8 901 9 100 55 275
29 9 101 9 300 54 100
30 9 301 9 500 52 925
31 9 501 9 700 51 750
32 9 701 9 900 50 575
33 9 901 10 00 49 400
34 10 101 10 300 48 225
35 10 301 10 500 47 050
36 10 501 10 700 45 875
37 10 701 10 900 44 700
38 10 901 11 100 43 525
39 11 101 11 300 42 350
40 11 301 11 500 41 175
41 11 501 11 700 40 000
42 11 701 11 900 38 825
43 11 901 12 100 37 650
44 12 101 12 300 36 475
45 12 301 12 500 35 300
46 12 501 12 700 34 125
47 12 701 12 900 32 950
48 12 901 13 100 31 775
49 13 101 13 300 30 600
50 13 301 13 500 29 425
51 13 501 13 700 28 250
52 13 701 13 900 27 075
53 13 901 14 100 25 900
54 14 101 14 300 24 725
55 14 301 14 500 23 550
56 14 501 14 700 22 375
57 14 701 14 900 21 200
58 14 901 15 000 20 000

Enumeration Report: Kanana Informal Settlement Pocket
62
Conclusion07The enumeration of Kanana informal settlement pocket, which covered 91% of all 3415 structures numbered, has revealed some surprising statistics about the settlement. There are a number of trends that should centrally inform future planning and decision-making:
• 48% of households are single, of which 66% are male, 75% are younger than 35 years old and 90% has never been married
• 41% of dwellings are single rooms• 30,8% of single-household dwellings and 59% of all dwellings of other
households are less than 30sqm• 33% of residents reported to have lived in their dwellings for less than five
years• 78% of residents claim to own their dwellings• 61% of youth are unemployed• 97% of residents are South Africans, and 181 foreigners were recorded
The history of the settlement relates to backyarders from Gugulethu who occupied the land in 1989, and satellite photos confirm that the settlement expanded eastwards towards the N2. The settlement was founded on a discontinued landfill/dumping site, which makes prospects for long-term development difficult without significant land rehabilitation.
Taking the history of the settlement into account, the enumeration data gives an accurate portrayal of a young and single population entering adulthood and leaving their parents’ homes, but challenged by high levels of unemployment, small living spaces, and low level of educational attainment. The average household size of Kanana is 2.09 persons per household.
The implications for settlement planning and upgrade are tremendous. To attain the high densities of 159 dwelling units per hectare over 23.14 hectares and cause minimal disruption, a sensitive upgrading strategy needs to cater for a highly-mobile population. The high density of the settlement will require innovative tenure types, and consolidation housing might need to consider smaller apartments in higher density housing typologies. However, addressing the needs through the conventional housing package will clearly be unrealistic given the current beneficiary criteria. Economic growth is a top priority, as are quality open spaces. The established road network could be an important lever for the design of settlement consolidation.
7. CONCLUSION

Enumeration Report: Kanana Informal Settlement Pocket
63
References08
REFERENCES
• Department of Cooperative Governance and Traditional Affairs (COGTA). 2005. The Municipal Infrastructure Grant: Basic Levels of services and unit costs; a guide for municipalities. Online: http://www.cogta.gov.za/mig/docs/5.pdf
• Todes, A.; Kok, P.; Wntzel, M.; van Zyl, J.; & Cross, C. 2010. Contemporary South African Urbanisation Dynamics. Urban Forum (2010) 21:331–348
• Housing Development Agency (HDA). 2013a. Western Cape: Informal Settlements Status. Research Report, HDA
• Housing Development Agency (HDA). 2013b. South Africa: Informal Settlements Status 2013. Research Report, HDA
• NDHS (National Department of Human Settlements). 2014. Presentation made by the National Upgrading Support Programme at the Policy Consultative Workshop held on 5 September 2014 at the Townhouse Hotel, Cape Town.
• Statistics South Africa, 2016. Labour Force Survey• Western Cape Department of Human Settlements. 2015. Minister’s Budget
Vote speech for the 2015/16 financial year. Cape Town.
Enumeration Report: Kanana Informal Settlement Pocket
64
List of core team members
09Team Member Institution
Mr. Thando Mguli HOD: WC Department of Human Settlements
Ms. Tracy Jooste WC Department of Human Settlements
Ms. Pamela Masiko-Kambala WC Department of Human Settlements
Ms. Susan Nel City of Cape Town
Ms. Levona Powell City of Cape Town
Mr. Greg Exford City of Cape Town
Mr. Jeffrey Williams City of Cape Town
Mr. Michael Webster WC Department of Human Settlements
Mr. Mbongi Gubuza WC Department of Human Settlements
Mr. Kenneth Kirsten WC Department of Human Settlements
Mr. Bongani Ngcombolo City of Cape Town: Councillor Ward 40
Mr. Siphiwo Nqamnduku City of Cape Town: Councillor Ward 88
Mr. Sithembiso Mzobe City of Cape Town: Councillor Ward 33
Mr. Khaya Yozi City of Cape Town: Councillor Ward 39
Mr. Anthony Moses City of Cape Town: Councillor Ward 44
Mr. Mzwakhe Nqavashe Previous Ward Councillor Ward 40
Mr. Nico Mzalisi Previous Ward Councillor Ward 88
Ms. Noxolo Kabane WC Department of Human Settlements
Mr. Lindilizwi Mngxekeza Housing Development Agency
Federation of the Urban and Rural Poor
Informal Settlement Network
Community Organisation Resource Centre
LIST OF CORE TEAM MEMBERS

sasdialliance.org.za
South African SDI Alliance
@SASDIAlliance
vimeo.com/sasdialliance
w
e
A member of the SA SDI Alliance