kanashiro-takeuchi et al. · pdf filekanashiro-takeuchi et al. supplemental information -...
TRANSCRIPT

Kanashiro-Takeuchi et al.
Supplemental Information - Material and Methods
Echocardiography
Serial echocardiographic measurements were obtained at baseline, 4 and 8
weeks following MI. Echocardiographic assessments were performed in anesthetized
rats (1-2% isoflurane inhalation) using a Vevo-770 echocardiogram (Visual Sonics Inc.,
Toronto, Ontario, Canada) equipped with 17.5 and 25 MHz transducers. Cardiac
dimensions: left ventricle end-diastolic (LVEDD), end-systolic (LVESD) diameters and
fractional shortening (FS) were recorded from M-mode images using averaged
measurements from 3 to 5 consecutive cardiac cycles according to the American
Society of Echocardiography (1). LV end-diastolic (LVEDV) and end-systolic (LVESV)
volumes and ejection fraction (EF) were calculated from bi-dimensional long-axis
parasternal views taken through the infarcted area. All images were analyzed using
Vevo 770 3.0.0 software (Visual Sonics).
Hemodynamic measurements
Rats were anesthetized with an intramuscular injection of 0.5 ml/Kg of a mixture
of 1.5 ml of ketamine (100mg/ml), 1.5 ml of xylazine (20 mg/ml) and 0.5 ml of
acepromazine (10 mg/ml). A 2-F micromanometer tipped catheter (SPR-838, Millar
Instruments, Houston, TX) was inserted into the right carotid artery and advanced
retrograde into the left ventricle. Measurements were calibrated by injecting a
hypertonic saline (15%) bolus to determine extra-ventricular conductance; relative
volume units were converted to actual volume using the cuvette calibration method (2).
All analyses were performed using PVAN 3.0 software (Millar Instruments, Houston,
TX). Left ventricular pressure-volume loops were recorded at steady state and at
varying preloads during temporary compression of theinferior vena cava.
Tissue Collection
At the end of the study, rat hearts were harvested and weighed, and a portion of
the LV remote from the infarct area was flash-frozen in liquid nitrogen for total RNA

isolation and protein analysis. Remaining tissues were fixed with 10% formalin for
histology.
Morphometric analysis
Rat hearts were processed using routine histological procedures. Five-
micrometer sections were sliced and stained with hematoxylin/eosin (H&E) and
Masson’s trichrome. Myocardial infarct size was quantified by the circumferential extent
of scar and percentage area fibrosis as previously described (3).
Total RNA Isolation
Total RNA from heart tissue was extracted using Trizol (Invitrogen, Carlsbad,
CA). Three heart samples from each group were analyzed.The quality of RNA isolated
was tested using NanoDrop1000 (Thermo Fisher Scientific Inc., Wilmington, DE). OD
260/280 ratio was in the range of 1.8 to 2.1 for all samples.
Myocyte isolation
The isolation of myocytes was performed as previously described (4). Briefly; the
rats were anesthetized with pentobarbital (100mg/Kg, Sigma, St. Louis, MO) with
heparin (4000 U/Kg, APP Pharmaceuticals, Schaumburg, IL). For the isolation of
myocytes, the hearts were cannulated and perfused through the aorta with Ca2+ free
bicarbonate buffer containing 120 mMNaCl, 5.4 KCl, 1.2 mM MgSO4, 1.2 mM NaH2PO4,
20 mM NaHCO3, 10 mM 2,3-butanedione monoxime, 5 mMtaurine and, 5.6 mM
glucose, gassed with 95% O2 - 5% CO2; this was followed by enzymatic digestion with
collagenase type-2 (1 mg/ml, Worthington Biochemical Co., Lakewood, NJ) and
protease type-XIV (0.1 mg/ml, Sigma, St. Louis, MO).
Cardiomyocytes were obtained from digested hearts which were then
mechanically disrupted, filtered, centrifuged and resuspended in a Tyrode solution
containing 0.125 mM CaCl2, 144 mMNaCl, 1 mM MgCl2, 10 mM HEPES, 5.6 mM
glucose, 1.2 mM NaHPO4 and 5 mMKCl at pH7.4.

GH and IGF-I measurements
Blood was drawn 1-2 hours after the last injection at the end of the study and the
serum was stored at –80ºC until the measurements were performed. All the samples
were assayed together and each sample was assayed in duplicate. Rat serum GH was
measured using a rat GH Enzyme-Linked Immunosorbent Assay (ELISA) Kit (DSL-10-
72100, DSL Webster, TX), following the manufacturer's recommendations. This test is
an enzymatically amplified “one-step” sandwich-type enzyme immunoassay, where
standards, controls and unknown samples are incubated in micro-titration wells pre-
coated with the anti-rat GH antibody. The standard curve of the assay was established
with samples provided by the manufacturer. Rat serum IGF-I, after extraction with acid
ethanol, was measured using a rat IGF-I Radioimmunoassay Kit (DSL-2900, DSL
Webster, TX) following the manufacturer’s recommendations. The IGF-I assay included
quality controls provided by the manufacturer. The standard curve of the assay was
established with samples provided by the manufacturer.
Immunostaining
Cardiomyocytes were stained as described previously (5). Briefly, after isolation,
150 l of cardiomyocytes in suspension were allowed to sediment and then fixed for 10
minutes in 2% paraformaldehyde. Cells were then stained with rabbit polyclonal
antibody against human GHRHR at 4ºC for 24 hours followed by the secondary
antibody at 37ºC for 1 hour (see table S3).
Paraffin sections were deparaffinized and rehydrated by immersion in xylene
followed by a graded series of ethanol as previously described (6). Antigen retrieval
was performed by a heat-induced method with citrate buffer (Dako, Carpinteria, CA).
After blocking with 10% normal donkey serum, sections were incubated with a primary
antibody (table S3), at 37ºC for 1 hour, followed by application of secondary antibody.
Omission of the primary antibodies on parallel sections was used as negative control.
Nuclei were counterstained with DAPI (Invitrogen, Carlsbad, CA). The total numbers of
positively-stained cells were quantified per slide to calculate the number of cells per unit

volume (mm3) on each sample. Morphometric analysis was performed using Adobe
Photoshop CS3 (San Jose, CA).
To quantify apoptosis of cardiac cells, terminal deoxynucleotidyltransferase-
mediated dUTP nick end-labeling (TUNEL) staining was performed on paraffin
embedded tissue sections according to the manufacturer’s protocol using a
commercially available kit (In Situ Cell Death Detection Kit, POD, Roche Diagnostics
GmbH, Germany). Slides were scanned by using a Mirax scan (Carl Zeiss,GmHB,
Germany) and analyzed under 20 and 40x magnifications. Apoptotic nuclei were
identified by green fluorescence staining and expressed as a percentage per cubic
millimeter (mm3). All images were obtained with fluorescent (Olympus IX81, Olympus
America Inc., Center Valley, PA) or a LSM710 Zeiss confocal laser scanning
module(Carl Zeiss MicroImaging). The quantification of other markers (c-kit, CD45,
mast cell tryptase, myosin light chain, phospho-histone H3 [pH3], GATA-4) was
performed in a similar manner.
Quantification of immunohistochemistry staining for GHRHR
All images were obtained using a 40x objective and the settings were constant
for the entire study. Ten high power fields of confocal images were taken from each
sample (n=3 for each group). The quantification of the fluorescence was performed
following deconvolution, using Huygen Essential software, version 3.4 (Scientific
Volume Imaging, Hilversum, The Netherlands). An optical density plot of the selected
area was generated using the histogram tool in the Image Pro plus version 6.3 (Media
Cybernetics, MD) and the mean staining intensity (intensity/pixel) was recorded.
Capillary density
For determining the capillary density in the myocardium, three to four
representative sections of each group were stained with isolectin-B4 conjugated to
Alexa 488 (Invitrogen, Carlsbad, CA) for 24 hours at 4°C. Five fields on each section
were randomly chosen for counting vessel profiles at the border and remote area
separately. The capillary density was expressed as capillaries/high-power field (HPF).
Real Time PCR
Two micrograms of total RNA were reverse transcribed with the QuantiTect
Reverse Transcription Kit (Qiagen, Valencia, CA) using Veriti 96 well thermal cycler
(Applied Biosystems, Foster City, CA). Quantitative real-time RT-PCR reactions were
performed using the iQ5 Real-Time PCR Detection System (Bio-Rad Laboratories,
Hercules, CA).
We evaluated the mRNA expression of rat GHRHR, GHRH and β-actin. The
analyses of gene expression for GHRHR, GHRH and β-actin were as described
previously (5, 7). PCR conditions were 3 min at 95ºC and 30 cycles with 30 s 95ºC, 60 s
60ºC. The criteria for the design of rat specific primers were as extensively described
(8). All samples were run in triplicate, and each well of PCR reactions contained 25 μL
as final volume, including 2 μL of cDNA, 200 nM of gene-specific primers, and 400 nM
of probes. iQSupermix (Bio-Rad) was used in the PCR. The efficiencies of all primers
(Invitrogen Life Technologies, Carlsbad, CA) and probes (Integrated DNA Technologies,
Coralville, IA) were tested prior to the experiments and they were all efficient in the
range of 95–105%. Normal rat pituitary was used as positive control and rat beta-actin
was used to normalize for differences in RNA input(5). Negative samples were run in
each reaction consisting of no-RNA in reverse transcriptase reaction and no-cDNA in
PCR reaction.
To examine the effect of the treatments on the molecular phenotypes of MI
hearts pro-apoptotic and anti-apoptotic genes, as well as stem cell, calcium
homeostasis and genes related to proliferation, were also assessed by real-time PCR.
We used TaqMan probes (see Table S4) labeled with 6-carboxyfluorescein (FAM) and
iQSupermix (Bio-Rad Laboratories) for real-time RT-PCR reactions, according to the
manufacturer’s protocol (Applied Biosystems). Relative expression ratios were
calculated using Pfaffl’s method (9). Calculated values are presented as mean ± SEM to
indicate accuracy of measurement.
Functional assay of proliferation
In order to determine the impact of GHRH-A on proliferation of cardiac stem cells
(CSCs) in vitro, we isolated CSCs from rat hearts after myocardial digestion with
collagenase. C-kitpos cells were selected by magnetic sorting using Easy Sep (Stem Cell
Technology). Selection was confirmed by fluorescence activated cell sorting (FACS)
and immunostaining. Proliferation was determined by measuring the incorporation of the
thymidine analog EdU (5-ethynyl-2´-deoxyuridine), followed by immunodetection and
quantification of EdU positive cells by flow cytometry using a commercially available kit
(Click-it, Invitrogen). Cells were plated a day before the experiment at an initial density
of 2-5 x 10⁵cells/100 mm culture dish and pre-primed with 200 nM GHRH-A, vehicle
(DMSO), MIA-602 and combination of GHRH (A+Ant).The next day, cells were treated
again with drugs and Edu at a concentration of 10μM, harvested at different time points
(8h-20h), fixed, stained and analyzed according to manufacturer’s instructions.
Statistical Analysis
All values are shown as mean ± SEM. Significance was determined by the
analysis of variance (ANOVA) followed by post-hoc tests and Student's t test. For a
given parameter, p<0.05 was considered significant. All tests were carried out using
GraphPad Prism software (San Diego, CA, USA) version 5.0 for Windows.

References
1. Sahn, D. J., DeMaria, A., Kisslo, J., & Weyman, A. (1978) Recommendations regarding quantitation in M-mode echocardiography: results of a survey of echocardiographic measurements Circulation 58, 1072-1083.
2. Pacher, P. et al. (2008) Measurement of cardiac function using pressure-volume conductance catheter technique in mice and rats Nat. Protoc. 3, 1422-1434.
3. Kanashiro-Takeuchi R.M et al. (2009) Sex-specific impact of aldosterone receptor antagonism on ventricular remodeling and gene expression after myocardial infarction Clinical and Translational Science 2, 134-142.
4. Gonzalez, D. R., Beigi, F., Treuer, A. V., & Hare, J. M. (2007) Deficient ryanodine receptor S-nitrosylation increases sarcoplasmic reticulum calcium leak and arrhythmogenesis in cardiomyocytes Proc. Natl. Acad. Sci. U. S. A 104, 20612-20617.
5. Kanashiro-Takeuchi, R. M. et al. (2010) Cardioprotective effects of growth hormone-releasing hormone agonist after myocardial infarction Proc. Natl. Acad. Sci. U. S. A 107, 2604-2609.
6. Hatzistergos, K. E. et al. (2010) Bone marrow mesenchymal stem cells stimulate cardiac stem cell proliferation and differentiation Circ. Res. 107, 913-922.
7. Rick, F. G. et al. (2011) Antagonists of growth hormone-releasing hormone (GHRH) reduce prostate size in experimental benign prostatic hyperplasia Proc. Natl. Acad. Sci. U. S. A 108, 3755-3760.
8. Rick, F. G. et al. (2011) LHRH antagonist Cetrorelix reduces prostate size and gene expression of proinflammatory cytokines and growth factors in a rat model of benign prostatic hyperplasia Prostate 71, 736-747.
9. Pfaffl, M. W. (2001) A new mathematical model for relative quantification in real-time RT-PCR Nucleic Acids Res. 29, e45.
Supplemental Information - Results
Figure Legends
Figure S1. Changes over time in body weight (BW) after MI and effects of 4-week
treatment on heart weight (HW) and the ratio HW/BW and HW and tibia length (HW/TL).
All values represent mean ± SEM (n=7-10). Note that rrGH, GHRH-A and GHRH
(A+Ant) therapy increased BW at week 8 (* p<0.001 † p<0.05 vs. placebo and MIA-
602).
Figure S2. Serum concentration (ng/ml) of GH (A) and IGF-I (B) measured at the end of
the study. All values represent mean ± SEM (n=7-10) Panel A: GH level was markedly
increased by rrGH treatment, * p<0.0001 vs. all groups. Panel B: IGF-I levels were
increased in both rrGH and GHRH (A+Ant) groups, * p<0.0001 vs. placebo, GHRH-A
and MIA-602.
Figure S3. Representative confocal micrograph image of GHRH receptors (GHRHR).
Bar graphs correspond to expression of GHRHR. Panels depicts a confocal microscopy
images showing tropomyosin (green), GHRHR (red) and nuclei (blue). The upper right
panel shows higher magnification of the GHRHR on the cardiomyocyte sarcolemmal
membrane. Scale bars correspond to 10 and 50 um respectively. At the bottom, bar
graphs represent the measurement of the intensity of the fluorescence of GHRHR on
cardiomyocytes. All values represent mean ± SEM (n=3-4)
Figure S4. Heat map showing fold change patterns of mRNA for anti- and pro-apoptotic
genes (Bcl-2 and Bax, respectively), stromal derived factor 1 (SDF-1), stem cell factor
(SCF), genes related to angiogenesis (vascular endothelial growth factor A: VEGFA)
and proliferation (IGF-1 and cyclin A2: CCna2), GHRH and GHRH-R. The heat map
was generated in Microsoft Excel; color spectrum expands from green (lowest value) to
red (highest value) through yellow.
Figure S5. Representative pressure-volume loops and corresponding end-systolic
(ESPVR) and end-diastolic (EDPVR) pressure-volume relationships from placebo and

GHRH-A groups. As depicted, improved contractility was observed in the GHRH-A
treated rats as compared with placebo rats.
Figure S6. Representative fluorescent microimage of endothelial cells stained for
isolectin B4 (green) in placebo and GHRH-A group. Bar graphs showing capillary
density per high power field (HPF) at the border zone. All values represent mean ± SEM
(n=3-4).
Figure S7. Impact of treatments on expression of apoptosis (TUNELpos cells) at the
border zone of the infarct area. All values represent mean ± SEM (n=3-4).
Figure S8. GHRH receptor (GHRHR) expression on rat CSCs. FACS analysis of rat
CSCs showing that the majority of cells from explants (SPNT) or supernatant (SPNT)
are positive for GHRHR.
Figure S9. Representative fluorescent microimage of transcription factor GATA-4
(magenta), myosin light chain (MLC, green) and nuclei (blue). Bar graphs correspond to
expression of GATA-4pos cells at the border zone of the infarct area. Data represent
mean ± SEM (n=3), * p<0.05 vs. placebo and MIA-602.
Table Legends
Table S1. Serial echocardiographic analysis of LV chamber size and function.
Echocardiographic measurements at baseline (BSL), week 4 (W4) and week 8 (W8)
after MI.
Table S2. Hemodynamic parameters and indices of systolic and diastolic function
derived from pressure-volume relationships.
Table S3. Antibodies list.
Table S4. TaqMan probes for RT-PCR.

Figure S1
*††
rrGH MIA-502GHRH-APLACEBO GHRH(A+Ant)

Figure S2
A B* *† *A B
rrGH MIA-502GHRH-APLACEBO GHRH(A+Ant)

Figure S3
GHRHRT i GHRHRTropomyosin
DAPI Merge
rrGH MIA-502GHRH-APLACEBO GHRH(A+Ant)

Figure S4

Figure S5
PLACEBO GHRH‐A

Figure S6
50
Isolectin B4
40
y/H
PF
*†* *
*
20
30
lary
den
sity
Isolectin B4 DAPIPlacebo
Isolectin B4
10C
apillIsolectin B4
0
GHRH ArrGH MIA-502GHRH-APLACEBO GHRH(A+Ant)
GHRH‐A

Figure S7
40
50
30
EL
+/m
m3
10
20
TU
NE
0
10
rrGH MIA-502GHRH-APLACEBO GHRH(A+Ant)

Figure S8

Figure S9
25
MLC GATA 4 DAPI
15
20
HP
F
MLC GATA‐4 DAPI*
*
5
10Gat
a-4/
H
0
5
rrGH MIA-502GHRH-APLACEBO GHRH(A+Ant)

Kanashiro-Takeuchi et al.
Table S1. Serial echocardiographic analysis of LV chamber size and function.
Echocardiographic measurements at baseline (BSL), week 4 (W4) and week 8
(W8) after MI.
Parameter Placebo (8) GHRH‐A (10) rrGH (9) GHRH(A+ANT) (7)
MIA‐602 (8)
LVEDD (mm)
BSL 6.0±0.1 6.0±0.1 6.0±0.1 5.9±0.1 6.1±0.1
W4 8.2±0.1 * 8.4±0.1 * 8.4±0.1 * 8.4±0.2 * 8.3±0.2 *
W8 8.7±0.2 * 8.8±0.1 * 9.2±0.2 *†‡ 8.9±0.1 *† 8.8±0.3 *
LVESD (mm)
BSL 2.6±0.1 2.8±0.1 2.7±0.1 2.7±0.1 2.4±0.1
W4 6.8±0.2 * 6.7±0.1 * 6.7±0.2 * 7.0±0.3 * 6.9±0.1 *
W8 7.4±0.2 *† 7.3±0.1 *† 7.8±0.2 *† 7.4±0.1 * 7.4±0.3 *
EF (%)
BSL 89±0.7 85±0.9 88±1.0 88±0.7 89±0.7
W4 35.4±1.9 * 35.3±2.7 * 38.1±2.5 * 36.0±1.5 * 36.0±2.7 *
W8 32.7±2.7 * 43.0±3.7 *†§ 32.3±2.7 * 34.5±2.8 * 31.2±2.5 *†
FS (%)
BSL 57.2±1.9 53.6±0.7 54.4±1.8 53.4±1.8 54.3±1.1
W4 17.2±1.3 * 19.2±1.0 * 18.4±1.0 * 17.5±1.8 * 17.2±1.4 *
W8 14.6±0.7 * 17.4±0.6 *¶ 14.8±1.5 *† 16.4±1.3 * 15.9±1.3 *
VD (µl)
BSL 254±4.0 264±5.5 257±5.8 281±10.5 260±8.0
W4 369±15 * 387±12 * 388±12 * 426±8 * 428±10 *
W8 523±22 *† 510±17 *† 554±28 *† 525±10 *† 503±30 *†
VS(µl)
BSL 29±1.7 31±1.8 31±2.0 33±1.4 30±2.6
W4 260±16 * 252±14 * 255±12* 265±9.8* 264±14 *
W8 359±24*† 291±21 *§ 376±26 *† 359±31 *† 370±29 *†
* p < 0.05 vs. BSL, same group
† p < 0.05 vs. W4, same group
‡ p < 0.05 vs. all other groups at W8, except GHRH (A+Ant)
§ p < 0.05 vs. all other groups
¶ p < 0.05 vs. placebo at W8

Kanashiro-Takeuchi et al.
Table S2. Hemodynamic parameters and indices of systolic and diastolic function derived from
pressure‐volume relationships.
Parameter Placebo (5) GHRH-A (5) rrGH (5) GHRH (A+Ant) (7) MIA-602 (7)
Heart rate (bpm) 266±7.3 241±13 274±12 260±9 295±28
Integrated performance
EF (%) 22.8±0.9 38.8±4.2 * 29.7±1.9 28.1±1.3 25.1±2.7
SW (mmHgxl) 5432±277 12572±1685 † 9201±877 8844±426 7328±1027
SV (µl) 94.3±8.5 184.4±19.2 † 137.6±12.4 133.7±3.5 111.4±17.9
CO (ml/ min) 21.9±2.9 40±6.9 † 38.1±3.5 34±2.2 27.2±2.4
Ea/Ees 5.3±0.6 2.7±0.5 ‡ 3.5±0.5 4.1±0.2 5.1±1.2
Afterload
LVESP (mmHg) 89.5±2.9 87.9±3.8 87.7±1.2 89±2.1 89.2±2.2
Ea (mmHg/ µl) 0.9±0.08 0.5±0.06 † 0.6±0.05 0.7±0.04 0.9±0.13
Preload
LVEDP (mmHg) 19.8±2.3 12.5±1.3 ‡ 18±3.1 19.3±3.1 16.2±1.7
Contractility
dP/dtmax (mmHg/s) 6245±363 6642±370 6885±222 6532±429 6813±366
Ees (mmHg/l) 0.17±0.02 0.19±0.01 0.19±0.02 0.17±0.01 0.19±0.01
PRSW (mmHg) 42±6.2 59±4.4 50±1.4 44±4.7 48±2.9
Lusitropy
dP/dtmin (mmHg/s) 4314±234 4770±272 4589±300 4372±406 4603±414
TAU (W) (ms) 14.4±05 13.4±0.6 18.2±1.8 16.4±1.5 13.7±1.2
All values represent mean ± SEM. Ejection fraction (EF), stroke work (SW), stroke volume (SV), cardiac output (CO), ratio between arterial elastance
and end-systolic elastance (Ea/Ees), left ventricular end-systolic pressure (LVESP), arterial elastance (Ea), left ventricular end-diastolic pressure
(LVEDP), peak rate of the pressure rise (dP/dtmax), end-systolic elastance (Ees), preload recruitable stroke work (PRSW), peak rate of pressure decline
(dP/dtmin), relaxation time constant calculated by Weiss method (TAU).
* p<0.05 vs. all other groups. except rrGH.
† p<0.05 vs. placebo and MIA-602
‡ p<0.05 vs.placebo, Student t test

Kanashiro-Takeuchi et al. Table S3. Antibody list
Protein Antibody Labeling Fluorochromes
GHRHR rabbit polyclonal indirect F
C-kit goat polyclonal indirect T
Mast cell tryptase mouse polyclonal indirect T
CD45 rabbit polyclonal indirect F
Myosin light chain rabbit monoclonal indirect F
Phospho H3 mouse monoclonal indirect T
GATA-4 goat polyclonal indirect T
Nuclear DNA DAPI N/A
TUNEL Tdt/dUTP direct F
Direct labeling: primary antibody conjugated with the fluorochrome.
Indirect labeling: species-specific secondary antibody with the fluorochrome.
F: fluorescein isothiocyanate
T: tetramethyl rhodamine isothiocyanate,
Dapi: 4',6-diamidino-2-phenylindole.
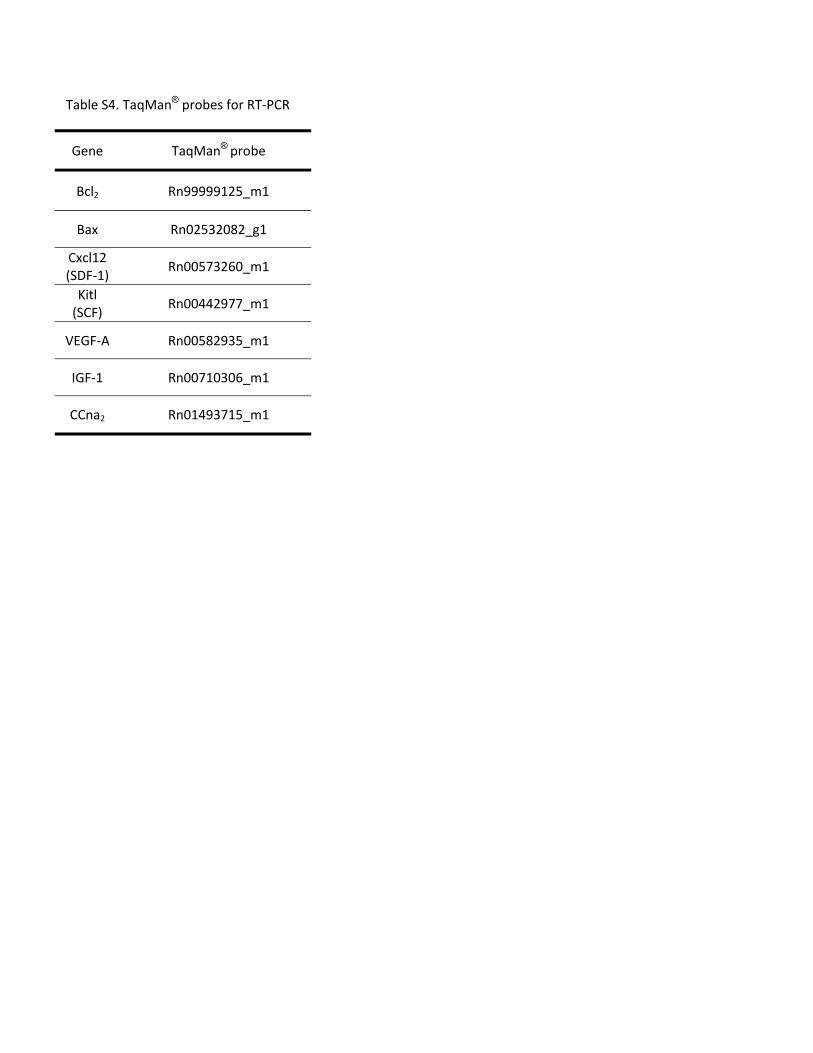
Table S4. TaqMan® probes for RT‐PCR
Gene TaqMan® probe
Bcl2 Rn99999125_m1
Bax Rn02532082_g1
Cxcl12 (SDF‐1) Rn00573260_m1
Kitl (SCF) Rn00442977_m1
VEGF‐A Rn00582935_m1
IGF‐1 Rn00710306_m1
CCna2 Rn01493715_m1