kansas medical assistance program - kansas … · 2014-10-21 · kansas medical assistance program...
TRANSCRIPT
Kansas Medical Assistance Program: Fee-For-Service Program Assessment
State Fiscal Year 2014
Prepared by Health Information Designs, LLC Nicole Ellermeier, PharmD
October 2014
Kansas Medical Assistance Program FFS Program Assessment SFY 2014
Table of Contents Introduction ......................................................................................................................................3
Claims Totals .....................................................................................................................................3
Overall Program Totals...................................................................................................................... 4 TXIX Program Totals ................................................................................................................ 5 ADAPD Program Totals ............................................................................................................ 6 MKN Program Totals ............................................................................................................... 6 Share of FFS Claims and Claims Cost ....................................................................................... 7
Drug Classification Reporting..............................................................................................................8
FFS Top Therapeutic Drug Classes ..................................................................................................... 9 ADAPD Top Therapeutic Drug Classes ............................................................................................. 11 TXIX Top Therapeutic Drug Classes ................................................................................................. 12 MKN Top Therapeutic Drug Classes ................................................................................................ 13 Therapeutic Drug Classes Trend Summary Analysis ........................................................................ 14
Antiretrovirals Trend Summary ............................................................................................. 14 Nevirapine Trend Summary ................................................................................................... 15 Antipsychotics Trend Summary ............................................................................................. 16
Conclusion ....................................................................................................................................... 17
Appendix A – Drugs by Class ............................................................................................................. 18
Copyright © 2014 Health Information Designs, LLC i
Kansas Medical Assistance Program FFS Program Assessment SFY 2014
List of Tables and Figures Table 1: FFS Program Summary for SFY 2014 compared to SFY 2013. ........................................................ 3 Table 2: Top 20 FFS Therapeutic Drug Classes based on Number of Claims ............................................... 9 Table 3: Top 20 FFS Therapeutic Drug Classes based on Claims Cost ....................................................... 10 Table 4: Top 5 ADAPD Therapeutic Drug Classes based on Number of Claims ......................................... 11 Table 5: Top 5 ADAPD Therapeutic Drug Classes based on Claims Cost ................................................... 11 Table 6: Top 5 TXIX Therapeutic Drug Classes based on Number of Claims .............................................. 12 Table 7: Top 5 TXIX Therapeutic Drug Classes based on Claims Cost ........................................................ 12 Table 8: Top 5 MKN Therapeutic Drug Classes based on Number of Claims ............................................. 13 Table 9: Top 5 ADAPD Therapeutic Drug Classes based on Claims Cost ................................................... 13 Table 10: Antiretrovirals Trend Summary ................................................................................................. 14 Table 11: Nevirapine Trend Summary ....................................................................................................... 15 Table 12: Antipsychotic Agents Trend Summary ...................................................................................... 16 Table 13: Past Years’ Totals ...................................................................................................................... 17 Figure 1: Eligibility per Month for SFY 2013-SFY 2014 ................................................................................ 4 Figure 2: All FFS Users, Claims, and Claims Cost per Month for SFY 2014 ................................................... 5 Figure 3: TXIX Users, Claims, and Claims Cost per Month for SFY 2014 ...................................................... 5 Figure 4: ADAPD Users, Claims, and Claims Cost per Month for SFY 2014.................................................. 6 Figure 5: MKN Users, Claims, and Claims Cost per Month for SFY 2014 ..................................................... 6 Figure 6: ADAPD, TXIX, and MKN share of SFY 2014 FFS Claims ................................................................. 7 Figure 7: ADAPD, TXIX, and MKN share of SFY 2014 FFS Claims Cost ......................................................... 7 Figure 8: Antiretrovirals Claims Cost Compared to Claims ........................................................................ 14 Figure 9: Nevirapine Claims Cost Compared to Claims ............................................................................. 15 Figure 10: Antipsychotics Claims Cost Compared to Claims...................................................................... 16
Copyright © 2014 Health Information Designs, LLC ii
Kansas Medical Assistance Program FFS Program Assessment SFY 2014
Introduction This Program Assessment report prepared for the Kansas Medical Assistance Program (KMAP) provides analysis of trends in drug utilization for KMAP in State Fiscal Year (SFY) 2014. Included in the analysis are the overall drug claims and expenditures, as well as claims and expenditures broken down by program type and therapeutic drug class.
This analysis identifies where changes in utilization and/or expenditures occurred during the past SFY to help KMAP identify areas in which management and/or interventions may be useful for the fee-for-service (FFS) beneficiaries.
Claims Totals SFY 2014 is the first full SFY since the implementation of KanCare, which resulted in the majority of FFS beneficiaries moving to managed care organizations (MCOs). The total expenditures, claims, members, users, and costs are broken down by SFY 2014, SFY 2013, and SFY 2013 Post-KanCare to identify changes.
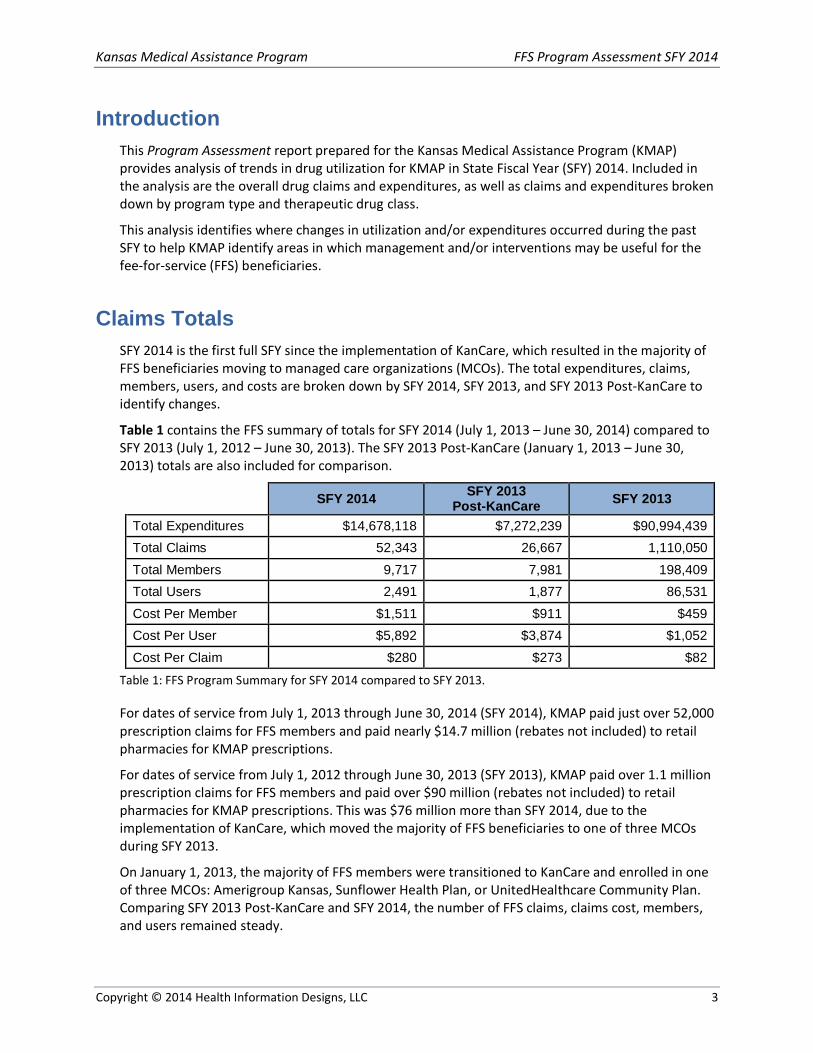
Table 1 contains the FFS summary of totals for SFY 2014 (July 1, 2013 – June 30, 2014) compared to SFY 2013 (July 1, 2012 – June 30, 2013). The SFY 2013 Post-KanCare (January 1, 2013 – June 30, 2013) totals are also included for comparison.
SFY 2014 SFY 2013 Post-KanCare SFY 2013
Total Expenditures $14,678,118 $7,272,239 $90,994,439 Total Claims 52,343 26,667 1,110,050 Total Members 9,717 7,981 198,409 Total Users 2,491 1,877 86,531 Cost Per Member $1,511 $911 $459 Cost Per User $5,892 $3,874 $1,052 Cost Per Claim $280 $273 $82
Table 1: FFS Program Summary for SFY 2014 compared to SFY 2013.
For dates of service from July 1, 2013 through June 30, 2014 (SFY 2014), KMAP paid just over 52,000 prescription claims for FFS members and paid nearly $14.7 million (rebates not included) to retail pharmacies for KMAP prescriptions.
For dates of service from July 1, 2012 through June 30, 2013 (SFY 2013), KMAP paid over 1.1 million prescription claims for FFS members and paid over $90 million (rebates not included) to retail pharmacies for KMAP prescriptions. This was $76 million more than SFY 2014, due to the implementation of KanCare, which moved the majority of FFS beneficiaries to one of three MCOs during SFY 2013.
On January 1, 2013, the majority of FFS members were transitioned to KanCare and enrolled in one of three MCOs: Amerigroup Kansas, Sunflower Health Plan, or UnitedHealthcare Community Plan. Comparing SFY 2013 Post-KanCare and SFY 2014, the number of FFS claims, claims cost, members, and users remained steady.
Copyright © 2014 Health Information Designs, LLC 3

Kansas Medical Assistance Program FFS Program Assessment SFY 2014
Figure 1 is a graphical representation of the total number of beneficiaries eligible for services, including MCO eligibility and FFS members. This shows the overall trend for enrollment over the past two state fiscal years.
Figure 1: Eligibility per Month for SFY 2013-SFY 2014
In January 2013 the majority of FFS beneficiaries were moved to one of three MCOs causing a decline in FFS eligibility and an increase in MCO eligibility. Since that time, the FFS eligibility has remained fairly steady while the Total and MCO eligibility have increased slightly.
Overall Program Totals Several member eligibility types remain in FFS. The three main types with pharmacy coverage include Title 19 (TXIX), MediKan (MKN), and AIDS Drug Assistance Program (ADAPD).
0
100,000
200,000
300,000
400,000
Eligibility Per Month Total Eligibility MCO Eligibility FFS Eligibility
FFS Program Types
TXIX, or Medicaid, is the health insurance program that helps low-income people pay for health services, including preventative, primary, and acute health services for individuals, children, and families.
MKN is the state-funded health insurance program for adults 18 years or older and covers fewer services than Medicaid.
ADAPD is the program that covers the cost of medications dispensed by a retail pharmacy for those enrolled individuals who have AIDS or are HIV positive.
Copyright © 2014 Health Information Designs, LLC 4
Kansas Medical Assistance Program FFS Program Assessment SFY 2014
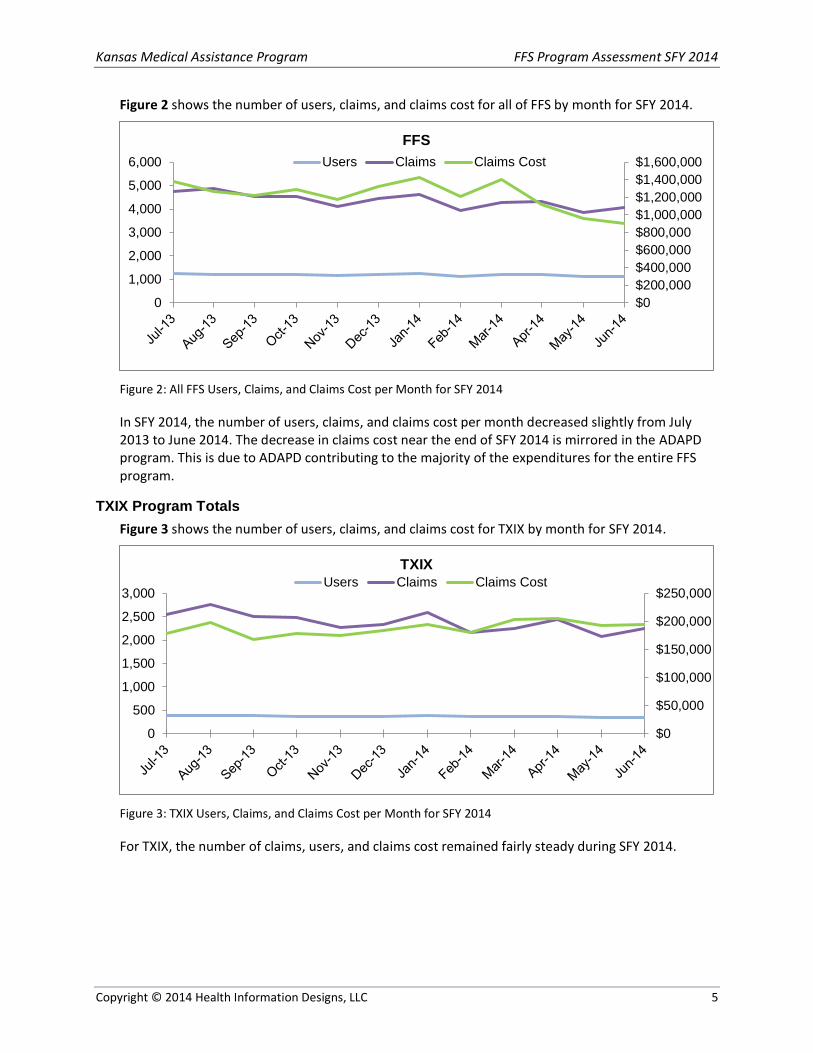
Figure 2 shows the number of users, claims, and claims cost for all of FFS by month for SFY 2014.
Figure 2: All FFS Users, Claims, and Claims Cost per Month for SFY 2014
In SFY 2014, the number of users, claims, and claims cost per month decreased slightly from July 2013 to June 2014. The decrease in claims cost near the end of SFY 2014 is mirrored in the ADAPD program. This is due to ADAPD contributing to the majority of the expenditures for the entire FFS program.
TXIX Program Totals Figure 3 shows the number of users, claims, and claims cost for TXIX by month for SFY 2014.
Figure 3: TXIX Users, Claims, and Claims Cost per Month for SFY 2014
For TXIX, the number of claims, users, and claims cost remained fairly steady during SFY 2014.
$0$200,000$400,000$600,000$800,000$1,000,000$1,200,000$1,400,000$1,600,000
0
1,000
2,000
3,000
4,000
5,000
6,000FFS
Users Claims Claims Cost
$0
$50,000
$100,000
$150,000
$200,000
$250,000
0
500
1,000
1,500
2,000
2,500
3,000
TXIX Users Claims Claims Cost
Copyright © 2014 Health Information Designs, LLC 5
Kansas Medical Assistance Program FFS Program Assessment SFY 2014
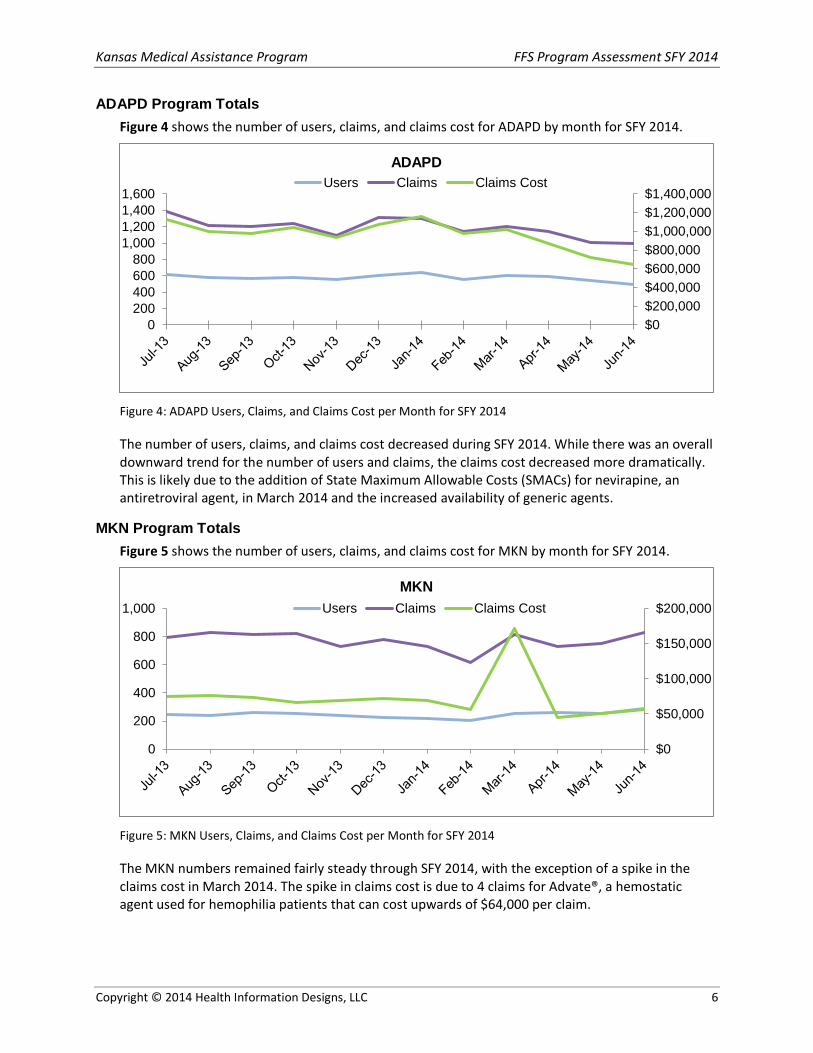
ADAPD Program Totals Figure 4 shows the number of users, claims, and claims cost for ADAPD by month for SFY 2014.
Figure 4: ADAPD Users, Claims, and Claims Cost per Month for SFY 2014
The number of users, claims, and claims cost decreased during SFY 2014. While there was an overall downward trend for the number of users and claims, the claims cost decreased more dramatically. This is likely due to the addition of State Maximum Allowable Costs (SMACs) for nevirapine, an antiretroviral agent, in March 2014 and the increased availability of generic agents.
MKN Program Totals Figure 5 shows the number of users, claims, and claims cost for MKN by month for SFY 2014.
Figure 5: MKN Users, Claims, and Claims Cost per Month for SFY 2014
The MKN numbers remained fairly steady through SFY 2014, with the exception of a spike in the claims cost in March 2014. The spike in claims cost is due to 4 claims for Advate®, a hemostatic agent used for hemophilia patients that can cost upwards of $64,000 per claim.
$0$200,000$400,000$600,000$800,000$1,000,000$1,200,000$1,400,000
0200400600800
1,0001,2001,4001,600
ADAPD Users Claims Claims Cost
$0
$50,000
$100,000
$150,000
$200,000
0
200
400
600
800
1,000MKN
Users Claims Claims Cost
Copyright © 2014 Health Information Designs, LLC 6
Kansas Medical Assistance Program FFS Program Assessment SFY 2014
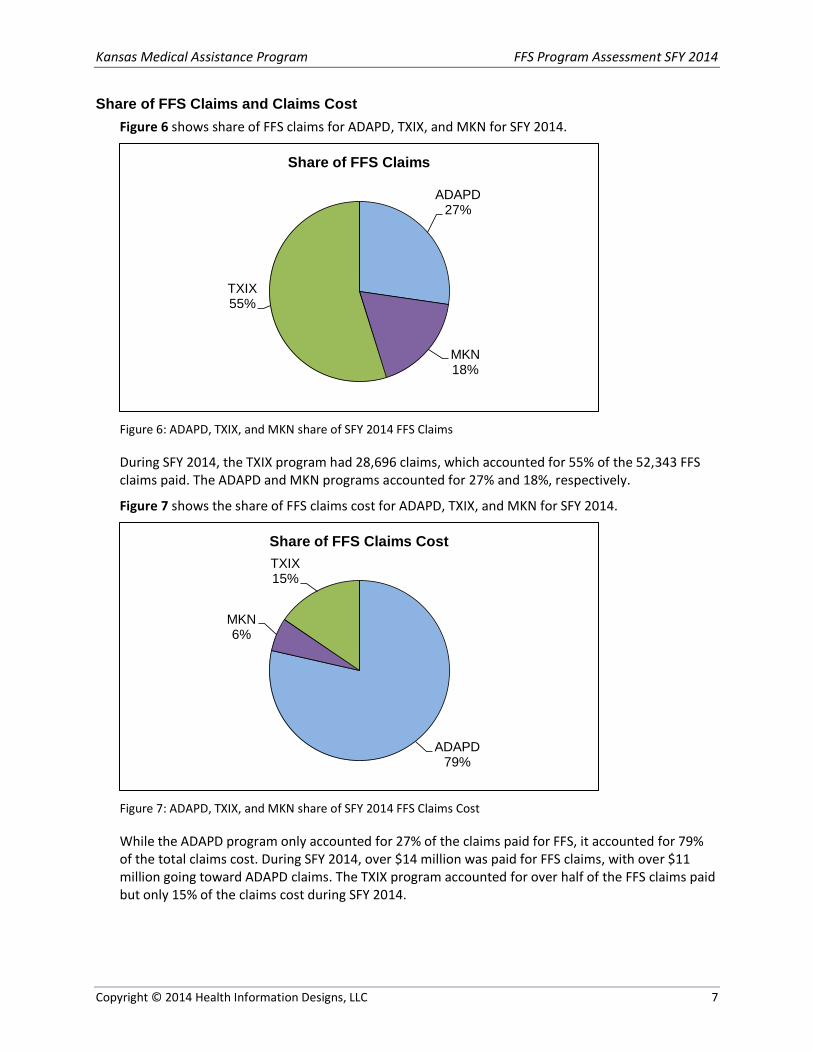
Share of FFS Claims and Claims Cost Figure 6 shows share of FFS claims for ADAPD, TXIX, and MKN for SFY 2014.
Figure 6: ADAPD, TXIX, and MKN share of SFY 2014 FFS Claims
During SFY 2014, the TXIX program had 28,696 claims, which accounted for 55% of the 52,343 FFS claims paid. The ADAPD and MKN programs accounted for 27% and 18%, respectively.
Figure 7 shows the share of FFS claims cost for ADAPD, TXIX, and MKN for SFY 2014.
Figure 7: ADAPD, TXIX, and MKN share of SFY 2014 FFS Claims Cost
While the ADAPD program only accounted for 27% of the claims paid for FFS, it accounted for 79% of the total claims cost. During SFY 2014, over $14 million was paid for FFS claims, with over $11 million going toward ADAPD claims. The TXIX program accounted for over half of the FFS claims paid but only 15% of the claims cost during SFY 2014.
ADAPD 27%
MKN 18%
TXIX 55%
Share of FFS Claims
ADAPD 79%
MKN 6%
TXIX 15%
Share of FFS Claims Cost
Copyright © 2014 Health Information Designs, LLC 7
Kansas Medical Assistance Program FFS Program Assessment SFY 2014
Drug Classification Reporting It is important not only to report the number of beneficiaries, number of claims, and claims cost by yearly and monthly totals, but also to look at trends by therapeutic drug classes.
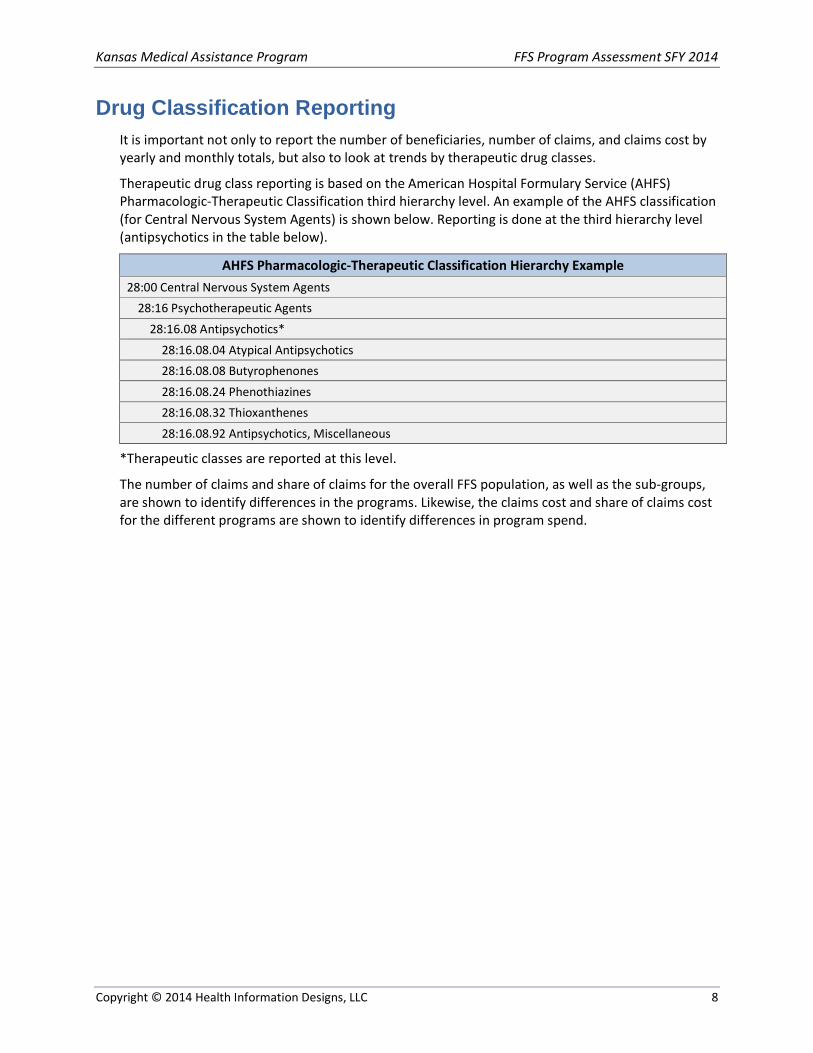
Therapeutic drug class reporting is based on the American Hospital Formulary Service (AHFS) Pharmacologic-Therapeutic Classification third hierarchy level. An example of the AHFS classification (for Central Nervous System Agents) is shown below. Reporting is done at the third hierarchy level (antipsychotics in the table below).
AHFS Pharmacologic-Therapeutic Classification Hierarchy Example 28:00 Central Nervous System Agents
28:16 Psychotherapeutic Agents 28:16.08 Antipsychotics*
28:16.08.04 Atypical Antipsychotics 28:16.08.08 Butyrophenones 28:16.08.24 Phenothiazines 28:16.08.32 Thioxanthenes 28:16.08.92 Antipsychotics, Miscellaneous
*Therapeutic classes are reported at this level.
The number of claims and share of claims for the overall FFS population, as well as the sub-groups, are shown to identify differences in the programs. Likewise, the claims cost and share of claims cost for the different programs are shown to identify differences in program spend.
Copyright © 2014 Health Information Designs, LLC 8
Kansas Medical Assistance Program FFS Program Assessment SFY 2014
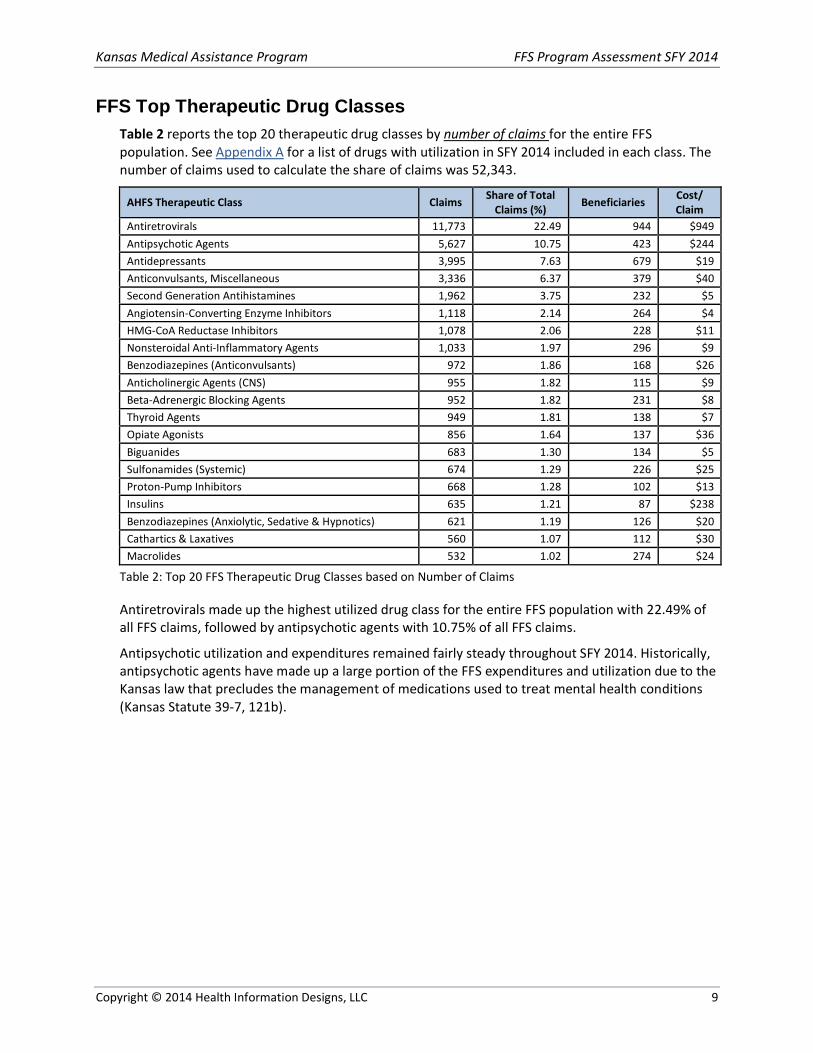
FFS Top Therapeutic Drug Classes Table 2 reports the top 20 therapeutic drug classes by number of claims for the entire FFS population. See Appendix A for a list of drugs with utilization in SFY 2014 included in each class. The number of claims used to calculate the share of claims was 52,343.
AHFS Therapeutic Class Claims Share of Total Claims (%) Beneficiaries Cost/
Claim Antiretrovirals 11,773 22.49 944 $949 Antipsychotic Agents 5,627 10.75 423 $244 Antidepressants 3,995 7.63 679 $19 Anticonvulsants, Miscellaneous 3,336 6.37 379 $40 Second Generation Antihistamines 1,962 3.75 232 $5 Angiotensin-Converting Enzyme Inhibitors 1,118 2.14 264 $4 HMG-CoA Reductase Inhibitors 1,078 2.06 228 $11 Nonsteroidal Anti-Inflammatory Agents 1,033 1.97 296 $9 Benzodiazepines (Anticonvulsants) 972 1.86 168 $26 Anticholinergic Agents (CNS) 955 1.82 115 $9 Beta-Adrenergic Blocking Agents 952 1.82 231 $8 Thyroid Agents 949 1.81 138 $7 Opiate Agonists 856 1.64 137 $36 Biguanides 683 1.30 134 $5 Sulfonamides (Systemic) 674 1.29 226 $25 Proton-Pump Inhibitors 668 1.28 102 $13 Insulins 635 1.21 87 $238 Benzodiazepines (Anxiolytic, Sedative & Hypnotics) 621 1.19 126 $20 Cathartics & Laxatives 560 1.07 112 $30 Macrolides 532 1.02 274 $24
Table 2: Top 20 FFS Therapeutic Drug Classes based on Number of Claims
Antiretrovirals made up the highest utilized drug class for the entire FFS population with 22.49% of all FFS claims, followed by antipsychotic agents with 10.75% of all FFS claims.
Antipsychotic utilization and expenditures remained fairly steady throughout SFY 2014. Historically, antipsychotic agents have made up a large portion of the FFS expenditures and utilization due to the Kansas law that precludes the management of medications used to treat mental health conditions (Kansas Statute 39-7, 121b).
Copyright © 2014 Health Information Designs, LLC 9

Kansas Medical Assistance Program FFS Program Assessment SFY 2014
Table 3 reports the top 20 therapeutic drug classes by claims cost for the entire FFS population. The claims cost used to calculate the share of claims cost was $14,678,118.
AHFS Therapeutic Class Claims Cost Share of Total Claims Cost (%) Beneficiaries Cost/
Claim Antiretrovirals $11,172,408 76.12 944 $949 Antipsychotic Agents $1,373,987 9.36 423 $244 Hemostatics $385,958 2.63 1 $32,163 Antiemetics, Miscellaneous $195,873 1.33 55 $765 Insulins $151,370 1.03 87 $238 Anticonvulsants, Miscellaneous $134,459 0.92 379 $40 Nucleosides & Nucleotides $118,539 0.81 105 $297 Corticosteroids (Respiratory Tract) $88,788 0.60 80 $277 Antidepressants $77,816 0.53 679 $19 Immunomodulatory Agents $68,605 0.47 3 $3,611 Antimuscarinics/Antispasmodics $65,239 0.44 78 $173 Interferons $47,370 0.32 7 $3,158 Antineoplastic Agents $36,578 0.25 19 $600 Antibacterials (Skin & Mucous Membrane) $35,780 0.24 64 $114 Opiate Agonists $31,180 0.21 137 $36 Dipeptidyl Peptidase-4(DPP-4) Inhibitors $28,661 0.20 15 $302 Respiratory Tract Agents, Miscellaneous $28,526 0.19 1 $7,131 Antimuscarinics $25,334 0.17 26 $103 Benzodiazepines (Anticonvulsants) $24,882 0.17 168 $26 HCV Antivirals $24,312 0.17 2 $6,078
Table 3: Top 20 FFS Therapeutic Drug Classes based on Claims Cost
Antiretrovirals made up the drug class with the highest cost for the entire FFS population with 76.12% of all FFS claims cost, followed by antipsychotic agents with 9.36% of all FFS claims cost.
The DDP-4 Inhibitors are new to the top therapeutic classes by cost in SFY 2014. There were less than 100 claims for these agents, but the average cost per claim was around $300. Another drug class to note is the antineoplastic agents, which includes megesterol, an agent used to treat significant weight loss in patients with a diagnosis of AIDS. Megesterol claims accounted for 51% of the claims cost for antineoplastic agents in SFY 2014.
Copyright © 2014 Health Information Designs, LLC 10
Kansas Medical Assistance Program FFS Program Assessment SFY 2014
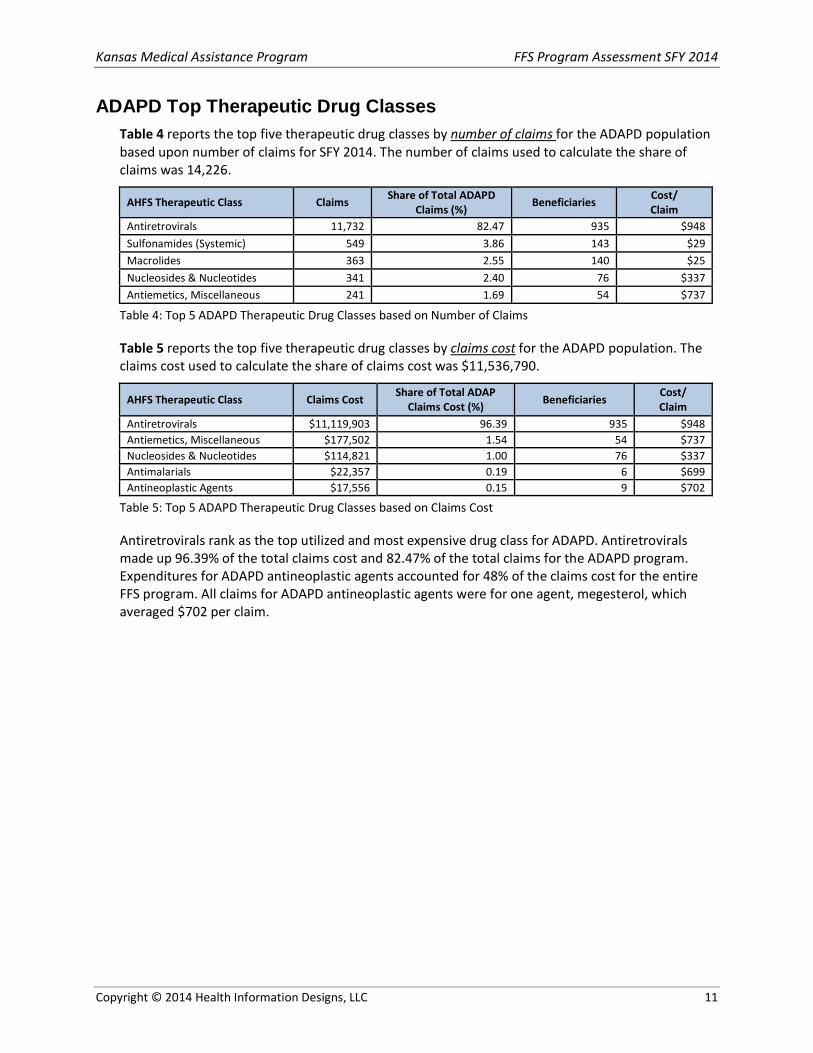
ADAPD Top Therapeutic Drug Classes Table 4 reports the top five therapeutic drug classes by number of claims for the ADAPD population based upon number of claims for SFY 2014. The number of claims used to calculate the share of claims was 14,226.
AHFS Therapeutic Class Claims Share of Total ADAPD Claims (%) Beneficiaries Cost/
Claim Antiretrovirals 11,732 82.47 935 $948 Sulfonamides (Systemic) 549 3.86 143 $29 Macrolides 363 2.55 140 $25 Nucleosides & Nucleotides 341 2.40 76 $337 Antiemetics, Miscellaneous 241 1.69 54 $737
Table 4: Top 5 ADAPD Therapeutic Drug Classes based on Number of Claims
Table 5 reports the top five therapeutic drug classes by claims cost for the ADAPD population. The claims cost used to calculate the share of claims cost was $11,536,790.
AHFS Therapeutic Class Claims Cost Share of Total ADAP Claims Cost (%) Beneficiaries Cost/
Claim Antiretrovirals $11,119,903 96.39 935 $948 Antiemetics, Miscellaneous $177,502 1.54 54 $737 Nucleosides & Nucleotides $114,821 1.00 76 $337 Antimalarials $22,357 0.19 6 $699 Antineoplastic Agents $17,556 0.15 9 $702
Table 5: Top 5 ADAPD Therapeutic Drug Classes based on Claims Cost
Antiretrovirals rank as the top utilized and most expensive drug class for ADAPD. Antiretrovirals made up 96.39% of the total claims cost and 82.47% of the total claims for the ADAPD program. Expenditures for ADAPD antineoplastic agents accounted for 48% of the claims cost for the entire FFS program. All claims for ADAPD antineoplastic agents were for one agent, megesterol, which averaged $702 per claim.
Copyright © 2014 Health Information Designs, LLC 11
Kansas Medical Assistance Program FFS Program Assessment SFY 2014
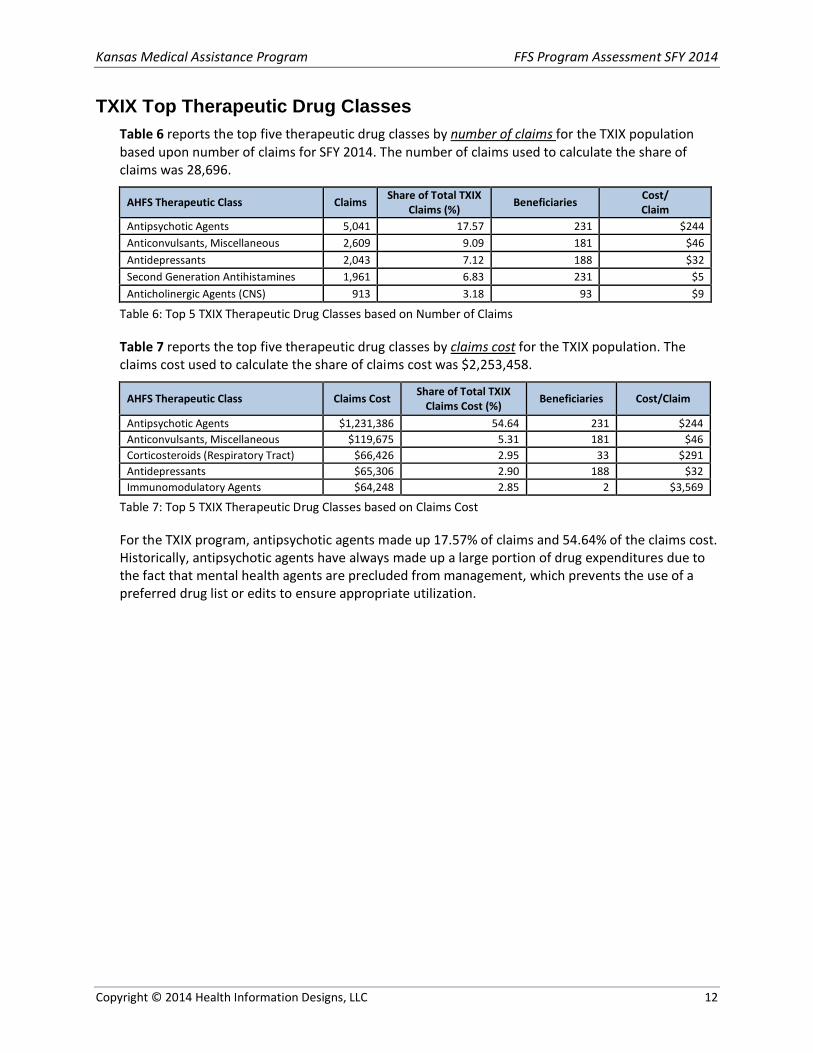
TXIX Top Therapeutic Drug Classes Table 6 reports the top five therapeutic drug classes by number of claims for the TXIX population based upon number of claims for SFY 2014. The number of claims used to calculate the share of claims was 28,696.
AHFS Therapeutic Class Claims Share of Total TXIX Claims (%) Beneficiaries Cost/
Claim Antipsychotic Agents 5,041 17.57 231 $244 Anticonvulsants, Miscellaneous 2,609 9.09 181 $46 Antidepressants 2,043 7.12 188 $32 Second Generation Antihistamines 1,961 6.83 231 $5 Anticholinergic Agents (CNS) 913 3.18 93 $9
Table 6: Top 5 TXIX Therapeutic Drug Classes based on Number of Claims
Table 7 reports the top five therapeutic drug classes by claims cost for the TXIX population. The claims cost used to calculate the share of claims cost was $2,253,458.
AHFS Therapeutic Class Claims Cost Share of Total TXIX Claims Cost (%) Beneficiaries Cost/Claim
Antipsychotic Agents $1,231,386 54.64 231 $244 Anticonvulsants, Miscellaneous $119,675 5.31 181 $46 Corticosteroids (Respiratory Tract) $66,426 2.95 33 $291 Antidepressants $65,306 2.90 188 $32 Immunomodulatory Agents $64,248 2.85 2 $3,569
Table 7: Top 5 TXIX Therapeutic Drug Classes based on Claims Cost
For the TXIX program, antipsychotic agents made up 17.57% of claims and 54.64% of the claims cost. Historically, antipsychotic agents have always made up a large portion of drug expenditures due to the fact that mental health agents are precluded from management, which prevents the use of a preferred drug list or edits to ensure appropriate utilization.
Copyright © 2014 Health Information Designs, LLC 12

Kansas Medical Assistance Program FFS Program Assessment SFY 2014
MKN Top Therapeutic Drug Classes Table 8 reports the top five therapeutic drug classes by number of claims for the MKN population based upon number of claims for SFY 2014. The number of claims used to calculate the share of claims was 9,237.
AHFS Therapeutic Class Claims Share of Total MKN Claims (%) Beneficiaries Cost/
Claim Antidepressants 1,746 18.90 451 $6 Anticonvulsants, Miscellaneous 721 7.81 199 $20 Angiotensin-Converting Enzyme Inhibitors 588 6.37 193 $3 Antipsychotic Agents 585 6.33 196 $244 Beta-Adrenergic Blocking Agents 478 5.17 166 $5
Table 8: Top 5 MKN Therapeutic Drug Classes based on Number of Claims
Antidepressant agents made up the highest number of claims at 18.9%, followed by miscellaneous anticonvulsants at 7.81% of claims.
Table 9 reports the top five therapeutic drug classes by claims cost for the MKN population. The claims cost used to calculate the share of claims cost was $11,536,790.
AHFS Therapeutic Class Claims Cost
Share of Total MKN Claims Cost (%) Beneficiaries Cost/
Claim Hemostatics $385,958 43.80 1 $32,163 Antipsychotic Agents $142,585 16.18 196 $244 Insulins $93,291 10.59 57 $304 Interferons $44,142 5.01 6 $3,153 Respiratory Tract Agents, Miscellaneous $28,526 3.24 1 $7,131
Table 9: Top 5 ADAPD Therapeutic Drug Classes based on Claims Cost
Hemostatics accounted for 43.80% of the claims cost for MKN. This is due to the average cost/claim of over $32,000 for these agents. There is a large variance in claims cost for these agents because the dose is variable, with some patients requiring large doses during a crisis.
The miscellaneous respiratory tract agents include the alpha-1-proteinase inhibitors (A1-PI), which are used to treat patients with A1-PI deficiency who have clinical evidence of emphysema. These agents average over $7,000 per claim.
Copyright © 2014 Health Information Designs, LLC 13
Kansas Medical Assistance Program FFS Program Assessment SFY 2014
Therapeutic Drug Classes Trend Summary Analysis Within the list of therapeutic drug classes, there are several classes and specific drugs that are of interest due to the changes in their share of claims or claims cost over the year.
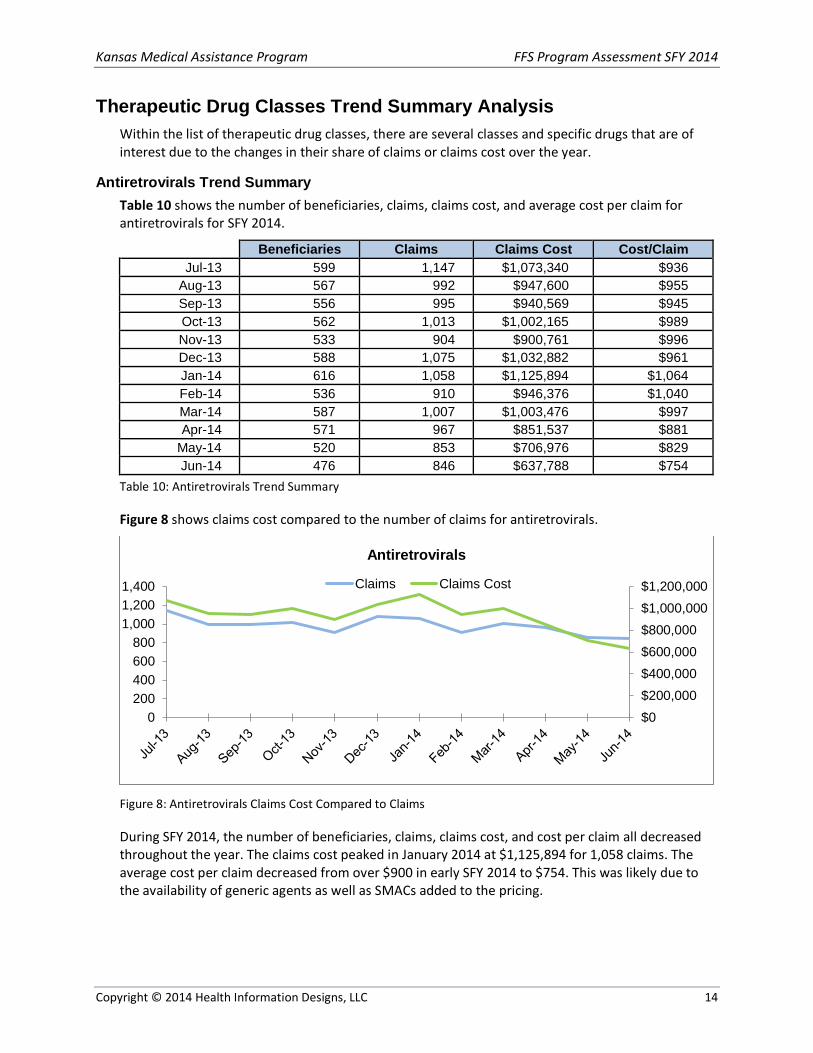
Antiretrovirals Trend Summary Table 10 shows the number of beneficiaries, claims, claims cost, and average cost per claim for antiretrovirals for SFY 2014.
Beneficiaries Claims Claims Cost Cost/Claim Jul-13 599 1,147 $1,073,340 $936
Aug-13 567 992 $947,600 $955 Sep-13 556 995 $940,569 $945 Oct-13 562 1,013 $1,002,165 $989 Nov-13 533 904 $900,761 $996 Dec-13 588 1,075 $1,032,882 $961 Jan-14 616 1,058 $1,125,894 $1,064 Feb-14 536 910 $946,376 $1,040 Mar-14 587 1,007 $1,003,476 $997 Apr-14 571 967 $851,537 $881
May-14 520 853 $706,976 $829 Jun-14 476 846 $637,788 $754
Table 10: Antiretrovirals Trend Summary
Figure 8 shows claims cost compared to the number of claims for antiretrovirals.
Figure 8: Antiretrovirals Claims Cost Compared to Claims
During SFY 2014, the number of beneficiaries, claims, claims cost, and cost per claim all decreased throughout the year. The claims cost peaked in January 2014 at $1,125,894 for 1,058 claims. The average cost per claim decreased from over $900 in early SFY 2014 to $754. This was likely due to the availability of generic agents as well as SMACs added to the pricing.
$0$200,000$400,000$600,000$800,000$1,000,000$1,200,000
0200400600800
1,0001,2001,400
Antiretrovirals
Claims Claims Cost
Copyright © 2014 Health Information Designs, LLC 14
Kansas Medical Assistance Program FFS Program Assessment SFY 2014
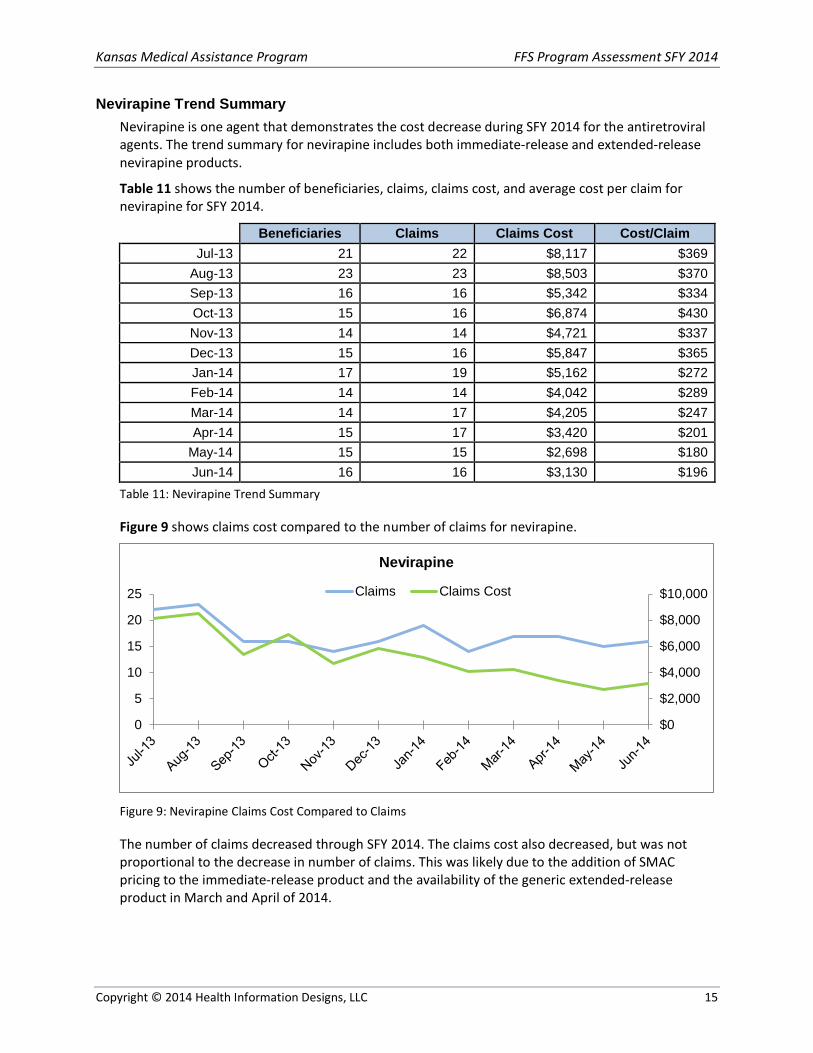
Nevirapine Trend Summary Nevirapine is one agent that demonstrates the cost decrease during SFY 2014 for the antiretroviral agents. The trend summary for nevirapine includes both immediate-release and extended-release nevirapine products.
Table 11 shows the number of beneficiaries, claims, claims cost, and average cost per claim for nevirapine for SFY 2014.
Beneficiaries Claims Claims Cost Cost/Claim Jul-13 21 22 $8,117 $369
Aug-13 23 23 $8,503 $370 Sep-13 16 16 $5,342 $334 Oct-13 15 16 $6,874 $430 Nov-13 14 14 $4,721 $337 Dec-13 15 16 $5,847 $365 Jan-14 17 19 $5,162 $272 Feb-14 14 14 $4,042 $289 Mar-14 14 17 $4,205 $247 Apr-14 15 17 $3,420 $201
May-14 15 15 $2,698 $180 Jun-14 16 16 $3,130 $196
Table 11: Nevirapine Trend Summary
Figure 9 shows claims cost compared to the number of claims for nevirapine.
Figure 9: Nevirapine Claims Cost Compared to Claims
The number of claims decreased through SFY 2014. The claims cost also decreased, but was not proportional to the decrease in number of claims. This was likely due to the addition of SMAC pricing to the immediate-release product and the availability of the generic extended-release product in March and April of 2014.
$0
$2,000
$4,000
$6,000
$8,000
$10,000
0
5
10
15
20
25
Nevirapine
Claims Claims Cost
Copyright © 2014 Health Information Designs, LLC 15
Kansas Medical Assistance Program FFS Program Assessment SFY 2014
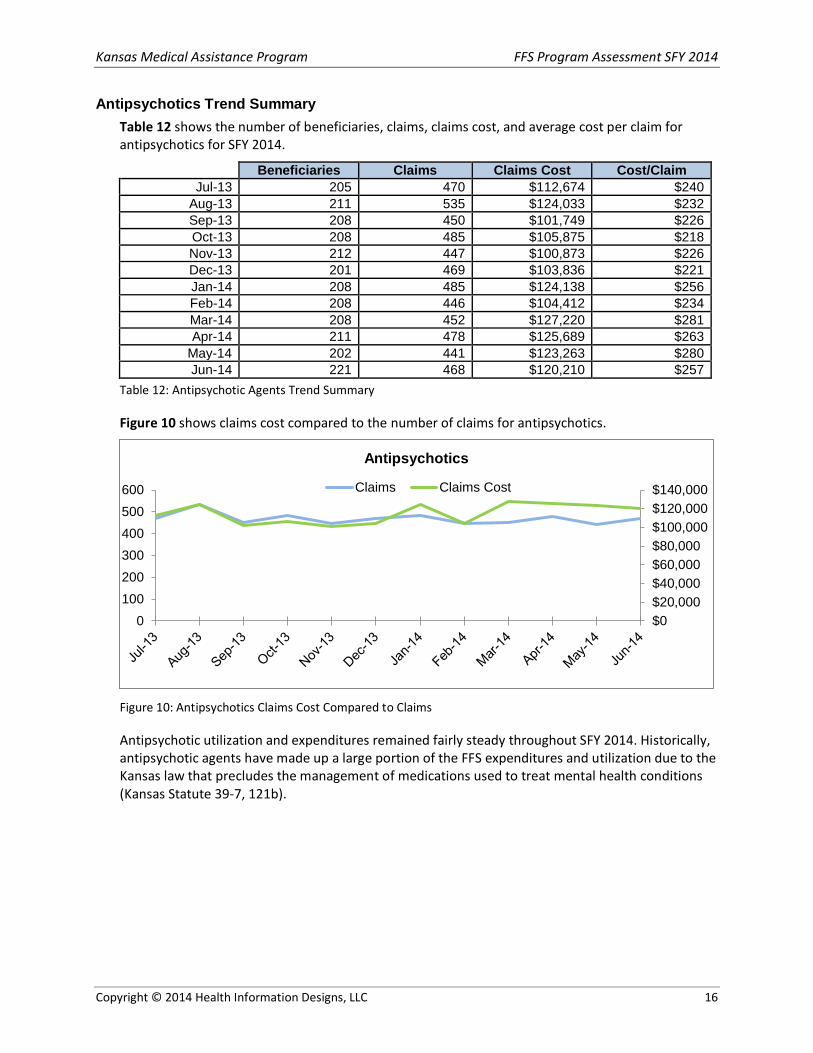
Antipsychotics Trend Summary Table 12 shows the number of beneficiaries, claims, claims cost, and average cost per claim for antipsychotics for SFY 2014.
Beneficiaries Claims Claims Cost Cost/Claim Jul-13 205 470 $112,674 $240
Aug-13 211 535 $124,033 $232 Sep-13 208 450 $101,749 $226 Oct-13 208 485 $105,875 $218 Nov-13 212 447 $100,873 $226 Dec-13 201 469 $103,836 $221 Jan-14 208 485 $124,138 $256 Feb-14 208 446 $104,412 $234 Mar-14 208 452 $127,220 $281 Apr-14 211 478 $125,689 $263
May-14 202 441 $123,263 $280 Jun-14 221 468 $120,210 $257
Table 12: Antipsychotic Agents Trend Summary
Figure 10 shows claims cost compared to the number of claims for antipsychotics.
Figure 10: Antipsychotics Claims Cost Compared to Claims
Antipsychotic utilization and expenditures remained fairly steady throughout SFY 2014. Historically, antipsychotic agents have made up a large portion of the FFS expenditures and utilization due to the Kansas law that precludes the management of medications used to treat mental health conditions (Kansas Statute 39-7, 121b).
$0$20,000$40,000$60,000$80,000$100,000$120,000$140,000
0100200300400500600
Antipsychotics
Claims Claims Cost
Copyright © 2014 Health Information Designs, LLC 16
Kansas Medical Assistance Program FFS Program Assessment SFY 2014
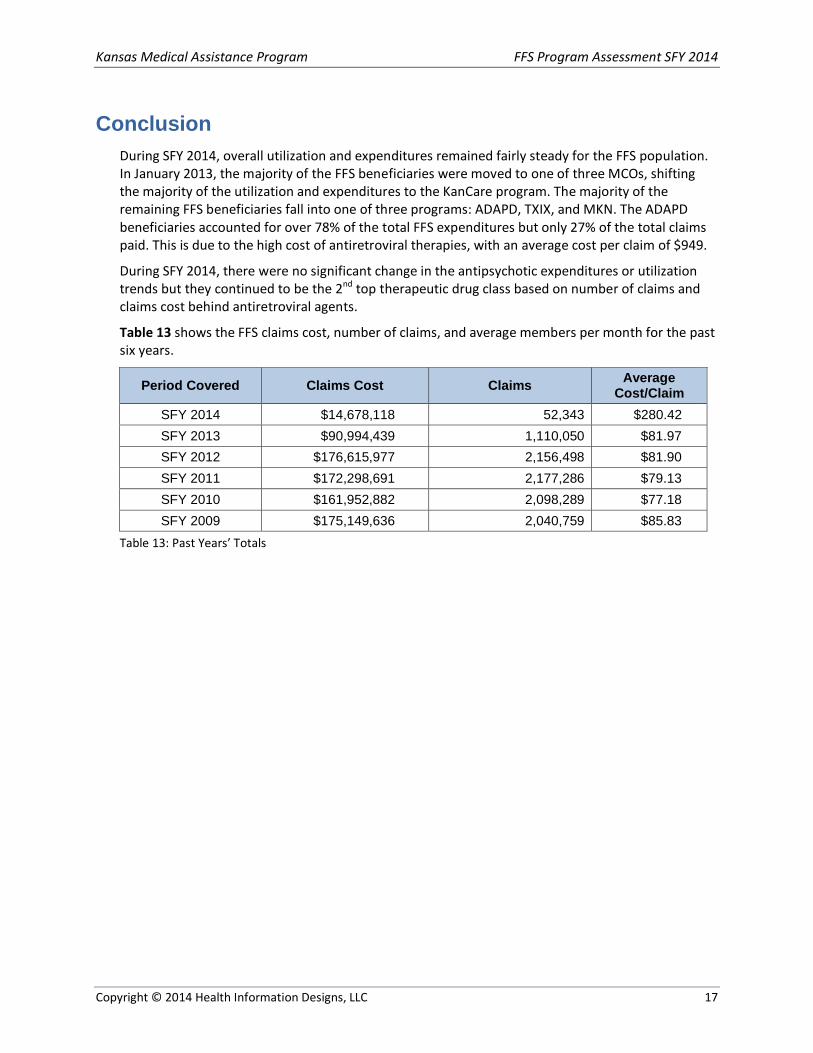
Conclusion During SFY 2014, overall utilization and expenditures remained fairly steady for the FFS population. In January 2013, the majority of the FFS beneficiaries were moved to one of three MCOs, shifting the majority of the utilization and expenditures to the KanCare program. The majority of the remaining FFS beneficiaries fall into one of three programs: ADAPD, TXIX, and MKN. The ADAPD beneficiaries accounted for over 78% of the total FFS expenditures but only 27% of the total claims paid. This is due to the high cost of antiretroviral therapies, with an average cost per claim of $949.
During SFY 2014, there were no significant change in the antipsychotic expenditures or utilization trends but they continued to be the 2nd top therapeutic drug class based on number of claims and claims cost behind antiretroviral agents.
Table 13 shows the FFS claims cost, number of claims, and average members per month for the past six years.
Period Covered Claims Cost Claims Average Cost/Claim
SFY 2014 $14,678,118 52,343 $280.42 SFY 2013 $90,994,439 1,110,050 $81.97 SFY 2012 $176,615,977 2,156,498 $81.90 SFY 2011 $172,298,691 2,177,286 $79.13 SFY 2010 $161,952,882 2,098,289 $77.18 SFY 2009 $175,149,636 2,040,759 $85.83
Table 13: Past Years’ Totals
Copyright © 2014 Health Information Designs, LLC 17
Kansas Medical Assistance Program FFS Program Assessment SFY 2014
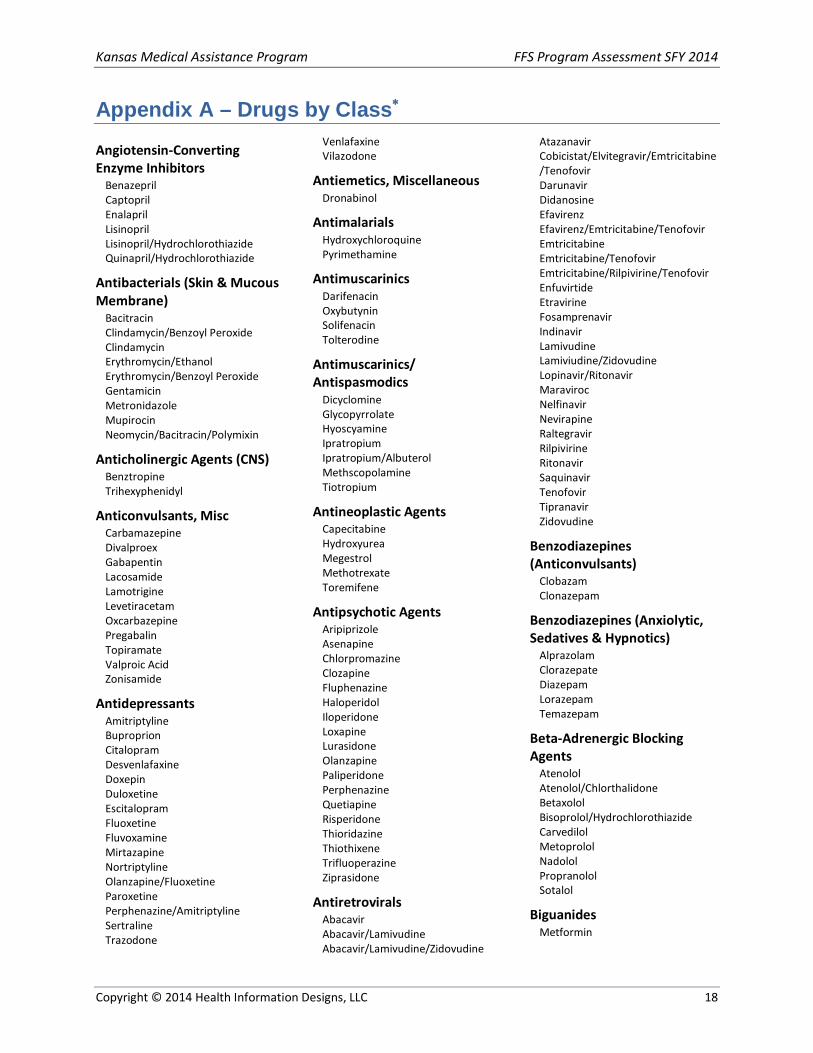
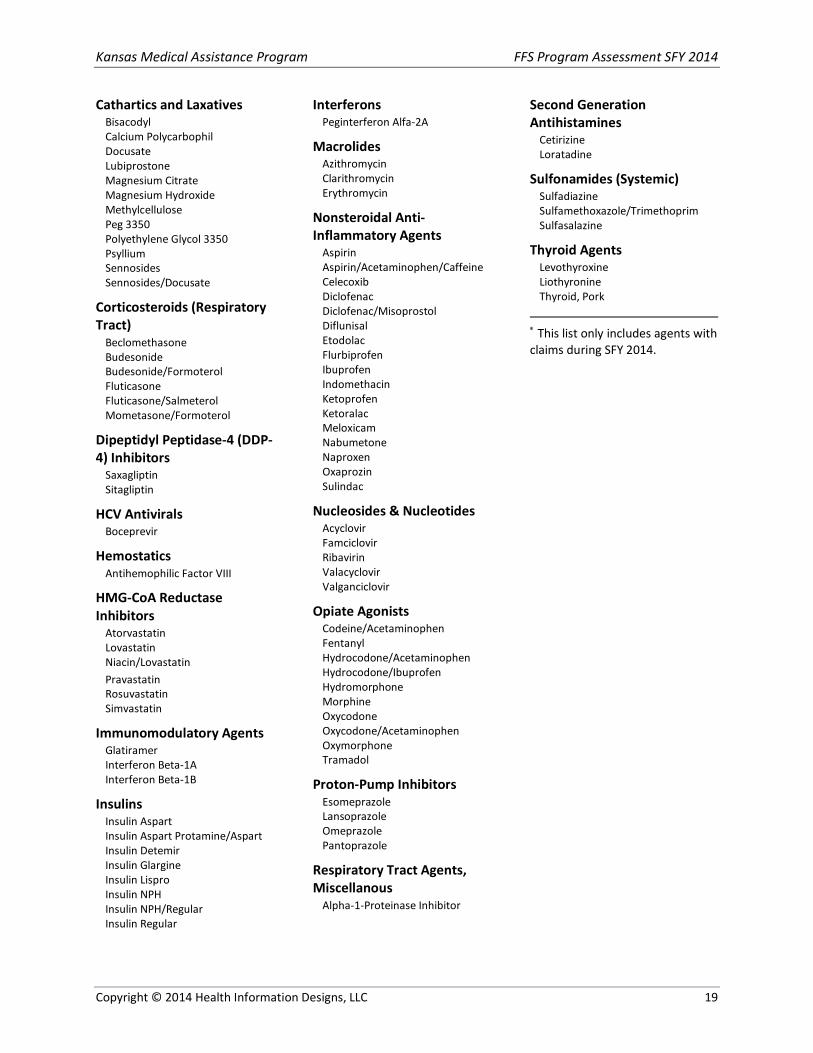
Appendix A – Drugs by Class∗
Angiotensin-Converting Enzyme Inhibitors
Benazepril Captopril Enalapril Lisinopril Lisinopril/Hydrochlorothiazide Quinapril/Hydrochlorothiazide
Antibacterials (Skin & Mucous Membrane)
Bacitracin Clindamycin/Benzoyl Peroxide Clindamycin Erythromycin/Ethanol Erythromycin/Benzoyl Peroxide Gentamicin Metronidazole Mupirocin Neomycin/Bacitracin/Polymixin
Anticholinergic Agents (CNS) Benztropine Trihexyphenidyl
Anticonvulsants, Misc Carbamazepine Divalproex Gabapentin Lacosamide Lamotrigine Levetiracetam Oxcarbazepine Pregabalin Topiramate Valproic Acid Zonisamide
Antidepressants Amitriptyline Buproprion Citalopram Desvenlafaxine Doxepin Duloxetine Escitalopram Fluoxetine Fluvoxamine Mirtazapine Nortriptyline Olanzapine/Fluoxetine Paroxetine Perphenazine/Amitriptyline Sertraline Trazodone
Venlafaxine Vilazodone
Antiemetics, Miscellaneous Dronabinol
Antimalarials Hydroxychloroquine Pyrimethamine
Antimuscarinics Darifenacin Oxybutynin Solifenacin Tolterodine
Antimuscarinics/ Antispasmodics
Dicyclomine Glycopyrrolate Hyoscyamine Ipratropium Ipratropium/Albuterol Methscopolamine Tiotropium
Antineoplastic Agents Capecitabine Hydroxyurea Megestrol Methotrexate Toremifene
Antipsychotic Agents Aripiprizole Asenapine Chlorpromazine Clozapine Fluphenazine Haloperidol Iloperidone Loxapine Lurasidone Olanzapine Paliperidone Perphenazine Quetiapine Risperidone Thioridazine Thiothixene Trifluoperazine Ziprasidone
Antiretrovirals Abacavir Abacavir/Lamivudine Abacavir/Lamivudine/Zidovudine
Atazanavir Cobicistat/Elvitegravir/Emtricitabine/Tenofovir Darunavir Didanosine Efavirenz Efavirenz/Emtricitabine/Tenofovir Emtricitabine Emtricitabine/Tenofovir Emtricitabine/Rilpivirine/Tenofovir Enfuvirtide Etravirine Fosamprenavir Indinavir Lamivudine Lamiviudine/Zidovudine Lopinavir/Ritonavir Maraviroc Nelfinavir Nevirapine Raltegravir Rilpivirine Ritonavir Saquinavir Tenofovir Tipranavir Zidovudine
Benzodiazepines (Anticonvulsants)
Clobazam Clonazepam
Benzodiazepines (Anxiolytic, Sedatives & Hypnotics)
Alprazolam Clorazepate Diazepam Lorazepam Temazepam
Beta-Adrenergic Blocking Agents
Atenolol Atenolol/Chlorthalidone Betaxolol Bisoprolol/Hydrochlorothiazide Carvedilol Metoprolol Nadolol Propranolol Sotalol
Biguanides Metformin
Copyright © 2014 Health Information Designs, LLC 18
Kansas Medical Assistance Program FFS Program Assessment SFY 2014
Cathartics and Laxatives Bisacodyl Calcium Polycarbophil Docusate Lubiprostone Magnesium Citrate Magnesium Hydroxide Methylcellulose Peg 3350 Polyethylene Glycol 3350 Psyllium Sennosides Sennosides/Docusate
Corticosteroids (Respiratory Tract)
Beclomethasone Budesonide Budesonide/Formoterol Fluticasone Fluticasone/Salmeterol Mometasone/Formoterol
Dipeptidyl Peptidase-4 (DDP-4) Inhibitors
Saxagliptin Sitagliptin
HCV Antivirals Boceprevir
Hemostatics Antihemophilic Factor VIII
HMG-CoA Reductase Inhibitors
Atorvastatin Lovastatin Niacin/Lovastatin Pravastatin Rosuvastatin Simvastatin
Immunomodulatory Agents Glatiramer Interferon Beta-1A Interferon Beta-1B
Insulins Insulin Aspart Insulin Aspart Protamine/Aspart Insulin Detemir Insulin Glargine Insulin Lispro Insulin NPH Insulin NPH/Regular Insulin Regular
Interferons Peginterferon Alfa-2A
Macrolides Azithromycin Clarithromycin Erythromycin
Nonsteroidal Anti-Inflammatory Agents
Aspirin Aspirin/Acetaminophen/Caffeine Celecoxib Diclofenac Diclofenac/Misoprostol Diflunisal Etodolac Flurbiprofen Ibuprofen Indomethacin Ketoprofen Ketoralac Meloxicam Nabumetone Naproxen Oxaprozin Sulindac
Nucleosides & Nucleotides Acyclovir Famciclovir Ribavirin Valacyclovir Valganciclovir
Opiate Agonists Codeine/Acetaminophen Fentanyl Hydrocodone/Acetaminophen Hydrocodone/Ibuprofen Hydromorphone Morphine Oxycodone Oxycodone/Acetaminophen Oxymorphone Tramadol
Proton-Pump Inhibitors Esomeprazole Lansoprazole Omeprazole Pantoprazole
Respiratory Tract Agents, Miscellanous
Alpha-1-Proteinase Inhibitor
Second Generation Antihistamines
Cetirizine Loratadine
Sulfonamides (Systemic) Sulfadiazine Sulfamethoxazole/Trimethoprim Sulfasalazine
Thyroid Agents Levothyroxine Liothyronine Thyroid, Pork
∗ This list only includes agents with claims during SFY 2014.
Copyright © 2014 Health Information Designs, LLC 19