kaolinite to halloysite-7 a transformation in the … 49/49-6-596.pdf · chtys and clay minerals,...
TRANSCRIPT

Chtys and Clay Minerals, Vol. 49, No. 6, 596-607, 2001.
KAOLINITE TO HALLOYSITE-7 A TRANSFORMATION IN THE KAOLIN DEPOSIT OF SAO VICENTE DE PEREIRA, PORTUGAL
IULIU BOBOS I, JOELLE DUPLAY 2, JOAO ROCHA 3 AND CELSO GOMES 1
Department of Geosciences, University of Aveiro, 3810-Aveiro, Portugal 2 Centre de Geoch6mie de la Surface, Universite "Louis Pasteur", 67084-Strasbourg Cedex, France
3 Department of Chemistry, University of Aveiro, 3810-Aveiro, Portugal
A b s t r a c t ~ h e transformation of kaolinite to halloysite-7 .~ was identified in the kaolin deposit of S~o Vicente de Pereira (SVP), using X-ray diffraction (XRD), Fourier transform infrared spectroscopy (FTIR) and transmission electron microscopy (TEM). Both the 02,1 i and 13,13 reflections show changes in the XRD patterns along the kaolinite to halloysite-7 ,~ transition, and the FTIR spectra show changes cor- responding to both OH and Si-O-stretching bands and Al-O-Si-bending vibrations. The interlayer water content in the kaolinite structure increases during transition. The two-layer periodicity of well-ordered kaolinite and rolling up of kaolinite plates are observed using hi~h-resolution transmission electron mi- croscopy (HRTEM). Long and short tubes exhibit halloysite-7 A. No structural Fe was found in the kaolinite samples. Analytical electron microscopy (AEM) indicates no substitution of AP § for Si 4+. The Si/A1 ratio shows values of -- 1 for the kaolinite and rolled kaolinite plates. The 27A1 magic angle spinning neutron magnetic resonance (MAS-NMR) spectra display a resonance centered at - 1 ppm, assigned to six-coordinated aluminum. The transformation of kaolinite to halloysite-7 A. is controlled by surface reaction.
Key Words--Kaolinite to Halloysite-7 A Transformation, Hydration, Rolling and Folding, Surface Re- action Control, Portugal.
I N T R O D U C T I O N
Kaolinite, one of the most abundant clay minerals, occurs widely in soils, sediments and altered rocks. It may form from feldspars and/or micas by weathering or hydrothermal processes or it may crystal l ize direct f rom solution (Stoch and Sikora, 1976; Keller, 1978; Wilke et al . , 1978; Meunier and Velde, 1979; Anand et al . , 1985; Banfield and Eggleton, 1990; Rober tson and Eggleton, 1991; Jiang and Peacor, 1991; Singh and Gilkes, 1992). Topotactic or epitactic alteration of mica or feldspar to halloysite has not previously been identified in nature (Gilkes et aL , 1986; Singh and Gil- kes, 1992), whereas kaolinite formed from mica by topotactic alteration can subsequently produce halloy- site tubes (Giese, 1988). Nevertheless , halloysite may also be formed through alteration of feldspar via so- lution or a non-crystal l ine intermediate stage (Eswaran and Bin, 1978; Singh and Gilkes, 1992).
Rober tson and Eggle ton (1991) explained the trans- formation of platy kaolinite into spiral halloysite rods by a loss of structural r igidity at points along the ka- olinite crystal due to hydration of kaolinite. Also, Singh and Gilkes (1992) showed a deve lopment of parallel halloysite tubes and laths through deformation of platy kaolinite pseudomorphs after mica. These au- thors described the tranformation of kaolinite plates by fragmentat ion into laths that rolled or folded to form halloysite tubes.
Using kaolinite f rom Georgia (USA), Singh and Mackinnon (1996) tested the hypothesis that platy ka- olinite will roll upon hydration. The H R T E M images
of cross-sections of tubes formed after repeated cycles of kaolinite hydration showed both curved layers and planar faces, supporting their hypothesis.
By contrast, the reverse transformation of halloy- site-7 A to kaolinite was recognized by Churchman and Gilkes (1989) in the lateritic profiles of dolerite and granite.
A gradual transition f rom wel l -ordered to poorly- ordered kaolinite was found along a geological profile in the kaolin deposit of SVP from Portugal. The pre- sent contribution reports the transformation of kaolin- ite to halloysite-7 A and structural, morphologica l and crys ta l lochemical results are discussed.
G E O L O G I C A L S E T T I N G
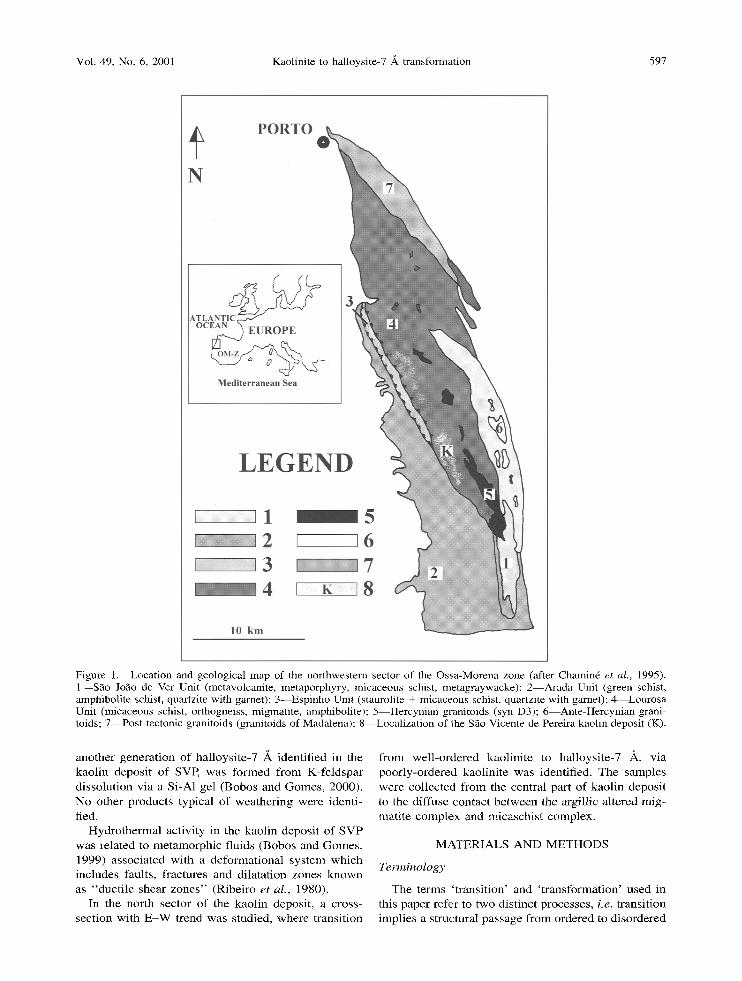
The kaolin deposit of SVP is situated at the north- western edge of the Ossa Morena zone (OM-Z) and extends along a N N W - S S E transect that separates the two lithostratigrafic units of Lourosa and Arada (Fig- ure 1).
The migmati te and/or migmat i te gneiss are argillic, altered due to either hydrothermal or supergene pro- cesses. Bobos and Gomes (1998) described a greisen alteration (quartz + muscovi te bearing E C1 and quartz + tourmaline assemblages) and an argillic alteration (including post-greisen type alteration) represented by wel l -ordered kaolinite ___ illite assemblage. Tourmaline +_ quartz veins cross-cut the argil l ized migmati te rocks (rich in kaolinite). Weathering is characterized by hy- dration of wel l -ordered kaolinite that led to the trans- formation of kaolinite into halloysite-7 A. However ,
Copyright �9 2001, The Clay Minerals Society 596
Vol. 49, No. 6, 2001 Kaolinite to halloysite-7 A transformation 597
Figure 1. Location and geological map of the northwestern sector of the Ossa-Morena zone (after Chamin6 et aL, 1995). 1--Silo Jofio de Ver Unit (metavolcanite, metaporphyry, micaceous schist, metagraywacke); 2--Arada Unit (green schist, amphibolite schist, quartzite with garnet); 3--Espinho Unit (staurolite + micaceous schist, quartzite with garnet); 4 ~ o u r o s a Unit (micaceous schist, orthogneiss, migmatite, amphibolite); 5--Hercynian granitoids (syn D3); 6--Ante-Hercynian grani- toids; 7~Post-tectonic granitoids (granitoids of Madalena); 8 Localization of the S~o Vicente de Pereira kaolin deposit (K).
ano ther genera t ion of hal loysi te-7 A ident i f ied in the kaol in deposi t of SVR was fo rmed f rom K-fe ldspar d isso lu t ion via a Si-A1 gel (Bobos and Gomes , 2000). No o ther products typical of wea the r ing were ident i - fied.
H y d r o t h e r m a l act ivi ty in the kaol in deposi t of S V P was re la ted to m e t a m o r p h i c fluids (Bobos and Gomes , 1999) associa ted wi th a de format iona l sys tem wh ich inc ludes faults, f ractures and di la ta t ion zones k n o w n as "duc t i l e shear z o n e s " (Ribei ro et al. , 1980).
In the nor th sector of the kaol in deposit , a cross- sect ion wi th E - W trend was studied, where t rans i t ion
f rom wel l -o rdered kaol in i te to hal loysi te-7 A, via poor ly -ordered kaol in i te was identified. The samples were col lected f rom the centra l par t of kaol in deposi t to the di f fuse contac t be tween the argil l ic a l tered mig- mat i te co mp l ex and micasch i s t complex .
M A T E R I A L S A N D M E T H O D S
T e r m i n o l o g y
T h e te rms ' t r ans i t ion ' and ' t r ans fo rma t ion ' used in this paper refer to two dis t inct processes , i.e. t rans i t ion impl ies a s tructural passage f rom ordered to d isordered

598 Bobos, Duplay, Rocha and Gomes Clays and Clay Minerals
structure observed by XRD and FTIR techniques, whereas transformation refers to a morphological fea- ture expressed by a topotactic transformation of kao- linite to halloysite-7 A.
The Hinckley index (HI) was calculated in order to assess the kaolinite crystallinity (Hinckley, 1963). We interpreted the HI in accordance with the method sug- gested by Plan~on et al. (1988) and by Plan~on and Zacharie (1990) which shows that HI is an empirical calculation and is not based entirely on the crystalline structure of kaolinite.
Preparation o f materials
The HI was measured for 30 specimens of kaolinite (<2 Ixm clay-aggregate fractions) and three main groups were established: high crystallinity (HI >0.9), medium crystallinity (HI = 0.5-0.9) and low crystal- linity (HI <0.5). Only three samples (SVP-7, SVP-44 and Hly-8) were selected from each group.
Either <10 p~m or <2 ixm clay-aggregate fractions were separated from aqueous suspensions by the sed- imentation method (Stokes' law). The <2 ixm clay fraction was washed and concentrated by centrifuga- tion and then air dried at 40~ overnight to avoid pos- sible collapse of halloysite-10 A to halloysite-7 A. A chemical treatment (Jackson, 1975) was used to re- move a Si-A1 gel identified in the kaolinite samples.
Prior to particle-size analysis, Na hexametaphos- phate followed by ultrasonic treatment were used to obtain good particle dispersion.
The structural behaviour of kaolinite was tested us- ing organic molecule intercalation. Oriented kaolinite specimens were prepared on glass slides; afterwards organic molecules (dimethylsulfoxide and K acetate) were intercalated in a saturated environment at 60~ for 48 h. The hydrazine test was used to identify mix- tures of kaolinite and halloysite-7 A (Range et al., 1969).
Disc-shaped samples were obtained by pressing a mixture of 1 mg sample with 200 mg of KBr. The disc-shaped samples were heated at 150~ prior to FTIR analysis, in order to remove the hydration water.
The <2 Ixm clay-aggregate specimens were dis- persed using an ultrasonic bath and after a convenient dilution, one drop of the suspension was deposited on a copper microgrid, previously covered with a formvar film. Before HRTEM analysis, the <2 txm kaolinite suspensions were oriented in a plastic tray support, dried at 40~ and embedded in Spurr's resin. Ultrathin sections were cut with a diamond knife at 50 txm thick using a Reichert microtome.
Methods
Particle size. The particle-size distribution of the <2 txm clay-aggregate specimens was determined using a Se- digraph (Micromeritics 5100) in the range 10-0.2/zm. The pH was measured using a pH meter apparatus
(Corning 240, UK) calibrated with buffer solutions (pH 7 and 10 Merck, Germany).
X-ray diffraction. The specimens were prepared as randomly oriented clay-aggregate specimens for XRD analysis using a Rigaku Geigerttex D/max.-C series diffractometer equipped with CuKc~ radiation and a graphite monochromator. A step size of 0.02~ and 10 s counting time for randomly oriented aggregate specimens and 5 s for oriented clay-aggregate speci- mens were used. The d(hkl)-spacings and reflection in- tensifies were measured using a computer program (IBM PC--sof tware for DMAXB Controller).
Fourier transform infrared spectroscopy. The FTIR spectroscopy (transmittance mode) was performed us- ing a Mattson-7000 apparatus in the frequency range 4000-400 cm -1, equipped with a DTGS (deuterated triglycine sulfate) single plate detector.
Transmission electron microscopy. The microscopic ob- servations were performed using an Hitachi H9000-NA transmission electron microscope, working at 300 kV, equipped with a solid-state quantum detector (Kevex, USA) for X-ray energy dispersive spectroscopy (EDS). Selected area electron diffraction (SAED) was used to determine the crystalline or amorphous char- acter of the minerals, using apertures of 5-50 Ixm to select 0.1-1.5 ~m areas. A gold standard was used for SAED pattern calibration. The HRTEM was per- formed using a Philips CM12 electron microscope (at "Louis Pasteur" University of Strasbourg, France).
Analytical electron microscopy. This method was used for chemical analysis of kaolinite crystals. The chem- ical data reported are the average of n analyses per- formed on the same types of crystal. A conventional k factor was used according to various chemical com- positions determined previously (Ma et al., 1998).
The 27Al-magic angle spinning neutron magnetic res- onance. The 27A1-MAS-NMR spectra were recorded at 104.3 MHz on a (9.4 T) Bruker MSL 400P spectrom- eter using short, powerful radio-frequency pulses (0.6 Ixs equivalent to 10 ~ pulse angle), a spinning rate of 14 kHz and a recycle delay of l s. To remove the strong tH- 27A1 dipolar interaction, high-power (B 1 field ampli- tude --70 kHz) ~H decoupling was used. Chemical shifts are quoted in ppm from [Al(H20)6] 3+.
RESULTS
X-ray diffraction
Randomly oriented clay-aggregate analyses. Three se- lected kaolinite samples analyzed using XRD (Fig- ure 2) show the structural transition from well-ordered kaolinite (HI = 1.07) to halloysite-7 A, via poorly- ordered kaolinite HI = 0.56). Structurally well-ordered kaolinite (SVP 7) is characterized by well-resolved 02,1i and 13,13 reflections (Figure 2a). The 02,11 re-

Vol. 49, No. 6, 2001 Kaolinite to halloysite-7 ,~ transformation 599
c / /
/ r r
\
Figure 2.
uluu iiii
. . . . . . . . . . . . . . . . . . . . . . . . . . . . . . . . . i . . . . . . . . . . . . . . . . . . . . . . . . . . . . . . . . . . . . . . . . . . . . . . . . . .
001 020 ~ 1 ~ / 002
l i 0 i 13i 003 ..1 , _. _ I'~ 111 /n/ 130 , - - / 1 3 !
: SVP 44
~ " ~ ; ~ ~ -~ ~ i I i .............. l ................ r f
20 30 40 50 o2e Cu K~
XRD patterns of well-ordered kaolinite (a), poorly-ordered kaolinite (b) and halloysite-7 A (c).
10
flections show changes both in intensity and resolution during transition. The intensity of the 110 and 11i reflections corresponding to well-ordered kaolinite, were compared with the intensity of the 020 reflection, the latter being progressively shorter than the former. In comparative terms, the 020 reflection increases in intensity during transition, whereas both l i 0 and 115 reflections decrease in intensity, changing to weakly modulated reflections (Figure 2b, c).
Changes both in intensity and resolution of the 13,13 reflections in the range 36-42~ took place dur- ing the kaolinite to halloysite-7 A transition. The X-ray pattern of well-ordered kaolinite shows two clearly resolved reflection triplets in the range 36- 42~ Both the 130 and 135 reflections are well-re- solved either in well-ordered kaolinite or poorly-or- dered kaolinite, indicating its triclinic character (Plan- ~on and Tchoubal; 1977). Whenever kaolinite struc- tural order decreases, the intensity of the 130 reflection increases. Within the range 39-42~ the triplet 003, 131 and 131 reflections observed in well-ordered ka- olinite (Figure 2a) transforms into a doublet in poorly- ordered kaolinite and halloysite-7 A (Figure 2b). The intensity of the 003 reflection transforms into a shoul- der at the 131 reflection,
The intensities of both the 001 and 002 reflections decrease as the order decreases. Also, the shape of the
001 reflection became more asymmetric as the disor- der decreased.
Dimethylsulfoxide, K acetate and hydrazine interca- lation. Dimethylsulfoxide (DMSO) was intercalated in the kaolinite structure and then the complex was XRD analysed. After intercalation, the 7.2 A peak shifted to 11.2 A. A residual 7.2 A peak remained visible, be- cause DMSO did not completely intercalate in the ka- olinite structure. The 7 A residual peak was almost absent in poorly-ordered kaolinite.
X-ray patterns of K acetate intercalated in well-or- dered kaolinite and poorly-ordered kaolinite showed a very sharp peak at 14.10 A. Also, a residual peak at 7.2 A occurred. After 15 washing cycles, K acetate had been partially removed and the two peaks were still present at 7.9 A and 7.2 A. The intensity of the 7.2 ,~ peak increased after the organic molecules were removed.
After hydrazine intercalation, the 7 A peak expand- ed to 10 A and became broader. Nevertheless, the 7 residual peak appeared in both well-ordered kaolinite and poorly-ordered kaolinite. The 10 A peak collapsed at 7.2 A after hydrazine was removed and an inter- mediate reflection at 8.42 A appeared. After 10 wash- ing cycles the 8.42 A peak collapsed at 8.20 ,~. After 35 cycles the intermediate reflection disappeared corn-

600 Bobos, Duplay, Rocha and Gomes Clays and Clay Minerals
0 e" t~
E ffl e-
I ,-
: J i ......................................... .......... ~1
'~~! 1 d30 ~ . !:. i
N
i . / ............. " H L Y 8 F i g . 3 c ~ !~,~ i ~ ~~
! ' " i:i~ i 754 i i
: ;
:i!! :~ Fig. 3a Fig. 3b
. . . . . , I I I I m,, ~ I I I r r r I I I I I I
! t/i: '!i 539 47, c
I I I
4000 3400 2800 2200 1600 1000 400
Wavelength (cm -1) Figure 3. FTIR spectra of well-ordered kaolinite, poorly-ordered kaolinite and halloysite-7 A. (a) Selected OH -stretching bands in the range 3700 3500 cm L (b) Selected Si-O-stretching bands in the range 1200-950 cm L (C) Selected H-O-H bands at 1630 cm L
pletely. The intensity o f the 7.2 A peak increased after each washing cycle. The posit ion of the intermediate reflection depends on the degree of organic molecule intercalation. The mixture of kaolinite and halloysite- 7 A was only identified in the Hly-8 sample, where the 10 A peak remained after hydrazine removal . In quantitative terms, the kaolinite:halloysite ratio was est imated as 1:6.
F o u r i e r t rans form in f rared spec t roscopy
The OH-stretching region of wel l -ordered kaolinite is character ized by four bands essentially unchanged at 3694, 3668, 3526 and 3620 c m -1, whereas poorly- ordered kaolinite displays only three bands (Figure 3a). The FTIR spectrum of halloysite-7 * is characterized by two OH-stretching bands at 3696 and 3620 cm -1 of lower intensity and broader; two small inflexions occur be tween them (Figure 3a).
The S i - O stretching region comprises three absorp- tion bands at 1114, 1030 and 1008 cm ~ either in well- ordered or poorly-ordered kaolinite (Figure 3b). In sample Hly-8 the S i - O stretching exhibits a broader range. The doublet f rom 1030 and 1008 cm -t disap- pears and becomes broader. However , a small peak at 1114 cm -a may be seen (Figure 3b).
The A1-OH bond at 939 cm -1 assigned to the inner O H - surface, occurs as a small inflexion to the OH - bending vibrations of inner hydroxyl groups at 913 cm apparently sharp during transition, but is broader in sample Hly-8.
The stretching band S i - O at 696 cm -1 is sharp in the first two samples, whereas sample Hly-8 has lower intensity and is broader. The bands at 539 and 470 cm I assigned to the A 1 - O - S i and S i - O - S i bending vibrations are sharp in wel l -ordered kaolinite, whereas in the halloysite-7 A sample they are broader.
The intensity of the H - O - H deformation band at 1635 cm a increases as the structural order decreases and as the interlayer water content increases, the in- tensity of the same band increases and broadens (Fig- ure 3c).
Par t i c l e - s i ze d i s t r ibu t ion
An analysis o f the part icle-size distribution was per- formed for aggregates and particles of kaolinite (Fig- ure 4). The < 1 0 txm clay aggregate fraction of well- ordered kaolinite (SVP-7) is concentrated in the range 2 -0 .6 Ixm, whereas the same fraction of poorly-or- dered kaolinite (SVP 44) occurs in the range 2-1 txm.

Vol. 49, No. 6, 2001 Kaolinite to halloysite-7 A transformation 601
35
3O
20 . :
15 $
5
Figure 4.
Hly~8/~ VP-44
0 2 4 6 8 10
Equivalent spherical diameter (~tm)
Particle-size distribution of kaolinite samples (SVP-7, SVP-44 and Hly-8).
The particle-size distribution of the Hly-8 sample has the equivalent spherical diameter in the range 1-0.8 txm.
Transmission electron microscopy
Several morphological features were observed: ag- gregates of kaol ini te booklets , pseudohexagonal plates, thin irregular plates exhibiting both rolling-up on their surfaces and short tubular forms at their edges, partially rolled fragmented plates and well-defined long tubes.
Well-ordered kaolinite (SVP-7) contains aggregates of booklets. Kaolinite plates grew syntaxially and dis- play aggregates of individual particles oriented along the e* direction (Bobos and Gomes, 1998). Poorly- ordered kaolinite exhibits individual pseudohexagonal kaolinite plates (Figure 5a). Two morphologies were recognized corresponding to sample Hly-8 (Figure
5b): long tubes elongated along the a* direction and short tubes elongated along the b* direction. Very thin pseudohexagonal plates of kaolinite showing rolling- up are identified in sample Hly-8 (Figure 6). Rolling- up preferentially follows one crystallographic direc- tion. The SAED performed on kaolinite plates yields a hexagonal 'single spot' , exhibiting a hk0 pattern (Figure 6). Transformation of kaolinite into halloysite- 7 A is suggested by rolling-up of kaolinite platy crys- tals into tubes.
The lath shape apparently interpretable as hal loy- site-7 A aggregates corresponds to kaolinite (Figure 7a). The SAED carried out on single crystal gives an hex- agonal reflection spot similar to that obtained for ka- olinite (Figure 7b). The lath-shaped kaolinite crystals are folded or rolled. Halloysite exhibits an intermedi- ate spherical shape formed from lath kaolinite rolled
Figure 5. TEM images showing: (a) pseudohexagonal plates of poorly-ordered kaolinite; (b) long and short tubes of halloy- site-7 A and lath-shaped kaolinite plates rolled.

602 Bobos, Duplay, Rocha and Gomes Clays and Clay Minerals
Figure 6. TEM image showing kaolinite plates rolling-up along the h* direction. SAED shows the hk0 pattern of the kaolinite structure.
(Figure 7c). The diameter estimated for a tube of hal- loysite is - 1 4 nm (Figure 7d). These results constitute the unique relationship between the two minerals.
A representative HRTEM image of well-ordered ka- olinite (SVP-7) exhibits the 7 A basal lattice fringes with a two-layer periodicity (Figure 8). Two sections were chosen: (1) the first section (a) shows the basal lattice fringes of 7 A coherent layers; (2) the second section (b) reveals some defects (indicated by arrows), exhibiting deformation and terminated layers. Non- basal 021 fringes are crossing the basal 001 lattice fringes.
Analytical electron microscopy
Crystals of well-ordered kaolinite, poorly-ordered kaolinite and halloysite-7 A were analyzed by AEM (Table 1). Structural Fe was not detected. The Si/A1 ratio calculated on sets of well-ordered kaolinite to poorly-ordered kaolinite and rolled kaolinite plates (Figure 6) or folded lath kaolinite (Figure 7a) show values of -- 1. Nevertheless, long tubes of halloysite-7 * show a slightly smaller Si content and greater A1 con- tent.
2ZAl-magic angle spinning neutron magnetic resonance
The 27A1 MAS-NMR spectra of the samples studied (Figure 9) display the second-order quadropole pow- der pattern centered at --1 ppm, assigned to six-coor- dinated aluminum (Rocha and Klinowski, 1990; Rocha and Pedrosa de Jesus, 1994). The full-width-at half- maximum (FWHM) of this line increases from 9.4 ppm for well-ordered kaolinite to 10.00 ppm for halloysite,
whereas for poorly-ordered kaolinite it is 10.8 ppm. The increasing FWHM of this resonance is due to a larger distribution of quadropole coupling parameters and isotropic chemical shifts brought by structural disorder that arises primarily as the result of Al-vacancy dis- placements in the octahedral sheet (Newman et aL, 1994). In addition to the six-coordinated aluminum peak, the spectrum of poorly-ordered kaolinite dis- plays a resonance at --70 ppm attributed to four-co- ordinated aluminum. This resonance accounts for --9% of the total spectral intensity in the range 100- 50 ppm. Well-ordered kaolinite also gives a very faint (intensity 1% or less) peak at - 7 0 ppm.
DISCUSSION
The powder XRD patterns show structural charac- teristics interpreted as variable order-disorder of kao- linite. The structural data observed serve as a basis for inferring the transition and transformation of kaolinite into halloysite-7 A. The relationship between kaolinite and halloysite-7 A should include trends of interme- diate stages between the two separate mineral species (Churchman and Gilkes, 1989). The kaolinite to hal- loysite-7 A transition is expressed by (1) decrease of the structural order, and (2) increase of the structural water content.
The organic molecules did not completely interca- late in the kaolinite samples studied. Reports of partial intercalation of organic molecules are known from the literature (MacEwan and Wilson, 1980). Random in- terstratification of 10 A and 7.2 A kaolinites during organic molecule intercalation was observed and dis- cussed.

Vol. 49, No. 6, 2001 Kaolinite to halloysite-7 A transformation 603
Figure 7. (a) Aggregates of folded lath-shaped kaolinite. (b) SAED pattern confirms the structure of kaolinite. (c) TEM image exhibiting rolled-up lath-shaped kaolinite. (d) HRTEM image of a section of a tube of halloysite-7 A.
Figure 8. HRTEM image of well-ordered kaolinite. Some coherent 7 A layers are observed in sector a and some defect layers (arrows) in sector b.

604 Bobos, Duplay, Rocha and Comes Clays and Clay Minerals
Table 1. Chemistry of individual crystals of kaolinite and halloysite-7 ~,. Samples SiO 2 A120~ SIO2/A1203 Si AI Si/AI ~ Morphology
n 6 n = 6 SVP-7 53.76 46.24 1.16 1.99 2.01 0.99 0.1 pseudo-hexagonal crystal SVP-7 53.91 46.08 1.17 1.99 2.01 0.99 0.1 pseudo-hexagonal crystal SVP-44 53.61 46.39 1.15 1.98 2.02 0.98 0.1 pseudo-hexagonal crystal Hly-8 53.71 46.29 " 1.16 1.99 2.01 0.99 0.1 kaolinite plates rolled Hly-8 53.63 46.37 1.16 1.98 2.02 0.98 0.1 lath kaolinite Hly-8 53.11 46.89 1.13 1.96 2.04 0.96 0.1 long tubes of halloysite
n = number of analysis; 8 = standard deviation.
Particle-size distribution decreases along transition. This is due to exfoliation of booklets of kaolinite plates caused by hydration of kaolinite. The well-or- dered kaolinite (SVP 7) displays a bi-modal distribu- tion, whereas poorly-ordered kaolinite (SVP 44) ex- hibits a log-normal distribution. The halloysite-7 sample (Hly-8) has a smaller and narrower average particle-size distribution than the other two samples. The particle shape is reflected in their size-distribution curves.
Hydration is a chemical process related to weath- ering. Kaolinite hydration involves adsorption of water molecules on external and internal surfaces of particles and may form interlayer hydration complexes. As the degree of hydration increases, the disorder in the ka-
2'0 1'0 6 - i 0 - 2 0 p p m
Figure 9. The 27A1 MAS-NMR spectra of (a) well-ordered kaolinite, (b) poorly-ordered kaolinite, and (c) halloysite-7 A.
olinite structure increases (Wada, 1961; Costanzo et
al., 1984). The FTIR spectra show that hydration in- creases during the kaolinite to halloysite-7 ,~ transi- tion, whereas XRD patterns show an increase of dis- order in kaolinite.
Individual pseudohexagonal plates of kaolinite were found in poorly-ordered kaolinite (SVP-44), whereas in well-ordered kaolinite, aggregates of kaolinite book- lets occur. The Hly-8 sample is of lath-shaped kaolin- ite and halloysite-7 A crystals formed from kaolinite or Si-A1 gel. Long tubes of halloysite-7 ,~ are genet- ically related to a Si-A1 gel which resulted from K- feldspar dissolution (Bobos and Comes, 2000), where- as the short tubes were formed by folding/rolling of kaolinite plates. The XRD pattern of the Hly-8 sample displays a poorly-ordered kaolinite structure. A hydra- zine test confirmed a mixture of kaolinite and halloy- site-7 A. Otherwise, the TEM image exhibits short and long tubes of halloysite-7 A, curved/folded lath- shaped kaolinite plates and rolled kaolinite plates (Fig- ure 6b). Short tubes elongated along the b* direction correspond to folded lath-shaped kaolinite. Rolled/ folded fractured plates of kaolinite yielded an XRD pattern similar to that for a poorly-ordered kaolinite structure. The SAED pattern obtained on apparent hal- loysite tubes (Figure 7) confirm a pattern typical of kaolinite.
Honjo et al. (1954) and Kohyama et al. (1978) in- vestigated halloysite crystals by SAED, identifying a structure based on two-layer periodicity, named "tu- bular kaolinite". Using electron diffraction, Zvyagin (1967) showed that dehydrated halloysite exhibits a higher degree of structural order than was previously inferred from XRD. Otherwise, halloysite tubes dis- playing lath-like morphology were considered by Churchman and Gilkes (1989) as kaolinite formed by prolonged dehydration of tubular halloysite, where de- hydration of the hydrated 1:1 structure was explained by H bonding which became the dominant force fa- voring tetrahedral sheet rotation (Bailey, 1988).
The repulsive forces are usually due to the interac- tion between electrical double layers or from interac- tion between layers. Such repulsion forces may have caused a true mechanical fragmentation of kaolinite plates, producing lath-shaped kaolinite. Otherwise, un-

Vol. 49, No. 6, 2001 Kaolinite to halloysite-7 A transformation 605
balanced forces (i .e. contraction of outer OH planes of the octahedral sheet or the unequal dimensions of the tetrahedral and octahedral sheets) may fracture the ka- olinite plates that subsequently will curve/fold along a preferred crystallographic direction (Robertson and Eggleton, 1991; Singh and Gilkes, 1992).
Rolled/folded kaolinite plates constitute a unique genetic link between kaolinite and halloysite-7 A, which confirms the transformation of kaolinite to hal- loysite-7 A. A parallel orientation of the rolled/folded plates of kaolinite to a major crystallographic face is shown by TEM. This is in accord with Singh and Mackinnon (1996), who showed that the major crys- tallographic directions controlled the rolling-up of ka- olinite plates.
Some defect layers represented by either deforma- tions or layer terminations were identified locally by HRTEM in well-ordered kaolinite displaying a good crystallinity (HI = 1.07). It is assumed to be typical of kaolinite crystals, which supported a rapid growth. The geological environment associated with the shear zones facilitated a great discharge of metamorphic wa- ters, generating large ion concentrations of solution and a rapid growth of kaolinite crystallite (Sunagawa, 1975).
The AEM data show no variation in the Si/A1 ratio, of - 1 for both well-ordered kaolinite or rolled kaolin- ite plates. However, the ideal ratio of kaolinite is = 1. During the passage from kaolinite to rolled kaolinite plates or folded lath-shaped kaolinite there is no clear evidence to support the hypothesis that the tetrahedral substitution took place along the transformation of ka- olinite to halloysite-7 A.
The FTIR spectra show changes in the resolution of the absorption bands corresponding to the S i -O-Si (in- cluding Si-O-A1) stretching region in the range 1100- 950 cm -1. The Si-O stretching bands show changes along the kaolinite to hallosyite-7 A transition. Also, changes of vibrational bands were recorded in the FTIR spectrum of sample Hly-8 as a consequence of a reduced symmetry in kaolinite.
The 27A1-MAS-NMR confirms a disorder in kaolin- ite structure arising as a result of Al-vacancy displace- ments in the octahedral sheet (Newman e t al . , 1994). The three spectra of kaolinite samples have a similar shape and no major differences between the kaolinite spectrum and the halloysite spectrum could be detect- ed.
The surface charge and electrophoretic properties of the kaolinite samples studied were discussed previous- ly (Tari e t al . , 1999). The cation exchange capacity increases slightly during the kaolinite to halloysite-7 A transition, whereas the BET specific surface area re- tains almost the same value. Tari e t al. (1999) com- bined the deprotonation effects of both siloxane and gibbsite sheets, reporting the effect of isomorphic sub- stitution on the electrophoretic behaviour of the kao-
linite to halloysite-7 A transition. Some permanent negatively charged surface sites such as (A1-O-Si) on the siloxane sheet will be induced by A13+ for Si 4+ substitution and promote electrostatic attraction of cat- ions in order to ensure the electroneutrality of the sys- tem. According to Tari et al. (1999) the modification of charge density during the kaolinite to halloysite-7 ,~ transition was believed to be due to AP+-for-Si 4+ isomorphous substitution. The same observation was made by other authors (McBride, 1976; Rand and Melton, 1976). Nevertheless, heterogeneous surface charge of kaolinite is well recognized. For instance, Grim (1967) shows that the surface negative charge of kaolinite is derived from broken bonds around the edg- es and from exposed basal hydroxyls. The pH values at ~ potential curve range from 3.5 to 5 for the three samples of kaolinite studied (Tari e t al. , 1999), which is lower than is expected for a 1:1 structure. This shows that the basal hydroxyl surfaces behave as edg- es and are important charge surfaces (Ma and Eggle- ton, 1999).
Two mechanisms are suggested in literature: tetra- hedral rotation for correction of the lateral misfit (Bai- ley, 1990) and reduction of interlayer cohesion due to Si-Si repulsion for correction of the same lateral misfit (Singh, 1996).
Bailey (1990) reinterpreted the Bates e t al. (1950) model, assuming that in kaolinite there is tetrahedral rotation of the basal oxygens, whereas in halloysite the tetrahedral rotation is blocked by interlayer water ad- sorbed into holes between oxygen tetrahedra. Interlay- er water may not have a real effect on tetrahedral ro- tation, but only to disrupt hydrogen bonding across the interlayer (Costanzo and Giese, 1985). Singh (1996) put forward a new model for halloysite rolling by which the misfit of the tetrahedral sheet is corrected by rolling instead of tetrahedral rotation in the hydrat- ed 1:1 layers. The misfit is transmitted through Si-O bonds to Si planes and basal oxygen planes, being af- fected as a consequence of contraction of the apical oxygen plane. To correct the misfit between apical ox- ygen planes and the inner OH plane, either tetrahedral rotation or rolling of the 1:1 layer must have taken place. The most convenient way, shown by Singh (1996), is by rolling, which causes a minimum con- traction of the Si and basal oxygen planes.
The big question derived from previous studies (Singh and Mackinnon 1996) is what causes hydra- tion? The hydration of kaolinite surfaces can lead to the formation of different surface species such as A1- OH A1 groups at the gibbsite sheet, =A1OH and/or --SiOH groups at the edge surfaces and S i -O-Si groups at the siloxane sheet (Stumm, 1992). Changes on the edges and the exposed hydroxyl surfaces de- pend upon pH. Negative charges are developed at the edges according to the reaction: Si-OH + OH- = Si- O- + H20, when [OH ] concentrations increase (Ma

606 Bobos, Duplay, Rocha and Gomes Clays and Clay Minerals
Solution
Stable mineral surface
Basal-O plane
( ~ Apical-O ~ ( ~ )
~ i _ A1 ~Z
H
0 / H
Diffusion
pit dependent
Reaction control
OH
Figure 10. Schematic drawing of the siloxane sheet reacting with water. The reaction is through diffusion at the surface layer with solution.
and Eggleton, 1999). The same reaction may be ap- plied to A1-OH at edges of an exposed basal surface. Otherwise, the AP + ion has a small ionic radius and a high electric charge, exercising a high polarization ef- fect on water molecules.
Previous studies have considered that the transfor- mation of kaolinite to halloysite-7 A takes place in the solid state (Robertson and Eggleton, 1991; Singh and Gilkes, 1992). However , the solid-state transformation calls for ionic substitution of A13+ for Si 4+ within an intact silicate sheet and a planar kaolinite layer cannot roll after crystall ization (Singh and Mackinnon, 1996). Therefore, it is l ikely that hydration of kaolinite pro- duces a reaction at the mineral surface (Figure 10), which is rate controlled by the concentrat ions o f the solutes. This reaction control is typically a detachment (desorption) or at tachment (adsorption) of species (i.e.
H20 molecules) on the mineral surface. Exposure of the oxide surfaces to water causes the format ion of surface OH groups ( S - O H ) that can be ionized. The pH of the medium influences the degree of ionization. At the particle/solution interface, the acid/base reac- tions occur resulting in surface charge development :
H + OH S - O H 2 + ( - - - - - S - O H > S - O
As the pH increases, deprotonation of the silica is con- tinued, being more accentuated up to pH ~ 6 and more gradual afterwards (Tari et al., 1999). Therefore, the rate-determining step may be the diffusion through a solid layer at the si loxane sheet. This reaction type may contribute to the hydration of the kaolinite struc- ture and subsequently the mechan ism described by Singh (1996) should be a pathway of the kaolinite to halloysite-7 A transformation.
C O N C L U S I O N S
The kaolinite samples selected f rom the same geo- logical profile confirm the kaolinite to halloysite-7 transformation. The Hly-8 sample consists of a mix- ture of rolled kaolinite plates, and small and long tubes
of halloysite-7 ]~. The main conclusions are: ( l ) The kaolinite to halloysite-7 A transition is accompanied by structural changes observed in both 02 ,1 i and 15,13 reflections. (2) The F T I R spectra confirm struc- tural changes during transition in the S i - O stretching band and A 1 - O - S i bending vibrations. The kaolinite hydration increases during kaolinite to hal loysi te-7A transition. (3) The T E M data exhibit either thin kao- linite plates rol led/folded along a major crystallo- graphic direction or folding of lath-shaped kaolinite. This is the unique genetic relationship be tween the two minerals. Well-ordered kaolinite contains some defect layers such as deformation or terminations, observed by H R T E M . (4) No tetrahedral substitution occurs dur- ing transition; (5) The surface OH group formation was ionized as a result of exposure of the oxide sur- face to water. The S i - O bonds are directed towards the contact points instead of lying normal to the basal plane and one of the basal oxygen atoms in each tet- rahedron was raised above the other two and the si- loxane surface becomes corrugated. The kaolinite structure in the near-surface water contact is modif ied towards a new structurally stable phase. The rate o f reaction is a function of pH.
A C K N O W L E D G M E N T S
I. Bobos gratefully acknowledges the Portuguese Founda- tion for Science and Technology for financial support (Praxis XXI BCC-4815), granted under his appointment as Invited Scientist. We are indebted to Associate Editor J. Elzea Kogel, to E Elasass and to E. Galen for their constructive reviews and helpful comments. Thanks are due to A. Andrade and A.L. Lopes for their help with the XRD and TEM analyses.
R E F E R E N C E S
Anand, R.R., Gilkes, R.J., Armitage, T.M. and Hillyer, J.W. (1985) Feldspar weathering in a lateritic saprolite. Clays and Clay Minerals, 33, 31 43.
Bailey, S.W. (1988) Polytypism of 1:1 layer silicates. Pp. 9 - 27 in: Hydrous Phyllosilicates (exclusive of Micas) (S.W. Bailey, editor). Reviews in MineraIogy, 19. Mineralogical Society of America, Washington, D.C.
Bailey, S.W. (1990) Halloysite--a critical assessment. Pp. 89-98 in: Proceedings o f 9 ~h International Clay Confer- ence, Strasbourg (V.C. Farmer and Y. Tardy, editors). Sci- ences G6ologiques M6moire, Strasbourg, France, 85.
Banfield, J.E and Eggleton, R.A. (1990) Analytical transmis- sion electron microscope studies of plagioclase, muscovite and K-feldspar weathering. Clays and Clay Minerals, 38, 77-89.
Bates, T.E, Hildebrand, EA. and Swineford, A. (1950) Mor- phology and structure of endellite and halloysite. American Mineralogist, 6, 237-248.
Bobos, I. and Gomes, C. (1998) Greisen and post-greisen alteration in the kaolin deposit of S~o Vicente de Pereira (Portugal). Canadian Mineralogist, 36, 1621-1630.
Bobos, I. and Gomes, C. (1999) Hydrothermal alteration and kaolinization in the north western border o f Ossa Morena zone. EUG 10, Abstract volume, 4. Cambridge Publica- tions, 592 pp.
Bobos, I. and Gomes, C. (2000) Dissolution of K-feldspar into Si-AI gel and crystallization of halloysite identified in

Vol. 49, No. 6, 2001 Kaolinite to halloysite-7 A transformation 607
the kaolin deposit of S~o Vicente de Pereira (Portugal). Geologica Carpathica, 51, 49-57.
Chamin6, H.I., Ribeiro, A. and Pereira, E. (1995) Cartogratia geol6gica e estratigrafia da faixa precfimbrica do sector Es- pirtho--Albergaria-A-Velha (Zona de Ossa-Morena). Fa- culdade de CiOncias, Universidade do Porto. Memdria, 4, 329-333.
Churchman, G.J. and Gilkes, R.J. (1989) Recognition of in- termediates in the possible transformation of halloysite to kaolinite in weathering profiles. Clay Minerals, 24, 579 590.
Costanzo, RM. and Giese, R.E Jr. (1985) Dehydration of syn- thetic hydrated~ kaolinite: a model for the dehydration of halloysite (10 A). Clays and Clay Minerals, 33, 415-423.
Costanzo, RM., Giese, R.E Jr. and Clemency, C.V. (1984) Synthesis of a 10 A hydrated kaolinite. Clays and Clay Minerals, 32, 29-35.
Eswaran, H. and Bin, W.C. (1978) A study of deep weath- ering profile on granite in peninsular Malaysia: Mineralogy of the clay, silt and sand fractions. Soil Science Society of America Journal, 42, 149-158.
Giese, R.E Jr. (1988) Kaolin minerals: structures and stability. Pp. 29-66 in: Itydrous Phyllosilicates (exclusive of Micas) (S.W. Bailey, editor). Reveiws in Mineralogy, 19. Miner- alogical Society of America, Washington, D.C.
Gilkes, R.J., Anand, R.R. and Suddhiprakarn, A. (1986) How the microfabric of soils may be influenced by the structure and chemical composition of parent minerals. Pp. 1093 1106 in: Trans International Soil Science Conference, Hamburg, 6.
Grim, R. (1967) Clay Mineralogy. McGraw Hill, New York, 596 pp.
Hinckley, D.N. (1963) Variability in "crystallinity" values among the kaolin deposits of the coastal plain of Georgia and South Carolina. Clays and Clay Minerals, 11, 229 235.
Honjo, G., Kitamura, N. and Mihama, K. (1954) A study of clay minerals by means of single-crystal electron diffrac- tion diagram -the structure of tubular kaolin. Clay Min- erals Bulletin, 2, 133-141.
Jackson, M.L. (1975) Soil Chemical Analyses--Advanced Course. Published by the author, Madison, Wisconsin, 895 pp.
Jiang, W.T. and Peacor, D.R. (1991) Transmission electron microscopic study of the kaolinisation of muscovite. Clays and Clay Minerals, 39, 1-13.
Keller, W.D. (1978) Classification of kaolins exemplified by their textures in scanning electron microscopy. Clays and Clay Minerals, 26, 1-20.
Kohymna, N., Fukushima, K. and Fukami, A. (1978) Obser- vation of the hydrated form of tubular halloysite by an electron microscope equipped with an environmental cell. Clays and Clay Minerals, 26, 25-40.
Ma, C. and Eggleton, R.A. (1999) Surface layer types of ka- olinite: A high resolution transmission electron microscopy study. Clays and Clay Minerals, 47, 181-191.
Ma, C., FitzGerald, J.D. Eggleton, R.A. and Llewellyn, D.J. (1998) Analytical electron microscopy in clays and other phyllosilicates: Loss of elements from a 90-nm stationary beam of 300 KeV electrons. Clays and Clay Minerals, 46, 301-317.
MacEwan, D.M.C. and Wilson, MJ. (1980) Interlayer and intercalation complexes of clay minerals. Pp. 197-249 in: Crystal Structures of Clay Minerals and Their X-ray iden- tification (G.W. Brindley and G. Brown, editors). Mono- graph 5. Mineralogical Society, London.
McBride, M.B. (1976) A critique of diffuse double layer models applied to colloid and surface chemistry. Clays and Clay Minerals', 24, 598-608.
Meunier, A. and Velde, B. (1979) Weathering mineral facies in altered granites: The importance of local smMl-scale equilibrium. Mineralogical Magazine, 43, 261-268.
Newman, R.H., Childs, C.W. and Churchman, G.J. (1994) Aluminium co-ordination and structural disorder in halloy- site and kaolinite by 27A1 NMR spectroscopy. Clay Min- erals, 29, 305-312.
Planqon, A. and Tchoubar, C. (1977) Determination of struc- tural defects in phyllosillicates by X-ray powder diffrac- tion. Clays and Clay Minerals', 25, 436-450.
Planqon, A. and Zacharie, C. (1990) An expert system for the structural characterization of kaolinites. Clay Minerals, 25, 249 260.
Planqon, A., Giese, R.E and Snyder, R. (1988) The Hinckley index for kaolinites. Clay Minerals, 23, 249-260.
Rand, B. and Melton, I.E. (1976) Particle interactions in aque- ous kaolinite suspensions, I. Effect of pH and electrolyte upon the mode of particle interaction in homoionic sodium kaolinite suspensions. Journal of Colloidal Interface Sci- ence, 60, 308-320.
Range, K.J., Range, A. and Weiss, A. (1969) Fire clay type kaolinite or fire clay minerals? Experimental classification of kaolinite-halloysite minerals. Pp. 3-13 in: Proceedings International Clay Conference Tokyo, Volume 1. (L. Heller and A. Weiss, editors). Israel University Press, Jerusalem.
Ribeiro, A., Pereira, E. and Severo, L. (1980) Anfilise da de- formaqfio da zona de cisalhamento Porto.Tomar na trans- versal de Oliveira de Azemdis. Comunicaf6o de Servicio Geologico de Portugal, 66, 3-9.
Robertson, I.D. and Eggleton, R.A. (1991) Weathering of gra- nitic muscovite to kaolinite and halloysite and plagioclase- derived kaolinite to halloysite. Clays and Clay Minerals, 39, 113 126.
Rocha, J. and Klinowski, J. (1990) 29Si and 27A1 magic-angle- spinning NMR studies of the thermal transformation of ka- olinite. Physics and Chemistry of Minerals, 17, 179-186.
Rocha, J. and Pedrosa de Jesus, J.D. (1994) 27A1 satellite tran- sition MAS NMR spectroscopy of kaolinite. Clay Minerals, 29, 287-291.
Singh, B. (1996) Why does halloysite ro l l?~A new model. Clays and Clay Minerals, 44, 191 197.
Singh, B. and Gilkes, R.J. (1992) An electron optical inves- tigation of the alteration of kaolinite to halloysite. Clays and Clay Minerals, 40, 212 229.
Singh, B. and Mackinnon, I. (1996) Experimental transfor- mation of kaolinite to halloysite. Clays and Clay Minerals', 44, 825-834.
Stoch, L. and Sikora, W. (1976) Transformation of micas in the process of kaolinization of granites and gneisses. Clays and Clay Minerals, 24, 156-162.
Stumm, W. (1992) Chemistry of the Solid-Water Interface. Wiley & Sons, New York, 346 pp.
Sunagawa, I. (1975) Morphology of minerals. Pp. 509-587 in: Morphology of Crystals (I. Sunagawa, editor). Terra Sci- ence Publishes Co., Tokyo.
Tari, G., Bobos, I., Gomes, C. and Ferreira, J.M. (1999) Mod- ification of charge density during the kaolinite to hallosyite- 7 A transformation. Journal of Colloid Interface Surface, 209, 360-366.
Wada, K. (1961) Lattice expansion of kaolin minerals by treatment with potassium acetate. American Mineralogist, 46, 78-91.
Wilke, B.S., Schwertmann, U. and Murad, E. (1978) An oc- currence of polymorphic halloysite in granite saprolite of the Bayerischer Wald, Germany. Clay Minerals, 13, 67-77.
Zvyagin, B.B. (1967) Electron Diffraction Analysis of Clay Minerals Structures. Plenum Press, New York, 364 pp.
E-mail of cot-responding author: [email protected] (Received 16 July 2000; revised 12 March 2001; Ms. 468;
A.E. Jessica Elzea Kogel)