katanga mining limited/media/files/k/katanga-mining-v2/investor... · management’s discussion and...
TRANSCRIPT
KATANGA MINING LIMITED
Management’s Discussion and Analysis March 31, 2010
MANAGEMENT’S DISCUSSION AND ANALYSIS OF FINANCIAL CONDITION AND RESULTS OF OPERATIONS
1
MANAGEMENT’S DISCUSSION AND ANALYSIS The following discussion and analysis is management’s assessment of the results of operations and financial condition of Katanga Mining Limited (“Katanga” or the “Company”) and should be read in conjunction with the unaudited interim consolidated financial statements of the Company for the three months ended March 31, 2010 and the notes thereto. The interim consolidated financial statements have been prepared in accordance with Canadian generally accepted accounting principles. All dollar amounts unless otherwise indicated are in United States dollars. This information has been prepared as of May 11, 2010. Katanga’s common shares, warrants and notes trade on the Toronto Stock Exchange (“TSX”) under the symbols “KAT” “KAT.WT” and “KAT.NT” respectively. Katanga’s most recent filings, including Katanga’s Annual Information Form, are available on the System for Electronic Document Analysis and Retrieval (“SEDAR”) and can be accessed through the internet at www.sedar.com. 1. Company Overview Katanga Mining Limited ("Katanga" or the "Company") is incorporated under the laws of Bermuda. Katanga, through Kamoto Copper Company SARL (“KCC”), is engaged in copper and cobalt mining and related activities in the Democratic Republic of Congo (“DRC”). KCC is engaged in the exploration, refurbishment and rehabilitation of the Kamoto/Mashamba East mining complex and the KOV copper and cobalt mine (the “Project”), in the DRC. The Kamoto Project includes exploration and mining properties, the Kamoto concentrator, the Luilu metallurgical plant, the Kamoto underground mine, the KOV pit and various oxide open pit resources in the Kolwezi district of the DRC. The KOV pit is not yet in commercial production although pre-stripping and de-watering activities have commenced. The Company has prepared an Accelerated Development Plan with an initial 150,000 tonnes per annum (“tpa”) production target by the second quarter of 2011. Thereafter, the Company aims to continue the ramp-up to a level in excess of 300,000 tpa, utilizing new SX/EW modules.

MANAGEMENT’S DISCUSSION AND ANALYSIS OF FINANCIAL CONDITION AND RESULTS OF OPERATIONS
2
2. Highlights and Outlook Highlights during and subsequent to the three months ended March 31, 2010 • Total sales for the first quarter of 2010, were $140.7 million, comprising $94.3 million
(12,915 tonnes) for copper cathode, $37.6 million for cobalt metal (900 tonnes) and $8.8 million for copper concentrate (1,381 tonnes of contained copper).
• For the first quarter of 2010, the Company had a gross profit of $39.1 million and net income
of $27.6 million • For the first quarter of 2010, the Company generated $72.3 million in positive cash flows
from operating activities and a net total cash increase of $49.6 million resulting in a closing cash balance of $126.7 million.
• C1 cash cost for the first quarter of 2010 were $1.34 per pound of copper (C1 cash costs per
pound of copper are cash costs including mining, processing, administration and refining, net of cobalt credits).
• Production data for the first quarter:
o Copper production was 12,458 tonnes which was a reduction on the previous quarter of 924 tonnes due to mining constraints in Kamoto underground mine which have now been resolved.
o Cobalt production was 889 tonnes with improved recovery rates for cobalt achieved throughout the plant.
• On March 31, 2010, the Company filed its updated Technical Report, which detailed the
accelerated increase in production capacity to 150,000 tonnes of copper and 8,000 tonnes of cobalt by end of the second quarter of 2011, and the proposed increase in production capacity to 310,000 tonnes per annum of copper and 30,000 tonnes of cobalt. The Technical Report stated the Company’s ability to fund this development through existing cash balances and cash generated from operations, based on current copper and cobalt prices.
• On April 27, 2010, the merger of Kamoto Copper Company SARL and DRC Copper and Cobalt Project was approved by Presidential decree.
Outlook
• As detailed in the updated Technical Report the Company continues to implement the Accelerated Development Plan to a production capacity of 150,000 tonnes per annum of copper and 8,000 tonnes per annum of cobalt by the second quarter of 2011, with a production capacity of 110,000 tonnes per annum of copper being achieved as planned in July 2010.
• The Company has commenced a Scoping and Engineering study which will be completed in
the fourth quarter of 2010. This study will review the process engineering completed for the planned new SX/EW plant with a view towards reducing capital expenditures and simplifying process design, as highlighted in the new Technical Report, to facilitate the integration with the current site infrastructure.
• Dewatering and pre-strip activities in KOV open pit are progressing as scheduled to allow for the production of ore in July 2010.

MANAGEMENT’S DISCUSSION AND ANALYSIS OF FINANCIAL CONDITION AND RESULTS OF OPERATIONS
3
3. Quarterly Results The following table sets out a summary of the quarterly results for the Company for the last eight quarters:
*Includes royalties and transportation costs and depreciation **Includes impact of provisionally priced sales which retain exposure to future changes in commodity prices being marked-to-market based on the London Metal Exchange (“LME”) forward rate for copper at the balance sheet date and repricing of those provisional sales in future periods ***Sales to June 1, 2008 (3,619 tonnes) were capitalized to mineral interest as they were prior to commencement of commercial production.
2008 2008 2008 2009 2009 2009 2009 2010Q2 Q3 Q4 Q1 Q2 Q3 Q4 Q1
Statement of Operations (USD millions except where indicated)Total revenues 48.8 57.6 13.3 47.0 62.3 76.2 100.0 140.7 Cost of sales* (38.5) (77.9) (89.1) (85.6) (77.5) (74.2) (83.2) (101.7)Total revenues less cost of sales 10.4 (20.2) (75.8) (38.6) (15.3) 2.1 16.8 39.1 General administrative and other expenses (20.3) (9.5) 15.6 (0.8) (19.6) (11.5) (8.6) (6.4)Restructuring expenses - (7.2) (101.7) (10.1) (15.9) 0.8 11.2 - Impairment of mineral properties and inventories - - (1,460.4) - - - - - Debenture interest (4.6) (4.6) (4.5) (3.7) (4.6) (4.4) (4.6) (4.8)Interest income 5.8 2.1 1.2 0.2 0.0 0.9 0.6 0.0 (Loss) income before income taxes (8.6) (39.4) (1,625.6) (53.0) (55.3) (12.2) 15.4 27.9 Basic (loss) income per common share (0.05) (0.19) (5.98) (0.26) (0.09) (0.01) 0.01 0.01
Realized copper price (per lb)** 3.71 2.38 0.23 1.63 2.07 2.75 3.27 3.31 Realized cobalt price (per lb)** 32.00 28.03 8.40 10.76 12.73 14.73 17.25 18.95 Realized concentrate price (per tonne)** 4,301 2,510 266 492 664 - - 2,660
Total copper sold (tonnes)*** 3,892 4,197 8,472 7,750 10,478 9,623 10,275 12,915 Total copper produced (tonnes) 5,314 6,812 6,090 8,715 9,516 10,351 13,382 12,458 Total cobalt sold (tonnes) 30 290 310 460 500 620 680 900 Total cobalt produced (tonnes) 120 356 273 487 595 628 824 889 Total concentrate sold (tonnes) 7,897 6,847 12,784 16,992 560 - - 3,304
Balance SheetCash and cash equivalents 330.1 155.8 31.8 31.8 149.8 152.8 77.2 126.7 Other current assets 123.5 147.1 88.6 103.5 139.8 158.1 190.4 161.5 Mineral interests and other assets 2,622.2 2,726.4 1,351.5 1,389.3 1,437.4 1,450.7 1,484.0 1,504.8 Total assets 3,075.9 3,029.4 1,471.9 1,524.6 1,727.1 1,761.6 1,751.7 1,793.0 Current liabilities 124.7 101.3 192.8 169.6 204.8 162.8 136.8 147.0 Long-term debt 271.8 272.6 258.4 356.2 101.2 108.6 112.9 116.9 Other long-term liabilities 568.3 580.2 168.4 192.5 231.3 228.8 224.9 224.5 Total liabilities 964.9 954.2 619.6 718.4 537.3 500.2 474.7 488.3 Shareholders' equity 2,111.0 2,075.2 852.4 806.2 1,189.8 1,261.4 1,277.0 1,304.6
Cash FlowOperating activities 4.0 (59.5) (0.5) (71.3) (39.5) (48.8) (19.9) 72.3 Investing activities (116.0) (107.8) (136.9) (28.9) (12.5) (22.8) (56.7) (22.7)Financing activities - - - 100.0 170.6 74.7 - -
MANAGEMENT’S DISCUSSION AND ANALYSIS OF FINANCIAL CONDITION AND RESULTS OF OPERATIONS
4
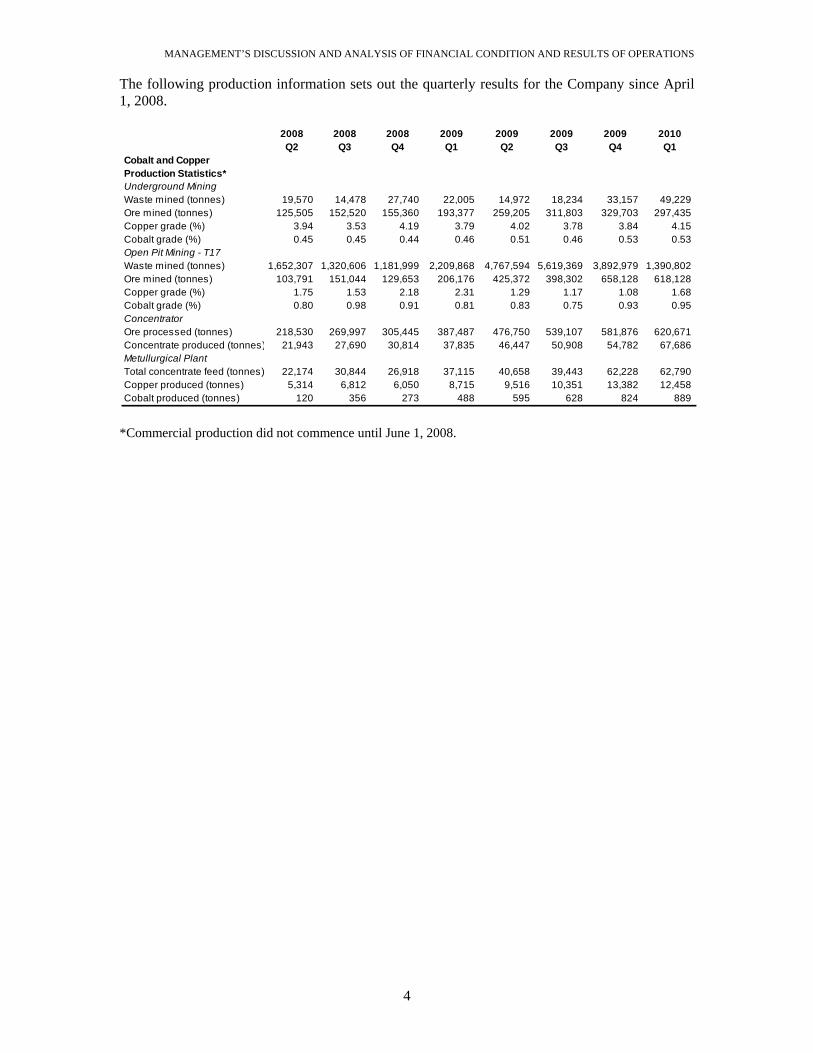
The following production information sets out the quarterly results for the Company since April 1, 2008.
*Commercial production did not commence until June 1, 2008.
2008 2008 2008 2009 2009 2009 2009 2010Q2 Q3 Q4 Q1 Q2 Q3 Q4 Q1
Cobalt and Copper Production Statistics*Underground Mining Waste mined (tonnes) 19,570 14,478 27,740 22,005 14,972 18,234 33,157 49,229 Ore mined (tonnes) 125,505 152,520 155,360 193,377 259,205 311,803 329,703 297,435 Copper grade (%) 3.94 3.53 4.19 3.79 4.02 3.78 3.84 4.15 Cobalt grade (%) 0.45 0.45 0.44 0.46 0.51 0.46 0.53 0.53 Open Pit Mining - T17Waste mined (tonnes) 1,652,307 1,320,606 1,181,999 2,209,868 4,767,594 5,619,369 3,892,979 1,390,802 Ore mined (tonnes) 103,791 151,044 129,653 206,176 425,372 398,302 658,128 618,128 Copper grade (%) 1.75 1.53 2.18 2.31 1.29 1.17 1.08 1.68 Cobalt grade (%) 0.80 0.98 0.91 0.81 0.83 0.75 0.93 0.95 ConcentratorOre processed (tonnes) 218,530 269,997 305,445 387,487 476,750 539,107 581,876 620,671 Concentrate produced (tonnes) 21,943 27,690 30,814 37,835 46,447 50,908 54,782 67,686 Metullurgical PlantTotal concentrate feed (tonnes) 22,174 30,844 26,918 37,115 40,658 39,443 62,228 62,790 Copper produced (tonnes) 5,314 6,812 6,050 8,715 9,516 10,351 13,382 12,458 Cobalt produced (tonnes) 120 356 273 488 595 628 824 889
MANAGEMENT’S DISCUSSION AND ANALYSIS OF FINANCIAL CONDITION AND RESULTS OF OPERATIONS
5
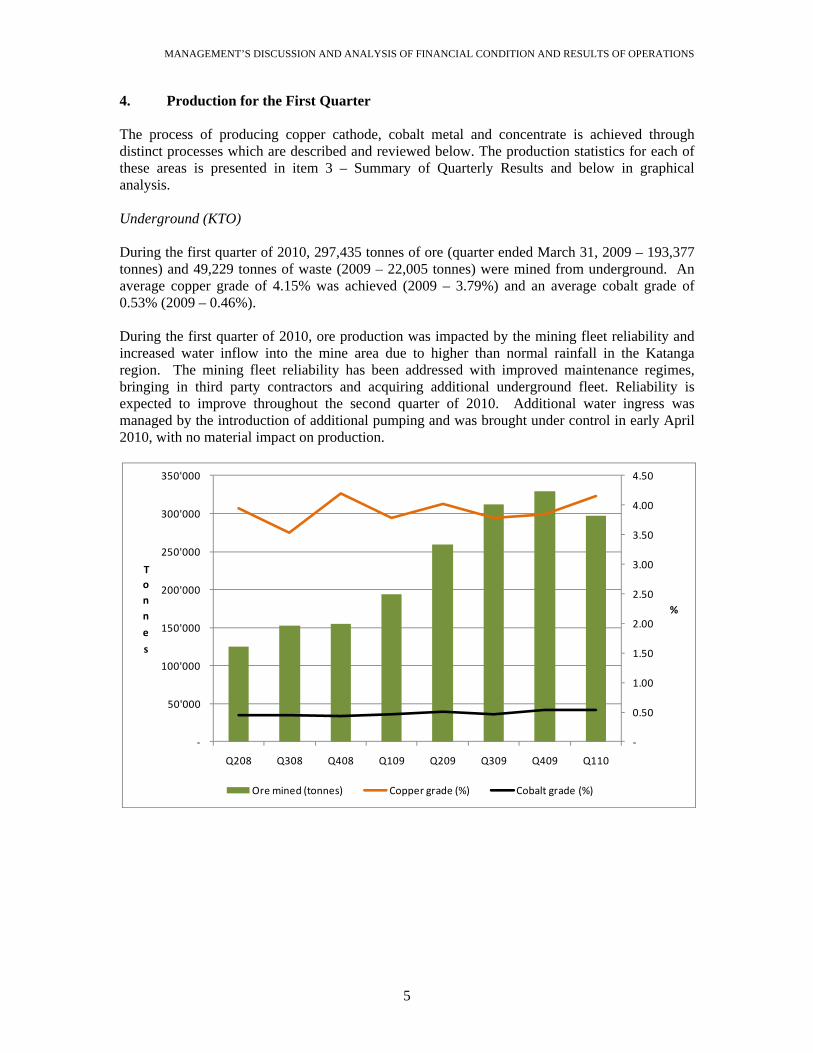
4. Production for the First Quarter The process of producing copper cathode, cobalt metal and concentrate is achieved through distinct processes which are described and reviewed below. The production statistics for each of these areas is presented in item 3 – Summary of Quarterly Results and below in graphical analysis. Underground (KTO) During the first quarter of 2010, 297,435 tonnes of ore (quarter ended March 31, 2009 – 193,377 tonnes) and 49,229 tonnes of waste (2009 – 22,005 tonnes) were mined from underground. An average copper grade of 4.15% was achieved (2009 – 3.79%) and an average cobalt grade of 0.53% (2009 – 0.46%). During the first quarter of 2010, ore production was impacted by the mining fleet reliability and increased water inflow into the mine area due to higher than normal rainfall in the Katanga region. The mining fleet reliability has been addressed with improved maintenance regimes, bringing in third party contractors and acquiring additional underground fleet. Reliability is expected to improve throughout the second quarter of 2010. Additional water ingress was managed by the introduction of additional pumping and was brought under control in early April 2010, with no material impact on production.
‐
0.50
1.00
1.50
2.00
2.50
3.00
3.50
4.00
4.50
‐
50'000
100'000
150'000
200'000
250'000
300'000
350'000
Q208 Q308 Q408 Q109 Q209 Q309 Q409 Q110
%
Tonn
e
s
Ore mined (tonnes) Copper grade (%) Cobalt grade (%)
MANAGEMENT’S DISCUSSION AND ANALYSIS OF FINANCIAL CONDITION AND RESULTS OF OPERATIONS
6
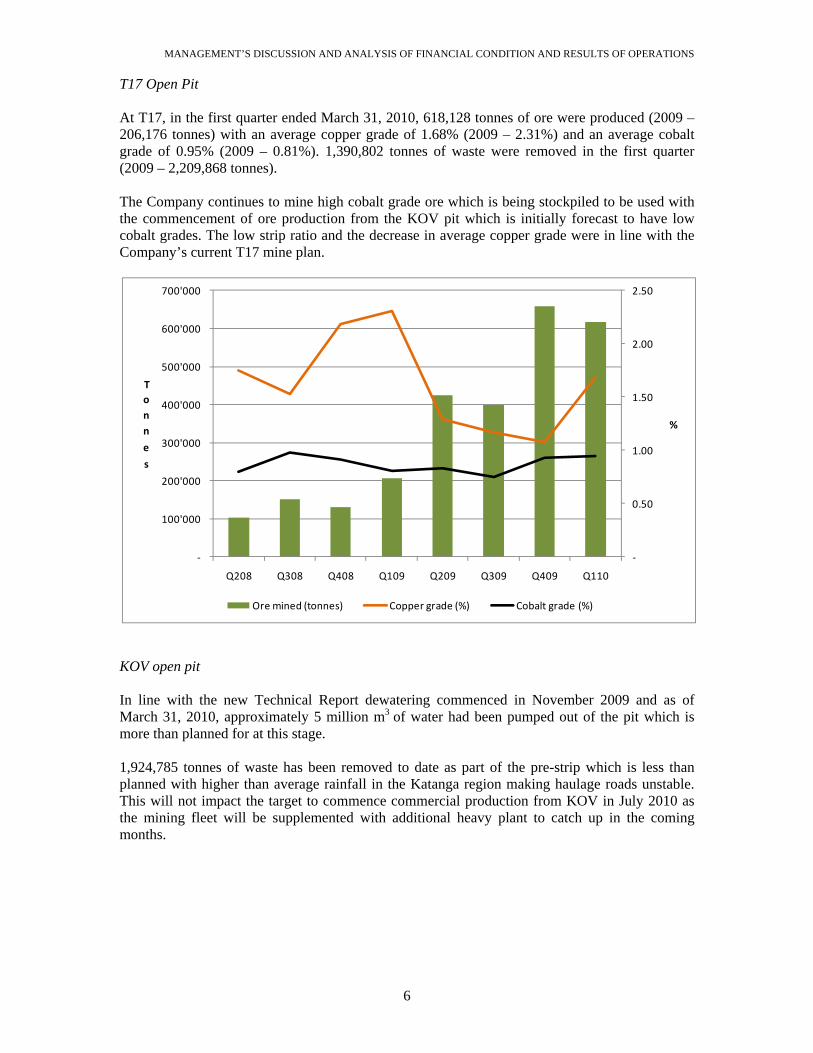
T17 Open Pit At T17, in the first quarter ended March 31, 2010, 618,128 tonnes of ore were produced (2009 – 206,176 tonnes) with an average copper grade of 1.68% (2009 – 2.31%) and an average cobalt grade of 0.95% (2009 – 0.81%). 1,390,802 tonnes of waste were removed in the first quarter (2009 – 2,209,868 tonnes). The Company continues to mine high cobalt grade ore which is being stockpiled to be used with the commencement of ore production from the KOV pit which is initially forecast to have low cobalt grades. The low strip ratio and the decrease in average copper grade were in line with the Company’s current T17 mine plan.
KOV open pit In line with the new Technical Report dewatering commenced in November 2009 and as of March 31, 2010, approximately 5 million m3 of water had been pumped out of the pit which is more than planned for at this stage. 1,924,785 tonnes of waste has been removed to date as part of the pre-strip which is less than planned with higher than average rainfall in the Katanga region making haulage roads unstable. This will not impact the target to commence commercial production from KOV in July 2010 as the mining fleet will be supplemented with additional heavy plant to catch up in the coming months.
‐
0.50
1.00
1.50
2.00
2.50
‐
100'000
200'000
300'000
400'000
500'000
600'000
700'000
Q208 Q308 Q408 Q109 Q209 Q309 Q409 Q110
%
Tonn
e
s
Ore mined (tonnes) Copper grade (%) Cobalt grade (%)
MANAGEMENT’S DISCUSSION AND ANALYSIS OF FINANCIAL CONDITION AND RESULTS OF OPERATIONS
7
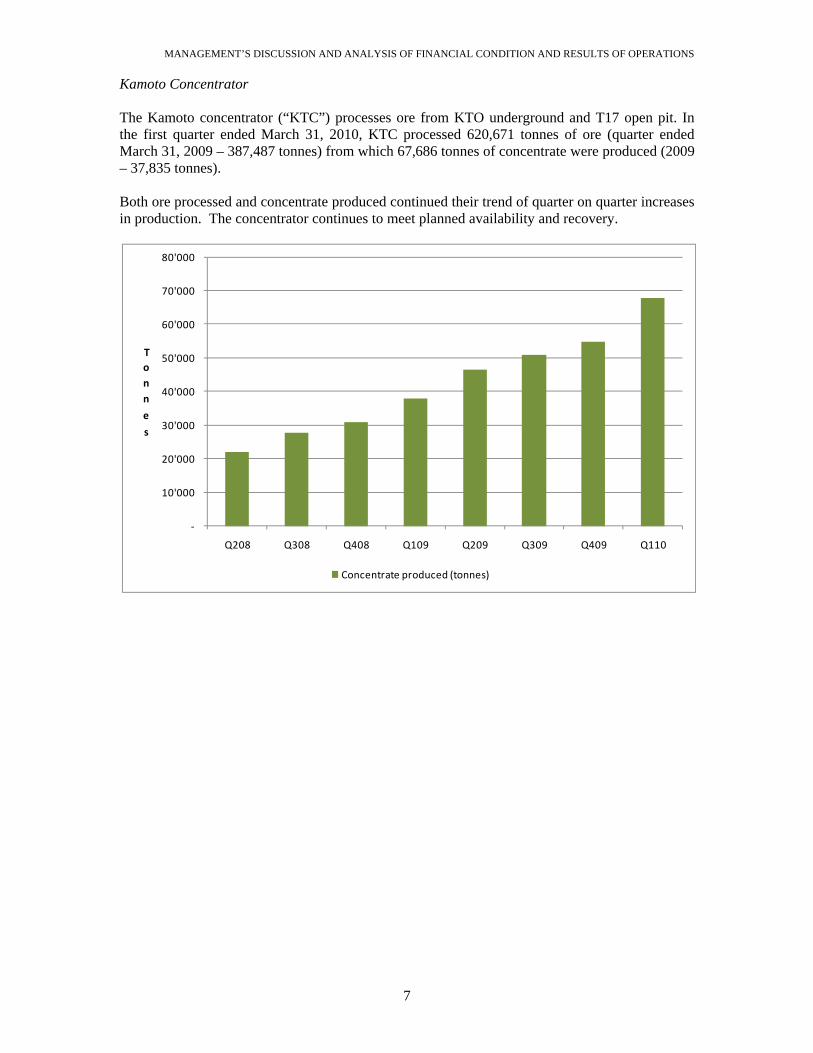
Kamoto Concentrator The Kamoto concentrator (“KTC”) processes ore from KTO underground and T17 open pit. In the first quarter ended March 31, 2010, KTC processed 620,671 tonnes of ore (quarter ended March 31, 2009 – 387,487 tonnes) from which 67,686 tonnes of concentrate were produced (2009 – 37,835 tonnes). Both ore processed and concentrate produced continued their trend of quarter on quarter increases in production. The concentrator continues to meet planned availability and recovery.
‐
10'000
20'000
30'000
40'000
50'000
60'000
70'000
80'000
Q208 Q308 Q408 Q109 Q209 Q309 Q409 Q110
Tonn
e
s
Concentrate produced (tonnes)
MANAGEMENT’S DISCUSSION AND ANALYSIS OF FINANCIAL CONDITION AND RESULTS OF OPERATIONS
8
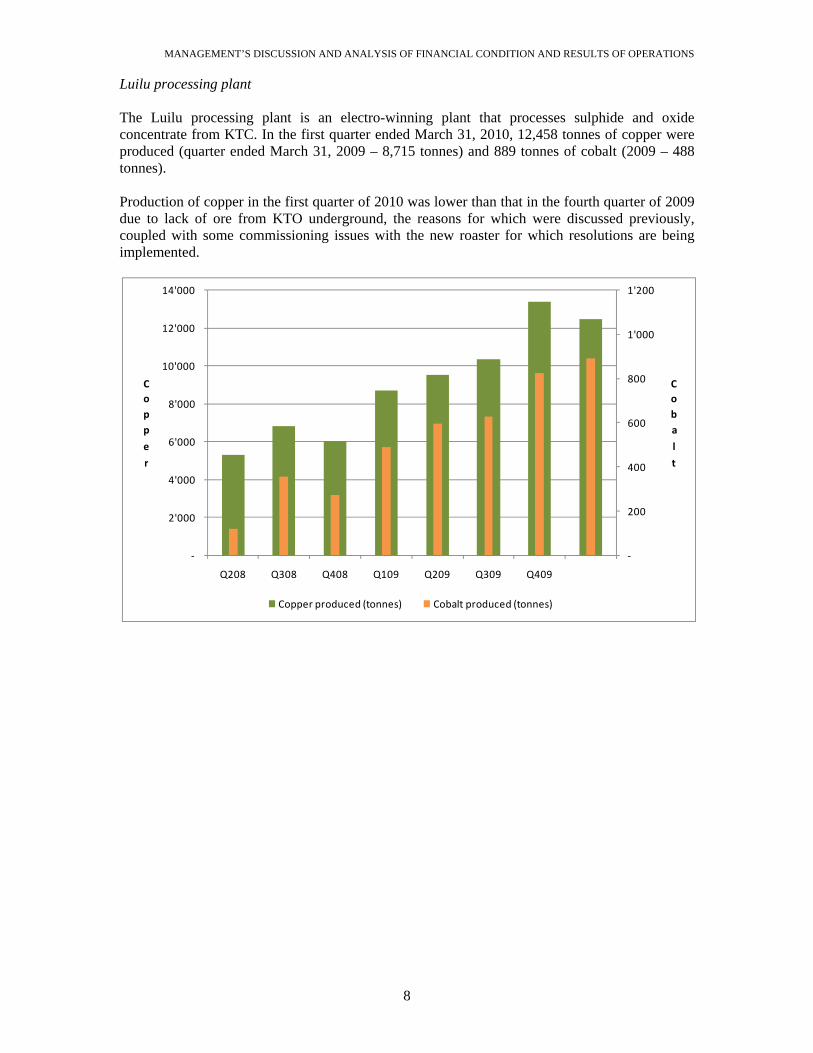
Luilu processing plant The Luilu processing plant is an electro-winning plant that processes sulphide and oxide concentrate from KTC. In the first quarter ended March 31, 2010, 12,458 tonnes of copper were produced (quarter ended March 31, 2009 – 8,715 tonnes) and 889 tonnes of cobalt (2009 – 488 tonnes). Production of copper in the first quarter of 2010 was lower than that in the fourth quarter of 2009 due to lack of ore from KTO underground, the reasons for which were discussed previously, coupled with some commissioning issues with the new roaster for which resolutions are being implemented.
‐
200
400
600
800
1'000
1'200
‐
2'000
4'000
6'000
8'000
10'000
12'000
14'000
Q208 Q308 Q408 Q109 Q209 Q309 Q409
Coba
l
t
Copp
e
r
Copper produced (tonnes) Cobalt produced (tonnes)

MANAGEMENT’S DISCUSSION AND ANALYSIS OF FINANCIAL CONDITION AND RESULTS OF OPERATIONS
9
5. 2010 First Quarter Financial Discussion Operating Results Three Months Ended
March 31, 2010 $’000
March 31, 2009 $’000
Copper revenue 94,353 27,782 Cobalt revenue 37,605 10,913 Copper concentrate revenue 8,790 - Cobalt concentrate revenue - 8,363 Cost of sales* (101,668) (85,626) 39,080 (38,568) Other expenses (6,435) (812)) Restructuring expense - (10,064) Debenture interest (4,792) (3,704) Interest income 36 157) Income tax (provision) recovery (296) (227)) Net income (loss) 27,593 (53,218) Basic and diluted income (loss) per common share $0.01 $(0.26) *Includes royalties, transportation costs and depreciation The Company reported a net income for the three months ended March 31, 2010, of $27.6 million, $0.01 basic income per share, compared with a net loss for the comparable quarter in 2009, of $53.2 million, $0.26 basic loss per share.
• Copper revenue increased by $66.6 million for the three months ended March 31, 2010, compared to the same period in 2009 due to:
o an increase in copper cathodes sold from 7,750 tonnes to 12,915 tonnes as production capacity has increased; and
o an increase in the realized copper price per pound to $3.31 from $1.63 as a result of the increase in commodity prices.
• Cobalt revenue similarly increased by $26.7 million with: o cobalt metal sales increasing from 460 tonnes to 900 tonnes; and o the realized cobalt price per pound increasing from $10.76 to $18.95.
• Copper concentrate revenue for the three months ended March 31, 2010, was $8.8 million. No copper concentrate was sold in the three months ended March 31, 2009.
• There was no cobalt concentrate revenue in the first quarter of 2010 as a result of the hand back of the KZC concentrator to La Générale des Carrières et des Mines (“Gécamines”) in 2009 as part of the new Joint Venture Agreement.
• Included in revenue are net re-pricing adjustments during the three months ended March 31, 2010, for copper and cobalt of $8.4 million (three months ended March 31, 2009 $4.8 million). Re-pricing adjustments result from sales being made at a provisional price in the month of shipment with final pricing based on average prices at a specified period thereafter.
• Also included in revenue are movements in the marked-to-market provision for copper, the first quarter represented an unrealized gain of $2.7 million (three months ended March 31, 2009 - $0.5 million).
• The cost of sales for the three months ended March 31, 2010, totaled $101.7 million (three months ended March 31, 2009, $85.6 million). The major variance between the periods being:
MANAGEMENT’S DISCUSSION AND ANALYSIS OF FINANCIAL CONDITION AND RESULTS OF OPERATIONS
10
o Royalties and transportation costs for three months ended March 31, 2010 were $1.6 million lower than for the three months ended March 31, 2009. Higher royalties in the three months ended March 31, 2010, as a result of increased sales revenue were offset by a reduction in transportation costs. The reduced transportation costs were as a result of a reduction of 8,083 tonnes in the number of tonnes of finished product shipped due to a reduction in the amount of concentrate sold.
o Costs directly attributable to mining operations (KTO and T-17), processing operations (Kamoto concentrator and Luilu processing plant) and engineering costs for the three months ended March 31, 2010 increased by $12.5 million compared to the same period in 2009. This was as a result of the increase in production.
o Site infrastructure and support costs of $15.5 million for site operating and maintenance costs not directly attributable to individual operations (three months ended March 31, 2009, $15.0 million) was only a small increase even though production increased at a greater rate as the Company benefited from reductions made in overheads last year.
o Depreciation and amortization of mineral interests of $13.5 million in the three months ended March 31, 2010, represented an increase of $4.6 million on the same three months in 2009. The increase is a result of the additional amortization and depreciation being charged due to the increase in capacity achieved from the completion of Phase II of the rehabilitation project.
o The other expenses for the three months ended March 31, 2010, totaled $6.4 million (three months ended March 31, 2009 - $0.9 million). The major variances were:
foreign exchange loss of $3.7 million (three months ended March 31, 2009 - $3.7 million gain) mainly due the weakening of the US dollar in the three months ended March 31, 2010 which resulted in foreign exchange losses being incurred on the Canadian dollar denominated debenture (for the three months ended March 31, 2009, the US dollar strengthened); and
a reduction in general administrative expenses of $2.1 million as a result of savings achieved during the second half of 2009.
• Restructuring expenses for the three months ended March 31, 2009, totaled $10.1 million in relation to the settlement of a terminated construction service contract. No such expenses were incurred for the three months ended March 31, 2010.
• Debenture interest for the three months ended March 31, 2010, totaled $4.8 million (three months ended March 31, 2009 – $3.7 million). The increase in the charge is due to the Debentures being denominated in Canadian dollars and the change in the exchange rate to the US dollar as discussed above.

MANAGEMENT’S DISCUSSION AND ANALYSIS OF FINANCIAL CONDITION AND RESULTS OF OPERATIONS
11
Cash Flows Three Months Ended
Cash flow from (used in): March 31, 2010 $’000
March 31, 2009 $’000
Operating activities 72,323 (71,337) Investing activities (22,707) (28,949) Financing activities -) 100,000)
• For the three months ended March 31, 2010, cash inflows from operating activities were $72.3 million (three months ended March 31, 2009 – $71.3 million outflow). The increase of $143.6 million was primarily due to:
o The increase in net income of $80.8 million as already discussed. o Changes in working capital which for the three months ended March 31, 2010
was an inflow of $31.2 million and for the three months ended March 31, 2009 a $21.2 million outflow. The majority of the improvement in the cash inflow is a result of trade receivables. At December 31, 2008, there were no accounts receivables due to the drop in commodity prices at the end of 2008 resulting in repricing of provisional invoices. The increase in commodity prices in the first quarter of 2009 led to an increase in accounts receivable and a negative impact on cash flow of $23.5 million, compared to a net cash inflow of $5.1 million in the three months ended March 31, 2010.
• Investing activities in the three months ended March 31, 2010, totaled $22.7 million with $31.2 million for acquisition of property plant and equipment, offset by a reduction in restricted cash of $8.5 million and for three months ended March 31, 2009, $28.9 million with $36.6 million for acquisition of property plant and equipment, offset by a reduction in restricted cash of $7.7 million.
• Financing activities in the three months ended March 31, 2010 were nil but for the three months ended March 31, 2009 they totaled $100.0 million as a result of proceeds from the Glencore convertible facility.

MANAGEMENT’S DISCUSSION AND ANALYSIS OF FINANCIAL CONDITION AND RESULTS OF OPERATIONS
12
6. Balance Sheet Discussion March 31,
2010 $’000
December 31, 2009 $’000
Assets Cash and cash equivalents 126,695 77,243 Restricted cash 5,000 13.455 Accounts receivable 53,278 58,379 Other current assets 108,213 120,614 Property, plant and equipment 1,499,708 1,481,904 Other non-current assets 56 56 1,792,950 1,751,651 Liabilities Current liabilities 146,950 136,804 Debentures payable 116,876 112,929 Other long-term liabilities 224,509 224,932 488,335 474,665 Shareholders’ equity 1,304,615 1,276,986 Cash The cash balance at March 31, 2010 increased to $126.7 million from $77.2 million at December 31, 2009. The increase was as a result of operating cash inflows of $72.3 million; investing activities outflows of $22.7 million; and realized foreign exchange losses of $0.1million. Restricted Cash Restricted cash at March 31, 2010 of $5.0 million (December 31, 2009 - $13.5 million) includes cash held for guarantees entered into as required by certain capital asset procurement contracts. The restricted cash at December 31, 2009, also included debenture interest of $8.5 million which was held in trust at the year end and is payable semi-annually. Accounts receivable As at March 31, 2010, the accounts receivable balance of $53.3 million represents outstanding balances for copper, cobalt and concentrate sales invoiced. Copper, cobalt and concentrate sales are made under various sales agreements. Sales are made at a provisional price in the month of shipment with final pricing based on average prices at a specified period thereafter. Included in the $53.3 million is a marked-to-market adjustment for sales of $11.9 million (December 31, 2009 - $9.2 million) that represents the difference between the provisional invoice price and the quoted market price of copper and cobalt at March 31, 2010.

MANAGEMENT’S DISCUSSION AND ANALYSIS OF FINANCIAL CONDITION AND RESULTS OF OPERATIONS
13
Other Current Assets Other current assets decreased to $108.2 million at March 31, 2010 from $120.6 million at December 31, 2009. There was a net reduction in inventories of $5.7 million with a decrease in work in progress and finished goods of $16.1 million due to improved logistics offset by an increase of $10.4 million in consumables inventory with the ramp up in production. Prepayments have decreased by $6.7 million with the completion of Phase II expansion and payments for Phase III expansion now only starting to commence. Property, Plant and Equipment Property, plant and equipment at March 31, 2010 increased to $1,499.7 million from $1,481.9 million at December 31, 2009 with project related capital expenditure of $16.8 million and operational capital expenditure of $14.4 million. Other Non-current Assets Other non-current assets were $0.1 million at March 31, 2010 consistent with $0.1 million at December 31, 2009. Current Liabilities Current liabilities at March 31, 2010 increased to $147.0 million from $136.8 million at December 31, 2009, with the main reason for the increase being an increase in accounts payable in line with increased production. Debentures Payable The increase in debentures payable to $116.9 million at March 31, 2010 from $112.9 million at December 31, 2009 occurred as a result of an unrealized foreign exchange loss of $3.6 million on the revaluation of the Canadian dollar denominated debentures into U.S. dollars. The Company’s outstanding debentures are due on November 20, 2013. Interest on the debentures is payable semi-annually in arrears with equal installments on January 1 and July 1 of each year, with interest payable from the closing date to June 30, 2007 capitalized and payable on maturity and cash interest payments commencing January 1, 2008. Other long-term liabilities Other long-term liabilities decreased to $224.5 million as at March 31, 2010 from $224.9 million as at December 31, 2009. Off-Balance Sheet Arrangements As at March 31, 2010, the Company had no off-balance sheet arrangements.
MANAGEMENT’S DISCUSSION AND ANALYSIS OF FINANCIAL CONDITION AND RESULTS OF OPERATIONS
14
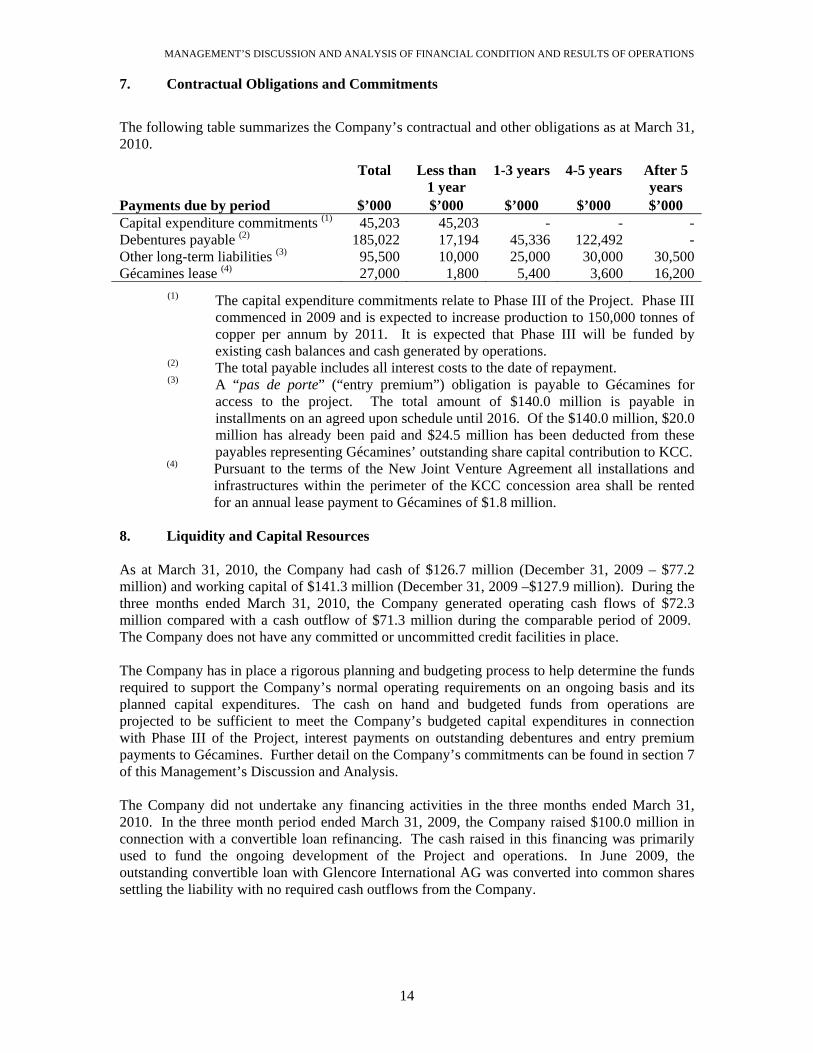
7. Contractual Obligations and Commitments
The following table summarizes the Company’s contractual and other obligations as at March 31, 2010.
(1) The capital expenditure commitments relate to Phase III of the Project. Phase III commenced in 2009 and is expected to increase production to 150,000 tonnes of copper per annum by 2011. It is expected that Phase III will be funded by existing cash balances and cash generated by operations.
(2) The total payable includes all interest costs to the date of repayment. (3) A “pas de porte” (“entry premium”) obligation is payable to Gécamines for
access to the project. The total amount of $140.0 million is payable in installments on an agreed upon schedule until 2016. Of the $140.0 million, $20.0 million has already been paid and $24.5 million has been deducted from these payables representing Gécamines’ outstanding share capital contribution to KCC.
(4) Pursuant to the terms of the New Joint Venture Agreement all installations and infrastructures within the perimeter of the KCC concession area shall be rented for an annual lease payment to Gécamines of $1.8 million.
8. Liquidity and Capital Resources As at March 31, 2010, the Company had cash of $126.7 million (December 31, 2009 – $77.2 million) and working capital of $141.3 million (December 31, 2009 –$127.9 million). During the three months ended March 31, 2010, the Company generated operating cash flows of $72.3 million compared with a cash outflow of $71.3 million during the comparable period of 2009. The Company does not have any committed or uncommitted credit facilities in place. The Company has in place a rigorous planning and budgeting process to help determine the funds required to support the Company’s normal operating requirements on an ongoing basis and its planned capital expenditures. The cash on hand and budgeted funds from operations are projected to be sufficient to meet the Company’s budgeted capital expenditures in connection with Phase III of the Project, interest payments on outstanding debentures and entry premium payments to Gécamines. Further detail on the Company’s commitments can be found in section 7 of this Management’s Discussion and Analysis. The Company did not undertake any financing activities in the three months ended March 31, 2010. In the three month period ended March 31, 2009, the Company raised $100.0 million in connection with a convertible loan refinancing. The cash raised in this financing was primarily used to fund the ongoing development of the Project and operations. In June 2009, the outstanding convertible loan with Glencore International AG was converted into common shares settling the liability with no required cash outflows from the Company.
Total Less than 1 year
1-3 years 4-5 years After 5 years
Payments due by period $’000 $’000 $’000 $’000 $’000Capital expenditure commitments (1) 45,203 45,203 - - -Debentures payable (2) 185,022 17,194 45,336 122,492 -Other long-term liabilities (3) 95,500 10,000 25,000 30,000 30,500Gécamines lease (4) 27,000 1,800 5,400 3,600 16,200
MANAGEMENT’S DISCUSSION AND ANALYSIS OF FINANCIAL CONDITION AND RESULTS OF OPERATIONS
15
9. Changes in Accounting Policies
New accounting policies
No new accounting standards were adopted in the three months ended March 31, 2010.
International Financial Reporting Standards (“IFRS”)
In 2008, the Canadian Accounting Standards Board confirmed that publicly listed companies will be required to adopt IFRS for interim and annual financial statements relating to fiscal years beginning on or after January 1, 2011. Early adoption may be permitted, however it will require exemptive relief on a case by case basis from the Canadian Securities Administrators. Katanga expects its first consolidated financial statements presented in accordance with IFRS to be for the three month period ended March 31, 2011, which includes presentation of its comparative results for fiscal 2010 under IFRS. In order to prepare for the changeover to IFRS, the Company has developed an IFRS conversion plan that comprises three major phases, including a scope and planning phase, a design and build phase and an implement and review phase culminating in the reporting of financial information in accordance with IFRS for Q1 2011. The Company is currently in the scoping and planning phase which involves establishing a project management team, identifying and allocating resources required for the conversion, identifying major areas affected by the conversion and developing an implementation plan and communication strategy. The Company has designated the appropriate resources to the conversion project to develop an effective plan and continues to assess resource and training requirements as the project progresses. The Company expects to begin the design and build phase of the project in the second quarter of 2010 which will result in the selection of IFRS accounting policies and transitional exemptions decisions, estimates of quantification of financial statement impacts and the preparation of shell financial statements. The Company expects to have completed shell financial statements, made estimates of the quantified impacts of a significant portion of anticipated changes to the Company’s current accounting policies on the Company’s IFRS opening balance sheet and identified business processes and resources impacted by the end of the third quarter of 2010. The International Accounting Standards Board continues to amend and add to current IFRS standards with several projects currently underway. The Company’s conversion process includes monitoring actual and anticipated changes to IFRS standards and related rules and regulations and assessing the impacts of these changes on the Company and its reporting, including expected dates of when such impacts are effective. The impact of the transition to IFRS on internal controls over financial reporting and disclosure controls and procedures will be determined during the design and implementation phases.

MANAGEMENT’S DISCUSSION AND ANALYSIS OF FINANCIAL CONDITION AND RESULTS OF OPERATIONS
16
To be adopted in fiscal 2011 and beyond
Business Combinations
In December 2008, the CICA issued Handbook Section 1582, Business Combinations (“Section 1582”), which replaces Handbook Section 1581, Business Combinations, and Handbook Section 1601, Consolidated Financial Statements and Handbook Section 1602, Non-Controlling Interests (“Section 1602”), which replace Handbook Section 1600, Consolidated Financial Statements. These new sections are effective January 1, 2011 with earlier adoption permitted.
Sections 1582 and 1602 will require net assets, non-controlling interests and goodwill acquired in a business combination to be recorded at fair value and non-controlling interests will be reported as a component of equity. In addition, the definition of a business is expanded and is described as an integrated set of activities and assets that are capable of being managed to provide a return to investors or economic benefits to owners. Acquisition costs are not part of the consideration and are to be expensed when incurred. The Company is currently assessing the impact that these sections may have on its financial position and results of operations. The Company has not early adopted these sections however should the Company engage in a future business combination, it would consider early adoption.
Multiple Deliverable Revenue Arrangements
In December 2009, the CICA issued EIC 175, “Multiple Deliverable Revenue Arrangements” to provide guidance on revenue recognition on contracts which provide multiple products, services, rights to use assets, or any combination thereof. This is effective for fiscal years beginning on or after January 2011. The application of this EIC would have no effect on the consolidated financial statements.
MANAGEMENT’S DISCUSSION AND ANALYSIS OF FINANCIAL CONDITION AND RESULTS OF OPERATIONS
17
10. Critical Accounting Estimates Critical accounting estimates used in the preparation of the interim consolidated financial statements include the Company’s estimate of recoverable value on its investment in the redevelopment of the Kamoto Joint Venture Assets and the KOV pit, inventory valuation, the estimated lives of depreciable assets and the estimation of the value of the work carried out on terminated contracts for the deferred SX/EW plant. These estimates involve considerable judgment and are, or could be, affected by significant factors that are beyond the Company’s control. The Company’s recorded value of its mineral interests associated with the redevelopment of the Kamoto Joint Venture Assets is based on historical costs. The cost of acquisition of Nikanor was allocated to the net assets acquired based on fair values. The carrying values of these assets are expected to be recovered in the future. The Company’s recoverability evaluation is based on market conditions for minerals, underlying mineral resources associated with the properties and future costs that may be required for ultimate realization through mining operations or by sale. The Company is in an industry that is exposed to a number of risks and uncertainties, including political risk, exploration risk, development risk, commodity price risk, operating risk, ownership risk, funding risk, currency risk and environmental risk. Bearing these risks in mind, the Company has assumed reasonable world commodity prices will be achievable, as will costs used in studies for projected construction and mining operations. All of these assumptions are potentially subject to significant change, which are out of the Company’s control, however such changes are not determinable. Accordingly, there is always the potential for a material adjustment to the value assigned to these assets.
MANAGEMENT’S DISCUSSION AND ANALYSIS OF FINANCIAL CONDITION AND RESULTS OF OPERATIONS
18
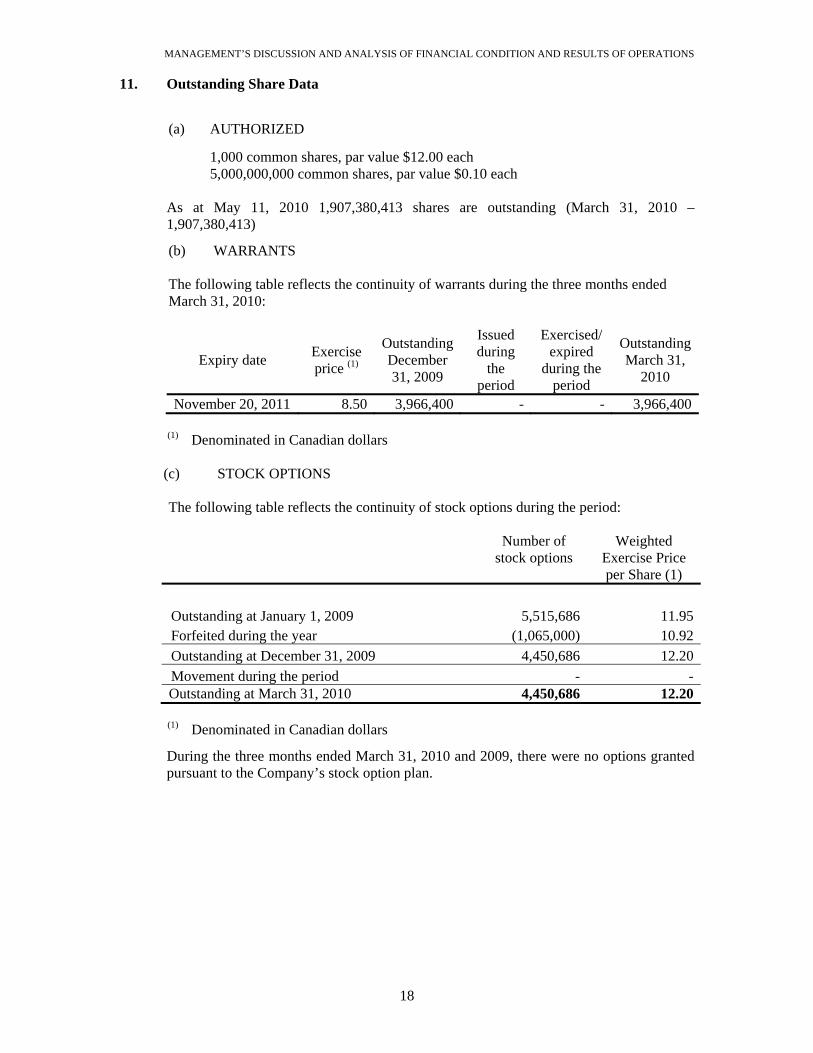
11. Outstanding Share Data
(a) AUTHORIZED
1,000 common shares, par value $12.00 each 5,000,000,000 common shares, par value $0.10 each
As at May 11, 2010 1,907,380,413 shares are outstanding (March 31, 2010 – 1,907,380,413)
(b) WARRANTS
The following table reflects the continuity of warrants during the three months ended March 31, 2010:
Expiry date Exercise price (1)
Outstanding December 31, 2009
Issued during
the period
Exercised/ expired
during the period
Outstanding March 31,
2010
November 20, 2011 8.50 3,966,400 - - 3,966,400
(1) Denominated in Canadian dollars (c) STOCK OPTIONS
The following table reflects the continuity of stock options during the period: Number of
stock options Weighted
Exercise Price per Share (1)
Outstanding at January 1, 2009 5,515,686 11.95Forfeited during the year (1,065,000) 10.92Outstanding at December 31, 2009 4,450,686 12.20Movement during the period - -Outstanding at March 31, 2010 4,450,686 12.20
(1) Denominated in Canadian dollars
During the three months ended March 31, 2010 and 2009, there were no options granted pursuant to the Company’s stock option plan.
MANAGEMENT’S DISCUSSION AND ANALYSIS OF FINANCIAL CONDITION AND RESULTS OF OPERATIONS
19
12. Related Party Transactions Related Parties DEM Mining SPRL (“DEM”) Dan Gertler holds an interest in the shares in DEM and has a beneficial interest in the Company. DEM was contracted to drill, mine and transport ore from the Tilwezembe mine to the crusher at the KZC plant. This contract was completed in December 2008. La Générale des Carrières et des Mines (“Gécamines”) a state owned and operated mining enterprise of the DRC, has a 25% minority interest in KCC. KCC is required to make royalty payments to Gécamines. Glencore International AG (“Glencore”) is the majority shareholder and is represented on the Board of Directors of the Company. Glencore entered into a 100% off-take agreement for concentrate sales with the Company and commencing January 1, 2009, pursuant to additional off-take agreements all copper and cobalt metal produced are sold to Glencore on market terms. During the year ended December 31, 2009, Glencore has also provided funding to the Company in the form of convertible debt and a non-convertible bridge loan facility. Xstrata Queensland Ltd (“Xstrata”) is identified as a related party on the basis Glencore holds a significant interest in Xstrata. At March 31, 2010, this interest represented 34.38% of Xstrata’s issued share capital. During 2009 and 2010, Xstrata has provided mining equipment and services to the Company. Mopani Copper Mine Plc (“Mopani”) is a copper and cobalt producer located in Zambia. Mopani is a 73% owned subsidiary of Glencore. During 2009 and 2010, Mopani supplied sulphuric acid and other consumables to the Company, and purchased concentrate from the Company. Mutanda ya Mukonkota Mining SPRL (“Mutanda“) is a copper and cobalt producer located in the DRC. Mutanda is a 40% owned investment of Glencore. There is an agreement in place for employees to use charter flights operated by either company with associated costs invoiced. During the year ended December 31, 2009, Mutanda supplied cranes to the Company and the Company supplied vehicles and furniture to Mutanda. Kamoto Operating Limited (“KOL”) a company incorporated pursuant to the laws of the DRC, was appointed to act as the operator of the Kamoto project pursuant to the Kamoto Joint Venture Agreement and an operating agreement (“Operating Agreement”) between KOL and the Company’s subsidiary, KCC, executed on November 2, 2005. KOL was acquired by the Company on September 23, 2009, and the Operating Agreement terminated on September 30, 2009. Current shareholders and former directors of the Company were the owners of KOL. The Operating Agreement established the terms and conditions pursuant to which KOL as operator provided services to KCC in the planning and conduct of exploration, development, mining, processing and related operations with respect to the Kamoto Joint Venture Assets, including a management fee provided to KOL. Fees to the end of May, 2008 were capitalized to mineral interests. From the commencement of commercial production on June 1, 2008 to the date of termination of the Operating Agreement (September 30, 2009), fees were expensed in the consolidated statement of operations and comprehensive loss.
MANAGEMENT’S DISCUSSION AND ANALYSIS OF FINANCIAL CONDITION AND RESULTS OF OPERATIONS
20
Enterprise Generale Malta Forrest SPRL (“EGMF”) a company owned by George Forrest and which has Malta Forrest as a Director, both of whom had a beneficial interest in the Company, was involved in contracts for the sourcing and provision of goods and services (including construction and other resources), mining of one of the open pit ore bodies, civil work and the construction of a tailings dam. EGMF ceased being a related party on June 10, 2009. These contracts were entered into while EGMF was a related party. Malta Forrest, who was a Director and had a beneficial interest in the Company, provided consultation on corporate affairs in the DRC. Malta Forrest ceased being a related party on June 10, 2009. Bateman Engineering N.V (“Bateman”) a company in the BSG Resources group who through Oakey Investment Holdings, was a related party as a result of owning a beneficial interest in the Company, and was engaged in the engineering and procurement contracts for KOV and the Kamoto Project. These contracts were entered into while Bateman was a related party. Bateman ceased being a related party on June 2, 2009.

MANAGEMENT’S DISCUSSION AND ANALYSIS OF FINANCIAL CONDITION AND RESULTS OF OPERATIONS
21
Transactions All related party transactions, other than the financing transactions with the Company’s parent company Glencore, were in the normal course of business and recorded at exchange amounts. The following table provides the total amount of the transactions entered into with these related parties:
Three months ended
March 31, 2010 $’000
Three months ended March 31, 2009
$’000 Purchases from related parties La Générale des Carrières et des
Mines 3,305 2,541Mopani Copper Mine Plc 4,175 -Purchases from former related parties Enterprise Generale Malta Forrest
SPRL - 8,774DEM Mining SPRL - 181Sales to related parties Mutanda ya Mukonkota Mining
SPRL 120 -Glencore International AG (1) 131,956 6,617Mopani Copper Mine Plc 8,790 -
As at March 31, 2010
$’000
As at December 31, 2009
$’000 Amounts owed to related parties La Générale des Carrières et des Mines 6,946 -Glencore International AG 3,811 178Mopani Copper Mine Plc 2,736 -Xstrata Queensland Ltd 1,915 1,915Amounts owed by related parties La Générale des Carrières et des Mines 6,642 806Mopani Copper Mine Plc 1,240 5,190Mutanda ya Mukonkota Mining SPRL 96 24Glencore International AG 48,421 44,774 (1) Glencore and the Company have signed an off-take agreement whereby, commencing
January 1, 2009, all copper and cobalt produced is sold to Glencore based on market terms.

MANAGEMENT’S DISCUSSION AND ANALYSIS OF FINANCIAL CONDITION AND RESULTS OF OPERATIONS
22
13. Health, Safety, Community and Environment In terms of the health and safety policy, there is explicit recognition of the importance of a safe and healthy work environment, created as a result of joint responsibility between the Company, its employees and contracting companies involved in work on the operating site. The Company is actively developing and implementing procedures, practices, training, and audit protocols across its operation. This includes emergency response preparedness and relevant training. In December 2008, the Company’s consultants (SRK Consulting) completed a draft Environmental & Social Impact Assessment (“ESIA”) which is supported by a series of Environmental & Social Management Plans. This ESIA was carried out on a project description that envisaged a full build-out to increase the production to in excess of 300,000 tpa copper. Arrangements have been made for SRK Consulting to review the draft ESIA based on the revised project development and in consideration of DRC legal requirements. Public consultation was completed at April 15, 2010, and it is anticipated that SRK Consulting will complete the necessary amendment to the ESIA during the second quarter of 2010. Once this review and amendment is completed the ESIA will be submitted to the DRC authorities for approval. In the interim, community development and ongoing communications are maintained, albeit at a somewhat lower level than originally anticipated. 14. Joint Venture Agreement (JVA) The amended JVA was signed with Gécamines on July 25, 2009, and all conditions remain consistent with those outlined in the Annual Information Form which is available under the Company’s profile on SEDAR at www.sedar.com. 15. Technical report The Company filed an updated Technical Report on March 31, 2010, that covered the mineral reserves [as defined by National Instrument 43-101 of the Canadian Securities Regulators (“NI 43-101”)] and operations of the Company’s operating subsidiary in the DRC, Kamoto Copper Company SARL.

MANAGEMENT’S DISCUSSION AND ANALYSIS OF FINANCIAL CONDITION AND RESULTS OF OPERATIONS
23
16. Disclosure Controls and Procedures and Internal Control over Financial Reporting Disclosure Controls Disclosure control and procedures have been designed to ensure that information required to be disclosed by the Company is accumulated and communicated to the Company’s management as appropriate to allow timely decisions regarding required disclosure. For the fiscal year ended December 31, 2009, an evaluation was commissioned by the Company under the supervision of the CEO and CFO and with the participation of management of the effectiveness of the Company’s disclosure controls and procedures as defined under the rules adopted by the Canadian securities regulatory authorities. The Company’s CEO and CFO are responsible for establishing and maintaining disclosure controls and procedures (DC&P) and internal control over financial reporting (ICFR), as those terms are defined in National Instrument 52-109 Certification of Disclosure in Issuers’ Annual and Interim Filings, for the Company. The CEO and CFO have concluded that, as at March 31, 2010, the Company’s DC&P has been designed effectively to provide reasonable assurance that (a) material information relating to the Company is made known to them by others, particularly during the period in which the annual filings are being prepared; and (b) information required to be disclosed by the Company in its annual filings, interim filings or other reports filed or submitted recorded, processed, summarized and reported within the time periods specified in securities legislation. They have also concluded that the Company’s ICFR has been designed effectively to provide reasonable assurance regarding the reliability of the preparation and presentation of the financial statements for external purposes. It should be noted that while the Company’s CEO and CFO believe that the Company’s disclosure controls and procedures provide a reasonable level of assurance that they are effective, they do not expect that the disclosure controls will prevent all errors and fraud. A control system, no matter how well conceived or operated, can only provide reasonable, not absolute, assurance that the objectives of the control system are met. Internal controls over financial reporting are designed to provide reasonable assurance regarding the reliability of financial reporting and the preparation of the financial statements for external reporting purposes in line with generally accepted accounting principles in Canada. Management is responsible for establishing and maintaining adequate internal controls over financial reporting appropriate to the nature and size of the Company. However, any system of internal control over financial reporting has inherent limitations and can only provide reasonable assurance with respect to financial statement preparation and presentation. The Company uses the Committee of Sponsoring Organizations of the Treadway Commission (“COSO”) control framework. For the fiscal year ended 2009, an evaluation was commissioned by the Company under the supervision of the CEO and CFO and with the participation of management of the effectiveness of the Company’s internal control over financial reporting. Based on this evaluation, the CEO and CFO have concluded that the design and operation of the Company’s internal controls over financial reporting were effective as at December 31, 2009. Management is continually monitoring and revising its control procedures and processes. Due to the size of its finance staff, there is not complete segregation of duties in the Company. However, for more complex areas of accounting and accounting estimates, the CFO and Controller review each other’s work.

MANAGEMENT’S DISCUSSION AND ANALYSIS OF FINANCIAL CONDITION AND RESULTS OF OPERATIONS
24
Internal Control over Financial Reporting While the Company’s CEO and CFO have concluded that the Company’s internal control over financial reporting has been designed to provide reasonable assurance regarding the reliability of financial reporting and the preparation of financial statements for external purposes, management of the Company wishes to provide additional disclosure in this management’s discussion and analysis in view of certain weaknesses that were identified by internal audit, with the participation of the Company’s CEO, CFO and the Audit Committee. Internal audit findings The internal audit findings of the Company indicated that, based on internal audits conducted in 2009, the following areas required improvement: • Supply chain management • Accounting and reporting • Payroll • Capital projects • Metallurgical accounting and inventory control Improvements have been made in all of the areas as recommended with follow up audits currently being undertaken to assess the effectiveness of the improvements. Through the process of evaluating its internal controls systems, the Company and internal audit identified areas that require improvement regarding the internal control systems. To a large extent the weaknesses can be attributed with remote operations. Management continues to work with internal audit to take the necessary steps to resolve areas of weakness identified. For those weaknesses where corrective action is still in progress, Management has concluded that mitigating controls are in place such that the reliability of the Company’s financial reporting has not been compromised. 17. Financial Instruments
The Company’s use of financial instruments has not changed since December 31, 2009. The main financial instruments of the Company remain as:
• Receivables from copper sales - Open provisionally priced copper sales which retain an exposure to future changes in commodity prices are marked-to-market based on London Metal Exchange (“LME”) forward prices for copper offset by the contractual discount to the LME price.
• Restricted stock units - Outstanding restricted stock units are marked-to-market based on the Company’s share price on the TSX at the reporting date.

MANAGEMENT’S DISCUSSION AND ANALYSIS OF FINANCIAL CONDITION AND RESULTS OF OPERATIONS
25
18. Risk Factors Katanga's operations and results are subject to a number of different risks at any given time. These risk factors include, but are not limited to, the current global financial condition; the speculative nature of mining operations; unanticipated variations in mineral resources or ore reserves, grade and recovery rates; risks relating to international operations, including political unrest, social disruption in the local communities and limitations in taking legal actions and enforcing judgments; the lack of infrastructure in the Democratic Republic of the Congo; health risks to Katanga personnel and local population; global competition in the mining sector; relationships with joint venture partners; the existence of a principal shareholder; potential conflicts of interests; dependence on key personnel and third party contracts and business arrangements; compliance with, or changes to, applicable laws, regulations, rules or quality standards, including those relating to Katanga's mineral entitlements and mining rights; insurance coverage limitations and uninsured risks; changes in environmental regulations and/or enforcement of such regulations; fluctuating copper and/or cobalt prices and currency exchange rates; acts of terrorism; accidents, labour disputes and other risks of the mining industry, including the possibility of project cost overruns or unanticipated costs and expenses or the failure of plant, logistics, equipment or processes to operate as anticipated. A more detailed analysis of the risk factors that could affect Katanga's operations and results can be found in the updated Technical Report and most recent Annual Information Form of Katanga, which are available on SEDAR at www.sedar.com. 19. Non-GAAP Measures The Company has included a non-GAAP performance measure, C1 cash costs, net of by-product credits, per pound of copper. The Company reports C1 cash costs on a production basis. In the copper mining industry, this is a common performance measure but does not have any standardized meaning. The Company believes that, in addition to conventional measures prepared in accordance with GAAP, certain investors use this information to evaluate the Company’s performance and ability to generate cash flow. Accordingly, it is intended to provide additional information and should not be considered in isolation or as a substitute for measures of performance prepared in accordance with GAAP. C1 cash costs inclusive of by-product credits are calculated by deducting by-product cobalt sales revenues from operating cash costs.
MANAGEMENT’S DISCUSSION AND ANALYSIS OF FINANCIAL CONDITION AND RESULTS OF OPERATIONS
26
20. Forward Looking Statements Management’s discussion and analysis may contain forward-looking statements, including predictions, projections and forecasts. Forward-looking statements include, but are not limited to, statements with respect to exploration results, the future price of copper and cobalt, the estimation of mineral reserves and resources, the realization of mineral reserve and resource estimates, the timing and amount of estimated future production, costs of production, anticipated budgets and exploration expenditures, capital expenditures, costs and timing of the development of new deposits, the success of exploration activities generally, permitting time lines, currency fluctuations, requirements for additional capital, government regulation of exploration and mining operations, environmental risks, unanticipated reclamation expenses, title disputes or claims, limitations on insurance coverage and the timing and possible outcome of any pending litigation. Often, but not always, forward-looking statements can be identified by the use of words such as “plans”, “expects” or “does not expect”, “is expected”, "budget”, “scheduled”, “estimates”, “forecasts”, “intends”, “anticipates” or “does not anticipate”, or “believes”, or describes a “goal”, or variation of such words and phrases or state that certain actions, events or results “may”, “could”, “would”, “might” or “will” be taken, occur or be achieved. Forward-looking statements involve known and unknown risks, future events, conditions, uncertainties and other factors which may cause the actual results, performance or achievements to be materially different from any future results, prediction, projection, forecast, performance or achievements expressed or implied by the forward-looking statements. Such factors include, among others, the actual results of current exploration activities; actual results and interpretation of current reclamation activities; conclusions of economic evaluations; changes in project parameters as plans continue to be refined; future prices of copper and cobalt; possible variations in ore grade or recovery rates; failure of plant, equipment or processes to operate as anticipated; accidents, labour disputes and other risks of the mining industry; delays in obtaining governmental approvals or financing or in the completion of exploration, development or construction activities, as well as those factors disclosed in the Company's current annual information form and other publicly filed documents. Although Katanga has attempted to identify important factors that could cause actual actions, events or results to differ materially from those described in forward-looking statements, there may be other factors that cause actions, events or results not to be as anticipated, estimated or intended. There can be no assurance that forward-looking statements will prove to be accurate, as actual results and future events could differ materially from those anticipated in such statements. Accordingly, readers should not place undue reliance on forward-looking statements. The Company disclaims any intention or obligation to update or revise any forward-looking statements whether as a result of new information, future events, or otherwise, except in accordance with applicable securities laws.