kathleen tyson's thesis - tdl
TRANSCRIPT
ABSTRACT
WacoCrimeTrends,1930–2013:AComparativeStudyofViolent,Property,andIndexCrimeRates
KathleenTyson
Director:SungJoonJang,Ph.D.
Thisthesisexamineslong‐termtrendsofviolent,property,andindexcrimes
inWacobetween1930and2013.DataweredrawnfromtheUniformCrimeReports
for the crime rates ofWaco, the United States, Texas, threemajor cities of Texas
(Dallas, Austin, and Houston), and four neighboring cities of Waco (Bellmead,
Robinson, Hewitt, and Woodway). While crime rates of Waco were higher than
those of the U.S. and Texas when examined since 1960, the rates have been
decreasingforthe lasttwentyyearsfasterthanthoseofothercitiesaswellasthe
U.S. and Texas. To explore whether the pattern of crime rates was related to
community characteristics, Waco’s social, familial, and economic statistics were
collected using the decennial Census data. Being consistent with Social
Disorganization Theory, findings show that the economic condition and family
structureofWacochangedsimilarlytothecrimetrend.Implicationsoffindingsare
discussed.

APPROVED BY DIRECTOR OF HONORS THESIS: Dr. Sung Joon Jang, Institute for Studies of Religion APPROVED BY THE HONORS PROGRAM: __________________________________________ Dr. Elizabeth Corey, Director. DATE:
WACOCRIMETRENDS,1930–2013:
ACOMPARATIVESTUDYOFVIOLENT,PROPERTY,ANDINDEXCRIMERATES
A Thesis Submitted to the Faculty of
Baylor University
In Partial Fulfillment of the Requirements for the
Honors Program
By
Kathleen Tyson
Waco, Texas
December 2015
ii
TABLE OF CONTENTS
Chapter One: Introduction . . . . . . . . 1
Chapter Two: Methodology: Data Collection . . . . . 4
Chapter Three: Waco Crime Trends, 1930 – 2013 . . . . . 14
Chapter Four: Rate of Change in Crime Rates of Waco, 1960 – 2013 . . 27
Chapter Five: Explaining Crime Trends: A Social Disorganization Approach . 33
Chapter Six: Conclusion . . . . . . . . 42
Appendix . . . . . . . . . . 47
Appendix: Figures and Tables . . . . . . 48
Bibliography . . . . . . . . . . 66
1
CHAPTER ONE
Introduction
As I study Criminal Justice, the subject of crime in Waco was a common topic
among my fellow students. In most circles, the consensus was often the same: crime
rates in Waco were very high, or Waco was one of the most dangerous cities in Texas.
Other times, my peers (especially those who grew up in high-crime places) would argue
that Waco really was not that dangerous of a city. Even one of my first memories here, is
of my cousin (who was also starting college at Baylor) telling me not to go anywhere by
myself in Waco at night and to never roll my windows down when driving in the area.
So just how high is the crime rate in Waco? Is it as bad as most tend to suspect? Is it
even worse than what many think? Or is it lower than the common belief? Also, why are
the crime rates in Waco the way they are? How did they get to that level? In order to
answer these questions, I decided to conduct a study of the long-term crime trends of
Waco between 1930 and the most recent year that relevant data are available for, which
no one seems to have done to the best of my knowledge.
After this study began, it became apparent that much more than the crime trends
in Waco would need to be researched. What would be the usefulness of studying the City
of Waco’s trends if there were not any others to compare Waco with? Ultimately, it was
decided to also research the long-term crime trends of the United States of America; the
State of Texas; three major cities in Texas (Austin, Dallas, and Houston); four
neighboring cities (Bellmead, Hewitt, Robinson, and Woodway); and Baylor University

2
campus. This way, there would be many different ways Waco could be compared with
other places in order to place Waco’s crime trends in different contexts.
Furthermore, this project was started in the hopes of being able to gain a clearer
and more accurate empirical understanding of Waco’s crime, as well as to gain an
understanding of why the crime levels are the way they are (whether that be high or low).
It, therefore, became important to also research and collect data on the sociodemographic
characteristics of Waco so that I may apply to the understanding of Waco’s crime trends
a major theory of community crime rates, Social Disorganization Theory, put forth by the
criminologists Shaw and McKay. In their theory, Shaw and McKay argue that three
community characteristics lead to higher rates of delinquency – low economic status,
ethnic heterogeneity, and family disruption rates. Comparing Waco’s sociodemographic
trends with crime trends may help explore which characteristics contribute to crimes in
Waco and even what could be done to decrease the crime rates of Waco.
After this introductory chapter, I start with describing methodological approaches
I applied to this research project. In this chapter you will find my adventures into the
world of research chronicled as I describe the steps I took to gather the data needed for
this project. It will also include all successes in my research efforts along with the
challenges/setbacks faced so that if anyone else decides to further this research they can
hopefully learn from my mistakes and have a better understanding of how to gather this
type of data.
In Chapter Three I will discuss the crime trends found for Waco over the last
eighty years or so and compare Waco’s crime trends with all other geographic units. I
also attempt to explain possible interpretations of the crime trends observed, using

3
theories by prominent criminological scholars such as Gary LaFree and Robert M.
O’Brien.
In Chapter Four changes in the crime rates of Waco will be compared with those
of the U.S., Texas, and other cities. In Chapter Five, the Social Disorganization Theory
will be discussed as well as other relevant theories and applied to the data on Waco’s
demographic characteristics. Then in the final chapter, I will synthesize the information
presented in preceding chapters and offer potential policy suggestions as to what would
contribute in the future to decreasing Waco’s crime rates.
4
CHAPTER TWO
Methodology: Data Collection
To collect crime data for the City of Waco, I began my search on the Federal
Bureau of Investigation’s website1 and looked up their Uniform Crime Reports (UCR):
Crime in the United States. The annual report organizes the UCR statistics into different
categories, by organizing them into tables. Among them, Table 8, “Offenses Known to
Law Enforcement by State by City,” included the so-called index crime statistics at a city
level for each year. The last fifteen years were either uploaded to the website as an excel
sheet or a pdf file. I downloaded the files and searched for Waco, after which I typed in
the statistics for each year into an excel sheet that I had created. In the process of
recording the data into the excel sheet, I added additional columns to the original nine I
had for the years (1930 – 2013) and the eight index crimes: Criminal Homicide, Forcible
Rape, Robbery, Aggravated Assault, Burglary, Larceny, Motor Vehicle Theft, and Arson.
I eventually had sixteen total columns: Year, Population, Violent Crime Rate, Violent
Crime (total), Criminal Homicide subdivided into two columns of Murder &
Nonnegligent Manslaughter (henceforth, “Murder” as the UCR calls it) and Manslaughter
by Negligence, Forcible Rape, Robbery, Aggravated Assault, Property Crime Rate,
Property Crime (total), Burglary, Larceny-theft subdivided into two columns of Over $50
and Under $50, Motor Vehicle Theft, and Arson.
1FBI website: https://www.fbi.gov/about-us/cjis/ucr/ucr-publications

5
For the Year column, I set 1930 as the base year because this was the year the
Uniform Crime Reports were first collected from policing agencies. I then extended the
column all the way down to 2013, the most recent year, for which complete annual
reports were available at the time of my data collection. The Texas Almanac2 was used
to look up each year’s population size as determined by the U.S. Census. To calculate
the crime rates, the following formulas were used: ∗ 100, 000 and
∗ 100, 000. The Violent Crime total was determined by adding the data in
the columns of Murder3, Forcible Rape, Robbery, and Aggravated Assault together for
each year. Property Crime total included Burglary, Larceny-Theft, and Motor Vehicle
Theft.4
Since the FBI website had only the most recent fifteen years available on the
Internet, I turned to the Baylor library as a resource for finding the years between 1930
and 1995. The library only had the recent years as well which led me to look online
through the library catalog. This eventually led to a link to the full text from the
HathiTrust Digital library.5 This new library database had the majority of the missing
years I was looking for, but required a lot of sifting through the numerous pages of each
year’s publication to find the specific data relevant to Waco.
2Texas Almanac: https://www.texasalmanac.com/sites/default/files/images/CityPopHist%20web.pdf
3Manslaughter by Negligence was not used in the calculations, as it is not included as a Part One Index Crime.
4Since Arson was not integrated into the UCR until 1979, for the sake of uniformity Arson was not included in my crime rates.
5HathiTrust Digital library: http://catalog.hathitrust.org/Record/007406857

6
When I began collecting each year’s statistics, I was curious about exactly which
year Waco started submitting their reports to the UCR. The HathiTrust database revealed
that Waco had been submitting reports from the very beginning of the UCR in 1930.
This was a pleasant discovery because it meant my research could include all of the data
as far back as our nation had started keeping track of it, which would allow me to
examine crime trends in Waco for the longest period possible in comparison with other
geographic units at the national, state, and local level.
The main challenge I had in using the HathiTrust reports was that not every year
was included between 1930 and 2013 for an unknown reason, nor was I able to search for
Waco in the documents as the majority of them consisted of very small, nearly illegible
print which could not be identified when trying to do a whole document word search.
Another downfall I discovered was that the earlier years did not include a yearly total of
the statistics, but rather only kept track at the quarterly level and in some cases at the
monthly level. This made it more difficult for me to gather the numbers I needed as I
found it necessary to add each quarter or month’s rate together on my own. Eventually,
however, I was able to find the reports, which included the yearly totals. Also, since it
required Internet access to see the data, which was an obstacle at different points, I
wondered whether the Waco library would have a hard copy of any of the Uniform Crime
Reports. This idea unfortunately was not useful as after working with the Research
librarian for several hours we were unable to find even one physical UCR document in
the Waco library system.
Since neither the Waco library nor the Baylor library had the older Uniform
Crime Reports, to solve the problem of the missing years in the HathiTrust database I

7
used Google to find another source. This led me to discover that the Internet Archives6
had nearly all of the years for the UCR, enabling me to collect the crime statistics for
every year. The Internet Archives, however, was difficult to use as the website would
change the order of the yearly reports each time I would close the window, go back a
page or two, or allow my computer to sleep. This cost me extra time in opening each
report to find out what year it was and if I had gone through it before. It was almost
impossible to find one specific year as well as to determine if the Internet Archives had
every year or not. I discovered this difficulty when I could not locate the Uniform Crime
Report for the year 1974 on HathiTrust and thought I had gone through every year
available on the Internet Archives. As it turns out, though, I had either missed it when
going through the different years a few days prior or because of the shifting nature of the
website had not realized that it was now in a section I had previously looked at earlier in
that same session. However, within a couple of weeks, 1974 appeared after numerous
search efforts, and I was able to fill in the year initially thought to be missing.
While gathering all of the data, I also looked for the crime statistics broken down
at the community level. The Waco Police Department website7 provided the last five
years worth of monthly crime statistics divided by “neighborhood.” Unfortunately, the
majority of this information was not very helpful, as the categories of the crimes were not
consistent with the UCR’s index crimes. For example, the page for January 2010 had
two columns labeled Assault and Sexual Assault, whereas the UCR violent crimes
include Forcible Rape and Aggravated Assault. Therefore, I could not use the statistics
6Internet Archives: https://archive.org/search.php?query=uniform%20crime%20reports%20for%20the%20united%20states%20AND%20collection%3Aadditional_collections 7Waco Police Department: http://www.waco-texas.com/police/police-crime-statistics.asp
8
provided in the Assault and Sexual Assault columns because it could not be determined
how many of the assaults were “aggravated” (as opposed to “simple”) or whether sexual
assault referred to forcible rape or not (e.g., statutory rape, sexual battery, etc.). To solve
this problem, I called the Waco Police Department in hopes of speaking with the person
in charge of reporting the UCR data to the FBI. However, my phone calls only led in
circles as I was transferred from person to person, and eventually I was only able to speak
with answering machines, leaving messages which were not returned. I then obtained
contact information of an officer in the Waco Police Department from one of my
professors, Chief Yost Zakhary, who is the Manager and Safety Director of the City of
Woodway (a nearby city). From this new contact I learned that the information I had
previously found on their website was all they had available. After this dead end, I
turned to the Waco City records to see if it held the information I was seeking.
I submitted a request to the public records forum for the Waco Neighborhood
Offense Data for years prior to 2009, particularly the Index Crimes broken down at the
neighborhood level. I also asked for the individual offense data including information
about location – the zip code area where the offense was committed – as well as offense
type for Waco for as many years as the electronic form of the data was available. This
was intended to break down crime statistics at the zip code level so that they may be
linked to the U.S. Census data on demographic characteristics at the same level. I
eventually received an email back stating that they had reviewed their records and
determined that there were no responsive documents to my requests. Shortly thereafter, I
was contacted by the City of Waco City Secretary’s Office, who informed me over the
course of several emails, that the information I was seeking was on the FBI website. She

9
also informed me that the only information they had on the specific crime statistics I was
looking for broken down at a neighborhood level were the ones already available online.
While this response did not prove to be more helpful than what I had previously learned,
her email had a link to the FBI UCR data tool8 which turned out to be extremely helpful
because it directed me to a section of their website I had previously been unaware of.
This allowed me to search for local police departments and pull up the UCR information
for as many years as they had available electronically. Using this method, I was able to
more easily collect the UCR data than with any system I had previously used.
With this new method, I collected the data for three major cities in the State of
Texas (Austin, Dallas, and Houston) as well as the data on the national and state level.
For the United States and Texas statistics, the FBI provided the Index Crimes from the
year 1960 onwards. For the local agencies, it provided the data from the year 1985
onwards. Since the UCR data tool only included the years 1985 onwards, I had to return
to the previous methods I had used when gathering the statistics for Waco to collect the
years between 1930 and 1985 for the major cities. Furthermore, using the data tool, I
could also collect data for smaller cities (i.e., having a population under 10,000) adjacent
to Waco: Bellmead and Robinson from the late 2000’s onward and Hewitt from the late
1990’s. Woodway, another neighboring city, was not included in the UCR database tool
on the FBI website until 1999.
After collecting the national, state, and city crime statistics, I became curious
about the campus crime statistics of Baylor University since the annual report of the UCR
includes Table 9 “Offenses Known to Law Enforcement, by State by University and
8UCR Data Tool: http://www.ucrdatatool.gov/Search/Crime/Crime.cfm
10
College.” Between the FBI website’s Table 9 listings and the Internet Archives, I was
able to find a little over thirty years worth of data. I also used the HathiTrust database
and an actual hardcopy of the year 1976 that I found in the Baylor library collection to fill
in the missing years. The year 1976 was the earliest record I was able to find that Baylor
University submitted data to the UCR.
Due to being unable to find sufficient data on Waco crime statistics broken down
at the neighborhood level, I decided to look at data on social demographics in hopes that
it could potentially help explain why crime rates were higher or lower in Waco than the
surrounding cities, Texas, and the U.S. I went to www.census.gov to see what type of
demographic data they collected and after pulling up Waco in the Quick Facts data tool, I
decided to collect the following categories: % Black or African American; % Hispanic or
Latino; Homeownership rate; % Persons below poverty level; Median household income;
% Female householder, no husband present; % Unemployed; and Divorce Rate.9 I set
these categories into column one of a new spreadsheet and made a table that gave each of
these categories six decades: 1960, 1970, 1980, 1990, 2000, and 2010. The year 1960
was determined to be the starting year as the UCR data collected for the U.S. and Texas
began that time. Only the year 2010 was available for most of these categories online
under Quick Facts, so I turned to the published census archives in the Baylor library for
the remaining decades.
In the archives, I looked in the volumes Census of Population: Characteristics of
Population and Census of Population: General Social and Economic Characteristics for
the State of Texas for each decade between 1960 and 2000. Using these volumes I
9http://quickfacts.census.gov/qfd/states/48/4876000.html
11
located the categories % Black or African American; Median household income; and %
Unemployed for Waco for all decades from 1960 through 2000. For the two categories
% Hispanic or Latino and % Persons below poverty level, I found the Waco data starting
in 1970 through 2000. For the category % Female householder, no husband present, I
was only able to find the years 1980, 1990, and 2000 using the Census volumes. Divorce
Rate was also a category I did not find many years for, as I was only able to find 1960,
1970, and 1980. I was unable to find the Homeownership rate in Waco category prior to
2000, so I ultimately decided to leave this category out of my research.
As I had a few decades missing in different categories, particularly the Divorce
Rate category, I turned to the Statistical Abstract volumes to see if I could locate the
missing numbers. After searching through the Baylor library database, I was able to find
the Statistical Abstracts from the years 1886 through the present in the Census
database.10 However, after downloading the zipped files and searching through these
volumes it was determined that each year was limited to the national and state statistics
but not cities; and therefore was irrelevant to my search. The 2010 data from Census
Quick Facts also failed to include the categories Divorce Rate or % Unemployed. I was
unable to find the Divorce Rate statistic, but after searching Google I discovered the
category % Unemployed for Waco in 2010 on the United States Department of Labor:
Bureau of Labor Statistics website.11
Another difficulty I encountered in the data from the 1960 volume Census of
Population: Characteristics of Population was that the categories % Black or African
American, % Unemployed, and Divorce Rate were separated into male and female total 10http://www.census.gov/prod/www/statistical_abstract.html 11http://data.bls.gov/timeseries/LAUMT484738000000004?data_tool=XGtable

12
statistics without the percent or rate calculated. So to match the data I was able to find in
the other volumes and online, I used the following formulas to calculate the numbers I
needed:
(male African Americans + female African Americans)
(Waco population) * 100 = % Black or African American
(males in CLF unemployed + females in CLF unemployed)
(males in civilianlaborforce CLF + females in CLF) * 100 = %Unemployed
(divorced males + divorced females)
(males ever married + females ever married) * 100 = Divorce Rate
I calculated the percentages for the decades 1970, 1980, and 1990 for the categories %
Black or African American; % Hispanic or Latino; and % Female householder, no
husband present (only 1980 & 1990). Fortunately, these categories were no longer
divided into male and female statistics. For the divorce rate statistics from 1970 and
1980 I calculated the rate as shown above, but eliminated the step of adding male and
female statistics together as that was already done for me.
After collecting all of these statistics for Waco, I grouped the different categories
into three groups of racial, economic, and familial demographics. I then took each group
and chartered their statistics in a figure along with the property and violent crime
statistics of Waco so that they could be directly compared to one another. To do this, I
added two rows to my new spreadsheet and typed in the appropriate crime statistics for
only the decade years. However, since the violent and property crime numbers were so
much higher than the demographic statistics I had collected, I divided the violent crime
numbers by 100 and property crime numbers by 1000 to make them equivalent with the
demographic statistics. This step was necessary in order that the demographic statistics
could be compared on a chart with all other numbers on an equal x-axis and y-axis. My
13
finished product was three figures labeled Waco Heterogeneity vs. Violent and Property
Crime which included the two racial categories; Waco Family Disruption vs. Violent and
Property Crime which included the categories % Female householder, no husband present
and Divorce Rate; and Waco Economic Demographics vs. Violent and Property Crime
which included the categories Median household income, % Unemployed, and % Persons
below poverty level.
14
CHAPTER THREE
Waco Crime Trends, 1930 – 2013
Crime Rates in Waco, 1930 – 2013 The City of Waco has participated in the Uniform Crime Reports (UCR) program
since it was launched in 1930. Because Waco reported their crime statistics from the
beginning, we can examine the crime trends of the last eight decades separately for
violent, property, and index offenses. Overall, crime rates in Waco were relatively steady
between 1930 and the early 1950s, when there began a long-term increase of almost
every type of crime until the late eighties and early nineties. We then see a rather
unexpected change in the crime rates, quite contrary to some scholars’ prediction of
crime trends in the United States entering a new millennium (Haberman, 2014): Crime
has been steadily falling since the early nineties, with only a few minor upsurges.
Violent crimes are committed substantially less often than property crimes, and
the index crimes are a compilation of violent and property crimes. As a result, the index
crime trends always reflect property crime trends more than violent. As can be seen in
Figure 1, the index crime rates of Waco are almost an exact replica of the property crime
rates. Because, both the property and index crime rates completely eclipse the violent
crime rates as to make them appear almost flat in comparison, I multiplied the violent
crime rates by ten, so that Figure 1 could show each trend in a comparable manner. So
even though violent crimes are much lower in quantity and thus rate, all types of crime
committed in Waco have similar trends. It can therefore be implied that the explanations
15
behind the main changes in the crime rates are to be applicable to both violent and
property types of crime throughout the period.
Between 1958 and 1976, violent crimes of the UCR included an offense category
known as Manslaughter by Negligence, but it was removed from the UCR to only include
the offense of Murder & Nonnegligent Manslaughter beginning in 1977. However,
adding in the extra offense did not change the overall crime trend picture as the amount
of the particular offense reported ranged from zero to nineteen in any given year they
were included (see Figure 1a). Because the offense categories of Robbery and
Aggravated Assault had a much higher rate in those same years than Manslaughter by
Negligence, the effect Manslaughter by Negligence had on the trends was almost
ignorable. Therefore, I chose not to include Manslaughter by Negligence in my overall
violent crime rate calculations for consistency across years.
As mentioned above, the crime rates before 1950 remained relatively low and
steady without showing any noticeable change, but they are worth briefly discussing. It
is interesting to note that property crime rates were slightly higher during the 1930s than
the 1940s, whereas violent crimes were slightly lower during the same period (see Figure
1). The former was consistent with what would have been predicted given the economic
hardship during the Great Depression of the thirties and World War II of the early forties,
which, ironically, boosted our economy. On the other hand, it is interesting to see the
reversed pattern for violent crimes: that is, violent crime rates were lower during the
Great Depression than the war time when many members of crime-prone age groups (i.e.,
ages 18 to 25) were in the military.
16
The second half of the nineteen hundreds, however, can arguably be the most
important time period for the U.S. crime trends as the change in crime rates were quite
drastic. From 1951 through 1994, there was an overall long-term increase in the violent
crime rates and from 1951 through 1988 property crime rates also increased long-term
(see Figure 1). Most intriguing fact about this time period is that after the increase in
both violent and property crime rates there was a sudden change of direction, that is, a
decrease in both types of crime during the remainder of the nineties and into the new
millennium. What might have caused such a long-term increase in crime? Why did it
last for only forty years? What happened in the nineties or prior to this period, which
allowed for such a dramatic drop in the crime rates that continues even today? Before
answering these questions, it is necessary to compare Waco and a variety of other
geographic units to see whether the observed trends are unique to Waco or not.
Specifically, I compare Waco with the United States, the State of Texas, three major
cities of Texas (Austin, Dallas, and Houston), four neighbor cities of Waco (Bellmead,
Hewitt, Robinson, and Woodway), and Baylor University campus.
Waco versus the United States and Texas
The sixties and seventies seemed an unsettling time for Waco compared to the
United States and Texas. 1 The violent crime trend for Waco had three separate
noticeable surges in the crime rate compared to the generally steady increase of the
United States and Texas. While Waco’s crime rate was increasing overall during these
years, Figure 2a shows three instances where Waco’s trend deviated from those of the
U.S. and Texas. The observed difference might be due simply to the fact that Waco 1Comparisons start in the year 1960 as data prior to year 1960 were not as reliable for the United States and Texas
17
crime trend is based on only one city, whereas, both Texas and the United States’ trends
are a combination of many different geographic units’ (including cities) trends. That is,
one city such as Waco is more likely to show fluctuating crime rates than the national and
state trends that combine fluctuating crime rates of different places, which would cancel
each other out and result in a less fluctuating or smoother pattern. The property crime
trend of Waco also shows a couple of big surges in the late seventies when the U.S. and
Texas were just steadily increasing (see Figure 2b). The index crime trend of Waco
follows the Waco property crime trend as expected and has a few surges; whereas, the
U.S. and Texas index crime trends just steadily increase in the seventies (Figure 2c).
The main point of interest in the crime trends was during the second half of the
nineteenth century, when there was a sharp rise and fall of all types of crime in the
eighties and nineties, respectively. Waco had a drastic rise in violent crime as well as
property crime during the eighties, as did the United States and Texas. Then, in the early
to mid-nineties, specifically 1994 for Waco and 1991 for the U.S. and Texas, violent
crime rates started decreasing. Property crime rates, however, started decreasing in 1988
for Waco and Texas, and 1991 for the U.S. This observation tends to suggest consistent
rather than different crime trends across Waco, the United States, and Texas, while
Waco’s rate of increase and decrease tends to be larger (i.e., steeper) than the U.S. and
Texas. Because the trends are generally consistent across the three geographic units,
possible explanations for the increase and decrease in the crime rates might apply to all
three of them. In other words, if we had just seen Waco having the large increase in
crime and found that the U.S. and Texas did not increase during the same time period,
then we would focus on finding more of local, Waco-specific reasons for changes in
18
crime rates. However, since we saw the similar trends across the Nation, we can focus on
reasons that would apply to the whole nation.
Waco versus Three Major Cities of Texas: Austin, Dallas, and Houston
The violent and property crime trends of Austin, Dallas, Houston, and Waco were
also very similar to each other. All four cities had relatively steady crime rates
throughout the thirties, forties, and fifties. All four began rising in the sixties as was the
case with the U.S. as well as Texas; and all four cities began sharply decreasing in the
nineties (see Figures 3a and 3b). Waco is more comparable to Houston and Dallas than
Austin in the crime trends. It was interesting to see that Waco and Austin were the most
different when the two cities are the closest geographically of the four. Perhaps Austin
did not have as drastic increases and decreases in crime as Waco because it is the state
capitol and therefore more stable, as the state would put a higher emphasis on controlling
crime rates in the capitol. Furthermore, it was interesting to note that Waco had the same
high spike and subsequent fall in crime rates as Dallas and Houston. This further
supports the idea that whatever caused crime to start increasing in the sixties and then
drop in the nineties was big enough in scale to affect several large cities in the same
manner, though they are demographically different.
Waco versus Bellmead, Hewitt, Robinson, Woodway, and Baylor Campus
I first compare Waco with Bellmead in violent and property crime trends before
doing the same for the other cities (Hewitt, Robinson, and Woodway) and Baylor
University campus because Waco and Bellmead are more similar in crime rates to each
other than the others and thus graphs were drawn separately for the two comparisons. In
19
1985, Waco’s violent crime rates were going up, but have steadily been coming down
since 1994 as we saw in other geographical units above. Bellmead’s, on the other hand,
spiked up, after rapidly dropping in the late eighties, and show generally increasing
trends since 2001 (see Figure 4a). This is a complete opposite to Waco’s trends. The
property crime trends also show the same: that is, property crime rates have consistently
declined in Waco since 1988, whereas they have been generally increasing in Bellmead
overall since 1990 after a brief drop between 1987 and 1990 (Figure 4b). This is very
interesting given that Waco and Bellmead are located right next to each other. This
means one cannot use different geographical locations as the explanation for the different
crime trends. Perhaps it might be due to different policing practices or socio-economic
conditions, which requires further investigation.
Other cities next to Waco have very similar crime trends not only to each other
but also to Waco. Robinson and Hewitt had very large spikes in violent crime in the
early nineties that match with Waco’s high spike in violent crime, while Baylor
University campus shows a different trend, spiking in the early eighties (see Figure 4c).
Hewitt, Robinson, and Woodway’s violent crime rates stayed relatively steady after they
levelled out from the drop in late nineties, but in Waco’s rates we see a continual
decrease. Baylor University campus is not very similar to Waco as instead of a steady
decrease, Baylor actually has a relatively flat violent crime rate with little movement
through the nineties and two thousands.
However, for the property crime trends, Waco is actually very comparable with
Baylor campus as well as Robinson and Hewitt, as all follow the overall decreasing
pattern since the nineties (see Figure 4d). Woodway, however, is not as comparable with

20
Waco because it has a relatively steady trend through the 2000s and not an overall
decreasing pattern. During the first few years of the millennium, Waco and Baylor
experience a small rise in the property crime trends, before both continue decreasing
thereafter. Woodway also follows this small pattern of Waco’s during the first couple of
years of the new millennium. Currently, Waco’s property crime trends are still steadily
dropping and this pattern can also be seen in Baylor campus and Hewitt’s property crime
trends. Woodway and Robinson, however, have started a small upward turn in the last
couple of years.
Possible Explanations for Crime Trends
Waco’s crime trends have been found to be generally similar to those of the
United States and most other comparison units. This allows me to apply what previous
researchers have developed to explain the Unites States’ crime trends to Waco’s crime
trends. There are a couple of theories that I found to be the most applicable when
explaining the increase in crime rates. One theory, by Robert M O’Brien (2003),
suggests that the increase in crime is partially due to the changes in reporting and the
better efficiency of recording and reporting crimes. The other theory, by Gary LaFree
(1998), suggests that the rise in crime is due to the breakdown of social institutions in the
United States.
First, in his article “UCR violent crime rates, 1958 – 2000: recorded and offender-
generated trends,” O’Brien (2003) points out that the homicide crime rates did not change
overly much during the 1970s to 1990s period, whereas the crime rates of rape, robbery,
and aggravated assault increased steadily throughout this period. The significance of this
argument is that if some external reason was causing crime rates to increase everywhere,

21
the rates of homicides should have increased in the same way. O’Brien’s argument is
supported by Figure 5, which depicts Waco’s violent crime’s individual rates. Whereas
there is an increase for Waco’s violent crime rates overall, there is not a clear trend for
Waco’s homicide rates between 1970 and 1990. The homicide rates go up and down
with only a slight increase overall. To even notice this trend, however, I had to multiply
the homicide crime rate by a constant, 50, for each year, so that the graph created would
be comparable with the other violent crimes. I also multiplied the forcible rape rate by 10
for each year and the robbery rate by five. Between 1970 and the 1990s, there was a
major increase in all three categories of forcible rape, robbery, and aggravated assault.
Therefore, the homicide crime rate of Waco did not change as much as the other violent
crime rates.
These violent crime rates reveal, as O’Brien suggested, that the sudden increase in
rapes, robberies, and aggravated assaults had more to do with the increased efficiency of
reporting than with an actual increase in crime. Since homicides are the least likely crime
to go unreported or unnoticed, it is highly unlikely if all violent crimes were increasing
that homicides would not be reported. O’Brien goes on to point out, the “Justice
Department embarked on a major effort to help local police departments improve their
record-keeping, and officers on the beat began spending more time on paperwork”
between 1973 and 1988, which just happens to line up perfectly with the increase in
violent crime rates (p. 505). His argument might also extend to property crime rates.
That is, it is possible that the increased efficiency in reporting might have attributed to the
large increase in property crimes as well. But because, there is not a clear way to prove
this, O’Brien’s argument may apply only to violent crime rates.

22
One of the most interesting theories regarding the rise in the overall crime rates
was proposed in a study conducted by Gary LaFree (1998) on the collapse of social
institutions across the United States. He defines an institution as a “patterned, mutually
shared way that people develop for living together” which can be seen in political,
economic, or familial structures. In his book, Losing Legitimacy: Street Crime and the
Decline of Social Institutions in America, LaFree (1998) first established that there are
three main postwar periods of crime rates: “an early period (1946 – 1960) with stable,
low crime rates; a middle period (1961 – 1973) with rapidly accelerating crime rates; and
a late period (after 1973) with stable, high crime rates” (p. 6). He used data from several
different sources such as the UCR and the National Crime Victimization Survey (NCVS)
to gather information on the crime trends of the United States.
Analyzing the data, he was able to review gender/race characteristics and
concluded that any plausible explanation of the crime trends must explain why the crime
rates for young, black males were so much higher than others of the same age but of a
different race. He explains this through one of his theories that the legitimacy of
economic institutions have left behind a large portion of the African Americans in their
improvements, which causes some to have no recourse but to repeatedly commit crimes.
He further argues that political institutions affect crime rates through the periods of
political distrust, as can be seen by the higher crime rates in the 1960s and 1970s. As
seen in this time period, there was a great deal of social/political unrest due to the civil
rights movement and the Vietnam War. Therefore, LaFree argues, when the public is
generally satisfied with the government’s actions, the crime rates are lower.

23
Families also influence crime rates through their ability to directly influence the
individual. LaFree suggests that there was a strong push for individualism in the post war
period (seen through the hippie and feminist movements) that affected the family
structure across the board. As divorce became more acceptable throughout the nation in
the 1970s and after California instituted the first “no fault” divorce laws, the amount of
single parents skyrocketed (p. 142). LaFree directly correlates this breakdown in the
familial institution to higher crime rates, because the people who are unhappy with their
home life (especially children from broken homes) will be more likely to commit an
offense. LaFree concludes his book by suggesting that the fastest way to reduce crime is
to increase the trust in political institutions, reduce economic inequality (especially for
African Americans), and renew the family structure.
After focusing on what could have caused the crime trends to go up, it is
interesting to note the theories behind why the crime rates have dropped so drastically in
the last twenty years. In his article “Understanding Why Crime Fell in the 1990s: Four
Factors that Explain the Decline and Six that Do Not,” Economist Steven D. Levitt
(2004) suggests that the main reasons crime declined so rapidly is due to the increase in
the number of police, the rise in prison population, the receding crack epidemic, and the
legalization of abortion. Levitt first argues that the “number of police affects the amount
of crime, but the amount of crime also affects the number of police” (p. 176). As the
public perceived a large increase of crime, the government and politicians responded by
adding more funding to police departments, which allowed police departments to increase
in size and directly affected their presence on the street. Just their presence alone would
deter crime, which is why Levitt argues this factor as a main reason for the drastic drop in

24
crime rates. Secondly, he argues that the increased incarceration rates removed the
perpetrators committing the crimes from the public presence as well as acting as a
deterring effect. Because the increase in the prison population during the 1980s and
1990s rose drastically and the government incarcerated over a million people, this factor
is another large cause of the crime rate drop in the 1990s (p. 177).
The third factor Levitt found to likely have an effect on the crime drop was the
receding amount of crack being sold in the 1990s. The crack market created large
amounts of gang violence in the 1980s after it was introduced and accounted for a large
number of male homicides under the age of 25. So as this market decreased, the amount
of homicides being committed also decreased. For his final factor, Levitt argues that the
legalization of abortion attributed to a large portion of the drop in crime rates. He points
out that abortion led to a “reduction in the number of unwanted births” and that
“unwanted children are at greater risk for crime” (2004, p. 182). Therefore, when the
amount of unwanted children began decreasing, the amount of crimes these children
would have possibly committed did not happen, thereby causing a decrease in the crime
rates. He also points out that there was a large decline in infanticide as well after
abortion was legalized. Levitt concludes his article with the assumption that only
increases in police forces and the continuation of abortion will lead to further declines in
crime rates, as prison populations and the crack market have stabilized.
Two other theories introduced in Alfred Blumstein and Joel Wallman’s edited
book The Crime Drop In America (2006) look at policing and economic opportunity. In
the chapter about the role of policing, John E. Eck and Edward R. Maguire explain that
changes have been made in policing in the last fifty years by putting a greater emphasis
25
on having more officers in the field, better community policing, and zero-tolerance
policing. However, some critics argue that better community and zero-tolerance policing
will not have long-term effects on the decline of crime rates. Increasing police presence
seems to be the only option likely to have any relevant effect on crime rates (as pointed
out by Levitt above). Unfortunately, researching police numbers to help prove this
argument is almost impossible, according to Eck and Maguire, as the data available is
extremely inaccurate and therefore it is hard to say.
In another chapter, Jeff Grogger proposed more of a believable thesis in his
discussion on economics. He argues that because most crimes are committed for
economical purposes, having shifts in the economic markets such as the introduction of
crack and the rise and fall of wages could easily explain why crime was stable in the
1940s and 1950s with a good economy and better wages. Additionally, the sharp rise of
crime as crack came onto the scene and wages fell in the 1960s – 1980s and when crack
started to decrease from the market as well as the increase of wages in the late 1980s –
1990s, there was a sharp decrease in crime.
While largely speculative, it is possible that some of the theories mentioned above
such as the rise and decline of crack, legalized abortion, and increased incarcerations
might also have had impacts on the Waco crime trends specifically. Crack could have
accounted for a portion of the rise of violent crimes in Waco in the seventies and eighties.
While if there was an increase in the rate of abortions and incarcerations in Waco, these
theories could be an explanation for the dramatic decrease of crime rates in the nineties.
However, the theories that can help continue the decrease in crime seen in Waco over the
last twenty years are the suggestions of increasing the number of police, working on

26
helping to restore familial institutions, and raising wages. Altogether, these different
theories help highlight possible explanations for why crime increased so drastically
during the sixties through the end of the eighties as well as provide possible explanations
for the rapid decrease in the crime trends.

27
CHAPTER FOUR
Rate of Change in Crime Rates of Waco, 1960 – 2013
Waco versus the United States and Texas
As shown in Figure 2a, Waco has had higher violent crime rates than those of the
United States and Texas until recently. Specifically, since 1960 Waco has consistently
had higher rates of violent crimes in the last fifty years or so (see Table 1). However, in
2013 Waco’s violent crime rate (404) decreased to the level of Texas (400), while being
higher than the rate of the U.S. (368). Between 1960 and 1994, when the violent crime
rate of Waco reached a peak, Waco’s violent crime rates increased by more than
threefold (347.60%), which was also the case with the U.S. (343.60%) and Texas
(338.68%) as shown in Table 3a. So even though Waco showed a consistently higher
violent crime rate than the U.S. and Texas during this period, the rate of increase in the
violent crime rate was actually not much higher than the U.S and Texas. Additionally, as
Table 3b shows, a reduction in the violent crime rates of Waco (1,212) between 1994 and
2013 was more than four times faster than that of the U.S. (346) and Texas (307).
Reduction equals the difference between the crime rates of the two years being compared.
So for example: Waco’s violent crime rate was 1,615 in 1994 and 404 in 2013 (Table 1).
Therefore the reduced amount from 1994 to 2013 for Waco would equal 1,212 (1,615 –
404 = 1,212). It was a result of this rapid reduction that Waco’s violent crime rate in
2013 (404) was not very different from the U.S. (368) and Texas rate (400).
28
For property crime rates, Waco has also had a consistently higher crime rate than
the U.S and Texas from 1960 through 2013. As Table 1 and Figure 2b shows, the
property crime rate of Waco reached a peak in 1988, when the rate was 208.05% higher
than 1960, whereas that of the U.S. and Texas were 192.76% and 258.19% higher,
respectively (also see Table 3a). The rate of increase in Waco was about 15 percent
higher than the U.S., but 50 percent lower than Texas. It is noteworthy that Waco has
had a higher property crime rate than Texas throughout the 29-year period, but property
crime rates did not increase in Waco as fast as it had in Texas. Furthermore, Waco has
had the larger reduction in property crime rate between 1988 and 2013 (7,699 = 11,949 –
4,250) not only than Texas (4,107 = 7,365 – 3,258) but also the U.S. (2,323 = 5,054 –
2,731) since the peak year 1988 to 2013, when the gap is the smallest since 1978. If this
trend continues, Waco will soon be at the same or even a lower level of property crime
rate than the U.S. and Texas.
As for the index crime rate, since it is a combination of the violent and property
crime rates, it has also stayed at a higher rate than both the United States and Texas, but
drawn closer to the levels of Texas and the U.S. more recently (see Figure 2c). Between
1960 and 1988, Waco had 204.66% increase in index crime rate , while the U.S. and
Texas had 201.75% and 261.60%, respectively (Table 3a). In the peak year for Waco
(1988) the index crime rate was 12,918, whereas the U.S. was 5,695 and Texas 8,018.
However, in 2013 Waco’s index crime rate was 4,654, while the U.S. and Texas had
3,099 and Texas was 3,658, respectively (Table 1). As shown in Table 3b, Waco had
index crime reduced by 8,264 between 1988 and 2013, which was much greater than the
U.S. (2,596) and Texas (4,360). Because the index crime rate is so similar to the property

29
crime rate of any given geographical unit, in the following sections I will focus on only
comparing the violent and property crime rates.
Waco versus Austin, Dallas, and Houston
During the late thirties through the end of World War II and the Korean War
(1950 – 1953), Waco had lower violent crime rates than three major cities in Texas:
Austin, Dallas, and Houston (see Figure 3a). Between 1930 and the early 1960s, violent
crime rates in Waco tended to be similar to those in the three cities, being higher in some
years and lower in other years. Of those years, 1953 was a peculiar year for Waco in
comparison to the other cities, as Waco had a sudden spike in the violent crime rate,
whereas all the other cities had a sudden drop in violent crime rate. Since then, violent
crime rates in Waco have never stayed lower than those of the larger cities for a long
period of time, as they did from 1930 to 1952 (Table 1). What could have caused such a
large spike in crime? This year is very interesting, because up until this point, the
property crime rates of Waco remained significantly lower than the other three cities
(Figure 3b). However, in 1953, Waco caught up to the three and thereafter stayed
relatively close to their levels of property crime.
One possible reason for the sudden spike in crime could be the F-5 tornado (rated
in the top ten of the deadliest in U.S. history) that hit Waco on May 11th, 1953.
According to a radio script titled “Waco Tornado Script for KWBU/NPR” by Hans
Christianson, an Austin freelancer, “114 people were killed, 600 were injured . . . 2,000
vehicles and 1,000 homes and businesses were damaged along with 600 more completed
destroyed. The final damage bill . . . around $50 million” (2010, p. 1). One would
expect lawlessness to rise in the wake of such devastation as thousands of lives were

30
upturned and people displaced from their homes. An increase in violent crimes and
property crimes is not unexpected in the wake of such a vast disruption in the economic
and social structure of Waco.
From the sixties through the nineties, there was not a significant variation in the
property crime rates for Waco, Austin, and Houston (see Figure 3b), whereas Dallas
pulled away from the group with a large spike in 1969 and continued to have much
higher rates than the other cities until 1992. In 1996, Waco had a higher rate of property
crime than the large cities for the first time since 1963, before quickly falling back down
under the crime rate of Dallas for the last few years of the millennium. During the 2000s,
Waco and Dallas have had the higher property crime rates until recently in 2010 when
Austin and Houston surpassed them. As shown in Table 1 and Table 4a, from 1960
(3,879) through 1988 (11,949) Waco had a property crime rate of increase of 208.05%,
which was less than Austin (250.64%), Dallas (380.93%), and Houston (238.98%).
However, between 1989 and 2013, Waco experienced the second highest amount of
reduction (7,350) of property crimes, with Dallas experiencing the most reduction
(10,411). Austin and Houston saw similar reductions in property crimes of 5,264 and
4,590 respectively (Table 4b). The most recent data shows the property crime rate of
Waco (4,250) was lower than Austin (4,850) and Houston (5,087) and similar to Dallas
(4,165), which was the lowest of all (Table 2).
The violent crime rates of Austin, Dallas, Houston, and Waco from the sixties and
the nineties were similar to what was just described for property crime rates. That is,
Dallas pulled away with the highest in 1969 and remained so all the way through 1994.
Austin kept a consistent pace with the lowest amount of violent crime starting in 1971,

31
leaving Waco and Houston to battle back and forth before Houston in 1979 stayed at a
higher rate for thirteen years (see Figure 3a). The biggest increase in crime for all four
cities was from 1983 through 1991, so I decided to compare the cities on a rate of
increase. As shown in Table 4a, Waco (108.31%) has a comparable rate of increase for
violent crimes with Dallas (123.49%), but has a much higher rate of increase than both
Austin (55.05%) and Houston (73.75%) for these eight years. Moreover, between 1992
and 2013, Waco and Dallas had large reductions of violent crimes (856 and 1,408
respectively), whereas Austin (225) and Houston (502) had much smaller reductions
(Table 4b). Beginning to decline in 1994 and since 1996, violent crime rates in Waco
have remained lower than Dallas and Houston, but closer to Austin’s rates.
Waco versus Bellmead, Hewitt, Robinson, Woodway, and Baylor Campus
The violent crime rates of Waco and Bellmead were not only much higher than
the other adjacent cities but also opposite in trends as Waco rates decreased and Bellmead
rates increased, I begin with comparing Waco and Bellmead. The violent crime rates of
Waco were higher than those of Bellmead from 1985 through 2001, except for the year
1995 (see Figure 4a). Since 2002, however, violent crime rates in Bellmead have
increased, remaining higher than those in Waco, which showed a declining pattern. The
same was found for property crime rates of Waco and Bellmead: that is, the rates in
Waco have consistently declined since 2002, remaining lower than the rates in Bellmead
that continued to increase (Figure 4b). Between 1985 and 2013, Bellmead’s violent
crime had a rate of increase of 241.03% and property crime of 54.75% (Table 5a). Waco,
on the other hand, had a percent reduction of 45.59% in its violent crime rate and 49.67%
in its property crime rate during the same time period.

32
As expected, Baylor University campus had the lowest violent crime rate of all
the small jurisdictions adjacent to Waco, but did not have the lowest property crime rate
(see Figure 4c). Between 1985 and 1992, Hewitt and Robinson had an increase in their
violent crime rates of 242.52% and 390.72% respectively, while Baylor had a reduction
of 23 in its violent crimes (Table 5b). From 1998 to 2013, Woodway, Robinson, Hewitt,
and Baylor violent crime rates were similar to each other as seen in Figure 4c. For
property crime rates, Baylor campus had the highest rates in 1984, 1988, for a few years
in the late nineties, 2002, and 2003 (Figure 4d). From 2004 to 2008, Robinson had the
consistently higher property crime rates ranging anywhere from 1,629 to 2,733; whereas
Hewitt ranged from 1,451 to 2,029, Woodway from 1,495 to 1,858, and Baylor from
1,418 to 1,996 (Table 3).
It is noteworthy that while Baylor campus has had the lowest violent crime rates,
its property crime rates were actually consistent with those of the surrounding cities. One
possible explanation for this occurrence is that Baylor campus has a similar population to
those of the smaller cities and therefore could have a similar ratio of people committing
the property crimes. Additionally, one could speculate that due to the constant
population turnover that comes with being a college campus, the students are not going to
notice one extra person they do not know. Therefore, someone with malicious intent
could easily blend in with the college crowd and commit a property crime without anyone
noticing. Furthermore, a college campus with a concentrated population of students who
have a lot of valuables might have been a popular target for property crimes.

33
CHAPTER FIVE
Explaining Crime Trends: A Social Disorganization Approach
In their article “Community Structure and Crime: Testing Social-Disorganization
Theory,” Robert J. Sampson and W. Byron Groves (1989) test a theory built on Shaw and
McKay’s (1942, 1969) theory of social disorganization. Results from testing hypothesis
led them to conclude that “communities characterized by sparse friendship networks,
unsupervised teenage peer groups, and low organizational participation had
disproportionately high rates of crime and delinquency” (p. 799). An interesting finding
to note about Sampson and Groves’ study was that socioeconomic status and family
disruption had a negative effect on teenage street-corner groups, whereas heterogeneity
had positive effects. This means that a neighborhood’s economic status along with the
disruption of families in the area contributed to the formation of teenage street-corner
groups in a community, thus leading to juvenile delinquency, but that the heterogeneity
of the neighborhood did not help contribute as might be expected. Therefore, when
looking at the community-level to determine causes of crime or places of prevention, one
must look at the heterogeneity demographics, along with socioeconomic status and
family disruption rates.
Robert J. Bursik (1988) wrote an article called “Social Disorganization and
Theories of Crime and Delinquency: Problems and Prospects” that lays out five main
criticisms of Shaw and McKay’s social disorganization model as well as recent attempts
to solve those issues. Criticism number one of the social disorganization model when it
34
first was introduced was that it focused on a group, but the studies generally done at that
time were focused more on the individual. Therefore, it was more difficult to base
findings on aggregate data. Recently, however, studies have shown that combining the
two methods of looking at the “relative effects of individual and community
characteristics on the likelihood of illegal behavior” has become an important extension
of the theory of social disorganization and thereby “broadened the scope of traditional
theories of victimization” (p. 524).
Criticism number two was the assumption of stable ecological structures.
However, as data continued to show, most cities did not have the same ecological
structures as each other and therefore most attempts at comparison with another city with
different social histories of development were difficult at best. For a reappearance of the
social disorganization theory, the perspective had to change to include an “emphasis on
the dynamics of urban change and their reflection in changing spatial distribution of
crime and delinquency” (p. 525).
Criticisms number three and four had to do with the measurements of social
disorganization as well as crime and delinquency. Few seemed to know exactly how
social disorganization was supposed to be measured or exactly what the concept was and
how it differed from disorganization in general. Eventually some researchers have
attempted to define social disorganization “in terms of the capacity of a neighborhood to
regulate itself through formal and informal processes of social control” (p. 527). At
present, researchers have to study a few small communities (almost impossible with large
communities) to feasibly obtain any direct indicators of social disorganization. On top of
researchers struggling to measure social disorganization, accurate data collected on crime
35
and delinquency was also difficult to find. Areas with higher socioeconomic status could
possibly have crimes going unreported due to low focus from law enforcement as they
were primarily focused on lower socioeconomic areas. Perhaps there is only a perceived
higher rate of delinquency in the poorer areas due to more people being apprehended,
because police are not focused on the higher socioeconomic areas. However, this idea
that police decision-making biases distorts the data does not mean that it is the primary
reason behind the data pointing to higher crime rates in lower socioeconomic areas. It is
something researchers have to consider.
Criticism number five has to do with the normative assumptions of social
disorganization. The importance of this criticism is, first, that researchers cannot always
assume that a general consensus of a neighborhood exists on how serious an offense is
perceived. It is impossible to measure a community’s goals and abilities to achieve that
goal if no general agreement can be demonstrated. Second, this criticism points out that
the model as it has been generally used in the past is too narrow in scope and needs to be
expanded to include more than just the community as effecting crime in that community.
Outside forces such as local government that control zoning and housing policies can also
have a strong effect on the crime of a community.
Therefore, Bursik concludes with the notion that the neighborhood/community
needs to be used as contextual evidence for the individual’s actions. If the community
has a strong familial structure and more control over the peer influence teenage “street-
corner” groups, then there is a less likely chance of juvenile delinquency than in a
community without a good structure. Even if a community is more affluent, it could still
36
have higher delinquency rates than a less affluent community if the less affluent
community had more stability.
Robert J. Sampson (1995) also wrote a book chapter titled “The Community” on
the importance of community, which ties in with the above authors. Sampson studies the
factors that play into what communities have higher crime rates than others. It was
interesting to note that a high mobility rate (or population turnover) of a community had
twice as much crime than another community with a low mobility rate regardless of the
socioeconomic status of the communities. Sampson also said that the racial composition
of a neighborhood was not the main factor in whether or not that neighborhood
experienced more crime. This is important because most people (including myself)
would assume that a lower socioeconomic neighborhood with a high minority rate equals
more crime. But those two factors according to Sampson are not the main reason behind
the higher crime rates, because when the socioeconomic status is equalized between non-
Hispanic whites and others Sampson discovered there was little difference in crime rates.
However, the areas with more households led by females or family disruption saw more
crime than the areas of family stability (regardless of race or socioeconomic status).
Finally, Sampson coauthored with William Julius Wilson (1995) to write a book
chapter called “Toward a Theory of Race, Crime, and Urban Inequality” that focuses on
how race and crime interacts. Sampson and Wilson found that, as stated above, the
family structure had more of an effect “on juvenile violence than on adult violence” (p.
40). White families led by a female led to juvenile crime as much as black families in the
same position. The combination of urban poverty and family disruption, however, was
found to be disproportionate between the races. The percentage of white families living

37
in urban poverty (concentrated together) was extremely low compared to black families.
Therefore, Sampson and Wilson concluded that the structural social disorganization and
the cultural social isolation were the most important determinants of the relationship
between crime and race and were a direct result of the concentration of poverty, family
disruption, and residential instability.
After reading the above scholarly works, I decided to gather data on the
heterogeneity, family disruption, socioeconomic status, and population turnover rates of
Waco. Once data on the four variables are collected, I can then explore whether or not
those characteristics tend to vary together with the changes in crime rates in Waco. The
above research suggests that I find all four characteristics, particularly family disruption
to coincide with the crime trends.
As reported in Chapter Two, I was unable to collect enough data on the
population turnover statistics of Waco for comparison with the crime rates. However, I
could find enough data on the other three characteristics of racial heterogeneity, family
disruption, and socioeconomic status to compare with the crime trends of Waco. In the
remainder of this chapter I will discuss each characteristic separately in relation to crime
trends of Waco.
Section 1: Racial Heterogeneity and Crime Trends of Waco
To measure the racial heterogeneity of the City of Waco, I collected data on two
indicators: % Black or African American and % Hispanic or Latino. I focused on these
two groups since other racial/ethnic minorities such as Asians, Pacific Islanders, and
American Indians or Alaska Natives in Waco are too small in number to provide reliable
data for comparisons with Waco crime trends.

38
As shown in Figure 6, the % Black or African American residents in Waco
gradually increased from 1960 through 1990 and then slightly decreased thereafter. This
coincides most with the property crime trend, but it also aligns with the increase and
decrease of violent crime over the six decades. The other indicator of racial
heterogeneity, % Hispanic or Latino residents, on the other hand, did not match the
overall property and violent crime trends of Waco. The percentage of Hispanic residents
in Waco rapidly increased since 1970, surpassing that of African American residents just
before the new millennium and continuing to rise at a sharp rate through 2010. Thus its
direction after 1990 was the opposite of the property and violent crime trends.
These findings are interesting for two reasons. First, while a claim could be made
that the observed similarities between the trends of racial heterogeneity and crime are
coincidence, the observation is consistent with what social disorganization theory posits:
that is, the crime trends varied together with the percent of African American residents in
Waco. The positive association between % African American and crime rates observed
at the city level, however, should not be interpreted as indicating such association at the
individual level (i.e., Blacks committing more crimes than non-Blacks in Waco), which
would be ecological fallacy. Second, on the other hand, the other measure of racial
heterogeneity, % Hispanic, increased between 1960 and 1990, like both crime trends, but
continued to do so afterwards, unlike the crime trends that began to slowly decline after
1990. Given the inconsistent findings between the two measures, too much weight
cannot be given to racial heterogeneity being the sole cause of crime as there are other
factors that must have contributed to the violent and property crime trends of Waco.

39
Section 2: Family Disruption and Crime Trends of Waco
In order to measure family disruption, I collected data not only on divorce rate but
also % female-headed households in Waco given that divorce tends to result in female-
headed households. In fact, social disorganization researchers commonly use both as a
measure of family disruption. Unfortunately, though, I was unable to gather sufficient
data for each measure for all six decades as the Census data recording system changed
over the decades. However, I was able to cover each decade, using one of the two, and
compare what I could find with Waco violent and property crime trends (see Figure 7).
As shown in Figure 7, the divorce rate sharply increased between 1960 and 1980
while the households led by females increased from 1980 to 1990 followed by a
noticeable decrease in 2000 and a small increase in 2010. In comparison with Waco
violent and property crime trends, an increase in the divorce rate between 1960 and 1980
corresponds to the increase in both violent and property crimes over the same period.
The female-headed household statistics also closely align with the violent crime trends,
with the only difference being in the last ten years as the female households increased
and violent crime continued (albeit less sharply) to decrease. The female-headed
household data also lined up somewhat with the property crime trends, but not as much
for 2000 and 2010.
The results, while based on bivariate analysis of limited data, were in line with
what was expected. That is, the crime trends of Waco generally were similar to the
changes found in the indicators of family disruption in Waco. This result is consistent
with the Sampson’s (1995) argument that family disruption plays a large part in crime
causation.

40
Section 3: Socioeconomic Status and Crime Trends of Waco
For the indicators of socioeconomic status of community that social
disorganization theory suggests contribute to community crime rate, I looked at the %
Unemployed, % persons below poverty level, and the median household income. I was
actually able to find almost every decade needed for each indicator, except for persons
below poverty level of 1960. As shown in Figure 8, the pattern of % Unemployed
coincides the most with the violent and property crimes – with the exception of the year
2000 when % Unemployed was still increasing despite the crime trends had already
begun decreasing, which it might indicate lagged effect of % Unemployed on crime. The
indicator of % persons below the poverty level also tended to vary together with the
crime trends of Waco, except for the most recent decade (2010) when the percentage
increased while crime continued to decrease.
Similarly, the median household income could also be argued to have contributed
to violent and property crimes in Waco since 1990 as it continued to rise in the last three
decades when crime rates were declining. However, patterns of 1970 and 1980 do not fit
this observation since median income, violent crime, and property crime all increased
between 1960 and 1990.
Taken together, the results from comparing the Waco crime trends with changes
in the social disorganization indicators tend to provide a partial support for the theory as
proposed by Sampson and Wilson (1994) and Sampson (1995): that is, family disruption
and poverty tend to have more of an impact on crime rates than racial heterogeneity.
Figures 7 and 8 illustrate how indicators of family disruption and poverty in Waco might
have contributed to Waco crime rates, although Figure 6 shows mixed findings about
41
racial heterogeneity. Perhaps the mixed finding might lend some support to Sampson’s
(1995) argument that racial/ethnic minority groups living together in a highly
concentrated impoverished area with a high family disruption contribute to crime rates
rather than racial/ethnic heterogeneity in and of itself as original social disorganization
theory suggested.

42
CHAPTER SIX
Conclusion
Throughout this research process, the aim has been to examine Waco’s crime
trends of the past eighty-four years (1930 – 2013) in comparison with the United States,
Texas, and other cities in Texas. This research is important because the findings and
observations made can shed a light on the reality of crimes in Waco. Examining violent
and property crimes separately as well as combined, I found the crime rates of Waco to
have been decreasing faster than the rates of other geographic units of comparison over
the last twenty years. I also made an observation that Waco’s crime rates are lower than
those of Dallas and Houston in recent years. These are welcome discoveries because not
only many people outside but also residents of Waco would learn that the crime rates of
Waco are not as high as they thought as a result of this thesis believed to be the first study
on long-term crime trends of Waco. Even when compared to the national and state rates,
Waco’s crime rates have been decreasing at a greater rate and as of 2013 the violent
crime rate (404) is practically even with that of the State of Texas (400), though
somewhat higher than the national rate (368). If the trend continues, Waco is on a path to
having a lower crime rate than the national and state averages, as well as a lower crime
rate than the main cities of Texas. However, it is something to wait and see in coming
years.
Besides the long-term crime trends, I was interested in exploring what
sociodemographic characteristics of Waco might have been associated with the crime

43
rates based on social disorganization theory. Chapter Five provided an overview of the
racial, familial, and economic characteristics of Waco over the last five and half decades,
although the analysis was limited due to the fact that each social disorganization indicator
was examined separately rather than simultaneously. Having said that, it was interesting
to see that changes in Waco crime rates were generally similar to those in the percentage
of African American residents or those unemployed in Waco, which is consistent with
what the social disorganization theory posits. However, family disruption, measured by
% female-headed households, along with poverty, measured by % people living under
poverty line, as suggested by Sampson (1995), tended to be the more likely sources of
crime in Waco than racial heterogeneity.
Fifty years ago the citizens of Waco were experiencing a continuous rise in the
crime rates. Therefore, those living in Waco, especially between 1965 and 1985, would
have seen more crimes committed or would have lived through more turbulence and
violence than anyone of the current generation. However, the current generation fondly
dubbed the “Millennials,” with the help of the Internet and social media has access to
more graphic news stories and replay videos of crimes as to build the misbelief that Waco
is a very dangerous place to live. Then when a rare singularity happens such as the tragic
event of the biker gang shooting at Twin Peaks that happened at the beginning of the
summer of 2015, the belief that Waco has high levels of crime might have been further
reinforced. Not only does an event like Twin Peaks get splashed over every local news
station and social media outlet, it also receives national attention which then becomes one
of the only things outsiders may ever know about Waco.
44
However, the findings of this thesis empirically demonstrate that not only was the
above described event a singularity, but also that the widespread belief that Waco has
high crime rates is a misconception. In fact, the Uniform Crime Report data of recent
years show that Waco is actually much safer to live in than Dallas or Houston and is
almost equal with that of Austin. Also the fact that crime in Waco has a faster reduction
rate than any other larger city, the state, and the nation is incredible! If the recent trends
continue, Waco may become one of the safest cities in Texas. While there is room for
improvement, overall Waco is not as dangerous of a city, as is popular belief.
This brings us to the question of what kinds of changes in Waco might have
brought about this relatively fast reduction in crime and what factors would help continue
this course, further bringing down the crime rates. According to my research, family
disruption seems one of the major contributors of crime in Waco, as social
disorganization scholars would agree. Helping to foster strong family bonds and creating
community networks to help support families would be an important aspect of keeping
the current crime trend going. Other factors that may affect Waco crime rates for the
better are the many volunteer and non-profit groups that give relief and support to those
in need. Many Baylor students, for example, participate in a volunteer program called
“Steppin’ Out” twice a year to help clean and repair Waco’s most impoverished areas.
The impact of these types of services on the reduction of crime cannot be ignored.
Overall, finding a way to strengthen family bonds, creating better community networks,
and continuing services to help those in dire need are likely to all work together to
continue Waco’s decrease in crime rates.
45
One of the more interesting discoveries of this thesis has been the facts about the
neighboring cities of Waco. While Waco’s crime rates have been steadily decreasing
over the last twenty years, the City of Bellmead’s crime rates have been increasing. This
was surprising since Waco and Bellmead are adjoining. I speculate that Bellmead might
have higher family disruption rates or more citizens below the poverty line than Waco,
which is a topic for future research. Robinson has higher crime rates than Hewitt or
Woodway, but all three of them had much lower crime rates than Waco or Bellmead.
While Waco has been known to be a high-crime city, which has turned out to not
be the case, how about Baylor University campus? The most interesting finding about
the campus is that Baylor actually has extremely low violent crime rates and much lower
property crime rates than Waco. Future Baylor students and their parents should feel
comforted in the fact that Baylor is a safe place to live and not only that, but Waco itself
is much safer than they might have heard. Even though my research is limited in that I
did not compare it with other university campuses, those looking to enroll as well as their
parents will be pleased to know that violent crimes are very minimal (average of 5 violent
acts in a year) and their main worry will only need to be “Can I find parking in time to
get to class?” Altogether, Baylor campus in comparison with the surrounding towns has
a lower rate of violent and property crimes than any other surrounding town in years
recent.
Some limitations of this research that readers should keep in mind include, first,
my analysis being limited to a bivariate analysis instead of a multivariate analysis.
Second, I was limited in my ability to find sufficient data to conduct equal comparisons
especially of Waco demographics. Finally, this research only made comparisons on a

46
relatively small scale (i.e. three large cities, four small cities) that might limit the analysis
that could be made with a larger data pool.
In the future, it would be interesting and important for researchers to look into the
areas of neighborhood-level crime rates in Waco and see not only how crime rates differ
among Waco neighborhoods, but also whether observed neighborhood differences in
crime rates can be attributed to their differences in indicators of social disorganization
(i.e., family disruption, poverty rate, racial heterogeneity). It would be also interesting to
see whether what I found in this study would be confirmed by a larger scale project that
would allow for a multivariate analysis, taking all of the major sociodemographic
indicators into account at the same time.
Despite the limitations acknowledged above, the most important finding of this
research is that the City of Waco has seen larger reduction in crime rates since the
nineties than any other group it has been compared with. Waco residents as well as the
police department seem to be doing a good job at controlling and reducing crime,
contrary to what popular belief might suggest. Strengthening the family unit and forming
strong community networks will further help to reduce crime along with continuing
efforts to alleviate poverty. Altogether, I hope and anticipate that in a near future Waco
becomes one of the safest cities to live in in Texas.

47
APPENDIX

48
APPENDIX
Figures and Tables
‐
2,000
4,000
6,000
8,000
10,000
12,000
14,000
16,000
18,000
1930
1933
1936
1939
1942
1945
1948
1951
1954
1957
1960
1963
1966
1969
1972
1975
1978
1981
1984
1987
1990
1993
1996
1999
2002
2005
2008
2011
Figure 1. 1930 - 2012 Waco Crime Rates
Index Crime Rate Violent Crime Rate Multiplied By 10 Property Crime Rate
‐
200
400
600
800
1,000
Figure 1a. Waco Original Violent Crime Rate Without Manslaughter by Negligence vs. New Rate With It Included
Original Rate New Rate

49
‐
200400
600800
1,0001,200
1,4001,600
1,800
1960
1962
1964
1966
1968
1970
1972
1974
1976
1978
1980
1982
1984
1986
1988
1990
1992
1994
1996
1998
2000
2002
2004
2006
2008
2010
2012
Figure 2a. Violent Crime Trends of Waco, the United States, and Texas
Waco U.S. Texas
‐
2,000
4,000
6,000
8,000
10,000
12,000
14,000
1960
1962
1964
1966
1968
1970
1972
1974
1976
1978
1980
1982
1984
1986
1988
1990
1992
1994
1996
1998
2000
2002
2004
2006
2008
2010
2012
Figure 2b. Property Crime Trends of Waco, the United States, and Texas
Waco U.S. Texas

50
‐
2,000
4,000
6,000
8,000
10,000
12,000
14,000
1960
1962
1964
1966
1968
1970
1972
1974
1976
1978
1980
1982
1984
1986
1988
1990
1992
1994
1996
1998
2000
2002
2004
2006
2008
2010
2012
Figure 2c. Index Crime Trends of Waco, the United States, and Texas
Waco U.S. Texas
‐
500
1,000
1,500
2,000
2,500
3,000
1930
1933
1936
1939
1942
1945
1948
1951
1954
1957
1960
1963
1966
1969
1972
1975
1978
1981
1984
1987
1990
1993
1996
1999
2002
2005
2008
2011
Figure 3a. Violent Crime Rates of Waco and Large Texan Cities
Waco Austin Dallas Houston
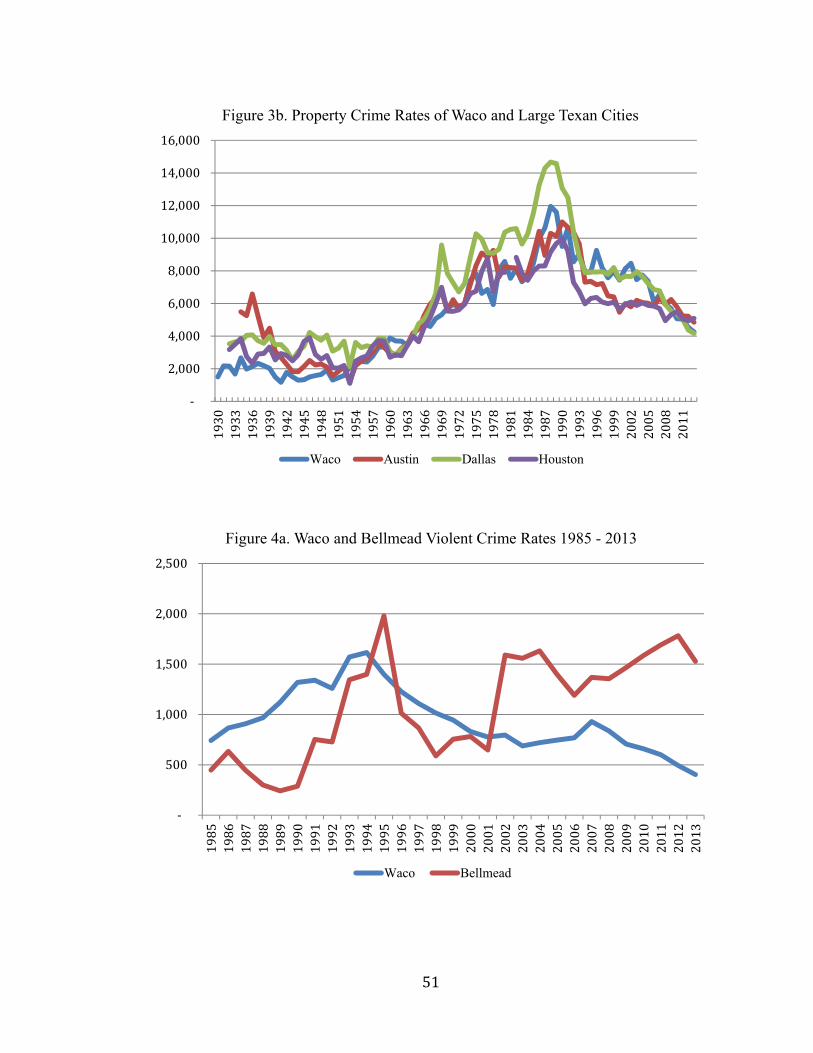
51
‐
2,000
4,000
6,000
8,000
10,000
12,000
14,000
16,000
1930
1933
1936
1939
1942
1945
1948
1951
1954
1957
1960
1963
1966
1969
1972
1975
1978
1981
1984
1987
1990
1993
1996
1999
2002
2005
2008
2011
Figure 3b. Property Crime Rates of Waco and Large Texan Cities
Waco Austin Dallas Houston
‐
500
1,000
1,500
2,000
2,500
1985
1986
1987
1988
1989
1990
1991
1992
1993
1994
1995
1996
1997
1998
1999
2000
2001
2002
2003
2004
2005
2006
2007
2008
2009
2010
2011
2012
2013
Figure 4a. Waco and Bellmead Violent Crime Rates 1985 - 2013
Waco Bellmead
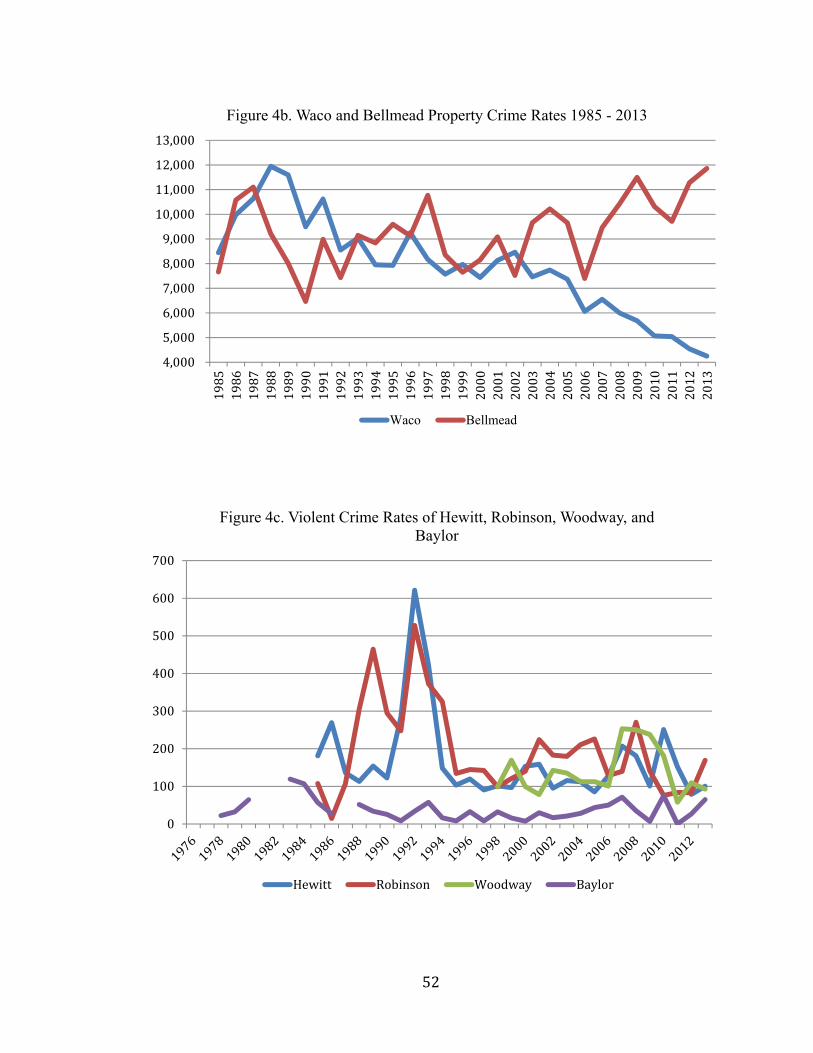
52
4,000
5,000
6,000
7,000
8,000
9,000
10,000
11,000
12,000
13,000
1985
1986
1987
1988
1989
1990
1991
1992
1993
1994
1995
1996
1997
1998
1999
2000
2001
2002
2003
2004
2005
2006
2007
2008
2009
2010
2011
2012
2013
Figure 4b. Waco and Bellmead Property Crime Rates 1985 - 2013
Waco Bellmead
0
100
200
300
400
500
600
700
Figure 4c. Violent Crime Rates of Hewitt, Robinson, Woodway, and Baylor
Hewitt Robinson Woodway Baylor

53
0
500
1000
1500
2000
2500
3000
3500
4000
4500
Figure 4d. Property Crime Rates of Hewitt, Robinson, Woodway, and Baylor
Hewitt Robinson Woodway Baylor
0
500
1000
1500
2000
2500
1960
1962
1964
1966
1968
1970
1972
1974
1976
1978
1980
1982
1984
1986
1988
1990
1992
1994
1996
1998
2000
2002
2004
2006
2008
2010
2012
Figure 5. Waco's Individual Violent Crime Rates 1960 - 2013
HomicideRate*50 ForcibleRapeRate*10
RobberyRate*5 AggravatedAssaultRate
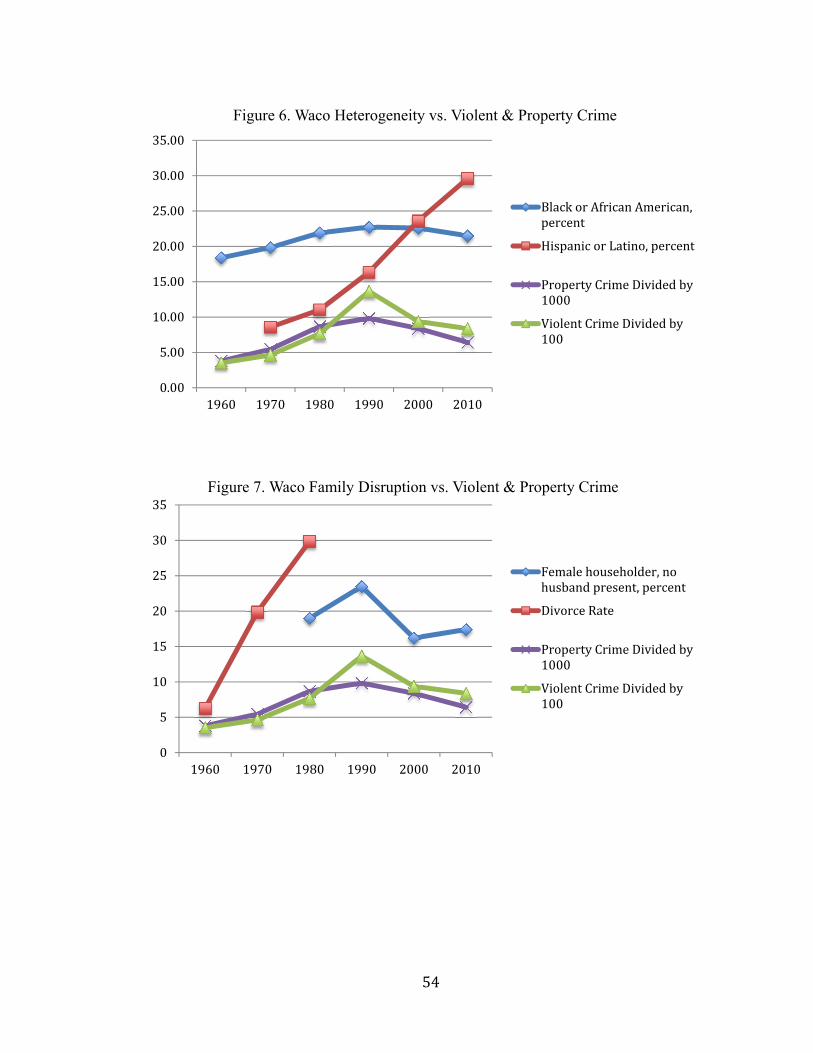
54
0.00
5.00
10.00
15.00
20.00
25.00
30.00
35.00
1960 1970 1980 1990 2000 2010
Figure 6. Waco Heterogeneity vs. Violent & Property Crime
BlackorAfricanAmerican,percent
HispanicorLatino,percent
PropertyCrimeDividedby1000
ViolentCrimeDividedby100
0
5
10
15
20
25
30
35
1960 1970 1980 1990 2000 2010
Figure 7. Waco Family Disruption vs. Violent & Property Crime
Femalehouseholder,nohusbandpresent,percent
DivorceRate
PropertyCrimeDividedby1000
ViolentCrimeDividedby100

55
0.0
5.0
10.0
15.0
20.0
25.0
30.0
35.0
1960 1970 1980 1990 2000 2010
Figure 8. Waco Economic Demographics vs. Violent & Property Crime
Personsbelowpovertylevel,percent
PercentUnemployed
PropertyCrimeDividedby1000
Medianhouseholdincomedividedby1000
ViolentCrimeDividedby100

56
TABLE 1: Crime Rates of Waco, the United States, and Texas, 1960 – 2013 Index Crime Rate Violent Crime Rate Property Crime Rate
Year Waco National Texas Waco National Texas Waco National Texas 1960 4,240 1,887 2,217 361 161 161 3,879 1,726 2,056 1961 4,027 1,906 2,128 322 158 158 3,705 1,748 1,970 1962 3,899 2,020 2,148 211 162 153 3,689 1,858 1,994 1963 3,662 2,180 2,243 216 168 170 3,447 2,012 2,074 1964 4,303 2,388 2,507 284 191 190 4,019 2,198 2,317 1965 4,906 2,449 2,584 294 200 199 4,611 2,249 2,385 1966 5,288 2,671 2,873 547 220 227 4,741 2,451 2,646 1967 5,040 2,990 3,130 453 253 246 4,588 2,737 2,884 1968 5,459 3,370 3,478 376 298 270 5,082 3,072 3,208 1969 5,735 3,680 3,967 427 329 328 5,307 3,351 3,639 1970 6,201 3,985 4,173 487 364 365 5,714 3,621 3,808 1971 6,593 4,165 4,100 660 396 376 5,933 3,769 3,724 1972 6,692 3,961 3,914 896 401 354 5,796 3,560 3,560 1973 6,905 4,154 4,126 938 417 385 5,967 3,737 3,740 1974 8,071 4,850 4,787 648 461 390 7,423 4,389 4,397 1975 8,468 5,298 5,407 636 488 391 7,832 4,811 5,017 1976 7,372 5,287 5,464 752 468 356 6,619 4,820 5,109 1977 7,871 5,078 5,397 1,013 476 408 6,858 4,602 4,989 1978 6,835 5,140 5,557 902 498 435 5,933 4,643 5,122 1979 8,786 5,565 5,925 692 549 508 8,093 5,017 5,417 1980 9,333 5,950 6,143 757 597 550 8,575 5,353 5,593 1981 8,251 5,850 6,050 706 593 532 7,546 5,257 5,518 1982 8,870 5,601 6,302 758 571 577 8,112 5,030 5,725

57
Index Crime Rate Violent Crime Rate Property Crime Rate 1983 7,979 5,179 5,907 643 538 512 7,335 4,641 5,395 1984 8,349 5,038 6,030 711 540 505 7,638 4,498 5,525 1985 9,187 5,225 6,569 742 558 550 8,445 4,666 6,019 1986 10,846 5,502 7,408 866 620 659 9,980 4,882 6,749 1987 11,543 5,575 7,722 908 612 631 10,634 4,963 7,091 1988 12,918 5,695 8,018 968 641 653 11,949 5,054 7,365 1989 12,723 5,774 7,927 1,122 667 659 11,600 5,107 7,268 1990 10,816 5,803 7,827 1,319 730 761 9,497 5,073 7,065 1991 11,963 5,898 7,819 1,340 758 840 10,623 5,140 6,979 1992 9,810 5,661 7,058 1,259 758 806 8,551 4,904 6,252 1993 10,613 5,487 6,439 1,571 747 762 9,042 4,740 5,677 1994 9,567 5,374 5,872 1,615 714 706 7,951 4,660 5,166 1995 9,328 5,275 5,684 1,398 684 664 7,931 4,590 5,020 1996 10,482 5,088 5,709 1,227 637 644 9,256 4,451 5,064 1997 9,284 4,927 5,481 1,110 611 603 8,174 4,316 4,878 1998 8,589 4,620 5,112 1,014 568 565 7,575 4,053 4,547 1999 8,913 4,267 5,032 945 523 560 7,968 3,744 4,471 2000 8,268 4,125 4,955 831 507 545 7,437 3,618 4,410 2001 8,908 4,163 5,142 776 505 572 8,132 3,658 4,570 2002 9,261 4,125 5,200 796 494 580 8,466 3,631 4,620 2003 8,151 4,067 5,153 688 476 553 7,463 3,591 4,600 2004 8,464 3,977 5,039 720 463 541 7,743 3,514 4,498 2005 8,114 3,901 4,847 746 469 528 7,369 3,432 4,319 2006 6,832 3,826 4,600 768 479 517 6,064 3,347 4,083 2007 7,483 3,748 4,633 930 472 510 6,554 3,276 4,122 2008 6,837 3,673 4,495 837 459 508 6,000 3,215 3,987
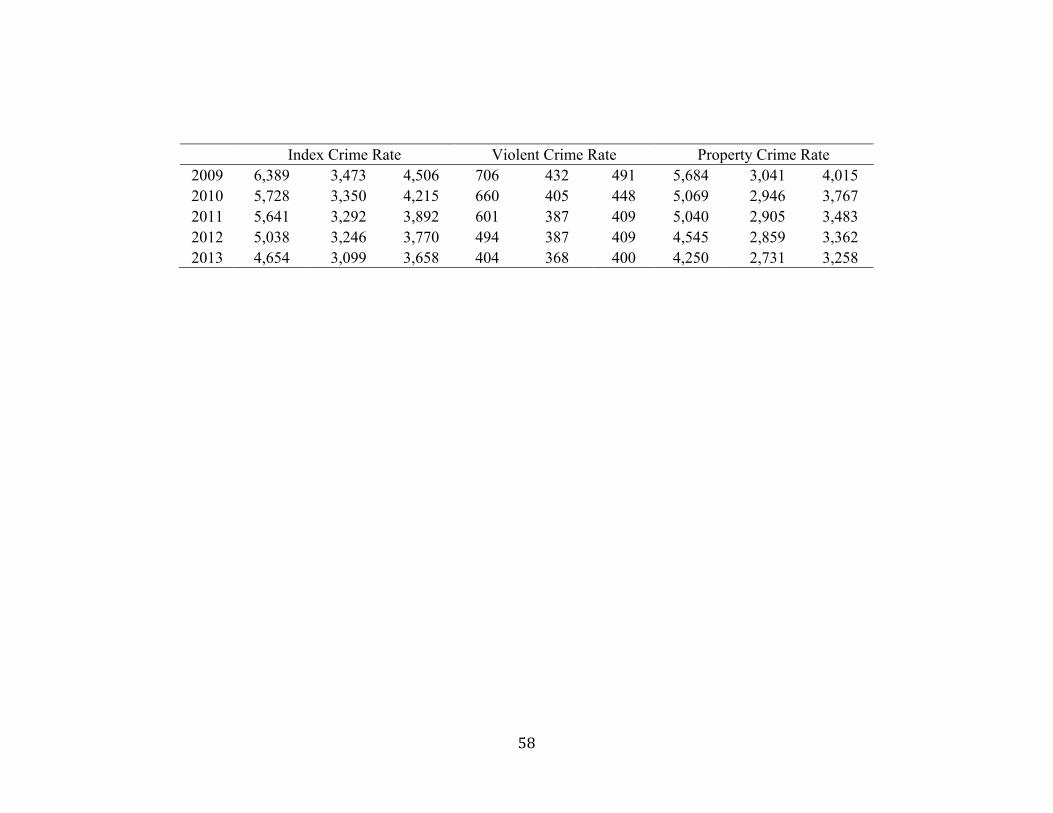
58
Index Crime Rate Violent Crime Rate Property Crime Rate 2009 6,389 3,473 4,506 706 432 491 5,684 3,041 4,015 2010 5,728 3,350 4,215 660 405 448 5,069 2,946 3,767 2011 5,641 3,292 3,892 601 387 409 5,040 2,905 3,483 2012 5,038 3,246 3,770 494 387 409 4,545 2,859 3,362 2013 4,654 3,099 3,658 404 368 400 4,250 2,731 3,258

59
Table 2: Crime Rates of Waco, Austin, Dallas, and Houston, 1960 – 2013 Index Crime Rates Violent Crime Rates Property Crime Rates
Year Waco Austin Dallas Houston Waco Austin Dallas Houston Waco Austin Dallas Houston
1960 4,240 3,113 3,297 2,971 361 175 247 268 3,879 2,939 3,049 2,703 1961 4,027 2,983 3,059 3,145 322 166 215 294 3,705 2,817 2,844 2,851 1962 3,899 3,437 3,439 3,135 211 170 218 336 3,689 3,266 3,221 2,798 1963 3,662 3,695 3,671 3,845 216 209 232 426 3,447 3,485 3,439 3,419 1964 4,303 4,505 4,261 4,460 284 320 273 459 4,019 4,185 3,987 4,000 1965 4,906 4,756 5,082 4,083 294 336 319 427 4,611 4,420 4,764 3,655 1966 5,288 5,653 5,485 5,169 547 361 434 603 4,741 5,293 5,051 4,566 1967 5,040 6,374 6,186 5,808 453 410 515 679 4,588 5,964 5,671 5,129 1968 5,459 6,838 7,232 6,840 376 496 596 825 5,082 6,342 6,636 6,015 1969 5,735 7,288 10,593 7,932 427 562 1,009 942 5,307 6,727 9,583 6,990 1970 6,201 6,063 8,809 6,332 487 494 966 799 5,714 5,569 7,843 5,533 1971 6,593 6,860 8,321 6,234 660 629 1,058 717 5,933 6,231 7,263 5,517 1972 6,692 6,242 7,647 6,266 896 537 932 654 5,796 5,705 6,715 5,612 1973 6,905 6,575 8,272 6,685 938 557 1,043 730 5,967 6,018 7,229 5,956 1974 8,071 7,609 9,740 7,389 648 432 906 787 7,423 7,176 8,834 6,602
1975 8,468 8,805 11,181 7,479 636 483 907 724 7,832 8,322 10,274 6,756
1976 7,372 9,570 10,810 8,621 752 477 858 653 6,619 9,093 9,952 7,969 1977 7,871 9,347 10,162 9,514 1,013 500 1,054 755 6,858 8,846 9,108 8,759 1978 6,835 9,817 10,252 7,310 902 561 1,171 601 5,933 9,255 9,082 6,709 1979 8,786 8,065 10,628 8,752 692 443 1,298 878 8,093 7,622 9,330 7,874 1980 9,333 8,755 11,778 8,886 757 502 1,409 975 8,575 8,253 10,369 7,912 1981 8,251 8,632 11,905 706 432 1,360 7,546 8,200 10,545 1982 8,870 8,590 11,937 9,887 758 414 1,345 1,060 8,112 8,176 10,592 8,827 1983 7,979 7,823 10,793 8,772 643 403 1,149 921 7,335 7,420 9,644 7,852

60
Index Crime Rates Violent Crime Rates Property Crime Rates 1984 8,349 8,260 11,486 8,262 711 428 1,226 839 7,638 7,832 10,260 7,423 1985 9,187 9,606 12,982 8,928 742 581 1,440 943 8,445 9,024 11,542 7,985 1986 10,846 11,070 15,143 9,448 866 644 1,896 1,156 9,980 10,427 13,247 8,292 1987 11,543 9,443 16,283 9,392 908 493 1,989 1,090 10,634 8,950 14,294 8,302 1988 12,918 10,841 16,742 10,311 968 537 2,077 1,149 11,949 10,304 14,665 9,163 1989 12,723 10,669 16,707 10,816 1,122 556 2,131 1,140 11,600 10,114 14,576 9,676 1990 10,816 11,714 15,520 11,338 1,319 714 2,438 1,388 9,497 11,000 13,082 9,950 1991 11,963 11,295 15,066 10,824 1,340 624 2,568 1,600 10,623 10,671 12,497 9,224 1992 9,810 10,944 12,429 8,747 1,259 589 2,072 1,465 8,551 10,355 10,358 7,282 1993 10,613 10,252 10,627 8,187 1,571 600 1,743 1,454 9,042 9,652 8,884 6,734 1994 9,567 7,941 9,477 7,285 1,615 635 1,589 1,307 7,951 7,306 7,888 5,978 1995 9,328 8,132 9,464 7,588 1,398 773 1,532 1,283 7,931 7,359 7,932 6,305 1996 10,482 7,866 9,467 7,636 1,227 711 1,535 1,267 9,256 7,155 7,932 6,369 1997 9,284 7,870 9,336 7,264 1,110 646 1,384 1,174 8,174 7,224 7,952 6,089 1998 8,589 7,002 9,253 7,112 1,014 541 1,465 1,123 7,575 6,461 7,787 5,989 1999 8,913 6,904 9,616 7,271 945 498 1,414 1,187 7,968 6,406 8,201 6,084 2000 8,268 5,937 8,838 6,742 831 472 1,350 1,100 7,437 5,465 7,489 5,642 2001 8,908 6,469 9,132 7,107 776 474 1,462 1,172 8,132 5,995 7,670 5,934 2002 9,261 6,267 9,025 7,314 796 467 1,371 1,223 8,466 5,800 7,654 6,091 2003 8,151 6,657 9,328 7,055 688 462 1,371 1,175 7,463 6,195 7,957 5,879 2004 8,464 6,582 8,972 7,186 720 525 1,316 1,146 7,743 6,057 7,656 6,040 2005 8,114 6,502 8,484 7,059 746 490 1,254 1,173 7,369 6,013 7,230 5,887 2006 6,832 6,372 8,063 7,007 768 515 1,206 1,169 6,064 5,857 6,857 5,837 2007 7,483 6,881 7,845 6,817 930 540 1,069 1,132 6,554 6,341 6,776 5,684 2008 6,837 6,468 6,831 6,054 837 522 895 1,107 6,000 5,945 5,936 4,947 2009 6,389 6,769 6,323 6,444 706 523 792 1,126 5,684 6,245 5,531 5,319

61
Index Crime Rates Violent Crime Rates Property Crime Rates 2010 5,728 6,277 6,118 6,564 660 480 765 1,071 5,069 5,798 5,353 5,493 2011 5,641 5,665 5,739 6,028 601 430 681 975 5,040 5,235 5,058 5,054 2012 5,038 5,628 5,049 5,938 494 409 675 993 4,545 5,219 4,374 4,946 2013 4,654 5,213 4,829 6,049 404 363 664 963 4,250 4,850 4,165 5,087

62
Table 3: Crime Rates of Neighboring Cities of Waco, 1977 – 2013 Violent Crime Rates Property Crime Rates
Year Bellmead Hewitt Robinson Woodway Baylor Bellmead Hewitt Robinson Woodway Baylor 1977 22 1,961 1978 32 1,805 1979 65 2,059 1980 3,978 1981 1982 119 1983 107 2,455 1984 448 181 108 57 3,085 1985 633 269 15 27 7,663 2,766 1,260 2,277 1986 446 136 107 10,582 3,745 1,288 2,031 1987 301 113 305 52 11,106 3,180 1,898 1988 241 154 465 34 9,210 2,684 3,007 3,193 1989 288 122 295 25 8,014 2,298 3,484 2,358 1990 752 283 248 8 6,466 2,505 2,925 2,256 1991 727 621 528 34 8,986 2,671 2,451 2,048 1992 1,345 424 373 57 7,434 2,892 1,746 1,762 1993 1,399 149 325 16 9,147 2,604 2,017 1,962 1994 1,980 103 134 8 8,839 2,090 1,762 2,176 1995 1,013 120 145 33 9,595 2,473 1,613 1,536 1996 867 91 142 8 9,129 1,629 1,342 1,912 1997 589 102 99 99 32 10,772 1,866 1,334 1,880 1998 754 97 121 170 16 8,355 1,619 1,384 1,428 2,381 1999 781 153 140 100 7 7,652 1,760 1,449 1,735 2,253 2000 647 159 224 78 30 8,151 1,642 2,473 1,574 2,227

63
Violent Crime Rates Property Crime Rates 2001 1,590 95 183 143 17 9,084 2,726 2,443 1,959 2,167 2002 1,558 115 180 135 21 7,523 2,392 1,977 2,028 2,389 2003 1,632 112 211 112 28 9,660 2,036 2,168 1,536 3,108 2004 1,399 85 226 112 43 10,222 2,029 1,629 1,529 1,547 2005 1,191 127 129 101 50 9,658 1,839 2,733 1,495 1,993 2006 1,368 207 140 253 71 7,399 1,528 2,468 1,858 1,996 2007 1,355 181 270 251 35 9,464 1,790 1,958 1,633 1,838 2008 1,467 101 141 238 7 10,424 1,451 2,365 1,789 1,418 2009 1,586 251 76 181 75 11,498 1,451 1,936 1,677 1,307 2010 1,692 152 84 58 - 10,312 908 1,903 1,893 1,088 2011 1,782 79 83 110 27 9,714 961 1,622 1,414 1,423 2012 1,528 100 169 93 65 11,281 1,045 1,762 1,455 832 2013 11,859 911 1,878 1,658 859

64
Table 3a - Waco, U.S. and Texas
Cities Rate of Increase
1960 - 1994 Rate of Increase
1960 - 1988 Rate of Increase
1960 - 1988 Violent Property Index
Waco 347.60% 208.05% 204.66% U.S. 343.61% 192.76% 201.75%
Texas 338.68% 258.19% 261.60%
Table 3b - Waco, U.S. and Texas
Cities 1994 - 2013 Reduction 1988 - 2013 Reduction 1988 - 2013 Reduction
Violent Property Index
Waco 1,212 7,699 8,264 U.S. 346 2,323 2,596
Texas 307 4,107 4,360
Table 4a - Waco, Austin, Dallas, and Houston
Cities Rate of Increase 1983 - 1991 Rate of Increase 1960 - 1988
Violent Property
Waco 108.31% 208.05% Austin 55.05% 250.64% Dallas 123.49% 380.93%
Houston 73.75% 238.98%
Table 4b - Waco, Austin, Dallas, and Houston
Cities 1992 - 2013 Reduction 1989 - 2013 Reduction
Violent Property
Waco 856 7,350 Austin 225 5,264 Dallas 1,408 10,411
Houston 502 4,590
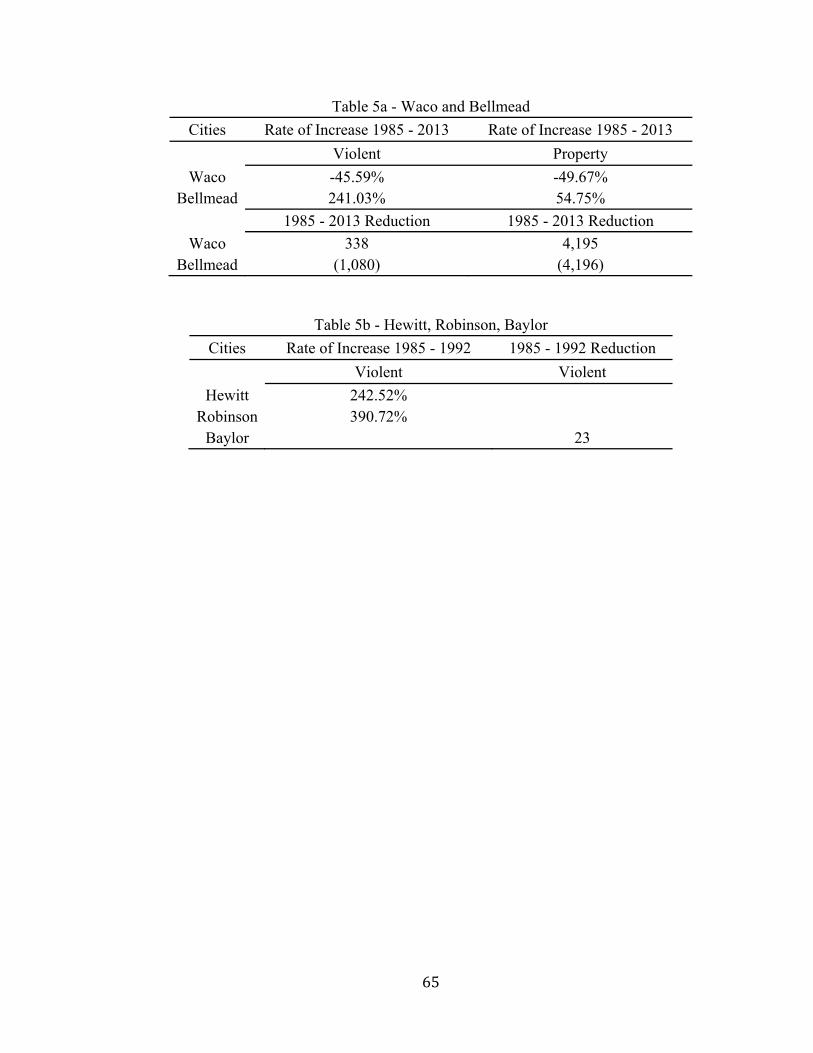
65
Table 5a - Waco and Bellmead
Cities Rate of Increase 1985 - 2013 Rate of Increase 1985 - 2013
Violent Property
Waco -45.59% -49.67% Bellmead 241.03% 54.75%
1985 - 2013 Reduction 1985 - 2013 Reduction
Waco 338 4,195 Bellmead (1,080) (4,196)
Table 5b - Hewitt, Robinson, Baylor
Cities Rate of Increase 1985 - 1992 1985 - 1992 Reduction
Violent Violent
Hewitt 242.52% Robinson 390.72%
Baylor 23

66
BIBLIOGRAPHY
Blumstein, A., & Wallman, J. (Eds.). (2006). The crime drop in America. (Rev. ed.) Cambridge Studies in Criminology. New York: Cambridge University Press.
Bursik, R. J. (1988). Social Disorganization and Theories of Crime and Delinquency:
Problems and Prospects. Criminology, 26(4), 519–551. Christianson,H.,&Darden,M.L.(2010).WacoTornadoScriptforKWBU/NPR.
Waco,TX:TheTexasCollection.Retrievedfromhttp://www.baylor.edu/content/services/document.php/104585.doc
Federal Bureau of Investigation. Uniform crime reports. Retrieved from
http://www.fbi.gov/about-us/cjis/ucr/ucr-publications#Crime Federal Bureau of Investigation. Uniform Crime Reporting Statistics. Retrieved from
http://www.ucrdatatool.gov/Search/Crime/Crime.cfm Haberman, C. (2014, April 6). "When Youth Violence Spurred ‘Superpredator’
Fear." The New York Times. Retreived from http://www.nytimes.com/2014/04/07/us/politics/killing-on-bus-recalls-superpredator-threat-of-90s.html
LaFree, G. D. (1998). Losing legitimacy: Street crime and the decline of institutions in
America. Boulder, CO: Westview Press. Levitt, S. D. (2004). Understanding Why Crime Fell in the 1990s: Four Factors that
Explain the Decline and Six that Do Not. Journal of Economic Perspectivs, 18(1), 163–190.
O’Brien, R. M. (2003). UCR violent crime rates, 1958–2000: recorded and offender-
generated trends. Social Science Research, 32(3), 499–518. Sampson, R. J. (1995). The Community. In Crime (pp. 193–216). San Francisco, CA:
ICS Press, Insititutue for Contemporary Studies. Sampson, R. J., & Groves, W. B. (1989). Community Structure and Crime: Testing
Social-Disorganization Theory. American Journal of Sociology, 94(4), 774–802. Sampson, R. J., & Wilson, W. J. (1995). Toward a Theory of Race, Crime, and Urban
Inequality. In J. Hagan & R. D. Peterson (Eds.), Crime and Inequality (pp. 37– 54). Stanford, CA: Stanford University Press.
67
Shaw, C. R., & McKay, H. D. (1942). Juvenile Delinquency and Urban Areas. University of Chicago Press. Chicago: University of Chicago Press.
Shaw, C. R., & McKay, H. D. (1969). Juvenile Delinquency and Urban Areas. University
of Chicago Press (Rev. ed.). Chicago: University of Chicago Press. Texas Almanac. Texas Almanac: City Population History from 1850–2000. Retrieved
from http://texasalmanac.com/sites/default/files/images/CityPopHist%20web.pdf United States Census Bureau. State and County QuickFacts [Data file]. Retrieved from
http://quickfacts.census.gov/qfd/states/48/4876000.html United States Census Bureau. Bureau of Labor Statistics. Statistical Abstracts. Retrieved
from http://www.census.gov/prod/www/statistical_abstract.html United States Census of Population: Characteristics of Population Texas. Washington:
Government Printing Office. United States Census of Population: General Social and Economic Characteristics
Texas. Washington: Government Printing Office. United States Department of Labor. Databases, Tables & Calculators by Subject.
Retrieved from http://data.bls.gov/timeseries/LAUMT484738000000004?data_tool=XGtable
United States. Federal Bureau of Investigation., United States. Dept. of Justice. Division
of Investigation., United States Bureau of Investigation. (1930 - 1997). Uniform crime reports for the United States. Washington: Bureau of Investigation, U.S. Dept. of Justice. Retrieved from https://archive.org/search.php?query=united%20states%20uniform%20crime%20reports
United States. Federal Bureau of Investigation., United States. Dept. of Justice. Division
of Investigation., United States Bureau of Investigation. (1930 - 1998). Uniform crime reports for the United States. Washington: Bureau of Investigation, U.S. Dept. of Justice. Retrieved from http://catalog.hathitrust.org/Record/007406857/Home
Waco Police Department. (2009 - 2014). “Crime Statistics by Year”. The City of Waco
Texas. Retrieved from http://www.waco-texas.com/police/police-crime-statistics.asp