kauffman foundation we have met the enemy and he is us(1)
TRANSCRIPT

8/11/2019 Kauffman Foundation We Have Met the Enemy and He is Us(1)
http://slidepdf.com/reader/full/kauffman-foundation-we-have-met-the-enemy-and-he-is-us1 1/52
0
“WE HAVE MET THE ENEMY… AND HE IS US”Lessons from Twenty Years of the Kauffman Foundation’s
Investments in Venture Capital Fundsand The Triumph of Hope over Experience
May 2012

8/11/2019 Kauffman Foundation We Have Met the Enemy and He is Us(1)
http://slidepdf.com/reader/full/kauffman-foundation-we-have-met-the-enemy-and-he-is-us1 2/52
1
“WE HAVE MET THE ENEMY… AND HE IS US”Lessons from Twenty Years of the Kauffman Foundation’s
Investments in Venture Capital Fundsand The Triumph of Hope over Experience
May 2012
Authors:
Diane MulcahyDirector of Private Equity,
Ewing Marion Kauffman Foundation
Bill WeeksQuantitative Director,
Ewing Marion Kauffman Foundation
Harold S. BradleyChief Investment Officer,Ewing Marion Kauffman Foundation
© 2012 by the Ewing Marion Kauffman Foundation. All rights reserved.

8/11/2019 Kauffman Foundation We Have Met the Enemy and He is Us(1)
http://slidepdf.com/reader/full/kauffman-foundation-we-have-met-the-enemy-and-he-is-us1 3/52
2
ACKNOWLEDGEMENTS
We thank Benno Schmidt, interim CEO of the Kauffman Foundation, and ourInvestment Committee, for their support of our detailed analysis and publication of the
Foundation’s historic venture capital portfolio and investing experience. Kauffman’sQuantitative Director, Bill Weeks, contributed exceptional analytic work and key insightsabout the performance of our portfolio.
We also thank our colleagues and readers Paul Kedrosky, Robert Litan, Mary McLean,Brent Merfen, and Dane Stangler for their valuable input.
We also are grateful for the more than thirty venture capitalists and institutionalinvestors that we interviewed, who shared their candid views and perspectives on thesetopics.
A NOTE ON CONFIDENTIALITY
Despite the strong brand recognition of many of the partnerships in which we’veinvested, we are prevented from providing specifics in this paper due to confidentialityprovisions to which we agreed at the time of our investment. Similarly, the data andanalyses we present in this paper are mostly our own because detailed informationabout VC fund performance and structures is nearly impossible to obtain given theconfidentiality terms in the typical limited partner agreement.
8/11/2019 Kauffman Foundation We Have Met the Enemy and He is Us(1)
http://slidepdf.com/reader/full/kauffman-foundation-we-have-met-the-enemy-and-he-is-us1 4/52
3
EXECUTIVE SUMMARY
Venture capital (VC) has delivered poor returns for more than a decade. VC returnshaven’t significantly outperformed the public market since the late 1990s, and, since1997, less cash has been returned to investors than has been invested in VC.
Speculation among industry insiders is that the VC model is broken, despite occasionalhigh-profile successes like Groupon, Zynga, LinkedIn, and Facebook in recent years.
The Kauffman Foundation investment team analyzed our twenty-year history of ventureinvesting experience in nearly 100 VC funds with some of the most notable andexclusive partnership “brands” and concluded that the Limited Partner (LP) investmentmodel is broken1. Limited Partners—foundations, endowments, and state pensionfund—invest too much capital in underperforming venture capital funds on frequentlymis-aligned terms. Our research suggests that investors like us succumb time andagain to narrative fallacies, a well-studied behavioral finance bias. We found in our ownportfolio that:
Only twenty of 100 venture funds generated returns that beat a public-marketequivalent by more than 3 percent annually, and half of those began investingprior to 1995.
The majority of funds—sixty-two out of 100—failed to exceed returnsavailable from the public markets, after fees and carry were paid.
There is not consistent evidence of a J-curve in venture investing since 1997;the typical Kauffman Foundation venture fund reported peak internal rates ofreturn (IRRs) and investment multiples early in a fund’s life (while still in thetypical sixty-month investment period), followed by serial fundraising in monthtwenty-seven.
Only four of thirty venture capital funds with committed capital of more than$400 million delivered returns better than those available from a publiclytraded small cap common stock index.
Of eighty-eight venture funds in our sample, sixty-six failed to deliverexpected venture rates of return in the first twenty-seven months (prior toserial fundraises). The cumulative effect of fees, carry, and the uneven natureof venture investing ultimately left us with sixty-nine funds (78 percent) thatdid not achieve returns sufficient to reward us for patient, expensive, long-term investing.
Investment committees and trustees should shoulder blame for the broken LP
investment model, as they have created the conditions for the chronic misallocation ofcapital. In particular, we learned that investment committees and trustees:
1 As of February 29, 2012, the Kauffman Foundation endowment of $1.83 billion was invested in aglobally diversified portfolio, comprising public and private equity, alternative strategies (including hedgefunds), and fixed-income securities. About $249 million was invested in or committed to venture capitaland growth equity funds.

8/11/2019 Kauffman Foundation We Have Met the Enemy and He is Us(1)
http://slidepdf.com/reader/full/kauffman-foundation-we-have-met-the-enemy-and-he-is-us1 5/52
4
Create buckets of “investment classes” for staffs to fill when they establishtarget allocations to VC; large LPs must invest in very large funds to put theirallocated capital to work, yet big VC funds most often fail to generate market-beating returns.
Make investment decisions based on seductive narratives such as vintage
year and quartile performance, which rely heavily on internal rate of returnmeasures that often are misleading and aren’t persistent over time. Fail to judge investments in venture capital against returns from small
capitalization public stock investing.
The most significant misalignment occurs because LPs don’t pay VCs to do what theysay they will—generate returns that exceed the public market. Instead, VCs typically arepaid a 2 percent management fee on committed capital and a 20 percent profit-sharingstructure (known as “2 and 20”). This pays VCs more for raising bigger funds, and inmany cases allows them to lock in high levels of fee-based personal income even whenthe general partner fails to return investor capital.
Furthermore, our research shows that LPs regularly accept the risks of investing in a“black box” of VC firm economics. It is common for institutional investors to makeinvestments in VC funds without requiring information about general partner (GP)compensation, carry structure, ownership, and firm-level income, expenses, or profits.
Understanding the costs and long-term investment results of VC fund investing revealsstill more nettlesome problems for investors:
The average VC fund fails to return investor capital after fees. Many VC funds last longer than ten years—up to fifteen years or more. We have
eight VC funds in our portfolio that are more than fifteen years old. Investors are afraid to contest GP terms for fear of “rocking the boat” with
General Partners who use scarcity and limited access as marketing strategies. The typical GP commits only 1 percent of partner dollars to a new fund while LPs
commit 99 percent. These economics insulate GPs from personal income effectsof poor fund returns and encourages them to focus on generating short-term,high IRRs by “flipping” companies rather than committing to long-term, scalegrowth of a startup.
To fix what’s broken in the LP investment model, institutional investors will need tobecome more selective and more disciplined investors in venture capital funds. The
best investors will negotiate better alignment, transparency, governance, and terms thattake into account the skewed distribution of VC fund returns. The KauffmanFoundation’s approach to venture capital investing in the future will be to:
Invest in VC funds of less than $400 million with a history of consistently highpublic market equivalent (PME) performance, and in which GPs commit at least 5percent of capital;

8/11/2019 Kauffman Foundation We Have Met the Enemy and He is Us(1)
http://slidepdf.com/reader/full/kauffman-foundation-we-have-met-the-enemy-and-he-is-us1 6/52
5
Invest directly in a small portfolio of new companies, without being saddled byhigh fees and carry;
Co-invest in later-round deals side-by-side with seasoned investors; Move a portion of capital invested in VC into the public markets. There are not
enough strong VC investors with above-market returns to absorb even our limited
investment capital.

8/11/2019 Kauffman Foundation We Have Met the Enemy and He is Us(1)
http://slidepdf.com/reader/full/kauffman-foundation-we-have-met-the-enemy-and-he-is-us1 7/52
6
“You let one ant stand up to us…then they all might stand up.Those puny little ants outnumber us 100 to 1, and if they ever figure that out,
there goes our way of life!”Hopper’s speech to the grasshoppers, A Bug’s Life
INTRODUCTION
It’s become a bit of a sport among venture capital (VC) insiders and observers to assertthat the venture capital model is broken.2 Industry returns data show that VC returnshaven’t beaten the public market for most of the past decade, and the industry hasn’treturned the cash invested since 1997, certainly a compelling sign that something mustbe wrong. It’s so easy to point the finger of blame directly at VCs—there are too manyof them, they’re raising too much cash, they’re sitting on too much cash, they’reinvesting too much cash, they’re taking home too much cash….you get the idea.
As tempting as those arguments are to pursue, they miss the bigger picture and thefundamental problem. After all, who is financing all these VCs with their big funds, big
piles of investible cash, big fees, and unimpressive returns? Limited partners (LPs), ofcourse. All the state pension funds, endowments, foundations, and other institutionalinvestors who, with one collective closing of their checkbooks, could bring the VCindustry to a grinding halt, but don’t. Why not? After all, the VCs have effectively shutdown their own investing—many General Partners (GPs) crack their checkbooks thesmallest bit to contribute a token 1 percent commitment of partner capital to their ownfunds, then LPs swoop in to fund the remaining 99 percent. What are we thinking?
At the Kauffman Foundation, our investment team decided to seriously consider thisquestion and analyze our own large and (largely) underperforming VC portfolio,question our assumptions, and revisit exactly what we’ve been thinking about investing
in venture capital. This paper explores venture capital investing from the perspective ofthe LP and is targeted to an audience of institutional investors and their investmentcommittees and trustees. It considers: Is it the VC model that’s broken, or the LPinvestment model? Our conclusion is that the LP investment model is broken. Too manyLPs invest too much capital in underperforming VC funds and on misaligned terms.
We believe that to really understand and constructively address what’s ‘broken’ in VC,we need to follow the money. And the money trail leads right to the LP boardroom,where investment committees oversee venture capital investing. It’s in the boardroomthat VC allocations are created, VC fund performance is evaluated, investmentconsultants are heard, and investment decisions are approved. Investment committees
are partly responsible for the broken LP investment model through their setting andapproving of targeted allocations to VC, an acceptance of inconsistent and not fullyinformative VC performance reporting, and either a lack of awareness or tolerance ofthe opaque economics and misaligned terms on which most investments in venturecapital funds are made.
2 Scott Austin, Majority of VCs in Survey Call Industry Broken, Wall Street Journal , June 20, 2009.http://blogs.wsj.com/venturecapital/2009/06/29/majority-of-vcs-in-survey-call-industry-broken/. Also see AngelBlog for links to several articles, http://www.angelblog.net/The_VC_Model_is_Broken.html.

8/11/2019 Kauffman Foundation We Have Met the Enemy and He is Us(1)
http://slidepdf.com/reader/full/kauffman-foundation-we-have-met-the-enemy-and-he-is-us1 8/52

8/11/2019 Kauffman Foundation We Have Met the Enemy and He is Us(1)
http://slidepdf.com/reader/full/kauffman-foundation-we-have-met-the-enemy-and-he-is-us1 9/52
8
need to accept that investing in small cap public equities is better for long-terminvestment returns than investing in second- or third-tier VC funds.
Recommendation 2: Reject the Assumption of a J-Curve: The data we present indicatethat the “J-curve” is an empirically elusive outcome in venture capital investing. A
surprising number of funds show early positive returns that peak before or duringfundraising for their next fund. We see no evidence that the J-curve is a consistent VCphenomenon or that it predicts later performance of a fund. Committees should be waryof J-curve-based defenses of VC investing.
Recommendation 3: Eliminate the Black Box of VC Firm Economics: Institutionalinvestors aren’t paid for taking on the additional risk of investing in VC firms with ‘blackbox’ economics. Investment committees can stop accepting that risk by requiringconsultants and their investment staffs to acquire and present information on VC firmeconomics, including compensation, carry structure, GP commitment, and managementcompany terms and performance, in order to obtain investment committee approval.
Recommendation 4: Pay for Performance: The current market standard 2 percentmanagement fee and 20 percent profit-sharing structure (“2 and 20”) pays VCs more forraising bigger funds and, in many cases, allows them to lock in high levels of fee-basedpersonal income regardless of fund performance. Creating and negotiating acompensation structure that pays fees based on a firm budget, and shares profits onlyafter investors receive their capital back plus a preferred return, would mean LPs payVCs for doing what they say they will—generating excess returns above the publicmarket.
Recommendation 5: Measure VC Fund Performance Using a Public Market Equivalent(PME): Evaluate VC fund performance by modeling a fund’s cash flows in comparableindexes of publicly traded common stocks. We use the small capitalization Russell 2000as a benchmark as we believe it better reflects the higher price volatility, higher beta,and higher sensitivity of small companies to economic cycles than the largecapitalization S&P 500 index does. Adopt PME as a consistent standard for VCperformance reporting, similar to the Global Investment Performance Standards.3 Require consultants or investment staff to present PMEs as part of any investmentdecision. Reject performance marketing narratives that anchor on internal rate of return(IRR), top quartile, vintage year, or gross returns.
In our discussions with institutional investors, we’ve been struck by the prevailingreluctance to initiate changes in the LP investment model. This seems to stem partlyfrom investors’ general fear that they will be denied access to top-performing funds ifthey “rock the boat”’ by negotiating more favorable terms that offer more alignment. Theaccess issue is a real one, but is material only for a small select group of top-tier funds.The cases in which access to one of the ten or twenty top-performing funds is at stakedoesn’t support the systemic reluctance, expressed by LPs with whom we talked, to
3 Global Investment Performance Standards (GIPS) were created by the CFA Institute to standardize howinvestment firms calculate and report performance. http://gipsstandards.org/.

8/11/2019 Kauffman Foundation We Have Met the Enemy and He is Us(1)
http://slidepdf.com/reader/full/kauffman-foundation-we-have-met-the-enemy-and-he-is-us1 10/52
9
either more aggressively negotiate key economic terms or exercise the discipline toeither sell or walk away from further investments in a partnership that isunderperforming or misaligned.
It might be true that investors in funds with a strong historical track record of top
performance have little incentive to insist on changes. But we know that many LPsaren’t invested in that small group of top funds. Negotiating stronger alignment andbetter terms may not turn a mediocre fund into a top-performing one, but the right termscan certainly turn a mediocre fund into one that generates materially better returns.Better terms also can eliminate GPs’ ability to generate high personal incomes forthemselves from fees while generating below-market returns on investmentperformance for their LPs.
There’s also a general narrative espoused by some LPs that investing in VC funds is a“relationship business,” and that these relationships would suffer damage by negotiatingbetter LP terms and alignment. Our belief is that the best relationships are fair and
balanced partnerships based on transparency, accountability, and aligned interests. Weknow we’re not the first to identify these issues. Since 2009, the Institutional LimitedPartners Association (ILPA) and its more than 200 members have advocated for greatertransparency, governance, and alignment of interests between LPs and GPs.4 Structuring those kinds of partnerships requires discipline and negotiation.
The Kauffman Foundation began investing in VC funds in 1985 and has been a limitedpartner in more than 100 funds managed by more than sixty General Partners, many ofwhich have been considered “top-tier.” We conducted significant historical performanceanalyses of our venture capital portfolio and the results show chronically disappointingreturns over most of the twenty years studied, no matter which way we slice theperformance data—IRRs, investment multiples, or PME. This was a surprising andunexpected conclusion. As recently as 2009, we reported our comparative performanceto our investment committee as evaluated against fund-of-fund returns provided byCambridge Associates. It showed the Kauffman PE portfolio (including both VC andbuyouts) to be in the “top quartile” of such investors.
4 See the ILPA’s Private Equity Principles. http://ilpa.org/index.php?file=/wp-content/uploads/2011/01/ILPA-Private-Equity-Principles-version-2.pdf&ref=http://ilpa.org/principles-version-2-0/&t=1332038765.

8/11/2019 Kauffman Foundation We Have Met the Enemy and He is Us(1)
http://slidepdf.com/reader/full/kauffman-foundation-we-have-met-the-enemy-and-he-is-us1 11/52
10
Our performance since 2009 is negatively impacted by our elimination of poor-performing funds through select sales in the secondary market. The discounted priceswe accepted for underperforming funds resulted in short-term realized losses in ourportfolio, hurting our performance relative to our peers, but we believe that a moreconcentrated portfolio focused on a consolidated group of our best-performing funds willachieve better long-term returns. Going forward, we will continue to shrink the size ofour VC portfolio through attrition, by passing on serial fundraises, and by conductingadditional select sales in the secondary market.
That said, we are still an active venture capital investor. We continue to bet with small,early-stage funds and larger, growth equity funds with strong performance trackrecords. During 2011, we made both new and serial fund investments of about $70m ina select group of VCs. What’s changed for us as a result of the analysis we share in thispaper is the type of VC firm in which we choose to invest. We’re looking for partnershipswhere we can negotiate better GP/LP alignment, transparency, governance, and termsthat take into account the skewed distribution of VC fund returns.
8/11/2019 Kauffman Foundation We Have Met the Enemy and He is Us(1)
http://slidepdf.com/reader/full/kauffman-foundation-we-have-met-the-enemy-and-he-is-us1 12/52
11
AN INVESTMENT COMMITTEE PRIMER:FIVE NEW ASSUMPTIONS THAT UNDERLIE THE KAUFFMAN FOUNDATION’S
VC INVESTMENT DECISION-MAKING
ASSUMPTION 1: ‘Top-Quartile’ and ‘Vintage-Year’ performance reporting is, at
best, not fully informative, and is, at worst, misleading.
There’s a running joke among venture industry insiders that every fund must be “topquartile” because it’s such an oft-used descriptor. Pick up any private placementmemorandum and see for yourself. The problem with top quartile is that it’s a self-referencing performance measure that tells us only that the fund is in the top 25 percentof all VC funds formed in the same year. That might be interesting, but it’s not veryuseful for decision-making because it fails to convey whether the fund’s returns havemet or exceeded the performance hurdle of 3 percent to 5 percent annual returns abovethe public markets that most investors expect from illiquid, risky venture capitalinvestments. It doesn’t reveal whether a fund achieves a ‘venture rate of return’ of more
than twice the invested capital after fees. “Top quartile” doesn’t even inform us if thefund returns were positive. It is possible for a top quartile fund to underperform thepublic markets, fail to return investor capital, and even generate a negative return. Forinstitutional investors trying to allocate capital to generate market-beating returns, “topquartile” does not give us a complete picture of performance and is not a particularlyuseful measure.
Vintage year also fails to incorporate any measure of external market performance andtells us nothing about whether a fund actually generated the excess return above thepublic markets that LPs seek. Instead, vintage-year measures focus on which VC fundformed in a specific year performed best among the universe of VC funds formed in thatsame year. The narrative behind vintage year postulates that a fund manager should becompared only to managers who faced the same market environment at fund inception,yet it fails to take into account any measure of public market performance. A topvintage-year performer can still underperform the public markets.
Vintage year is a relative performance measure that possibly is useful to investors whohave a mandate and therefore are forced to select firms to invest in during a specificyear in order to ‘spend’ their allocations. Historically, many institutional investors didhave mandates, so vintage-year performance measures helped them evaluate how wellthey did, given the limited universe of funds available in the year they invested.
Today, the investing environment is different. Most LPs are looking at performanceacross their entire portfolio and trying to decide whether to invest in VC, or how much toinvest in private versus public equities, issues that vintage-year measures ignore. Theadvantage of PME analysis is that it establishes a consistent standard of performancemeasurement among VC funds, as well as between public and private equity managers
Vintage-year and top-quartile measures can be misleading due to their reliance on IRRsthat are vulnerable to ‘manipulation’ in the short term and are not persistent over the
8/11/2019 Kauffman Foundation We Have Met the Enemy and He is Us(1)
http://slidepdf.com/reader/full/kauffman-foundation-we-have-met-the-enemy-and-he-is-us1 13/52
12
term of a fund’s life. IRRs are influenced by the timing of investment cash flows and thelength of time an investment is held, so a fund with limited capital invested and returnsfrom early exits or early valuation write-ups can generate attractive IRRs in the shortterm. For example, a company that is sold and returns more than twice the investedcapital in three years generates a 26 percent IRR, but the same multiple generated by a
sale in year ten results in only a 7.2 percent IRR. As Josh Lerner, a professor atHarvard Business School and leading researcher on venture capital, notes, “When youlook at how people report performance, there’s often a lot of gaming taking place interms of how they manipulate the IRR.”5
Our portfolio analysis shows clearly that high IRR performance frequently is generatedearly in a fund’s life, either before or during fundraising for the next fund, but that thoseearly high IRRs do not predict a fund’s eventual performance. We evaluated our fundsbased on the difference between maximum IRR, and final IRR and PME in order toassess whether peak IRRs early in a fund’s life might foretell the outcome. What welearned is that our best-performing funds—those launched prior to 1995—did not report
peak returns until the sixth or the seventh year of their lives. That pattern began tochange in the late ’90s, when peak returns almost always were reported during thefund’s five-year investment period, usually in the first thirty-six months. We also see thatpeak IRRs are not consistent predictors of high final returns.
5 Inside IRR, Private Equity International, The First Ten Years, p. 34–36.

8/11/2019 Kauffman Foundation We Have Met the Enemy and He is Us(1)
http://slidepdf.com/reader/full/kauffman-foundation-we-have-met-the-enemy-and-he-is-us1 14/52
13
Do peak IRRs predict final fund performance?
FUND VINTAGEPEAK
IRR
PEAK
IRR
MONTH
MONTH
NEXT
FUND
CAP CALL
FINAL
IRRFINAL
PME*
Fund A 1992 29.2 57 115 20.8 1.35
Fund B 1993 16.8 73 NA 6.8 .73
Fund C 1994 50.5 71 113 27.7 2.71
Fund D 1995 59.7 6 54 16.0 1.71
Fund E1 1996 84.0 39 68 26.3 2.55
Fund F 1997 140.7 33 55 22.2 1.26
Fund G 1998 >200.0 19 36 18.2 1.23
Fund H1 1999 >200.0 8 18 -23.0 .14
Fund E2 2000 44.2 8 24 -10.6 .26Fund I 2001 9.2 89 140 -.09 1.00
Fund H2 2002 31.6 2 NA -7.1 .41
Fund J 2003 24.5 18 44 6.9 1.27
Fund K1 2004 32.2 44 86 13.1 1.53
Fund E3 2005 14.8 38 NA -7.1 .70
Fund L 2006 66.3 4 41 11.0 1.08
Fund K2 2007 69.4 8 44 42.9 1.81For vintage years 2002 and later, the PME is as of 6/30/11. The benchmark is the Russell2000. All IRRs and PMEs are net figures.
Source: Kauffman Foundation VC portfolio.
The table above tells us that almost all GPs use peak IRRs to raise serial funds. In thesixteen years we sample, there were only two peak IRRs less than 15 percent; write-ups in value prove seductive to investors even though they are not consistent predictorsof a fund’s ultimate performance. The sample of funds above all suffered the worstretreat from peak to final IRRs of funds that we owned in each vintage year. In eight ofthe sixteen years, funds with the largest subsequent contraction of returns showed peakIRRs in excess of 50 percent and final IRRs that were significantly lower. After 1995,only three funds delivered final excess returns that justify the risk and illiquidity inherentin venture investing. Our analysis suggests that skepticism of early, high-fund IRRs is
prudent.
When we forget about IRR and look only at performance between the public marketsand our VC portfolio, we see that our best-performing funds relative to the Russell 2000index are pre-1995 vintage years. There is some select good performance (but overallmediocre returns) from the 1996–2000 Internet boom funds, and there are poor returnsfrom 2000 forward.
8/11/2019 Kauffman Foundation We Have Met the Enemy and He is Us(1)
http://slidepdf.com/reader/full/kauffman-foundation-we-have-met-the-enemy-and-he-is-us1 15/52
14
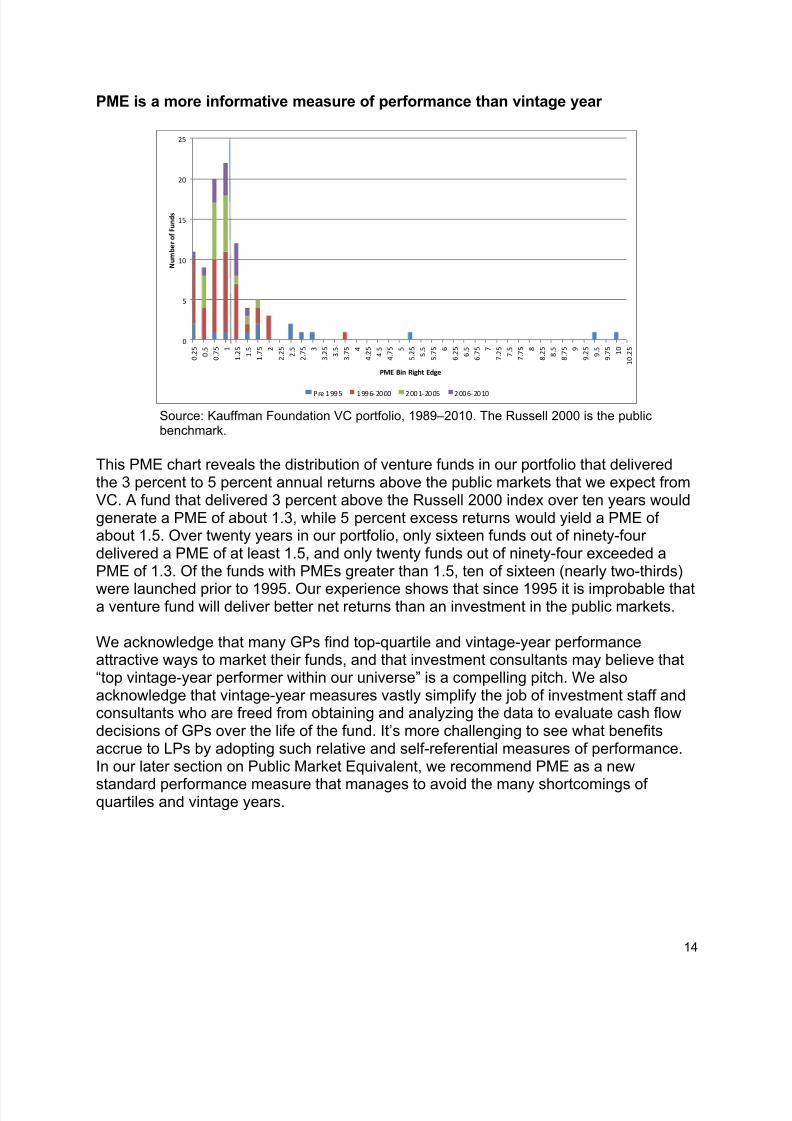
PME is a more informative measure of performance than vintage year
Source: Kauffman Foundation VC portfolio, 1989–2010. The Russell 2000 is the publicbenchmark.
This PME chart reveals the distribution of venture funds in our portfolio that deliveredthe 3 percent to 5 percent annual returns above the public markets that we expect fromVC. A fund that delivered 3 percent above the Russell 2000 index over ten years wouldgenerate a PME of about 1.3, while 5 percent excess returns would yield a PME ofabout 1.5. Over twenty years in our portfolio, only sixteen funds out of ninety-fourdelivered a PME of at least 1.5, and only twenty funds out of ninety-four exceeded aPME of 1.3. Of the funds with PMEs greater than 1.5, ten of sixteen (nearly two-thirds)
were launched prior to 1995. Our experience shows that since 1995 it is improbable thata venture fund will deliver better net returns than an investment in the public markets.
We acknowledge that many GPs find top-quartile and vintage-year performanceattractive ways to market their funds, and that investment consultants may believe that“top vintage-year performer within our universe” is a compelling pitch. We alsoacknowledge that vintage-year measures vastly simplify the job of investment staff andconsultants who are freed from obtaining and analyzing the data to evaluate cash flowdecisions of GPs over the life of the fund. It’s more challenging to see what benefitsaccrue to LPs by adopting such relative and self-referential measures of performance.In our later section on Public Market Equivalent, we recommend PME as a new
standard performance measure that manages to avoid the many shortcomings ofquartiles and vintage years.
0
5
10
15
20
25
0 . 2 5
0 . 5
0 . 7 5 1
1 . 2 5
1 . 5
1 . 7 5 2
2 . 2 5
2 . 5
2 . 7 5 3
3 . 2 5
3 . 5
3 . 7 5 4
4 . 2 5
4 . 5
4 . 7 5 5
5 . 2 5
5 . 5
5 . 7 5 6
6 . 2 5
6 . 5
6 . 7 5 7
7 . 2 5
7 . 5
7 . 7 5 8
8 . 2 5
8 . 5
8 . 7 5 9
9 . 2 5
9 . 5
9 . 7 5
1 0
1 0 . 2 5
N u m b e r o f F u n d s
PME Bin Right Edge
Pre 1995 1996-2000 2001-2005 2006-2010

8/11/2019 Kauffman Foundation We Have Met the Enemy and He is Us(1)
http://slidepdf.com/reader/full/kauffman-foundation-we-have-met-the-enemy-and-he-is-us1 16/52
15
ASSUMPTION 2: The average VC fund barely manages to return investor capitalafter all fees are paid.
Investing in venture capital in the early to mid-1990s generated strong, above-marketreturns, and performance by any measure was good. What has happened since? Our
colleague Paul Kedrosky asserts that the venture capital industry is too big and mustshrink to effectively fund entrepreneurs and generate competitive returns.6 Longtimeventure investor Bill Hambrecht notes that, “When you get an above-average return inany class of assets, money floods in until it drives returns down to a normal, and I thinkthat’s what happened.7”
When we look at VC fundraising by vintage year, we see that LPs are committing farmore capital to venture capital today than during the industry’s best return years in thelate ’80s and early ’90s. We see also that the number of VC funds, the amountcommitted per fund, and the total capital invested in VC all remain at much higher levelsthan at any time other than the stock market’s Internet bubble in the late ’90s.
The institutionalization of Venture Capital: Fewer funds with a lot more money
Source: NVCA Annual Yearbook, 2011.
During the past fifteen years of poor performance, investors have committed about $20beach year to VC, about four times the $500 million in capital committed to venturecapital in total during the decade 1985–1995. The flow of capital into VC has slowed
6 Paul Kedrosky, Right-Sizing the U.S. Venture Capital Industry, Kauffman Foundation, June 10, 2009.http://www.kauffman.org/newsroom/venture-capital-industry-must-shrink-to-be-an-economic-force-kauffman-foundation-study-finds.aspx.7 Bill Hambrecht interview at the Kauffman Foundation, February 2012.
0
100
200
300
400
500
600
700
$0
$20,000
$40,000
$60,000
$80,000
$100,000
$120,000
1 9 9 9
D o l l a r s C o m m i t t e d
Vintage Year
Fund Number VC ($mil)

8/11/2019 Kauffman Foundation We Have Met the Enemy and He is Us(1)
http://slidepdf.com/reader/full/kauffman-foundation-we-have-met-the-enemy-and-he-is-us1 17/52
16
over the past few years, but still has a way to go to return to pre-1995 levels. 8 If it’s truethat too much capital is dragging down returns, money should be flowing out of VC untilreturns normalize. Despite more than a decade of poor returns relative to publicly tradedstocks, however, there appears to be only a modest retrenchment by LPs. We wonder:why are LPs so committed to investing in VC despite its persistent underperformance?
LP hopes for VC returns are high, and those hopes fuel new money into VC fundsnationwide. A Probitas Partners survey of nearly 300 institutional investors found thattwo-thirds of investors expect a 2x+ multiple from top quartile, early-stage VC funds.9 Contrary to those lofty expectations, Cambridge Associates data show that during thetwelve-year period from 1997 to 2009, there have been only five vintage years in whichmedian VC funds generated IRRs that returned investor capital, let alone doubled it. It’snotable that these poor returns have persisted through several market cycles: theInternet boom and bust, the recovery, and the financial crisis. The chart below showsthat, in eight of the past twelve vintage years, the typical VC fund generated a negativeIRR, and for the other four years, barely eked out a positive return.
The average VC fund barely returns investor capital after fees
-10
0
10
20
30
40
50
60
70
1990 1992 1994 1996 1998 2000 2002 2004 2006 2008
N e t I R R
Vintage Year
Median IRR Mean IRR
Source: Cambridge Associates, 2010 Benchmark Report, vintage year 1990–2009 funds(http://www.nvca.org/index.php?option=com_content&view=article&id=78&Itemid=102).
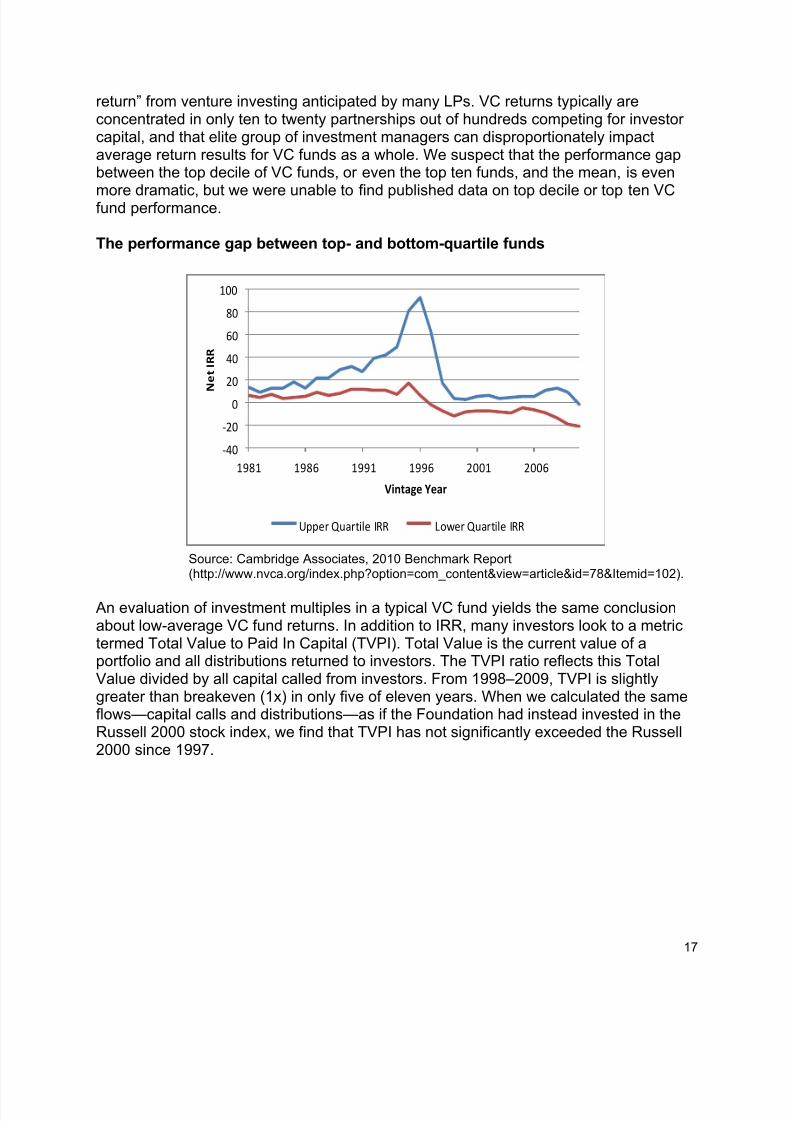
The chart below shows us that top quartile fund returns since 1998 hover around
breakeven, but the bottom quartile generates only negative returns since 1996. Thisperformance gap between the top and bottom quartiles highlights the importance of GPselection. The historic difference between top- and bottom-quartile IRRs demonstratesthat only a few high-performing GPs help to generate the expected high “venture rate of
8 NVCA Yearbook, 2011; NVCA VC Fundraising Q4 2011 press release athttp://www.nvca.org/index.php?option=com_content&view=article&id=78&Itemid=102.9 Probitas Partners, Private Equity Market Review and Institutional Investor Trends Survey for 2010,http://probitaspartners.com/alternative_investments_publications/white-papers-and-surveys.html.
8/11/2019 Kauffman Foundation We Have Met the Enemy and He is Us(1)
http://slidepdf.com/reader/full/kauffman-foundation-we-have-met-the-enemy-and-he-is-us1 18/52
17
return” from venture investing anticipated by many LPs. VC returns typically areconcentrated in only ten to twenty partnerships out of hundreds competing for investorcapital, and that elite group of investment managers can disproportionately impactaverage return results for VC funds as a whole. We suspect that the performance gapbetween the top decile of VC funds, or even the top ten funds, and the mean, is even
more dramatic, but we were unable to find published data on top decile or top ten VCfund performance.
The performance gap between top- and bottom-quartile funds
-40
-20
0
20
40
60
80
100
1981 1986 1991 1996 2001 2006
N e t I R R
Vintage Year
Upper Quartile IRR Lower Quartile IRR
Source: Cambridge Associates, 2010 Benchmark Report(http://www.nvca.org/index.php?option=com_content&view=article&id=78&Itemid=102).
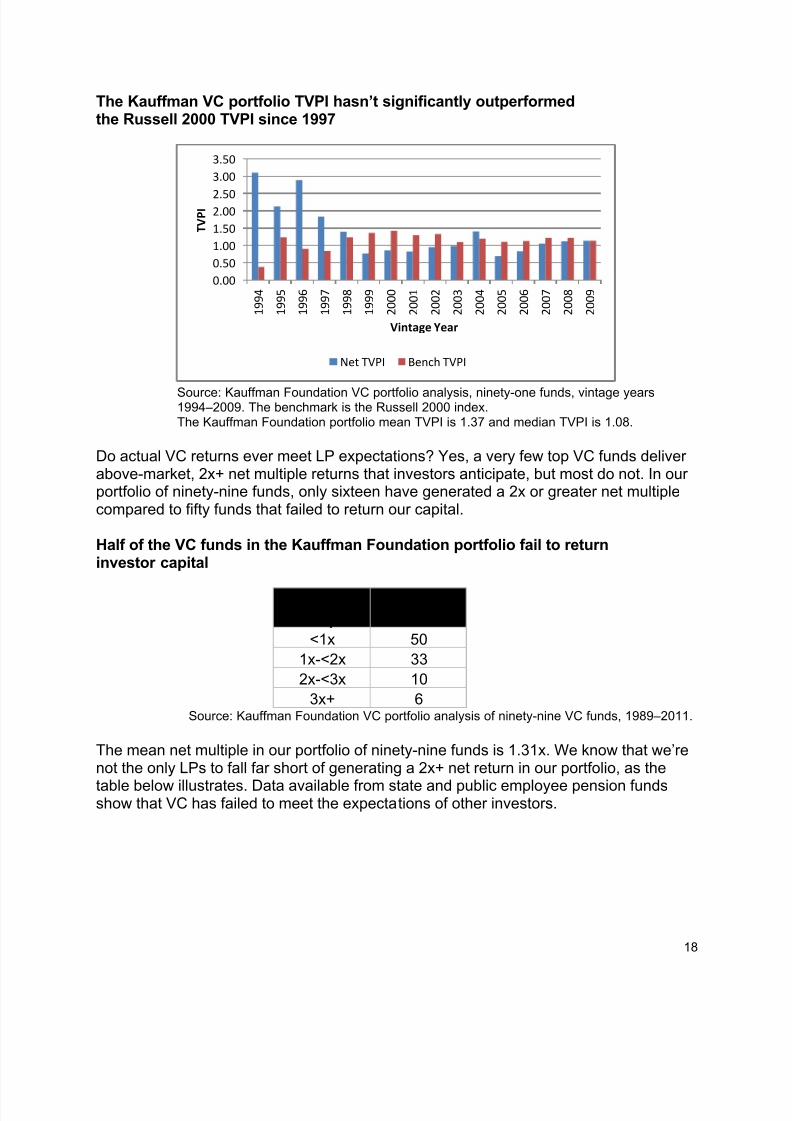
An evaluation of investment multiples in a typical VC fund yields the same conclusionabout low-average VC fund returns. In addition to IRR, many investors look to a metrictermed Total Value to Paid In Capital (TVPI). Total Value is the current value of aportfolio and all distributions returned to investors. The TVPI ratio reflects this TotalValue divided by all capital called from investors. From 1998–2009, TVPI is slightlygreater than breakeven (1x) in only five of eleven years. When we calculated the sameflows—capital calls and distributions—as if the Foundation had instead invested in theRussell 2000 stock index, we find that TVPI has not significantly exceeded the Russell2000 since 1997.
8/11/2019 Kauffman Foundation We Have Met the Enemy and He is Us(1)
http://slidepdf.com/reader/full/kauffman-foundation-we-have-met-the-enemy-and-he-is-us1 19/52
18
The Kauffman VC portfolio TVPI hasn’t significantly outperformedthe Russell 2000 TVPI since 1997
Source: Kauffman Foundation VC portfolio analysis, ninety-one funds, vintage years1994–2009. The benchmark is the Russell 2000 index.The Kauffman Foundation portfolio mean TVPI is 1.37 and median TVPI is 1.08.
Do actual VC returns ever meet LP expectations? Yes, a very few top VC funds deliverabove-market, 2x+ net multiple returns that investors anticipate, but most do not. In ourportfolio of ninety-nine funds, only sixteen have generated a 2x or greater net multiplecompared to fifty funds that failed to return our capital.
Half of the VC funds in the Kauffman Foundation portfolio fail to returninvestor capital
Net ReturnMultiple
No. ofFunds
<1x 50
1x-<2x 33
2x-<3x 10
3x+ 6Source: Kauffman Foundation VC portfolio analysis of ninety-nine VC funds, 1989–2011.
The mean net multiple in our portfolio of ninety-nine funds is 1.31x. We know that we’renot the only LPs to fall far short of generating a 2x+ net return in our portfolio, as the
table below illustrates. Data available from state and public employee pension fundsshow that VC has failed to meet the expectations of other investors.
0.00
0.50
1.00
1.50
2.002.50
3.00
3.50
1 9 9 4
1 9 9 5
1 9 9 6
1 9 9 7
1 9 9 8
1 9 9 9
2 0 0 0
2 0 0 1
2 0 0 2
2 0 0 3
2 0 0 4
2 0 0 5
2 0 0 6
2 0 0 7
2 0 0 8
2 0 0 9
T V P I
Vintage Year
Net TVPI Bench TVPI

8/11/2019 Kauffman Foundation We Have Met the Enemy and He is Us(1)
http://slidepdf.com/reader/full/kauffman-foundation-we-have-met-the-enemy-and-he-is-us1 20/52
19
Major LPs fail to realize a 2x+ net multiple ‘venture rate of return’
LPPortfolioMultiple*
Kauffman Foundation VC Portfolio 1.31x
Washington State Investment Board 1.40x
Oregon Public Employee Retirement Fund 1.50x
NY State Retirement Plan 1.04x
Sources: Kauffman Foundation VC portfolio analysis, Kauffman Foundation analysis from theWashington State Investment Board,10 the Oregon Public Employees Retirement Fund,11 andthe New York State retirement plan.12 * The Kauffman Foundation multiple is net of carry and fees. We believe all other figures aregross.
The historic narrative of VC investing is a compelling story filled with entrepreneurial
heroes, spectacular returns, and life-changing companies. The quest to invest in thenext Google guarantees that VC will retain its allure and glamour, even in the face of thedisappointing results we’ve just discussed. Investors are still attracted to the ‘lotteryticket’ potential VC offers, where one lucky ‘hit’ investment like Zynga or Facebook canoffer the potential to mitigate the damage done to a portfolio after a decade of poor risk-adjusted returns. The data suggest that such ‘hits’ are unlikely to salvage industryreturns, but may benefit investors in the right fund at the right time.
ASSUMPTION 3: VC mandates do not produce “VC returns” that exceed a publicequity benchmark by 3 percent to 5 percent per year.
The quest for consistent, high multiples on invested capital and annualized IRRs that farexceed public market equivalents historically have driven investment committees tocreate (or their consultants to recommend) policy portfolios with mandated allocations toVC.13 These mandates require investment staff to invest a fixed percent of the portfolioor a fixed amount of capital into VC, and appear to be anchored to the misconceptionthat allocating capital to a diversified basket of VC funds will result in a high “VC return”portfolio.14
Venture capital investment mandates lead to what some institutional investors term“bucket filling,” and is one reason why LPs continue to invest in venture capital despite
10 Washington State Investment Board, http://www.sib.wa.gov/financial/pdfs/quarterly/ir123110.pdf.
11 Oregon Public Employee Retirement Fund
http://www.ost.state.or.us/FactsAndFigures/PERS/AlternativeEquity/FOIA%20Q3%202011.pdf.12 New York State and Local Retirement System, Comprehensive Annual Financial Report, 2011.http://www.osc.state.ny.us/retire/about_us/annual_report_2011/index.php, and authors’ calculations.13 Josh Lerner, Private Equity Returns: Myth and Realityhttp://www.law.harvard.edu/programs/lwp/Session%20III%20-%20Lerner%20FINAL.pdf.14 Josh Lerner, Antoinette Schoar, and Wan Wong, Smart Institutions, Foolish Choices?: The LimitedPartner Performance Puzzle, 2005. http://www.mit.edu/~aschoar/SmartInstitutions.pdf.

8/11/2019 Kauffman Foundation We Have Met the Enemy and He is Us(1)
http://slidepdf.com/reader/full/kauffman-foundation-we-have-met-the-enemy-and-he-is-us1 21/52
20
poor historical returns. GPs we interviewed are very aware of “bucket filling” behavior,and said LPs with VC mandates act like the money is “burning a hole in their pockets.”They just need to spend it. Institutional investors governed by mandates presumablyattempt to get into the ten to twenty top-tier VC funds; but if they can’t, they’re left tochoose from second- and third-tier funds—a strategy that nearly guarantees returns
unlikely to exceed a low-cost, liquid, small cap public index.
VC mandates fail because generating great VC returns is entirely dependent on which funds you’re in, not how many funds.15 Generating great VC returns requires access tothe small group of best-performing funds. One study conducted by a fund-of-fundsinvestment manager revealed that, from 1986–1999, a mere twenty-nine funds raised14 percent of the capital in the industry, but generated an astonishing 51 percent of totaldistributions—about a 3.6x multiple. The remaining 500+ funds in the industrygenerated a 0.4-0.6x multiple. Put another way, the study concludes that the twenty-nine top funds invested $21 billion and returned $85 billion, while the rest of the VC funduniverse invested $160 billion and returned a scant $85 billion.16 This is a surprising
result given the strong venture capital returns from that time period.This performance skew is most dramatically reflected in the distribution of VC returns. Inour portfolio, we find a distribution in which only sixteen of ninety-nine funds generate aVC return of 2x+. The remaining funds form a long tail of underperformance, producingan average return of 1.31x. When such a skewed concentration of returns is present,investing in a large diversified group of VC funds almost certainly will result in a dilutedaverage return compared to investing in a small group of select top-performers thatdrive returns for the industry. Even a strategy of targeting “top quartile” funds actuallywill include many less-than-top-performing funds that will exert a drag on returns.
15 Josh Lerner, Private Equity Returns: Myth and Reality,http://www.law.harvard.edu/programs/lwp/Session%20III%20-%20Lerner%20FINAL.pdf.16 Shedding light on the concentration of VC returns, Flag Capital Management, 2005.http://www.flagcapital.com/pdf/1Q2005.pdf.

8/11/2019 Kauffman Foundation We Have Met the Enemy and He is Us(1)
http://slidepdf.com/reader/full/kauffman-foundation-we-have-met-the-enemy-and-he-is-us1 22/52
21
A small number of funds generate big VC returns
0.00
1.00
2.00
3.00
4.00
5.00
6.00
7.00
8.00
9.00
N e t M u l t i p l e
Ordered Fund
Source: Kauffman Foundation VC portfolio, ninety-nine funds, 1989–2011. Net multiple values as of12/31/2011.
VC mandates are becoming less prevalent than they once were, and LPs have told usthat investment consultants are moving away from recommending them. It’s becomeclear that diversification is not a strategy that works in venture capital; disciplinedinvestment into the subset of consistent top performers is. It matters little if you have aportfolio of VCs that invest in different geographies, sectors, and stages. If they are nottop-tier VCs, you are very unlikely to generate top-tier returns. There is also strongevidence that VC performance is persistent at both the top and bottom,17 which meansan avoidance of VC mandates combined with a focus on track record and stronghistorical success is one of the best ways to avoid the trap of “bucket filling.”
ASSUMPTION 4. The life of a VC fund is frequently longer than ten years. VCfunds are structured to invest capital for five years and to return all capital withinten years but we see a large percentage of our funds extending to twelve tofifteen years.
Like their investors, VC funds live longer now than they did twenty years ago. VCsstructure and market their funds based on a standard partnership life of ten years.Investors rely on this ten-year timeframe and expect returns that compensate them forthe lack of liquidity over a decade. Our data indicate that few funds actually liquidate
within a ten-year time period. In the volatile economy and exit markets of the pastdecade (and for the foreseeable future), VC fund life extensions have become the newnormal. Funds regularly require at least twelve years, and often more, to completely exitor liquidate all investments and complete the life of the fund.
17 Steven Kaplan and Antoinette Schoar, Private Equity Performance: Returns, Persistence and CapitalFlows, http://www.mit.edu/~aschoar/KaplanSchoar2005.pdf.
Mean = 1.31x
8/11/2019 Kauffman Foundation We Have Met the Enemy and He is Us(1)
http://slidepdf.com/reader/full/kauffman-foundation-we-have-met-the-enemy-and-he-is-us1 23/52
22
Longer fund lives are an expensive trend for LPs, who often are asked to pay additionalmanagement fees for a fund that extends beyond ten years. Many funds have severalcompanies left in the fund at the ten-year mark, and demand additional fees, frequentlybased on the value of the portfolio (e.g., 1.5 percent of the cost basis of the remainingportfolio). The alternative available to LPs is to receive a FedEx package of private
company share certificates. Which of the two evils is lesser?
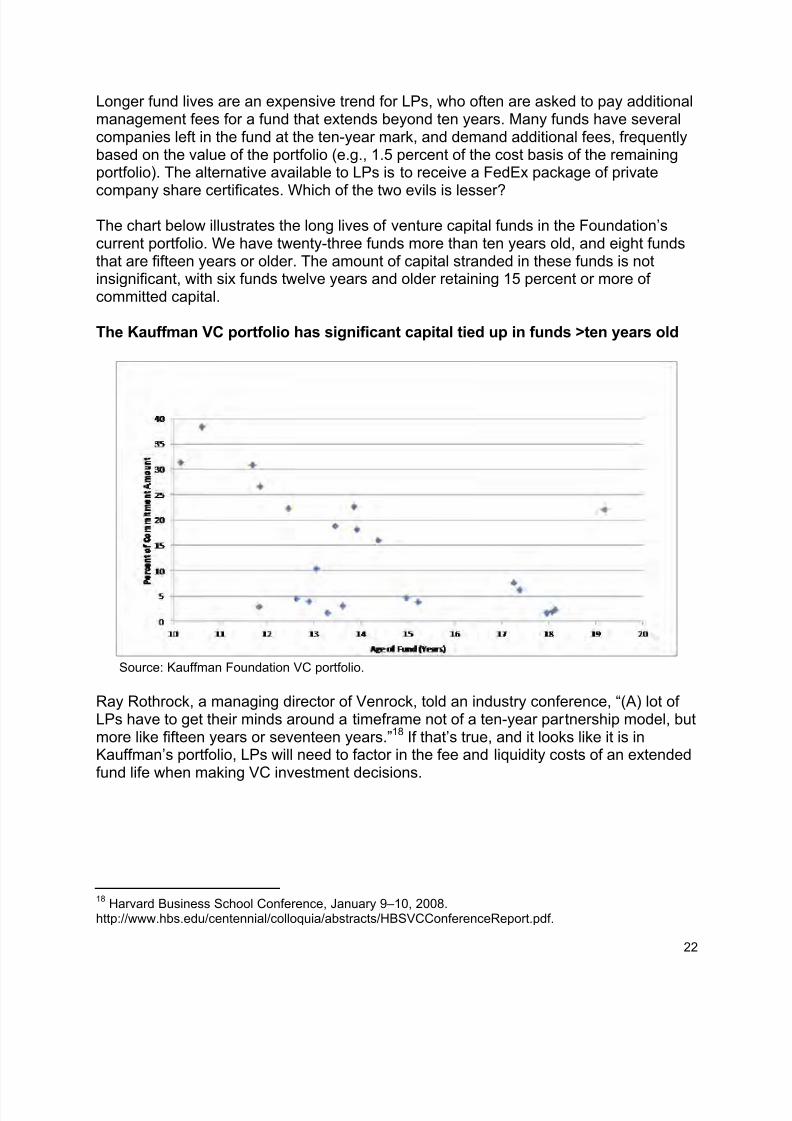
The chart below illustrates the long lives of venture capital funds in the Foundation’scurrent portfolio. We have twenty-three funds more than ten years old, and eight fundsthat are fifteen years or older. The amount of capital stranded in these funds is notinsignificant, with six funds twelve years and older retaining 15 percent or more ofcommitted capital.
The Kauffman VC portfolio has significant capital tied up in funds >ten years old
Source: Kauffman Foundation VC portfolio.
Ray Rothrock, a managing director of Venrock, told an industry conference, “(A) lot ofLPs have to get their minds around a timeframe not of a ten-year partnership model, butmore like fifteen years or seventeen years.”18 If that’s true, and it looks like it is inKauffman’s portfolio, LPs will need to factor in the fee and liquidity costs of an extendedfund life when making VC investment decisions.
18 Harvard Business School Conference, January 9–10, 2008.http://www.hbs.edu/centennial/colloquia/abstracts/HBSVCConferenceReport.pdf.

8/11/2019 Kauffman Foundation We Have Met the Enemy and He is Us(1)
http://slidepdf.com/reader/full/kauffman-foundation-we-have-met-the-enemy-and-he-is-us1 24/52
23
ASSUMPTION 5: Big VC funds fail to deliver big returns. We have no funds in ourportfolio that have raised more than $500m and returned more than 2x our capitalafter fees.
The best-performing GPs face increasing demand for access to subsequent funds, and
many understandably succumb to the pressure to raise larger funds. There are plenty ofexamples of this behavior in the market—Accel, Greylock, NEA, Oak, and Sequoia haveeach raised $1b+ funds in the past few years, in some cases despite declining returns. 19 Other funds such as Benchmark, First Round, and Foundry are focused on early-stageinvesting with fund sizes generally less than $500m.
We discussed above how VC allocations or mandates can create pressure among LPsto invest in whatever funds they can access. Many good small funds are closed to newinvestors, and institutional investors with large balance sheets cannot move theperformance needle without large allocations if they choose to invest in VC. Thiscreates pressure to invest in big funds, even if the expected returns are lower, and
makes very long odds for large institutional investors trying to win the VC investinggame.
In our own portfolio, we found that we earned an investment multiple of two times ourinvested capital only from venture funds whose commitment size was less than $500million; not a single fund that exceeded that capital raise earned more than twice theinvested capital after fees.
No Kauffman Foundation VC fund >$1billion returns more than twice the investedcapital after fees
Source: Kauffman Foundation VC portfolio analysis, ninety-five VC funds, vintage years1989–2007.
19 Bryce Roberts, What Happens if Venture Capital Gets Too Concentrated at the Top?, May 2011.http://finance.fortune.cnn.com/2011/05/23/fear-of-a-vc-monoculture/.
0
1
2
3
4
5
6
7
89
$0 $1,000 $2,000 $3,000
T V P I
Millions

8/11/2019 Kauffman Foundation We Have Met the Enemy and He is Us(1)
http://slidepdf.com/reader/full/kauffman-foundation-we-have-met-the-enemy-and-he-is-us1 25/52
24
Furthermore, our PME analysis shows that the preponderance of VC funds thatexceeded our expected high returns relative to public equities raised less than$500 million.
The Kauffman Foundation’s best-performing VC funds are smaller than $500m
Source: Kauffman Foundation VC portfolio analysis, ninety-five VC funds, vintage years1989–2007.
Our data on the relationship between fund size and returns is supported by otherempirical work within the industry. Silicon Valley Bank conducted a study on VC fundsize and performance, examining Total Value to Paid In (TVPI) capital returns from 850
VC funds from vintage years 1981–2003.20
There are three main conclusions to bedrawn from SVB’s analysis:
The majority (51 percent) of funds larger than $250 million fail to returninvestor capital, after fees;
Almost all (93 percent) of large funds fail to return a “venture capital rate ofreturn” of more than twice the invested capital, after fees.
Small funds under $250m return more than two times invested capital34 percent of the time; a rate almost six times greater than the rate forlarge funds.
20 Silicon Valley Bank, Dialing Down: Venture Capital Returns to Smaller Fund Sizes, 2009.http://yelnick.typepad.com/files/vcupdate_0410.pdf.
0
0.5
1
1.5
2
2.5
3
3.5
4
4.5
5
$0 $200 $400 $600 $800 $1,000
L a t e s t P M E
Fund Size (USD) Millions

8/11/2019 Kauffman Foundation We Have Met the Enemy and He is Us(1)
http://slidepdf.com/reader/full/kauffman-foundation-we-have-met-the-enemy-and-he-is-us1 26/52
25
Smaller VC Funds Outperform Larger-Sized Funds
Source: Silicon Valley Bank, Dialing Down: Venture Capital Returns to Smaller Fund Sizes, 2009.
Industry research conducted by Josh Lerner finds a similar relationship between IRRand fund size.21 He finds that VCs that perform well raise successively larger funds, andthey often see consistent or improving returns up until the fund size grows larger than$500m, after which performance starts to degrade. He also finds a concave relationshipbetween IRR and fund size, and a negative relationship between change in IRR andchange in fund size for a given firm.22
Source: Josh Lerner and Antoinette Schoar, Smart Institutions, Foolish Choices?, 2005.
21 The Future of Venture Finance, A Kauffman Foundation Summit, January 14–15, 2010.22 Josh Lerner, Antoinette Schoar, and Wan Wong, Smart Institutions, Foolish Choices?: The LimitedPartner Performance Puzzle, 2005. http://www.mit.edu/~aschoar/SmartInstitutions.pdf.

8/11/2019 Kauffman Foundation We Have Met the Enemy and He is Us(1)
http://slidepdf.com/reader/full/kauffman-foundation-we-have-met-the-enemy-and-he-is-us1 27/52
26
Other academic researchers have found that, for funds raised by the same GP, a 50percent increase in fund size is associated with roughly a 0.07 decline in PME, whichtranslates into a 1.5 percent to 2 percent decline in a fund’s IRR.23 They further find thatbest-in-class funds tend to have persistent top performance across serial funds, andthey hypothesize that those top funds maintain their performance because they choose
to stay smaller than those that suffer poor returns in later funds.
The institutionalization of venture capital investing has led inevitably to the growth infund size. Endowments and foundations were early investors in a category deemed toorisky for large corporate and state pension funds. The excess returns of VC funds fromthe mid-to-late 1990s induced more risk-averse investors to jump in—right about thetime that the Internet bubble was about to burst. Today we see that enormous funds failto generate excess returns, and fee-based economics misalign the interests betweenGPs and LPs, and create an environment for VCs to act like high-fee asset managersinstead of nimble backers of high-risk, high-return entrepreneurial companies.
THE MYTH OF THE J-CURVE AND THE TRIUMPH OF FUND RAISING OVER FUNDPERFORMANCE
The J-curve effect is a prevalent and widely accepted theory about the expected returnprofile of VC funds.24 The J-curve describes returns over the ten-year life of a venturefund. It illustrates how VC returns are negative early in a fund’s life due to managementfee drag and the negative performance of early “lemon” investments, and then turnpositive in the latter half of a fund’s life when investments are exited. The J-curveencourages LPs to accept early negative returns, and to wait for the highest returns oninvested capital until the final years of an expected ten-year term.
Our analysis of public data, and of the Foundation’s own history, shows that the J-curveeffect is an elusive outcome, especially in funds started after the mid-1990s. Weconducted a detailed search of academic literature and professional publications andfailed to discover empirical data that substantiate the existence of the J-curve today.Instead we found only theoretical descriptions and illustrative graphics. Below is aconceptual illustration of the J-curve from the CALPERS website (which does notappear to be based on actual CALPERS data).25
23 Steven Kaplan and Antoinette Schoar, Private Equity Performance: Returns, Persistence, and Capital
Flows, 2005. http://www.mit.edu/~aschoar/KaplanSchoar2005.pdf.24 http://www.carriedinterest.com/2006/02/weekly_private__2.html; http://www.avc.com/a_vc/2006/02/the_j_curve.html; http://www.amazon.com/Beyond-Curve-Managing-Portfolio-Venture/dp/product-description/047001198X.25 CALPERS, Understanding Private Equity Performance.http://www.calpers.ca.gov/index.jsp?bc=/investments/assets/equities/aim/private-equity-review/understanding.xml.

8/11/2019 Kauffman Foundation We Have Met the Enemy and He is Us(1)
http://slidepdf.com/reader/full/kauffman-foundation-we-have-met-the-enemy-and-he-is-us1 28/52
27
Source: CALPERS,http://www.calpers.ca.gov/index.jsp?bc=/investments/assets/equities/aim/private-equity-review/understanding.xml.
Our analysis of the J-curve effect based on data from the Kauffman portfolio relies onthe assumption that manager skill in timing both new investments and sales of existingsuccessful companies is consistent through a ten-year fund life. For instance, the most
skillful managers who raised capital in 1999 in the heart of the Internet bubble wouldhave avoided extreme valuations and a rush to invest. Less skillful managers, or thoseoptimizing management fee income, would have instead rapidly invested in order toraise a subsequent fund and thereby amplify fee income to the partnership.
We evaluated all our venture fund investments on the same ten-year investmenthorizon. We centered all eighty-eight VC funds from vintage years 1995–2009 on a timezero axis and plotted both gross and net dollar-weighted IRRs. Our aggregate portfoliodata reveals a trend of early positive returns that resembles the shape of an “n-curve,”where net IRR peaks in month sixteen (presumably driven by increases in companyvaluations, which the GPs themselves determine), and retreats precipitously over the
remaining term of fund life.26
26 Thanks to Liam Donohue of .406 Ventures for the term “n-curve.”

8/11/2019 Kauffman Foundation We Have Met the Enemy and He is Us(1)
http://slidepdf.com/reader/full/kauffman-foundation-we-have-met-the-enemy-and-he-is-us1 29/52
28
The Kauffman Foundation VC portfolio “n” curve
Source: Kauffman Foundation VC portfolio analysis. Note: The peak IRRs that our data show in part reflect the historically unprecedentedreturns from VC during the Internet boom. Excluding those extreme years changes theheight, but doesn’t alter the shape of the anti-J-curve.
An analysis of our VC investing experience reveals that, in the aggregate, our funds:
Report a peak IRR in the sixteenth month of existence and early in a fund’sinvestment period;
Raise and close a subsequent serial fund shortly after the IRR peaks. Thenext fund’s first capital call occurs at a median twenty-seven months of afund’s life, still within the previous fund’s investment period;
Experience a steady erosion of both IRR and investment multiple over theaverage fund’s remaining life, creating a return shape better termed an “n”curve than a “J” curve.
We also found that, in the Kauffman portfolio, the J-curve is an unusual outcome, not anexpected pattern of fund returns. Our analysis indicates that only twenty-five funds (29percent) in our portfolio produce returns that resemble a J-curve pattern of earlynegative returns that turn positive. Our data also show that if a fund generates anegative IRR early in its life, as the J-curve suggests, the odds are no better thanrandom that the fund will remain negative or reverse that trend and generate a positiveIRR from year five onward.

8/11/2019 Kauffman Foundation We Have Met the Enemy and He is Us(1)
http://slidepdf.com/reader/full/kauffman-foundation-we-have-met-the-enemy-and-he-is-us1 30/52
29
The elusive J-curve in the Kauffman Foundation VC portfolio
Source: Kauffman Foundation VC portfolio, vintage years 1989–2007.
We also found that returns data from CALPERS and other institutions fail to offerempirical validation for the existence of a J-curve. CALPERS declares that returns are“not meaningful” from about 100 vintage year 2007–2011 funds due to the J-curveeffect.27 But, rather than showing weak early IRRs (a J-curve), CALPERS fund data forthe period show that more than twice as many fund IRRs are positive than negative.CALSTRS reports similar data. More than twice as many recent vintage-year fundsreport positive returns. The Oregon Public Employees Retirement Fund also reportsnearly twice as many positive as negative returns for recent vintage-year funds.
The elusive J-curve in other major LP portfolios
LP Early PositiveIRRs
Early NegativeIRRs (as
expected bythe J-Curve)
Percent of Funds NotExhibiting a J-CurveDip in the First Five
Years CALPERS 71 29 71%
CALSTRS 45 18 71%
Oregon 43 23 65%Source: CALPERS, http://www.calpers.ca.gov/index.jsp?bc=/investments/assets/equities/aim/private-equity-review/aim-perform-review/home.xml; CALSTRS,http://www.calstrs.com/Investments/portfolio/privequityperformance.pdf; OPERF,http://www.ost.state.or.us/FactsAndFigures/PERS/AlternativeEquity/FOIA%20Q3%202011.pdf.
These data suggest that the J-curve effect is mostly notable by its absence. Moredistressingly, it suggests that too many fund managers focus on the front end of a fund’sperformance period because that performance drives a successful fundraising outcomein subsequent funds.
27 CALPERS, AIM Program Fund Performance Review.http://www.calpers.ca.gov/index.jsp?bc=/investments/assets/equities/aim/private-equity-review/aim-perform-review/home.xml.
86 VC funds
43% (37) positiveIRR after 27
months
28% (24) positiveIRR at end
15% (13) negativeIRR at end
57% (49) negativeIRR after 27
months
29% (25) positiveIRR at end
28% (24) negativeIRR at end

8/11/2019 Kauffman Foundation We Have Met the Enemy and He is Us(1)
http://slidepdf.com/reader/full/kauffman-foundation-we-have-met-the-enemy-and-he-is-us1 31/52
30
Quarterly data over the past seven years from Fenwick & West confirm what our “n-curve” results suggest: GPs write up portfolio company valuations considerably andfrequently early in their fund’s life, which results in early positive returns instead of anegative IRR dip. The chart below indicates that the majority of subsequent financingsfrom the past several years are up rounds, and that the average per-share increases in
valuation range from 73 percent to more than 100 percent.
28
Some academic researchalso has found that high valuation of existing investments accounts for inflated PEreturns.29
Subsequent financings often lead to significant write-ups in unrealized portfoliocompany valuations
4Q04 4Q05 4Q06 4Q07 4Q08 4Q09 4Q10Percent up roundfinancings 60% 69% 67% 69% 54% 47% 67%
Price change for all Series 84% 81% 119% 91% 80% 73% 104%
Price change Series A to Series B 99% 152% 108% 105% 74% 103%Source: Fenwick & West, Trends in Terms of Venture Financings in Silicon Valley, 2005–2011.
The “n-curve” we found in our portfolio suggests that many VCs have moved fromprofessional risk-taking and investing to professional fundraising. Under 2 and 20,raising more and bigger funds frequently can be much easier and far less risky thanmaking the right bets on the best companies. GPs can create and show positive IRRsearly in a fund’s life to best position themselves prior to the next anticipated fundraisingroadshow. LPs support this behavior by re-upping early, making investment decisionsbased on early high IRRs and investing in ever-larger funds.
The J-curve forms the cornerstone of the GP argument that early fund returns shouldn’tbe published because they are negative (but they will eventually turn positive), andbecause negative results create confusion and publicity that will put pressure on LPs toreduce investing in VC. When the University of Texas started publishing VC fundreturns under Freedom of Information Act (FOIA) requests in 2002, their actions quicklydivided the GP community (the National Venture Capital Association stood by quietly).
At one extreme, Sequoia Capital severed its twenty-two-year relationship with theUniversity of California, and then with the University of Michigan, to keep theirperformance figures from being disclosed.30 Benchmark and Charles River Partnersdeclared they would not accept public capital investors into their funds for the samereason.31 On the other side, a small group of GPs, such as Fred Wilson at Union
28 Fenwick & West, Trends in Terms of Venture Financings in Silicon Valley, 2005–2011.
www.fenwick.com.29 Lukovic Phalippou and Oliver Gottschlag, The Performance of Private Equity Funds, The Review ofFinancial Studies, 2005. Vol. 22, Issue 4, pp. 1747–1776, 2009.30 Ann Grimes, VCs scramble to keep their numbers secret, Wall Street Journal , May 11, 2004.www.signallake.com/innovation/051104WSJ_comVentureCapitalistsScrambleToKeepTheirNumbersSecr et.htm. Also see Ann Grimes, Venture Funds’ Best-Kept Secret, May 27, 2004.http://pages.stern.nyu.edu/~adamodar/New_Home_Page/articles/venturecapitalreturns.htm.31 http://www.illinoisvc.org/filebin/PDFs/IV_FOIA%20Backgrounder.pdf.

8/11/2019 Kauffman Foundation We Have Met the Enemy and He is Us(1)
http://slidepdf.com/reader/full/kauffman-foundation-we-have-met-the-enemy-and-he-is-us1 32/52
31
Square and Gerry Langeler at OVP, came out vocally in support of FOIA disclosures,chiding their fellow investors for “hiding” from their performance.32
Today, the GP community remains divided in how it handles existing FOIA investors,most of whom are obligated to publish VC fund returns. It’s now commonplace for
prospective LPs to be asked on Subscription Agreements if they are subject to FOIA,which allows GPs to identify, and then accept or reject them, a priori . But, as we’veseen, if early-fund returns often are positive, and the J-curve pattern is an unusualoutcome, then the GP argument doesn’t hold, and recent vintage-year fundperformance data should be published.
Investment committees can take steps to evaluate the existence of the J-curve effectand reduce the frequency of “n-curve” behavior in their own portfolios.
The only way to evaluate possible J-curve effects in any fund, or for any VC firmacross serial funds, or in aggregate for any portfolio, is to analyze and graph the
returns over time. Investment committees can request this data regularly tomonitor the early valuation and fundraising behavior of GPs, and to evaluate thefrequency of J-curve returns in their own portfolios. It is also useful to analyzepeak IRRs relative to end-of-fund-life returns.
Consider fund structures that mitigate the “n-curve.” The ten-year fund with afive-year investment period creates the incentives to quickly make and exitsuccessful investments early in order to raise the next fund before the investmentperiod on the prior fund is over. Evergreen fund structures offer an alternativethat reduces the impact of cumulative fees and eliminates the time pressure toproduce positive short-term returns in time for the next fundraise. An evergreen
structure reduces the pressure for near-term performance and encourages GPsto adopt a longer view on company exits. It rewards GPs for maximizing scalegrowth opportunities and long-term returns within the portfolio.
Negotiate alternatives to the usual 2 and 20 compensation structure, thusmitigating the pressure for fund raising over fund performance. In the nextsection, we discuss alternatives to 2 and 20 that reward performance overfundraising, and better align the interests of LPs and GPs.
32 AVC blog, http://www.avc.com/a_vc/2004/05/transparency_co.html; and OVP blog,http://www.ovp.com/Resources/Category/0001/0001/57/HTA_FOIA_6_04.pdf.

8/11/2019 Kauffman Foundation We Have Met the Enemy and He is Us(1)
http://slidepdf.com/reader/full/kauffman-foundation-we-have-met-the-enemy-and-he-is-us1 33/52
32
You get what you pay for: a good, hard look at 2 and 20
Somewhere along the way, LPs and their investment committees largely abdicated theresponsibility for creating and negotiating compensation structures that pay VCs to dowhat they promise to do: generate returns in excess of public equities. Many LPs state
that their minimum target return for venture capital is 300 to 500 basis points above apublic benchmark.33 Yet, they don’t structure compensation based on that outcome.Instead, institutional investors allow VCs to “charge” them based on the “marketstandard” 2 and 20. Here is how a typical 2 and 20 compensation model works:
VC firms earn a 2 percent per year management fee on committed capital duringthe first five years of the fund (the investment period);
After the investment period, the annual fee usually steps down but continuesthrough the fund’s life (e.g., 2 percent on the lower of invested capital or marketvalue of the portfolio);
The VC firm earns 20 percent of all investment profits on a deal-by-deal basis
when a portfolio company is sold.
This structure has been the industry standard for so long that it’s difficult to trace itsorigins or rationale. The same 2 and 20 model remains nearly universal today. Onestudy analyzed compensation from ninety-three VC funds raised from 1993–2006 andfound that 90 percent of the funds charged a 2 percent or more fee, and 95 percent offunds charged a 20 percent carry.34 In an earlier analysis, Paul Gompers and JoshLerner reached a similar conclusion.35
It’s interesting that VCs have positioned themselves as supporters, financers, and eveninstigators of innovation, yet there has been so little innovation within the VC industry
itself. There have been changes—more funds, more money, bigger funds, and biggerdeals—but very little ‘creative destruction’ around how funds are structured, capital israised, or VCs are paid. For more than twenty years, most LPs have accepted thefollowing terms:
A ten-year fund; A five-year investment period; A 2 percent management fee on committed capital; An 80/20 LP/GP split of any profits on investments; One percent GP capital commitment invested in their own fund; Serial fundraising every twenty-four to thirty-six months.
33 Ernst & Young, The Limited Partner Venture Capital Sentiment Survey, October 2010.
http://www.ey.com/Publication/vwLUAssets/2010_Limited_Partner_VC_Sentiment_Survey/$FILE/LP%20Sentiment%20Survey%20Report%20-%20October%202010.pdf.34 Andrew Metrick and Ayako Yasuda, The Economics of Private Equity Funds, 2010.http://www.stanford.edu/~piazzesi/Reading/MetrickYasuda2010.pdf.35 Paul Gompers and Josh Lerner, 1999, “An Analysis of Compensation in the U.S. Venture CapitalPartnership,” Journal of Financial Economics, 51, 3–44.

8/11/2019 Kauffman Foundation We Have Met the Enemy and He is Us(1)
http://slidepdf.com/reader/full/kauffman-foundation-we-have-met-the-enemy-and-he-is-us1 34/52
33
The general perception is that VCs are paid based on how well their investments do. Iftrue, that would align the interests both of LPs, who want to maximize their returns, andVCs, who are rewarded for making high-risk, high-return investments. A closer look atcompensation data shows that, while a select group of VCs remain focused ondelivering great investment performance to their investors, too many are compensated
like highly-paid asset managers.
Public data on GP compensation amounts and structure is difficult to obtain, yet onerecent study that analyzed ninety-four VC funds and estimated the amount of partnerrevenues from management fees and carry found that VC funds receive nearly two-thirds of their revenues from fixed fees rather than from performance-based carry.36 VCfunds received a median $14.61 per $100 under management, compared to only $8.20in carry. Another study analyzed vintage-year funds from 1986 through 1997, and alsofound that average VC compensation is not really performance-based at all.37 Theauthors found that an average VC received about half its compensation from themanagement fee, a surprising finding given the historically unprecedented nature of
fund returns during this period of the Internet bubble in the late 1990s.
Many LPs are keenly aware of the misalignment inherent in the 2 percent flatmanagement fee, which pays VCs more for raising bigger funds and pays them steadilywhether or not they perform. A recent Probitas Partners survey of 291 institutional LPsfound that 48 percent of respondents identified the overall level of management fees asan area of concern.38 The same percent of LPs also reported fears that fee levels weredestroying the alignment of interests between GPs and investors. An Ernst and Youngsurvey of LPs found that 89 percent of respondents want to see changes to themanagement fee.39
For smaller funds, a 2 percent fee might be a reasonable way to cover fund expenses.But the impact of fee income is most mis-aligning in the expanding universe of $1b+funds, a fund size that generates $20m per year in fees from a single fund, whetherthere are five partners or twenty-five, one office or ten, positive returns or losses. Asone GP told us: “The management fee is like heroin. No one can step away from2 and 20.”
If you don’t consider the management fee from a single fund sufficient to potentiallymisalign GP and LP interests, then consider the cumulative effect of fees paid on aseries of subsequent funds. Data from the Foundation’s portfolio indicate that themedian time to the first capital call of a subsequent fund is 26.6 months. As a thought
36 Andrew Metrick and Ayako Yasuda, The Economics of Private Equity Funds, 2010.
http://www.stanford.edu/~piazzesi/Reading/MetrickYasuda2010.pdf.37 Kate Litvak, Venture Capital Limited Partnership Agreements: Understanding Compensation Arrangements, The University of Chicago Law Review, Vol. 76, Issue 161, pp. 161–218.38 Probitas Partners, Private Equity Market Review and Institutional Investor Survey, 2010.http://probitaspartners.com/alternative_investments_publications/white-papers-and-surveys.html.39 Ernst and Young, The Limited Partner VC Sentiment Survey, 2010.http://www.ey.com/Publication/vwLUAssets/2010_Limited_Partner_VC_Sentiment_Survey/$FILE/LP%20Sentiment%20Survey%20Report%20-%20October%202010.pdf.

8/11/2019 Kauffman Foundation We Have Met the Enemy and He is Us(1)
http://slidepdf.com/reader/full/kauffman-foundation-we-have-met-the-enemy-and-he-is-us1 35/52
34
experiment, assume a VC partnership raises a $250 million fund. Early in year three,exhibiting early positive IRRs, the firm raises a subsequent $350 million fund. Demandfor Fund III remains strong, and the GPs raise another $500 million fund later in yearfive. Each new fund adds a fresh income stream to the residual fees older fundscontinue to generate over the ten-year life. Without visibility into the firm financials, LPs
don’t see the total cumulative management fees the firm receives, and, moreimportantly, don’t know where those fees go. In this theoretical example, a moderatelysuccessful VC firm raises three smaller-sized funds within the investment period of thefirst fund; and the operating income climbs to more than $19 million by year five. Ourexperience would indicate that VCs may somewhat increase fixed costs like additionalstaff with subsequent funds, but in most cases expand very conservatively.
Pay for Non-Performance: Cumulative management fees are significant andcontribute to misalignment between LPs and GPs
Fund I:
$250,000,000
Fund II:
$350,000,000
Fund III:
$500,000,000
Total Fee
IncomeYear 1 $5,000,000 $5,000,000
Year 2 $5,000,000 $5,000,000
Year 3 $5,000,000 $7,000,000 $12,000,000
Year 4 $5,000,000 $7,000,000 $12,000,000
Year 5 $5,000,000 $7,000,000 $7,500,000 $19,500,000
Year 6 $5,000,000 $7,000,000 $10,000,000 $22,000,000
Year 7 $5,000,000 $7,000,000 $10,000,000 $22,000,000
Year 8 $5,000,000 $7,000,000 $10,000,000 $22,000,000
Year 9 $5,000,000 $7,000,000 $10,000,000 $22,000,000
Year 10 $5,000,000 $7,000,000 $10,000,000 $22,000,000We assume the first capital call of the next fund is twenty-seven months after the last fund.Source: Kauffman Foundation investment staff analysis.
This example helps us understand why GPs, particularly GPs of medium and large-sized funds, find a 2 and 20 model attractive. Flat management fees based on thefund’s committed capital insulate GPs from significant personal income effects of poorperformance. Even if you agree that the management fee severely limits (the morecynical among us might even say eliminates) the downside risk to GPs ofunderperformance, one could argue that the effect is short-term. After all, if the GPdoesn’t perform, it’s unlikely the firm will be able to raise a subsequent fund, so the
management fee goes away—it’s a short-term perk at best. If only this were true. Sadly,it is well documented in the industry that many, many underperforming fund groups canand do raise subsequent funds as LPs fill their VC allocations, convince themselves thatearly fund IRRs will persist, anchor to misleading performance metrics, or rely insteadon ‘relationships’ when making investment decisions.
A better option than the 2 percent flat management fee is a budget-based managementfee based on VC firm operating expenses. The budget-based fee offers better alignment

8/11/2019 Kauffman Foundation We Have Met the Enemy and He is Us(1)
http://slidepdf.com/reader/full/kauffman-foundation-we-have-met-the-enemy-and-he-is-us1 36/52
35
between GPs and LPs, gives GPs sufficient capital to operate their firm, and providesLPs with transparency into firm economics.
The 20 percent carry structure has become another immovable, unchangeable industrystandard. This is confusing when one considers that high-performing VCs (who
presumably would have the most leverage to negotiate carry) would benefit the mostfrom a sliding scale carry structure that increased with performance. Landmark Partnersexplored the bold idea of carried interest auction, in which top-performing GPs that areover-subscribed would select their LPs by taking bids on the maximum carry each LPwould pay.40 Landmark simulated an auction among thirty-five LPs to invest in a top-tierfund that had been charging a 25 percent carry. The carry bids ranged from 22 percentto 72.5 percent, and the market-clearing interest for the $250m fund was 42.50 percent.
If a real auction would generate similar results, then top-performing GPs are leaving alot of money on the table. GPs who believe in their abilities to generate great returnswould seem much more likely to prefer reduced management fees and higher carry
percentages. LPs willing to pay for skills that create high returns certainly would preferthis structure. Similarly, emerging managers who come to market with a riskier profilethan well-established firms would seem to benefit from offering investors a carry-dominated compensation structure with lower ongoing management fees. So why wouldGPs—top performers and emerging managers included—structure compensationsystems that rely heavily on a management fee and constraints carry to a mere20 percent of profits?
Our interviews with General Partners blame LPs for insisting on consistent andhistorical fee practices. They report general rebellion by existing LPs to any change instructures that might require additional explanation or analysis for investmentcommittees. GPs insist that they have to sell what LPs will buy and they say that LPs asa group are not at all interested in discussing any alternative structures to the 2 and 20model. Our interviews indicate that many GPs are, not surprisingly, generally interestedin increased carry and more resistant (but still open) to reduced management feesbased on a budget. Our discussions with LPs confirm that it’s they who consistentlyexpress strong opposition to almost any deviation from 2 and 20.
One experienced GP raising his own first-time fund said he offered a budget-basedmanagement fee, and was open to a sliding carry based on performance (e.g.,25 percent above 2x), but felt that such a departure from industry practice sent themessage to prospective LPs that the fund was desperate to attract new investors byoffering unique and better-aligned economic terms.
Another GP from a top-performing fund that consistently is oversubscribed (thus puttinghim in a position to negotiate carry) told us his firm was reluctant to “seem greedy” andrisk alienating its investors by asking for higher carry on its best returns, even if the offerwere made in conjunction with a reduced management fee. A third GP of an
40 Ian Charles, A Carried Interest Auction?, PEHub, March 2008. http://www.pehub.com/2090/a-carried-interest-auction/.

8/11/2019 Kauffman Foundation We Have Met the Enemy and He is Us(1)
http://slidepdf.com/reader/full/kauffman-foundation-we-have-met-the-enemy-and-he-is-us1 37/52
36
oversubscribed fund told us he would love a sliding carry structure. He said he was inthe middle of fundraising and could either stick with the 2 and 20 structure and close thefund in a few months, or risk spending ‘a year and a half’ educating, explaining, andovercoming suspicion about a new structure, and maybe get the fund closed. It was arisk he didn’t want to take. Several GPs indicated that they and their partners had
discussed offering alternative structures and received very negative responses (one GPraising his second fund characterized it as a “visceral negative reaction”) from their LPsto anything other than the 2 and 20 model.
Instead of innovating with new carry structures, the best-performing VCs tend to raiseboth the management fee and carry—to a 2.5 percent and 25 percent, or 3 percent and30 percent. It’s the best of both worlds for those GPs; above-market guaranteed feesindependent of performance and above-market carry for performance. LPs chose toaccept this singular deviation from 2 and 20, and line up to invest.
The 20 percent carry is, in principle, less egregiously misaligning than the 2 percent
management fee. But the devil is in the details. How the carry is paid out is material.If carry is paid out to LPs by investment, as each exit occurs, then GPs can end uptaking carry distributions on profitable deals done early in the fund’s life, before it’s clearthat the fund overall will break even. In the worst case, this can lead to clawbacks at theend of the fund’s life, in which GPs have to pay back excess carry they received fromearlier exits.
Clawback provisions are difficult and contentious to enforce. In one notable case,Mayfield’s treatment of LPs during clawback disputes made it into industry mediareports, and reportedly cost them seven LP relationships.41 Most Limited Partnership
Agreements (LPAs) structure clawbacks as payable “after tax,” which can return as littleas 60 percent of what the LP is owed, even though the GP did not rightfully earn thecarry. If capital gains rates increase in 2013 as expected, the negative effect for LPs willbe compounded. Only a few funds require a portion of carry to be escrowed to providefor the possibility of clawback. The better structure (and one possible solution to theclawback problem) is what’s known as a ‘European style’ waterfall, where carry iscalculated based on capital drawn over the life of the fund rather than deal by deal.The most aligned carry structure is one where LP capital is returned first, followed bya preferred return or ‘hurdle’ on LP capital, then a carry split between GPs and LPson profits.
When GPs make investments in companies, they regularly structure minimum returnprovisions such as liquidation preferences, dividend payouts, and redemption options.LPs can similarly structure a minimum return through return of capital provisions plus apreferred hurdle that equals the return rate of investing in a liquid and less-riskysecurity. This structure is more common in mid-market buyout firm investments, whichregularly offer LPs return of capital plus an 8 percent hurdle before the carry split kicksin. It is rarely negotiated by LPs in venture capital funds. A few VC firms in the
41 Mayfield takes LP lumps, PE Week Wire, Aug. 12, 2005. http://www.preqin.com/item/mayfield-takes-lp-lumps/101/620.

8/11/2019 Kauffman Foundation We Have Met the Enemy and He is Us(1)
http://slidepdf.com/reader/full/kauffman-foundation-we-have-met-the-enemy-and-he-is-us1 38/52
37
Foundation’s portfolio include a similar preferred return of 8 percent to 10 percent,which ensures that the GPs are paid only for value creation above ordinary returns wecould obtain in a less risky and more liquid public equity investment.
It’s difficult to understand why LPs have allowed the 2 and 20 model to persist,
unchallenged, during two decades of enormous growth in the VC industry, theemergence of billion dollar funds, and more than a decade of VC fundunderperformance. We’re aware that some LPs don’t perceive any misalignment incurrent compensation structures. CALPERS, for instance, publicly supports the 2 and20 compensation structure, noting on its website that, “When this compensationstructure is used, the financial interests of the General Partner are aligned with those ofthe Limited Partners, including CALPERS.”42
For LPs that perceive misalignment, the vexing question is why they aren’t creating,negotiating, even demanding better-aligned compensation structure that rewardsgenerated investment returns above the public market? Creating a carry-dominated
compensation structure is riskier for GPs, and LPs fail to require them to take onthat risk.
There is some truth to the old adage “you get what you pay for.” Under the existing2 and 20 structure, many institutional investors pay GPs well to build funds, not buildcompanies. LPs also pay VCs well when they underperform. Under 2 and 20, GPs arepaid significant cash compensation even when they don’t return investor capital. Thereare steps that investment committees can take steps to create more pay forperformance.
Eliminate the 2 percent management fee on committed capital. This fee structure
pays VCs more for raising bigger funds and, in many cases, pays them wellregardless of investment performance. A budget-based management fee withcarry on returns that beat a public benchmark will pay VCs to do what they saythey will—generate above-market returns. For instance, pay a 20 percent carry ifthe PME is 1.34 (a 3 percent annual excess return), a 25 percent carry if thePME is 1.62 (a 5 percent annual excess return), and a 30 percent carry if thePME exceeds 1.97 (a 7 percent annual excess return). This structure and abudget-based management fee eliminate the risk that LPs pay highcompensation to a fund that doesn’t outperform a lower-risk, lower-fee, and fullyliquid public index. It also rewards and offers more upside returns to GPs whoperform well.
Negotiate ‘European style’ waterfalls where profit sharing occurs after investorcapital has been returned, with a preferred hurdle.
Consider an evergreen fund structure as an alternative to the 2 and 20 model.Evergreen funds are structured to better align the incentives between GPs and
42 CALPERS,http://www.calpers.ca.gov/index.jsp?bc=/investments/assets/equities/aim/programoverview.xml.
8/11/2019 Kauffman Foundation We Have Met the Enemy and He is Us(1)
http://slidepdf.com/reader/full/kauffman-foundation-we-have-met-the-enemy-and-he-is-us1 39/52
38
LPs. They have just one annual management fee (not a series of fees thataccumulate from subsequent funds), and raise capital from a limited number ofLPs on a rolling basis. Investors receive gains from successful exits, which theycan choose to reinvest. The fund restructures every few years (usually every fouryears) and investors can decide whether to continue investing or withdraw their
investment based on current values.
In the 1980s, when the VC industry was nascent, several blue chip VC firmswere structured as evergreen funds. Old family funds like Venrock (Rockefellerfamily) and Bessemer (Phipps family) were top evergreen funds formed to investthe family’s money, but within the last two decades both funds have adopted atraditional fund structure and expanded their investor base. Now there are only afew evergreen funds in the industry, such as Sutter Hill Ventures and General
Atlantic Partners, a larger growth equity firm.43
Evergreen funds are open-ended and therefore not subject to the fixed timeframe
of a ten-year fund life or the pressure and distraction of fundraising every four tofive years. Without the pressure of regular fundraising, evergreen funds canadopt a longer timeframe, be more patient investors, and focus entirely on cash-on-cash returns, rather than generating IRRs to market and raising the next fund.Bill Ford, one of the founders of evergreen fund General Atlantic Partners, notesan advantage of evergreen fund structures as the “…willingness and ability totake a long-term view on investing because we’re not on a two- or three-yearfundraising cycle like many firms need to be. We have a tendency to think notonly in five-year investment periods, but even longer term to say we’re preparedto hold an investment seven, eight, nine, ten years because there’s no pressurefor us to return capital, or to “end a fund,” or to realize returns on a certaintimeframe so we can achieve a fundraising objective.”44
43 The Kauffman Foundation is an investor in funds managed by Bessemer Venture Partners and General Atlantic Partners.44 Bill Ford interview at the Kauffman Foundation Venture Roundtable, 2008.

8/11/2019 Kauffman Foundation We Have Met the Enemy and He is Us(1)
http://slidepdf.com/reader/full/kauffman-foundation-we-have-met-the-enemy-and-he-is-us1 40/52
39
Do As I Say, Not As I Do…THE BLACK BOX OF VC FIRM ECONOMICS
“Do as I say, not as I do” is the maxim in force when it comes to VC firm economics.When VCs conduct due diligence on potential portfolio companies, they carry out a
comprehensive assessment of the company’s financials (cash flow, burn rate, keyexpenses, and stock option plans, etc.) and require complete detail on seniormanagement team salaries, bonus amounts, ‘skin in the game,’ and equity ownership.GPs know this information is crucial to understanding company financial health as wellas management team incentives, stability, and succession. Every GP we interviewedacknowledged the essential importance of senior management team compensation intheir portfolio company investments. One GP emphasized its significance, saying thatnot only does his firm “know everything about the compensation…a lot of times westructure it.”
LPs have the exact same interest in understanding the firm economics of the
partnerships in which we invest, and the compensation structure of the GPs investingour capital. LPs also have the same fiduciary obligation as GPs to understand theeconomics and incentives that underlie investments, and to evaluate how fees, carry,and ownership align investor and investee interests. What LPs seem to lack is theconviction to require the information from GPs in the same way the GPs themselvesrequire it. Even more disconcerting, investment committees and trustees fail to require adisciplined approach to understanding and evaluating firm economics of VCpartnerships to which they allocate, approve, and oversee large capital investments.
As the table below illustrates, LPs aren’t seeking any information that GPs themselvesdon’t require when they make an investment.

8/11/2019 Kauffman Foundation We Have Met the Enemy and He is Us(1)
http://slidepdf.com/reader/full/kauffman-foundation-we-have-met-the-enemy-and-he-is-us1 41/52
40
CategoryWhat GPs Get: Due
Diligence on aCompany
What GPs Give toLPs: Due Diligence
on their Firm
What LPs need:Due Diligence on
a VC Firm
“Skin in theGame”
Detailed capitalization
table, companyownership
Overall GPcommitment for the
fund (market standardis about 1 percenttotal capital raised)
Partner capitalcontributions (bypartner), partnershipownership
CompIncentives
Senior managementcomp amounts andstructure—salary,bonus amounts andstructure, equity
No standardcompensationinformation given aspart of due diligence
Partner comp amountsand structure—salary,bonus amounts andstructure, and theallocation of carry,management companyagreement
QuarterlyFinancials
Quarterly company
financials—balancesheet, incomestatement, cash flow
No standard firm
financial informationgiven as part of duediligence
Quarterly firm
financials—balancesheet, incomestatement, cash flow
ProjectedFinancialsand Budget
Full-year projectedfinancials, annualbudget (approved byBoard afterinvestment is made)
No standard firmfinancial or budgetinformation given aspart of due diligence
Full-year firm projectedfinancials, annualbudget
Past
Performance
Historical financials,
growth rates
Individual partnertrack records; cash
flow data uponrequest
Partner track records,investment cash flowdata for public marketequivalent (PME)analysis
We discussed in the prior section how management fees and management companyprofits far in excess of firm operating expenses allow GPs to lock in stable, high levelsof personal income regardless of fund performance. Additional misaligned behavioroccurs when GPs choose not to invest their personal income and assets alongside LPsin new funds. It’s become the ‘market standard’ that GPs, as a group, will invest only1 percent of committed capital in a new fund. This amount is grossly insufficient to fosteralignment of interests. The Foundation expects a 5 percent to 10 percent GPcommitment, and for any lower amounts we require a detailed understanding of thecommitment amounts relative to personal net worth, especially for senior partners.
Firm economics are enormously important in aligning LP and GP interests. It’s ourexperience that bad firm economics cause VC firms to lose top-performing partners.The VC firm personnel problems we’ve encountered in our portfolio most often originatefrom misaligned firm economics and compensation. For example, one firm in theFoundation’s portfolio lost one of its top three best-performing partners just prior toraising its next fund. As part of due diligence, we required information about the firm’s

8/11/2019 Kauffman Foundation We Have Met the Enemy and He is Us(1)
http://slidepdf.com/reader/full/kauffman-foundation-we-have-met-the-enemy-and-he-is-us1 42/52
41
compensation structure. We discovered that the two founding partners retained fullownership of the firm, enjoyed control over the fee stream and management companyprofits, and had adopted the habit of awarding themselves generous salaries andbonuses. The carry was allocated in a reasonable way among senior and juniorpartners, but the prior funds weren’t performing well enough to generate carry. The
top-performing partners were generating good returns (2x+ multiples on theirinvestments) but the other partners weren’t performing as well. As a result, the topperformer the firm lost wasn’t getting paid from carry, and the senior partners weremaking no effort to re-allocate management fee income to pay the partner forperformance.
Cash compensation and carry allocations that implicitly (or explicitly) reward seniorityand tenure at the firm rather than track record can give firm owners the lion’s share offee income and management company profits, but do little to recruit, motivate, or retainpromising junior partners and principals. Had we known earlier about the firm’s lopsidedcompensation, we might have been more active in addressing the predictable risk that
the top performer would take his track record and go where he could get paid for thereturns he generated. We also might have had sufficient information to pass on the newcommitment before staff turnover undermined our investment objectives with the fund.
The Foundation is not the only LP to think compensation information is important. Asurvey of ninety-seven LPs conducted by the Center for Private Equity andEntrepreneurship at Dartmouth found that LPs would use carry interest allocationinformation “…to better understand GP dynamics, including the structure andincentives, team building and succession planning, and changes in key individuals’compensation plans.45”
We now ask our existing and potential VC partners for firm economics andcompensation structures as part of investment decision-making. GPs tell us theyunderstand the logic about why this information is critically important to us as LPs.Despite acknowledging the power of the argument, many still refuse to provide thatinformation, and cite the long queue of potential investors waiting to invest as proof thatsuch disclosures are unnecessary.
Our team’s experience obtaining detailed firm financial and compensation structureinformation has been mixed. In our best-of-class partnerships, our experience hasexceeded our expectations. We’ve asked for and received full transparency andinformation about the firms’ operating expenses relative to the fees, and a detailedunderstanding of the partner compensation structure—ownership, cash compensation,and carry allocation. In these cases, we’re able to have informative and usefulconversations about investment team incentives, retention of promising performers,succession planning and continuity, and overall philosophy about team versus individualrewards. During these discussions, GPs have told us that it’s highly unusual to discuss
45 Center for Private Equity and Entrepreneurship, Tuck School of Business at Dartmouth, LimitedPartnership Agreement Conference Proceedings, 2004.http://mba.tuck.dartmouth.edu/pecenter/research/pdfs/LPA_conference.pdf.

8/11/2019 Kauffman Foundation We Have Met the Enemy and He is Us(1)
http://slidepdf.com/reader/full/kauffman-foundation-we-have-met-the-enemy-and-he-is-us1 43/52
42
firm economics with prospective LPs and admit that they do not enjoy the experience.These “best cases” do not yet reflect the majority, but these are the funds in which wenow most comfortably invest.
We also encounter situations in which GPs refuse to provide the information we
request. The GPs agree with our logic, and confirm how important the same informationis when they’re making investments, but they refuse to provide transparency “for as longas we can.” One perceived top-tier VC told us during fundraising discussions that “carrystructure doesn’t go outside the firm,” and that “compensation amounts and carry splitsare private.” Another perceived top-tier GP in which the Foundation doesn’t investagreed with our view about the importance of transparent partnership economics and headmitted “no good answer” as to why LPs couldn’t receive the same information abouthis fund, except that the information is “never shared.”
Eliminating the black box of VC firm economics is required if LPs seek to make prudentand aligned VC investments. LPs have historically failed to secure even minimal
information rights on issues that foster transparency and are material to aligning LP andGP interests. A well-regarded GP of a perceived top-tier VC fund told us that “LPs haveno leverage” to obtain firm economics. We suggested that LPs do have leverage—thesame leverage that VCs have when they can’t reach agreement on terms with apotential portfolio company—we can walk away. “Yes,” he said, “but LPs never walkaway.”
One of the most interesting features of LP/GP relations is the complete lack of oversightand accountability inherent in the relationship. Under current fund structures andindustry standard terms, any one LP has limited influence—the only real influence is notto re-invest in the firm’s next fund. This is partly due to firm governance structure. WhenGPs raise a fund, they appoint an Advisory Board typically composed of the biggestinvestors in a fund (their “anchor” investors) with whom they want to cultivate a closeand enduring relationship over multiple funds. Unlike a regular Board, the AdvisoryBoard generally does not meet independently, has no ongoing oversight responsibilities(e.g., approving budgets or compensation, or overseeing an audit), and has very limited(if any) approval rights—most events or actions that require LP approval require amajority or two-thirds of the LPs to sign off, so, practically speaking, the Advisory Boarddoesn’t have rights independent of the entire group of LP investors.
There is a lot of room to improve VC firms’ governance and oversight. Below is a set oflimited information and approval rights that would have a meaningful impact onincreasing transparency and accountability for LPs.

8/11/2019 Kauffman Foundation We Have Met the Enemy and He is Us(1)
http://slidepdf.com/reader/full/kauffman-foundation-we-have-met-the-enemy-and-he-is-us1 44/52
43
CategoryWhat GPs Get from
Portfolio Companies:Governance
What GPs Give toLPs: Governance
What LPs Need:Governance
“Board” SeatThe right to appoint aDirector to the Board
An Advisory Boardcomposed of GP-
appointed LPs
The right to elect LPrepresentatives to fund
Advisory Boards
InformationRights
Information rights todetailed companyquarterly and annualfinancials
No firm-levelinformation rights
Information rights todetailed firm quarterlyand annual financials
BudgetApprovalRights
Right to review andapprove annualcompany budgets
No right to review orapprove firmbudgets
Right to review andapprove annual firmbudgets
The bottom line is that no LP can fulfill its fiduciary obligations by accepting theadditional risk of investing in a firm with “black box” economics around its financials, GP
compensation, ownership structure, and carry allocations. LPs must begin to require this information during due diligence. The additional risk the lack of transparencyintroduces is difficult to justify. The Foundation is no different from other LPs in havingfailed in the past to consistently gather complete information about firm economics, butit’s a mistake our investment team is committed to avoiding in the future. Investmentcommittees can take these steps to eliminate the black box of VC firm economics:
Require investment staff and consultants during due diligence to acquire acomplete understanding of VC firm economics, management companyperformance, ‘skin in the game,’ and partner compensation structure andamounts. If we and other LPs don’t require and understand this information, we
take on unjustifiable risk related to fund performance, organizational stability, andquality of the investment team. And, as we saw earlier in our discussion on VCfund returns, LPs aren’t getting paid for taking on this additional risk.
Seek a minimum number of oversight and approval rights at the VC firm level tofoster transparency and accountability.

8/11/2019 Kauffman Foundation We Have Met the Enemy and He is Us(1)
http://slidepdf.com/reader/full/kauffman-foundation-we-have-met-the-enemy-and-he-is-us1 45/52
44
Public Market Equivalent (PME) Performance Discussion and Rationale
As we have previously discussed, the world of VC performance measures oftenconfuses, sometimes misleads and, only on rare occasions, informs. There are IRRs,TVPIs, vintage years, and quartiles. Then there’s the most mystifying measure: gross
performance, which many GPs continue to report instead of the net returns that LPsreceive (presumably because the gross numbers are bigger). None of these measuresalone is sufficient to help LPs evaluate whether or how much to invest in VC becausethey don’t incorporate the risk, illiquidity, and fees of investing in private equity relativeto public equity.
We’ve come to believe that PME, despite some statistical limitations, is the mostinformative measure of VC fund performance. We use PMEs based on fund cash flowdata to see the benefits and opportunity costs of investing in public versus privateequity, and to compare performance among GPs.46 Kaplan and Schoar (2005) bestdescribe the concept of PME: 47
We think PME is a sensible measure for LPs as it reflects the return to private equityinvestments relative to public equities. For example, a private equity fund investing$50 million in March 1997 and realizing $100 million in March 2000 would havegenerated an annualized IRR of 26 percent. However, an LP would have been betteroff investing in the S&P 500 because $50 million in the S&P 500 would have grown to$103.5 million over that period. The PME of 0.97 (or 100/103.5) for this investmentreflects the fact that the private equity investment would have underperformed theS&P 500.
We calculate PMEs using public benchmarks that most closely match the investmentstyle of the private fund. We’ve noted the tendency for consultants and investmentcommittees to compare VC returns to or benchmark against the large capitalizationweighted S&P 500 index rather than to a small capitalization benchmark. We prefer tobenchmark early-stage VC funds against the Russell 2000 index of the nation’s smallestpublicly traded companies, as we believe that index best reflects the higher pricevolatility, higher beta, and higher sensitivity of small companies to economic cycles.
A VC fund with a ten-year life should deliver a PME of 1.34 or greater to justify theexpectation of 3 percent annualized returns above a public benchmark. A PME of 1.0indicates that the VC fund performed the same as the public market. A PME greaterthan one indicates that the venture fund beat the public market, and a PME less thanone says the Foundation unnecessarily tied up money in a high-fee, poorly performing
alternative to publicly traded stocks. Our data show that, of ninety-six VC funds in ourportfolio from 1989–2010 vintage years, only twenty-five funds delivered the expectedVC return of 3 percent annual excess returns.
46 See Appendix A: Sample PME Calculation for more detail.47 Steven Kaplan and Antoinette Schoar, Private Equity Performance: Returns, Persistence and CapitalFlows, August 2005. http://www.mit.edu/~aschoar/KaplanSchoar2005.pdf; see also James M. Kocis,James C. Bachman IV, Austin M. Long III, and Craig J. Nickels, Inside Private Equity, 2009.http://www.amazon.com/Inside-Private-Equity-Professional-Investors/dp/0470421894.

8/11/2019 Kauffman Foundation We Have Met the Enemy and He is Us(1)
http://slidepdf.com/reader/full/kauffman-foundation-we-have-met-the-enemy-and-he-is-us1 46/52
45
Vintage Group Number ofFunds
Venture Returns 3Percent Better Than A
Public Index
“BattingAverage”
Before 1995 14 10 .710
1996–2000 48 8 .1662001–2005 21 2 .095
2006–2010 13 5 .385
When we consider the asset flow into venture capital funds from about 1997 to today,we must ask whether there is just too much money chasing a small and finite number ofcompanies able to scale and grow sufficiently to reward investors for a decade ofpatient waiting. We find that, in the Foundation’s portfolio, the majority of ourinvestments in vintage years prior to 1995 exceeded the returns offered in the publicstock market by more than 3 percentage points a year. At a .710 “batting average,” thefund managers belonged in any hall of fame. Over sixteen subsequent years, in a
market where ample capital drives the value of early stage companies up sharply,success has been elusive.
A specific example from the Foundation’s portfolio will illustrate Kaplan and Schoar’spoint that PME is a helpful tool for helping LPs decide where to invest. Below are thePME results of a traditional, early-stage VC firm in our portfolio. A cursory reading of thereturns would suggest that Fund II displayed the highest level of early-stage investingskill because the net IRR was higher than returns to LPs in all other funds. However, thePME evaluation counter-intuitively suggests that Fund I demonstrated a higher level ofinvestment skill as returns exceeded those available in publicly traded common stocksby more than two times, net of all fees and carry.
PME is useful for investment decision-making
Fund Net IRR Net Multiple PME
I 28% 2.20 2.68
II 46% 1.74 1.95
III -2% 0.89 0.59
IV 2% 1.09 0.92
V -14% 0.72 0.62The benchmark for the PME is the Russell 2000.
Source: Kauffman Foundation VC portfolio analysis.
The PME is particularly useful for investment decision-making. In the above example,an LP considering whether to participate in a prospective Fund VI can better quantifythe chronic poor performance of Funds III, IV, and V when measured against returnsfrom public equity markets. The PME tells us clearly that, in the most recent three funds,we weren’t compensated for the risk, illiquidity, and high fees we accepted when weinvested in this private fund instead of a public equity index.

8/11/2019 Kauffman Foundation We Have Met the Enemy and He is Us(1)
http://slidepdf.com/reader/full/kauffman-foundation-we-have-met-the-enemy-and-he-is-us1 47/52
46
PMEs also can add transparency across portfolios for investment committees, and allowfor easier evaluation of consultant and investment staff performance. For instance,University of California investment committee members likely have a challenging timecomparing portfolio performance to other LPs, or across the UC system. Each universityuses its own benchmark, some of which seem difficult to interpret at first glance.
PME can increase transparency and comparability of returns across VC portfolios
LPCurrent Benchmark
CALPERS Wilshire 2500 ex-Tobacco
CALSTRS Custom benchmark
UC Berkeley “Benched against itself”
UCLA “Actual PE returns”
UC Irvine Russell 3000 + 3%
UC San Diego S&P 500 + 5%UCSF S&P 500 + 7%
UC Santa Cruz “Actual return of private equityportfolio”
Source: 2010 UC Annual Endowment Report, www.calpers.org, www.calstrs.org.
If the investment committee used PME based on a standard public benchmarkdetermined a priori , it could easily compare portfolio performance across the UCsystem, and relative to other LPs. LPs could allocate their capital more effectively ifperformance data were calculated and reported in this standardized manner. Fundperformance data that is consistent and standardized creates transparency that lowers
the ‘costs of capital’ (due to information asymmetry and risk) for all parties financing andgrowing young companies. With new regulatory guidance expected from the SEC forprivate equity, a clear, standard performance measure such as PME would benefit allparticipants in the industry.
We discussed earlier that the ‘J-curve’ effect has been tied exclusively to discussionsabout a fund’s IRR—a time-weighted calculation subject to enormous bias andestimation errors. We were curious whether our preferred PME measurement might berelevant in the context of a J-curve analysis. We looked at PME in eighty-eight fundsand found that funds that lag public markets early in their life were very likely(71 percent) to persist with poor relative returns. We didn’t find a dominant J-curve
effect—only 15 percent of the funds exhibit a J-curve pattern of returns—but early poorPME ratios may do a better job than early poor IRRs in helping investors identifyventure commitments that may be problematic.

8/11/2019 Kauffman Foundation We Have Met the Enemy and He is Us(1)
http://slidepdf.com/reader/full/kauffman-foundation-we-have-met-the-enemy-and-he-is-us1 48/52
47
Most VC funds do not generate returns of 3 percent to 5 percent better thanpublic markets as investors expect
Source: Kauffman Foundation VC portfolio. The public benchmark is the Russell 2000.
The Foundation now calculates cash flow-based PMEs for all our VC funds on aquarterly basis, and uses PMEs regularly to make investment decisions. Over the pastseveral years, as we have consolidated our portfolio, we have used PME to prioritizeour best-performing funds, and to concentrate our investment activity and increase ourinvestment amounts in those partnerships. We’ve also used it to identify where we havecapital tied up in poorly performing partnerships, and to develop a list of partnerships wewould be willing to sell on the secondary market.
Investment committees can take steps to understand how the funds in their portfoliosperform against a public benchmark and to start using PME as a tool in investmentdecision-making.
Require their investment staff and consultants to calculate cash flow-basedPMEs for each fund in the portfolio to evaluate how many generate the excessreturns of 3 percent to 5 percent above the public market sought by mostinvestors.
Require cash flow data on prior funds to calculate historic PMEs before investingwith a new GP or re-upping in existing partnerships. PMEs from older funds willprovide information on GP performance persistency and consistency acrossdifferent market cycles.
88 VC funds
25% (22) with VC
PME after27 months
7% (6) VC PME at end
18% (16) fail to generateVC PME at end
75% (66) fail togenerate VC PME
after 27 months
15% (13) VC PME at end
60% (53) fail to generateVC PME at end
8/11/2019 Kauffman Foundation We Have Met the Enemy and He is Us(1)
http://slidepdf.com/reader/full/kauffman-foundation-we-have-met-the-enemy-and-he-is-us1 49/52

8/11/2019 Kauffman Foundation We Have Met the Enemy and He is Us(1)
http://slidepdf.com/reader/full/kauffman-foundation-we-have-met-the-enemy-and-he-is-us1 50/52
49
decision in a top-tier fund where our analysis convinces us that outsized historic returnsare common and likely to continue.
There will not likely be significant pushback on the industry’s GP-favorable terms untilinvestment committees find and exercise more fiduciary courage. Investment
committees have a real role to play in asking their investment staff the questions andrequiring the data to better evaluate VC firm performance, and improve transparencyand GP/LP alignment.
The data we’ve reviewed in this paper demonstrate that VCs are good capitalists. Theyact in ways that are consistent with maximizing their economic profits. LPs seem to beless-good capitalists, because they repeatedly fail to negotiate key economic terms thathave a significant impact on their investment returns. Why is this? Investmentcommittees have to be alert to the possibility of misaligned incentives between theirinstitution and the individuals making investments and investment recommendations.For instance, many institutional investment teams (including ours) have one or more
dedicated investors who focus on PE/VC investing. There is little incentive for thoseinvestors to alert the investment committee to the poor performance or misalignedincentives of the venture capital industry, or to question whether it makes sense tocontinue investing at historic levels. After all, who wants to introduce a line of inquirythat could be job threatening? And, speaking of jobs, our own casual review ofinstitutional private equity investors reveals median job tenure of around three years.There is much turnover at the LP investor level, which creates little incentive for any oneinvestor to fight hard on behalf of their institution for better economic terms, especially ifthey are not getting paid for that outcome and views such behavior as harmful toindustry ‘relationships,’ which the investor likely will find beneficial in landing theirnext job.
Similarly, investment consultants generate search fees and revenues for investigatingand recommending venture capital firms, and may have little incentive to take anindependent stance against an underperforming investment category that they are, atthe same time, recommending to other clients. Committees that ask questions, andrequire data and analysis on their VC portfolios can avoid these pitfalls.
The Foundation has been an active VC investor for more than twenty years, and, in thepast, we’ve invested in funds without strong performance or aligned terms. We havecome to believe that it’s a mistake to continue to do so. As recently as 2007, we hadmore than sixty GPs and more than 100 funds in our portfolio. Over the past few years,through attrition and select sales on the secondary market, we’ve reduced our portfolioto thirty GPs and sold about sixty funds that were underperforming and/or significantlymisaligned with our interests. We’ve walked away from investments in emergingmanagers and re-ups in existing partnerships that were not willing to enter into better-aligned terms. We know we may need to continue to walk away, even from some of ourcurrent favorite VCs who, if they continue to be successful, may succumb to thepressure and incentives to raise bigger funds.

8/11/2019 Kauffman Foundation We Have Met the Enemy and He is Us(1)
http://slidepdf.com/reader/full/kauffman-foundation-we-have-met-the-enemy-and-he-is-us1 51/52
50
In the meantime, we’ve taken our fee savings from our reduced partnerships and havedeployed the newly available capital into building a concentrated portfolio of largercommitments in our top-performing, better-aligned funds, re-allocating some capital intoless-risky liquid public equities, and initiating a small program to make direct, early-stage equity investments financed entirely by management fee savings.
The Foundation and other LPs will continue to invest in venture capital funds. There arestill existing and emerging funds that are committed to taking risk, building companiesand realizing great returns. Venture capital isn’t going away, and we’re not suggestingthat it should. But we are arguing strongly that LPs who invest in VC need to rethinkhow they invest. As investors, we need to require more transparency, betterperformance metrics, and a lot more alignment. Investment staff can’t do this bythemselves. Investment committees need to help, by moving beyond asset allocationand exercising meaningful fiduciary oversight around the performance, structure, andeconomics of the VC investments they approve.
Our plan at the Foundation is to continue to invest in VC, but with a different approachthan in the past. Most significantly, we will be smaller, more disciplined, and much moreselective investors than we have been historically. We anticipate having a long-termportfolio of only five to ten VC partnerships. Our focus is to choose relationships withVCs whose performance offers a significant return over a public market equivalent andwho are open to structuring aligned partnerships. What we seek is a transparent andaccountable partnership relationship with our funds, on terms that make economic andfiduciary sense.
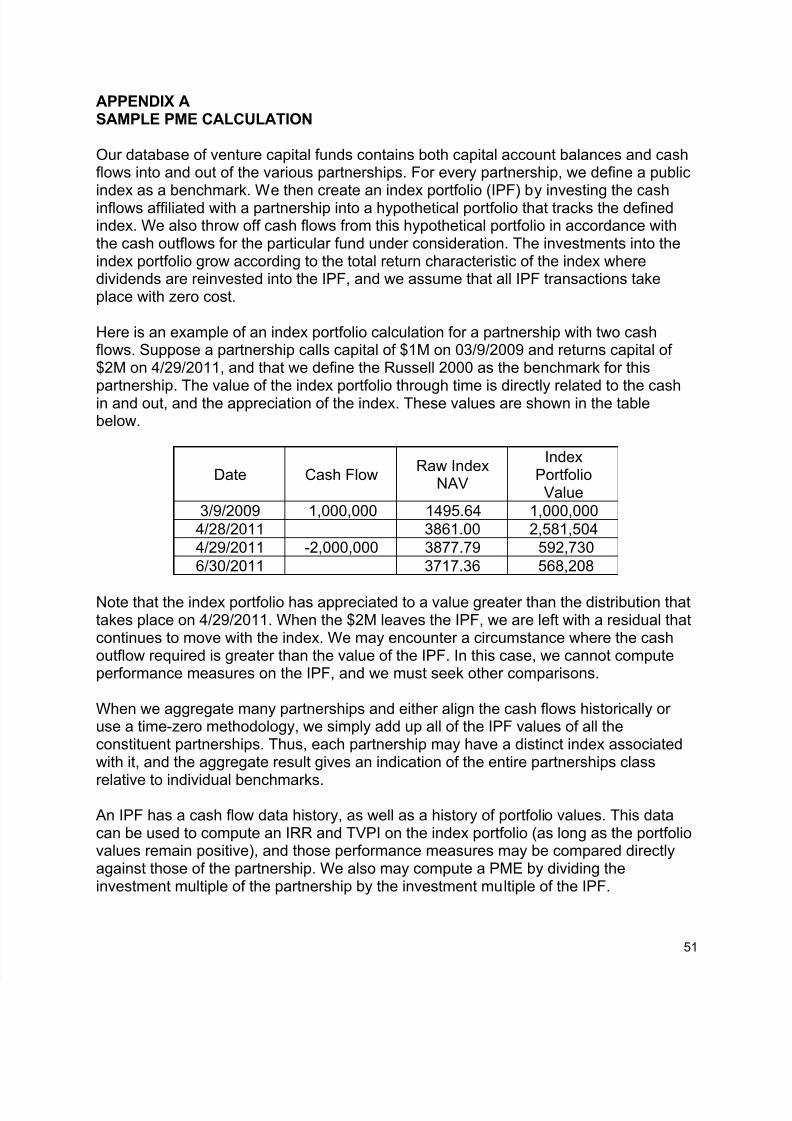
8/11/2019 Kauffman Foundation We Have Met the Enemy and He is Us(1)
http://slidepdf.com/reader/full/kauffman-foundation-we-have-met-the-enemy-and-he-is-us1 52/52
APPENDIX ASAMPLE PME CALCULATION
Our database of venture capital funds contains both capital account balances and cashflows into and out of the various partnerships. For every partnership, we define a public
index as a benchmark. We then create an index portfolio (IPF) by investing the cashinflows affiliated with a partnership into a hypothetical portfolio that tracks the definedindex. We also throw off cash flows from this hypothetical portfolio in accordance withthe cash outflows for the particular fund under consideration. The investments into theindex portfolio grow according to the total return characteristic of the index wheredividends are reinvested into the IPF, and we assume that all IPF transactions takeplace with zero cost.
Here is an example of an index portfolio calculation for a partnership with two cashflows. Suppose a partnership calls capital of $1M on 03/9/2009 and returns capital of$2M on 4/29/2011, and that we define the Russell 2000 as the benchmark for this
partnership. The value of the index portfolio through time is directly related to the cashin and out, and the appreciation of the index. These values are shown in the tablebelow.
Date Cash FlowRaw Index
NAV
IndexPortfolioValue
3/9/2009 1,000,000 1495.64 1,000,0004/28/2011 3861.00 2,581,5044/29/2011 -2,000,000 3877.79 592,7306/30/2011 3717.36 568,208
Note that the index portfolio has appreciated to a value greater than the distribution thattakes place on 4/29/2011. When the $2M leaves the IPF, we are left with a residual thatcontinues to move with the index. We may encounter a circumstance where the cashoutflow required is greater than the value of the IPF. In this case, we cannot computeperformance measures on the IPF, and we must seek other comparisons.
When we aggregate many partnerships and either align the cash flows historically oruse a time-zero methodology, we simply add up all of the IPF values of all theconstituent partnerships. Thus, each partnership may have a distinct index associatedwith it, and the aggregate result gives an indication of the entire partnerships class
relative to individual benchmarks.
An IPF has a cash flow data history, as well as a history of portfolio values. This datacan be used to compute an IRR and TVPI on the index portfolio (as long as the portfoliovalues remain positive), and those performance measures may be compared directly