kawashita, l. f., & hallett, s. r. (2012). a crack tip ... · 2898-2913....
TRANSCRIPT

Kawashita, L. F., & Hallett, S. R. (2012). A crack tip tracking algorithm forcohesive interface element analysis of fatigue delamination propagation incomposite materials. International Journal for Solids and Structures, 49(21),2898-2913. 10.1016/j.ijsolstr.2012.03.034
Peer reviewed version
Link to published version (if available):10.1016/j.ijsolstr.2012.03.034
Link to publication record in Explore Bristol ResearchPDF-document
University of Bristol - Explore Bristol ResearchGeneral rights
This document is made available in accordance with publisher policies. Please cite only the publishedversion using the reference above. Full terms of use are available:http://www.bristol.ac.uk/pure/about/ebr-terms.html
Take down policy
Explore Bristol Research is a digital archive and the intention is that deposited content should not beremoved. However, if you believe that this version of the work breaches copyright law please [email protected] and include the following information in your message:
• Your contact details• Bibliographic details for the item, including a URL• An outline of the nature of the complaint
On receipt of your message the Open Access Team will immediately investigate your claim, make aninitial judgement of the validity of the claim and, where appropriate, withdraw the item in questionfrom public view.

A crack tip tracking algorithm for cohesive interface
element analysis of fatigue delamination propagation in
composite materials
Luiz F. KawashitaI , Stephen R. Hallett
Advanced Composites Centre for Innovation and Science (ACCIS), University of Bristol,Bristol BS8 1TR, UK
Abstract
A novel approach is proposed for the use of cohesive elements in the analysis
of delamination propagation in composite materials under high-cycle fatigue
loading. The method is applicable to delamination propagation within the
Paris-law regime and is suitable for the analysis of three-dimensional struc-
tures typical of aerospace applications. The major advantages of the pro-
posed formulation are its complete independence of the cohesive zone length
– which is a geometry-dependent parameter – and its relative insensitivity to
mesh refinement. This is only possible via the introduction of three nonlocal
algorithms, which provide (i) automated three-dimensional tracking of de-
lamination fronts, (ii) an estimation of direction of crack propagation and (iii)
accurate and mesh-insensitive integration of strain energy release rate. All
calculations are updated at every increment of an explicit time-integration fi-
nite element solution, which models the envelopes of forces and displacements
with an assumption of underlying constant cyclic loading. The method was
ICorresponding address: School of Engineering, Cardiff University, The Parade, CF243AA, Wales, UK. Tel: +44 (0)29 208 75910, Email: [email protected]
Published in: International Journal of Solids and Structures 2012, 49(21), Pages 2898–2913doi:10.1016/j.ijsolstr.2012.03.034

implemented as a user-defined subroutine in the commercial finite element
software LS-Dyna and supports the analysis of complex three-dimensional
models. Results are presented for benchmark cases such as specimens with
central cut plies and centrally-loaded circular plates. Accurate predictions
of delamination growth rates are observed for different mesh topologies in
agreement with the Paris-laws of the material.
Keywords: cohesive, element, fatigue, delamination, fiber, composite
1. Introduction
Laminated composites are increasingly being used as replacements for
metals in safety-critical components for the aerospace industry. The rea-
sons are mainly related to the weight savings that composites can provide
over their metallic counterparts for similar levels of stiffness and strength.
Another key advantage is the highly anisotropic behaviour of composite lam-
inae which can be used to tailor the in-plane properties of the laminate and
provide optimised designs with significant improvements in performance.
Delamination is the mode of failure that requires the lowest load for initi-
ation in laminated composites. During operational conditions, delamination
initiation can be facilitated by the presence of manufacturing defects such
as voids, fibre waviness, contaminants and others. A delaminated composite
will present stiffness changes which, if not directly detrimental to in-service
performance, can trigger further damage mechanisms which will result in loss
of load bearing capacity.
The susceptibility to delamination often makes safe-life designs imprac-
tical for laminated composites. Better solutions are usually obtained via
2

damage-tolerant approaches. The latter require knowledge of the propaga-
tion behaviour of flaws under typical operational conditions. Inspection or
monitoring techniques are required to estimate the remaining life of the com-
ponent based either on the characteristics of detectable flaws or by assuming
the presence of flaws which are below the detection limits. However, the ac-
curate lifing of composite structures in the presence of delaminations is still
a challenge, especially due to the lack of appropriate analysis tools.
The present work addresses the problem of predicting delamination growth
in complex laminated structures subjected to high-cycle fatigue loading. The
requirement in this case is not only to provide models that predict delami-
nation growth rate with accuracy, but also to ensure that these models are
applicable to realistic three-dimensional geometries. The strategy is based
on the use of three-dimensional nonlinear finite element (FE) approximations
with a modified cohesive zone modelling (CZM) approach for the analysis of
fatigue-driven delamination.
The CZM technique combines the classical fracture mechanics concept
of a critical strain energy release rate criterion for crack propagation with
the damage mechanics assumption of a zone ahead of the crack tip where a
gradual and irreversible loss of material stiffness is observed (Dugdale, 1960;
Barenblatt, 1962). This approach is very attractive for modelling fracture
processes within the FE analysis framework because it avoids the treatment
of singular and oscillatory stress fields which would be observed with the
assumption of linear elasticity. Pioneering works on FE implementations of
the CZM technique include Planas and Elices (1991) and Ortiz and Pandolfi
(1999) while application to the modelling of delamination in fibre-reinforced
3

composites include Petrossian and Wisnom (1998); Chen et al. (1999); Alfano
and Crisfield (2001); Camanho et al. (2003); Borg et al. (2004); Jiang et al.
(2007).
More recently the CZM approach has been further developed to model
fatigue crack growth (Nguyen et al., 2001; Yang et al., 2001) and delamina-
tion propagation in composites under fatigue loading (Robinson et al., 2005;
Turon et al., 2007; Harper and Hallett, 2010). Whilst the advantages of the
CZM approach are preserved for the fatigue case, complications arise in the
computation of a local damage rate which satisfies the global Paris-law. One
limitation, which has been reported elsewhere (Turon et al., 2007; Harper
and Hallett, 2010) and will be explored in detail in this paper, is the need for
estimating the cohesive zone length ahead of the numerical crack tip. As this
length is dependent on the geometry and loading configuration (Harper and
Hallett, 2008), the need for its estimation limits the applicability of these
models in complex three-dimensional problems.
In this paper an updated method is proposed for modelling fatigue de-
lamination growth in the Paris regime using cohesive interface elements. The
methodology eliminates the dependency on the cohesive zone length, which
is observed in other formulations reported in the literature, via the auto-
mated tracking of numerical delamination fronts. This procedure allows the
introduction of further improvements which would not be possible otherwise,
namely the computation of effective cohesive element lengths and a more
accurate extraction of the strain energy release rate amplitude.
This paper is organised as follows. Section 2 reviews the baseline mixed-
mode cohesive formulations for monotonic and cyclic loading. Section 3
4

describes the proposed enhancements which are related to the use of a crack
tip tracking algorithm. In Section 4 two test cases are analysed to illustrate
the proposed formulation, and Section 5 summarises the main conclusions of
the present work.
2. Cohesive formulation
The cohesive formulations described here have been implemented in the
form of 8-node three-dimensional elements with single integration point in
the commercial software LS-Dyna, via the addition of a user-defined material
subroutine for the under-integrated hexahedral continuum element. This
model builds upon the implementation for monotonic loading presented by
Li et al. (2008) and extended to fatigue loading by Harper and Hallett (2010).
The displacements of the two surfaces making the cohesive element are
interpolated linearly from nodal values at a central integration point so that
the resultant displacement jump vector, δ, can be obtained as shown in Fig-
ure 1. The projection of this vector onto one of the surfaces gives three
orthogonal displacement components, namely δ33, δ12 and δ13. These com-
ponents represent the cohesive displacements in the out-of-plane, in-plane
transverse and in-plane longitudinal directions respectively, following con-
ventional composites notation. Because a resultant shear formulation will be
used, the in-plane orientation of the local 1-axis is irrelevant, and the dis-
tinction between two shear components δ12 and δ13 is only required for the
finite element implementation.
5

33δ
13δ
23δδ
Figure 1: Displacement components of a cohesive element.
2.1. Displacement-based damage
In standard cohesive element formulations the degradation of the inter-
face is characterised by the loss of cohesive stiffness which is represented by
a scalar damage variable (Chen et al., 1999; Alfano and Crisfield, 2001; Ca-
manho et al., 2003). This variable will be referred to as the static displacement-
based damage, Ds, which is a function of the displacement jump across the
interface. This variable can be interpreted as the overall macroscopic stiff-
ness loss of the material as a combination of all irreversible micro-structural
changes that occur during straining.
The formulation of the displacement-based damage variable utilised in
this work has been described elsewhere (Jiang et al., 2007) and is summarised
here for completion. The mixed-mode cohesive displacement δm is defined in
terms of mode-I (opening) and resultant mode-II (shear) components, i.e.,
δI = 〈δ33〉 (1)
δII =√δ12
2 + δ132 (2)
δm =√δI
2 + δII2 , (3)
where 〈·〉 is the McCauley bracket, i.e. 〈·〉 = max (· , 0).
6

The cohesive law adopted here is the bilinear model shown in Figure 2a.
For an arbitrary mode ratio, the basic parameters defining the traction-
separation response are the cohesive stiffness K, the cohesive strength σmaxm
and the critical strain energy release rate GC. The latter is equivalent to the
work done per unit area upon complete interface degradation and is given by
the integration of cohesive tractions as functions of the displacement jump,
GC =
∫ δfm
0
σm dδm , (4)
where σm is the mixed-mode traction and δfm is the displacement at failure.
GC can be interpreted graphically as the area under the traction-displacement
curve in Figure 2a.
mδ
maxmσ
mσ
emδ
CG
fmδ
K
σ
Iδ
IIδ
maxIIσ
maxIσ
fIδ
fIIδ
eIIδ
eIδ
Mode-I
Mode-II
(a) (b)
Figure 2: Mixed-mode cohesive law (a) and its definition in terms of mode-I and mode-II
components (b).
The mixed-mode quantities K, σmaxm and GC are effective values which
depend on mode ratio. The basic cohesive properties are therefore defined
separately for pure modes I and II as shown in Figure 2b. The effective mixed-
7

mode cohesive law is then calculated and updated at every time increment
based on the instantaneous ratio between the cohesive displacements δI and
δII, following the formulation described in detail in Jiang et al. (2007).
For initiation a quadratic damage initiation criterion applies,√(〈σI〉σmax
I
)2
+
(σII
σmaxII
)2
= 1 , (5)
and for failure a linear criterion is used,
GI
GIC
+GII
GIIC
= 1 . (6)
The displacement-based damage parameter Ds is defined in terms of the
resultant cohesive displacements, i.e.,
Ds =〈δmaxm − δem〉δfm − δem
, (7)
where δem is the resultant displacement for damage initiation, and δmaxm is the
historical maximum resultant displacement given by,
tδmaxm = max(t−∆tδmax
m , tδm) , (8)
with superscripts t and t−∆t indicating the current and the previous time
increments, respectively. It follows that the interface is undamaged when
Ds = 0, damaged when 0 < Ds < 1 and failed when Ds = 1.
A modification of the formulation above was proposed by Li et al. (2008)
which takes into account the enhancement in effective mode-II properties
when the interface is under through-thickness compressive stresses. The ef-
fective mode-II strength is given by,
σmaxII = σmax
II − η σ33 , (9)
8

where σ33 is the through-thickness stress, σmaxII is the mode-II delamination
strength in the absence of through-thickness stresses, and η is the empirically
derived enhancement factor. It is assumed that the initial cohesive stiffness
and softening slope remain unchanged with this enhancement. The effective
critical mode-II strain energy release rate is then,
GIIC =
(1− 2η
(σ33
σmaxII
)+ η
(σ33
σmaxII
)2)GIIC . (10)
Li et al. (2008) showed that the experimental results for glass-fibre/epoxy
laminates presented by Cui et al. (1994) are best fit with an average value of
η = 0.74, which also gives a good fit for high rate tests on carbon-fibre/epoxy
specimens. This value has been used in the analysis of cut-ply specimens as
will be shown later.
2.2. Fatigue-based damage
When modelling fatigue damage accumulation and propagation over large
numbers of cycles, it is often impractical to analyse each load cycle individ-
ually. For constant amplitude loading, one alternative is to analyse only the
envelopes of forces and displacements (Robinson et al., 2005; Turon et al.,
2007; Harper and Hallett, 2010), as illustrated in Figure 3, using an exter-
nal variable to represent the number of elapsed load cycles. For explicit
time-integration analyses it is convenient to take the number of cycles to be
proportional to simulation time. The latter is treated as pseudo-time since
it is no longer related to physical properties such as kinetic energy or strain
rate.
For the generalised load-controlled problem in Figure 3 the force applied
to the model is initially increased gradually from zero to the desired peak
9

FE force or displacementFatigue model assumption
pseudo-time
pseudo-time
F
minF
maxF
initialisation fatigue degradation
F∆
δ
Figure 3: Modelling the envelopes of loads and displacements in a cyclic regime.
value using a smooth polynomial curve to minimise any dynamic effects.
Once the system is in static equilibrium, the fatigue degradation law is ac-
tivated. This will result in fatigue crack growth and reduction of overall
stiffness, causing the displacement envelopes to expand as shown in Fig-
ure 3. During a fatigue analysis, changes to the boundary conditions (e.g.
changes in load amplitude) must be gradual since the solution should not be
affected by dynamic effects.
The underlying formulation for propagation of a delamination under cyclic
loading follows that of Harper and Hallett (2010) which uses a modified Paris-
law,da
dN= C
(∆G
GC
)m, (11)
where a is the delamination length, N is the number of load cycles, ∆G is
the strain energy release rate amplitude, GC is the mixed-mode critical strain
energy release rate, equation (4), and C and m are empirical parameters
10

derived from experimental data. For load-controlled tests the strain energy
release rate amplitude ∆G is obtained from the peak value of strain energy
release rate, Gmax, via,
∆G =(1−R2
)Gmax , (12)
where R is the positive and constant ratio between trough and peak applied
loads (R-ratio).
In order to account for the accumulation of damage during cyclic loading,
a fatigue damage parameter Df is introduced (following Robinson et al.,
2005) so that the total accumulated damage becomes,
Dtot = Ds +Df . (13)
The computation of the fatigue component Df requires several steps.
Firstly, the peak value of strain energy release rate, Gmax, is obtained for
each cohesive integration point via the numerical integration of the history
of tractions and displacements at that point, i.e. evaluating equation (4) in
discrete form. We use a midpoint rule so that at a given time step t the
instantaneous value of the integrated strain energy release rate is,
G (inst)max =
nstep(t)∑k=1
(σk + σk−1
2
)(δk − δk−1) , (14)
where k is the increment number and nstep(t) is the number of increments
between time zero and time t.
Previous implementations of fatigue cohesive elements reported in the
literature (Robinson et al., 2005; Turon et al., 2007; Harper and Hallett,
2010) used instantaneous values of strain energy release rate to compute the
11

fatigue degradation rate, i.e. assuming that Gmax = G(inst)max . It will be shown
that G(inst)max can vary considerably during the fatigue degradation of a cohesive
element, so an alternative definition for Gmax is proposed in the present work.
Once ∆G is known, a local measure of delamination growth rate, da/dN ,
can be computed using the modified Paris-law in equation (11). This de-
lamination growth rate must then be converted into a fatigue damage rate,
dDf/dN , to be used in the constitutive update of the cohesive element.
This conversion requires knowledge of the area within the cohesive zone
where fatigue damage is being accumulated. Previous work on fatigue cohe-
sive elements (Turon et al., 2007; Harper and Hallett, 2010) performed the
computation of Df at every integration point within the cohesive zone, and
by doing so required an estimation of the cohesive zone length in the direction
of propagation. Because the cohesive zone length is a load and geometry-
dependent parameter (Turon et al., 2008; Harper and Hallett, 2008), the
present work aimed at developing a formulation which is independent of this
value and of any assumptions required for its estimation. This makes the
model more appropriate for use in arbitrary three-dimensional geometries
with complex loading conditions.
Here the damage rate is derived in terms of an effective element length
le which represents the length associated with a single cohesive integration
point in the direction of crack propagation. This length is obtained from
nodal coordinates as will be discussed in Section 3.2. According to the Paris-
law in equation (11), the delamination will advance the distance le after a
certain number of cycles to failure, ∆Ne, has elapsed so that,
∆Ne =dN
dale . (15)
12
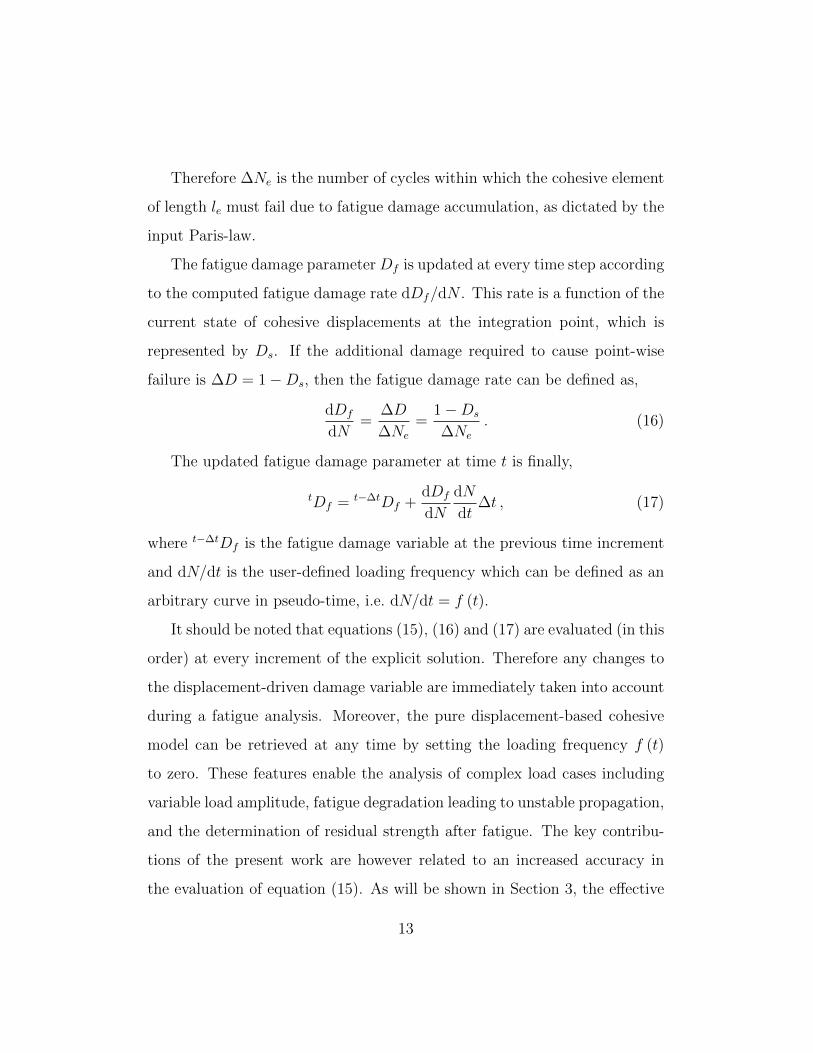
Therefore ∆Ne is the number of cycles within which the cohesive element
of length le must fail due to fatigue damage accumulation, as dictated by the
input Paris-law.
The fatigue damage parameter Df is updated at every time step according
to the computed fatigue damage rate dDf/dN . This rate is a function of the
current state of cohesive displacements at the integration point, which is
represented by Ds. If the additional damage required to cause point-wise
failure is ∆D = 1−Ds, then the fatigue damage rate can be defined as,
dDf
dN=
∆D
∆Ne
=1−Ds
∆Ne
. (16)
The updated fatigue damage parameter at time t is finally,
tDf = t−∆tDf +dDf
dN
dN
dt∆t , (17)
where t−∆tDf is the fatigue damage variable at the previous time increment
and dN/dt is the user-defined loading frequency which can be defined as an
arbitrary curve in pseudo-time, i.e. dN/dt = f (t).
It should be noted that equations (15), (16) and (17) are evaluated (in this
order) at every increment of the explicit solution. Therefore any changes to
the displacement-driven damage variable are immediately taken into account
during a fatigue analysis. Moreover, the pure displacement-based cohesive
model can be retrieved at any time by setting the loading frequency f (t)
to zero. These features enable the analysis of complex load cases including
variable load amplitude, fatigue degradation leading to unstable propagation,
and the determination of residual strength after fatigue. The key contribu-
tions of the present work are however related to an increased accuracy in
the evaluation of equation (15). As will be shown in Section 3, the effective
13

length le can be computed automatically, and the crack growth rate da/dN
determined more accurately with the use of a crack tip tracking algorithm.
The degradation of cohesive tractions due to the presence of fatigue dam-
age is illustrated by the traction-damage curve in Figure 4. At time t0 the in-
terface has accumulated displacement-based damage only, and at time t0+∆t
the first fatigue degradation occurs. Cohesive stresses are then evaluated
from the total damage variable Dtot, reducing the cohesive traction to a
point below the original softening curve.
The presence of a fatigue damage componentDf causes the global stiffness
of the interface to decrease, resulting in a further increase in relative displace-
ments. Therefore the displacement-based damage variable Ds also increases
when fatigue damage is accumulated, as shown in Figure 5a (Harper and
Hallett, 2010). This will cause the instantaneous measure of strain energy
release rate, G(inst)max , to increase as the element undergoes fatigue degradation,
as shown by the shaded area in Figure 5a. The total work per unit area for
crack propagation under this combination of displacement-based and fatigue-
based damage is G(fail)max , which is shown as the shaded area in Figure 5b.
D
maxσσ
10 sD
0t
fD
tt ∆+0
Figure 4: Stress-damage curve showing degradation due to fatigue damage.
14

δ
maxσσ
0
(fail) maxG
fδδ
maxσσ
0
(inst) maxG
fδ
ttt ∆−
(a) (b)
Figure 5: Different measures of integrated strain energy release rate, (a) instantaneous
value at time t and (b) final value at failure.
The procedures above have been described for a constant mode ratio. In
order to enable the analysis at any ratio between mode-I and mode-II two
options of mixed-mode growth laws have been implemented. The first is a
simple linear rule of mixtures between modes I and II, i.e.,
C =GI
GI +GII
CI +GII
GI +GII
CII (18)
m =GI
GI +GII
mI +GII
GI +GII
mII , (19)
where the subscripts indicate mode-I or mode-II components.
The second option is a more sophisticated non-monotonic rule developed
by Blanco et al. (2004) which had been implemented previously by Harper
and Hallett (2010), i.e.,
logC = logCI + logCm
(GII
GI +GII
)+ log
CII
CICm
(GII
GI +GII
)2
(20)
m = mI +mm
(GII
GI +GII
)+ (mII −mI −mm)
(GII
GI +GII
)2
(21)
where the subscript m indicates that an additional Paris-law is required at
15

an intermediate mode ratio.
3. Nonlocal algorithms
3.1. Crack tip tracking
Previous work on fatigue cohesive elements (Robinson et al., 2005; Turon
et al., 2007; Harper and Hallett, 2010) relied on the application of a fatigue
degradation parameter to every cohesive integration point within the dam-
age zone, i.e. every cohesive element for which the displacement jump was
greater than the displacement for damage initiation. Therefore these for-
mulations were point-local, meaning that the state of a cohesive integration
point depended solely on the properties of that point alone. Point-local algo-
rithms are generally the choice when working with commercial finite element
software because most user-defined subroutines are point-local by default.
Computing a fatigue degradation rate for every damaged element within
the cohesive zone adds a further level of complexity to the analysis when the
phenomenological Paris-law is employed. More specifically, the conversion of
the point-local strain energy release rate amplitude into the correct macro-
scopic crack growth rate will require knowledge of the cohesive zone length
in the direction of crack propagation.
Turon et al. (2007) proposed the use of a closed form analytical solution
for mode-I loading of a Double Cantilever Beam (DCB) specimen to esti-
mate the ratio between the element area and the total area of the cohesive
zone. Although this method was shown to predict fairly well also mode-II
and mixed-mode fatigue delamination, its accuracy for full three-dimensional
16

geometries will depend on the validity of this assumption regarding the co-
hesive zone length, which was investigated by Harper and Hallett (2008).
Harper and Hallett (2010) opted to leave the cohesive zone length as an
input parameter to be determined either via analytical solutions or additional
finite element analyses. They assumed that the fatigue degradation affected
only one half of the cohesive zone length, which provided good agreement
with experimental results.
In the present work a new formulation is proposed which is independent
of the cohesive zone length and has a considerably lower dependency on mesh
refinement, therefore being more appropriate for use in full three-dimensional
problems. This formulation is based on the introduction of three nonlocal
aspects in the computation of fatigue damage rate, namely:
• identification and tracking of cohesive elements pertaining to delami-
nation fronts;
• estimation of the local direction of crack propagation and the compu-
tation of effective element lengths;
• computation of crack growth rate based on the integrated strain energy
release rate at failure.
The implementation was done in the commercial software LS-Dyna but
is general enough so that it can be ported to other commercial explicit FE
solvers as long as user-defined element subroutines are available. The imple-
mentation is based on a user-defined constitutive law for cohesive elements
plus separate algorithms for the nonlocal computations described above. The
latter were compiled together with the user-defined constitutive subroutine
17

but were called only once at every new time step. This allowed the non-
local algorithms to interact with the constitutive update with virtually no
interruption to the solution process, and therefore negligible increase in CPU
usage.
The crack tip tracking algorithm performs an initial search for potential
delamination fronts at the start of the fatigue loading step. This search is
based on the analysis of local maxima in instantaneous strain energy release
rate, G(inst)max . Elements with high local G
(inst)max are identified as potential de-
lamination fronts and will accumulate fatigue damage. This initial search
avoids the need for pre-existing cracks, and ensures that multiple delamina-
tions are taken into account.
δ
σ
δ
σ
failed Paris-law degradation elastic
elastic
Paris-law degradation Paris-law degradation
Paris-law degradationfailed damaged damaged
baseline fatigue formulation
crack tip tracking formulation
Figure 6: Application of fatigue damage without and with the crack tip tracking algorithm.
Once the fatigue degradation has been activated, the tracking of crack
fronts is accomplished via the exchange of point-local data between neigh-
bouring integration points whenever a cohesive failure occurs. Once an el-
18
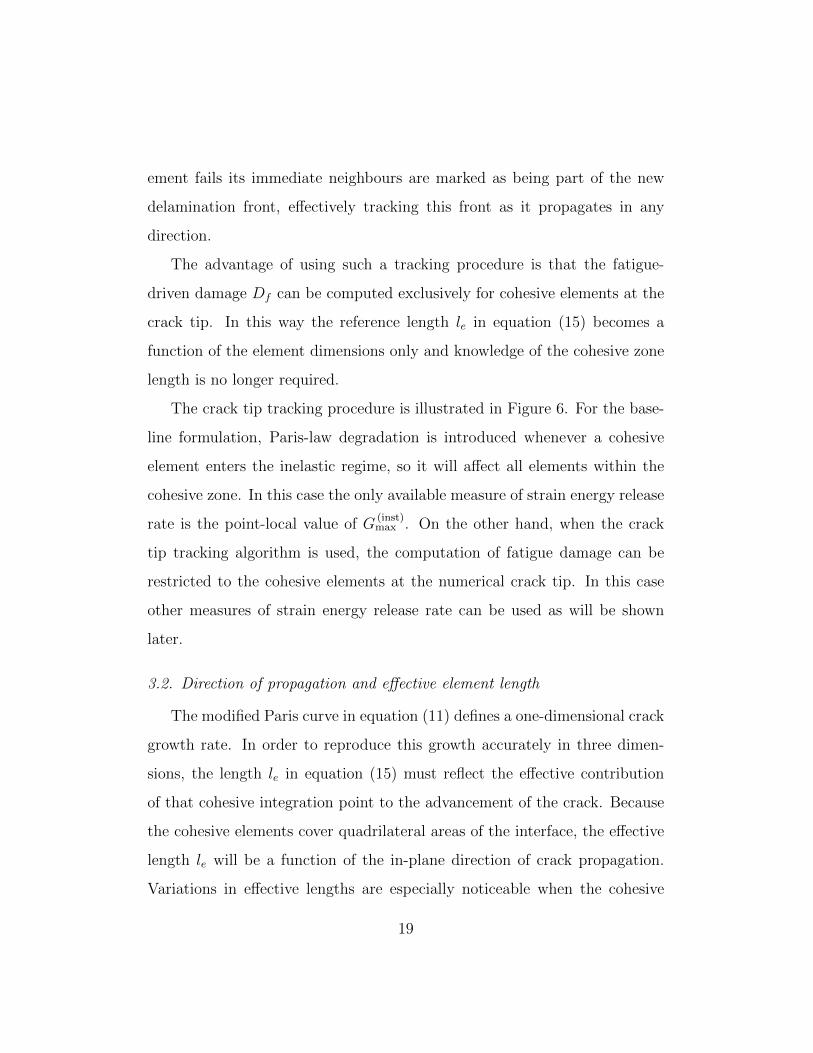
ement fails its immediate neighbours are marked as being part of the new
delamination front, effectively tracking this front as it propagates in any
direction.
The advantage of using such a tracking procedure is that the fatigue-
driven damage Df can be computed exclusively for cohesive elements at the
crack tip. In this way the reference length le in equation (15) becomes a
function of the element dimensions only and knowledge of the cohesive zone
length is no longer required.
The crack tip tracking procedure is illustrated in Figure 6. For the base-
line formulation, Paris-law degradation is introduced whenever a cohesive
element enters the inelastic regime, so it will affect all elements within the
cohesive zone. In this case the only available measure of strain energy release
rate is the point-local value of G(inst)max . On the other hand, when the crack
tip tracking algorithm is used, the computation of fatigue damage can be
restricted to the cohesive elements at the numerical crack tip. In this case
other measures of strain energy release rate can be used as will be shown
later.
3.2. Direction of propagation and effective element length
The modified Paris curve in equation (11) defines a one-dimensional crack
growth rate. In order to reproduce this growth accurately in three dimen-
sions, the length le in equation (15) must reflect the effective contribution
of that cohesive integration point to the advancement of the crack. Because
the cohesive elements cover quadrilateral areas of the interface, the effective
length le will be a function of the in-plane direction of crack propagation.
Variations in effective lengths are especially noticeable when the cohesive
19

elements have large aspect ratios.
The solution proposed in this work consists of a nonlocal algorithm that
estimates the direction of propagation for each cohesive element along the
crack front. This is done based on the analysis of its neighbouring elements at
every time increment. The effective element length is taken as the distance
between consecutive rows of integration points assuming that the pattern
observed at the current element is repeated over its nearest neighbours. In
order to minimise the computational overhead, only the four nearest neigh-
bours of each cohesive element are included in the check. This results in five
possible directions of propagation for each quadrant as shown in Figure 7.
The five values of le are shown graphically in Figure 7 together with their
expressions in terms of the two in-plane average lengths l1 and l2, which are
obtained via the interpolation of nodal coordinates.
For minimisation of CPU cost, these five effective lengths are pre-computed
at the start of the fatigue degradation step and stored as state variables for
each cohesive element in the model. The choice of which length is used for
the calculation of fatigue damage rate is made on-the-fly according to the
state of the nearest neighbours at the current time step.
Clearly this algorithm will produce only coarse estimates of the direction
of crack propagation but as will be shown in later sections, it seems to provide
a good balance between CPU cost and accuracy, effectively removing the
mesh bias otherwise seen with elements of large aspect ratio.
3.3. Strain energy release rate extraction
As mentioned earlier, the instantaneous measure of strain energy release
rate G(inst)max varies as the elements accumulate fatigue damage. Moreover, the
20

∙
∙
∙
∙∙ ∙
∙
∙
∙
∙
∙∙ ∙
∙ ∙
∙ ∙ ∙
∙
∙
∙
∙
∙
∙
∙ ∙
∙ ∙ ∙
∙ ∙ ∙
∙
∙
∙
∙
∙
∙
∙∙ ∙
∙ ∙ ∙
∙ ∙
∙
∙
∙
∙
∙
∙ ∙
∙∙ ∙
∙ ∙
∙ ∙
∙
∙∙
∙ ∙ ∙
∙
∙ ∙
∙
∙
∙
∙ ∙ ∙
∙∙
∙∙
1lle = 2lle =22
21
21
4
2
ll
llle+
=2
22
1
21
ll
llle+
=2
22
1
21
4
2
ll
llle+
=
Case 1 Case 2 Case 3 Case 4 Case 5
∙
∙ ∙ ∙∙
∙ ∙ ∙∙
∙ ∙∙
∙ ∙ ∙∙
∙∙ ∙ ∙
∙ ∙∙ ∙
∙
∙∙
∙ ∙ ∙
∙ ∙∙ ∙
∙ ∙
∙
∙ ∙ ∙∙∙
∙∙ ∙ ∙
Failed DamagedParis law2l
1l
∙∙ ∙
Figure 7: Five effective in-plane element lengths (in each quadrant) for a given cohesive
element (at the numerical crack tip) based on the status of its four nearest neighbours.
magnitude of the variation in G(inst)max with increasing fatigue damage depends
on the level of mesh refinement, being more pronounced in coarser meshes.
Figure 8 illustrates this phenomenon for two different levels of mesh refine-
ment. In fine meshes, Figure 8a, the high resolution of the cohesive zone
results in an accurate measure of Ds at the crack tip at time t0. The dashed
line shows the ideal traction-separation behaviour for an ideal mesh where
le → 0. Because the element area is small, its contribution to the overall in-
terfacial stiffness is also small and during fatigue degradation, i.e. for t > t0,
the cohesive displacements will increase only slightly so that G(inst)max will re-
main nearly constant. On the other hand, for coarse meshes, Figure 8b,
the resolution of the cohesive zone is poor and Ds is under-estimated at the
crack tip at time t0. Because the element is large, it will have a more signif-
21

icant contribution the overall interfacial stiffness. Therefore, during fatigue
degradation the cohesive displacements will increase considerably causing a
noticeable increase in G(inst)max .
The variable nature of G(inst)max with fatigue degradation and mesh refine-
ment make it an inappropriate measure of strain energy release rate for the
translation of the Paris-law into an element damage rate. Instead, one would
seek to use the final value, G(fail)max , which is the best estimate of the total
energy dissipated during crack propagation over the element area. However,
the correct value of G(fail)max is not available until the element has undergone
full fatigue degradation, so it cannot be used to determine how the element
should be degraded. Therefore it seems impossible to reproduce the Paris-law
accurately using point-local formulations alone.
δ
σ
0
fine mesh
δ
σ
0
coarse mesh
(a) (b)
0t0t
Figure 8: Fatigue degradation at the crack tip cohesive element for (a) a fine mesh and
(b) a coarse mesh (the dashed line shows the ideal behaviour for le → 0).
To address this issue, we introduce a third nonlocal aspect in the calcula-
tion of fatigue damage rate which is the extraction of the total strain energy
release rate at failure, G(fail)max , from elements in the wake of the numerical
crack front. This method assumes that the variation of G(fail)max between con-
22

secutive cohesive elements is small, which holds true for the majority of cases
of practical interest. Though, as a conservative measure the value of G(fail)max
is used if and only if it is greater than the instantaneous value of G(inst)max for
the current element. The nonlocal integrated strain energy release rate is
therefore,
G (NL)max = max
(G (inst)
max , G (fail)max ,1, G
(fail)max ,2, G
(fail)max ,3, . . . , G
(fail)max ,n
), (22)
where the indices represent a subset of n elements used by the nonlocal
algorithm, and G(fail)max ,i = 0 if the ith neighbour has not yet failed. For the
8-node cohesive elements adopted in the present work only the four nearest
neighbours are considered for simplicity.
4. Test cases
Two test cases have been used to demonstrate the formulations described
above, namely:
• central cut-ply specimens in tension-tension loading (Allegri et al.,
2011), where the mode-II loading and the refined mesh result in a high
resolution of the cohesive zone;
• NAFEMS benchmark for circular delamination (Davies, 2002; Davies
and Zhang, 1995), here extended to the analysis of fatigue loading,
where the three-dimensional aspects of the formulation are explored
with variable mesh refinement.
4.1. Cut-ply specimens
The testing and analysis of unidirectional central cut-ply specimens was
described in detail by Cui et al. (1994) for glass-fibre/epoxy laminates. The
23

2 cut plies
4 continuous plies
ply thickness 0.125 mm
4 continuous plies
Figure 9: Cut-ply specimen geometry and detail of the central discontinuous plies.
introduction of discontinuous central plies promotes mode-II delamination
along four interfaces when longitudinal tensile loads are applied, as shown in
Figure 9.
The experimental data presented here are the result of a recent test pro-
gramme carried out at the University of Bristol on the Hexcel IM7/8552
carbon/epoxy pre-preg material. Laminates containing 8 continuous plies
and 2 central cut plies were manufactured on flat tooling as larger plates and
cured in an autoclave. Final cured ply thicknesses were on average 0.125 mm.
Glass/epoxy end tabs were adhesively bonded to the plate before individual
specimens could be machined to the final dimensions shown in Figure 9.
Tests were performed under quasi-static tension and tension-tension fatigue
in a servo-hydraulic testing machine.
24

4.1.1. Quasi-static loading
Quasi-static tests were performed under a crosshead velocity of 0.5 mm ·min−1.
The average net section failure stress (which takes into account only the thick-
ness of continuous plies) was 1932.3 MPa with a coefficient of variation of
2.1 % for five repeats.
A finite element model of the gauge section of the specimen was pro-
duced as shown in Figure 10. Only a quarter model was required due to
symmetries. For compatibility with the three-dimensional cohesive elements
described in Section 2, ‘slice’ models were built using hexahedral continuum
elements. Only one element was needed along the width direction and a state
of generalised plane strain was assumed. In relation to the global coordinate
system depicted in Figure 10b, this assumption meant that the strains ε22
were constant throughout the model. This was achieved via the introduction
of kinematic constraints which enforced zero 2–direction displacements for
all nodes on one side of the slice, and coupled 2–direction displacements for
all nodes on the other side.
The distinction between continuous and cut plies resided in the definition
of boundary conditions for the longitudinal symmetry plane (Figure 10b).
The cross-section of continous plies was represented by symmetry boundary
conditions, while the cross-section of cut plies was left as a free surface. The
mesh was refined near the interface between continuous and discontinuous
plies for the first 25 mm from the plane of the cut, and coarsened gradually
elsewhere. The minimum element length was 0.03125 mm (1/4 of a ply thick-
ness) and the maximum was 0.5 mm, while the width of the model was set to
0.2 mm. User-defined cohesive elements were inserted along the interface, off-
25

4 continuous plies (symmetry plane)
1 cut ply (free surface)
(a)
(b)
Cohesive elements
1 2
3
Figure 10: Finite element model of a cut-ply specimen (quarter model).
setting continuous and discontinuous plies by the interface element thickness
of 0.01 mm. In order to reduce the required runtime, the mass was scaled by
a factor of 105 which resulted in relatively short CPU times while still avoid-
ing excessive dynamic effects. Because these are unidirectional laminates,
thermal residual stresses have been neglected.
Elastic material properties for IM7/8552 were obtained from Jiang et al.
(2007) and are shown in Table 1. Critical fracture energies for delamination
along 0◦ ply interfaces were obtained from a best fit to experimental mixed-
mode data presented by Jimenez and Miravete (2004) and are shown together
with the remaining basic cohesive properties in Table 2.
Quasi-static tests were modelled by imposing a displacement boundary
condition to all nodes at the end of the gauge section (i.e. 50 mm away from
the cut), at a value of 1 mm·s−1.
Experimental and numerical results for static loading are compared in
Figure 11. A good agreement is observed in terms of load for first delamina-
tion, with a slightly closer agreement for the compression enhanced cohesive
26

Table 1: Elastic properties for IM7/8552 UD laminates.
E11 E22 E33 ν12 ν13 ν23 G12 G13 G23 ρ
[MPa] [MPa] [MPa] [MPa] [MPa] [MPa] [g·cm−3]
161000 11380 11380 0.32 0.32 0.436 5170 5170 3980 1.5
Table 2: Interlaminar cohesive properties for IM7/8552.
GIC GIIC σmaxI σmax
II KI KII η
[N·mm−1] [N·mm−1] [MPa] [MPa] [N·mm−3] [N·mm−3]
0.2 1.0 60.0 90.0 4.67× 10⁵ 4.67× 10⁵ 0.74
formulation, equations (9) and (10), due to the presence of a moderate com-
pressive stress of about 35 MPa across the interface at the delamination load.
The strain energy release rate associated with cut-ply delamination was
obtained via the closed-form solution proposed by Petrossian and Wisnom
(1998),
G =σnet
2(htot − hcut)hcut
4E11htot
, (23)
where σnet is the average net section stress, htot is the total specimen thick-
ness, hcut is the thickness of discontinuous plies, and E11 is the elastic mod-
ulus in the fibre direction. The average strain energy release rate computed
from experimental data was 1.18 N·mm−1. This is slightly higher than the
1.0 N·mm−1 input value but should in fact be compared to the enhanced
value of 1.247 N·mm−1 obtained from equation (10).
27

0
500
1000
1500
2000
2500
0.000 0.002 0.004 0.006 0.008 0.010 0.012 0.014
Displacement / Initial Gauge Length
Net
sec
tion
stre
ss [M
Pa]
experimental averagestandard cohesive modelcompression-enhance cohesive model
delamination, compression-enhanced cohesive model
delamination, standard cohesive model
delamination, experimental average
Figure 11: Numerical and experimental curves of net section stress versus displacement
for quasi-static cut-ply tests.
4.1.2. Fatigue loading
During the fatigue experiments, a clip-gauge extensometer was placed
over the centre of the gauge length, across the central cut, so that delamina-
tion crack growth rates (da/dN) could be estimated from the rate of change
in dynamic modulus. Peak forces were chosen as different fractions of the
average (net section) static failure stress, namely 75 %, 70 %, 60 %, 50 %
and 40 % severities. Tests were performed with R-ratios of 0.1, 0.3 and 0.5.
Loading frequencies were adjusted in order to keep a constant stress rate
between all tests, with the baseline frequency being 5 Hz for the 75 % sever-
ity case. The Paris-law coefficients obtained from cut-ply tests are shown in
Table 3.
The analysis of fatigue tests using the envelope modelling technique re-
28
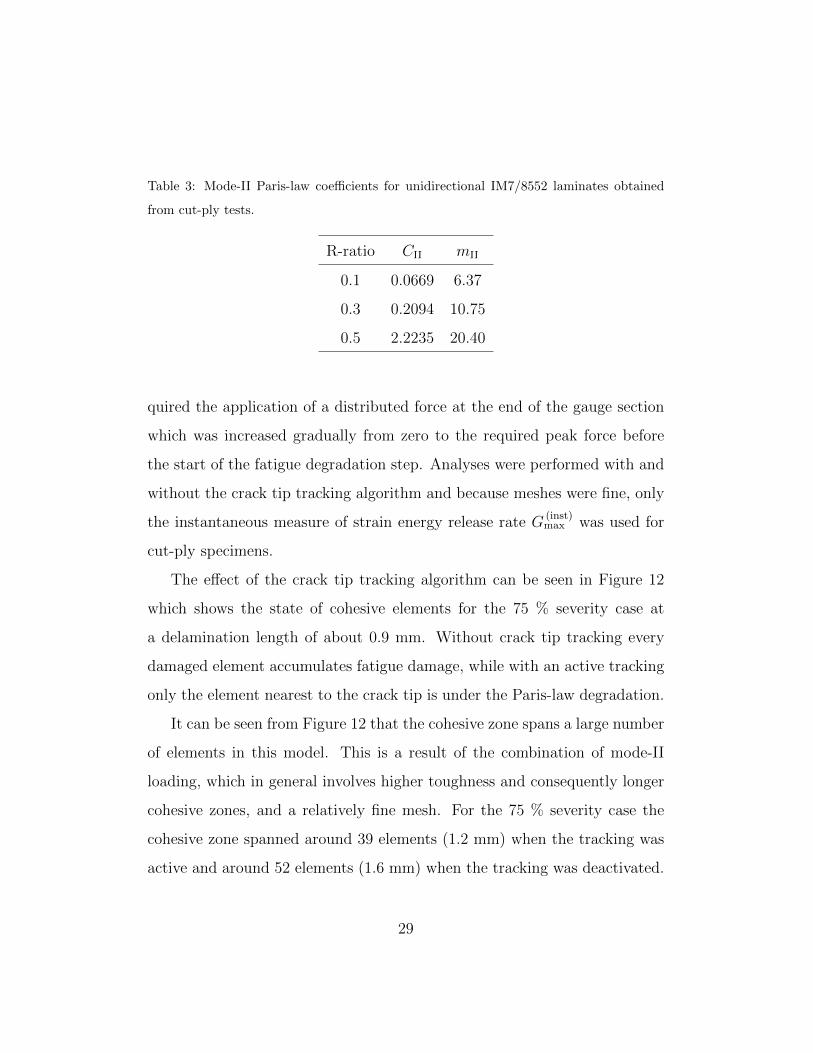
Table 3: Mode-II Paris-law coefficients for unidirectional IM7/8552 laminates obtained
from cut-ply tests.
R-ratio CII mII
0.1 0.0669 6.37
0.3 0.2094 10.75
0.5 2.2235 20.40
quired the application of a distributed force at the end of the gauge section
which was increased gradually from zero to the required peak force before
the start of the fatigue degradation step. Analyses were performed with and
without the crack tip tracking algorithm and because meshes were fine, only
the instantaneous measure of strain energy release rate G(inst)max was used for
cut-ply specimens.
The effect of the crack tip tracking algorithm can be seen in Figure 12
which shows the state of cohesive elements for the 75 % severity case at
a delamination length of about 0.9 mm. Without crack tip tracking every
damaged element accumulates fatigue damage, while with an active tracking
only the element nearest to the crack tip is under the Paris-law degradation.
It can be seen from Figure 12 that the cohesive zone spans a large number
of elements in this model. This is a result of the combination of mode-II
loading, which in general involves higher toughness and consequently longer
cohesive zones, and a relatively fine mesh. For the 75 % severity case the
cohesive zone spanned around 39 elements (1.2 mm) when the tracking was
active and around 52 elements (1.6 mm) when the tracking was deactivated.
29

failedParis-law
damagedelastic
withcrack tip tracking
withoutcrack tip tracking
Figure 12: Cohesive element status for a cut-ply specimen under fatigue, 75 % load severity,
with a crack length of 0.9 mm.
The different lengths reflect the fact that different stress distributions are
observed within the cohesive zone with the different formulations. Figure 13
shows the effective traction-separation curves obtained for a series of cohesive
elements in the path of the fatigue crack. Without the crack tip tracking,
Figure 13a, the fatigue traction-separation curves never exactly followed the
reference (static) softening curve. With the tracking active, Figure 13b, the
reference curve is followed for a considerable portion of the softening region,
up to the point where the elements became part of the numerical crack front,
from where rapid fatigue degradation takes place.
Even though the effective traction-separation responses in Figures 13a
and 13b are considerably different, the energies dissipated in each case were
very similar. Figure 14 shows the final strain energy release rates, G(fail)max ,
computed along the crack path for cut-ply specimens with and without the
30

(a) (b)
Figure 13: Traction-separation histories for the cut-ply specimen model, (a) without and
(b) with crack tip tracking (fine mesh, data sampled in 1 mm intervals starting 2 mm
away from the ply discontinuity).
tracking algorithm, for four different values of peak load and a constant
R-ratio of 0.1. Analytical solutions using equation (23) are also shown for
comparison. Numerical strain energy release rates were initially higher than
the analytical values because near the cut (i.e. when the cracks are short)
extra work is required for the formation of a cohesive zone along an initially
pristine interface. Once the delamination had grown about one millimetre
away from the initial cut, both formulations predicted nearly identical values
of G(fail)max which were also in excellent agreement with the analytical solution.
In order to facilitate the post-processing of numerical results, the number
of load cycles to failure was output by the user-defined subroutine for every
failed cohesive element. Combining these data with the spatial coordinates
of each integration point allowed the construction of effective Paris curves
with the predicted crack growth rates. Figure 15 shows experimental and
numerical Paris curves for the R-ratio of 0.1. It can be seen that the crack tip
31

0.0
0.1
0.2
0.3
0.4
0.5
0.6
0.7
0.8
0.9
1.0
0 1 2 3 4 5 6 7 8 9 10 11 12
Gm
ax[N
/mm
]
Crack length, a [mm]
Analytical solution 75% severity, without crack tip tracking75% severity, with crack tip tracking 60% severity, without crack tip tracking60% severity, with crack tip tracking 50% severity, without crack tip tracking50% severity, with crack tip tracking 40% severity, without crack tip tracking40% severity, with crack tip tracking
Figure 14: Numerical and analytical strain energy release rates versus crack length for
cut-ply tests.
tracking formulation reproduced well the experimental Paris-law as expected.
Without the crack tip tracking algorithm however the crack growth rates were
considerably overestimated. This was due to the computation of a fatigue
damage component for every element within the cohesive zone, based on
individual element lengths le, without any correction for the cohesive zone
length. As the overestimation in delamination growth rate is dependent on
the length of the cohesive zone, the numerical Paris curves without crack tip
tracking show a different slope when compared with the theoretical curve.
For completeness, the two other R-ratios used in the experimental pro-
gramme, 0.3 and 0.5, were also analysed with the crack tip tracking model
and the results are summarised in Figure 16. Excellent agreement is ob-
served between the input Paris curves and the effective crack growth rates
32

1.E-8
1.E-7
1.E-6
1.E-5
1.E-4
1.E-3
1.E-2
1.E-1
1.E+0
1.E-1 1.E+0
∆G /G C
da/d
N (m
m/c
ycle
)experimental75% severity, original75% severity, crack tip tracking60% severity, original60% severity, crack tip tracking50% severity, original50% severity, crack tip tracking40% severity, original40% severity, crack tip tracking
with crack tip tracking
without crack tip tracking
Theoretical Paris law(best fit to experimental data)
Figure 15: Experimental and numerical Paris curves for cut-ply specimens, R-ratio 0.1.
1.E-9
1.E-8
1.E-7
1.E-6
1.E-5
1.E-4
1.E-3
1.E-2
1.E-1
1.E-1 1.E+0
∆G /G C
da/d
N (m
m/c
ycle
)
R-ratio=0.1, experimentalR-ratio=0.1, numericalR-ratio=0.3, experimentalR-ratio=0.3, numericalR-ratio=0.5, experimentalR-ratio=0.5, numerical
Theoretical Paris law(best fit to experimental data)
Figure 16: Experimental and numerical Paris curves for cut-ply specimens with various
R-ratios (crack tip tracking formulation, Gmax = G(inst)max ).
33

as expected.
The use of a crack tip tracking algorithm with the instantaneous strain
energy release rate G(inst)max will only provide accurate results if the mesh is
fine enough so that the cohesive zone spans several elements. For coarse
meshes the extraction of strain energy release rates becomes the main source
of inaccuracy. This is addressed by the use of the nonlocal value G(NL)
max as
illustrated in the next Section.
4.2. Circular delamination benchmark
In order to illustrate the three-dimensional aspects of the proposed formu-
lation a circular delamination problem was investigated. This was based on
the NAFEMS benchmark for circular delamination (Davies, 2002) which was
here extended to the analysis of fatigue loading. This benchmark was cho-
sen mainly for its simplicity and the availability of a closed-form analytical
solution for the strain energy release rate.
In the NAFEMS benchmark a circular composite plate with simply-
supported edges is loaded centrally so that a circular delamination grows radi-
ally along the mid plane which may contain a small starter crack. Because the
layup is quasi-isotropic (i.e. the ply orientations are given by [−45/90/45/0]xS
for x sub-laminates), the in-plane properties can be homogenised to make the
analysis axisymmetric. A simplified analytical solution for the critical load
for delamination Pc was given by Davies and Zhang (1995),
Pc2 =
8π2E (2h)3
9 (1− ν2)(24)
where h is the total plate thickness and E and ν are the isotropic elastic
constants for the equivalent material properties. This solution was derived
34

Table 4: Homogenised isotropic properties for T800/924 laminates.
E ν σmaxII GIIC
[GPa] [MPa] [N·mm−1]
60 0.3 57 0.8
assuming axisymmetry and neglecting geometric nonlinearity, so it applies
only to cases where deflections are small.
In the present work the plate is assumed to have a radius of 100 mm
and a total thickness of 4 mm which, as will be shown later, will require
geometrically nonlinear analyses. The material properties for the T800/924
carbon/epoxy material provided in the benchmark are summarised in Ta-
ble 4. As for the cut-ply specimens, only mode-II properties were required
due to the single-mode nature of the crack growth.
Three-dimensional quarter models were used for the cohesive element
analyses as shown in Figure 17. The laminate was modelled using hexahedral
continuum elements with selective-reduced integration. Two different mesh
topologies were employed. Grid meshes, shown in Figure 17a, were built
using elements of constant dimensions forming a regular grid, while radial
meshes, Figure 17b, consisted of concentric rows of elements dividing the
quarter plate into 32 sectors. Six elements were used through the thickness in
all cases, and a plane of cohesive elements was inserted along the mid surface.
Different mesh refinements were obtained by varying the characteristic length
of the mesh, which represents the grid spacing for grid meshes and the radial
spacing between elements for radial meshes. Three levels of mesh refinement
35

applied loadapplied load
symmetrysymmetry
(a) (b)
Figure 17: Finite element meshes for the analysis of circular delamination: (a) grid mesh
and (b) radial mesh.
were adopted, namely:
• coarse mesh: 1 mm characteristic length;
• medium refinement: 0.5 mm characteristic length;
• fine mesh: 0.25 mm characteristic length.
For static loading simulations a circular pre-crack of 10 mm radius was
modelled via the introduction of a plane of contact with zero friction. No
pre-cracks were used in fatigue simulations in order to allow the mapping of
strain energy release rates along the whole plate.
Because the analytical solution in equation (24) is not valid for large dis-
placements, two-dimensional axisymmetric analyses were conducted in order
to provide a reference for comparison with the three-dimensional models.
The software Abaqus/Standard was used to solve all axisymmetric problems
and a typical mesh is shown in Figure 18. Bilinear axisymmetric elements
36

zr
prescribed load (or displacement)
Figure 18: 2D axisymmetric model of the circular delamination benchmark (medium re-
finement).
with incompatible modes (type CAX4I) were used to model the laminate and
different strategies were adopted to model the interface. Quasi-static load-
ing tests were analysed using built-in axisymmetric cohesive elements (type
COHAX4), while the fatigue analyses were performed by applying the classi-
cal Virtual Crack Closure Technique (VCCT) (Rybicki and Kanninen, 1977).
In the latter the interface was modelled using multi-point constraints and se-
ries of separate static analyses were performed with increasing delamination
radii. The VCCT equations for the extraction of strain energy release rate
were then applied via a Python script written for the software Abaqus/CAE.
4.2.1. Quasi-static loading
The NAFEMS benchmark assumes small displacements and hence the de-
lamination load is not dependent on plate radius or pre-crack radius (Davies,
2002). A series of quasi-static analyses was performed using axisymmetric
and full three-dimensional models in order to investigate this assumption.
Figure 19 shows the load-displacement traces for axisymmetric models
assuming either geometrical linearity or nonlinearity. It can be seen that
very different results are obtained depending on this assumption. Only the
linear model predicts delamination loads comparable with the benchmark
solution. When geometrical nonlinearity is taken into account, the load for
37

0
2
4
6
8
10
12
0 2 4 6 8 10 12 14
Load
[kN
]
Displacement [mm]
Benchmark experimental average
2D axisymmetric, linear geometry
2D axisymmetric, nonlinear geometry
Figure 19: Load-displacement curves for the circular delamination benchmark using ax-
isymmetric models with and without geometrical nonlinearities (symbols mark the start
of delamination propagation).
0
2
4
6
8
10
12
0 2 4 6 8 10 12
Load
[kN
]
Displacement [mm]
Benchmark experimental average
2D axisymmetric
3D, grid mesh
3D, circular mesh
Figure 20: Load-displacement curves for the circular delamination benchmark using ax-
isymmetric and three-dimensional models (curves offset for clarity, symbols mark the start
of delamination propagation).
38

delamination initiation is no longer independent of pre-crack radius. For
a pre-crack of 10 mm radius a considerably higher delamination load was
obtained as compared with the analytical solution. One should note however
that the benchmark solution could be reproduced if a smaller pre-crack were
used.
The different mesh topologies for three-dimensional LS-Dyna models (grid
and radial meshes) are compared with the geometrically-nonlinear axisym-
metric analysis in Figure 20. Excellent agreement was observed between the
three models in terms of plate stiffness and load for delamination initiation.
However, the numerical delamination loads with a pre-crack of 10 mm radius
were again consistently higher than the analytical solution.
4.2.2. Fatigue loading
Cohesive analyses of fatigue delamination propagation were conducted on
the three-dimensional models using the loading envelope approach described
in Section 2.2 for an R-ratio of 0.1. All fatigue analyses were performed
without a pre-crack in order to allow the mapping of strain energy release
rates along the whole plate. Reference failure loads were obtained first by
analysing the same meshes under quasi-static loading. Load envelopes for a
severity ratio of 80 % were then calculated based on these numerical results.
In order to verify the computation of effective element lengths, tests were
conducted with a modified version of the code which enforced a constant
crack growth rate da/dN instead of a Paris-law fatigue degradation. In this
way the delamination growth rate was solely dependent on the computed
effective element lengths. An arbitrary growth rate of 10−4 mm/cycle was
chosen so that a delamination starting at the centre of the plate should reach
39

the edges in about 106 load cycles.
Figure 21 compares the contours of cycles to failure for the grid mesh of
medium refinement assuming a constant element length and an automatic
computation of effective element lengths. The use of a constant le resulted
in a delamination pattern which is clearly not circular, Figure 21a, revealing
a strong mesh bias. In this case the delamination growth was only predicted
correctly along the two directions which are parallel to the grid pattern. For
other directions the crack growth rate was under-estimated showing that the
approach is non-conservative. Results for the same mesh analysed with the
automatic computation of le are shown in Figure 21b. The delamination pat-
tern in this case was closer to being circular and the delamination radius was
not under-estimated in any direction. On the contrary, some over-estimation
of the growth rate was observed as a consequence of the conservative nature
of the computation of effective element lengths.
Similar tests with constant da/dN were also performed on a grid mesh
with an in-plane element aspect ratio of four, and results are shown in Fig-
ure 22. The assumption of a constant element length resulted in clear mesh
bias as the delamination growth rate was higher in the direction where ele-
ments are longer, Figure 22a. The computation of effective element lengths
produced considerably better results as shown in Figure 22b. The average
effective element lengths were output for post-processing and the results for
both aspect ratios are shown in Figure 23. It can be seen that the algo-
rithm computes the effective lengths correctly for most of the plate, with
small deviations only near the edges where boundary conditions had been
enforced.
40

elementdimensions[mm] 1.0
1.0
Cycles to failure
(a) (b)
Figure 21: Predicted contours of cycles to failure for constant da/dN simulations with a
grid mesh of aspect ratio 1, (a) with fixed element length and (b) with the computation
of effective element lengths.
Cycles to failure
elementdimensions[mm] 1.0
0.25
(a) (b)
Figure 22: Predicted contours of cycles to failure for constant da/dN simulations with a
grid mesh of aspect ratio 4; (a) with fixed element length and (b) with the computation
of effective element lengths
The circular delamination benchmark was also analysed with the com-
plete fatigue degradation model described in Section 2.2. Only grid meshes
41

Average effective element length [mm]
element dimensions:0.25 mm × 1.00 mm
Average effective element length [mm]
element dimensions:0.5 mm × 0.5 mm
(a) (b)
Figure 23: Average effective element lengths on different grid meshes; (a) aspect ratio 1
and (b) aspect ratio 4.
cycles to
failure
Figure 24: Contour of cycles to failure for the circular benchmark at 80 % severity (grid
mesh, medium refinement).
were used in this study, with a load severity of 80 % and an R-ratio of 0.1
being applied in all cases. In the absence of fatigue data for the T800/924
material, it was assumed that its mode-II Paris coefficients were identical
42

to that of the IM7/8552 material (Table 3). It should be noted that the
actual values of the Paris coefficients are not important in this study since
we investigate the ability of each model to reproduce the input Paris law.
Because the geometrical nonlinearities are not negligible in this case, for a
constant load amplitude the strain energy release rate decreased rapidly with
increasing delamination radius. Therefore in load-controlled fatigue simula-
tions the crack growth rate also decreased very rapidly as the delamination
grew away from the centre of the plate. Figure 24 shows the number of
cycles to failure for the grid mesh with medium refinement where a nearly-
exponential dependency on delamination radius is observed.
In order to optimise CPU usage, an exponentially-increasing load fre-
quency was used for the circular delamination benchmark. This frequency
was given by,
f(t) = f0 · c0(t−tstart)c1 (25)
for any time t > tstart where tstart is the pseudo-time at the start of the fatigue
degradation step, and f0, c0 and c1 are user-defined parameters describing
the evolution of frequency with pseudo-time. The aim was to provide a
nearly constant number of time increments for the fatigue degradation of any
cohesive element in the model despite this rapidly-decelerating crack growth.
A number of test runs were performed to determine which parameters would
result in about 1000 fatigue time steps for every element at each load level.
For 80 % severity and an R-ratio of 0.1 a good combination was found to be
f0 = 104, c0 = 100 and c1 = 2. It should be noted that the crack growth
rate will not be sensitive to the frequency as long as the number of fatigue
degradation time steps is not excessively small.
43
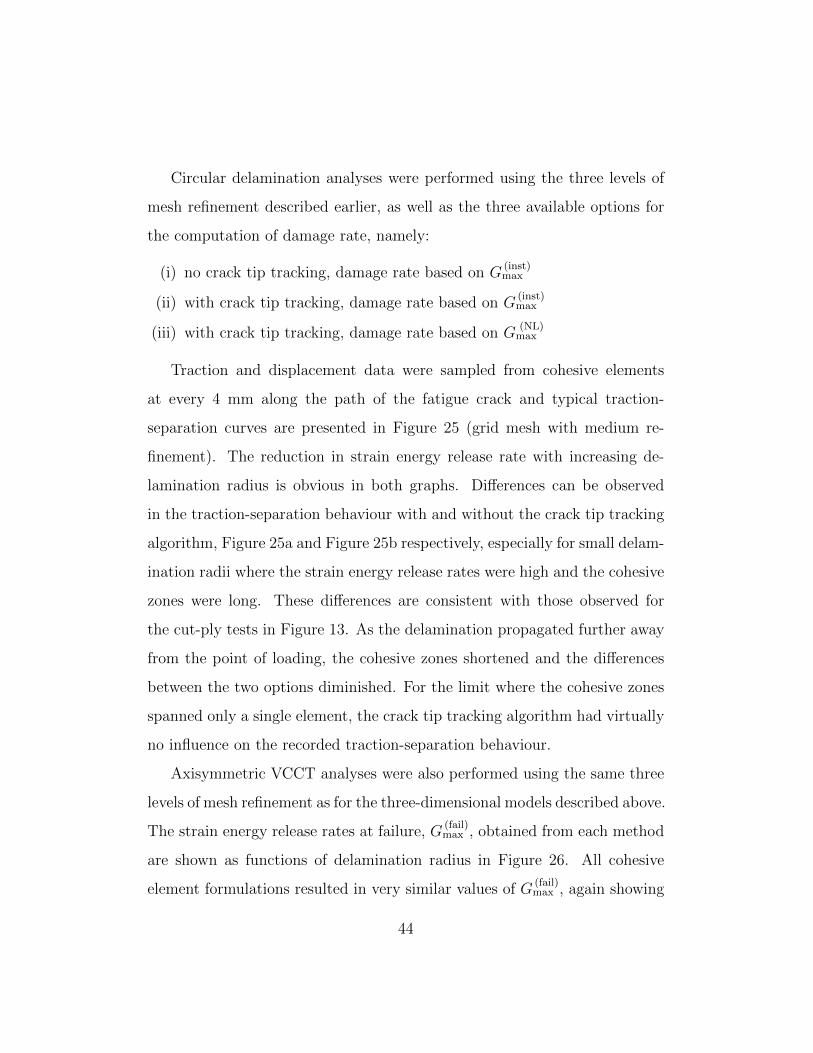
Circular delamination analyses were performed using the three levels of
mesh refinement described earlier, as well as the three available options for
the computation of damage rate, namely:
(i) no crack tip tracking, damage rate based on G(inst)max
(ii) with crack tip tracking, damage rate based on G(inst)max
(iii) with crack tip tracking, damage rate based on G(NL)
max
Traction and displacement data were sampled from cohesive elements
at every 4 mm along the path of the fatigue crack and typical traction-
separation curves are presented in Figure 25 (grid mesh with medium re-
finement). The reduction in strain energy release rate with increasing de-
lamination radius is obvious in both graphs. Differences can be observed
in the traction-separation behaviour with and without the crack tip tracking
algorithm, Figure 25a and Figure 25b respectively, especially for small delam-
ination radii where the strain energy release rates were high and the cohesive
zones were long. These differences are consistent with those observed for
the cut-ply tests in Figure 13. As the delamination propagated further away
from the point of loading, the cohesive zones shortened and the differences
between the two options diminished. For the limit where the cohesive zones
spanned only a single element, the crack tip tracking algorithm had virtually
no influence on the recorded traction-separation behaviour.
Axisymmetric VCCT analyses were also performed using the same three
levels of mesh refinement as for the three-dimensional models described above.
The strain energy release rates at failure, G(fail)max , obtained from each method
are shown as functions of delamination radius in Figure 26. All cohesive
element formulations resulted in very similar values of G(fail)max , again showing
44

(a) (b)
increasing delamination radius increasing delamination radius
Figure 25: Traction-separation histories for the circular delamination model (a) without
and (b) with crack tip tracking (grid mesh, medium refinement).
that the fracture energy envelope is independent of the shape of the traction-
separation curves in fatigue.
The results in Figure 26 reveal different trends with respect to mesh refine-
ment between axisymmetric VCCT and three-dimensional cohesive element
analyses, especially for small delamination radii. However, the overall agree-
ment between the two approaches was good considering that very different
FE models were used in each case.
The differences between the various fatigue modelling approaches can
only be fully appreciated when the effective crack growth rates are analysed.
Figure 27 shows plots of delamination growth rate versus radius for three
levels of mesh refinement. For the VCCT analysis, delamination growth
rates were obtained by applying equations (11) and (12) to the computed
strain energy release rates.
Cohesive analyses based on the use of G(inst)max provided similar results with
or without crack tip tracking. This is because the three meshes (including the
45

0
0.1
0.2
0.3
0.4
0.5
0.6
0.7
0 0.1 0.2 0.3 0.4 0.5 0.6 0.7 0.8 0.9 1
Gm
ax[N
/mm
]
Delamination Radius / Plate Radius
Grid mesh, coarse
Cohesive analysis, no crack tip tracking
Cohesive analysis, damage rate from
Cohesive analysis, damage rate from
VCCT analysis
0
0.1
0.2
0.3
0.4
0.5
0.6
0.7
0 0.1 0.2 0.3 0.4 0.5 0.6 0.7 0.8 0.9 1
Gm
ax[N
/mm
]
Delamination Radius / Plate Radius
Grid mesh, medium
Cohesive analysis, no crack tip tracking
Cohesive analysis, damage rate from
Cohesive analysis, damage rate from
VCCT analysis
0
0.1
0.2
0.3
0.4
0.5
0.6
0.7
0 0.1 0.2 0.3 0.4 0.5 0.6 0.7 0.8 0.9 1
Gm
ax[N
/mm
]
Delamination Radius / Plate Radius
Grid mesh, fine
Cohesive analysis, no crack tip tracking
Cohesive analysis, damage rate from
Cohesive analysis, damage rate from
VCCT analysis(a)
(b)
(c)
(NL) maxG
(inst) maxG
(NL) maxG
(inst) maxG
(NL) maxG
(inst) maxG
Figure 26: Final strain energy release rate versus delamination radius for VCCT and
cohesive element analyses using different mesh refinements: (a) fine, (b) medium and (c)
coarse. 46

1.E-8
1.E-7
1.E-6
1.E-5
1.E-4
1.E-3
1.E-2
1.E-1
0 0.1 0.2 0.3 0.4 0.5 0.6 0.7 0.8 0.9 1
da/d
N [m
m/c
ycle
]
Delamination Radius / Plate Radius
Grid mesh, coarse
Cohesive analysis, no crack tip trackingCohesive analysis, crack tip tracking,Cohesive analysis, crack tip tracking,VCCT analysis
1.E-8
1.E-7
1.E-6
1.E-5
1.E-4
1.E-3
1.E-2
1.E-1
0 0.1 0.2 0.3 0.4 0.5 0.6 0.7 0.8 0.9 1
da/d
N [m
m/c
ycle
]
Delamination Radius / Plate Radius
Grid mesh, medium
Cohesive analysis, no crack tip trackingCohesive analysis, crack tip tracking,Cohesive analysis, crack tip tracking,VCCT analysis
1.E-8
1.E-7
1.E-6
1.E-5
1.E-4
1.E-3
1.E-2
1.E-1
0 0.1 0.2 0.3 0.4 0.5 0.6 0.7 0.8 0.9 1
da/d
N [m
m/c
ycle
]
Delamination Radius / Plate Radius
Grid mesh, fine
Cohesive analysis, no crack tip trackingCohesive analysis, crack tip tracking,Cohesive analysis, crack tip tracking,VCCT analysis
(a)
(b)
(c)
(NL) maxG
(inst) maxG
(NL) maxG
(inst) maxG
(NL) maxG
(inst) maxG
Figure 27: Delamination growth rate versus delamination radius for VCCT and cohesive
element analyses using different mesh refinements: (a) fine, (b) medium and (c) coarse.
47

fine mesh) were relatively coarse when compared to the short cohesive zones
observed in this benchmark. In general, the analyses based on G(inst)max resulted
in poor agreement with the VCCT and considerable under-estimation of the
delamination growth rates for lager radii. The use of G(inst)max also resulted in
considerable mesh-dependency because, as explained earlier, the variation of
G(inst)max during the fatigue degradation is strongly dependent on mesh refine-
ment. The fact that this under-estimation was worse for coarser meshes is of
particular concern since coarser meshes are always desired from a practical
point of view.
On the other hand, crack growth rate predictions based on the nonlocal
G(NL)
max showed much better agreement with the VCCT. Reasonably good
agreement was observed even with a coarse mesh, Figure 27c, where the
cohesive zone was only one element long for most of the plate. This shows
that G(NL)
max provides an accurate measure of the strain energy release rate
even if the cohesive zone is not well-resolved. This is possible because the
energy dissipated during the Paris-law degradation is also taken into account
in the integration of strain energy release rates, which compensates for the
poor resolution of cohesive tractions and displacements at the crack tip in
coarse meshes.
5. Conclusions
A novel method has been proposed for the analysis of delamination propa-
gation under fatigue loading using cohesive elements. Accurate delamination
growth rates were obtained via the introduction of nonlocal aspects in the
computation of the fatigue damage rate, namely (i) the identification and
48

tracking of delamination fronts, (ii) the estimation of the local direction of
propagation and (iii) the extraction of strain energy release rates from failed
elements in the wake of the delamination front. The proposed formulation
eliminates the need for estimating the cohesive zone length and is there-
fore applicable to realistic geometries and complex loading conditions. The
advantages of the method have been demonstrated via the analysis of lam-
inates with central cut plies as well as a circular delamination benchmark
under cyclic loading. Predicted delamination growth rates were shown to
have weak mesh-dependency and to preserve accuracy with a slight conser-
vatism for excessively coarse meshes.
6. Acknowledgements
The authors would like to acknowledge Rolls-Royce Plc. for their support
of this research and for their permission to publish. Thanks also to Mike
Jones at the University of Bristol for experimental data from the cut-ply
tests.
References
Alfano, G., Crisfield, M.A., 2001. Finite element interface models for the
delamination analysis of laminated composites: Mechanical and computa-
tional issues. International Journal for Numerical Methods in Engineering
50, 1701–1736.
Allegri, G., Jones, M.I., Wisnom, M.R., Hallett, S.R., 2011. A new semi-
empirical model for stress ratio effect on mode II fatigue delamination
49

growth. Composites Part A - Applied Science and Manufacturing 42, 733–
740.
Barenblatt, G., 1962. The mathematical theory of equilibrium cracks in
brittle fracture. Adv Appl Mech 2, 55–125.
Blanco, N., Gamstedt, E.K., Asp, L.E., Costa, J., 2004. Mixed-mode delam-
ination growth in carbon-fibre composite laminates under cyclic loading.
International Journal of Solids and Structures 41, 4219–4235.
Borg, R., Nilsson, L., Simonsson, K., 2004. Simulating DCB, ENF and MMB
experiments using shell elements and a cohesive zone model. Composites
Science and Technology 64, 269–278.
Camanho, P.P., Davila, C.G., de Moura, M.F., 2003. Numerical simulation
of mixed-mode progressive delamination in composite materials. Journal
of Composite Materials 37, 1415–1438.
Chen, J., Crisfield, M., Kinloch, A.J., Busso, E.P., Matthews, F.L., Qiu, Y.,
1999. Predicting progressive delamination of composite material specimens
via interface elements. Mechanics of Composite Materials and Structures
6, 301–317.
Cui, W.C., Wisnom, M.R., Jones, M., 1994. An experimental and analytical
study of delamination of unidirectional specimens with cut central plies.
Journal of Reinforced Plastics and Composites 13, 722–739.
Davies, G.A.O., 2002. Benchmarks for composite delamination. NAFEMS
Ltd., Hamilton, UK.
50
Davies, G.A.O., Zhang, X., 1995. Impact damage prediction in carbon com-
posite structures. International Journal of Impact Engineering 16, 149–170.
Dugdale, D.S., 1960. Yielding of steel sheets containing slits. Journal of the
Mechanics and Physics of Solids 8, 100–104.
Harper, P.W., Hallett, S.R., 2008. Cohesive zone length in numerical sim-
ulations of composite delamination. Engineering Fracture Mechanics 75,
4774–4792.
Harper, P.W., Hallett, S.R., 2010. A fatigue degradation law for cohesive
interface elements - development and application to composite materials.
International Journal of Fatigue 32, 1774–1787.
Jiang, W.G., Hallett, S.R., Green, B.G., Wisnom, M.R., 2007. A concise
interface constitutive law for analysis of delamination and splitting in com-
posite materials and its application to scaled notched tensile specimens.
International Journal for Numerical Methods in Engineering 69, 1982–
1995.
Jimenez, M.A., Miravete, A., 2004. Application of the finite-element method
to predict the onset of delamination growth. Journal of Composite Mate-
rials 38, 1309–1335.
Li, X., Hallett, S.R., Wisnom, M.R., 2008. Predicting the effect of through-
thickness compressive stress on delamination using interface elements.
Composites Part a-Applied Science and Manufacturing 39, 218–230.
Nguyen, O., Repetto, E.A., Ortiz, M., Radovitzky, R.A., 2001. A cohesive
51
model of fatigue crack growth. International Journal of Fracture 110, 351–
369.
Ortiz, M., Pandolfi, A., 1999. Finite-deformation irreversible cohesive el-
ements for three-dimensional crack-propagation analysis. International
Journal for Numerical Methods in Engineering 44, 1267–1282.
Petrossian, Z., Wisnom, M.R., 1998. Prediction of delamination initiation
and growth from discontinuous plies using interface elements. Composites
Part a-Applied Science and Manufacturing 29, 503–515.
Planas, J., Elices, M., 1991. Nonlinear fracture of cohesive materials. Inter-
national Journal of Fracture 51, 139–157.
Robinson, P., Galvanetto, U., Tumino, D., Bellucci, G., Violeau, D., 2005.
Numerical simulation of fatigue-driven delamination using interface ele-
ments. International Journal for Numerical Methods in Engineering 63,
1824–1848.
Rybicki, E.F., Kanninen, M.F., 1977. Finite-element calculation of stress
intensity factors by a modified crack closure integral. Engineering Fracture
Mechanics 9, 931–938.
Turon, A., Costa, J., Camanho, P.P., Davila, C.G., 2007. Simulation of
delamination in composites under high-cycle fatigue. Composites Part A
- Applied Science and Manufacturing 38, 2270–2282.
Turon, A., Costa, J., Camanho, P.P., Maimi, P., 2008. Analytical and nu-
merical investigation of the length of the cohesive zone in delaminated
52

composite materials, in: Camanho, P.P., Davila, C.G., Pinho, S.T., Rem-
mers, J.J.C. (Eds.), Mechanical Response of Composites. Springer-Verlag
Berlin, Berlin. volume 10, pp. 77–97.
Yang, B., Mall, S., Ravi-Chandar, K., 2001. A cohesive zone model for fatigue
crack growth in quasibrittle materials. International Journal of Solids and
Structures 38, 3927–3944.
53