keep calm and care about your consumer - ernst & young · keep calm and care about your...
TRANSCRIPT

Keep calm and care about your consumerThe luxury and cosmetics financial factbook2016 edition


Contents Statistics and key facts
Index evolution
2 Executive summary
A. Financial parameters
B. Operating aggregates
C. Advertising expenses
D. SOTP and segment analyses
E. Trading multiples
F. Transaction multiples
8 DCF and valuation parameters
G. Global luxury goods market
H Global cosmetic goods market
I. Points of view from EY global sector and other industry professionals
36 Industry overview
Approach and SOTP analyses
Sample selection
Focus on YOOX Net–A–Porter
80 Methodology
83 Glossary
84 Contact us

The luxury and cosmetics financial factbook 2016
Executive summaryelcome to the sixth edition of EY ann al financial factboo for the l x r and cosmetics
industries. The report combines publicly available data with input from leaders who work with the world’s leading companies in the sector. It looks at current trends, the evolution of operating aggregates and e financial parameters.
In 2015, the luxury goods industry experienced 13% growth at current exchange rates, reaching b ho e er, c rrenc ct ations ere the main contrib tor of this gro th, with “real” growth reported to be 1%, lower than in 2014. The global cosmetics industry experienced a higher rate of growth (3.9%), reaching a total market value of €203b in 2015.
an factors contrib te to the state of the mar et. i en the significant impact that the socioeconomic and political climate can have on a global scale, it would be remiss not to acknowledge this instability early on in our report. While this study aims to provide a situational analysis, our conclusion is that the current climate and general instability across the global financial mar ets, as ell as other intangible elements, are contrib ting to the decline noted across the luxury sector. Recent global political disorder, terrorist threats and attacks as well as slowdown in economic growth rate in China are relevant factors that can impact any given industry. In short, uncertainty can have an impact on the mood of an cons mer, none more so than hen a significant spend is re ired, s ch as within the luxury sector.
On a brighter note, the luxury consumer has never been so sophisticated and is now seeking “the complete retail experience,“ ready for a trip to an exotic destination rather than limiting his or her purchase to the latest “it-bag.“
o sho ld l x r pla ers act to a oid losing their cons mers o ld a ic reaction s ffice, or do brands need to re ie their entire b siness model
In any case, companies must take time to get to know their consumers better, understand their desires in order to better engage them, and secure their attention and spend.
Executive summaryPage 2
Roberto BonacinaPartner, Lead Advisory M&A, Fashion & LuxuryMilan, EY [email protected]
Marco Pier MazzucchelliPartner, Head of TAS, MEDMilan, EY [email protected]

Page 3
The luxury and cosmetics financial factbook 2016
Exec
utiv
e su
mm
ary
The competitive landscape is changing. To keep pace, luxury brands must:
• Increase the digital effort — Luxury companies are behind in an increasingly digital world. New technology has changed the way companies do business, providing new communication channels, with buying behaviors evolving and the emergence of a new segment, the “millennials.” Immediacy is key, so there is a constant need to innovate within the digital world, which seems to contrast with the exclusivity known for its poleposition at the core of the luxury market. Luxury brands have to manage dual aspects; namely to (i) maintain their heritage and create long-term value while (ii) responding to cons mers’ expectations and tr ing to offer ni e prod cts that offer instant gratification. t is the latter here l x r companies are ris ing losing gro nd to more dynamic, digitally savvy players.
• Hold the positioning — Another category of players is threatening the balance of luxury fashion houses: the affordable luxury segment is gaining market share, continuously offering new products that are both fashionable and competitively priced. Price positioning is crucial, never more so than today when consumers appreciate and respond well to transparency given that digital channels provide them with a constant
o of information regarding prod cts’ characteristics orld ide. op end l x r companies sho ld therefore emphasi e the alit and rarit of their offerings to encourage their clients to spend more and reduce the risk of cannibalization by more nimble competitors.
• Defend the luxury experience — During the luxury journey, a consumer is surrounded by opportunities that may not always be characterized by material, long-term p rchases instead, the ma ha e intangible or more ephemeral benefits, s ch as travel, art, epicurean gastronomy. In such an environment, personal luxury goods companies must demonstrate that they can offer the same level of experience and customer satisfaction.
In retail stores, which offer the opportunity to physically interact with consumers, companies must aim to offer dedicated services by employing knowledgeable and highl alified shop assistants ho can pro ide an exceptional cons mer experience.
his goes be ond ne openings companies sho ld foc s on impro ing the alit offered in their existing network across every single customer touch point.
The 2016 factbook, based on industry leaders’ feedback, offers both operational and financial aggregates on the l x r and cosmetics ind stries as ell as e al ation parameters and multiples. It looks at the industries’ future trends and includes input from o r sector leaders. e hope o find this report to be insightf l and tho ght pro o ing for wider discussion within your organization.
Do not hesitate to contact us with any comments or suggestions.
Thank you,
Roberto Bonacina [email protected]
Page 3Executive summary
Marco Pier Mazzucchelli [email protected]

Statistics and key facts
Executive summaryPage 4
Global personal luxury market grew by 1% in 2015 at constant exchange rate.
1%The company– owned retail channels are growing twice as fast as the wholesale channel at current exchange rates and continue to gain market share due to network expansion.
Chinese consumers remain the top consumers by country with one-third of the global market.
1/3The online luxury market has grown tenfold since 2005 and accounted for about 7% of total sales in 2015.
~7%
The global cosmetics market grew by 3.9% in 2015.
3.9%
rrent ct ations, a strong US dollar and the depreciated Euro helped the market to show double-digit positive impact on the overall market value.
The accessories segment accounted for about 30% of the global personal luxury goods market in 2015.
Luxury cosmetics remains the most dynamic sector with 5.7% growth, due mostly to e-commerce sales.
5.7%New markets, such as India, South Africa and Turkey, generated more than two–thirds of the beauty market growth in 2015.
Today, beauty is synonymous with personalized products and services that enrich consumer experience and its relationship with the brands, in all distribution sectors.
Social media has made an online platform a critical part of every brand’s strategy.
~30%
>2/32X
The luxury and cosmetics financial factbook 2016

l y and c s e ics inde e l i n c pa ed a indices ase as an a y
The analysis reported in the graph below shows that the EY luxury and cosmetics index (represented by the companies included in the EY factbook) has outperformed the market over the last eight years with a total return of 83%, corresponding to an a erage earl significant ret rn of 8%.This relati e performance act all ill strates the appetite of in estors for an ind str that is characteri ed b solid financial f ndamentals in terms of sales gro th, ma or profitabilit , resilient international client base and expos re to gro ing mar ets, attrib ting higher al ations to companies related sec rities, despite the economic instable environment. Financial markets this year have been characterized by a high level of instability generated by a series of events: geopolitical events, commodities pricing volatility and the China stock market volatility have all hampered growth.The EY index is a representation of the l x r and cosmetics companies anal ed ithin the factboo . specific eight has been attrib ted to each compan incl ded in the EY index based on its market capitalization and revenues (each of these two parameters weighing for a half). The relative weights have been revised for each company’s inclusion after its initial public offering (IPO). Finally, the evolution of the EY index has been compared to those of the S&P 500 and STOXX Europe 600 indexes, using 1 January 2008 as a starting date (rebased to 100).
Index evolution
Exec
utiv
e su
mm
ary
Page 5Executive summary
As of 31 March
2016250
200
150
100
50
0
125
120
115
85
90
95
100
105
110
Jan 15
Feb 15
Mar 15
Apr 15
May 15
Jun 15
Jul 15
Aug 15
Sep 15
Oct 15
Nov 15
Dec 15
Jan 16
EY Index S&P 500 Europe 600
EY Index S&P 500 STOXX Europe 600
As of 1 January
2016
Jan 08
Apr 08
Jul 08
Oct 08
Jan 09
Apr 09
Jul 09
Oct 09
Jan 10
Apr 10
Jul 10
Oct 10
Jan 11
Apr 11
Jul 11
Oct 11
Jan 12
Apr 12
Jul 12
Oct 12
Jan 13
Apr 13
Jul 13
Oct 13
Jan 14
Apr 14
Jul 14
Oct 14
Jan 15
Jan 16
Mar 16
Apr 15
Jul 15
Oct 15
142
94
8%
4%
-1%
183
08–16CAGR 1
107
102
99
ase as an a y
The luxury and cosmetics financial factbook 2016
Source: Capital IQ.1. Compound annual growth.

PAGE 6 OPENING
LUXURY AND COSMETICS THE EY FINANCIAL FACTBOOK 2014
DCF and valuation parameters

Page 7Opening
DCF
and
val
uatio
n
para
met
ers
Financial parameters A
B Operating aggregates
C Advertising expenses
D SOTP and segment analyses
E Trading multiples
Transaction multiplesF
The luxury and cosmetics financial factbook 2016

DCF and valuation parameters a e
Financial parameters A
Sources:
• WACC* and LTGR: based on consensus of several brokers reports for each company. • Market capitalization and beta: EY elaboration based on S&P Capital IQ. • earing companies’ financial statements.
Notes:
• Market capitalization is based on a one–month average as of 31 March 2016. • earing is defined as net financial debt E . • Beta corresponds to levered beta measured on a weekly basis over a two–year period. • eta fig res for Y et orter is based on the share of Y .p. ., hich after
the merger with Net-A-Porter changed his name in YOOX Net-A-Porter Group. • ata point denoted as n a represents information not a ailable.
and other terms are defined in the glossar .
and y c pany
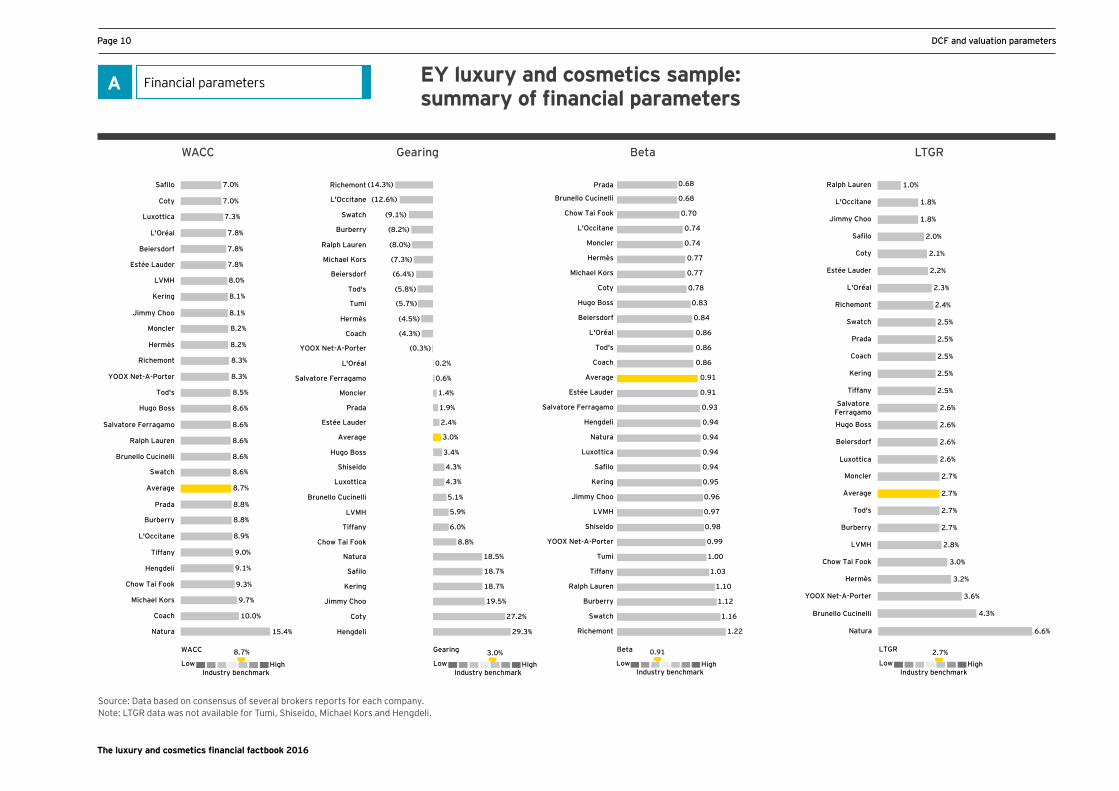
• ranges from afilo to oach , depending on the compan ’s ris profile perception ith an overall limited variance.
• LTGR presents a larger range (1% to 4.3%) mainly depending on size, maturity stage of the retail network and prod ct di ersification. he estimated a erage is slightl lo er o erall than last ear’s fig re, re ecting a pre ailing conser ati e ie among financial mar ets operators abo t f t re gro th.
Luxury companies reflect moderate but steady growth, with a limited risk profile
Companies are sorted in decreasing order based on the market capitalization in euros observed as of 31 March 2016 (one-month average).Michael Kors, Tumi and Hengdeli are not represented in the graphic at left because LTGR data for them was not available.
ote b bble si e re ects mar et capitali ation. otted lines represent a erage al es.
0.0% 1.0% 2.0% 3.0% 4.0% 5.0% 6.0%6.5%
7.0%
7.5%
8.0%
8.5%
9.0%
9.5%
10.0%
10.5%
Luxottica
Brunello Cucinelli
Chow Tai Fook
TiffanyHugo Boss
PradaSwatch
Coach
afil
LTGR
WA
CC
LVMH
Hermès
Salvatore Ferragamo
Jimmy Choo
Ralph Lauren
Tod's
Moncler
Kering
Burberry
RichemontYOOX Net-A-Porter
Luxury companies
Market capitalization (in €m)
WACC
Gearing
Beta
LTGR
LVMH Richemont Hermès Luxottica Kering SwatchCoach Michael Kors n/a
i any Prada 7,675
e yRalph Lauren
ai 5,657Hugo BossSalvatore Ferragamo 3,726Moncler 3,723YOOX Net–A–Porter 3,424Tod’s 2,263Tumi n/aBrunello Cucinelli
i y 642afil 525
Hengdeli n/aAverage 8.5% 2.4% 0.92 2.6%Median 8.6% 1.4% 0.94 2.6%Maximum 10.0% 29.3% 1.22 4.3%Minimum 7.0% (14.3%) 0.68 1.0%
The luxury and cosmetics financial factbook 2016

a e DCF and valuation parameters
and y c pany
• at ra’s ra il contin es to be significantl higher the the sample’s a erage, dri en b its geographical coverage.
• erage is in enced b the significantl high le el of at ra.
The cosmetics sample is characterized by stable growth and low risk, with the exception of Natura
Companies are sorted in decreasing order based on the market capitalization in euros observed as of 31 March 2016 (one-month average).
Shiseido is not represented in the graphic at left because LTGR data was not available.
Sources:
• WACC and LTGR: based on consensus of several broker reports for each company. • Market capitalization and beta: EY elaboration based on S&P Capital IQ. • earing companies’ financial statements.
Notes:
• Market capitalization is based on a one–month average as of 31 March 2016. • earing is defined as net financial debt E . • Beta corresponds to levered beta measured on a weekly basis over a two-year period.
ote b bble si e re ects mar et capitali ation. otted lines represent a erage al es.
DCF
and
val
uatio
n
para
met
ers
Financial parameters A
0.0% 1.0% 2.0% 3.0% 4.0% 5.0% 6.0% 7.0%6.0%
7.0%
8.0%
9.0%
10.0%
11.0%
12.0%
13.0%
14.0%
15.0%
16.0%
LTGR
WA
CC
LVMHL'Oréal
L'Occitane
Natura
BeiersdorfEstée Lauder
Coty
Cosmetics companies
Market capitalization (in €m)
WACC Gearing Beta LTGR
L'OréalEstée Lauder
eie sdCotyShiseido n/aNaturaL'Occitane 2,472Average 9.1% 4.8% 0.86 2.9%Median 7.8% 2.4% 0.86 2.3%Maximum 15.4% 27.2% 0.98 6.6%Minimum 7.0% (12.6%) 0.74 1.8%
The luxury and cosmetics financial factbook 2016
a e DCF and valuation parameters
WACC Gearing Beta LTGR
Source: Data based on consensus of several brokers reports for each company.Note: LTGR data was not available for Tumi, Shiseido, Michael Kors and Hengdeli.
EY luxury and cosmetics sample: summary of financial parameters
Financial parameters A
WACC 8.7%
Industry benchmarkLow High
29.3%
27.2%
19.5%
18.7%
18.7%
18.5%
8.8%
6.0%
5.9%
5.1%
4.3%
4.3%
3.4%
3.0%
2.4%
1.9%
1.4%
0.6%
Gearing 3.0%
Industry benchmarkLow High
(14.3%)
(12.6%)
(9.1%)
(8.2%)
(8.0%)
(7.3%)
(6.4%)
(5.8%)
(5.7%)
(4.5%)
(4.3%)
(0.3%)
0.2%
Swatch
Burberry
Ralph Lauren
Michael Kors
Beiersdorf
Tod's
Tumi
Hermès
Coach
YOOX Net-A-Porter
L'Oréal
Salvatore Ferragamo
Moncler
Prada
Average
Hugo Boss
Shiseido
Luxottica
Brunello Cucinelli
LVMH
Tiffany
Chow Tai Fook
Natura
afil
Kering
Jimmy Choo
Coty
Hengdeli
Estée Lauder
L'Occitane
Richemont
LTGR 2.7%
Industry benchmarkLow High
1.0%
1.8%
1.8%
2.0%
2.1%
2.2%
2.3%
2.4%
2.5%
2.5%
2.5%
2.5%
2.5%
2.6%
2.6%
2.6%
2.6%
2.7%
2.7%
2.7%
2.7%
2.8%
3.0%
3.2%
3.6%
4.3%
Ralph Lauren
L'Occitane
Jimmy Choo
afil
Coty
Estée Lauder
L'Oréal
Richemont
Swatch
Prada
Coach
Kering
Tiffany
Salvatore Ferragamo
Hugo Boss
Beiersdorf
Luxottica
Moncler
Average
Tod's
Burberry
Chow Tai Fook
Hermès
YOOX Net-A-Porter
Brunello Cucinelli
LVMH
6.6% Natura
7.0%
7.0%
7.3%
7.8%
7.8%
7.8%
8.0%
8.1%
8.1%
8.2%
8.2%
8.3%
8.3%
8.5%
8.6%
8.6%
8.6%
8.6%
8.6%
8.7%
8.8%
8.8%
8.9%
9.0%
9.1%
9.3%
9.7%
10.0%
Safilo
Coty
Luxottica
L'Oréal
Beiersdorf
Estée Lauder
LVMH
Kering
Jimmy Choo
Moncler
Hermès
Richemont
YOOX Net-A-Porter
Tod's
Hugo Boss
Salvatore Ferragamo
Ralph Lauren
Brunello Cucinelli
Average
Prada
Burberry
L'Occitane
Tiffany
Hengdeli
Chow Tai Fook
Michael Kors
Coach
Swatch
15.4% Natura
Beta 0.91
Industry benchmarkLow High
Brunello Cucinelli
Chow Tai Fook
L'Occitane
Moncler
Hermès
Michael Kors
Coty
Hugo Boss
Beiersdorf
L'Oréal
Tod's
Average
Estée Lauder
Salvatore Ferragamo
Hengdeli
Natura
Luxottica
afil
Kering
Jimmy Choo
LVMH
Shiseido
YOOX Net-A-Porter
Tumi
Tiffany
Ralph Lauren
Burberry
Swatch
Richemont
Coach
0.68
0.70
0.74
0.74
0.77
0.77
0.78
0.83
0.84
0.86
0.86
0.86
0.91
0.91
0.93
0.94
0.94
0.94
0.94
0.95
0.96
0.97
0.98
0.99
1.00
1.03
1.10
1.12
1.16
1.22
Prada 0.68
The luxury and cosmetics financial factbook 2016

Sales CAGR, l y c panies
Source: Data based on consensus of several brokers reports for each company.Estimated data have not been derived from internal insights.
Pricing growth has become a challenge for the luxury peers that have historically achieved ~25% growth through price increases. The popularity of the digital channel has made maintaining price divergence in different mar ets diffic lt. t re gro th is expected thro gh • Introduction of new products at lower price points to drive volumes, addressing the lower end segment • Improved volumes due to robust tourist–related demand
YOOX Net–A–Porter notably outperformed the average growth levels.
The sales outlook of luxury companies points to limited growth opportunities due to underperformance of key markets and a shift to global pricing
*Kering sales for FY14A–FY18E exclude numbers for Redcats, Sergio Rossi and Groupe Fnac.
Notes:
• fig res are estimated (“E“) or actual (“A“) , depending on their availability as of the date of this study.
• Figures are converted into euros, using exchange rates as of 31 March 2016 (Source: Capital IQ).
• Figures for YOOX Net–A–Porter for FY14 and FY15 are presented on a pro forma basis, i.e., assuming the merger was effective at the start of FY14.
• Hengdeli is not represented in the graphic at left because FY18E data was not available.
a e DCF and valuation parameters
B Operating aggregates
DCF
and
val
uatio
n
para
met
ers
Hugo Boss
Prada
afil
Richemont
Tod's
al a e e a a
Swatch
alp a en
Coach
Tiffany
Burberry
Kering
Tumi
e a e
ai
Hermès
ic ael s
ica
nell cinelli
Jimmy Choo
ncle
YOOX Net-A-Porter
3.0%
2.1%
3.6%
4.2%
4.4%
4.5%
4.7%
4.8%
4.9%
5.0%
5.2%
5.3%
5.4%
6.1%
6.6%
7.2%
7.5%
8.0%
8.1%
10.1%
10.3%
11.3%
20.4%
Sales (in €m) FY14A FY15A/E FY16E FY17E FY18E CAGR
(FY15A/E–FY18E)
LVMH 35,664 Kering* Richemont Luxottica 7,652 Swatch 7,742
ai 7,276 Ralph Lauren 7,276 7,654 Hermès 5,245 5,652 Michael Kors Coach 4,252
i any 3,732 Prada 3,552 3,553 3,664
e y 3,722 Hugo Boss 2,572 Hengdeli n/a n/aYOOX Net–A–Porter 2,357 Salvatore Ferragamo
afil Tod's Moncler Tumi 463 575 Brunello Cucinelli 356 454 552
i y 443 Average 6.6%Median 5.3%Maximum 20.4%Minimum 2.1%
The luxury and cosmetics financial factbook 2016

a e DCF and valuation parameters
Source: Data based on consensus of several brokers reports for each companyEstimated data have not been derived from internal insights.
Sales CAGR, c s e ics c panies
L’Occitane and Natura are expected to post strong growth in the next few years, driven by e-commerce sales and emerging brand expansion for ’ ccitane, and channel di ersification and international gro th for Natura. The cosmetics market is likely to be driven by: • Penetration by existing players with innovative products into new markets • Increase of consumer purchasing power • Rise of millennial consumers
’ ccitane and at ra significantl outperformed the cosmetics sample expectations.
Sales growth expectations for cosmetics players are lower than for the luxury segment but the gap is narrowing
Notes:
• fig res are estimated (“E“) or actual (“A“), depending on their availability as of the date of this study.
• Figures are converted into euros, using exchange rates as of 31 March 2016 (Source: Capital IQ).
B Operating aggregates
7.5%
9.5%
9.8%
10.9%
16.8%
17.1%
17.3%
19.1%
20.5%
20.9%
21.0%
21.1%
21.3%
22.9%
23.1%
23.2%
23.5%
24.0%
24.7%
25.1%
26.7%
29.0%
33.6%
Hengdeli
YOOX Net-A-Porter
afil
Chow Tai Fook
Jimmy Choo
Ralph Lauren
Brunello Cucinelli
Kering
Tumi
Burberry
Average
Hugo Boss
Tod's
Luxottica
Swatch
LVMH
Salvatore Ferragamo
Coach
Prada
Tiffany
Richemont
Michael Kors
Moncler
35.5% Hermès
2.0%
4.0%
4.2%
5.5%
5.9%
6.4%
9.3%
9.7%
Coty
Beiersdorf
L'Oréal
Estée Lauder
Average
Shiseido
Natura
L'Occitane
Sales(in €m) FY14A FY15A/E FY16E FY17E FY18E CAGR
(FY15A/E–FY18E)
L'Oréal 22,532 25,257 Estée Lauder
eie sd 7,523 Shiseido Coty 3,762 Natura 2,337 L'Occitane Average 5.9%Median 5.5%Maximum 9.7%Minimum 2.0%
The luxury and cosmetics financial factbook 2016

Source: Data based on consensus of several brokers reports for each company.Estimated data have not been derived from internal insights.
The slightly lower EBITDA margin presented this year is mainly due to: • ar et olatilit dri en b c rrenc s ings and ct ating to rist o s • Lower growth experienced in some of the key markets, such as mainland China and Hong Kong
EBITDA remains largely below 30%, with few notable exceptions
The luxury sample EBITDA margin indicates margin pressure in the near term
Average EBITDA margin, l y c panies
a e DCF and valuation parameters
DCF
and
val
uatio
n
para
met
ers
*Kering margin for FY14A–FY16E excludes numbers for Redcats, Sergio Rossi and Groupe Fnac.
Notes:
• Figures for YOOX Net–A–Porter for FY14 and FY15 are presented on a pro–forma basis, i.e., assuming the merger was effective at the start of FY14.
• The 2015 EBITDA margin is computed on the basis of either actual (“A“) or estimated
E fig res for sales, depending on their availability. As some groups are listed under different jurisdictions around the world, they may use different GAAP, and therefore a direct comparison of EBITDA may be less meaningful than if their results were presented under the International Accounting Standards.
7.5%
9.5%
9.8%
10.9%
16.8%
17.1%
17.3%
19.1%
20.5%
20.9%
21.0%
21.1%
21.3%
22.9%
23.1%
23.2%
23.5%
24.0%
24.7%
25.1%
26.7%
29.0%
33.6%
Hengdeli
YOOX Net-A-Porter
afil
Chow Tai Fook
Jimmy Choo
Ralph Lauren
Brunello Cucinelli
Kering
Tumi
Burberry
Average
Hugo Boss
Tod's
Luxottica
Swatch
LVMH
Salvatore Ferragamo
Coach
Prada
Tiffany
Richemont
Michael Kors
Moncler
35.5% Hermès
2.0%
4.0%
4.2%
5.5%
5.9%
6.4%
9.3%
9.7%
Coty
Beiersdorf
L'Oréal
Estée Lauder
Average
Shiseido
Natura
L'Occitane
B Operating aggregates
EBITDA margin FY14A FY15A/E FY16E FY17E FY18E Average ratio
(FY16E–FY18E)
LVMHKering*RichemontLuxotticaSwatch
ai Ralph LaurenHermèsMichael KorsCoach
i anyPrada
e yHugo BossHengdeliYOOX Net–A–PorterSalvatore Ferragamo
afilTod'sMonclerTumiBrunello Cucinelli
i y Average 21.4% 20.0% 20.7% 21.0% 21.3% 21.0%Median 21.6% 21.0% 21.0% 21.5% 21.5% 21.3%Maximum 35.1% 35.4% 35.6% 35.7% 35.2% 35.5%Minimum 6.7% 5.7% 7.1% 7.5% 7.9% 7.5%
The luxury and cosmetics financial factbook 2016

a e DCF and valuation parameters
Source: Data based on consensus of several brokers reports for each company. Estimated data have not been derived from internal insights.
Average EBITDA margin, c s e ics c panies
Cosmetics companies maintain last year’s average EBITDA of 18% for the FY16E–FY18E period
Cosmetics companies are expected to report expansion in operating margins in the coming years. The key drivers of margin growth are: • Increasing disposable income and improving lifestyle of individuals • Demand for high-end products (presenting higher margins)
L’Oréal and Estée Lauder are showing o tperforming profitabilit .
Note: the 2015 EBITDA margin is computed on the basis of either actual (“A“) or estimated (“E“) fig res for sales, depending on their availability. As some groups are listed under different jurisdictions around the world, they may use different GAAP, and therefore a direct comparison of EBITDA may be less meaningful than if their results were presented under International Accounting Standards.
B Operating aggregates
Hengdeli
Chow Tai Fook
afil
Ralph Lauren
Kering
Moncler
LVMH
Tod's
Brunello Cucinelli
Luxottica
Salvatore Ferragamo
Average
Tiffany
Richemont
Michael Kors
Burberry
Hermès
YOOX Net-A-Porter
Tumi
Swatch
Hugo Boss
Coach
Prada
0.8%
2.0%
3.3%
4.7%
4.9%
5.0%
5.1%
5.3%
5.5%
5.5%
5.5%
5.6%
5.6%
5.8%
6.3%
6.3%
6.3%
6.4%
6.5%
6.7%
6.7%
7.2%
8.3%
Jimmy Choo 8.5%
10.3%
17.6%
18.0%
18.0%
19.0%
19.4%
20.2%
21.9%
Shiseido
Beiersdorf
L'Occitane
Average
Coty
Natura
Estée Lauder
L'Oréal
EBITDA margin FY14A FY15A/E FY16E FY17E FY18E Average ratio
(FY16E–FY18E)
L'OréalEstée Lauder
eie sdShiseidoCotyNaturaL'OccitaneAverage 17.4% 16.7% 17.5% 18.0% 18.6% 18.0%Median 19.0% 17.1% 18.3% 19.1% 19.5% 19.0%Maximum 21.1% 21.1% 21.5% 21.8% 22.2% 21.9%Minimum 11.7% 8.8% 9.4% 10.2% 11.2% 10.3%
The luxury and cosmetics financial factbook 2016

Average CAPEX ratio, l y c panies
Stable CAPEX sales ratio reflects that high investments are required to support long–term growth
The stable a erage le el of a to E sales ratio is mainl explained b the re irements of the retail network (openings, renovations, etc.) for continued growth.
Note: the 2015 CAPEX ratio is computed on the basis of either actual (“A“) or estimated (“E“) fig res for sales, depending on their availability.
a e DCF and valuation parameters
DCF
and
val
uatio
n
para
met
ers
Jimmy Choo outperforms on the CAPEX ratio. Its CAPEX has been characterized by higher logistics costs and store renovations, and is expected to increase heavily as the company makes additional investments in its retail network.
Hengdeli
Chow Tai Fook
afil
Ralph Lauren
Kering
Moncler
LVMH
Tod's
Brunello Cucinelli
Luxottica
Salvatore Ferragamo
Average
Tiffany
Richemont
Michael Kors
Burberry
Hermès
YOOX Net-A-Porter
Tumi
Swatch
Hugo Boss
Coach
Prada
0.8%
2.0%
3.3%
4.7%
4.9%
5.0%
5.1%
5.3%
5.5%
5.5%
5.5%
5.6%
5.6%
5.8%
6.3%
6.3%
6.3%
6.4%
6.5%
6.7%
6.7%
7.2%
8.3%
Jimmy Choo 8.5%
10.3%
17.6%
18.0%
18.0%
19.0%
19.4%
20.2%
21.9%
Shiseido
Beiersdorf
L'Occitane
Average
Coty
Natura
Estée Lauder
L'Oréal
B Operating aggregates
CAPEX ratio FY14A FY15A/E FY16E FY17E FY18E Average ratio
(FY16E–FY18E)
LVMHKeringRichemontLuxotticaSwatch
ai Ralph LaurenHermèsMichael KorsCoach
i anyPrada
e yHugo BossHengdeliYOOX Net–A–PorterSalvatore Ferragamo
afilTod'sMonclerTumiBrunello Cucinelli
i y n/aAverage 5.9% 5.9% 6.0% 5.5% 5.1% 5.6%Median 6.1% 5.9% 6.0% 5.7% 5.2% 5.6%Maximum 12.4% 9.6% 9.3% 8.7% 7.0% 8.5%Minimum (1.6%) 1.1% 0.8% 0.8% 0.9% 0.8%
The luxury and cosmetics financial factbook 2016
Source: Data based on consensus of several brokers reports for each company.Estimated data have not been derived from internal insights.

a e DCF and valuation parameters
Average CAPEX ratio, c s e ics c panies
Capital requirements for cosmetics companies are lower than in the luxury sector
L’Occitane’s ratio o tperforms the sample d e to its retail profile.
Note: the 2015 CAPEX ratio is computed on the basis of either actual (“A“) or estimated (“E“) fig res for sales, depending on their availability.
B Operating aggregates
2.9%
3.0%
4.1%
4.1%
4.4%
4.4%
4.5%
5.5%
Shiseido
Beiersdorf
Average
Coty
Estée Lauder
L'Oréal
Natura
L'Occitane
CAPEX ratio FY14A FY15A/E FY16E FY17E FY18E Average ratio
(FY16E–FY18E)
L'OréalEstée Lauder
eie sdShiseido n/aCotyNaturaL'OccitaneAverage 4.5% 3.9% 4.2% 4.1% 4.3% 4.1%Median 4.4% 3.9% 4.4% 4.4% 4.3% 4.4%Maximum 6.8% 5.5% 5.5% 5.4% 5.7% 5.5%Minimum 2.0% 2.6% 2.9% 2.8% 3.1% 2.9%
The luxury and cosmetics financial factbook 2016
Source: Data based on consensus of several brokers reports for each company. Estimated data have not been derived from internal insights.

Average sales CAGR Average EBITDA margin Average CAPEX ratio
EY luxury and cosmetics sample: summary of operating aggregates
a e DCF and valuation parameters
DCF
and
val
uatio
n
para
met
ers
The charts below show the evolution of selected operating aggregates (sales CAGR, EBITDA margin, CAPEX ratio) over the past editions of The luxury and cosmetics financial factbook. Data reported represents estimates available for future years at the date of each factbook release.
1. Luxury
• n an increasingl challenging mar et, f t re expected gro th is slo ing do n b t still sho s significant gro th le els. • This slowdown in sales growth directly impacts the EBITDA margin aggregates, which also show a gradual contraction over the considered period. • he E ratio is stable at to , ill strating a high re irement of in estments, d e to a progressi e shift to the retail business.
B Operating aggregates
0%
2%
4%
6%
8%
10%
12%
9.3%10.5% 10.4%
8.6%
6.6%
FY12 FY13 FY14 FY15 FY1615%
17%
19%
21%
23%
25%
27%
24.6%25.1%
24.3%
22.6%21.0%
FY12 FY13 FY14 FY15 FY164.0%
4.5%
5.0%
5.5%
6.0%
4.9%
5.4% 5.3%
5.7%5.6%
FY12 FY13 FY14 FY15 FY16
The luxury and cosmetics financial factbook 2016
Source: Data based on consensus of several brokers reports for each company.

a e DCF and valuation parameters
EY luxury and cosmetics sample: summary of operating aggregates
The charts below show the evolution of the operating aggregates estimates (sales CAGR, EBITDA margin, CAPEX ratio) over the past editions of The luxury and cosmetics financial factbook. for cosmetics companies. Data reported represents only estimates available for the next few years at the date of the factbook release.
2. Cosmetics
• The cosmetics sector, on average, has lower sales CAGR and EBITDA margins than the luxury sector, but the difference has been narrowing over the years. While the EBITDA margin expected for the cosmetics sector remains 3% lower than the luxury sample, the average sales CAGR of cosmetics is almost the same of luxury companies (6.5% versus 6.6%, respectively).
• Expected sales obser ed in is higher than fig res, b t considerabl lo er than the pea of . • The EBITDA margin has remained globally stable over the considered period, at a solid level around 18%. • The CAPEX ratio is lower for luxury companies and mostly stable at 4.2%.
Average sales CAGR Average EBITDA margin Average CAPEX ratio
B Operating aggregates
0%
2%
4%
6%
8%
10%
12%
8.2% 8.3%
5.8% 6.1% 6.5%
FY12 FY13 FY14 FY15 FY1615%
16%
17%
18%
19%
20%
18.2%
18.9%
18.0% 17.8% 18.0%
FY12 FY13 FY14 FY15 FY163.0%
3.5%
4.0%
4.5%
5.0%
4.0%4.2%
4.5% 4.4%
4.1%
FY12 FY13 FY14 FY15 FY16
The luxury and cosmetics financial factbook 2016
Source: Data based on consensus of several brokers reports for each company.

Source: Data based on actual or estimated numbers based on availability as of the date of this report.
ote he res lts of are act al if the financial res lts are closed and expected E if the financial ear is not closed et.
• ar eting and ad ertising represent a significant cost component for both global l x r and cosmetics industries.
• igital expenses are gaining share in the ad ertising b dget of companies, as in encers, nstagrammers and social networks are replacing traditional channels.
• Communication media is now so diverse that companies can only focus on and allocate budget for some of the channels; in some cases, companies are dedicating more budget to communicating on new platforms.
Advertising remains a key driver in the industry, with digital expenses’ share growing fast
a e DCF and valuation parameters
C Advertising expenses
DCF
and
val
uatio
n
para
met
ers
elec ed c panies ad e isin e penses as a sales
0%
5%
10%
15%
20%
25%
30%
35%
40%
Tum
i
Coa
ch
Salv
ator
eFe
rrag
amo
Pra
da
Bru
nello
Cuc
inel
li
Mon
cler
Luxo
ttic
a
Hug
o B
oss
Tiff
any
LVM
H
afil
Bei
ersd
orf
Cot
y
Esté
e La
uder
Shis
eido
L'O
réal
Nat
ura
5.1% 5.4% 5.6% 6.6% 6.7% 6.8% 7.4%11.3% 11.3%
25.7% 26.4%29.1%
33.6%
3.4% 3.8%
22.9% 22.9%
Luxury companies Cosmetics companies
Average 6.7%
Average 26.8%
The luxury and cosmetics financial factbook 2016

a e DCF and valuation parameters
ales ea d n in ea d n in ea d n in
o rces based on EY anal sis and on the follo ing bro ers reports an ar , ac arie esearch ecember and atixis ecember .
• anal sis implies a total enterprise al ation of . b in Y E. • The fashion and leather goods segment is the largest contributor both in terms of sales (35%) and EBIT (52%).
LVMH SOTPD SOTP and segment analyses
35%
13%
9%
13%
31%
Fashion and
leather goods
Perfumes and
cosmetics
Watches and
jewelry
Wines and
spirits
Selectiveretailing
Eliminations Total Fashion and
leather goods
Perfumes and
cosmetics
Watches and
jewelry
Wines and
spirits
Selectiveretailing
Eliminations Total Fashion and
leather goods
Perfumes and
cosmetics
Watches and
jewelry
Wines and
spirits
Selectiveretailing
Eliminations Total
36.111.7
3.5
4.8
3.6
(0.3)
12.7 13%
10%
10%
52%
13%
7.01.0
0.50.5
1.4
(0.1)
-2%
3.7 8%7%
20%
15%
48%
13%
0.0
0%
106.917.2
7.69.9
21.9
(1.3)
-1%
51.5 9%7%
20%
16%
Investments
Luxury products (excluding wines and spirits
and selective retailing)
Luxury products (excluding wines and spirits
and selective retailing)
Luxury products (excluding wines and spirits
and selective retailing)
The luxury and cosmetics financial factbook 2016

D SOTP and segment analyses
o rces based on EY anal sis and on the follo ing bro ers reports arcla s ebr ar , an ar and ac arie esearch ecember .
• ering anal sis implies a total E of . b in Y E. • ontrib ting almost the hole of the total E for of sales, cci ro p is the most profitable segment in terms of operating margin.
Kering SOTP
a e DCF and valuation parameters
DCF
and
val
uatio
n
para
met
ers
ales ea d n in ea d n in ea d n in
Gucci Group Puma Other brands Eliminations Total
8.2
29%
0.3 12.00.03.5
3% 0%
68%
Gucci Group Puma Other brands Eliminations Total
1.9 6%
0.0 1.8
(0.2)
0.1
1%
-9%
103%
Gucci Group Puma Other brands Eliminations Total
27.3 8%
0.1 27.8
(1.7)
2.1
1%
-6%
98%
Luxury Sport and lifestyle Luxury Sport and lifestyle Luxury Sport and lifestyle
The luxury and cosmetics financial factbook 2016

Page 22 DCF and valuation parameters
ales ea d n in ea d n in ea d n in
o rces based on EY anal sis and on the follo ing bro ers reports arcla s ebr ar , an ar and ac arie esearch ecember .
• cci ro p anal sis implies an E of . b in Y E. • Within the Gucci Group segment, the Gucci brand alone represents 49% of the top line and 60% of EBIT in FY16E, meaning that the Gucci brand is expected to constitute the largest segment within the Gucci Group and the most profitable in terms of operating margin.
Kering: further analysis of Gucci Group through SOTP approachD SOTP and segment analyses
49%
17%
13%
21%
Gucci brand Bottega Veneta YSL Other brands Gucci Group
8.21.7
1.1
1.4
4.0
60%
22%
10%
8%
Gucci brand Bottega Veneta YSL Other brands Gucci Group
1.90.20.2
0.4
1.1
52%
22%
14%
13%
Gucci brand Bottega Veneta YSL Other brands Gucci Group
27.33.6
3.7
5.9
14.1
The luxury and cosmetics financial factbook 2016

L’Oréal segment analysis
• The L’Oréal Luxe division accounted for 29% of the total sales in FY15A. • This division is expected to register a sales growth at a CAGR of 4.4% over the 2015A–18E period, when its operating income is anticipated to grow from €1.5m to €1.8m (or at a CAGR of 4.2%) over the same period.
• The L’Oréal Luxe division will remain one of the biggest divisions within L’Oréal, together with consumer products.
ales ea d n in ea d n in a in in
Page 23DCF and valuation parameters
DCF
and
val
uatio
n
para
met
ers
Sources: Liberum (15 February 2016) and Kepler Cheuvreux (12 February 2016).
ote he res lts of are act al if the financial res lts are closed and expected E if the financial ear is not closed et.
D SOTP and segment analyses
13%0 0
1
2
3
4
5
30
15
5
10
25
20
13% 13% 13% 13%
28%
48%
7%
7% 7%8% 8%
47%46% 46% 45%
29% 29%29% 30%
4%
4%4% 4%
22.5
25.325.8
27.227.0
4%
2014A 2015A 2016E 2017E 2018E
Professional products Consumer products
L'Oreal Luxe Active cosmetics
Body shop
CAGR4.4%
CAGR0.9%
16% 15% 15% 15% 15%
56% 54% 54% 53% 53%
33%
10%
34%35%
10%
35%
10%
36%
11%
(16%) (15%) (15%) (15%) (15%)
2% 9%
2%2% 1%
3.9
4.94.94.6
1%
4.4
2014A 2015A 2016E 2017E 2018E
Professional products Consumer products
L'Oreal Luxe Active cosmetics
Eliminations Body shop
CAGR4.2%
CAGR2.2%
20%
18% 18% 18%19% 19%
21% 21% 21%22%
2014A 2015A 2016E 2017E 2018E
L'Oreal Luxe Total cosmetics
The luxury and cosmetics financial factbook 2016

Page 24 DCF and valuation parameters
Level of multiples is affected by high volatility of financial markets
• The charts below show the evolution of the trading multiples over the past editions of the factbook. • After reaching a peak in 2014, trading multiples for luxury companies are decreasing on all major valuation parameters, consistently with the lower growth expectations and margins showed by the listed company in this sector.
Source: Data based on consensus of several brokers reports for each company.
Note: Year is referred to the Factbook edition. As an example 2016 is Factbook 2016 edition. Therefore “Multiple on last FY Actual” is calculated on 2015 results, while “Multiple on current FY forecast” is calculated on 2016 expected results.
EV/sales EV/EBITDA Price to earnings
E Trading multiples
3.1x
3.6x3.7x
3.0x
2.3x
2.7x
3.3x
2.8x
2.2x
0.0x
0.5x
1.0x
1.5x
2.0x
2.5x
3.0x
3.5x
4.0x
2012 2013 2014 2015 2016
Multiple on last FY Actual Multiple on current FY Forecast
3.0x12.7x
15.0x 15.3x
13.3x
11.6x10.7x
12.0x
13.3x
11.9x
10.3x
0.0x
2.0x
4.0x
6.0x
8.0x
10.0x
12.0x
14.0x
16.0x
18.0x
2012 2013 2014 2015 2016
Multiple on last FY Actual Multiple on current FY Forecast Multiple on last FY Actual Multiple on current FY Forecast
25.0x 25.2x
29.4x
24.1x 24.5x
19.1x
22.0x
28.2x
21.4x20.4x
0.0x
5.0x
10.0x
15.0x
20.0x
25.0x
30.0x
35.0x
2012 2013 2014 2015 2016
The luxury and cosmetics financial factbook 2016

E Trading multiples Cosmetics multiples level illustrates the strong dynamism of the industry
• The charts below show the evolution of the trading multiples over the past editions of the factbook. • Trading multiples for cosmetics companies showed more resilience over time, as the sector’s listed companies are experimenting a stable gro th o er the last fe ears and a constant profitabilit .
Source: Data based on consensus of several brokers reports for each company.
Note: Year is referred to the Factbook edition. As an example 2016 is Factbook 2016 edition. Therefore “Multiple on last FY Actual” is calculated on 2015 results, while “Multiple on current FY forecast” is calculated on 2016 expected results.
EV/sales EV/EBITDA Price to earnings
Page 25DCF and valuation parameters
DCF
and
val
uatio
n
para
met
ers
2.2x
2.8x
2.3x
2.6x
2.4x
2.1x
2.5x
2.2x
2.5x2.4x
0.0x
0.5x
1.0x
1.5x
2.0x
2.5x
3.0x
2012 2013 2014 2015 2016
Multiple on last FY Actual Multiple on current FY Forecast
12.3x
15.0x
13.8x
15.6x14.6x
11.3x
14.1x13.1x
14.4x13.4x
0.0x
2.0x
4.0x
6.0x
8.0x
10.0x
12.0x
14.0x
16.0x
18.0x
2012 2013 2014 2015 2016
Multiple on last FY Actual Multiple on current FY Forecast
24.4x
32.2x
25.8x27.7x
33.1x
22.2x
26.9x28.2x 28.9x
25.2x
0.0x
5.0x
10.0x
15.0x
20.0x
25.0x
30.0x
35.0x
2012 2013 2014 2015 2016
Multiple on last FY Actual Multiple on current FY Forecast
The luxury and cosmetics financial factbook 2016

Page 26 DCF and valuation parameters
EY luxury and cosmetics sample: summary of EV/sales multiples
Source: Data based on consensus of several brokers reports for each company.
Notes:• he res lts of are act al if the financial res lts are closed and expected E if the financial ear is not closed et.• Market capitalization is based on a one-month average as of 31 March 2016.
sales sales sales sales
E Trading multiples
afil
ai
alp a en
iseid
ss
cci ane
a a
i y
a c
ic ael s
e e
d s
e y
ada
e in
e a e
i any
ac
eie sd
al a e e a a
nell cinelli
ic e n
ica
y
i
s e a de
al
M ncle
He s
en deli
0.9
1.3
1.
2.
2.
2.
2.
2.
2.
sales
Ind s y ench aHi h
afil
ai
alp a en
iseid
ss
cci ane
a a
e e
i y
a c
ic ael s
d s
e y
e in
ada
e a e
i any
ac
eie sd
al a e e a a
nell cinelli
ica
ic e n
i
y
s e a de
al
M ncle
He s
en deli
0.9
1.
2.
sales
Ind s y ench aHi h
afil
ai
alp a en
iseid
ss
cci ane
e e
a a
i y
a c
ic ael s
d s
e in
e y
e a e
i any
ada
ac
nell cinelli
eie sd
al a e e a a
ica
ic e n
i
y
s e a de
al
M ncle
He s
en deli
sales
Ind s y ench aHi h
afil
ai
alp a en
iseid
ss
cci ane
e e
a a
i y
a c
ic ael s
d s
e in
e y
e a e
i any
ada
ac
nell cinelli
eie sd
al a e e a a
ica
ic e n
i
y
s e a de
al
M ncle
He s
en deli
Ind s y ench aHi h
sales
The luxury and cosmetics financial factbook 2016

EY luxury and cosmetics sample: summary of EV/EBITDA multiples
Page 27DCF and valuation parameters
DCF
and
val
uatio
n
para
met
ers
Source: Data based on consensus of several brokers reports for each company.
Notes: • Market capitalization is based on a one-month average as of 31 March 2016. • he res lts of are act al if the financial res lts are closed and expected E if the financial ear is not closed et.
E Trading multiples
EV/EBITDA (FY15A/E)12.3x
Industry benchmarkLow High
EV/EBITDA (FY16E)11.1x
Industry benchmarkLow High
EV/EBITDA (FY17E)10.1x
Industry benchmarkLow High
EV/EBITDA (FY18E)9.3x
Industry benchmarkLow High
afil
Hugo Boss
ic ael s
en deli
Chow Tai Fook
Prada
L'Occitane
Swatch
Tiffany
Burberry
LVMH
Natura
Tod's
Richemont
al a e e a a
Jimmy Choo
e a e
e in
ncle
Coach
Luxottica
Tumi
Shiseido
Beiersdorf
al
nell cinelli
Estée Lauder
Coty
Hermès
YOOX Net-A-Porter
6.5x
alp a en 6.4x
6.7x
6.9x
7.3x
9.1x
9.8x
9.8x
9.9x
10.0x
10.2x
10.2x
10.4x
10.6x
10.8x
11.7x
12.2x
12.3x
12.6x
12.6x
12.9x
13.5x
14.1x
15.0x
15.7x
16.5x
16.7x
17.5x
17.5x
18.6x
27.0x
en deli
alp a en
Hugo Boss
ic ael s
Chow Tai Fook
Swatch
L'Occitane
Prada
Tiffany
Natura
Tod's
LVMH
Richemont
Burberry
Jimmy Choo
Coach
al a e e a a
e a e
ncle
e in
Luxottica
Shiseido
Tumi
Beiersdorf
nell cinelli
al
Estée Lauder
Coty
Hermès
YOOX Net-A-Porter
5.7x
afil 4.7x
5.9x
6.6x
6.9x
8.4x
8.4x
8.9x
9.0x
9.1x
9.2x
9.5x
9.7x
10.1x
10.2x
10.5x
10.7x
10.8x
11.1x
11.2x
11.6x
11.7x
12.9x
14.1x
14.7x
14.9x
15.8x
16.0x
16.2x
17.1x
21.0x
alp a en
afil
ic ael s
Hugo Boss
Chow Tai Fook
Swatch
L'Occitane
Natura
Tiffany
Prada
Tod's
LVMH
Jimmy Choo
Burberry
Coach
Richemont
ncle
e a e
al a e e a a
e in
Luxottica
Shiseido
nell cinelli
Beiersdorf
Tumi
Estée Lauder
al
Coty
YOOX Net-A-Porter
Hermès
5.3x
en deli 5.0x
6.1x
6.3x
6.3x
7.4x
7.9x
8.0x
8.2x
8.5x
8.6x
8.8x
9.1x
9.3x
9.6x
9.7x
9.9x
10.0x
10.1x
10.2x
10.6x
10.8x
11.4x
13.4x
13.6x
13.7x
14.7x
14.9x
15.4x
15.6x
15.8x
alp a en
afil
ic ael s
Hugo Boss
Chow Tai Fook
Swatch
L'Occitane
Natura
Tiffany
Prada
Tod's
LVMH
Jimmy Choo
Burberry
Coach
Richemont
ncle
e a e
al a e e a a
e in
Luxottica
Shiseido
nell cinelli
Beiersdorf
Tumi
Estée Lauder
al
Coty
YOOX Net-A-Porter
Hermès
4.9x
en deli 4.2x
5.6x
5.6x
6.3x
6.5x
6.8x
7.3x
7.8x
8.0x
8.1x
8.4x
8.5x
8.6x
9.1x
9.2x
9.2x
9.2x
9.3x
9.3x
9.7x
9.9x
10.0x
10.9x
12.1x
12.4x
12.5x
13.4x
13.8x
14.0x
15.1x
The luxury and cosmetics financial factbook 2016

a e DCF and valuation parameters
Regression analysis: EV/sales multiple vs. EBITDA margin
• egression anal ses sho strong correlation bet een E sales le els and profitabilit , ill strating the premi m paid for good profitabilit performance.
• nal ses sho a rob st correlation bet een E E and sales gro th. ales de elopment is another driver for creating value, especially for the luxury segment.
Source: Data based on consensus of several brokers reports for each company.Notes: market capitalization is based on a one–month average as of 31 March 2016.
e essi n analysis sales l iple s a in e essi n analysis l iple s sales
E Trading multiples
PradaLVMHTod's
Ralph Lauren
Coach
Hugo Boss
Safilo
Hermès
Tiffany
SwatchShiseido
Salvatore Ferragamo
L'Oréal
RichemontLuxottica
Estée Lauder
Beiersdorf
Brunello Cucinelli
Michael Kors
Coty
Jimmy Choo
R² = 0.5575
-
1.0x
2.0x
3.0x
4.0x
5.0x
6.0x
7.0x
0% 5% 10% 15% 20% 25% 30% 35% 40%
2016
EV
/sal
es
2016 EBITDA margin (%)
L'OccitaneNatura
Moncler
Tumi
Kering
Chow Tai Fook
Hengdeli
YOOX Net-A-Porter
Burberry
BurberryLVMHTod's
YOOX Net-A-Porter
Coach
Hugo Boss
Safilo
Brunello Cucinelli
KeringSalvatore Ferragamo
Richemont
Moncler
Michael Kors
Hermès
R² = 0.505
5.0x
10.0x
15.0x
20.0x
25.0x
-10% -5% 0% 5% 10% 15% 20% 25%
EV/E
BITD
A 2
016E
Sales CAGR 2016E–2018E
Prada
Tumi
Hengdeli
Jimmy Choo
Tiffany
Ralph Lauren
Chow Tai Fook
Luxottica
Swatch
The luxury and cosmetics financial factbook 2016

DCF
and
val
uatio
n
para
met
ers
The luxury and cosmetics financial factbook 2016

a e DCF and valuation parameters
Transaction multiples in the luxury industry remain at a significant premium to many other sectors
Transaction multiplesF
Source: Capital IQ.
• Transaction multiples illustrate the high attractiveness of the industry over the past few years. • he also re ect a premi m to rarit , indeed the brands rep ted to be on the mar et are er fe . • The average sales multiple in recent years ranged between 1.2x and 1.6x, when the average EBITDA multiple ranged between 10.4x and 15.0x.
• e transaction anno nced in ere the ac isition of ornelian b n estcorp and the ac isition of oger i ier b ods.
sales
1.6x1.5x
1.6x
1.2x
1.6x1.5x
1.2x1.1x
1.5x
0.9x
0.0x
0.2x
0.4x
0.6x
0.8x
1.0x
1.2x
1.4x
1.6x
1.8x
2012 2013 2014 2015 1H16
12.8x
14.6x
10.4x
14.2x15.0x
10.7x
13.1x
10.2x
13.4x14.1x
0.0x
2.0x
4.0x
6.0x
8.0x
10.0x
12.0x
14.0x
16.0x
2012 2013 2014 2015 1H16
Average Median Average Median
The luxury and cosmetics financial factbook 2016

a e DCF and valuation parameters
DCF
and
val
uatio
n
para
met
ers
The M&A deals in the cosmetics industry show a similar trend as the luxury industry
• he a erage sales m ltiple o er the last fi e ears ranged bet een . x and . x, hen the E m ltiple ranged between 10.1x and 16.6x.
• E E m ltiples in are slightl lo er than and incl de the ac isition of the ea t i ision b ot and the ac isition of on b erber s.
sales
Transaction multiplesF
Source: Capital IQ.
10.1x
11.7x
16.6x
12.6x
11.0x
8.8x
10.2x
14.9x
11.1x 10.9x
0.0x
2.0x
4.0x
6.0x
8.0x
10.0x
12.0x
14.0x
16.0x
18.0x
1.6x
1.9x
1.4x
2.1x
1.2x
1.0x
1.6x1.5x
1.9x
1.1x
0.0x
0.5x
1.0x
1.5x
2.0x
2.5x
2012 2013 2014 2015 1H16
Average Median
2012 2013 2014 2015 1H16
Average Median
The luxury and cosmetics financial factbook 2016

Page 32 DCF and valuation parameters
Analysis of worldwide M&A transactions in the luxury industry (2012–1H16)
• As shown in the number of completed deals sorted by geography and accounts for almost one-third of total deals, Italy is the top target country of the luxury industry. Italy and US together represent more than an half of total deals (59% of total transactions).
• ri ate e it f nds ha e a gro ing interest in the l x r sector, recentl approx. of total transactions.
• fter a characteri ed b a large n mber of transactions, the deal acti it in the first semester of 2016 has slowed down.
e c ple ed deals e c ple ed deals y ype ye e c ple ed deals s ed y e ap y e a e e a n e p c n ies
Transaction multiplesF
Sources: Capital IQ, Mergermarket, Factiva.
52
62
44
68
19
0
10
20
30
40
50
60
70
80
4341
31
41
109
21
13
27
9
17%
34%
30%
40%
47%
0%
5%
10%
15%
20%
25%
30%
35%
40%
45%
50%
0
5
10
15
20
25
30
35
40
45
50
Italy30%
France10%
United States
29%
Switzerland
9%
UK9%
Germany4%
Spain3%
China2%
S. Korea2% Canada
2%
2012 2013 2014 2015 1H16
Corporate PE PE/total
No.
of d
eals
2012 2013 2014 2015 1H16
The luxury and cosmetics financial factbook 2016

DCF
and
val
uatio
n
para
met
ers
Page 33DCF and valuation parameters
Analysis of worldwide M&A transactions in the cosmetics industry (2012–1H16)
• As shown in the number of completed deals sorted by geography, and account for almost half of total deals, US remains the top target country for the cosmetics industry.
• he first three co ntries b target geography (US, France and Italy) are the same of those of the luxury industry, and they represent 68% of total transactions.
• PE funds are increasingly attracted by the cosmetic market and the personal care sector in general.
Transaction multiplesF
e c ple ed deals e c ple ed deals y ype ye e c ple ed deals s ed y e ap y e a e e a n e p c n ies
Sources: Capital IQ, Mergermarket, Factiva.
39
17
26
35
21
0
5
10
15
20
25
30
35
40
45
31
14
10
28
14
8
3
16
7 7
21%
18%
62%
20%
33%
0%
10%
20%
30%
40%
50%
60%
70%
0
5
10
15
20
25
30
35
2012 2013 2014 2015 1H16
Corporate PE PE/total
2012 2013 2014 2015 1H16
No.
of d
eals
United States
41%
France19%
Italy8%
S. Korea6%
UK5%
Germany5%
Australia4%
Spain4%
China4% Canada
4%
The luxury and cosmetics financial factbook 2016

Industry overview

G Global luxury goods market
H Global cosmetic goods market
I Points of view from EY global sector and other industry professionals
Indu
stry
ove
rvie
w
The luxury and cosmetics financial factbook 2016
Global luxury goods market
Page 36 Industry overview
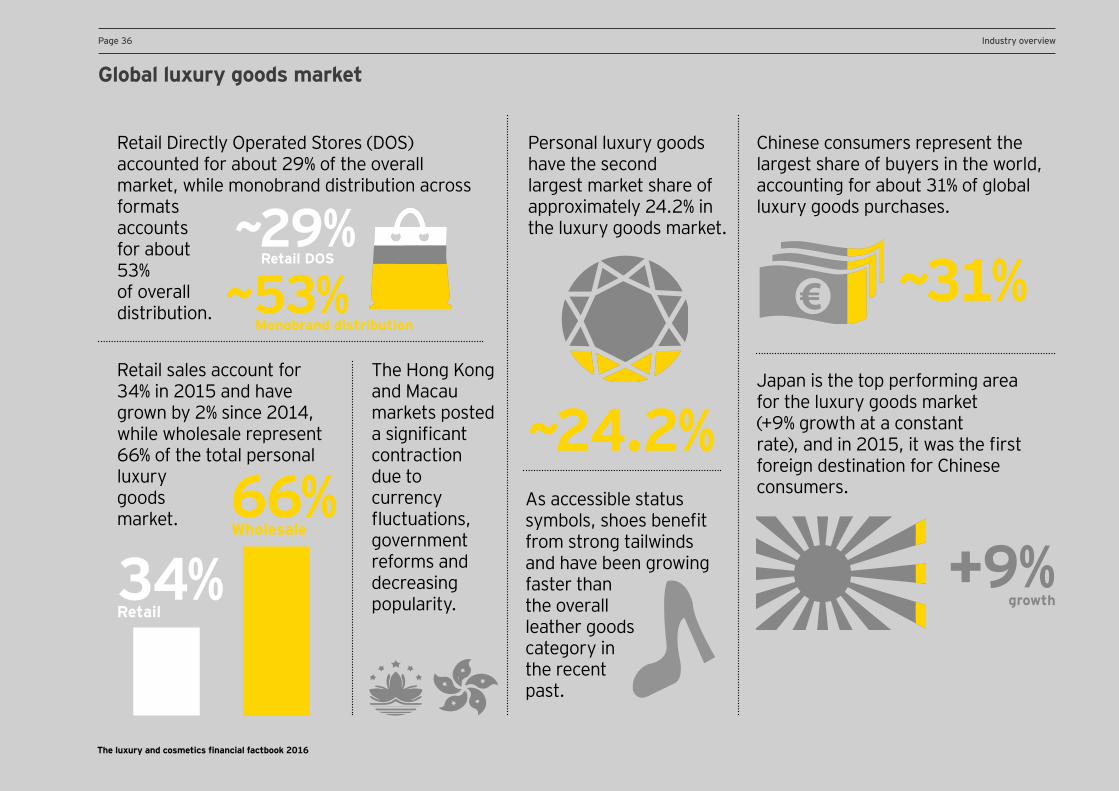
~24.2%
Personal luxury goods have the second largest market share of approximately 24.2% in the luxury goods market.
Retail Directly Operated Stores (DOS) accounted for about 29% of the overall market, while monobrand distribution across formats accounts for about 53% of overall distribution.
~29%Retail DOS
The Hong Kong and Macau markets posted a significant contraction due to currency
ct ations, government reforms and decreasing popularity.
Retail sales account for 34% in 2015 and have grown by 2% since 2014, while wholesale represent 66% of the total personal luxury goods market. 66%
Wholesale
Chinese consumers represent the largest share of buyers in the world, accounting for about 31% of global luxury goods purchases.
Japan is the top performing area for the luxury goods market (+9% growth at a constant rate , and in , it as the first foreign destination for Chinese consumers.As accessible status
s mbols, shoes benefit from strong tailwinds and have been growing faster than the overall leather goods category in the recent past.
+9%34%Retail
~53%Monobrand distribution
The luxury and cosmetics financial factbook 2016
~31%
growth

Glossary
Contact us
Title for section
Welcome to the third edition of EY’s annual Financial Factbook for the luxury and cosmetics sector. he actboo combines financial data, insight from EY’s global team of sector specialists and opinions of external experts.
XSales of industry players are expected to grow at a healthy rate, led by double-digit annual growth rate for L’Occitane and Natura from FY11A to FY14E. X Increased demand through innovative products will cater to underserved emerging markets. X Introduction of eco-friendly, sustainable and naturally derived beauty products and cosmetics will stimulate demand in established geographies.
Source: Data based on consensus of several brokers’ reports for each company.
Notes:Market capitalization is based on a one-month average as of December 2012. The 2012 growth corresponds to the sales growth rate between FY11A and FY12A/E.
Titles for charts
Titles for charts
H Global luxury goods
Sample selection
and specific analyses Executive sum
mary
DCF and valuation
parameters
Industry overview
Methodology
and disclaimer
Page 37DCF and valuation parameters
Notes: ltagamma ain x r oods orld ide ar et t d all inter , Altagamma/Bain. ltagamma ain, orld ide x r ar ets onitor, pdate, Altagamma/Bain, October 2015.
Global personal luxury goods continue to buoy the market, but growth is leveling off
• Personal luxury goods have the second largest market share (approximately 24.2%) in the luxury goods market after luxury cars, which account for about a 38.8% share in the industry.
• Global luxury market value stood at €1 trillion in 2015, with the personal luxury goods market growing at 13% at current exchange rates; however, at constant exchange rates, the growth has slowed to 1%, slower than the 3% recorded in 2014.
• Currency ct ations, and in partic lar a strong dollar and depreciating e ro, helped the market to show double-digit positive impact on overall market value. • While wholesale remains the dominant distribution channel for personal luxury goods (accounting for about two–thirds of market sales), the company–owned retail channels are growing twice as fast as the wholesale channel at current exchange rates and continue to gain market share due to network expansion (with 600 new stores opened in 2015) and growth in same store sales (13% at the current exchange rate).
ld ide pe s nal l y ds a e end
Industry overview Page 37
Indu
stry
ove
rvie
w
G Global luxury goods market
p c n ies 2
170 167153
173192
212 218 224
253
280–295
7%
-2%
-8%
13%
11%10%
3% 3%
13%
-10%
-5%
0%
5%
10%
15%
20%
-200
-150
-100
-50
0
50
100
150
200
250
300
2007 2008 2009 2010 2011 2012 2013 2014 2015E 2020E
% gr
owth
€b
Market size Growth
CAGR2%–3%
+1% at constant
rate
17.1
17.3
17.9
20.1
78.6
0 20 40 60 80 100
France
Italy
Mainland China
Japan
US
€b
The luxury and cosmetics financial factbook 2016
Title for section
Welcome to the third edition of EY’s annual Financial Factbook for the luxury and cosmetics sector. he actboo combines financial data, insight from EY’s global team of sector specialists and opinions of external experts.
XSales of industry players are expected to grow at a healthy rate, led by double-digit annual growth rate for L’Occitane and Natura from FY11A to FY14E. X Increased demand through innovative products will cater to underserved emerging markets. X Introduction of eco-friendly, sustainable and naturally derived beauty products and cosmetics will stimulate demand in established geographies.
Source: Data based on consensus of several brokers’ reports for each company.
Notes:Market capitalization is based on a one-month average as of December 2012. The 2012 growth corresponds to the sales growth rate between FY11A and FY12A/E.
Titles for charts
Titles for charts
H Global luxury goods
a e DCF and valuation parameters Page Industry overview
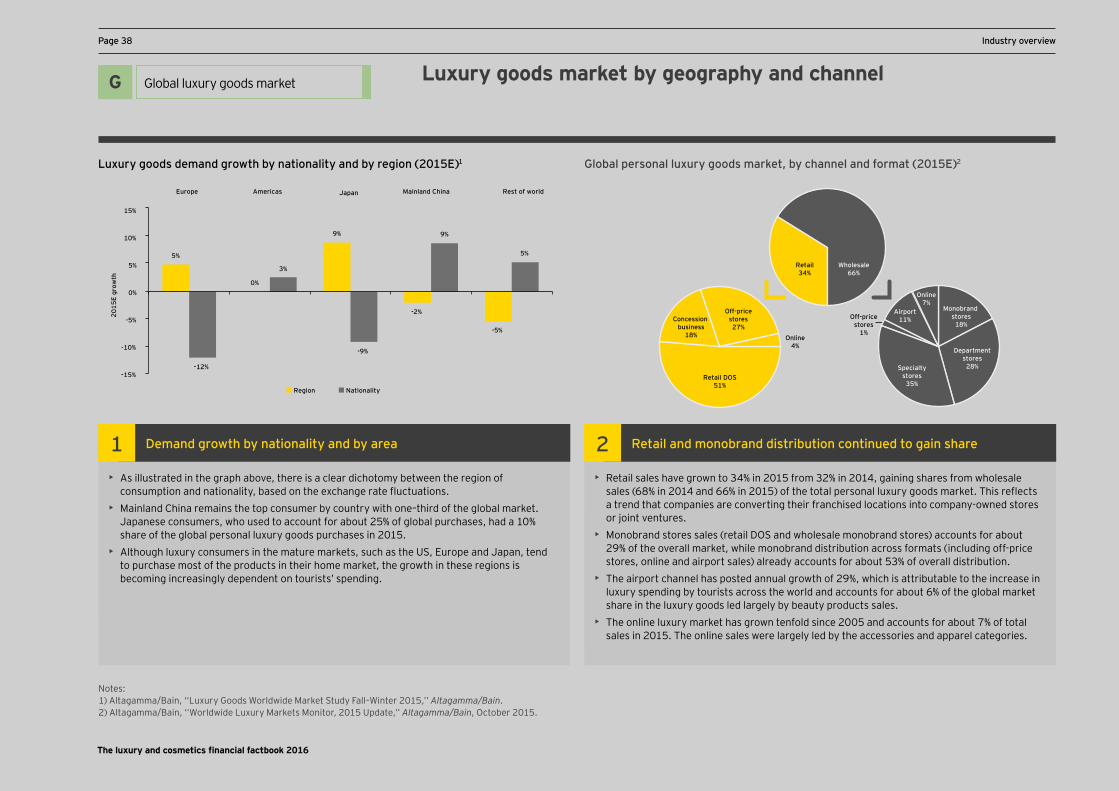
• As illustrated in the graph above, there is a clear dichotomy between the region of consumption and nationality, based on the exchange rate ct ations.
• Mainland China remains the top consumer by country with one–third of the global market. Japanese consumers, who used to account for about 25% of global purchases, had a 10% share of the global personal luxury goods purchases in 2015.
• Although luxury consumers in the mature markets, such as the US, Europe and Japan, tend to purchase most of the products in their home market, the growth in these regions is becoming increasingly dependent on tourists’ spending.
e and y na i nali y and y a ea
• Retail sales have grown to 34% in 2015 from 32% in 2014, gaining shares from wholesale sales in and in of the total personal l x r goods mar et. his re ects a trend that companies are converting their franchised locations into company -owned stores or joint ventures.
• Monobrand stores sales (retail DOS and wholesale monobrand stores) accounts for about 29% of the overall market, while monobrand distribution across formats (including off-price stores, online and airport sales) already accounts for about 53% of overall distribution.
• The airport channel has posted annual growth of 29%, which is attributable to the increase in luxury spending by tourists across the world and accounts for about 6% of the global market share in the luxury goods led largely by beauty products sales.
• The online luxury market has grown tenfold since 2005 and accounts for about 7% of total sales in 2015. The online sales were largely led by the accessories and apparel categories.
2 e ail and n and dis i i n c n in ed ain s a e
Notes: ltagamma ain, x r oods orld ide ar et t d all inter ,’’ Altagamma/Bain. ltagamma ain, orld ide x r ar ets onitor, pdate,’’ Altagamma/Bain, October 2015.
y ds de and y na i nali y and y e i n
Luxury goods market by geography and channelG Global luxury goods market
l al pe s nal l y ds a e y c annel and a 2
5%
0%
9%
-2%
-5%
-12%
3%
-9%
9%
5%
-15%
-10%
-5%
0%
5%
10%
15%
Europe Americas Japan Mainland China Rest of world
2015
E gr
owth
Region Nationality
Retail DOS51%
Concession business
18% Online4%
Off-pricestores27%
Monobrand stores
18%
Departmentstores
28%Specialtystores
35%
Airport11%
Online7%
Off-pricestores
1%
Wholesale66%
Retail34%
The luxury and cosmetics financial factbook 2016

Glossary
Contact us
Title for section
Welcome to the third edition of EY’s annual Financial Factbook for the luxury and cosmetics sector. he actboo combines financial data, insight from EY’s global team of sector specialists and opinions of external experts.
XSales of industry players are expected to grow at a healthy rate, led by double-digit annual growth rate for L’Occitane and Natura from FY11A to FY14E. X Increased demand through innovative products will cater to underserved emerging markets. X Introduction of eco-friendly, sustainable and naturally derived beauty products and cosmetics will stimulate demand in established geographies.
Source: Data based on consensus of several brokers’ reports for each company.
Notes:Market capitalization is based on a one-month average as of December 2012. The 2012 growth corresponds to the sales growth rate between FY11A and FY12A/E.
Titles for charts
Titles for charts
H Global luxury goods
Sample selection
and specific analyses Executive sum
mary
DCF and valuation
parameters
Industry overview
Methodology
and disclaimer
a e DCF and valuation parameters
Chinese consumers are the dominant luxury goods buyers, accounting for about one–third of global purchases, with the majority of purchases being carried out outside China
• Japan was the top performing region at a constant rate (+9%), and in 2015, it as the first foreign destination for Chinese tourists (whom represent almost 40% of total sales in Japan).
• Mainland China’s luxury market in 2015 witnessed an annual growth of about 17% (and a negative growth of about 2% at constant exchange rates) to reach €18b. While the demand for watches and menswear witnessed a decline, the demand for jewelry, womens wear and shoes experienced an upward trend.
• The ong ong and aca mar ets posted a significant contraction due to currency ct ations, go ernment reforms and decreasing pop larit . he ong ong mar et
witnessed a contraction of 11% in 2015 (–25% at constant rates). • Hong Kong and Macau remain the top destinations in terms of number of visitors, but Japan
and Korea are the geographic areas where the foreseen growth in tourists is the highest.
a ied pe ance in e sian pe s nal l y ds a e
• Chinese consumers represent the largest share of buyers in the world, accounting for about 31% of global luxury goods purchases, followed by American buyers (24%) and European buyers (18%).
• However, onl one fifth of the p rchases made b hinese to rists are done in ainland China, the majority being made in the European markets. The dominance is further increased with the development of new outlet sites in China and the fact that Chinese travelers have been enthusiastic visitors of the many outlet malls in Europe.
• Chinese consumers are also focused on purchasing more from South Korea and Japan, which are emerging as new prominent shopping destinations for Chinese tourists.
2 inese ye s c n in e d ina e as e p l al c s e s
sian pe s nal l y ds a e s
sian pe s nal l y ds a e
Notes: ltagamma ain, ltagamma orld ide x r ar et monitor, pdate, Altagamma/Bain,
October 2015.2) Nomura, “Global tourism: shifting destinations for Chinese travellers,” Nomura global market research, 7 April 2016.
Indu
stry
ove
rvie
w
Industry overview Page
G Global luxury goods market
13%17%
-11%
16% 14%9%
-2%
-25%
4% 3%
-30%
-20%
-10%
0%
10%
20%
Japan MainlandChina
Hong Kongand
Macau
SouthKorea
Southeast Asia
€b
Real terms Constant rate
27.2
6.0 5.0
12.6
29.1
15.513.5
20.9
1%
21% 22%
11%
0%
5%
10%
15%
20%
25%
0
5
10
15
20
25
30
35
Hong Kong andMacau
South Korea
Japan Southeast Asia
Mill
ion
2015E 2020E CAGR15E–20E
18.015.0
9.0 9.06.0
20.018.0
11.08.0 7.0
0
5
10
15
20
25
Japan MainlandChina
SouthKorea
Hong Kongand Macau
Southeast Asia
€b
2014 2015E
inese isi s y e i n 2
The luxury and cosmetics financial factbook 2016

Title for section
Welcome to the third edition of EY’s annual Financial Factbook for the luxury and cosmetics sector. he actboo combines financial data, insight from EY’s global team of sector specialists and opinions of external experts.
XSales of industry players are expected to grow at a healthy rate, led by double-digit annual growth rate for L’Occitane and Natura from FY11A to FY14E. X Increased demand through innovative products will cater to underserved emerging markets. X Introduction of eco-friendly, sustainable and naturally derived beauty products and cosmetics will stimulate demand in established geographies.
Source: Data based on consensus of several brokers’ reports for each company.
Notes:Market capitalization is based on a one-month average as of December 2012. The 2012 growth corresponds to the sales growth rate between FY11A and FY12A/E.
Titles for charts
Titles for charts
H Global luxury goods
a e DCF and valuation parameters
Accessories segment continues to be the largest, and fastest, growing market segment
• Since 2012, accessories has been the largest category within the personal luxury goods market and have grown the fastest since 2009, with a CAGR of 12% through 2015E.
• The accessories segment accounted for about 30% of the global personal luxury goods market, with a 3% growth rate (at constant exchange rates) in 2015.
• The accessories segment also commands a dominant 40% share of the overall online personal luxury goods market sales.
• As accessible stat s s mbols, shoes benefit from strong tail inds and ha e been gro ing faster than the overall leather goods category in the recent past. Shoe sales growth continues to outpace leather goods, with both men’s and women’s segments showing positive growth trends.
ccess ies pe e
• Pricing analysis indicates continued convergence towards European prices. Harmonization is being performed through new product launches; meanwhile, prices on current products are fre entl nchanged.
• In the past, brands have been “price setters.” Today, pricing is not driving growth, and this will generate pressure on the top line and margins in the near future.
• As Japan has become one of the most popular destinations among Chinese travelers, companies are trying to take advantage by charging higher prices in Japanese retail stores.
• Apparel is characteri ed b regional content, a higher fre enc of ne prod cts and less expos re to gifting and th s re ects a higher price gap than other prod ct categories.
• Price changes all at once could be risky, as they might confuse the customer base and suddenly change a brand’s relative positioning ers s peers, p tting brand e it at ris .
2 ice di e en ial e ap ic a eas and p d c ype
l al pe s nal l y ds a e y p d c ype
a es l al pe s nal l y ds a e y p d c ype
Notes: ltagamma ain, x r goods orld ide mar et st d , Altagamma/Bain, 21 Dicember 2015.
2) Morgan Stanley, “Mind the price gap,” Morgan stanley research, 21 March 2016.
Page Industry overview
G Global luxury goods market
ice ap e s s pe y e ap ic a ea e e las n s2
ice ap e s s pe y p d c ype e e las n s2
Accessories
30%
Apparel
24%
Beauty
20%
Hard luxury
22%
Others4%
Accessories 12%
11%
7%
5%
4%
Hard luxury
Apparel
Beauty
Others
0% 5%
CAGR 09-15E
10% 15%
29%
20%
39%
22%19%
30%
20%
31%27%
0%
10%
20%
30%
40%
50%
US Japan Hong Kong
Apr 15 Nov 15 Mar 16
29%
52%46%
23%
31% 31%
5%11%
5%
0%
10%
20%
30%
40%
50%
60%
US Japan Hong Kong
Apparel Leather Watches and jewelry
The luxury and cosmetics financial factbook 2016

Indu
stry
ove
rvie
w
The luxury and cosmetics financial factbook 2016
Global cosmetics goods market
Page 42 Industry overviewPage 42
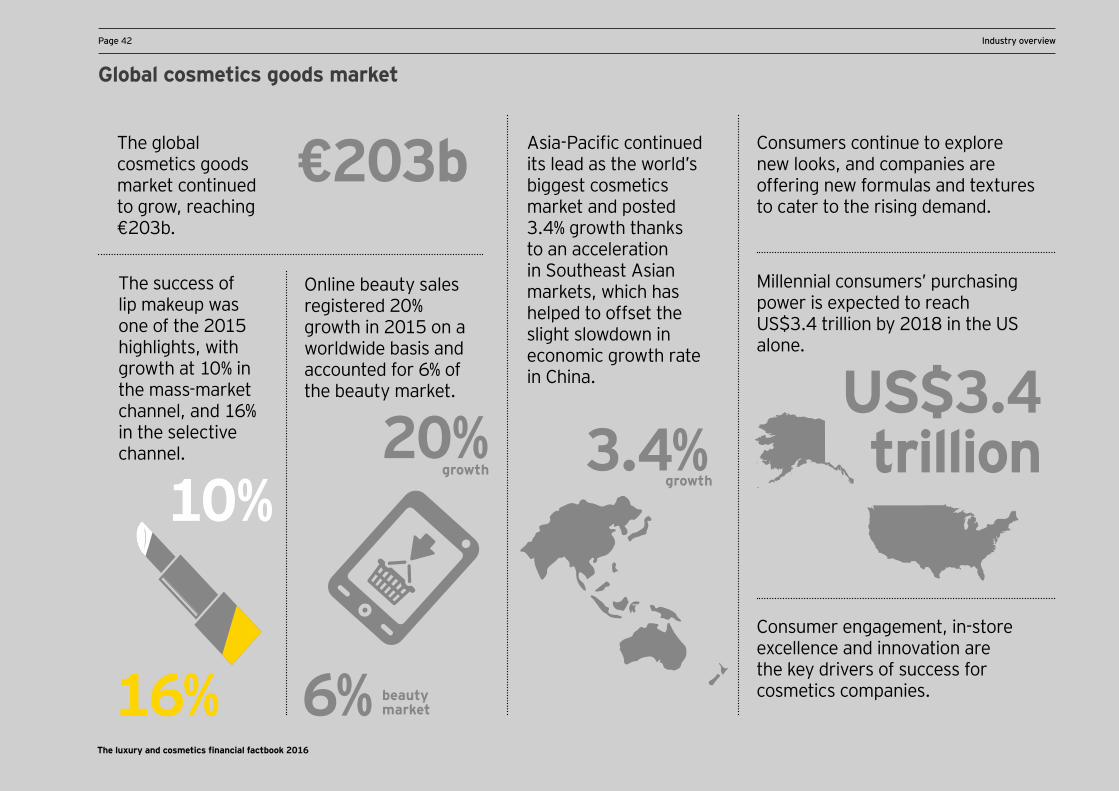
10%
The success of lip makeup was one of the 2015 highlights, with growth at 10% in the mass-market channel, and 16% in the selective channel.
The global cosmetics goods market continued to grow, reaching €203b.
€203b
Online beauty sales registered 20% growth in 2015 on a worldwide basis and accounted for 6% of the beauty market.
sia acific contin ed its lead as the world’s biggest cosmetics market and posted 3.4% growth thanks to an acceleration in Southeast Asian markets, which has helped to offset the slight slowdown in economic growth rate in China.
Consumers continue to explore new looks, and companies are offering new formulas and textures to cater to the rising demand.
Millennial consumers’ purchasing power is expected to reach US$3.4 trillion by 2018 in the US alone.
16%
20%
6%
3.4%US$3.4 trillion
Consumer engagement, in-store excellence and innovation are the key drivers of success for cosmetics companies.
The luxury and cosmetics financial factbook 2016
growthgrowth
beauty market

Glossary
Contact us
Title for section
Welcome to the third edition of EY’s annual Financial Factbook for the luxury and cosmetics sector. he actboo combines financial data, insight from EY’s global team of sector specialists and opinions of external experts.
XSales of industry players are expected to grow at a healthy rate, led by double-digit annual growth rate for L’Occitane and Natura from FY11A to FY14E. X Increased demand through innovative products will cater to underserved emerging markets. X Introduction of eco-friendly, sustainable and naturally derived beauty products and cosmetics will stimulate demand in established geographies.
Source: Data based on consensus of several brokers’ reports for each company.
Notes:Market capitalization is based on a one-month average as of December 2012. The 2012 growth corresponds to the sales growth rate between FY11A and FY12A/E.
Titles for charts
Titles for charts
H Global luxury goods
Sample selection
and specific analyses Executive sum
mary
DCF and valuation
parameters
Industry overview
Methodology
and disclaimer
Page 43DCF and valuation parameters
H Global cosmetic goods market The global cosmetics market is expanding steadily …
Notes: ar et ine ind str profile, global fragrances, hair care, ma e p, s in care, personal h giene.
2) L’Oréal annual report 2015.
• The market continued to grow, reaching €203b. The market was slightly stronger in 2015 with growth of 3.9% as compared to 3.6% in 2014 (both at constant rates) and in line with the average of 4% observed over the past decade.
• Consumer engagement, in-store excellence and innovation are the key drivers of success for cosmetics companies.
• he mar et remains s ppl dri en, and cons mers are al a s on the loo o t for alit , performance and perceived results.
l al c s e ics ind s y a e , at current rates l al c s e ics a e se en a i n y p d c s and e ap ies 2
Indu
stry
ove
rvie
w
Industry overview Page 43
158 165 171 178185
203
4%4%
4% 4%
10%
0%
2%
4%
6%
8%
10%
12%
0
50
100
150
200
250
2010 2011 2012 2013 2014 2015E
% gr
owth
€b
Cosmetics market Growth %
Skin care36%
Hair care23%
Makeup17%
Fragrances12%
Hygiene products
11%Other
1%
Asia-Pacific36%
WesternEurope
20%
LatinAmerica
11%
EasternEurope
6%
Africa, Middle East3%
North America24%
+4% at constant
rate
The luxury and cosmetics financial factbook 2016

Title for section
Welcome to the third edition of EY’s annual Financial Factbook for the luxury and cosmetics sector. he actboo combines financial data, insight from EY’s global team of sector specialists and opinions of external experts.
XSales of industry players are expected to grow at a healthy rate, led by double-digit annual growth rate for L’Occitane and Natura from FY11A to FY14E. X Increased demand through innovative products will cater to underserved emerging markets. X Introduction of eco-friendly, sustainable and naturally derived beauty products and cosmetics will stimulate demand in established geographies.
Source: Data based on consensus of several brokers’ reports for each company.
Notes:Market capitalization is based on a one-month average as of December 2012. The 2012 growth corresponds to the sales growth rate between FY11A and FY12A/E.
Titles for charts
Titles for charts
H Global luxury goods
Page 44 DCF and valuation parameters
… and proving resilient in times of economic uncertainty
• New markets, such as India, South Africa and Turkey, generated more than two–thirds of the beauty market growth in 2015.
• sia acific continued its lead as the world’s biggest cosmetics market and posted 4.3% growth due to an acceleration in Southeast Asian markets, which has helped to offset the slight slowdown in economic growth rate in China.
• The industry players are investing more resources in currently underrepresented countries to spread their global reach and tap growth opportunities.
• The operators are increasingl incl ding prod cts in their portfolios to specificall target consumers with lower disposable incomes.
e a e s
• Makeup is the most vibrant category for the third consecutive year and acted as a growth engine driven by the selfie generation.’’
• The success of lip makeup is one of the 2015 highlights, with growth at 10% in the mass market channel, and 16% in the selective channel.
• It is a o rishing mar et as cons mers contin e to explore ne loo s, and companies are offering new formulas and textures to cater to the rising demand.
• In addition, the push for natural cosmetics has opened new growth opportunities for smaller players in an otherwise highly competitive market. The trend has forced large companies to either ac ire or de elop their o n green’’ products.
2 in a e p ca e y
• Beauty, today, is synonymous with personalized products and services that enrich the consumer experience and its relationship with brands in all distribution sectors.
• Online beauty sales registered 20% growth in 2015 on a worldwide basis and accounted for 6% of the beauty market.
• Social media has made the online platform a critical part of every brand’s strategy. • Luxury cosmetics remains the most dynamic sector with 5.7% growth in 2015, thanks in
particular to e–commerce sales.
3 nline pla s ainin p p la i y
• There lies a strong opportunity for growth from millennial consumers, as their purchasing power is expected to reach US$3.4t by 2018 in the US alone.
• Further, it is estimated that 75% of the US workforce will comprise millennials by 2020, making it an attractive group for industry players.
• Eighty-six percent of millennials share their brand preferences online, which can help companies to reach wider consumer groups.1
• A new shopping revolution is underway in how consumers shop at retail stores and online platforms, as new channels of communication, commerce and service converge due to the impact of millennial consumers.
4 Targeting millennial consumers
Sources: L’Oréal Annual Report 2015, Estée Lauder Annual Report 2015 and other selected research. Notes: 1) Estée Lauder Annual Report 2015.
Page 44 Industry overview
H Global cosmetic goods market
The luxury and cosmetics financial factbook 2016

Indu
stry
ove
rvie
w
The luxury and cosmetics financial factbook 2016
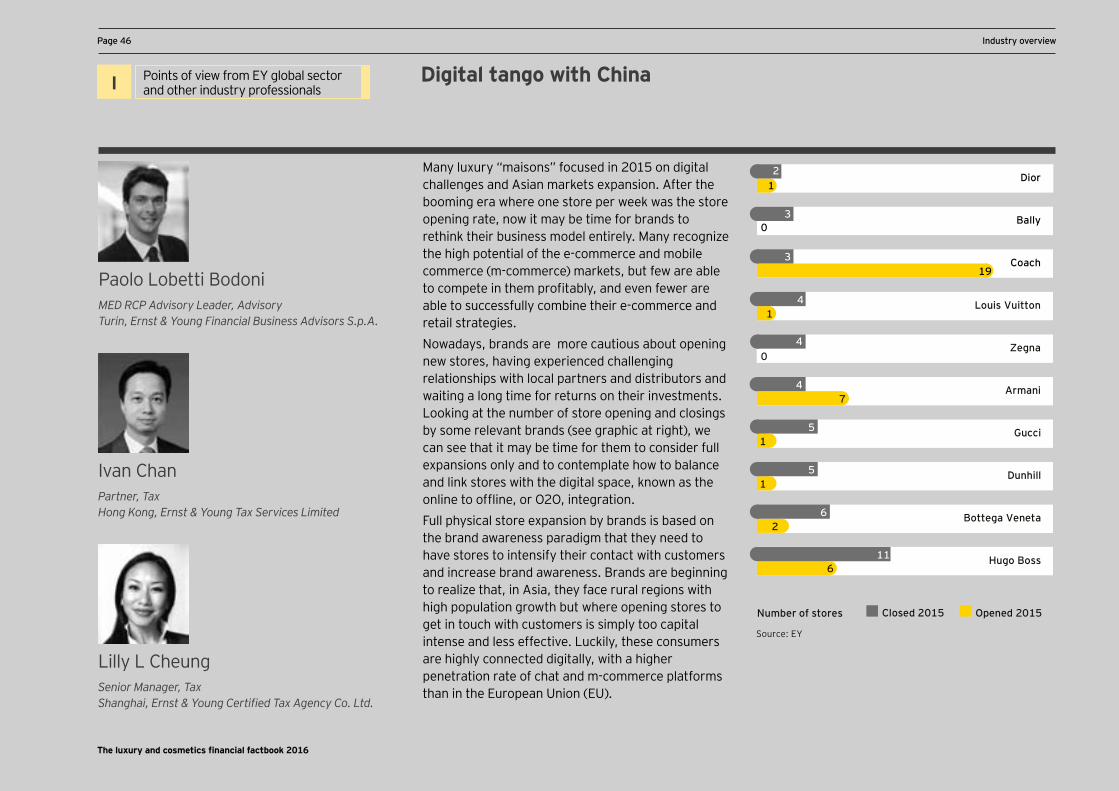
Page 46 DCF and valuation parameters Page 46 Industry overview
Digital tango with ChinaPoints of view from EY global sector and other industry professionalsI
Paolo Lobetti Bodoni MED RCP Advisory Leader, AdvisoryTurin, Ernst & Young Financial Business Advisors S.p.A.
Ivan Chan Partner, TaxHong Kong, Ernst & Young Tax Services Limited
Lilly L Cheung Senior Manager, Tax Shanghai, Ernst & Young Certified Tax Agency Co. Ltd.
Many luxury “maisons” focused in 2015 on digital challenges and Asian markets expansion. After the booming era where one store per week was the store opening rate, now it may be time for brands to rethink their business model entirely. Many recognize the high potential of the e-commerce and mobile commerce (m-commerce) markets, but few are able to compete in them profitabl , and e en fe er are able to successfully combine their e-commerce and retail strategies. Nowadays, brands are more cautious about opening new stores, having experienced challenging relationships with local partners and distributors and waiting a long time for returns on their investments. Looking at the number of store opening and closings by some relevant brands (see graphic at right), we can see that it may be time for them to consider full expansions only and to contemplate how to balance and link stores with the digital space, known as the online to of ine, or , integration.Full physical store expansion by brands is based on the brand awareness paradigm that they need to have stores to intensify their contact with customers and increase brand awareness. Brands are beginning to realize that, in Asia, they face rural regions with high population growth but where opening stores to get in touch with customers is simply too capital intense and less effective. Luckily, these consumers are highly connected digitally, with a higher penetration rate of chat and m-commerce platforms than in the European Union (EU).
0
0
12
Number of stores Closed 2015 Opened 2015
Hugo Boss
Bottega Veneta
Dunhill
Gucci
Armani
Zegna
Louis Vuitton
Coach
Bally
Dior
3
193
41
4
74
15
15
26
611
Source: EY
The luxury and cosmetics financial factbook 2016

Page 47DCF and valuation parameters Industry overview Page 47
Digital tango with ChinaPoints of view from EY global sector and other industry professionalsI
Indu
stry
ove
rvie
w
In particular, in China, customers are used to paying with modern mobile payment methods that only need a fingerprint and three seconds per transaction.
hese c stomers first enco nter brands on digital channels, so brands must manage their digital channels for the brand ambassadors that they are, foc sing on specific digital mar eting dedicated to c stomers on first contact. o reach this enormo s market, marketing and branding strategy need to be localized. The “digital conversation” with Chinese consumers is a totally different game than dialogue with Western consumers. Chinese consumers like more storytelling and have higher expectations in terms of delivery lead times and customer care
alit , as the are acc stomed to sing highl responsive and sophisticated platforms.
Digital luxury strategy capturing the Chinese mass marketCommercial trends in the luxury world traditionally follow retail trends, and m-commerce is the new must-have channel in China.Luxury houses are starting to try out different e-marketplaces, using e-commerce as a platform to socialize with customers and to provide a new level of customer experience. Luxury brands’ presence in high -end shopping malls seems to be serving more and more simply as a billboard. The growth of the targeted customer group for luxury brands, i.e., the upper middle class
(>$US26,000 in yearly disposable income) and af ent ho seholds , in earl disposable income) of lower tier cities, will be driving the growth potential for luxury brands in the coming years. In the past, luxury brands in China were reluctant to try the online channel. However, with the development of cross-border online platforms and the popularity of traveling to buy foreign goods, especially luxury goods, the online marketplace is
one potential way for luxury brands to secure China sales. The estion is hether l x r ho ses sho ld in est in their online presence instead of their of ine presence, or invest in a combination of both to attract future consumer growth and the millennial generation in China as well as to pioneer an unrivaled customer experience worldwide.
What s acles d l y ands ace in e di i al a e placeImage - The most important concern for luxury brands is their brand image and exclusivity. Online shopping is, in general, associated with shopping in a marketplace for cheap buys, which should be fast and convenient, whereas luxury goods are relatively expensive and not necessaril ic or con enient to p rchase. rod cts being a ailable online might impact their l x r image.
Grey market/fake/Daigou - Luxury brands do not wish to be associated with fake goods being sold via e-commerce through unauthorized channels. egal action has been an important tool in fighting this t pe of co nterfeiting. aigo is a pop lar a for hinese cons mers to purchase luxury goods, whereby a Chinese person overseas purchases a commodity (usually luxury goods) for a customer in Mainland China. There is room for cost negotiation between purchaser and recipient, since prices for luxury goods can be 30% to 40% higher in Mainland China than abroad.
Touch point - There is the potential for brands to lose contact in an online transaction with customers who often experience special luxury treatment in physical shops.
Governance - Third-parties’ behavior with customers cannot be controlled, especially in the last mile of delivery where a third-party logistic provider has the touch point with customers.
IT and supply chain capabilities - Digital, which heavily leverages the marketing, customer service, supply chain and IT functions of a company, is only partly in place with luxury companies. Luxury brands in China have outsourced much of their supply chain and IT functions.
Pricing E commerce triggers global transparenc on prod ct information and pricing. x r brands, e mar etplaces and agship stores on and of ine ha e to consider global pricing alignment, in order to balance a brand’s omni channel strateg . estions remain regarding ho to balance the retail price with the internal transfer price between different entities while ensuring shareholder value is enhanced.
Tax - Bonded, logistical cross-border e-commerce zones are popping up in different Chinese provinces to attract foreign investment. Import duties on luxury goods are constantly changing; therefore, business model innovation is needed where legal and tax play a crucial role.
The luxury and cosmetics financial factbook 2016

a e DCF and valuation parameters a e Industry overview
Digital tango with ChinaPoints of view from EY global sector and other industry professionalsI
The Chinese Government has been an important driver of stimulating and regulating online business growth, so it is worthwhile for luxury brands to gain a deeper understanding of the recent changes in guidelines that impact consumer behavior, including the recently launched Circular 18 on cross-border e-commerce duties. Further, the government is setting up cross-border e-commerce platforms, where certain governmental support is provided. This can be in the form of easing and hastening customs clearing. Finally, Chinese customers’ allowed online transaction amount has been increased.
China tax changes relating to e-commerceUntil recently, most cross-border business- to-consumer retail goods in China were administered under the individual parcel tax regime, which imposes an “individual parcel tax” on inbound hand-carried personal articles. These articles (e.g., passengers’ accompanying baggage and gifts for family and friends are mostl imported in reasonable antities for personal use, not for trading purposes. The tax is also called the “personal postage tax” because it applies to personal articles brought into China by post or by courier. It is a combined tax, consisting of the customs duty (CD), consumption tax (CT) and import le el al e added tax . he personal postage tax is generally lower than the accumulated
, and rates for similar goods imported for trading purposes (i.e., commercial goods). This favorable tax regime encouraged the popularity of traveling to buy foreign luxury goods and encouraged the practice of Daigou.
China increases individual parcel tax ratesIn order to le el the pla ing field,’’ the hinese government increased the individual parcel tax rates on nearly all luxury goods, effective 8 April, 2016, as summarized in the table below:
China individual parcel tax changeProduct categories New rate Old rate Increase
Gold and silver 15% 10% 5%
Sporting goods (excluding golfing prod cts , footwear, bags
30% 10% 20%
Apparel and textiles, electronics, bicycles, watches (excluding high-end pieces)
30% 20% 10%
Jewelry and precious jewelry accessories
60% 10% 50%
igh end atches, golfing products
60% 30% 30%
Cosmetics, tobacco, alcohol
60% 50% 10%
The new tax regime, if strictly enforced, will put pressure on the practice of Daigou and potentially discourage Chinese consumers from buying luxury goods overseas. The volume of parallel imports of luxury goods into China would likely reduce as well. A parallel import is a non-counterfeit product imported from another country without the permission of the brand owner.
The Chinese authorities also introduced the new cross-border e-commerce (CBEC) tax policy, which took effect on 8 April, 2016. This new CBEC tax regime only applies to imported goods that are traded through e-commerce platforms properly registered with Chinese Customs.A Chinese consumer is liable to pay the normal import duties when buying imported goods through CBEC, unless each transaction is less than RMB2,000 and the total amount spent is less than RMB20,000 a year. Reduced import taxes apply if transactions are below the thresholds previously mentioned, as follows: • No customs duty • 30% discount to CT • 30% disco nt to import le el
Additionally, imported CBEC goods, except for certain items, are not subject to China’s import licensing re irements. osmetic prod cts are one of the exceptions, and imported cosmetics and skin care products sold through CBEC will need to be registered with the China Food and Drug Administration, following the same procedures as those applicable to normal commercial goods imported under the general trade mode.
The luxury and cosmetics financial factbook 2016

a e DCF and valuation parameters Industry overview Page
Digital tango with ChinaPoints of view from EY global sector and other industry professionalsI
Indu
stry
ove
rvie
w
EY digital operating model research findingsFast-paced e-commerce development and the ensuing governmental response triggered the need for a better understanding of e-commerce for luxury brands in China. EY- Operating Model Effectiveness group interviewed 20 luxury brands in Mainland China between April and August 2015, investigating their digital market strategy, operating model and operational transformation needs. Some highlights of the study are discussed below.
How luxury brands maintain their brand imageLuxury brands use a number of approaches to protect and maintain their image or “e-reputation.” According to our survey, best practices include: appearing only on respected websites, limiting the number of e-commerce channels through which their products are offered, working with key opinion leaders (KOL) and ensuring positive reviews on products (see the graphic at right).
11%
13%
22%
11%
13%
11%
50%
44%
22%
75%
Linking your brand with only certain e-commerce channels
Review websites entries
Association with other brands of choice
Appearance on respected websites to increase your credibility
How do you build your e-reputation?
11.1%
22.2%
22.2%
11,1%
11.1% 11.1%
44.4%
22.2%
33.3%
66.7%
Censoring online conversations
Initiating online forum discussion
Promoting positive online conversations
Joint ventures with online KOLs
How do you control your e-reputation?
Not important Less important Average Somewhat important Very important
The luxury and cosmetics financial factbook 2016

a e DCF and valuation parameters a e Industry overview
Digital tango with ChinaPoints of view from EY global sector and other industry professionalsI
Luxury brands invest for omni‑channel integrationWhen luxury brands were asked how much and in which activities they were planning to invest for the next three years, there was a clear distinction between market entry brands with a limited online presence versus mature brands that are well-presented online. The luxury brands with a relatively low online presence are planning on spending an average of up to US$4m to US$5m on building presence on third-party e-commerce sites and social media, collaborating with KOLs, and marketing their brand history in order to create online awareness with (new) Chinese customers (see graphic below). These strategies aim to introduce new customers, via e-commerce, to foreign luxury brands, as agship stores are less present in smaller cities and more rural areas. Luxury brands that are well-presented online often have an online presence on third-party e-commerce sites. Some brands plan to invest up to US$40m in the next three years to build their own online platform; integrate mobile, tablet and PC; and integrate their online and of ine in entor management and supply chain (see graphic at right). Luxury brands building their own platform seems to be the future trend, since they do not need third-party e-commerce sites to build their brand. Moreover, if they grow in China, a part of their sales will go to these third-party e-commerce platforms if they do not have their own.
In addition, more and more luxury houses that have an outlet business are collaborating with multi-brand e-commerce sites to have a presence online.
Though proven success is yet to come, digitalization is in progress.
0% 10% 20% 30% 40% 50% 60% 70% 80% 90% 100%
Value proposition
Customer relationships
Channels
Cost structure
Revenue streams
Customer segments
Now
Future
Now and future
ic y siness del se en s is s ly in enced y y di i al s a e y
n es en in sales and a e in and c s e ela i ns ip ana e en ac i i ies
up to US$4m to US$5m
• eneration of traffic to channels
• Online marketing
• Content production
• KOLs and social media presence
• Platforms: e-marketplaces and mobile platforms
• Customer relationship management (CRM) to manage c stomer profiles and relationships
Investment in a holistic operations approach p
• et or sec rit , data storage and mobile tablet compatibility
• Digitization of sales processes
• Own integrated platform, i.e., e-commerce and m-commerce
• Omni-channel infrastructure
The luxury and cosmetics financial factbook 2016

a e DCF and valuation parameters Industry overview Page
Digital tango with ChinaPoints of view from EY global sector and other industry professionalsI
Indu
stry
ove
rvie
w
Organizational changes and impact of brands’ China digital strategyLuxury brands see their organization and service levels changing in the next three years, including mar eting, s ppl chain logistics, c stomer ser ice and IT capabilities. Marketing efforts, especially on social media, will need to increase in order to attract customers, improve the stickiness in the physical store and attract more traffic to the ebsite. ppl chain logistics sho ld be restr ct red pre io sl a batch of products was sent to the store, and from the store, it was divided. Now, companies send one item across China to get it delivered. A customer service team is needed to deal with returns and engage customers, who are more diverse, which will likely mean longer or ing ho rs for online estions. Sometimes, customer service teams have to answer
estions be ond their control, i.e., on the deli er alit . inall , capabilities ill need to change so
that there is transparency and communication between in-store and online inventory. Integration will be needed between online and mobile portals, the order management system, the warehouse management system and the logistics provider system. The graph at right shows the omni-channel integrated development plan of the average luxury brand.
33%
67%
56%
33%
22% 22%
11%
33%
22%
11%
22% 22% 22%
11%
33%
11%11%
22%
Return onlinepurchases
Check inventory atother stores
Order inventory atother stores
Ship from stores Pickup onlinepurchases in store
Holistic planningacross channels
When will you adopt these omni-channel practices?
Up-to-date
0–12 months
12–24 months
24–36 months
Currently, luxury brands want to have transparency between their physical stores in their stock availability. In the next year, they would like to ship inventory between stores and their distribution centers, where demand planning, inventory management and warehousing will be impacted.
In the coming two to three years, brands desire holistic planning across all channels, meaning that online prod cts can be bo ght and pic ed p of ine, but also the other way around.
The luxury and cosmetics financial factbook 2016

Page 52 DCF and valuation parameters Page 52 Industry overview
Points of view from EY global sector and other industry professionalsI Digital tango with China
What are the key drivers for integrating the supply chain and logistics of your physical and online stores?
0%
5%
10%
15%
20%
25%
Cost efficiency Inventory reduction Company structure and design
Tax and legal reasons
Not important
Average
Very important
f ine retail entities in China are exploring new approaches to expedite customs clearance and reduce supply chain lead time to meet the new e-commerce opportunities. The China General Administration of Customs (GAC) introduced the
stoms Enterprise ertification stem. his rating system may provide a possible solution to simplify customs for brands entering China. Effective 1 December 2014, importers are graded into the following four ratings:
In our study, one of the main reasons luxury brands provided as to why they should integrate their online and of ine s ppl chains is in entor red ction, where the transactions made are delivered from the same pool of inventory either in the physical stores or warehouses, based on availability to deliver on promised customer service levels (see graphic above). The other main reason is the tax and legal regulations in China.
Currently, most of the e-commerce luxury goods in hina are s pplied b of ine retail entities located in hina o ned b l x r brands. oods are first
imported into China as normal “commercial goods” under the general trade mode. Such imports face obstacles, such as slow clearance, the return of imported goods that need to be exported again, and the large amount of administrative work that needs to be prepared along with the importation.
Prior grades per GAC decree no. 197
Current grades per GAC decree no. 225
AA Advanced authorized enterprise
A Normal authorized enterprise
B General credit enterprise
C and D Dishonest enterprise
The luxury and cosmetics financial factbook 2016

Page 53DCF and valuation parameters Industry overview Page 53
Points of view from EY global sector and other industry professionalsI
Indu
stry
ove
rvie
w
Digital tango with China
Generally, entities with a higher rating from customs are entitled to more beneficial treatments d ring the clearance process.
pecificall , an advanced authorized enterprise may en o the follo ing c stoms benefits1. Lower inspection rate of imported and exported
goods2. implified review of documents for imported and
exported goods3. Prioritized customs clearance formalities for
imported and exported goods4. Customs inspection and release of imported and
exported goods before commodit classification, customs valuation and country of origin are determined or other customs formalities are completed
5. Customs assignment of coordinators for enterprises
In addition, an advanced authorized enterprise is now treated as an authorized economic operator (AEO) in China. The government has agreed with several co ntries regions ingapore, ong ong, o th Korea) to mutually recognize an AEO. Under such agreements, Chinese customs and participating co ntries regions ill provide conveniences for the goods imported by one AEO enterprise from another AEO enterprise.
New trends in customers’ and companies’ behavior in China
Luxury customers’ buying strategies divergeCustomers that have access to global pricing save money by buying online, mainly through e-marketplaces. These additional savings can in turn be used to buy luxury goods. Customers are able to buy more for less.
Company sales’ strategies convergeCompanies that pursued the mass market previously are now trying to upsell their brand, since new digital customers from lower tier cities are likely new to their brands. In addition, luxury brands are introducing new lines, which are capturing these new online customers, in order to prevent down selling of their original brand. In this context, luxury is no longer defined as scarce, b t characteri ed as ha ing a long,
ni e and a thentic brand stor of craftsmanship.
The best pla ers e’re obser ing are defining a blended strategy for each market, with different approaches for mega cities than for rural areas, le eraging agships on the m st be seen streets and A-list locations, delivering sophisticated digital marketing on Asian platforms (also third-party platforms) and providing story and content to generate social conversations. The mindset for 2016 is to move the focus from increasing walk-ins in the shops to engaging cons mers in a more exible, digital omni channel platform that is a ailable for contin ed profitabilit .
The luxury and cosmetics financial factbook 2016

Page 54 DCF and valuation parameters Page 54 Industry overview
Points of view from EY global sector and other industry professionalsI Recent transactions in the perfume industry: the price of
scarcity
Arnaud Cohen Partner, TASParis, Ernst & Young Advisory
For decades, the perfume market has proven extremely attractive for luxury brands and fashion designers, ho identified it as a ic a to earn incremental revenues while improving brand awareness. Perfume and cosmetics specialists also benefited from this incremental o of demand and too ad antage of the significant price differential between very high selling prices and their own (limited) costs.These golden years appear to have ended. In order to continue being successful in an increasingly competitive market, the main industry players have explored alternative or complementary strategies that are currently driving the industry, including: 1) the la nch of ne fragrances or an ers for brands that are already successful on the market, 2) the entry into new market segments, such as the “haute parf merie niche, primaril thro gh ac isitions, and 3) the purchase of rights over existing brands.Following a brief overview of the current state of the market, we will explore in more depth the last two options and ans er the estion mar et participants are asking themselves: is the price for continued growth still worth it?
***
As depicted in the next page, the fragrances market has so far mainly been led by two types of industry pla ers . di ersified l x r gro ps and . specialized cosmetics and fragrance manufacturers that partner with luxury, fashion or other premium brands (“haute couture,” fashion, accessories, etc.) through fragrance deals.Brands, such as Guerlain and Lancôme, which have been exclusively involved in the cosmetics sector, and smaller brands engaged in the haute parfumerie niche market are the few exceptions that prove the rules, as illustrated on the chart on page 55. In all other instances, the sale of fragrances mainly relies on a brand created outside of the perfume industry, which plays a considerable role in increasing product attractiveness and is a key differentiator in the market.
Benjamin MsikaSenior Manager, TASParis, Ernst & Young Advisory
The luxury and cosmetics financial factbook 2016

Page 55DCF and valuation parameters Industry overview Page 55
Points of view from EY global sector and other industry professionalsI
Indu
stry
ove
rvie
w
Recent transactions in the perfume industry: the price of scarcity
Entering the perf me ind str re ires large investments in the form of high marketing costs to build brand awareness. As a result, the link between fragrances and l x r fashion has become ite natural. It enables luxury houses to leverage their existing labels to sell perfumes. It further allows manufacturers to capitalize on a strong brand identity and a genuine history.
Avon: Christian Lacroix, Haiku
sa p e e a e li operatori economici?
Top perfume brands
Puig: ean a l a ltier, rada, alentino, omme des ar ons, ina Ricci, Paco Rabanne
Estée Lauder: Estée Lauder, Ermenegildo Zegna, DKNY, , om ord, omm ilfiger, ichael ors, r d ric
alle , ilian , lini e
Inter Parfums Inc.: Abercrombie & Fitch, Boucheron, Coach, nhill, ochas, ontblanc, imm hoo, an leef rpels,
Paul Smith, Lanvin, Karl Lagerfeld, S.T. Dupont, Repetto
AmorePacific: Annick Goutal**, Lolita Lempicka
Shiseido: Serge Lutens**, Zen
Chanel: Chanel
LVMH: Guerlain*, Christian Dior, Kenzo, Givenchy
L’Oréal: Lancôme*, Yves Saint Laurent, Giorgio Armani, Ralph Lauren, Cacharel, Diesel, Maison Margiela, Proenza
cho ler, i tor olf
Coty: cci, oberto a alli, ottega eneta, alenciaga, Guess, Stella McCartney, Cerruti, Miu Miu, Alexander McQueen, Hugo Boss, Lacoste, Escada, Chloé, Marc Jacobs, Calvin Klein, Adidas
Hermès: Hermès
Clarins: Thierry Mugler, Azzaro
*Involved in cosmetics and fragrance activities only**Haute parfumerie niche market
For man ears not ithstanding the sit ation of some of the larger brand portfolio owners (e.g.,
a health balance generall existed bet een the brand owners who did not have the desire, scale, time or skills to enter the perfume market and the perf me cosmetics man fact rers ho ere read to make the necessary investments in order to develop these brands in the perfume segment, provided they could access it at a reasonable cost.
This led to “win-win” licensing deals under which the owner of the brand (or licensor) granted a license for the right to use its brand for certain categories of products (generally class three rights, i.e., perfume and cosmetics) to a fragrance manufacturer (or licensee) who would pay a license fee (generally in the form of a royalty rate applied to its wholesale sales).
The luxury and cosmetics financial factbook 2016

Page 56 DCF and valuation parameters Page 56 Industry overview
Recent transactions in the perfume industry: the price of scarcity
Points of view from EY global sector and other industry professionalsI
The following table provides a non-exhaustive list of the license agreements in force in the fragrance sector today.
Licensor Licensor business Licensee Licensee business Date of effect Royalty rate Status
Abercrombie & Fitch Premium apparel Inter Parfums Inc. Perfume house 2016 n a Active
Alexander McQueen* Luxury fashion Coty Cosmetics 2016 n a Active
Boucheron Fine jewelry Inter Parfums Inc. Perfume house 2011 n a Active
Burberry Luxury fashion Inter Parfums Inc. Perfume house n a 14% Expired
Christian Lacroix Luxury fashion Inter Parfums Inc. Perfume house n a 5.5% Expired
Coach Luxury fashion Inter Parfums Inc. Perfume house 2016 n a Active
Dolce & Gabanna Luxury fashion Procter & Gamble Co. i ersified ons mer goods n a 10% Expired
Dunhill Tobacco and luxury goods Inter Parfums Inc. Perfume house 2013 n a Active
Ermenegildo Zegna Luxury fashion Estée Lauder Cosmetics 2011 n a Active
Escada* Apparel Coty Cosmetics 2016 n a Active
Fendi Luxury fur and leather goods Eli Lilly Pharmaceutical and cosmetics n a 4.5% n a
Giorgio Armani Luxury fashion L’Oréal Cosmetics n a 4% Active
Gucci Luxury fashion Procter & Gamble Co. i ersified cons mer goods 2006 9.3% Expired
Gucci* Luxury fashion Coty Cosmetics 2016 n a Active
Hugo Boss* Premium apparel Coty Cosmetics 2016 n a Active
Karl Lagerfeld Luxury fashion Inter Parfums Inc. Perfume house 2012 n a Active
Lacoste* Premium apparel Coty Cosmetics 2016 n a Active
Lanvin Luxury fashion Inter Parfums Inc. Perfume house 2007 5.5% Active
Louis Feraud Luxury fashion Ferraud et compagnie Luxury fashion n a 3% n a
Maison Margiela Luxury fashion L’Oréal Cosmetics 2016 n a Active
MiuMiu Luxury fashion Coty Cosmetics 2013 n a Active
Paul Smith Apparel Inter Parfums Inc. Perfume house n a 5.5% Active
Proenza Schouler Apparel L’Oréal Cosmetics 2015 n a Active
Repetto Ballet shoes Inter Parfums Inc. Perfume house 2012 n a Active
Roberto Cavalli Luxury fashion Coty Cosmetics 2011 n a Active
S. T. Dupont Luxury leather goods Inter Parfums Inc. Perfume house 2014 6% Active
Stella McCartney* Luxury fashion Coty Cosmetics 2016 n a Active
icense agreement originall signed ith ea t siness and transferred as part of ot transaction. The presented royalty rate corresponds to the midpoint of a range for the following license agreements: Celine, Christian Lacroix, Fendi, Lanvin, Paul Smith, Ralph Lauren and S.T. Dupont.
The luxury and cosmetics financial factbook 2016

Page 57DCF and valuation parameters Industry overview Page 57
Recent transactions in the perfume industry: the price of scarcity
Points of view from EY global sector and other industry professionalsI
Indu
stry
ove
rvie
w
More often than not, the exact terms and conditions of the licensing agreements are not publicly available, but royalty rates paid by the licensee are typically expected to range between 2% and 10% in this industry.While licensing deals are still very much being developed, some of the main perfume manufacturers have experienced the limits of this business model1 and are now exploring more, and more often, opportunities to directly buy either the rights over a trademark category or an entire trademark, brand or business. Another strategy used by industry players is to look for haute parfumerie brand targets. While the benefits of s ch strategies are ite e ident from a b siness and gro th perspecti e, the right estion to ask is whether these transactions are also sound from a financial perspecti e.To help ans er this estion, it is sef l to go bac to some of the basics of valuation theory and to review the valuation approach commonly known as the relief-from-royalty method2. In fact, the relief-from-royalty method seems particularly suited to estimating the value associated with the ownership of the rights to a brand intangible asset in the perfume sector.
1 One of the most famous examples of the limits to this business model is arguably the termination of the licensing arrangement between Burberry and Inter Parfums at the end of 2012. While Inter Parfums recei ed significant compensation from rberr pon termination of the licensing agreement, the former lost approximately 50% of its total sales almost overnight.
2 The basic tenet of the relief-from-royalty method is that without ownership of the subject intangible asset, the user of that intangible asset would have to make a stream of payments to the owner of the asset in ret rn for the rights to se that asset. ac iring the intangible asset, the user avoids these payments.
Revenues generated under the trademark
Royalties on the trademark Cash ows attributable to the trademark
Royalty rate
Value of the trademark
Less protection costs and tax
Discount rate{ {
As depicted in the previous chart, under this approach, the al e of the brand is e al to the stream of after-tax royalty savings associated with the ownership of the intellectual property (IP) rights discounted at a rate commensurate with the risks of the asset. athematicall , the brand al e rand is dependent on the following parameters: • S1 = sales generated under the brand name in year one
• g = annual growth rate of sales associated with the brand
• RR = royalty rate • DR = discount rate • TR = tax rate
In form laic terms, the al e of an indefinite li ed brand is computed as:
To nderstand the practical conse ences of this approach, let’s ta e a simplified example ith the following parameters: • S1 = 100 • g = 2% • RR = 6% • DR = 10% • TR = 33.33%
Numerically, this leads to rand .
In other words, a perfume brand generating sales of 100, growing at 2% per year (into the long term) and for which the licensee pays a royalty rate of 6% has a theoretical, intrinsic value of 50 or 0.5x sales.
VBrand = ((S1*RR) * (1–TR))/(DR–g)
The luxury and cosmetics financial factbook 2016

a e DCF and valuation parameters a e Industry overview
Points of view from EY global sector and other industry professionalsI Recent transactions in the perfume industry: the price of
scarcity
Now that we know how the math works, we can also nderstand ho the brand al e ct ates ith the
main parameters.For a royalty rate between 4% and 8% and a discount rate between 8% and 12%, the resulting brand value is between 0.3x and 0.9x sales.That is the theory. Let’s now take a look at two recent real-world industry transactions: • On 9 July 2015, Coty announced its merger with the P&G beauty business (and its large perfume and cosmetics portfolio for a combined e it value of US$9.6b. While this portfolio is made of scores of owned brands and license agreements
hich ma es it diffic lt to anal e , this translates into a 2.1x sales multiple.
• On 19 March 2015, Inter Parfums announced the ac isition of the ochas brand for m. According to the company’s press release, the brand achieved sales of US$46m at the time of the ac isition, hich translates into a . x sales multiple.
In other ords, for these t o transactions, the Esales multiple was more than four times what we computed for a “typical perfume brand.” While the utmost care should be taken when analyzing these transactions’ fig res as an example, the ochas sales included some royalty revenues that should be segregated and analyzed separately), we clearly see that there is a great disconnect between the intrinsic brand al e indicated b o r simplified theoretical computation and the reality of recent transaction prices paid in the industry.
What could cause such a disconnect?In our view, this discrepancy can be linked in large part to the following factors:1. The sec ring of f t re cash o s for an indefinite
period of time. Indeed, in our previous numerical example under the relief-from-royalty method, we had assumed that owning the brand was e i alent to a oiding the pa ment of a f t re stream of royalties. In doing so, we omitted to say that this ac isition is also a a to sec re the ability to continue using the brand and avoid any uncertainties that may arise at one moment or another (e.g., increased royalty rate upon renewal of the license . rther, in general, b ac iring a brand, the perfume manufacturer also secures the cash o s associated ith pre io sl developed IP (existing fragrances)
2. The capabilit to define the strateg on e er aspect of the se and de elopment of the brand
hich is nli el nder a license agreement and more specificall on the follo ing strategic decisions: • International development of the brand • e la nches inno ations, hich no longer need to be approved by the brand owner
• Price positioning, which does not need to be approved by the brand owner
3. Potential costs synergies [distribution, media buying purchasing power, Selling, General & Administrative expenses (SG&A), etc.]
4. Finally, the scarcity of such assets and the will to seize growth opportunities in a highly competitive market
While the first three factors could validly impact the parameters considered to value a brand under the relief-from-royalty method or translate into meas rable additional cash o s, the fourth factor has no direct financial translation and therefore leads to the estion each decision ma er in the ind str sho ld as hat price premi m am read to pa for such scarce assets?This race for scarce brands has also resulted in another strateg that clearl has some benefits b t will not be the ultimate answer to the industry’s challenges. This alternate or complementary strategy has consisted of perfume manufacturers looking for growth opportunities at the high end of the market, i.e., the haute parfumerie niche market.The haute parfumerie is indeed an interesting way to address the market, as it allows manufacturers to: • Avoid being dependent on third-party distributors (large, specialized retailers, such as Sephora) and capture the margin associated with the distribution of the perfumes
• Differentiate themselves from the “pack” of the fashion l x r brands ith a distinct image fine fragrances specialist) and value proposition
personali ed ni e fragrances • Increase the price scale with offers ranging from €100 to €700, as described in the following table, which summarizes some recent transactions in the high-end segment of the market
The luxury and cosmetics financial factbook 2016

a e DCF and valuation parameters Industry overview Page
Points of view from EY global sector and other industry professionalsI
Indu
stry
ove
rvie
w
Recent transactions in the perfume industry: the price of scarcity
Date Target Buyer Seller Consideration Comments
25 Feb 2016 By Kilian Estée Lauder
Kilian Hennessy
Undisclosed By Kilian is a luxury perfume brand from Paris, created by Kilian Hennessy. Sold in more than 40 countries through freestanding stores (e.g., Paris, London, New York, Moscow, Doha and Lugano) and perfumeries, By Kilian offers perfumes with a price range between €100 and €300.
24 Jan 2016 L’Artisan Parfumeur and Penhaligon’s London
Puig Fox Paine & Company
Undisclosed Penhaligon’s London is one of the most prestigious British fragrance houses and holds two Royal Warrants. The brand has its own stores (London, Paris, Hong Kong, Singapore, Milan, New York, Beverly Hills, Taipei, etc.) and a global presence. Penhaligon’s offers perfumes with a price range between £65 and £150. L’Artisan Parfumeur Paris is a luxury artisanal brand from Paris, working with its own craftspeople to create authentic and innovative perfumes. L’Artisan Parfumeur operates retail bo ti es in rance aris, ille, arseille and has a global presence. L’Artisan Parfumeur offers perfumes with a price range between €100 and €150.
22 Dec 2015 Serge Lutens
Shiseido Serge Lutens
Undisclosed Serge Lutens is a luxury perfume brand from Paris. Serge Lutens fragrances retail in approximately 2,000 stores, spanning 35 countries with a total net sales of c. €40m. Serge Lutens offers perfumes with a price range between €100 and €600.
12 Jan 2014 Editions de Parfums Frédéric Malle
Estée Lauder
n a Undisclosed Editions de Parfums Frédéric Malle offers a collection of luxury perfumes created by 12 master perfumers from aro nd the orld. old thro gh fi e stores in aris and e York as well as through Barneys New York in the United States and Liberty in London, Editions de Parfums Frédéric Malle offers perfumes with a price range between €100 and €260.
11 Jan 2014 Le Labo Estée Lauder
n a Undisclosed Le Labo provides highly selective luxury fragrances. The brand distributes its perfumes in minimalistic freestanding stores in New York, London, Paris, Los Angeles, San Francisco, Tokyo and Hong Kong, as well as selected prestige department stores worldwide. Le Labo offers perfumes with a price range between €140 and €730.
While not enough information is available to compute the valuation multiples, it should also be noted that these transactions generally also “come at a price,” as: • The market addressed by haute parfumerie corresponds to a marginal portion of it.
• There are an increasing number of players in this niche, which makes it increasingly competitive as well.
• In certain cases, these brands are too closely associated with their creator and may not last in the long run.
• They may not allow aggressive expansion or di ersification plans.
***The competition between the perfume industry’s main pla ers has certainl intensified as the ind str has become more mature and players realize that there might not be room for everyone. Besides, the race to the “Holy Grail” is not over, and some transactions might still occur in the near future. As an example, after the exit of the Dolce & Gabanna brand from the ot portfolio follo ing the ot transaction, some companies active in the sector seemed to look at it closely. For this transaction, as for an other, the estions that ill need to be answered include: how much of a premium are investors willing to pay for scarce assets? More importantly, in the luxury world where things change er ic l , are e betting on the right brand s the
price offered commensurate with the risks taken?
The luxury and cosmetics financial factbook 2016

a e DCF and valuation parameters a e Industry overview
Millennials and the luxury landscape Points of view from EY global sector and other industry professionalsI
Kelsea E WestSenior, TASDallas, Ernst & Young LLP United States
Millennials and the luxury landscape Millennials are taking the reins of luxury, and for them, it’s all about the experience. Born in an era bookended by the introduction of the personal computer and the smartphone, millennials have always had information — and choices — right at their fingertips. ith of all ho seholds in the making more than US$500,000 annually belonging to millennials, the generation represents a lucrative market for luxury brands. The U.S. Chamber of Commerce cites that although they’re decades away from peak earning power, millennials currently command approximately US$700b in purchasing power: US$200b of their own and US$500b of indirect spending thro gh in encing their parents.1
ecr iting firm erglass ssociates estimates that by 2017, the millennial generation is expected to outspend baby boomers. Tapping into millennials’ desire for engagement is forcing brands to innovate and create ever more immersive, interactive experiences for consumers.Here is what some luxury brands are doing to capture millennials’ hearts — and wallets.
1 r stina stafson, illennials redefine l x r and the sta es are high,” CNBC News, 18 February 2015, CNBC LL 2016, accessed via http .cnbc.com .
Creating a dialogue through social mediaCondé Nast magazine calls it “the Yelp effect.” Every experience with a brand, good or bad, can be easily catalogued, documented and shared online via social media in toda ’s orld. lmost a arter of searches for millennials’ top 20 brands are links to user-generated content. Additionally, millennials lean heavily on recommendations from friends and peers. Because millenials are accustomed to seeking out recommendations, l x r brands are finding it critical to maintain positive relationships with them. One way they’re doing this is through social media. More than 2.1 billion people worldwide are on social media in one form or another. And one-third of millennials cite social media as their preferred method of communication with businesses.2 Because millennials tend to be very active on various forms of social media, there are numerous channels and opportunities for luxury brands to deliver their messages to a willing audience.3 According to Chris Paradysz, co-CEO of marketing agency PMX Agency, Gucci, Chanel and Burberry have seen success with an innovative digital presence attracting millennial consumers. Chanel’s YouTube channel currently has more than 550,000 subscribers and features high-production content, including promotional videos, fashion shows and beauty tutorials.
2 Tom Pick, “47 Superb Social Media Marketing Stats and Facts,” InfusionSoft, 21 January 2016.
3 Erin Shea, “Future of fashion brands depends on millennial brand affinit , Luxury Daily, 18 January 2013 , Napean LLC, 2016.
John Nguyen Senior Manager, AuditDallas, Ernst & Young LLP United States
The luxury and cosmetics financial factbook 2016

a e DCF and valuation parameters Industry overview Page
Millennials and the luxury landscape Points of view from EY global sector and other industry professionalsI
Indu
stry
ove
rvie
w
Chanel aims to produce video content as luxurious as its products in order to build its digital brand and lure consumers.4 It seems to be working. The latest video from Chanel’s show in Cuba caused YouTube user lil iss to comment, ood ’ll go bro e again inNovember–December shopping this collection lol as usual.” User Christopher James had a more emotional take: “Oh my god! Thrilling! Inspirational, emotional, de ine sic . t’s the first time a fashion show makes me cry ... Devine [sic]!”There’s further evidence that connecting with consumers via social media can lead to a better bottom line. Luxury conglomerate Kering reported an 11.5% YOY revenue increase for Gucci, which became increasingly active in the digital space during the latter half of 2015. The Instagram page for Gucci has more than . million follo ers and fre entl posts photographs of the latest product offerings and celebrities wearing Gucci. Luxury conglomerate
also reported increased moment m and success for label Bulgari, which has a strong digital presence. And then there’s the story of Balmain.
4 Hilary Milnes, “How Chanel trounces other industry brands on YouTube,” Digiday, 25 August 2015, 2010–2016 Digiday.
Olivier Rousteing, Balmain’s creative director, has helped rejuvenate the popularity of the label through his Instagram account, which documents his partying
ith models as ell as his high profile relationship with the Kardashians.5 Named Balmain’s creative director at the age of 24, Rousteing’s social media presence — and the attention it attracts — has transformed the compan from a ash , inaccessible brand to the brand that o tfits millennials’ fa orite celebrities. Rousteing learned from his friend Kim Kardashian how to tap into the potential of using Instagram as a social media marketing tool long before many other designers. He prides himself on being a celebrity-loving millennial, and has now de eloped an nofficial almain rm of his closest celebrity friends, including model Rosie Huntington-Whiteley, Kanye West, Kylie Jenner and Rihanna, for whom he personally selected concert to r o tfits. Rousteing credits the success in part to his focus and ability to build a brand6 via social media.
5 Jessica Pressler, “Meet Balmain’s Oliver Rousteing, Fashion’s BFF,” GQ, 3 November 2015, Condé Nast, 2015.
6 Ibid.
Reinforcing the brand through social responsibilityMillennials are commonly characterized as caring more about social justice and the environment than generations before them. Due to these characteristics, l x r brands that sho an affinit for social responsibility could attract more millennial consumers. The Harvard Business Review says that 88% of US and UK millennials and Generation Xers believe brands need to do more good.7 Not typically associated with social responsibility, luxury brands are beginning to adapt this preference of their millennial customers by implementing green initiatives, focusing on transparency and sustainability, and showcasing local manufacturing efforts.8 oth and ering ha e implemented s stainabilit programs to foc s on specific environmental and social issues and challenges in their ind str , specificall aro nd man fact ring. n 2012, Kering implemented a series of ambitious target goals, which were integrated into the company manufacturing plans around responsible gold sourcing, water pollution, leather traceability, chemical se and carbon emissions. implemented the “LIFE” program, also in 2012, to embed environmental factors into the company’s managerial processes.
7 Andrew Winston, “Luxury Brands Can No Longer Ignore Sustainability,” hbr.org, 8 Feb 2016, 2016 Harvard Business School Publishing, 2016, accessed ia https hbr.org l x r brands can no longerignore-sustainability.
8 r stina stafson, illennials redefine l x r and the sta es are high,” CNBC News, 18 February 2015, CNBC LLC, 2016, accessed via http .cnbc.com .
The luxury and cosmetics financial factbook 2016

Page 62 DCF and valuation parameters Page 62 Industry overview
Millennials and the luxury landscape Points of view from EY global sector and other industry professionalsI
The program is centered on key elements of environmental performance and developing new environmental management tools. When millennials can see that their interests are aligned with that of a brand, they are more inclined to make a purchase knowing that it originated from causes that matter to them.9
Introducing the brand through accessible price pointsDespite the fact that millennials have not yet reached their full earning capabilities, they are willing to spend freely what they can now, with a hopeful future of even higher spending. A proven successful method for labels to cater to this spending is to offer a wide range of products at varying price points. Iconic fashion ho ses o is itton and rberr ha e both seen success in marketing a wide range of products ranging in price from US$100 up to thousands of dollars.10 This pricing strategy can also be seen in lines of “mini-me” bags by labels, such as Céline, Mulberry, Chanel, Philip Lim, Chloé, Stella McCartney, Kate Spade and more. This fall, Hermès will feature a mini-me version of its iconic “Kelly” bag.
9 “Most Millennials Don’t Trust Big Luxury Brands and Brands are Taking Notice,” The Fashion Law: The Leading Source for Fashion Law and the Business of Fashion, 20 January 2016, The Fashion Law, 2016.
10 Gabrielle Rein, “Think Tank: Why Millennials Are the Future of Luxury,” Women’s Wear Daily, 25 April 2016 , Fairchild Publishing, LLC, a subsidiary of Penske Business Media, LLC, 2016.
Luxury brands believe that a millennial who loves buying a brand’s mini-me bags, makeup, perfume and accessories now will love buying the same brand’s full-sized handbags and shoes in the future. As such, these lower-priced offerings provide brands an opportunity to form a relationship between the brand and the millennial consumer, as opposed to a certain product and the consumer. Brands that have had success with this strategy have found the balance between offering items for younger shoppers that are expensive enough to maintain the brand’s allure without diluting the luxury perception of the brand, yet are still attainable given millennial consumers’ current price sensitivity.11
Providing a personalized experience through technologyTechnology is another key method of reaching consumers. Creating an interactive, and digital experience helps to align millennials desires for experiences with luxury brand shopping. Fashion designer Rebecca Minkoff has succeeded in building technology into the brand’s identity to attract consumers and encourage spending.12 The brand recently opened a new high-tech store in Manhattan that includes interactive mirrors and smart dressing rooms.
11 Lianna Brinded, “Luxury fashion houses are starting to crack the secret to attracting millennials,” Business Insider, 26 December 2016, CNBC LLC 2016.
12 Kristina Gustafson, “Rebecca Minkoff rewriting the rules of fashion,” CNBC News, 12 February 2016, CNBC LLC 2016.
These store features were incorporated into the brand’s omni-channel sales strategy, creating an experience in which the consumer could order from the website or tell a sales associate he or she would like another size of an item or experience with different potential lightings, all from the comfort of the dressing room. This forward-looking initiative contributed toward a 10% increase in sales of Minkoff’s Capsule collection to wholesalers this season.13 Celebrity endorsements, social media, technology and social responsibility initiatives are all important mediums through which luxury brands can reach and appeal to millennial consumers. In order to capture millennial market share, successful brands will have to innovate, grow and adapt with the technological and social media revolutions that are shaping our economic future.14
13 Ibid.14 Gabrielle Rein, “Think Tank: Why Millennials Are the Future of Luxury,”
Women’s Wear Daily, 25 April 2016 , Fairchild Publishing, LLC, a subsidiary of Penske Business Media, LLC, 2016.
The luxury and cosmetics financial factbook 2016

Page 63DCF and valuation parameters Industry overview Page 63
Chinese appetite for luxury goods and brands reshapes the luxury landscape
Points of view from EY global sector and other industry professionalsI
Indu
stry
ove
rvie
w
Amaury Bonnaire Executive Director, TASGeneva, Ernst & Young SA
The Middle KingdomAccounting for roughly one-third of the total tax-free p rchases in , hina as the first ax ree Shopper Nation” according to Global Blue, a global leader in tax-free sales.1 his fig re is e en more impressive when considering that Hong Kong scores 10th in the same ranking. However, Chinese consumers did not complete the most tax-free transactions (Russian consumers completed the most , hich means that hina is first in this ran ing not because it is the most populous country, but because Chinese consumers bought expensive items first and foremost, atches and e elr hard luxury goods), also according to Global Blue. As a matter of fact, the Fung Business Intelligence Centre values the yearly Chinese tax-free spending at US$200b in 2015 — a value that is expected to more than do ble in the next fi e ears.2
1 “Global Blue releases the Globe Shopper Report: China Edition,” lobal l e ebsite, accessed ia http corporate.globalbl e.com
press centre global bl e releases the globe shopper report chinaedition , pril , lobal l e, .
2 “Report: Outbound Chinese Traveler Spending to Hit $422 Billion,” Jing Daily, eptember , ing ail , accessed ia http ingdail .com report o tbo nd chinese tra eler spending to hitbillion . o om .
Interestingly enough, China is far from being the preferred country for domestic luxury purchases. Three main factors may explain this paradox: strengthened anti-corruption laws in Mainland China and Hong Kong, Chinese consumers’ willingness to live an authentic brand experience by buying luxury products locally, and last but not least, better prices else here d e to in ation in hina, foreign exchange rates and high taxes and custom duties in China (about 30% for imported watchmaking and 50% for cosmetics).As a result, Chinese consumers prefer to make luxury goods purchases while traveling abroad. When traveling in Europe, more than 81% of Chinese travelers will shop with a budget as high as €3,544. Chinese travelers represent a crucial opportunity for luxury retailers — especially since they typically only have a few holidays during which to travel. One of them is the “National Day” holiday week in early October. In 2015, with a weak yen and during this so-called “Golden Week,” around 400,000 Chinese tourists spent some US$830m in Japan.3 Being able to capitalize on those Chinese travelers represents a crucial issue for the European luxury industry.
3 “Tax Free Shopping in 2015: a year in review,” Global Blue website, accessed ia http corporate.globalbl e.com press centre tax freeshopping in a ear in re ie , an ar , lobal l e, 2016.
Fabian Denneborg Executive Director, TAS Zurich, Ernst & Young AG
The luxury and cosmetics financial factbook 2016

Page 64 DCF and valuation parameters Page 64 Industry overview
Chinese appetite for luxury goods and brands reshapes the luxury landscape
Points of view from EY global sector and other industry professionalsI
Persistent uncertainty in Greater ChinaGreater China4 used to be seen as the only safe haven for European luxury brands following the 2007–08 global economic crisis — but it is no longer true. In 2012, the Chinese Government implemented a new anti-gift policy. This measure was a major challenge for luxury companies: since then, the market conditions in Greater China have remained very challenging, and the current situation is not getting any better. Over the last few months, the demand for high-end products has been shrinking. In the watch industry, the mid-price point declined by almost 20% in the second half of 2015.5 Luxury companies are suffering from cutthroat competition, even more exacerbated by the availability of midrange brands. Meanwhile, China’s middle class is allocating more and more savings to house properties as a result of the Chinese Government’s credit easing policy.6
Amid contin ing concerns abo t hinese financial mar et efficienc and gross domestic prod ct growth, the Greater China contribution to global Swiss watch exports has consistently decreased, falling from 33% in 2010 to 25% in 2014.7 Furthermore, the underlying trend is not any different in Hong Kong, which used to be the gateway for foreign products in China.
4 Greater China refers to Mainland China, Hong Kong, Macau and Taiwan.5 UBS Research.6 Deutsche Securities.7 ac arie esearch.
The deceleration in consumption of luxury goods has been f rther amplified since amid protests against Mainland China. Anti-Mainland sentiment has negatively impacted tourism from China Mainland, while a strong Hong Kong dollar has faded out the demand for luxury goods in that city-state.8
New normal, new strategiesUnsurprisingly, luxury brands remain highly exposed to uncertainty in Greater China: for instance, Swatch and Richemont generated 34% and 24% of their 2015 revenue in this area, respectively.9 However, due to weaker sales than expected, most watch retailers are currently facing overstocks. Meanwhile, they continue to struggle with high rental costs.In response to the change in the Chinese economic environment, luxury companies are currently adapting their strategies to catch new opportunities. For example, Swatch decided not to increase its prices to keep the focus on market share and production utilization.10 Other companies, such as Hengdeli, the largest watch retailer in Greater China, took the option to extend their portfolios by launching new midrange brands.11
8 Ibid.9 S&P Capital IQ database.10 orningstar E it esearch.11 Deutsche Securities.
As for most luxury groups, watch companies are currently prioritizing reducing their stock levels in order to improve inventory rotation. They are also taking advantage of lower pressure on real estate prices to renegotiate rents. Meanwhile, they pursue online sales implementation as well as store rationalization throughout Greater China, with a special focus on Hong Kong.12 Moreover, luxury groups’ marketing strategies are changing as well: some of them, s ch as , ering and ichemont, are focusing their efforts on promoting the most promising recent brands in their portfolios. This enables them to drastically decrease marketing expenses by avoiding onerous traditional communication campaigns.13
Made in ChinaBut what if intensifying ad campaigns or reducing costs is not the solution to invigorate the Chinese luxury market? More and more investors are betting on local products to attract a wealthy Chinese clientele. Long dominated by Western stakeholders, the Chinese fashion world has recently seen the uprising of Chinese creators and designers, praising the several-thousand-years-old Chinese traditions in craftsmanship.
12 Ibid.13 “Les groupes de luxe changent de stratégies pour faire face à la crise
chinoise,” BQF Le magazine du Monde, 18 September 2015, Le Monde, , accessed ia http .lemonde.fr m mode b siness of
fashion article les gro pes de l xe changent destrategies po r faire face a la crise chinoise .html.
The luxury and cosmetics financial factbook 2016

Page 65DCF and valuation parameters Industry overview Page 65
Chinese appetite for luxury goods and brands reshapes the luxury landscape
Points of view from EY global sector and other industry professionalsI
Indu
stry
ove
rvie
w
These young entrepreneurs are convinced that they can get past the lo alit rep tation of made in China” products and appeal to the proud-to-be-Chinese sentiment of its customers — es, made in hina can be ni e, original and of
high alit . And it seems to be working: many Chinese consumers now want products made for the Chinese by the Chinese, and the success story of local brands, such as the cosmetic producer Herborist, the designer Mary Ching and the number one jeweler in market share in Greater China Chow Tai Fook, is convincing proof.However, European brands also want a slice of the gigantic cake that represents Chinese-made luxury products, and a number of companies have been successful in combining European branding with Chinese design and production. Hermès, for instance, founded Shang Xia, a craft designer that focuses on Chinese savoir faire, in 2007. Hermès owns 90% of the brand, which has even opened a shop in Paris in 2013.Also in 2013, Kering bought Qeelin to penetrate the Chinese luxury market. Qeelin asserts its Chinese identity, not only by using Chinese materials and craftspeople, but also through its iconic collection “Wulu,” which celebrates China’s cultural heritage. Shanghai Tang, another example of a successful association of European brand management with Chinese design and production, aims at rejuvenating Chinese fashion of the 1920s and 1930s; it is now part of the prestigious brand collection of Richemont, alongside artier, ontblanc and an leef rpels.
European luxury groups have shown a strong interest in Chinese companies. This relation also works the other way around and has not left the Swiss luxury sector — more precisely the Swiss watchmaking industry — unchanged.
Asian groups, new driver of the consolidation waves in the ownership of the Swiss watch brandsThe Swiss watchmaking industry — with 30 million watches shipped abroad in 2014 — was not left
nto ched in this fight for s premac in the l x r sector. ltho gh it seems at first glance fairl fragmented with more than 200 watch brands, the Swiss watchmaking industry has undergone a multifaceted consolidation process with few sizable independent players left in the market. Looking a little bit closer at the past two decades (see the graphic below), three different types of consolidation
a es rationales can be identified Consolidation and p li s leadin Swiss watch groups Starting in the mid s, the first consolidation wave hit the Swiss watchmaking industry when the two large watch groups Swatch and
ichemont began ac iring l x r atch manufacturers to complement their product offerings in different price segments and to benefit from scale effects. hese ac isition targets included manufacturers with strong brand value and brand heritage, such as Breguet and Glashütte (Swatch) and A. Lange & Söhne, IWC and Jaeger-LeCoultre (Richemont).
French luxury groups strategically increase their Swiss watch activities In the second consolidation wave starting in the early 2000s, two large French luxury groups entered the stage. With a diverse luxury product portfolio ranging from clothes to perfume and accessories, and ering expanded their prod ct offerings b ac iring iss atch manufacturers in the premium segment, including ag e er and blot b and
Girard-Perregaux and Ulysse Nardin by Kering. Asian ps in e a da le l y space After these two consolidation waves, the four luxury players mentioned above (Swatch,
ichemont, and ering ha e reached a certain level of saturation. The remaining independent players in the Swiss watchmaking market include sizable heritage brands in the premium luxury segment, such as Rolex, Patek Philippe, Audemars Piguet, Chopard, and Breitling, as well as smaller brands; many of which are active in the affordable luxury segment. While the sizeable heritage brands are strongly positioned with high brand value and critical mass, the smaller brands face challenges due to international competition and scale. Demand for affordable luxury products has increased in emerging countries in the Middle East and Asia mainl dri en b the high affinit for “Swiss-made” watches in the growing middle class.
The luxury and cosmetics financial factbook 2016

Page 66 DCF and valuation parameters Page 66 Industry overview
Chinese appetite for luxury goods and brands reshapes the luxury landscape
Points of view from EY global sector and other industry professionalsI
Strategic investors from these regions, therefore, increasingly look at Swiss watch brands in the affordable l x r segment as potential ac isition targets. The most prominent representative of this development is Citychamp Watch & Jewellery Group (formerly known as China Haidian), which started to build up a portfolio of Swiss watch brands by ac iring Eterna, re f ss, otar , odex and Corum. An additional prime representative of this development is the Japanese watch company Citizen,
hich has recentl anno nced the ac isition of the iss atch brand r d ri e onstant,
complementing its existing portfolio of the Swiss component manufacturers La Joux-Perret and Prototec as well as the Swiss watch brand Arnold & Son.Looking ahead, ac isitions of one of the fo r European luxury groups seems unlikely due to the fact that each has already built up a comprehensive portfolio of brands and the sheer size and indicative valuation of the remaining independent heritage brands. The continuation of the third wave of consolidation is more likely, where we will see the entry of additional Asian buyers that aim to leverage their distribution power in Asia with the ownership and sale of affordable luxury watches made in Switzerland.
1999 2000 2001 2002 2003 2004 2005 2006 2007 2008 2009 2010 2011 2012 2013 2014 2015 2016
Cit
izen
Cit
ycha
mp
Ker
ing
LVM
HR
iche
mon
tSw
atch
Wave 1Breguet
(CHF120m)
A. Lange & SöhneJaeger-LeCoultre
IWC(CHF3.1b)*
Glashütte OriginalUnion Glashütte
Wave 2
Tag Heuer(CFH1.2b)
Wave 3
Eterna(CHF26m)
Corum(CHF81m)
Dreyfuss & Co.Rotary
(CHF45m)***
Arnold & Son(CHF64m)****
Frédérique Constant
Hublot Bulgari(CHF4.8b)
Girard-PerregauxJEANRICHARD**
e e es an ac es l es annes ann pl s e ainin s a e ae e e l e** Together Sowind Group*** Together Dreyfuss Group**** Purchase price for Prothor Holding, which includes the watch brand Arnold & Son as well as component manufacturers La Joux-Perret and Prototec
Ulysse Nardin
Sources: EY research, Mergermarket.
The luxury and cosmetics financial factbook 2016

Page 67DCF and valuation parameters Industry overview Page 67
Store costs management: how to improve internal rate of return and enhance performance
Points of view from EY global sector and other industry professionalsI
Indu
stry
ove
rvie
w
Riccardo Pastore Director, Cost and Cash Optimization, TASMilan, EY S.p.A.
The internet and social media have created a new generation of constantly connected consumers, who are updated on global trends, sensitive to innovation and willing to share with the world their own shopping experience. Even the way we think about stores and what they should be (and generally retail business management) has changed. Eye-catching signs, furnishings that enhance products’ value perception and stunning showcases remain key success factors, but modern shops should also be able to interact with social media and with customers’ smartphones, proposing offers and personalized content, presenting innovative experiences and responding to the needs of both teenagers and older consumers — all this while remaining a friendly and enjoyable place to go.As a conse ence, the o erall cost of a store’s life cycle has greatly increased. New high-tech systems generate ne expendit res, re ire periodic maintenance and are subject to rapid obsolescence risks. At the same time, costs for furniture and renovations (which in the opening of a new store can account for more than 60% of the budget) have not decreased, putting companies on the spot to make a decision: increase the budget or just say no to certain changes?During the store concept definition phase, companies are so focused on the impact of communication and on the return on investment that the store may postpone ans ering this estion, identif ing onl in a later stage solutions that adhere to the budget while still realizing the spirit of the store.
General construction31%
Wooden Items20%
Shelves and furniture12%
Markup7%
Stones6%External windows and doors
5%
Electrical works5%
Demolition and strip out5%
Lift and stairs4%
Painting3%
Carpets1%
Other1%
Store cost breakdown: example
Each cost can be addressed, preserving quality and concept
The luxury and cosmetics financial factbook 2016

a e DCF and valuation parameters a e Industry overview
Store costs management: how to improve internal rate of return and enhance performance
Points of view from EY global sector and other industry professionalsI
In this phase, store redesign is a key factor, especially for those retailers that manage a large number of shops, as a redesign offers the opportunity to not only reduce the cost of the investment (CAPEX reduction), but also to improve overall process efficienc . E en in those areas here it is t picall hard to challenge the stylistic choices, such as the selection of materials and finishes, it is possible to adopt a process that allows the company to focus exclusively on what really provides value to its customers, avoiding wasting resources on non-core elements.What does it mean to reconceive the store? It certainly does not mean dramatically changing the store’s aesthetics and the guidelines that drove its design, but rather to help make sure that any money spent has an impact on the customer and, conse entl , increases store profitabilit , b reducing all costs that do not elicit a positive emotional response from the customer.
In line with this view, cost reduction strategies may include the following: • Electricity and lighting costs are reduced by focusing light beams where the most interesting products are going to be placed.
• Furniture, display cabinets and counters are no longer purchased as a bundle, but their structure is analyzed, broken down and optimized component by component ntil achie ing a f nctional, exible and inexpensive solution.
• Large plastic furnishings are broken down into smaller pieces to reduce the costs of the molds.
• Suppliers of ooring, tiles, stones and coatings are sought on a global scale.
• Catalogs and window stickers disappear in favor of tablets, large screens and online solutions.
All of these choices, though each of possibly minor importance, can sometimes make the difference between a successful investment plan and a project with low returns.The estion is h sho ld companies p rs e this approach? Any savings generated will free up resources that can be used for new advertising campaigns as ell as to finance ne comm nications on social media and, potentially, to support the opening of additional stores.Financial reso rces to s pport a ic store modernization and renovation plan can be found by looking at each single store cost component, taking into account the store life cycle phase and identifying minimally invasive solutions.
The luxury and cosmetics financial factbook 2016

a e DCF and valuation parameters Industry overview Page
Store costs management: how to improve internal rate of return and enhance performance
Points of view from EY global sector and other industry professionalsI
Indu
stry
ove
rvie
w
Store concept definition, concept ind striali ation, initial investment and operational “or running” maintenance, as a whole, depend on how well the store concept has been thought out. But how is it possible to stay true to the concept and initial creative ideas while adhering to the budget? Though it’s not possible to no the price per s are meter for each store, it’s certainly possible to make a series of technical and mar et anal ses to fig re o t hich steps the compan is going to ta e and hat benefits and issues will result.Once the store concept is defined, it’s time for ind striali ation, hich raises the estion hat are the small changes and choices that allow the retailer to switch from a “beautiful” (and potentially costly) prod ct to an efficientl doable prod ctCreativity often clashes with the corporate targets, and during the redesign-to-cost process, the budget sho ld firstl be allocated to preser e the creati e and distinctive elements of the concept, while for standard and less marketing sensitive items (which can account for more than 50% of the investment), simple and linear solutions should be sought, mainly based on functionality and in line with the overall look.
Concept definition
Concept industrialization
Store investments
Maintenance
Savi
ng o
ppor
tuni
ties
Store life cycle
Definition of a new concept at target cost
Challenging of c ncep specifica i nsto achieve target cost
Cost managementwithout design
difica i ns
Maintenance running
costs management
Technical levers Commercial and process levers
The luxury and cosmetics financial factbook 2016

a e DCF and valuation parameters a e Industry overview
Store costs management: how to improve internal rate of return and enhance performance
Points of view from EY global sector and other industry professionalsI
Store cost management does not end with concept ind striali ation efficienc opport nities can be achieved through the so-called ”learning economies”: those processes that allow retailers, while developing a project, to learn from previous mistakes, eliminate
aste and increase reali ation efficienc . n o r experience, an efficienc reco er of p to is deemed feasible. Rethinking the store concept before a ne a e of openings reno ations is still possible, but it’s better to remember that other elements, such as planning, consolidation of purchasing volumes, choice of the best partner and cost-controlling acti ities, can ha e e all significant effects. Structured contractual agreements, adoptable on a large scale (e.g., builders, dry wall experts, electricians and main contractors) can help companies a oid o err ns. efining p rchasing frameworks, both for furnishings and finishes, for multiple stores from the beginning allows a company to get better pricing, and selecting national and or international partners helps ens re high alit standards at competitive prices.
“Store running cost“ is also an important consideration. Maintenance, cleaning, anti-theft systems and IT services can be centrally managed, helping provide the same level of service to all customers, reducing costs, by more than 10% in our experience, and streamlining business processes by rationalizing the number of counterparts daily managed.
Exhibitors, promotional materials, shopping bags, manne ins and hangers can be redesigned thro gh a process easier than the one undertaken for the stores, but their redesign will likewise be able to decrease costs by up to 20%, without renouncing the concept of the store and while satisfying marketing needs and goals.In conclusion, a fundamental aspect of making the redesign-to-cost process happen and be effective is the active collaboration between designers,
Technical
Tota
l cos
t(s
um o
f sev
eral
act
iviti
es)
Levers Examples of actions
Process
Purchasing
Financial
pecifica i n requirements
Purchasing organization audit
Bargaining power
Direct costs
Redesign to cost (RTC)
Validation optimization
Rate benchmark
Hidden costsAdvising and design
Database management
Printing
Delivery
Pre-printing
ea e s and brochures Catalogs
Displays andpoint of purchase (POP)
Window stickers
Shopping bags Packaging
mar eting, p rchasing and technical offices. n fact, it is only if each actor involved is available to ”get involved in the game’’ that real business needs and market opportunities will be highlighted, boosting a virtuous circle that encourages co-design with trusted partners and a 360-degree analysis of investments (considering both initial costs as well as incidental or recurring ones), respecting marketing guidelines and taking advantage of all communication and technical market solutions.
The luxury and cosmetics financial factbook 2016
a e DCF and valuation parameters Industry overview Page
A new challenge for luxury: retail through online marketplacesPoints of view from EY global sector and other industry professionalsI
Indu
stry
ove
rvie
w
Marie-Pierre Bonnet-DesplanExecutive director, TaxParis, Ernst & Young Société d’Avocats
Most luxury goods are sold online but sometimes under conditions that are not approved by their brands. Under European Union (EU) competition laws, manufacturers and luxury brands are prohibited from banning a distribution channel — in this case the internet — since the European and national competition authorities consider that it plays a key role in terms of fair competition and delivering goods at a lower price to consumers. Therefore, driven both by distribution practices and competition rules, luxury brands are essentially hoping to regulate the practices of retailers that sell their products online. But these online practices are subject to continuous changes as well as the legal rules issued by competition authorities. The rules recently put in place already appear to be outdated. Today, there are four different types of online sites that offer l x r goods for sale the first three are (i) brands’ own websites, which were initially used as showcases, but are now more often sales oriented; (ii) sites of “pure players” retailers, wherein the sale activity is fully digitalized, without involving any physical point of sale; and (iii) authorized retailers
ho ha e a ph sical point of sale of ine and ho have also developed their own online sites (i.e., click-and-mortar companies). For the “pure players” and “click-and-mortar” types of distribution websites, l x r brands are st beginning to establish specific
alitati e criteria for online sales. The fourth online site type — new entrants in the online business that is developing today and may become its most powerful participant — are online marketplaces.
An online marketplace is a website that sells products that it has bought but also broadcasts offers for other retailers or merchants, i.e., they do not buy products for resale but instead sell products on behalf of other merchants. These online marketplace websites often go as far as collecting the payment on the retailer’s or merchant’s behalf, and so consumers cannot clearly identify from whom they are buying the product. How is the development and growth of these marketplaces likely to impact distribution in the luxury segment?Until recently, brands were barely concerned with the websites developed by their retailers initially authorized to sell their products in their physical stores. The websites of the major authorized retailers, which have a strong reputation and therefore a strong potential audience (especially the
ebsites of leading stores , are generall high alit . Their internet policy is similar to their in-store policy and typically in compliance with a brand’s image and policies. This compliance, however, is not always the case for the websites of smaller authorized retailers. But until to now, the websites of these smaller retailers had a limited distribution; hence, even if the smaller retailer’s distribution policy was not really of good alit or consistent ith the polic of the brand, there was no real danger for the brand since the site was not widely published.
The luxury and cosmetics financial factbook 2016

Page 72 DCF and valuation parameters Page 72 Industry overview
A new challenge for luxury: retail through online marketplacesPoints of view from EY global sector and other industry professionalsI
But these rules are changing with the growth of online marketplaces. By hosting offers among this multitude of small websites, marketplaces provide luxury goods with a much wider distribution range. If brands wish to have more control over the sale of their goods, assuring compliance with their image and policies, what should they do? Some brands have tried to ban their authorized dealers from hosting their goods on a marketplace. Indeed, EU competition g idelines incl de a cla se, ite obsc re, that might validate such a restriction.But is this position sustainable? Recent legal developments suggest not. In Germany and France, the competition laws explain that opening up the internet to smaller retailers is an unrealistic way to foster competition if they cannot reach a wider audience by hosting their offers on a marketplace. Adidas has recently been instructed, in Germany,1 to allow its authorized retailers to offer its products on marketplaces. Following this instruction, Adidas’ French subsidiary has also committed to doing the same.2 Brand competitor Asics has similarly been instructed.3
1 Press release of the Bundeskartellamt, “Adidas abandons ban on sales via online market places,” 2 July 2014.
2 Press release of the French Competition Authority, 18 November 2015.3 Press release of the Bundeskartellamt, “Bundeskartellamt takes a critical
view of restriction online distribution by Asics,” 28 April 2014; decision of the Bundeskartellamt, 26 August 2015.
Even if these brands do not exactly belong to the luxury segment, they fall under this same legal regime — selective distribution. Cosmetic brand Caudalie has not been able to obtain an injunction from the Court of Appeal of Paris to ban the sales of its products through authorized drugstores selling its products on a marketplace specializing in this area.4 Conversely, the backpack brand Deuter has won its case before a German court.5 The French Authority has launched an analysis on this subject and conclusions are expected soon. Thus, the situation is
ite ag e, and l x r brands are dealing ith a legal uncertainty, which is not business as usual.
larification could be expected soon at least in Europe for a cosmetic brand considered to belong to the luxury sector. The Frankfurt court has put for ard a series of fo r estions to the o rt of Justice of the EU, as this subject is governed by European law.6 Put simply: is it legitimate, vis-à-vis European competition rules, to prohibit the members of a selective distribution network from involving a third party (i.e., marketplace) in the product sales process?
4 aris o rt of ppeal, e o a ant c a dalie, ebr ar .5 Supreme Regional Court of Frankfurt, Deuter Sport Backpack, 22 December
2015.6 Frankfurt Court of Appeal, 19 April 2016.
If the court decides that distribution via marketplaces cannot be banned on principle, brands will need to strike a balance: not by prohibiting sales but by regulating them. Hosting on a platform should be prohibited only if the platform does not comply with a brand’s alitati e criteria. hat is to sa that onl a platform that is not suitable given its activity, operation, and product environment, will be prohibited from distributing luxury goods. These
alitati e criteria sho ld be defined b l x r brands, and a strategy should be built around them.Luxury brands may choose to wait or prepare, but another development looms on the horizon: the geo-restriction of websites*... an even more complex subject.
* Websites are prevented from deli ering the goods o t of a specified territor .
The luxury and cosmetics financial factbook 2016

Page 73DCF and valuation parameters Industry overview Page 73
The beauty market: where to invest?Points of view from EY global sector and other industry professionalsI
Indu
stry
ove
rvie
w
Blasco De FeliceBeauty top executive
The beauty market is proving to be very attractive for most of its players — beauty companies, retailers, start-ups and investment funds — with its track record of high single-digit growth (from +6% to +8%) in the early 2000s and low single-digit growth (around +4%) after the global financial crisis, despite widespread economic tensions.The a erage profitabilit of the top pla ers in this rich and profitable mar et is aro nd E , and the best performers top , despite ma ing significant investments in distribution, business drivers and o erhead. his profitabilit enables most pla ers to deploy investments to develop their business in research and innovation, advertising and marketing, distribution and retail operations.The beauty market is also incredibly dynamic, with innovation representing up to one-third of yearly revenues. For the players in this market, this is a double-edged sword: the most innovative companies thrive, while the laggards are destined to decline. In addition to the more mature and competitive mainstream segments of the beauty market, many niche segments are growing at a double-digit pace and face less fierce competition. hese niches represent a strong investment opportunity for beauty companies, retailers, start-ups and investment funds alike. Some of the hot opportunities of the beauty market (see graphic) are discussed further below.
Retail beauty brands
Digital beauty service
Retail beauty services
Open innovation
Bio beauty brands
pecific a e ands
Ethnic beauty brands
E-commerce beauty platform
+4% Growth
18% EBITDA
Digital beauty brands
Bea
uty
mar
kets
The luxury and cosmetics financial factbook 2016

Page 74 DCF and valuation parameters Page 74 Industry overview
The beauty market: where to invest?Points of view from EY global sector and other industry professionalsI
Digital native beauty brands with a big ideaDigital native brands have all the trends in their favor: the consumer shift toward the internet, the expansion of social networks, the development of the vloggers’ community, the explosion of e-commerce, and the resistance of traditional brands to changing their business models. For example, NYX Cosmetics,
hich as recentl ac ired b ’ r al, became a big brand in the US by simply leveraging a community of YouTube creators. Sigma Beauty, another digital native, sells its makeup brushes and accessories thro gh an affiliation program here bea t vloggers receive a commission on every product that is sold after viewing one of their videos.
Digital platforms, innovative business models Of co rse, there are big fish in the digital bea t market too, namely Amazon and Sephora. Amazon is on track to becoming the online beauty generalist retailer, with its amazing offers, competitive prices and outstanding logistics. Meanwhile, Sephora is establishing itself as the digital genius among beauty retailers, by mastering social networks, in-store digital services and e-commerce.
But there are many segments that escape even the li es of ma on and ephora, lea ing the field open to innovative e-commerce retailers, particularly in the luxury, pharmacy and professional segments. Some e-commerce retailers are specializing in certain product categories, such as cosmetics (e.g., Beautylish) and perfume (e.g., The Perfume Shop), plus new e-commerce models are appearing, not unlike what is happening in the fashion industry with e-commerce sites Farfetch and Lyst.
Innovation labs and subcontractors Innovation in beauty is absolutely critical, yet not all companies can afford to pay an army of researchers or for sophisticated laboratories and all the product development costs. The same is true for manufacturing, which is both capital and people intensive.Even the large bea t companies sometimes find it more convenient to outsource part of their innovation seeking and manufacturing to achieve speed to mar et and exibilit . his trend to ard open innovation” and subcontracting is stimulating the development of smaller, more focused and more
exible companies that complement traditional beauty companies as well as start-ups.
Many of these smaller companies are located in orthern tal , here a specific sa oir faire exists.
Others are located in Latin America, where local specificities, economic instabilit and import d ties make such innovation and subcontracting strategies indispensable. Other such small companies are in Asia, where the cost of production is generally lower.
Digital beauty services The future is here for digital beauty services. Consumers access these services via laptops and desktops, at home and in the street, on e-commerce sites and in brick-and-mortar stores. Users may discover new products, try a hair color, locate a beauty professional (e.g., Uala in Italy and Style Seat in the US — both online platforms to locate and reserve a stylist), receive recommendations or simply make a purchase — all online. Consumers may also try virtual makeup application, which enables them to virtually try a brand’s products and colors on their face, with a very realistic and dynamic result.
The luxury and cosmetics financial factbook 2016

Page 75DCF and valuation parameters Industry overview Page 75
The beauty market: where to invest?Points of view from EY global sector and other industry professionalsI
Indu
stry
ove
rvie
w
Another factor they can leverage is to sell products in shops that are “men friendly,” rather than just in traditional perfumeries, supermarkets and department stores. And of course, using the internet as a marketing and commercial vehicle to reach men consumers will also make a major difference.
Investment opportunitiesThe large beauty companies are aggressively pursuing investment opportunities through a massive ac isition campaign. ost of them are foc sed on the “small beauty pearls,” which are brands that have something special in their DNA, their business model and or their mar eting model. arge bea t companies ac ire these pearls at a significant multiple of their EBITDA, yet they have a business plan that leverages their large R&D, marketing and commercial organizations to achieve spectacular growth.
Here is a short list of the small beauty pearls that the large bea t companies ha e ac ired o er the last few years: • Est e a der recentl ac ired se en bea t pearls: Le Labo, Rodin Olio Lusso, Editions de Parfum Frédéric Malle, Glamglow, Dr. Jart, Do The Right Thing, and Have & Be Co.
• ’ r al ac ired eight bea t pearls Essie, Clarisonic, Urban Decay, Décleor, Carita, NYX Cosmetics, Niely, and Carol’s Daughter.
• nile er ac ired fi e bea t pearls in the s in care category: Ioma, Ren Skincare, Kate Somerville, Dermologica and Murad.
• ig ac ired t o pearls in the fragrances category: Penhaligon’s and L’Artisan Parfumeur.
• ot ac ired a pac age of brands from and the portfolio of the Brazilian company Hypermarcas, among which several beauty pearls are included.
As the large beauty companies are mostly focused on ac iring and de eloping brands, the are sta ing away from other parts of the industry, i.e., services, retail and s bcontractors, hich lea es significant space for other players, such as investment funds, retailers and start-ups, to get in the game. The beauty market is attractive, growing and multifaceted, and any player with a precise business idea and outstanding execution can succeed and achieve considerable returns.
The luxury and cosmetics financial factbook 2016

Page 76 DCF and valuation parameters
The luxury and cosmetics financial factbook 2016

Page 77DCF and valuation parameters
Indu
stry
ove
rvie
w
The luxury and cosmetics financial factbook 2016

Methodology

Approach and SOTP analyses
Sample selection
Focus on Jimmy Choo
Met
hodo
logy
The luxury and cosmetics financial factbook 2016
Approach and SOTP analyses
Sample selection
Focus on YOOX Net–A–Porter

Methodologya e
The entirety of the data utilized in this factbook is publicly disclosed information. The Transaction Advisory Services (TAS) teams of EY who participated in developing this doc ment ha e not had access to an confidential information.
If the information used is found out to be incomplete or incorrect, EY will not be held responsible for any impact this may have on the results or the analyses presented in this document.
It must be noted that the information provided in this study is based on the latest available financial statements of each compan as at arch . ar et data has been considered as of arch , nless stated other ise or apart from s bse ent pieces of information incl ded in this s r e . n modification of the anal ed gro p’s financial performances or an e ol tion of the financial mar ets that occ rred since arch 2016 could lead to partially or completely different conclusions.
lease note that e ha e presented the act al fig res for the companies, hich have already released their 2015 annual results as of 31 March 2016.
or the companies that ha e di ersified acti ities , ering, ’ r al , e performed a SOTP analysis to isolate the pure luxury segment and to better understand its characteristics as well as its contribution to the companies’ performance.
This analysis was not possible for Swatch, Beiersdorf and Shiseido as no accurate data was available.
SOTP analyses
Approachhere are man criteria b hich to anal e the operating and financial performances of listed companies. he aim of this s r e is not to cond ct a
detailed analysis of the selected companies. The approach implemented in this sixth edition of The luxury and cosmetics financial factbook essentially relies on three types of information: • Several standard valuation parameters and operating aggregates • Industry characteristics (in terms of growth forecasts and drivers) • An overview of 30 major players of the industry
Even though this data is important and essential to the analysis, it must be stressed that other criteria or parameters could also have been analyzed.
Approach and SOTP analyses
The luxury and cosmetics financial factbook 2016

Methodology a e
Met
hodo
logy
The sample analyzed is composed of 30 listed companies from the luxury and cosmetics industry, of which 23 are mostly in the luxury business and 7 are in the cosmetics segment.
To select these companies we proceeded as follows:
• We firstl identified p re pla ers of the l x r sector r nello cinelli .p. . (Cucinelli), Burberry Group (Burberry), Coach Inc. (Coach), Chow Tai Fook Jewellery Group Ltd (Chow Tai Fook), Hengdeli Holdings Limited (Hengdeli), Hermès International S.C.A. (Hermès), Hugo Boss AG (Hugo Boss), Jimmy Choo PLC (Jimmy Choo), Kering
ering , oet enness o is itton . . , ichael ors oldings td (Michael Kors), Moncler S.p.A. (Moncler), Prada S.p.A. (Prada), Polo Ralph Lauren Corp. (Ralph Lauren), Compagnie Financière Richemont S.A. (Richemont), Salvatore Ferragamo S.p.A. (Salvatore Ferragamo), Swatch Group AG (Swatch), Tiffany & Co. (Tiffany), Tod’s S.p.A. (Tod’s), and Tumi Holdings Inc. (Tumi).
• We completed this first list ith other pla ers in cosmetics eiersdorf eiersdorf , Coty Inc. (Coty), Estée Lauder Companies Inc. (Estée Lauder), L’Occitane International S.A. (L’Occitane), L’Oréal S.A. (L’Oréal), and Shiseido Co. Ltd (Shiseido).
• We also added companies that are in direct relation with luxury companies, such as xottica ro p .p. . xottica and afilo ro p .p. . afilo .
• Finally, we decided to include a company that is not part of the luxury environment, but acts as the largest cosmetics company from the emerging markets, Natura Cosméticos S.A. (Natura), to enlarge the geographical coverage.
Sample selectionPlease note that the sample has been adjusted in this sixth edition. Actually, one company was added: YOOX Net–A–Porter Group S.p.A., as the two companies YOOX Group and Net–A–Porter have recently merged, creating the leading online luxury fashion retailer. YNAP was listed on the Milan Stock Exchange in October 2015.
Sample selection
The luxury and cosmetics financial factbook 2016

Methodologya e
Focus on YOOX Net–A–Porter YOOX Net–A–Porter: overview
We included YNAP in the sample as shares of the merged entity started trading on the Milan Stock Exchange on 5 October 2015.
ey ac s
• Founded in 1999 by Federico Marchetti, YOOX is an e–commerce company and an internet retailing partner for fashion and luxury brands. The company opened its first online door oox.com in , follo ed b thecorner.com, shoescribe.com and numerous monobrand online stores. The group delivers to more than 100 countries worldwide and as of 3 December 2009, YOOX was listed in the Milan Stock Exchange.
• Net–A–Porter was established in 2000 in the UK by Natalie Massenet. The company is an online luxury retailer, and it operates through three main brands: net–a–porter.com, theoutnet.com and mrporter.com. In 2015, Net–A–Porter delivered in 170 countries, offering more than 650 of the world’s leading luxury products.
• In 2015, the merger between YOOX Group and Net–A–Porter created the world’s leading online fashion retailer (YNAP Group). The newly formed group has 2.2m active consumers and 6m orders (FY14 data).
• The Y ro p operates in three b sinesses i online agship stores, ii multi–brand in–season and (iii) multi–brand off–season.
• Total offered shares: 24.3m (out of which 6.2m are newly issued shares), plus 3.6m of shares for the greenshoe option. Post IPO shares (excluding greenshoe)
ere . m. he final offer price as . per share for a mar et capitali ation of €209m.
YNAP Group
• The new entity YNAP started trading on 5 October 2015 at €29.95, representing a market capitalization of €3.6b.
a e adin pa e n since c e
Source: Capital IQ. Note: 5 October 2015 = 100.
Source: Capital IQ. ote financial fig res are at ecember.
Key financials (in €m) FY14A FY15A FY16E FY17E FY18E
CAGR FY16E–FY18E
SalesEBITDAEBITDA marginEBITEBIT margin
e p fiCAPEX ratio
60
70
80
90
100
110
120
130
October–15 November–15 December–15 January–16 February–16 March–16
YOOX Net-A-Porter Group FTSE MIB
The luxury and cosmetics financial factbook 2016

LUXURY AND COSMETICS THE EY FINANCIAL FACTBOOK 2014
OPENING
TITLESub title or First paragraph
SAM
PLE SELECTION
A
ND
SPECIFIC AN
ALYSES
EXECUTIV
E SUM
MA
RY
DCF A
ND
VALU
ATIO
N PA
-R
AM
ETERS
IND
USTRY
OVERV
IEW
METH
OD
OLO
GY
AN
D D
ISCLAIM
ER
GLO
SSARY
EY
EXP
ERTS
We have seen many luxury houses respond to the challenges of the new kind of customer by slowly developing a digital strategy. This is not just a web presence to manage brand content and deal with online sales. It is an integrated approach that harnesses social media, and connects mobile and tablet applications ith bac office logistics to deliver a viable e-channel. The channel can provide an alternative to retail and wholesale, or complement the more traditional routes to market.
1. Sustaining development: maintaining the quality and supply of crucial raw materials, such as increasingly rare skins and ethically traceable gems, is a big challenge for some houses. It has led to an increase in vertical acquisitions in the supply chain. For example, crocodile farms in Australia and African ostrich ranches have been on the acquisition menu of larger luxury groups. But the challenge is not just to secure supply. The focus is on sustainable development in all its forms. It is important to consider the ethics behind the products and images of luxury; the perceived and actual wastage in production processes and packaging; and the carbon footprint and water impact of the end product.
Global luxury goods market A
Global cosmetic goods marketB
Global luxury goods market C
Focus on Brunello Cucinelli and Michael KorsD
• Sustainable luxury
• China — can Western luxury tame the Red Dragon’s desire?
• Focus on the American market
• Focus on the Italian market
• Counterfeit issues facing the industry
• Focus on marketing and advertising in the luxury industry
• Focus on licensing in the luxury industry
• Focus on digital in the luxury industry
Sample selection
and specific analyses Executive sum
mary
DCF and valuation
parameters
Industry overview
Methodology
and disclaimer
Glossary
Contact us
CAGR: compound annual growth rate
CAPEX: capital expenditure
DCF: disco nted cash o
EBIT: earnings before interest and taxes
EBITDA: earnings before interest, taxes, depreciation and amortization
EV: enterprise value
FY: financial ear
GAAP: Generally accepted accounting principles
GDP: gross domestic product
LTGR: long-term growth rate
M&A: mergers and ac isitions
SOTP: sum of the parts
WACC: weighted average cost of capital
YOY: year-on-year
Glossary
Glo
ssar
y –
Cont
act u
s
Glossary a e
YOOX Net–A–Porter: overview
The luxury and cosmetics financial factbook 2016

a e Opening
Executive summaryWelcome to the third edition of EY’s annual Financial Factbook for the luxury and cosmetics sector. The Factbook combines financial data, insight from EY’s global team of sector specialists and opinions of external experts.
Laurent Bludzien
Full Name
Contact us p as i n y ea
Roberto BonacinaPartner, Lead Advisory M&A, Fashion & LuxuryMilan, EY S.p.A. [email protected]+39 335 138 1950
Rossana PezoneManager, Transaction Support, Fashion & Luxury Milan, EY [email protected]+39 366 578 7631
n i s e ac
Paolo Lobetti BodoniMED RCP Advisory Leader, AdvisoryTurin, Ernst & Young Financial Business Advisors S.p.A.paolo.lobetti–[email protected]+39 335 760 0436
Amaury BonnaireExecutive Director, TASGeneva, Ernst & Young [email protected]+41 58 286 5517
Ivan ChanPartner, TaxHong Kong, Ernst & Young Tax Services [email protected]+852 26293828
Benjamin MsikaSenior Manager, TASParis, Ernst & Young [email protected]+33 1 55 61 02 25
Fabian DenneborgExecutive Director, TAS Zurich, Ernst & Young [email protected]+41 58 286 3335
Riccardo PastoreDirector, Cost and Cash Optimization, TASMilan, EY S.p.A. [email protected]+39 02 8066 93794
John NguyenSenior Manager, AuditDallas, Ernst & Young LLP United [email protected]+1 214 7543499
Arnaud CohenPartner, TASParis, Ernst & Young [email protected]+33 1 55 61 07 10
Kelsea E WestSenior, TASDallas, Ernst & Young LLP United [email protected]+1 214 9698487
Lilly L CheungSenior Manager, Tax Shanghai, Ernst & Young Certified Tax Agency Co. [email protected]+86 21 22285506
Marie-Pierre Bonnet-DesplanExecutive director, TaxParis, Ernst & Young Société d’[email protected]+33 1 55 61 13 11
Contact usa e
Blasco De FeliceBeauty top [email protected]+39 344 136245
The luxury and cosmetics financial factbook 2016
Francesco GradoneSenior, TAS, Fashion & LuxuryMilan, EY [email protected]+39 366 402 1242

The luxury and cosmetics financial factbook 2016

EY | Assurance | Tax | Transactions | Advisory
About EY
EY is a global leader in assurance, tax, transaction and advisory services. The insights and quality services we deliver help build trust and confidence in the capital markets and in economies the world over. We develop outstanding leaders who team to deliver on our promises to all of our stakeholders. In so doing, we play a critical role in building a better working world for our people, for our clients and for our communities.
EY refers to the global organization, and may refer to one or more, of the member firms of Ernst & Young Global Limited, each of which is a separate legal entity. Ernst & Young Global Limited, a UK company limited by guarantee, does not provide services to clients. For more information about our organization, please visit ey.com.
How EY Global Consumer Products Sector can help your business
Consumer products companies are operating in a brand–new order, a challenging environment of spiraling complexity and unprecedented change. Demand is shifting to rapid–growth markets, costs are rising, consumer behavior and expectations are evolving, and stakeholders are becoming more demanding. To succeed, companies now need to be leaner and more agile, with a relentless focus on execution. Our Global Consumer Products Sector enables our worldwide network of more than 17,500 sector–focused assurance, tax, transaction and advisory professionals to share powerful insights and deep sector knowledge with businesses like yours. This intelligence, combined with our technical experience, can assist you in making more informed, strategic choices and help you execute better and faster.
© 2016 EYGM Limited. All Rights Reserved.
EYG no: 02904‑164GBL ED None
This material has been prepared for general informational purposes only and is not intended to be relied upon as accounting, tax, or other professional advice. Please refer to your advisors for specific advice.
The views of third parties set out in this publication are not necessarily the views of the global EY organization or its member firms. Moreover, they should be seen in the context of the time they were made.