keeping your oracle database healthy using the new 12c ... · this oracle 12c autonomic performance...
TRANSCRIPT

1
KeepingYourOracleDatabaseHealthyUsingtheNew12cDiagnosticandPerformanceFrameworkMark V. Scardina Oracle Corporation Redwood Shores, CA USA Keywords: Database RAC QoS Management Manageability Diagnostics Performance ORAchk Tools Introduction Oracle over the years has released a collection of tools and features that assist DBAs and cluster administrators in keeping their databases performing and diagnosing and triaging issues when problems arise. These tools, such as Cluster Verification Utility, ORAchk, Cluster Health Monitor, Trace File Analyzer, etc., suffer from a significant issue in maintaining database availability and performance.
Figure 1: The #1 Issue with Oracle’s Tools
That issue is simply the time it takes for admins to react to the issue, determine the appropriate diagnostic tool, run it and try and triage the issue from its output and then based upon their experience determine a corrective action. They may be fortunate to resolve this in under an hour but can easily see it extend to hours or days if Oracle Support Services is required. With the introduction of Oracle 12c Grid Infrastructure and Database these tools have been both expanded and enhanced to run in daemon mode, intercommunicate to share data, and autonomously provide either early warning or take action to prevent loss of availability or performance.

2
Figure 2: Oracle 12c Autonomic Performance & Diagnostic Framework
This Oracle 12c Autonomic Performance and Diagnostic Framework is the foundation of the effort to recognize the need for continuous availability and proactive intervention at the earliest indication of performance or availability issues before they escalate into impacting business processes or clients.
Oracle12c Grid Infrastructure Management Repository
At the hub of this framework is an Oracle database known as the Grid Infrastructure Management Repository. It was introduced as an infrastructure database for diagnostic data in Oracle 12cR1 in order to relieve local file systems of the growing amount of data being logged as more and more databases are consolidated onto individual nodes.
Figure 3: GIMR CDB plus Cluster PDB

3
This database is designed to be self-managing and require no monitoring by an Enterprise Manager agent. It is currently a single instance that can run on any node in the cluster and will automatically failover if its instance or current node fails. It is installed and enabled by default in 12.1.0.2 and is configured as a Container Database (CDB with a Single Pluggable Database (PDB) as in Figure 3. The CDB is specified with a fixed DB Name: _MGMTDB and an SID: -MGMTDB that will prevent collisions with existing database names due to the inclusion of an illegal character. The GIMR has its own cluster resource, ora.mgmtdb as well as a dedicated listener, ora.mgmtlsnr, both of which are controlled with srvctl commands as the Grid User. The GIMR is updated and patched automatically with the Grid Infrastructure PSUs as it resides in the GI Home. Finally, while there is no operational need to directly access the GIMR via SQLPlus or RMAN, the cluster admin may locally access it through OS authentication.
Diagnostic: Oracle12c Cluster Verification Utility (CVU)
Oracle users experience Cluster Verification Utility (CVU) during the installation of the Grid Infrastructure software. CVU performs the prerequisite checks to ensure the software environment is correctly configured to successfully install an Oracle cluster. Beginning in Oracle 12c, CVU also runs automatically every 6 hours with a healthcheck option to ensure the environment remains in compliance and has implemented best practices.
Figure 4: CVU Healthcheck Report
The output of each run is nicely formatted in HTML (Figure 4) to be able to quickly evaluate the current status and compare against previous reports should an issue be found. This is especially useful if multiple admins are responsible for the cluster and the Oracle stack.

4
Diagnostic: Oracle12c ORAchk
ORAchk (aka EXAchk) has been available from My Oracle Support (MOS) for years and has evolved to not only check compliance and best practices of the entire Oracle stack, but to proactively scan for known issues and available fixes as well as score the health of the cluster to easily identify and drill down on issues that need to be addressed before they threaten availability or performance. New in 12c, ORAchk is included in the Grid Infrastructure installation and now supports a daemon mode that will send email notifications when a diff between checks is detected. This again provides early warning to admins. To keep the cluster up to date, ORAchk is updated and released quarterly as well and is downloadable from My Oracle Support (MOS).
Figure 5: ORAchk Collection Manager
Also new in 12c is ORAchk Collection Manager which installs as an Apex application in an Oracle database of your choosing and supports uploading all reports from a collection of monitored clusters and databases. This provides a convenient dashboard (Figure 5) that displays the health scores and links for easy observation and if necessary action.
Diagnostic: Oracle12c Cluster Health Monitor (CHM)
Even if the cluster is fully compliant and has best practices implemented, it may become at risk due to issues related to load on the hardware resources such as CPU, memory and I/O. In Oracle 12c, Cluster Health Monitor (CHM) runs on each node (Figure 6) collecting O/S system and process metrics to aid diagnosis of issues as well as provide a data stream for other parts of the framework.

5
Figure 6: Cluster Health Monitor Architecture
CHM is enabled by default and runs in real time with locked-down memory to ensure that the data will be collected up until the last moment prior to a node failure or reboot. CHM takes the place of OSWatcher which, due its requirement to invoke processes, was not able to capture this critical data. Because CHM stores its data in the GIMR with default retention of 72 hours, it is available for review locally on the cluster with the OCLUMON commandline utility (Figure 7).
Figure 7: OCLUMON commandline output
This data is also available in real time or historically from Enterprise Manager Cloud Control from its cluster target page. Cluster-wide views of CPU, Memory and I/O metrics (Figure 8) provide a convenient ability to understand the current or previous state of the cluster.
Figure 8: Cluster Health Monitor EM Cloud Control Historical View

6
Diagnostic: Oracle12c Cluster Health Advisor (CHA)
COMING: Cluster Health Advisor (CHA) will support autonomic diagnosis presenting early warnings and targeted corrective actions for cluster and database problems.
Diagnostic: Oracle12c Trace File Analyzer (TFA)
An Oracle cluster and database deployment can have literally hundreds of log and trace files especially as one consolidates many databases or database homes in a single cluster. This can result in difficulty diagnosing or triaging an issue and if necessary ensuring the appropriate files are packaged and uploaded to Oracle Support Services. Oracle 12c Trace File Analyzer (TFA) was developed to address these areas. Deployed and enabled by default in Oracle 12c, TFA runs periodically gathering all log and trace files, consolidating, de-duplicating and packaging them in a form that can be easily queried through the supplied tfactl utility as well as packaged per incident for uploading to Oracle support. It can also be run interactively with the tfactl diagcollect command (Figure 9).
Figure 9: TFACTL diagcollect command to consolidate logs and traces
For DBA and cluster administrators, TFA provides a built-in analyze function that supports a wide range of queries against the diagnostic archive. For example, one can query for issues over a specified time period and received a report as in Figure 10.

7
Figure 10: TFACTL Analyze command
Performance: Oracle12c Quality of Service Management
Oracle Database Quality of Service Management was introduced in Oracle Database 11gR2 to support monitoring and managing RAC database workloads to meet SLAs. As individual servers become more powerful based upon hosting more CPU cores and memory, consolidated and Database-as-a-Service (DBaaS) deployments are becoming common place. This results in the need to have a workload-centric view of the entire cluster, real-time performance alerts, and just-in-time resource management as exemplified in Figure 11.
Figure 11: Oracle 12c RAC Databases – The New Reality

8
QoS Management provides a KPI cluster-wide dashboard along with a workload classification framework to rank workloads based upon business criticality and set their performance objectives on a policy basis. This policy is then used for autonomic resource management to trade-off resources between competing workloads to maintain SLAs. There are three modes to a QoS Management deployment – Measurement, Monitor, and Management.
Figure 12: QoS Management Dashboard - Measurement Mode
The Measurement Mode provides detailed insight into the performance of the consolidated workloads in real time displaying their performance breakdown in a dashboard (Figure 12). For each workload the average time using and waiting for resources totaling to the response time is displayed.
Figure 13: QoS Management Dashboard – Resource Wait Breakdown
In addition, the time waiting for resources is further broken down into four categories to easily identify potential bottlenecks. If CPU wait time is highest then this is the bottleneck. QoS using the DB Resource Manager functionality of CPU shares, PDB Shares, and Instance Caging or the RAC horizontal dynamic scaling capability built into Policy-Managed RAC databases can actively manage it. If Global Cache is the bottleneck then the workload should be considered for re-deployment as a singleton service as there is contention between database instances. If I/O wait is the bottleneck, then the storage sub-system should be evaluated to either add disks or reduce clients. Finally, if Other wait is the bottleneck, then there is likely database SQL contention (lock, mutex, latch, etc.) that should be investigated by generating an AWR report.

9
Once the capacity of the cluster and its performance has been evaluated, QoS Management can be switched to its Monitor Mode, by deploying a policy that specifies workload ranks and performance objectives.
Figure 14: QoS Dashboard - Monitor Mode
The resulting dashboard (Figure 14) will then display the Performance Classes (workloads) in rank order and also normalize the response time column (Resource Use vs Wait Time) to the specified performance objective and display the difference between the objective and the actual response time in green (Headroom) should it be less. If the Wait Time exceeds the performance objective, then it will be displayed in red indicating a violation.
Figure 15: QoS Dashboard - Monitor Mode
EM Cloud Control’s notification framework can be utilized to automatically generate alerts when a performance objective has been exceeded by a user-specified number of seconds (Figure 15). It may be sufficient for many RAC deployments to use QoS Management in its Monitor Mode. However, if the goal is to maximize resource usage while maintaining SLAs, the its Management Mode can be activated by creating one or more management policies.

10
Figure 16: QoS Management Dashboard – Management Mode
In this mode QoS Management will produce not only alerts but specific resource re-allocations to restore the cluster into meeting all performance objectives if possible. The Recommendations section of the dashboard (Figure 16) will display the specific resource adjustment which in this case is to have one database donate a CPU core to another that is running a higher ranked performance class. These recommendations can be implemented with a mouse click or performed automatically based upon settings in the active policy.
Figure 17: QoS Management Performance History Graphs
Supplementing the QoS Management dashboard are a set of graphs (Figure 17) that track all aspects of each performance class displaying metrics such as objective compliance, demand, response time, etc. in order that SLA compliance can be tracked.
11
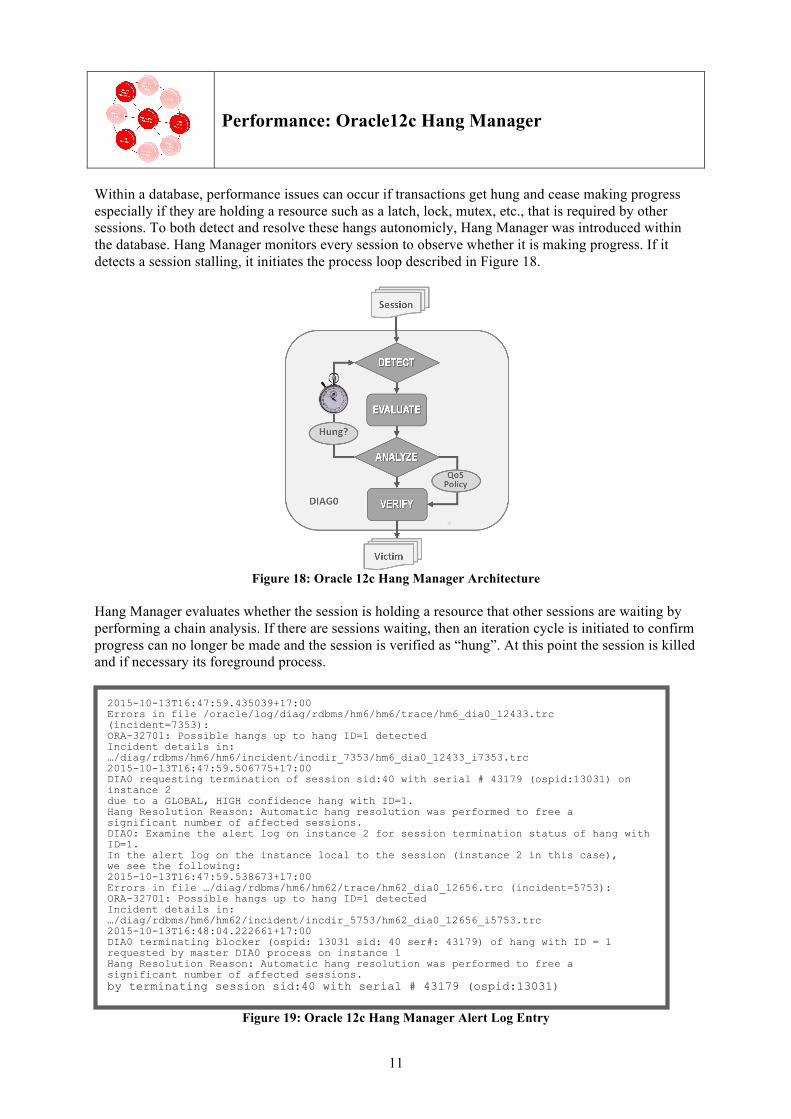
Performance: Oracle12c Hang Manager
Within a database, performance issues can occur if transactions get hung and cease making progress especially if they are holding a resource such as a latch, lock, mutex, etc., that is required by other sessions. To both detect and resolve these hangs autonomicly, Hang Manager was introduced within the database. Hang Manager monitors every session to observe whether it is making progress. If it detects a session stalling, it initiates the process loop described in Figure 18.
Figure 18: Oracle 12c Hang Manager Architecture
Hang Manager evaluates whether the session is holding a resource that other sessions are waiting by performing a chain analysis. If there are sessions waiting, then an iteration cycle is initiated to confirm progress can no longer be made and the session is verified as “hung”. At this point the session is killed and if necessary its foreground process.
Figure 19: Oracle 12c Hang Manager Alert Log Entry
2015-10-13T16:47:59.435039+17:00 Errors in file /oracle/log/diag/rdbms/hm6/hm6/trace/hm6_dia0_12433.trc (incident=7353): ORA-32701: Possible hangs up to hang ID=1 detected Incident details in: …/diag/rdbms/hm6/hm6/incident/incdir_7353/hm6_dia0_12433_i7353.trc 2015-10-13T16:47:59.506775+17:00 DIA0 requesting termination of session sid:40 with serial # 43179 (ospid:13031) on instance 2 due to a GLOBAL, HIGH confidence hang with ID=1. Hang Resolution Reason: Automatic hang resolution was performed to free a significant number of affected sessions. DIA0: Examine the alert log on instance 2 for session termination status of hang with ID=1. In the alert log on the instance local to the session (instance 2 in this case), we see the following: 2015-10-13T16:47:59.538673+17:00 Errors in file …/diag/rdbms/hm6/hm62/trace/hm62_dia0_12656.trc (incident=5753): ORA-32701: Possible hangs up to hang ID=1 detected Incident details in: …/diag/rdbms/hm6/hm62/incident/incdir_5753/hm62_dia0_12656_i5753.trc 2015-10-13T16:48:04.222661+17:00 DIA0 terminating blocker (ospid: 13031 sid: 40 ser#: 43179) of hang with ID = 1 requested by master DIA0 process on instance 1 Hang Resolution Reason: Automatic hang resolution was performed to free a significant number of affected sessions. by terminating session sid:40 with serial # 43179 (ospid:13031)

12
All sessions terminated in this manner have a trace dumped as well as an entry recorded in the database alert log (Figure 19).
Performance: Oracle12c Memory Guard
Another performance risk that can result in the loss of an entire node and all of its database instances is memory stress. This can typically occur if a large number of sessions are opened or several consume large amounts of PGA memory. Oracle 12c Memory Guard was created to continuously monitor memory health on each cluster node getting its data from CHM and take autonomous action should stress be detected.
Figure 20: Memory Guard Stopping New Connections on Stressed Node
If Memory Guard observes a node under memory stress, it will transactionally stop the database services on that node preventing new sessions from being created and letting existing sessions drain off. This action will cause the memory to be freed and the stress to be relieved. Once the node is no longer under stress, Memory Guard will automatically restart the services allowing new sessions and a rebalancing of the workload. Conclusion and Further Information
This has been an overview of the new Oracle 12c Autonomic Performance and Diagnostic Framework and its components. The goal as this framework continues to develop in future releases is to improve the availability and maintain performance of Oracle database deployments by continuously monitoring and taking targeted corrective action when compliance, degradation or fault issues arise. For further information on each of these components please refer to the following documents linked below.
• Oracle 12c Clusterware Admin Guide • Oracle Clusterware on OTN • Oracle QoS Management 12c Documentation • Oracle QoS Management on OTN

13
• Oracle 12c ORAchk • Oracle 12c Trace File Analyzer
Contact address: Mark V. Scardina Oracle Corporation 500 Oracle Parkway 94065, Redwood Shores Phone: +1 650-506-7000 Fax: +1 650-506-7203 Email [email protected] Internet: www.oracle.com