keeyask generation project · the kgp socio-economic monitoring plan (semp) is a commitment made by...
TRANSCRIPT
Keeyask Generation Project
2017 - 2018Manitoba Sustainable Development Client File 5550.00Manitoba Environment Act Licence No. 3107
Socio-Economic Monitoring Plan
Socio-Economic Monitoring ReportSEMP-2018-01

KEEYASK GENERATION PROJECT SOCIO-ECONOMIC MONITORING PLAN
REPORT #SEMP-2018-01
SOCIO-ECONOMIC MONITORING REPORT
APRIL 2017 TO MARCH 2018:
YEAR 4 CONSTRUCTION
Prepared by
Manitoba Hydro
2018
KEEYASK GENERATION PROJECT 2018
I SOCIO-ECONOMIC MONITORING PLAN ANNUAL REPORT
This report should be cited as follows:
Manitoba Hydro. 2018 Keeyask Generation Project Socio-Economic Monitoring Plan. # SEMP-2018-01. Socio-Economic Monitoring Report January 2017 to March 2018: Year 4 Construction, June 2018.
KEEYASK GENERATION PROJECT 2018
SOCIO-ECONOMIC MONITORING PLAN ANNUAL REPORT
ii
SUMMARY
The Keeyask Generation Project (KGP or the Project) Environmental Impact Statement (EIS), completed in June 2012, provides a description of the existing environment, summary of predicted effects and planned mitigation for the Project. Technical supporting information for the socio-economic environment, including a description of the existing environment, effects and mitigation, and a summary of proposed monitoring and follow-up programs is provided in the Socio-economic, Environment, Resource Use and Heritage Resources Supporting Volume (SE SV).
The environmental assessment for the KGP used both technical science and Aboriginal Traditional Knowledge (ATK). Mitigation measures were carefully planned and designed to prevent or reduce (to the extent practical), adverse effects from the Project. However, there were uncertainties associated with predicted effects and the effectiveness of planned mitigation measures. To address these uncertainties, many of the predictions and mitigation measures identified in the KGP EIS are supported by monitoring to enable testing of the predictions and timely response when actual results differ from the predictions.
The KGP Socio-economic Monitoring Plan (SEMP) is a commitment made by the Keeyask Hydropower Limited Partnership (KHLP) in Chapter 8 of the KGP EIS. The SEMP is intended to monitor changes over time for certain socio-economic Valued Environmental Components (VECs). The SEMP focuses on key pathways of effect to, and components of, the socio-economic environment, including:
• Economy,
• Population, Infrastructure and Services, and
• Personal, Family and Community Life
This report focuses on SEMP monitoring activities for the Project to March 31, 2018. Key learning’s of the SEMP Program over the 2017/18 period and next steps are presented below by monitoring topic area. Efforts will continue in the next reporting period to implement monitoring activities identified under the SEMP.
EMPLOYMENT AND TRAINING:
• The KGP EIS predicted employment levels for the partner First Nations members at peak, as well as total person years for the entire construction period. While a full comparison of person year outcomes cannot be made until the end of construction, total person years of employment to date are within the range of what was predicted for the entire Project.
• Since the start of KGP construction to the end of March 2018, there were 13,654 hires on the Project. Total Manitoba hires represented 9,149 hires. Of this, 4,152 hires represented northern Manitoba (Indigenous and non-Indigenous) hires or 50% of total Manitoba hires.
KEEYASK GENERATION PROJECT 2018
SOCIO-ECONOMIC MONITORING PLAN ANNUAL REPORT
iii
• Since the start of KGP construction to the end of March 2018, the Project generated 7,801 person years of employment in terms of a 2000 hour per year basis (5,200 person years of employment in terms of a 3000 hour per year basis). Of this, 5,005 (on a 2000 hour basis) represented Manitoba person years, and 1,995 represented total northern Manitoba (Indigenous and non-Indigenous) person years (40% of total Manitoba person years).
• Since the start of KGP construction to the end of March 2018, the cumulative turnover rate for the Project is 31% of total hires, 44% of Indigenous hires and 22% of non-Indigenous hires.
• Over the reporting period the Keeyask Advisory Group on Employment (AGE) and Subcommittee continued as a forum for addressing employment-related issues associated with construction of the KGP. Over the past year, an emphasis has been placed on community outreach, improving the pathways for Northern Indigenous workers entering apprenticeships, filling open On-the-Job training opportunities for both designated and non-designated trades, and maintaining the partner First Nations’ peak employment numbers achieved over the 2016 construction period.
• As of March 31, 2018, 1379 Indigenous employees had training opportunities on the Project; 584 of these were filled by partner First Nation members.
BUSINESS OPPORTUNITIES:
• The KGP EIS predicted that Project construction would present direct and indirect business opportunities locally, regionally and across the province as a whole.
• Cumulatively, $3,410.9 million has been spent on goods and services for the KGP. Of this, $1,009.1 million were Manitoba purchases. Total northern Manitoba (Indigenous and non-Indigenous) purchases represent $672.1 million or 67% of total Manitoba purchases.
• Key Person Interviews (KPIs) have been undertaken in Thompson and Gillam to ascertain any indirect business opportunities that may have been generated as a result of the KGP. Manitoba Hydro and the partner First Nations have initiated discussions regarding the design and implementation of the KPIs in the partner First Nation communities.
• KPIs are underway with key participants involved in the management of the KGP Direct Negotiated Contracts (DNCs) to understand the role of partner First Nations’ businesses in implementation of the DNCs and how they contribute to building partner First Nations’ business capacity.
INCOME:
• Since the start of KGP construction to the end of March 2018, total labour income earned as a result of the KGP was approximately $789.1 million. Of this, Manitoba labour income represented $452.6 million.
KEEYASK GENERATION PROJECT 2018
SOCIO-ECONOMIC MONITORING PLAN ANNUAL REPORT
iv
POPULATION:
• The Project EIS predicted that population change and the effect on physical infrastructure in the partner First Nations and Gillam would be minimal since workers would be hired through the Job Referral Service and cannot be hired at site. In addition, there is limited accommodation available in the region.
• Over this past reporting period, modest increases were observed in the Tataskweyak Cree Nation (TCN) and York Factory First Nation (YFFN) populations, and modest decreases were observed in the War Lake First nation (WLFN) and Fox Lake Cree Nation (FLCN) populations. Data for the communities dating back to 2003 shows periods of moderate population growth and decline across years. The changes in total population observed from 2016 to 2017 are consistent with the trends observed over time.
• Updated population data for the Town of Gillam was not available during this reporting period.
WORKER INTERACTION:
• The KGP EIS anticipated that construction of the Project may result in adverse interactions between non-local construction workers and TCN and FLCN Members and Gillam residents.
• A Worker Interaction Subcommittee was established by Manitoba Hydro prior to the beginning of Keeyask construction as part of a corporate-wide initiative to address anticipated increases in the Gillam area workforce.
• In the period from April 1, 2017 to March 31, 2018, the Worker Interaction Subcommittee met three times. Topics addressed in this forum included local road conditions and traffic safety; use of Gillam services and facilities; the behaviour of non-local persons; and the presence of drugs in the Gillam area. In addition, the subcommittee continued to monitor updates provided by service providers such as the Gillam Hospital and the Gillam RCMP to understand changing demands for health services and policing.
HOUSING, INFRASTRUCTURE AND SERVICES:
• One-time KPIs are taking place during project construction to identify any apparent effects on housing or infrastructure and services in the partner First Nations. Reporting on KPIs are in progress in both FLCN and YFFN. Discussions regarding design and implementation are underway with both TCN and WLFN.
• The interviews completed by YFFN document that since 2012, the community has observed change in a number of service areas. Discussions regarding many of the key findings of the interviews are underway at the community level and in forums related to the Keeyask project.
• Manitoba Hydro and FLCN continue to work together to summarize the findings related to their community.
KEEYASK GENERATION PROJECT 2018
SOCIO-ECONOMIC MONITORING PLAN ANNUAL REPORT
v
TRANSPORTATION INFRASTRUCTURE:
• While the KGP EIS predicted that existing transportation networks and plans for Provincial Road (PR) 280 upgrades would be able to accommodate the changes in road use associated with Project construction, community concerns remain regarding traffic safety and road conditions.
• In the period between April 2017 and March 2018, the PR 280 Joint Advisory Committee met twice, in April and May of 2017.
• A number of mitigation measures have been adopted to reduce the impact of Project traffic on PR 280 including road reconstruction and increased maintenance efforts, operation of the Provincial Trunk Highway (PTH) 6 weigh station near Thompson, and communicating driver expectations to contractors in an effort to promote appropriate driving behavior on PR 280.
• The segment of PR 280 with the highest traffic volumes is between PR 391 and Split Lake where from April 2017 to March 2018, the average traffic counts (northbound and southbound combined) were 391 vehicles per day. Of the 391 vehicles per day, 74 were large trucks.
• Collision rates along PR 280 and PR 290 have remained below the industry standard threshold of 1.50 million vehicle-kilometres of travel (MVKT). Spot grade improvements, localized design considerations, and other road safety improvements are being implemented to address ongoing concerns and to improve the driving experience for all road users
• The Keeyask North Access Road connects PR 280 to the construction site. On average, 125 vehicles per day used the road between April 2017 and March 2018. This is higher than past years reflecting the peak construction and large workforce.
• Over the past year, traffic monitoring data indicate that Keeyask related construction traffic varied month to month accounting for between 37% to 61% of all traffic on PR 280 near the PR 280/Keeyask North Access Road intersection.
CULTURE AND SPIRITUALITY:
• The KGP EIS noted some uncertainty about how the employment experience during Project construction would affect workers and their families.
• A worker and family survey is being undertaken to assess the experiences of a sample of partner First Nations’ members employed on the Project and their families. Over this past year Manitoba Hydro and the partner First Nations have been working towards the development of survey instruments and survey methodology. Surveys of current and past employees, and their family members, will occur over 2018.
• During this reporting period, between April 2017 and March 2018, there were eight ceremonies held. One hundred sixty three Indigenous awareness training workshops were
KEEYASK GENERATION PROJECT 2018
SOCIO-ECONOMIC MONITORING PLAN ANNUAL REPORT
vi
held over this same period. Counseling services were available to employees on site on a voluntary basis. These efforts will continue throughout construction.
MERCURY AND HUMAN HEALTH:
• The KGP EIS predicted no effects of the Project during the construction phase in relation to mercury and human health. After impoundment of the reservoir, flooding of soils is expected to release mercury into the environment and food chain. Increased mercury levels, especially in jackfish and pickerel in Gull Lake and to a lesser extent in Stephens Lake, are estimated to peak about three to seven years after impoundment and then return to pre-impoundment levels over about 30 years.
• The Partnership has prepared a Mercury and Human Health Risk Management Plan in consultation with provincial and federal regulators. This reporting period’s key activities included: updating fish consumption guidance (communication products) to reflect recent fish monitoring results; hiring mercury community coordinators in each of the partner First Nation; work towards retaining a consultant to undertake hair monitoring and food surveys, and preparing for community-based risk management activities.
KEEYASK GENERATION PROJECT 2018
SOCIO-ECONOMIC MONITORING PLAN ANNUAL REPORT
vii
TABLE OF CONTENTS
1.0 INTRODUCTION ..................................................................................... 1
2.0 OVERVIEW OF PROJECT ........................................................................ 2
3.0 OVERALL OBJECTIVES AND APPROACH .................................................. 3
4.0 OVERALL SCHEDULE ............................................................................ 4
5.0 STUDY AREA ....................................................................................... 5
6.0 ECONOMIC MONITORING ....................................................................... 8
6.1 EMPLOYMENT AND TRAINING ............................................................................... 8
6.1.1 Person Years of employment ............................................................. 9
6.1.2 Hires ................................................................................................... 10
6.1.3 Individual Employees ....................................................................... 11
6.1.4 Employment in the Partner First Nations ........................................ 12
6.1.5 Type of Work (Job Classification) Available ................................... 13
6.1.6 Rates of Turnover ............................................................................. 14
6.1.7 Employment Mitigation ..................................................................... 15
6.1.7.1 The Advisory Group on Employment ................................. 15
6.1.8 Training ............................................................................................. 17
6.2 BUSINESS OPPORTUNITIES ................................................................................ 17
6.2.1 Direct Project Expenditures ............................................................. 18
6.2.2 Indirect Business Opportunities Survey ......................................... 18
6.2.3 Direct Partnership Business Opportunities Survey ....................... 19
6.3 INCOME ............................................................................................................ 20
6.3.1 Labour Income .................................................................................. 20
7.0 SOCIAL MONITORING .......................................................................... 22
7.1 POPULATION ..................................................................................................... 22
7.1.1 Partner First Nation Communities ................................................... 22
7.1.2 Town of Gillam .................................................................................. 24
7.2 WORKER INTERACTION ...................................................................................... 24
7.3 HOUSING, INFRASTRUCTURE AND SERVICES ....................................................... 25
7.4 TRANSPORTATION INFRASTRUCTURE, TRAVEL, ACCESS AND SAFETY.................. 27
7.4.1 Traffic Volumes ................................................................................. 27

KEEYASK GENERATION PROJECT 2018
SOCIO-ECONOMIC MONITORING PLAN ANNUAL REPORT
viii
7.4.2 Collision Data .................................................................................... 28
7.4.3 Keeyask Site Access ........................................................................ 28
7.5 CULTURE AND SPIRITUALITY .............................................................................. 29
7.5.1 Indigenous awareness activities and retention support programs ........................................................................................... 29
7.5.1.1 Partner First Nation Members Orientation ......................... 29
7.5.1.2 Indigenous awareness training ........................................... 30
7.5.1.3 On-site counseling ............................................................... 30
7.5.1.4 Cultural site ceremonies ...................................................... 30
7.5.1.5 Sweat Lodge ......................................................................... 31
7.5.1.6 Site Liaison ........................................................................... 31
7.6 SOCIAL MITIGATION .......................................................................................... 32
7.6.1 Responding to Community Concerns ............................................. 32
7.6.2 Keeyask Workplace Culture ............................................................. 32
8.0 MERCURY AND HUMAN HEALTH ........................................................ 34

KEEYASK GENERATION PROJECT 2018
SOCIO-ECONOMIC MONITORING PLAN ANNUAL REPORT
ix
LIST OF TABLES
Table 1: Total Hires by Job Classification (Start of Construction to end of March 2018) ................................................................................................................. 13
Table 2: Turnover ............................................................................................................ 14 Table 3: Average Annual Growth Rate of On-Reserve and On Own Crown Land
Population at Partner First Nations in Pre-Construction and Construction Periods .............................................................................................................. 23
LIST OF FIGURES
Figure 1: Person Years of Employment (Start of Construction to end of March 2018) ....... 10 Figure 2: Number of Hires (Start of Construction to end of March 2018) ........................... 11 Figure 3: Total Individual Employees (Start of Construction to end of March 2018) .......... 12 Figure 4: Quarterly Turnover ............................................................................................. 15 Figure 5: Direct Purchases................................................................................................ 18 Figure 6: Labour Income ................................................................................................... 21 Figure 7: Total On-Reserve and On-Own-Crown Land Population at Partner First
Nations (2003-2017) .......................................................................................... 23 Figure 8: Gillam Population (2008-2016) ........................................................................... 24 Figure 9: Monthly Variations: Overall Traffic Versus Truck Traffic ..................................... 28
KEEYASK GENERATION PROJECT 2018
SOCIO-ECONOMIC MONITORING PLAN ANNUAL REPORT
x
LIST OF MAPS
Map 1: Socio-Economic Local Study Area ....................................................................... 6 Map 2: Socio-Economic Regional Study Area .................................................................. 7
LIST OF APPENDICES
Appendix 1: Northern Road Traffic Monitoring Quarterly Data Collection Summary APRIL 2018................................................................................................................... 35
KEEYASK GENERATION PROJECT 2018
SOCIO-ECONOMIC MONITORING PLAN ANNUAL REPORT
1
1.0 INTRODUCTION Manitoba Hydro, on behalf of the Keeyask Hydropower Limited Partnership received regulatory approval to commence construction of the Keeyask Generation Project (“the Project” or “KGP”) in July 2014.
The KGP follows the Keeyask Infrastructure Project (KIP), which included a start-up camp and associated infrastructure, a 25 km all weather north-access road, and the first phase of the Keeyask Generation Project main camp.
The KGP Socio-economic Monitoring Plan is intended to monitor changes over time for certain Valued Environmental Components (VECs). The SEMP focuses on key pathways of effect to, and components of, the socio-economic environment including;
• Economy,
• Population, Infrastructure and Services, and
• Personal, Family and Community Life
The SEMP is part of an integrated and coordinated Environmental Protection Program that has been developed to facilitate an effective transition from planning and assessment to implementation of all aspects of the Keeyask Generation Project.
This report focuses on monitoring for the Project from the start of construction to March 31, 2018.

KEEYASK GENERATION PROJECT 2018
SOCIO-ECONOMIC MONITORING PLAN ANNUAL REPORT
2
2.0 OVERVIEW OF PROJECT The Keeyask Generation Project is a 695 megawatt (MW) hydroelectric generating station located approximately 180 km northeast of Thompson and 40 km southwest of Gillam at Gull Rapids on the lower Nelson River. The Project consists of four principal structures: a powerhouse complex, a spillway, dams, and dykes. A reservoir will be created upstream of the principal structures. Supporting infrastructure consists of temporary facilities required to construct the principal structures and permanent facilities required to construct and operate the Project. Temporary infrastructure consists of work areas, cofferdams, rock groins, and an ice boom. Permanent supporting infrastructure consists of north and south access roads, a transmission tower spur, communications tower, some borrow areas, excavated-material placement areas, boat launches, and a portage to enable river traffic to bypass the dam.
KEEYASK GENERATION PROJECT 2018
SOCIO-ECONOMIC MONITORING PLAN ANNUAL REPORT
3
3.0 OVERALL OBJECTIVES AND APPROACH
The KGP EIS identified primary effects to the socio-economic VECs and defined the process, scope, methods, documentation and application of the socio-economic monitoring for the Project. Overall, the intent of Manitoba Hydro and the partner First Nations has been to reduce adverse effects of the Project and to enhance Project benefits to the extent feasible and practical. Monitoring information has been intended to assist in this management task. The SEMP for the Project is intended to monitor changes over time for certain VECs in order to, where applicable:
• Test predicted effects in the EIS;
• Identify unanticipated effects related to the Project;
• Monitor the effectiveness of mitigation measures;
• Determine if adaptive management is required; and
• Confirm compliance with regulatory requirements, including terms and conditions in Project approvals.
The SEMP focuses on key pathways of effect to, and components of, the socio-economic environment including;
• Economy
o Employment and Training Opportunities o Business Opportunities, and o Income
• Population, Infrastructure and Services
o Population o Housing o Infrastructure and Services, and o Transportation Infrastructure
• Personal, Family and Community Life
o Public Safety and Worker Interaction o Travel, Access and Safety o Culture and Spirituality, and o Mercury and Human Health
The SEMP builds on the assessment studies conducted for the EIS using established methods for data collection and analysis.
KEEYASK GENERATION PROJECT 2018
SOCIO-ECONOMIC MONITORING PLAN ANNUAL REPORT
4
4.0 OVERALL SCHEDULE The SEMP will be more extensive during construction of the Project, but will also occur during the operation phase. SEMP activities will occur as follows;
• Construction Phase – SEMP monitoring during construction is related to employment and training opportunities; business opportunities; income; population changes; housing; infrastructure and services; transportation infrastructure; public safety and worker interaction; travel, access and safety; and culture and spirituality.
• Operation Phase – SEMP monitoring during operation is more limited, and is related to population change in Gillam during the first five years of operation; water levels at Split Lake (re: transportation infrastructure/travel safety); and monitoring related to mercury and human health.
KEEYASK GENERATION PROJECT 2018
SOCIO-ECONOMIC MONITORING PLAN ANNUAL REPORT
5
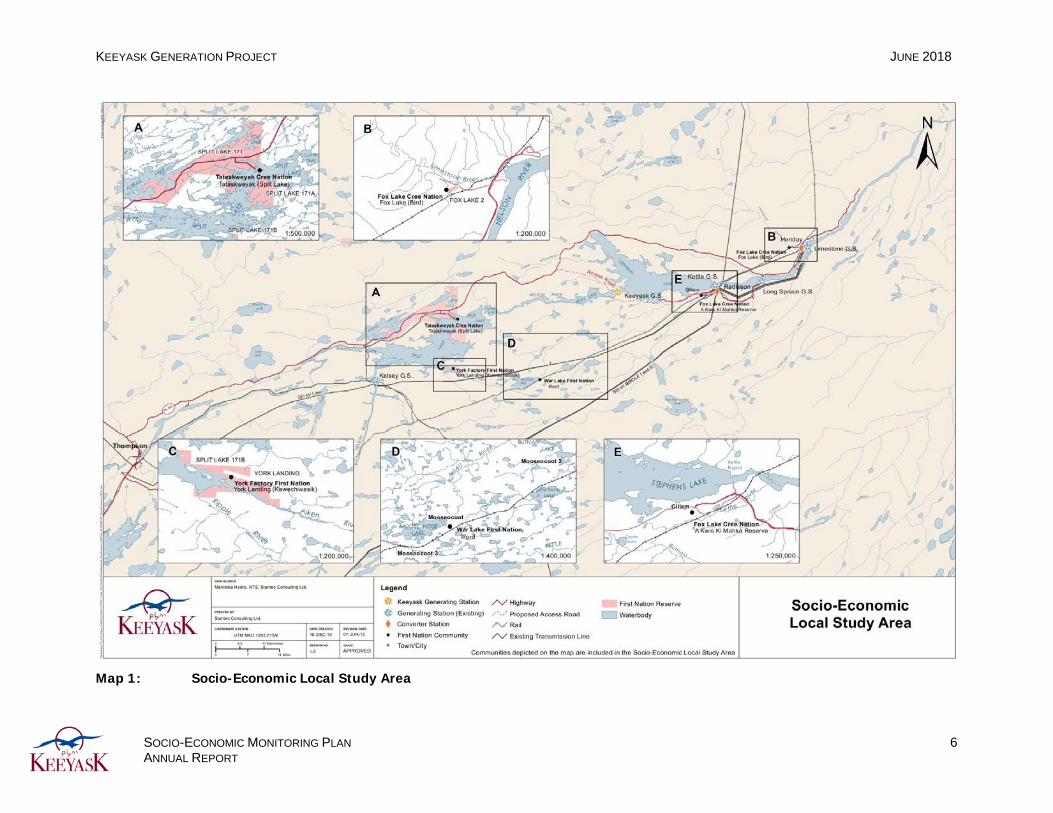
5.0 STUDY AREA The Socio-Economic Local Study Area for the SEMP (see Map 1) incorporates the Project site, and includes the partner First Nation communities of TCN at Split Lake, WLFN at Ilford, YFFN at York Landing and FLCN at Fox Lake/Gillam, which are affected by the Project through the following pathways of effect:
• Physical/biophysical changes to the way the landscape looks;
• Physical/biophysical effects on resource use/traditional use areas and heritage resources;
• Employment and business opportunities;
• Construction traffic;
• Interaction with non-local construction workers within the partner First Nations’ home communities; and
• Investment income.
In addition to the partner First Nations’ communities, the Town of Gillam and the City of Thompson are included in the Socio-Economic Local Study Area because of their proximity to the Project.
Certain Project effects, in particular preferential hiring of northern Indigenous and other northern workers for construction employment, will extend beyond the Socio-Economic Local Study Area to all of northern Manitoba. For this reason, the Socio-Economic Regional Study Area has been defined using the boundary identified under Schedule D of the Burntwood Nelson Agreement (BNA) (see Map 2) as the area pertaining to northern preference. This includes the Churchill-Burntwood-Nelson (CBN) communities identified in the BNA as part of hiring preference Zone 1.
KEEYASK GENERATION PROJECT JUNE 2018
SOCIO-ECONOMIC MONITORING PLAN ANNUAL REPORT
6
Map 1: Socio-Economic Local Study Area

KEEYASK GENERATION PROJECT June 2018
SOCIO-ECONOMIC MONITORING PLAN ANNUAL REPORT
7
Map 2: Socio-Economic Regional Study Area
KEEYASK GENERATION PROJECT June 2018
SOCIO-ECONOMIC MONITORING PLAN ANNUAL REPORT
8
6.0 ECONOMIC MONITORING Economic monitoring includes monitoring of all employment, training, business and income outcomes associated with the Project. Monitoring is conducted using a consistent methodology that Manitoba Hydro has used for other major capital projects.
All information regarding economic monitoring is provided from the start of generating station project activities (2014) to the end of March 2018.
Economic impacts can be either direct, indirect or induced. Direct impacts result from project expenditures and include employment, purchases, and income generated by the Project. Indirect impacts refer to the employment, purchases and income created in other industries as the effects of project expenditures work their way through the economy. For example, there are indirect impacts on businesses supplying materials and equipment to companies in the direct impact segment. Induced impacts are created by the spending of additional income and profits earned by workers and company owners associated with the Project directly or indirectly. This includes additional spending on food, housing, entertainment, transportation, and all of the other expenses that make up a typical household budget. Adding up the direct, indirect and induced impacts, results in the total economic impact of the Project.
6.1 EMPLOYMENT AND TRAINING
The Project EIS analysed and provided employment estimates for partner First Nations, the Indigenous workforce in the CBN area and the Indigenous workforce in the Socio-Economic Study Area as a whole (see SE SV Section 3.4.1) for the construction phase of the Project. The EIS also predicted that there would be northern participation in the operating jobs required to operate the facility.
Monitoring of employment and training is being undertaken, to determine the overall employment outcomes of the Project construction, with particular emphasis on Indigenous and northern resident participation. Monitoring is also intended to determine the extent to which recipients of pre-project training (PPT) participated in Keeyask construction jobs, and received on the job training. It was estimated that the levels of participation would be influenced by several factors, including timing of the opportunities and the level of interest by potential workers in pursuing those opportunities.
Monitoring of employment outcomes provides data on overall success in attracting and retaining partner First Nation members, Indigenous persons and Manitobans during Project construction.
As noted within the SEMP, the Project has an established AGE that will continue to function throughout construction. This is a forum to address employment-related issues related to the construction of the Project, in particular Indigenous employment. The AGE is established to
KEEYASK GENERATION PROJECT June 2018
SOCIO-ECONOMIC MONITORING PLAN ANNUAL REPORT
9
receive, review and find solutions to concerns and issues and to monitor, report and make recommendations to the Project manager on employment-related matters, as required.
During construction, employment data is collected on site by contractors through an employee self-declaration form designed specifically for the Project. All completed forms are provided by on-site contractors to Manitoba Hydro and stored in a central database for the Project. Contractors also provide information to Manitoba Hydro on hours worked and labour income to enable calculations for person years and income during construction. Employment data is provided in the categories outlined below:
• Person years – When part-time and/or seasonal workers are used, it is useful to standardize the hires in terms of person years of employment. Person years of employment are defined as the amount of work that one worker could complete during twelve months of full-time employment. This usually means about 2,000 hours of work per year using a standard 40 hour work week in most industries; whereas for Keeyask construction work, a person-year of employment represents 3,000 hours of work per year. The person-years of employment presented below are shown both at 2,000 hours of work per year, for economic comparisons to other industries, as well as at 3,000 hours (identified in parentheses) of work per year.
• Hires - Refers to the number of times people were hired on the Project site for any duration.
• Employees - Refers to the number of individuals hired. The variance between Hires and Employees can be attributed to an individual being hired to the Project more than once.
• Type (job classifications) of work available.
Training data is collected by Manitoba Hydro through established methods utilizing contractor on the job reporting, and the completion of an employee self declaration form. Hydro Northern Training and Employment (HNTEI) PPTs are tracked by comparing self declared Employee Report information to the Manitoba Hydro HNTEI database.
6.1.1 PERSON YEARS OF EMPLOYMENT
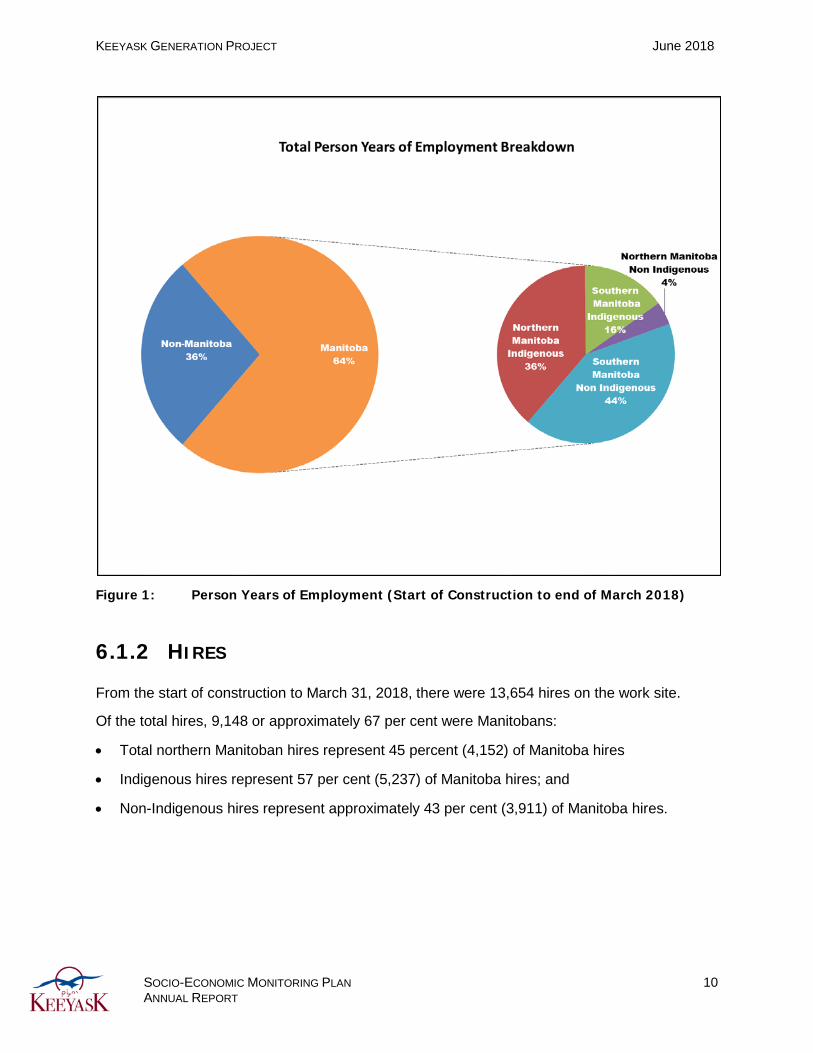
From the start of Keeyask Generation construction to March 31, 2018, direct employment on the Project totaled 7,801 (5,200) person-years. As shown below, 64 per cent, or 5,005 (3,337) of these person-years, represent people already living in Manitoba.
Of the 64 per cent of employees already living in Manitoba:
• Northern Manitobans represent 40 per cent, or, 1,995 (1,330) person-years;
• Other Manitobans represent 60 per cent, or 3,010 (2,007) person-years;
• Indigenous employment represents 52 per cent, or 2,600 (1,733) person years; and
• Non-Indigenous employment represents 48 per cent, or 2,405 (1,603) person-years.
KEEYASK GENERATION PROJECT June 2018
SOCIO-ECONOMIC MONITORING PLAN ANNUAL REPORT
10
Figure 1: Person Years of Employment (Start of Construction to end of March 2018)
6.1.2 HIRES
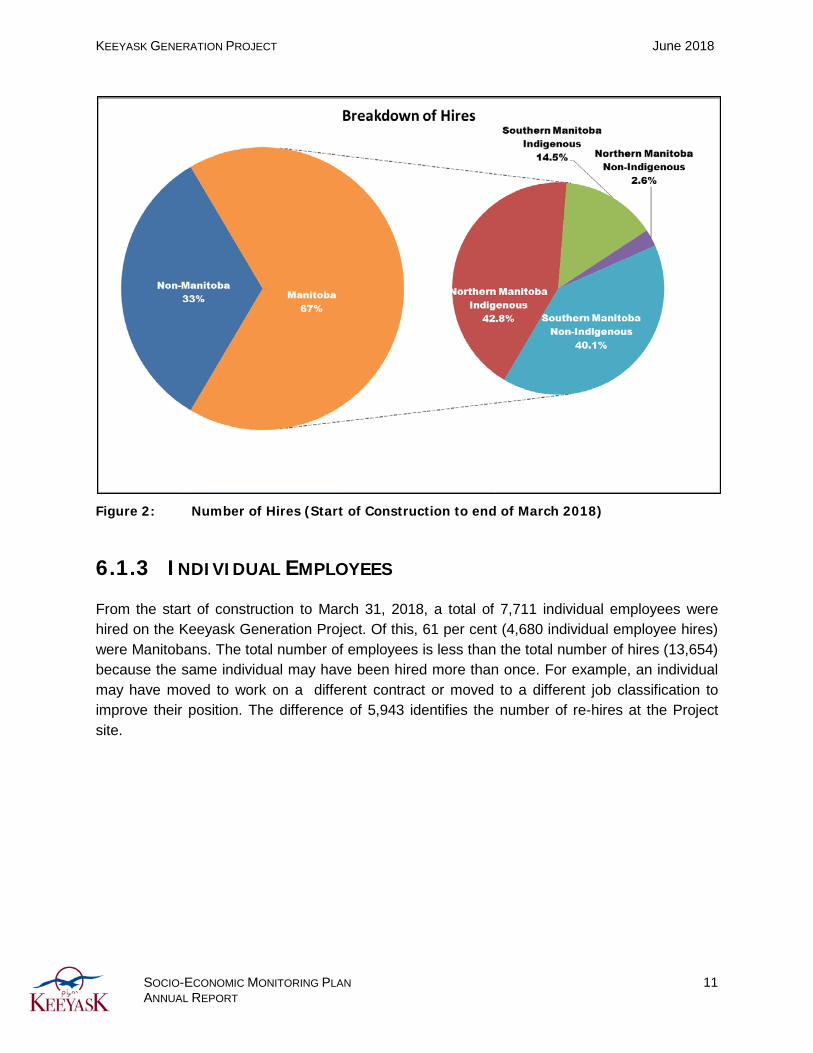
From the start of construction to March 31, 2018, there were 13,654 hires on the work site.
Of the total hires, 9,148 or approximately 67 per cent were Manitobans:
• Total northern Manitoban hires represent 45 percent (4,152) of Manitoba hires
• Indigenous hires represent 57 per cent (5,237) of Manitoba hires; and
• Non-Indigenous hires represent approximately 43 per cent (3,911) of Manitoba hires.
KEEYASK GENERATION PROJECT June 2018
SOCIO-ECONOMIC MONITORING PLAN ANNUAL REPORT
11
Figure 2: Number of Hires (Start of Construction to end of March 2018)
6.1.3 INDIVIDUAL EMPLOYEES
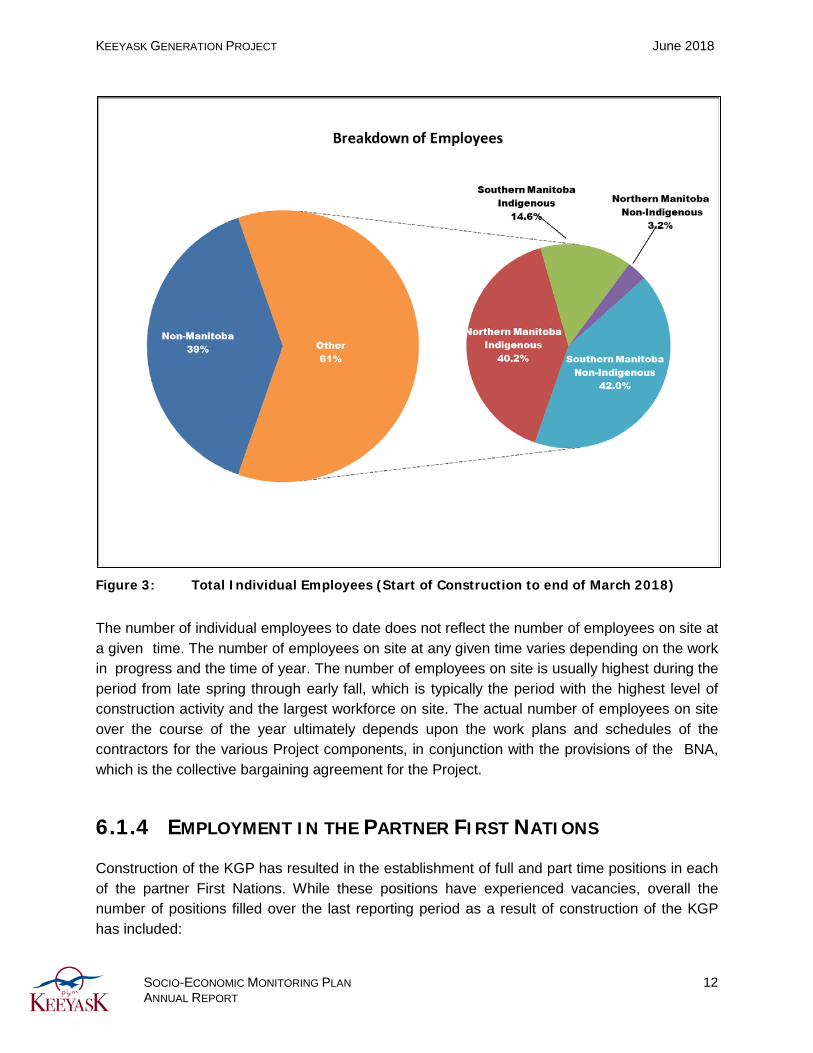
From the start of construction to March 31, 2018, a total of 7,711 individual employees were hired on the Keeyask Generation Project. Of this, 61 per cent (4,680 individual employee hires) were Manitobans. The total number of employees is less than the total number of hires (13,654) because the same individual may have been hired more than once. For example, an individual may have moved to work on a different contract or moved to a different job classification to improve their position. The difference of 5,943 identifies the number of re-hires at the Project site.
KEEYASK GENERATION PROJECT June 2018
SOCIO-ECONOMIC MONITORING PLAN ANNUAL REPORT
12
Figure 3: Total Individual Employees (Start of Construction to end of March 2018)
The number of individual employees to date does not reflect the number of employees on site at a given time. The number of employees on site at any given time varies depending on the work in progress and the time of year. The number of employees on site is usually highest during the period from late spring through early fall, which is typically the period with the highest level of construction activity and the largest workforce on site. The actual number of employees on site over the course of the year ultimately depends upon the work plans and schedules of the contractors for the various Project components, in conjunction with the provisions of the BNA, which is the collective bargaining agreement for the Project.
6.1.4 EMPLOYMENT IN THE PARTNER FIRST NATIONS
Construction of the KGP has resulted in the establishment of full and part time positions in each of the partner First Nations. While these positions have experienced vacancies, overall the number of positions filled over the last reporting period as a result of construction of the KGP has included:
KEEYASK GENERATION PROJECT June 2018
SOCIO-ECONOMIC MONITORING PLAN ANNUAL REPORT
13
• Seven full time, one term and one part time position at FLCN;
• Nine full time positions at TCN;
• Two full time positions at WLFN; and
• Nine full time and one term position at YFFN.
These positions have been created on the basis of community specific work plans for the implementation of governance and other commitments in the JKDA.
6.1.5 TYPE OF WORK (JOB CLASSIFICATION) AVAILABLE
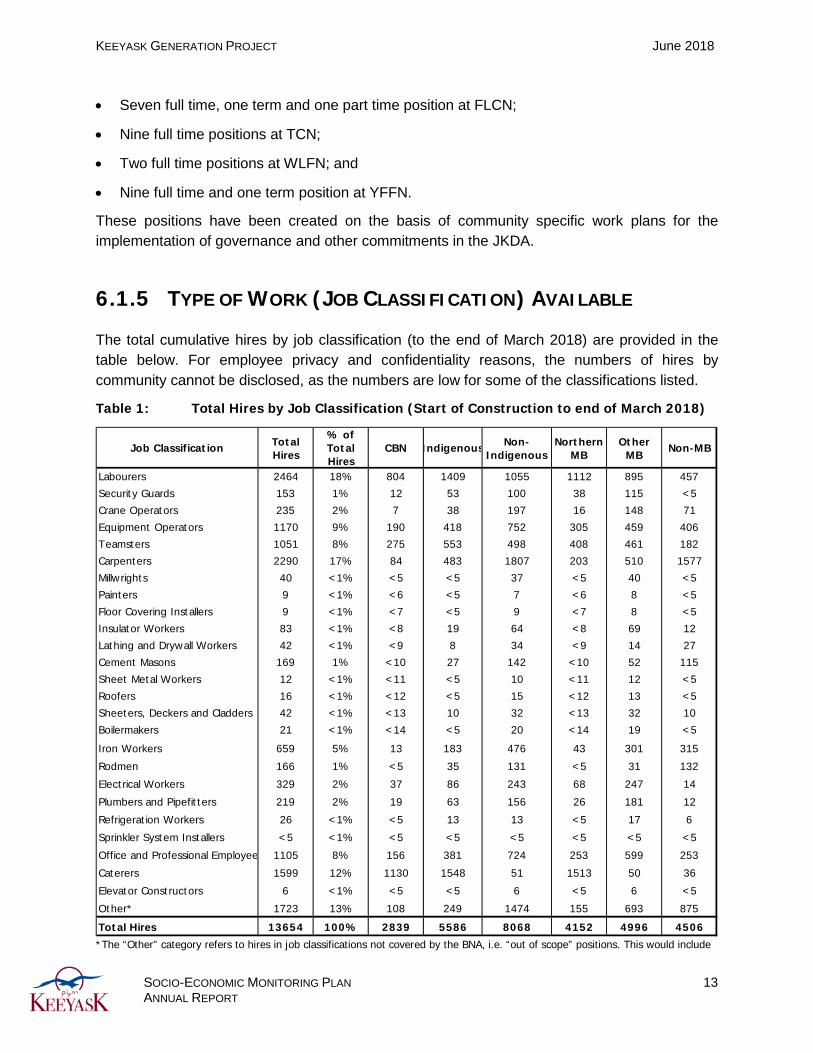
The total cumulative hires by job classification (to the end of March 2018) are provided in the table below. For employee privacy and confidentiality reasons, the numbers of hires by community cannot be disclosed, as the numbers are low for some of the classifications listed.
Table 1: Total Hires by Job Classification (Start of Construction to end of March 2018)
*The “Other” category refers to hires in job classifications not covered by the BNA, i.e. “out of scope” positions. This would include
Job Classification Total Hires
% of Total Hires
CBN Indigenous Non-Indigenous
Northern MB
Other MB
Non-MB
Labourers 2464 18% 804 1409 1055 1112 895 457
Security Guards 153 1% 12 53 100 38 115 <5
Crane Operators 235 2% 7 38 197 16 148 71
Equipment Operators 1170 9% 190 418 752 305 459 406
Teamsters 1051 8% 275 553 498 408 461 182
Carpenters 2290 17% 84 483 1807 203 510 1577
Millwrights 40 <1% <5 <5 37 <5 40 <5
Painters 9 <1% <6 <5 7 <6 8 <5
Floor Covering Installers 9 <1% <7 <5 9 <7 8 <5
Insulator Workers 83 <1% <8 19 64 <8 69 12
Lathing and Drywall Workers 42 <1% <9 8 34 <9 14 27
Cement Masons 169 1% <10 27 142 <10 52 115
Sheet Metal Workers 12 <1% <11 <5 10 <11 12 <5
Roofers 16 <1% <12 <5 15 <12 13 <5
Sheeters, Deckers and Cladders 42 <1% <13 10 32 <13 32 10
Boilermakers 21 <1% <14 <5 20 <14 19 <5
Iron Workers 659 5% 13 183 476 43 301 315
Rodmen 166 1% <5 35 131 <5 31 132
Electrical Workers 329 2% 37 86 243 68 247 14
Plumbers and Pipefitters 219 2% 19 63 156 26 181 12
Refrigeration Workers 26 <1% <5 13 13 <5 17 6
Sprinkler System Installers <5 <1% <5 <5 <5 <5 <5 <5
Office and Professional Employee 1105 8% 156 381 724 253 599 253
Caterers 1599 12% 1130 1548 51 1513 50 36
Elevator Constructors 6 <1% <5 <5 6 <5 6 <5
Other* 1723 13% 108 249 1474 155 693 875
Total Hires 13654 100% 2839 5586 8068 4152 4996 4506
KEEYASK GENERATION PROJECT June 2018
SOCIO-ECONOMIC MONITORING PLAN ANNUAL REPORT
14
managerial and supervisory staff (both Contractor and Manitoba Hydro), other Manitoba Hydro on-site staff and certain technical staff (engineers and technicians).
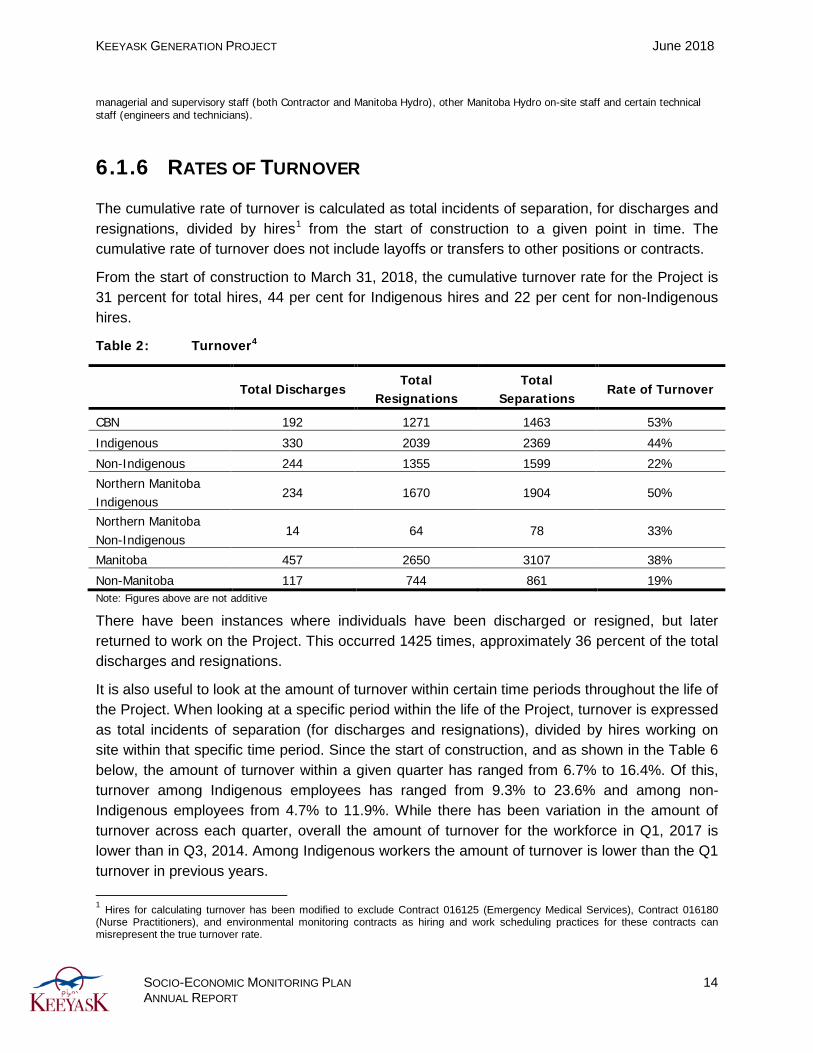
6.1.6 RATES OF TURNOVER
The cumulative rate of turnover is calculated as total incidents of separation, for discharges and resignations, divided by hires1 from the start of construction to a given point in time. The cumulative rate of turnover does not include layoffs or transfers to other positions or contracts.
From the start of construction to March 31, 2018, the cumulative turnover rate for the Project is 31 percent for total hires, 44 per cent for Indigenous hires and 22 per cent for non-Indigenous hires.
Table 2: Turnover4
Total Discharges Total
Resignations Total
Separations Rate of Turnover
CBN 192 1271 1463 53%
Indigenous 330 2039 2369 44%
Non-Indigenous 244 1355 1599 22%
Northern Manitoba Indigenous
234 1670 1904 50%
Northern Manitoba Non-Indigenous
14 64 78 33%
Manitoba 457 2650 3107 38%
Non-Manitoba 117 744 861 19% Note: Figures above are not additive
There have been instances where individuals have been discharged or resigned, but later returned to work on the Project. This occurred 1425 times, approximately 36 percent of the total discharges and resignations.
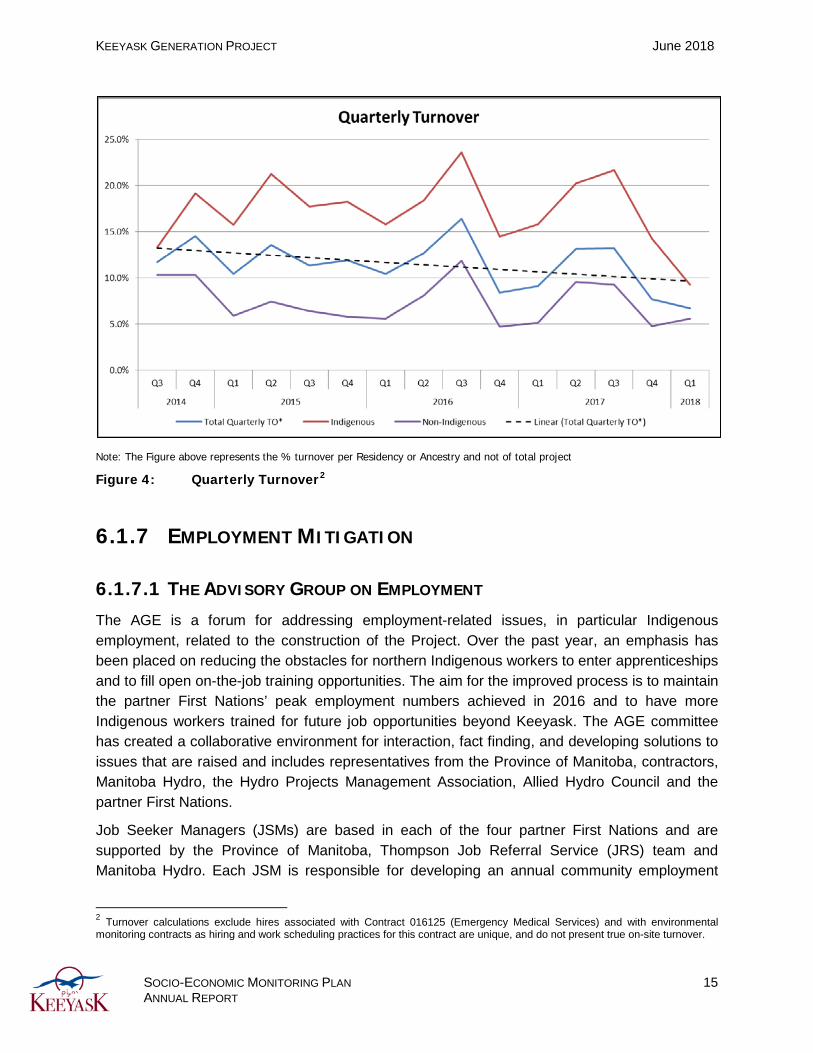
It is also useful to look at the amount of turnover within certain time periods throughout the life of the Project. When looking at a specific period within the life of the Project, turnover is expressed as total incidents of separation (for discharges and resignations), divided by hires working on site within that specific time period. Since the start of construction, and as shown in the Table 6 below, the amount of turnover within a given quarter has ranged from 6.7% to 16.4%. Of this, turnover among Indigenous employees has ranged from 9.3% to 23.6% and among non-Indigenous employees from 4.7% to 11.9%. While there has been variation in the amount of turnover across each quarter, overall the amount of turnover for the workforce in Q1, 2017 is lower than in Q3, 2014. Among Indigenous workers the amount of turnover is lower than the Q1 turnover in previous years. 1 Hires for calculating turnover has been modified to exclude Contract 016125 (Emergency Medical Services), Contract 016180 (Nurse Practitioners), and environmental monitoring contracts as hiring and work scheduling practices for these contracts can misrepresent the true turnover rate.
KEEYASK GENERATION PROJECT June 2018
SOCIO-ECONOMIC MONITORING PLAN ANNUAL REPORT
15
Note: The Figure above represents the % turnover per Residency or Ancestry and not of total project
Figure 4: Quarterly Turnover2
6.1.7 EMPLOYMENT MITIGATION
6.1.7.1 THE ADVISORY GROUP ON EMPLOYMENT
The AGE is a forum for addressing employment-related issues, in particular Indigenous employment, related to the construction of the Project. Over the past year, an emphasis has been placed on reducing the obstacles for northern Indigenous workers to enter apprenticeships and to fill open on-the-job training opportunities. The aim for the improved process is to maintain the partner First Nations’ peak employment numbers achieved in 2016 and to have more Indigenous workers trained for future job opportunities beyond Keeyask. The AGE committee has created a collaborative environment for interaction, fact finding, and developing solutions to issues that are raised and includes representatives from the Province of Manitoba, contractors, Manitoba Hydro, the Hydro Projects Management Association, Allied Hydro Council and the partner First Nations.
Job Seeker Managers (JSMs) are based in each of the four partner First Nations and are supported by the Province of Manitoba, Thompson Job Referral Service (JRS) team and Manitoba Hydro. Each JSM is responsible for developing an annual community employment
2 Turnover calculations exclude hires associated with Contract 016125 (Emergency Medical Services) and with environmental monitoring contracts as hiring and work scheduling practices for this contract are unique, and do not present true on-site turnover.

KEEYASK GENERATION PROJECT June 2018
SOCIO-ECONOMIC MONITORING PLAN ANNUAL REPORT
16
plan. All four plans are unique, but also have common goals including improving the ability for employers to make contact with members and ensuring that members’ qualification profiles are up to date. In addition, partner First Nation site reps support the JSMs, and help contact community members referred for a job or for an open training opportunity.
The JSM’s and Province, with support from Manitoba Hydro continue to work on what the AGE committee has identified as a key factor to increasing the partner First Nation workforce on the Project, which is reducing the number of job seekers who cannot be contacted. Several strategies are being used to ensure registration contact information is up to date such as: career counseling community based employment sessions and assisting with updating candidate profiles. Additional methods of contacting candidates have been used including: emails; cellular texts; phone calls during weekends, holidays and the time preferred by job seekers; Facebook postings; and Messenger texts. The Province in partnership with Manitoba Hydro and the JSMs has made every attempt to contact every partner First Nation member registered with the JRS to update their contact information.
In February 2018, partner First Nation job seekers, who had not previously worked at Keeyask, attended a two day Site Orientation session. To accommodate demand for the event, two separate sessions were held between February 5 to8 and February 12 to15. The 17 attendees had the opportunity to experience the Project first-hand, learned more about employment and training opportunities from the contractors, and found out what it is like living and working at Keeyask; Attending community members showed great interest in learning more about Keeyask and becoming employed on the Project Partner First Nations’ members have been given the opportunity to sign up to the Keeyask Engagement Project (KEP) Referral List. Maintained by the Province of Manitoba, the KEP Referral List identifies an individual’s current trade and level, and preferred trade(s) of interest. The KEP Referral List is distributed regularly to contractors to direct hire individuals into training and apprenticeship opportunities prior to posting a job order through the JRS. Use of the KEP Referral List for hiring has received positive reviews from both contractors and job seekers and has proven to be successful in identifying and filling training and apprenticeship positions in an expeditious manner.
The Keeyask Workplace Essential Skills Training (KWEST) Centre, was established onsite in August 2016The goal of KWEST is to provide new and existing workers access to skill development support, to enhance their capacity to participate in on-the-job training, to carry out workplace tasks effectively and efficiently, and to prepare for advanced training and employment opportunities. Essential skills assessment, administered by Workplace Education Manitoba, establishes the candidate’s development plan for the trade they are in or are interested in pursuing. The tool allows the trainer and student to address skill gaps through tutorials and small group sessions which are provided at the Centre. Contactors are also using the service to deliver targeted training in support of their skill development program for their workforce. Since its inception, KWEST has provided services to over 230 clients who have benefited from the support and ongoing instruction offered through KWEST.
The AGE has Community Engagement Sessions with the intent of attracting potential employees. Information is provided to community members regarding the Project’s camp
KEEYASK GENERATION PROJECT June 2018
SOCIO-ECONOMIC MONITORING PLAN ANNUAL REPORT
17
life, employment and on-the-job training opportunities. The events include the contractors who share company and job information, representatives from the JRS, Workplace Education Manitoba, and Apprenticeship Manitoba. These sessions were held throughout 2017-18 and were held in the partner First Nation communities as well as in Thompson, and Winnipeg. Job seekers were able to learn about employment and training opportunities at Keeyask, register with the JRS, participate in career planning, sign-up for essential skills upgrading speak with various contractor representatives and learn about what it means to be in the apprenticeship program.
6.1.8 TRAINING
On-the-job training programs were developed at site to hire individuals as trainees and apprentices and to enhance their qualifications for further career development. The programs offered during this reporting period were in the following areas:
• Catering, janitorial services and housekeeping
• Maintenance services
• Security services
• Emergency medical and ambulance services
• General civil contract
• Reservoir clearing
• Spillway and Intake gates, guides and hoists
As of March 31, 2018, 1379 Indigenous employees had participated in training opportunities on the Project (204 in OJT Programs); 584 of these were filled by partner First Nation members (122 in OJT Programs). Apprenticeship opportunities were available in trade classifications such as Mobile Crane Operators, Mechanics, Carpenters, Millwrights, Iron Workers, Plumbers & Pipefitters, Cement Masons, Electricians, Refrigeration Workers, and Red Seal Cooks.
6.2 BUSINESS OPPORTUNITIES
Project construction will present direct and indirect business opportunities locally, regionally and across the province as a whole. Business outcomes of Project construction are being tracked, with a particular focus on Indigenous and northern Manitoba business participation.
Direct impacts result from Project expenditures and include employment, purchases, and income generated by the Project. Indirect impacts refer to the employment, purchases and income created in other industries as the effects of Project expenditures work their way through the economy. For example, there are indirect impacts on businesses supplying materials and
KEEYASK GENERATION PROJECT June 2018
SOCIO-ECONOMIC MONITORING PLAN ANNUAL REPORT
18
equipment to companies in the direct impact segment. At the peak of the General Civil Contract, Key Person Interviews will be undertaken in Thompson, Gillam and each partner First Nation community to ascertain any indirect business opportunities that may be generated as a result of the Project.
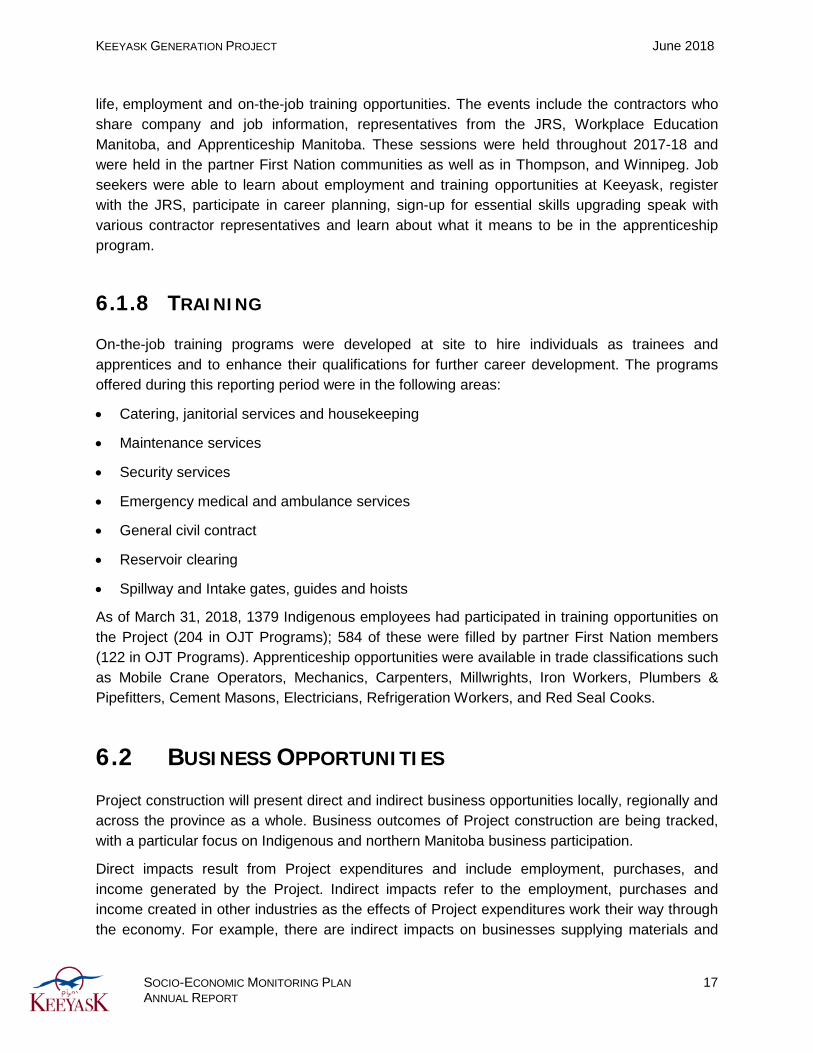
6.2.1 DIRECT PROJECT EXPENDITURES
There was $3,410.9 million spent on goods and services for the Project. Of this, $1,009.1 million were Manitoba purchases. Total northern Manitoba (Indigenous and non-Indigenous) purchases represent $672.1 million or 67 per cent of the total Manitoba purchases. This information reflects direct purchases of the Project for contractors and services. Indirect purchases made by contractors, in turn, would include purchases of goods and services from Manitoba based businesses.
The Figure below summarized the breakdown of total purchases to date.
Figure 5: Direct Purchases
6.2.2 INDIRECT BUSINESS OPPORTUNITIES SURVEY
With respect to indirect business effects, the KGP SEMP indicates that KPIs in Thompson, Gillam and each of the partner First Nation communities will be undertaken to ascertain any indirect business opportunities that may be generated as a result of the Project. KPIs are

KEEYASK GENERATION PROJECT June 2018
SOCIO-ECONOMIC MONITORING PLAN ANNUAL REPORT
19
complete in Thompson and Gillam. Manitoba Hydro and the partner First Nations have initiated discussions regarding the design and implementation of the KPIs in the partner First Nation communities.
6.2.3 DIRECT PARTNERSHIP BUSINESS OPPORTUNITIES SURVEY
As part of the JKDA, Manitoba Hydro and the partner First Nations committed to a series of business opportunities for the Project to negotiate as DNCs with partner First Nation businesses.
As of the end of March 2018, 18 DNCs for the Keeyask Project, ranging from camp services to heavy construction, have been awarded to the partner First Nations with a total value exceeding $500 million. DNCs with partner First Nation joint ventures include work undertaken on the following components of the Project:
Services (throughout Infrastructure and Generation projects)
• Catering & janitorial services
• Security services
• Camp maintenance services
• Employee retention & support services
• Emergency medical services
Infrastructure
• PR 280 Part 1 for Section 1
• North Access Road (Part A & B)
• Start-up camp and work areas site preparation
• Looking Back Creek bridge
• Work areas site development
Generation
• Southside containment dykes
• South Access Road
• Reservoir clearing
• Upstream and downstream boat Launches
• Reservoir spawning shoals
• Ellis Esker Winter Trail
KEEYASK GENERATION PROJECT June 2018
SOCIO-ECONOMIC MONITORING PLAN ANNUAL REPORT
20
In addition, there have also been four DNCs awarded to TCN for the Keeyask Transmission Project with a total value exceeding $75 million. DNCs have also been highly successful in providing significant employment opportunities for members of the partner First Nations.
A KPI program of key participants involved in management of the DNCs is underway to understand the role of partner First Nation businesses in implementation of the DNCs and how they contribute to building partner First Nation business capacity. As noted in the SEMP, this KPI program will be implemented again in year 8 of the construction phase. Results will be reported thereafter directly to the Partnership.
6.3 INCOME
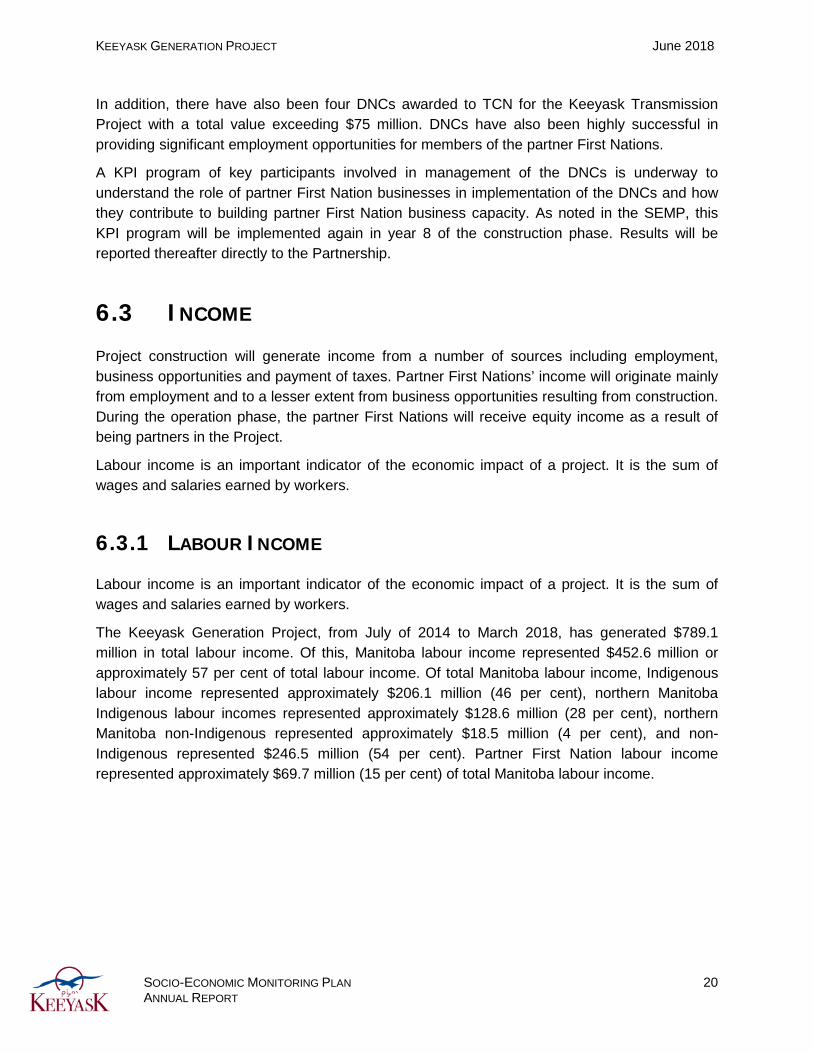
Project construction will generate income from a number of sources including employment, business opportunities and payment of taxes. Partner First Nations’ income will originate mainly from employment and to a lesser extent from business opportunities resulting from construction. During the operation phase, the partner First Nations will receive equity income as a result of being partners in the Project.
Labour income is an important indicator of the economic impact of a project. It is the sum of wages and salaries earned by workers.
6.3.1 LABOUR INCOME
Labour income is an important indicator of the economic impact of a project. It is the sum of wages and salaries earned by workers.
The Keeyask Generation Project, from July of 2014 to March 2018, has generated $789.1 million in total labour income. Of this, Manitoba labour income represented $452.6 million or approximately 57 per cent of total labour income. Of total Manitoba labour income, Indigenous labour income represented approximately $206.1 million (46 per cent), northern Manitoba Indigenous labour incomes represented approximately $128.6 million (28 per cent), northern Manitoba non-Indigenous represented approximately $18.5 million (4 per cent), and non-Indigenous represented $246.5 million (54 per cent). Partner First Nation labour income represented approximately $69.7 million (15 per cent) of total Manitoba labour income.
KEEYASK GENERATION PROJECT June 2018
SOCIO-ECONOMIC MONITORING PLAN ANNUAL REPORT
21
Figure 6: Labour Income3
3 Labour income is calculated based on information provided by contractors and Manitoba Hydro.
KEEYASK GENERATION PROJECT June 2018
SOCIO-ECONOMIC MONITORING PLAN ANNUAL REPORT
22
7.0 SOCIAL MONITORING
7.1 POPULATION
The KGP EIS predicted that the Project would not result in notable changes to the number of people in the partner First Nation communities and that there would not be many people moving into the communities because of Project construction. Similarly, Gillam was not predicted to see any substantial population growth as a result of Project-related construction and Thompson was also not expected to see any major construction-related population change.
However, accurately identifying the precise levels of in- and out-migration is difficult and the partner First Nations have noted that any in-migration to their communities could stress services already at capacity. Population is being monitored to confirm the extent of Project-induced migration in the partner First Nations communities and Gillam.
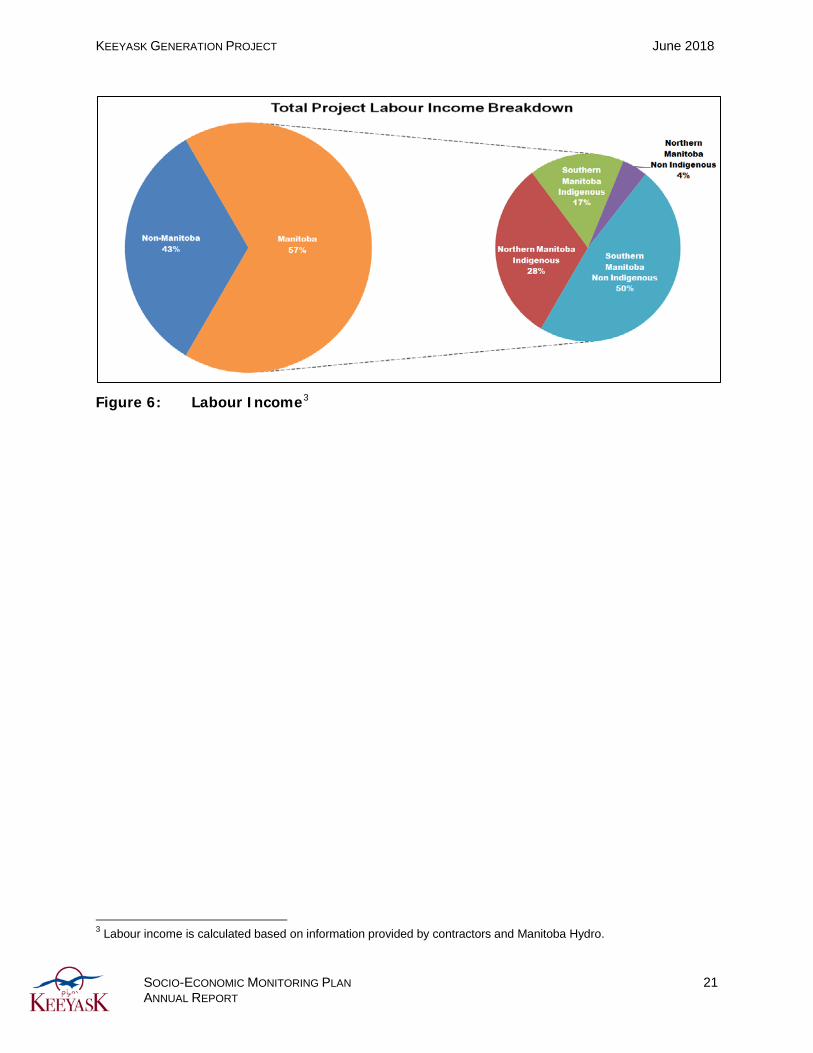
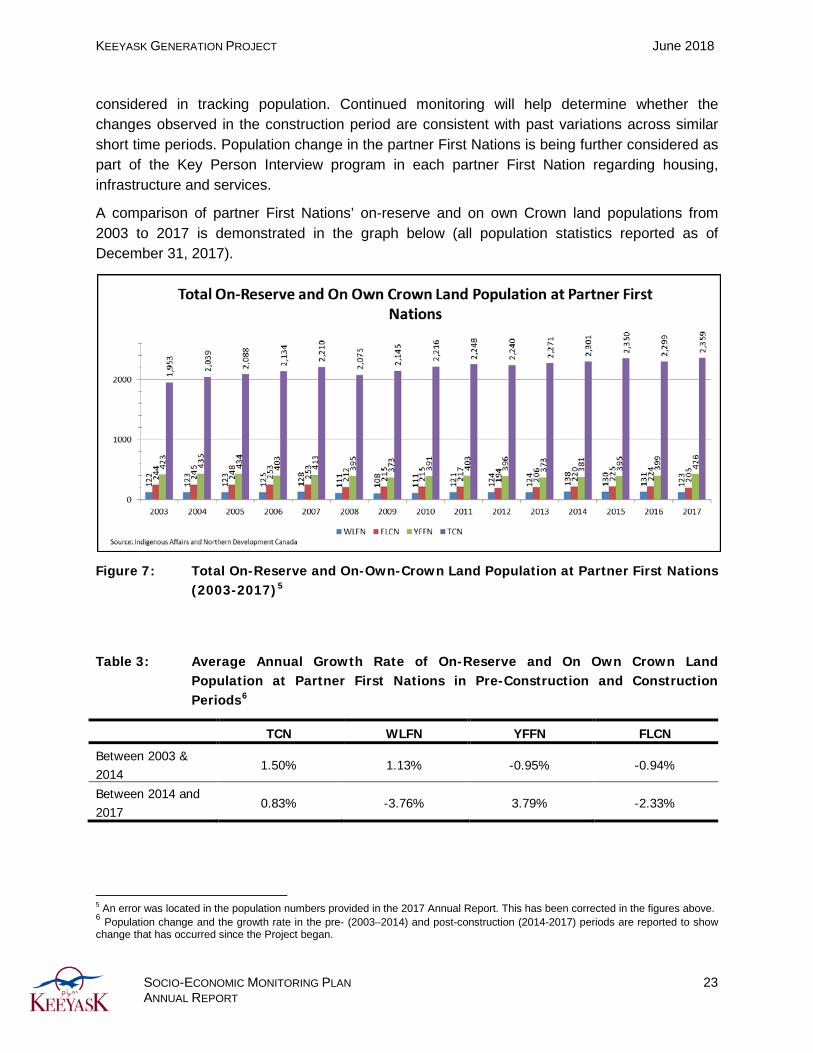
7.1.1 PARTNER FIRST NATION COMMUNITIES
The partnership has monitored the total on-reserve and on-own-Crown land4 populations of each of the partner First Nations. The total on-reserve and on-own-Crown land population of the partner First Nations represents the population assumed to be most likely to access housing, infrastructure and services on reserve. Members who reside off-reserve may still access band housing, infrastructure and services, particularly in the case of FLCN who has a number of members living in Gillam. One-time Key Person Interviews, reported on below, are also being conducted to identify any apparent Project effects on housing, infrastructure and services in the partner First Nations’ communities.
As shown in the Table below, data for the communities from 2003 to 2017 shows periods of moderate population growth as well as decline across years. Over this past reporting period, modest increases were observed in the TCN and YFFN populations, and modest decreases were observed in the WLFN and FLCN populations.
The changes in total population observed from 2016 to 2017 are consistent with the trends observed over time. While changes in the growth rates of all communities between the pre-construction and construction periods are observed, it is important to note that when looking at relatively small communities the addition or out-migration of a few families can result in what appears to be substantial changes in growth rates. That is why trends over multiple years are
4 On-Own-Crown lands are those lands not classified as reserve lands but Crown Lands that have been assigned to a particular Band. Population monitoring is based on data from Indigenous and Northern Affairs Canada (INAC), from December 31, 2003 to December 31, 2017. INAC tracks First Nations population data for a number of categories including on-reserve, off-reserve, on-own-Crown land, on no Band Crown land, and on another Band Crown Land.
KEEYASK GENERATION PROJECT June 2018
SOCIO-ECONOMIC MONITORING PLAN ANNUAL REPORT
23
considered in tracking population. Continued monitoring will help determine whether the changes observed in the construction period are consistent with past variations across similar short time periods. Population change in the partner First Nations is being further considered as part of the Key Person Interview program in each partner First Nation regarding housing, infrastructure and services.
A comparison of partner First Nations’ on-reserve and on own Crown land populations from 2003 to 2017 is demonstrated in the graph below (all population statistics reported as of December 31, 2017).
Figure 7: Total On-Reserve and On-Own-Crown Land Population at Partner First Nations (2003-2017)5
Table 3: Average Annual Growth Rate of On-Reserve and On Own Crown Land Population at Partner First Nations in Pre-Construction and Construction Periods6
TCN WLFN YFFN FLCN
Between 2003 & 2014
1.50% 1.13% -0.95% -0.94%
Between 2014 and 2017
0.83% -3.76% 3.79% -2.33%
5 An error was located in the population numbers provided in the 2017 Annual Report. This has been corrected in the figures above. 6 Population change and the growth rate in the pre- (2003–2014) and post-construction (2014-2017) periods are reported to show change that has occurred since the Project began.
KEEYASK GENERATION PROJECT June 2018
SOCIO-ECONOMIC MONITORING PLAN ANNUAL REPORT
24
7.1.2 TOWN OF GILLAM
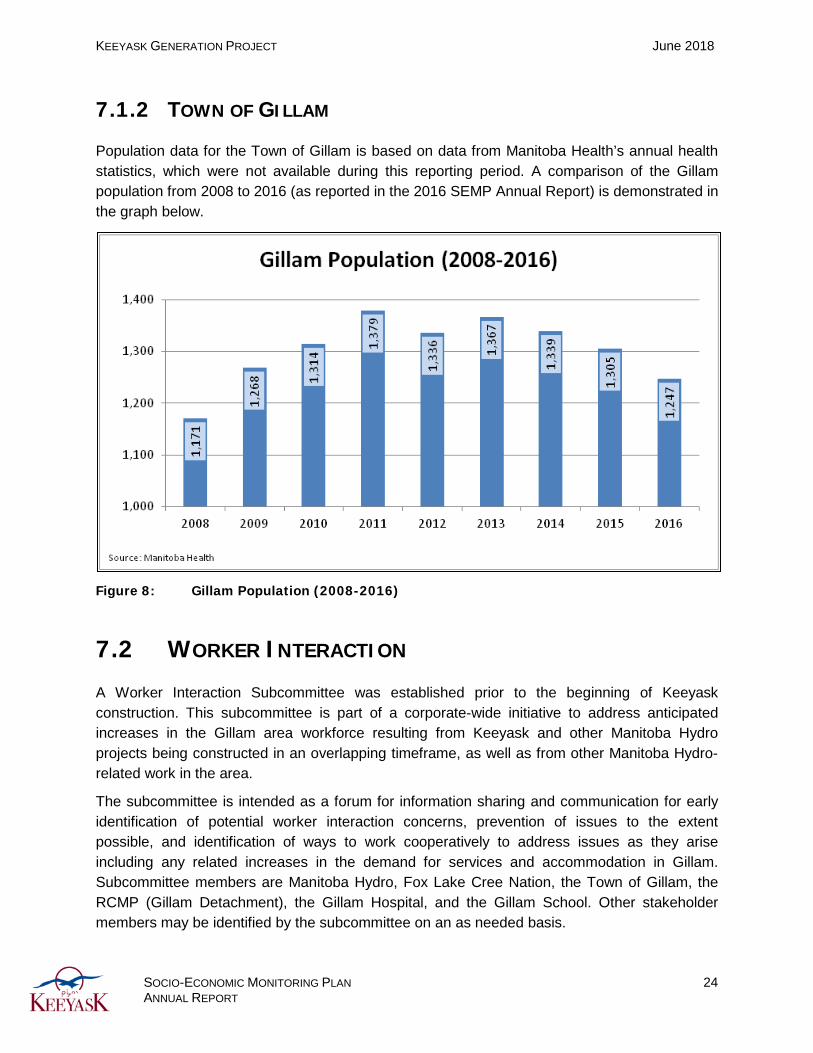
Population data for the Town of Gillam is based on data from Manitoba Health’s annual health statistics, which were not available during this reporting period. A comparison of the Gillam population from 2008 to 2016 (as reported in the 2016 SEMP Annual Report) is demonstrated in the graph below.
Figure 8: Gillam Population (2008-2016)
7.2 WORKER INTERACTION
A Worker Interaction Subcommittee was established prior to the beginning of Keeyask construction. This subcommittee is part of a corporate-wide initiative to address anticipated increases in the Gillam area workforce resulting from Keeyask and other Manitoba Hydro projects being constructed in an overlapping timeframe, as well as from other Manitoba Hydro-related work in the area.
The subcommittee is intended as a forum for information sharing and communication for early identification of potential worker interaction concerns, prevention of issues to the extent possible, and identification of ways to work cooperatively to address issues as they arise including any related increases in the demand for services and accommodation in Gillam. Subcommittee members are Manitoba Hydro, Fox Lake Cree Nation, the Town of Gillam, the RCMP (Gillam Detachment), the Gillam Hospital, and the Gillam School. Other stakeholder members may be identified by the subcommittee on an as needed basis.
KEEYASK GENERATION PROJECT June 2018
SOCIO-ECONOMIC MONITORING PLAN ANNUAL REPORT
25
The subcommittee met three times in 2017-18 to continue monitoring and discussing areas of community interest regarding potential Project impacts on the residents. Regular subcommittee meetings and ongoing communications, along with a system to track specific community concerns and incidents, facilitated action to address members’ concerns related to public safety, community services and infrastructure. Topics addressed in this forum include local road conditions and traffic safety, use of Gillam services and facilities, the behaviour of non-local persons, and the presence of drugs in the Gillam area.
In addition, the subcommittee continued to monitor updates provided by service providers such as the Gillam Hospital and the Gillam RCMP to understand changing demands for health services and on policing. Given privacy requirements in data collection as well as the various developments taking place in the area over the period, it was not always possible to link concerns or demands for services to specific projects.
Examples of activities undertaken during 2017-2018 in relation to concerns and topics raised at the subcommittee include:
• “PR 280/PR 290 Task Force” transportation management plan, developed to reduce the impacts of Project traffic on the road;
• Hiring a Nurse Practitioner to provide onsite health care services at the Keeyask site and reduce non-urgent visits by Project workers to the Gillam hospital;
• Revisions to the Drug and Alcohol standard to enhance workplace safety, reduce unnecessary leaves or removals and expand treatment options to include community based treatment and recreational drug education programs;
• Relocation of contractor charters from Gillam to Thompson, in part, to address congestion and flight schedule issues at the Gillam airport; and
• FLCN’s continued implementation of cultural awareness training for short-term contractors.
The information provided by subcommittee members will continue to be used to assist in identifying potential adaptive measures to reduce the impacts of hydroelectric development in the region.
7.3 HOUSING, INFRASTRUCTURE AND SERVICES
The KGP EIS anticipated little new demand for housing in the partner First Nation communities and in Gillam during Project construction. Minimal effects on infrastructure and services in the partner First Nations were also expected.
One-time KPIs will take place during Project construction to identify any apparent Project effects on housing or infrastructure and services in the partner First Nations’ communities. Discussions regarding design and implementation are underway with both TCN and WLFN and interviews have been completed by FLCN and YFFN. Manitoba Hydro and FLCN continue to work

KEEYASK GENERATION PROJECT June 2018
SOCIO-ECONOMIC MONITORING PLAN ANNUAL REPORT
26
together to summarize the findings related to their community. The KPIs completed by YFFN documented the following changes observed in population, infrastructure and services in the community:
• While there were differing perspectives on in-migration levels at York Landing, an increase in requests to transfer to YFFN band membership in order to take advantage of the employment preferences at Keeyask was reported. No substantial out-migration was reported.
• Demand for housing has increased since 2012 however the average number of individuals living in a dwelling has decreased. The availability of housing continues to be the main factor influencing population in York Landing.
• An increase in demand for childcare was reported.
• The effect of hydroelectric development on water quality is an ongoing concern for members.
• Alcohol and drug use in the community is a growing concern. There is a desire for increased enforcement as well as increased resources for substance abuse prevention and treatment initiatives within the community.
• The Project has created challenges for recruiting and retaining qualified staff in the community.
The KPIs also noted that an increase in wage employment has been a positive Project effect for YFFN families and a decrease in the amount of income assistance in the community has been observed. However, the KPIs also identified barriers to employment for YFFN Members as well as concerns regarding the lack of employment opportunities at Keeyask beyond entry level positions.
One acknowledged limitation of the interview program is the difficulty in separating out effects from Keeyask and those resulting from other sources. Discussions regarding many of the key findings are underway at forums related to the Project. For example, programming to address barriers to employment has been an area of focus at the AGE. YFFN and Manitoba Hydro have begun bi-lateral discussions on concerns related to drug and alcohol use and prevention of sexual exploitation (see Social Mitigation). Information related to the effects of non-local construction workers on the demand for infrastructure and services in Gillam is also available and has been discussed at the Gillam Worker Interaction Subcommittee.
KEEYASK GENERATION PROJECT June 2018
SOCIO-ECONOMIC MONITORING PLAN ANNUAL REPORT
27
7.4 TRANSPORTATION INFRASTRUCTURE, TRAVEL, ACCESS AND SAFETY
While the EIS predicted that existing transportation networks and plans for PR 280 upgrades would be able to accommodate the changes in road use associated with Project construction, community concerns remain regarding traffic safety and road conditions.
In response to community concerns, the Province, which is responsible for maintenance and upgrades to PR 280, established the PR 280 Joint Advisory Committee in the fall of 2014. The committee is comprised of representatives from the Province of Manitoba, Manitoba Hydro, the Town of Gillam and the partner First Nations’ communities to involve the latter directly in the planning of upgrades to PR 280. In the period between April 2017 and March 2018, the PR 280 Joint Advisory Committee met twice, in April and May of 2017.
A number of mitigation measures have been adopted to reduce the impact of Project traffic on PR 280 including road reconstruction and increased maintenance efforts, operation of the PTH 6 weigh station near Thompson, and communicating driver expectations to contractors in an effort to promote appropriate driving behavior on PR 280.
In the fall of 2016, Manitoba Hydro developed a comprehensive transportation management plan to reduce the impacts of Project traffic on PR 280. The plan includes pre-hauling construction materials to site during the winter months, night hauling, reductions in Manitoba Hydro truck traffic and reductions in truck weights during periods when the road has deteriorated substantially. The plan will help reduce wear and tear on the road and allow MI to focus on areas requiring increased maintenance, monitoring stations have seen increased traffic levels in the 2017/2018 winter months to support this.
Manitoba Hydro, in collaboration with Manitoba Public Insurance (MPI) and the RCMP will continue to monitor traffic volumes, speeds, and vehicle types on PR 280 and PR 290 in 2017/18.
7.4.1 TRAFFIC VOLUMES
Traffic volume data is typically collected by MI every two years. Traffic data for PR 280 is divided into three segments: PR 391 to Split Lake, Split Lake to the PR 280/PR 290 intersection, and PR 280/ PR 290 intersection to Gillam. Use of PR 280 and PR 290 has steadily increased since 2003. A larger increase in use has been observed since the start of construction on the Project, as anticipated.
To better understand traffic patterns during construction, Manitoba Hydro worked with MI to have five, permanent traffic counters installed on PR 280 and PR 290. The segment of PR 280 with the highest traffic volumes is between PR 391 and Split Lake where from April 2017 to
KEEYASK GENERATION PROJECT June 2018
SOCIO-ECONOMIC MONITORING PLAN ANNUAL REPORT
28
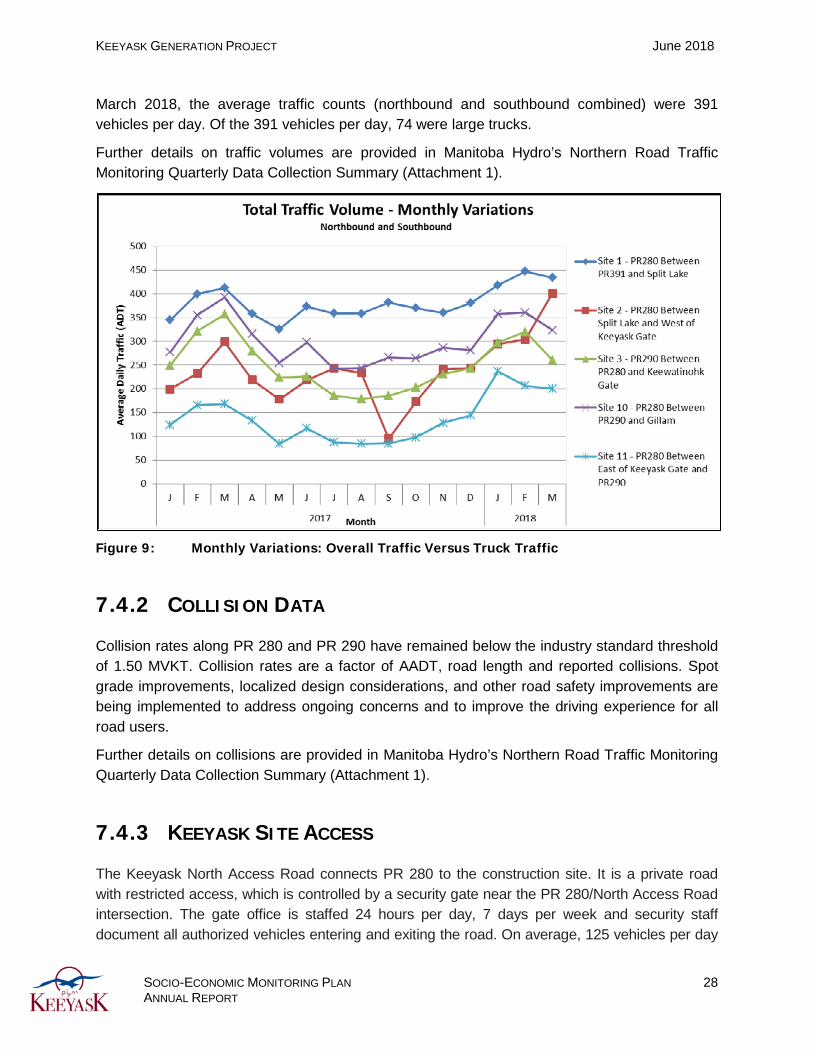
March 2018, the average traffic counts (northbound and southbound combined) were 391 vehicles per day. Of the 391 vehicles per day, 74 were large trucks.
Further details on traffic volumes are provided in Manitoba Hydro’s Northern Road Traffic Monitoring Quarterly Data Collection Summary (Attachment 1).
Figure 9: Monthly Variations: Overall Traffic Versus Truck Traffic
7.4.2 COLLISION DATA
Collision rates along PR 280 and PR 290 have remained below the industry standard threshold of 1.50 MVKT. Collision rates are a factor of AADT, road length and reported collisions. Spot grade improvements, localized design considerations, and other road safety improvements are being implemented to address ongoing concerns and to improve the driving experience for all road users.
Further details on collisions are provided in Manitoba Hydro’s Northern Road Traffic Monitoring Quarterly Data Collection Summary (Attachment 1).
7.4.3 KEEYASK SITE ACCESS
The Keeyask North Access Road connects PR 280 to the construction site. It is a private road with restricted access, which is controlled by a security gate near the PR 280/North Access Road intersection. The gate office is staffed 24 hours per day, 7 days per week and security staff document all authorized vehicles entering and exiting the road. On average, 125 vehicles per day

KEEYASK GENERATION PROJECT June 2018
SOCIO-ECONOMIC MONITORING PLAN ANNUAL REPORT
29
used the road between April 2017 and March 2018. This is higher than in past years, reflecting the peak construction period and large workforce.
Traffic counts from the monitoring station located at PR 280 Site 2, which is the closest station to the Keeyask North Access Road, allows construction related traffic to be compared to the overall traffic on PR 280. Over the past year, these two sets of traffic counts indicate that the percentage of Keeyask related construction traffic varies monthly and accounts for 37% to 61% of all traffic on PR 280 near the PR 280/Keeyask North Access Road intersection.
7.5 CULTURE AND SPIRITUALITY
Since the start of construction, various measures were put in place to support the retention of northern and Indigenous employees at the job site, and to ensure that sensitivity and respect for local culture is maintained throughout construction of the Project. These measures include orientation sessions for partner First Nation members, on-site Indigenous Awareness Training for employees voluntary counseling services and cultural ceremonies marking key construction activities.
7.5.1 INDIGENOUS AWARENESS ACTIVITIES AND RETENTION
SUPPORT PROGRAMS
Since the start of construction, various measures were put in place to support the retention of northern and Indigenous employees at the job site, and to ensure that sensitivity and respect for local culture is demonstrated throughout construction of the Project. These measures include establishing the Employment Retention and Support (ERS) Services contract where scope was developed jointly with the Fox and York Keeyask Joint Venture who endeavored to include all partner First Nations’ interests. The ERS contractor began delivery of services during the Keeyask Infrastructure Project and continued into the Generating Station Project. Services include orientation sessions for partner First Nation Members, on-site Indigenous awareness training for employees, voluntary counseling services, and cultural ceremonies marking key construction activities.
7.5.1.1 PARTNER FIRST NATION MEMBERS ORIENTATION
The purpose of these orientation sessions, delivered in the communities prepare partner First Nations’ members for the construction camp experience and enhance their prospects of achieving the benefits from employment on the Project. The focus is on key factors that affect the economy, culture and social conditions of each community. This includes the historical and ongoing effects of hydro development and relationships with Manitoba Hydro
KEEYASK GENERATION PROJECT June 2018
SOCIO-ECONOMIC MONITORING PLAN ANNUAL REPORT
30
7.5.1.2 INDIGENOUS AWARENESS TRAINING
On-site training workshops are provided for staff working at the Keeyask site. One hundred and sixty-three (163) training workshops were held in the past fiscal year, with 2756 participants. The purposes of training workshops are to:
• increase understanding and appreciation of the cultural differences, beliefs and values of individuals within the various parties/communities working at the site;
• enhance comfort in living, working and/or doing business in a culturally diverse environment;
• identify barriers and issues between the various parties working at the site;
• identify common goals;
• develop strategies and action plans for addressing issues/barriers, reaching common goals and developing and maintaining long-term harmonious relationships;
• increase participants’ understanding of contemporary issues facing Indigenous peoples;
• challenge participants to re-think their assumptions and personal biases about Indigenous peoples;
• provide participants with information that will promote understanding and respect of Indigenous cultures, enabling participants to work effectively with Indigenous peoples; and
• increase participants understanding of what a harassment free work environment means what each individuals’ responsibilities are to maintain a work environment that is safe for all.
7.5.1.3 ON-SITE COUNSELING
On-site counseling is available to help all employees, on a voluntary basis, to deal with any issues experienced while working on the Project. This could include, work adjustment problems, vocational/career issues, cultural adjustments, family stresses, money management, and alcohol and narcotics anonymous. The intent is to reduce attrition for all Project workers, but particularly for Northern Indigenous workers of Cree heritage, by assisting them in dealing with challenges directly affecting their work performance.
7.5.1.4 CULTURAL SITE CEREMONIES
Site ceremonies are being held at key construction milestones to help mitigate the effect of the Project on partner First Nations’ culture, and to demonstrate respect for the land and all that is supported by the land. Attendance at ceremonies is welcome and voluntary, and consists of various community members at large and staff of the contractors and Manitoba Hydro. Between April 2017 and March 2018, there were eight ceremonies held including spring ceremony, Elders dinner, sturgeon ceremony, spillway structure blessing, National Aboriginal day celebration, release of sturgeon fingerlings prayer and tobacco offering.

KEEYASK GENERATION PROJECT June 2018
SOCIO-ECONOMIC MONITORING PLAN ANNUAL REPORT
31
7.5.1.5 SWEAT LODGE
As a result of the Keeyask Workplace Culture Assessment (KWCA), a sweat lodge and teepee area was set up at Keeyask in September 2017. Since that time numerous sweat lodge ceremonies have been held which accommodate both night and day shift workers. The sweat lodge is a circular, dome-shaped structure used for many purposes in Indigenous culture. Through ceremonies, it offers a way of clearing, cleaning and freeing obstacles, obstructions and blockages to healing and well-being. During a purification ceremony, participants talk with and listen to the Creator and Grandfathers and Grandmothers for guidance. There are similarities between the physical body and the sweat lodge. Your skin is like the sweat lodge cover; ribs are like the willows; heart beat is like the drumming; songs are your life lived.
7.5.1.6 SITE LIAISON
The Site Liaison team consists of the Site Liaison Lead, two liaison officers and a partner First Nation site representative from each of the communities (Fox Lake Cree Nation, York Factory First Nation, Tataskweyak Cree Nation and War Lake First Nation) The Liaison team supports local community stakeholder management including collaboration with the four Keeyask Cree Nations and the site contractors with a high emphasis on employment & training opportunities, as well as cultural activities. The team also works very close with the ERS team where the focus has been on providing support to all Keeyask workers.
The Site Reps reached full complement in 2017. Over the past year, site liaison staff has been working closely with the Site Reps to engage community members in employment and training, working closely with community JSMs, and to facilitate improved communication with workers at site.
Site Liaison has been very active in 2017 with the Keeyask Committees. Site meetings are coordinated and attended for the Construction Advisory Committee and quarterly participation with the Advisory Group on Employment. Liaison representatives also participate with the Monitoring Advisory Committee open houses, where updates on environmental monitoring activities are provided to the four partner First Nations.
Keeyask Site tours continue to be popular as the Project gains momentum and employment/training opportunities and initiatives increase. A variety of individuals and stakeholder groups have expressed interest in coming to site to learn about Keeyask. Requests for site tours came in a variety of forms: schools and training centres in northern Manitoba, members of the partner First Nations, Project committees, and various Manitoba Hydro departments. Forty-seven tours were conducted with 333 visitors at site.
Liaison has played a key role in the delivery of the community engagement sessions; where the intent is to share information with community members regarding camp life, employment and on the job training opportunities for the Project. The participants include the Keeyask Contractors who share company information and job information, representatives from the Job Referral Service (JRS), Workplace Education Manitoba, and Apprenticeship Manitoba.

KEEYASK GENERATION PROJECT June 2018
SOCIO-ECONOMIC MONITORING PLAN ANNUAL REPORT
32
The Site Liaison Team continues to be an essential resource to producing all deliverables and tactics within the Keeyask Project Manager Communications Plan. The team assists with all communications and logistics needed at site to ensure success.
7.6 SOCIAL MITIGATION
7.6.1 RESPONDING TO COMMUNITY CONCERNS
Over this past year, concerns have been raised by the partner First Nations that the Keeyask Project has contributed to an increase in the presence and use of drugs and alcohol in the region: including at the Project site and at the community level. The Drug and Alcohol program at Keeyask provides the ability for treatment where addiction is present. The treatment for addiction not only supports a safe working environment but also improves the lives of these individuals and their families. Manitoba Hydro and each of the partner First Nations have had discussions on what supports can be provided at the community level to mitigate any potential increase in drugs and alcohol associated with the Project. These discussions will be ongoing.
The partner First Nations have also raised concerns regarding possible cases of sexual exploitation at the Keeyask site, as well as at the community level. Discussions have subsequently occurred with provincial representatives working in the field of sexual exploitation prevention to discuss what supports can be provided at the Keeyask site and within communities to address concerns about sexual exploitation. This includes discussion around training and communication materials for the Project site, and possible programming options at the community level.
7.6.2 KEEYASK WORKPLACE CULTURE
The KHLP is committed to creating a respectful workplace culture for all employees at the Keeyask site. Achieving this goal is the responsibility of everyone involved in the Keeyask Project. In the fall of 2016 a consultant was contracted by the KHLP Board to independently review the Keeyask site’s workplace culture. This was in part to address discrimination and harassment concerns, and to provide recommendations that would support creating a better work environment.
The independent Keeyask Workplace Culture Assessment (KWCA) confirmed that discrimination and harassment exist at Keeyask and that all parties need to implement measures to create a more respectful, positive work environment. The KWCA included 64 recommendations aimed towards improving workplace culture at Keeyask and to reduce incidents of discrimination and harassment. Efforts are underway to drive a positive culture change at site. These efforts not only focus on implementation, where feasible, of the spirit and
KEEYASK GENERATION PROJECT June 2018
SOCIO-ECONOMIC MONITORING PLAN ANNUAL REPORT
33
intent of the KWCA recommendations, but also on activities that go beyond the KWCA recommendations.
In an on-going effort to create and maintain a respectful and positive Project site, the Harassment and Discrimination Free Standard (previously title Respectful Workplace Standard) was revised in 2017. The revisions will assist in creating a workplace culture that is positive, respectful, and free of harassment, sexual harassment and discrimination for all who attend the Project site. Key revisions to the Standard included a clearer definition of what is sexual harassment, guidance regarding social media/electronic media based harassment, and enhancements to the process of filing a claim and post investigation follow-up with the claimant. In addition, the Standard now allows individuals filing a complaint to identify a ‘Trusted Advisor’ to participate with them in the process.
A Keeyask Respect Campaign has been, and will continue to be, rolled out at site to encourage positive interactions among all Project workers. The Campaign is intended to be a positive campaign focusing on the things all employees have in common as human beings. Its intent is to encourage positive interactions among all workers at site, and to reinforce the idea that everyone at site is part of the Keeyask team and valuable and important to the Project. The Respect Campaign has a different focus than the Aboriginal awareness training, and is intended to be complimentary to that separate and very important initiative.
A development and mentorship program has been developed by BBE (in collaboration with partner First Nations’ Site Representatives and Manitoba Hydro), and is currently being piloted on-site with their partner First Nations’ workforce. The program includes a development planning and performance review process, as well as talent assessments to ensure that those employees demonstrating technical and leadership abilities are paired with mentors to assist in their career development over time.
In addition to the above, online resources are being developed to assist potential employees interested in working at Keeyask (and their families) to gain an understanding of the camp rules and life at Keeyask to help prepare them for success when they arrive at the worksite.

KEEYASK GENERATION PROJECT June 2018
SOCIO-ECONOMIC MONITORING PLAN ANNUAL REPORT
34
8.0 MERCURY AND HUMAN HEALTH Mercury is a metal found naturally in small amounts in rock, soil, water, living organisms, as well as in manufactured products. Flooding of soil or wetlands commonly results in a temporary increase in mercury and its organic form, methylmercury. Methylmercury is taken up by the organisms that live in and use those environments. The vast majority of mercury exposure to people occurs through the consumption of fish. When fish high in mercury are eaten, particularly large and long-lived predatory fish, there is a potential for a negative effect on human health. There is also a potential for a negative effect on health and wellness if people substantively limit their consumption of healthy fish due to a fear of mercury.
As a result of past experience with hydroelectric development, the partner First Nations raised the issue of mercury and human health as a primary concern in relation to the Project. Potential impacts and mercury and human health risk management and wellness enhancement strategies have been the subject of considerable study and long-term planning by the Partnership.
Because Project effects of mercury in the reservoir, and to a lesser extent in Stephen’s Lake, are predicted to occur post-flooding, the majority of related monitoring will occur in the operation phase. Mercury levels in fish from Gull Lake are expected to peak three to seven years after impoundment and then to decline over the next 20 to 30 years until they reach pre-Project levels or stable concentrations.
The Partnership has prepared a Mercury and Human Health Risk Management Plan in consultation with provincial and federal regulators. The plan includes:
• Monitoring of mercury in fish, wildlife, plants;
• Voluntary hair sampling and wild foods survey of First Nation community members;
• Human health risk assessments; and
• A communication strategy for partner First Nation communities, Gillam, and other users of fish in affected waterbodies.
The goals of the risk management plan are: to support discussion and build understanding around mercury and fish; to allow individuals and families to confidently assess and manage the benefits and risks associated with eating wild fish in the Project area; to support and enhance local practices of fishing for sharing and eating wild fish at levels that are healthy for all community members. The Mercury and Human Health Implementation Group (composed of the partner First Nations, Manitoba Hydro, and provincial and federal health specialists) is responsible to implement risk management activities. This year’s key activities included: updating fish consumption guidance (communication products) to reflect recent fish monitoring results; hiring mercury community coordinators in each of the partner First Nations; work to retain a and a consultant to undertake hair monitoring and food surveys, and preparing for community-based risk management activities.
KEEYASK GENERATION PROJECT June 2018
SOCIO-ECONOMIC MONITORING PLAN ANNUAL REPORT
35
APPENDIX 1: NORTHERN ROAD TRAFFIC MONITORING QUARTERLY DATA COLLECTION SUMMARY
APRIL 2018
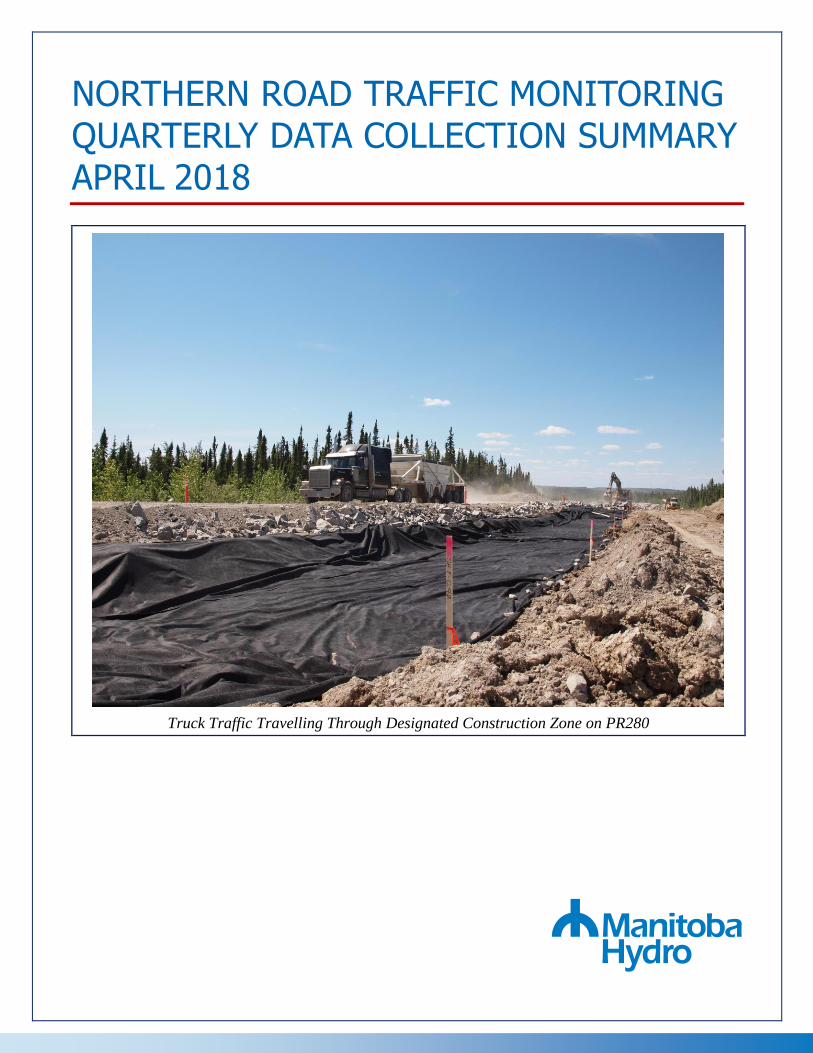
NORTHERN ROAD TRAFFIC MONITORING QUARTERLY DATA COLLECTION SUMMARY APRIL 2018
Truck Traffic Travelling Through Designated Construction Zone on PR280

© 2016 Manitoba Hydro. All Rights Reserved. Page 2
Table of Contents
ABLE OF CONTENTS ............................................................................................................................................2
EXECUTIVE SUMMARY ......................................................................................................................................3
BACKGROUND .......................................................................................................................................................4
TRAFFIC STUDY ..................................................................................................................................................... 4
TRAFFIC MONITORING STATIONS ........................................................................................................................ 4
DATA COLLECTION PROCESSES ....................................................................................................................5
TRAFFIC VOLUME DATA ....................................................................................................................................... 5
SPEED DATA ........................................................................................................................................................... 6
COLLISION DATA ................................................................................................................................................... 6
DATA COLLECTION RESULTS .........................................................................................................................7
HISTORIC DATA ..................................................................................................................................................... 7
CURRENT DATA ..................................................................................................................................................... 8
RESULTS ............................................................................................................................................................... 20
APPENDIX A – TRUCK TRAFFIC VS TOTAL TRAFFIC .............................................................................21
APPENDIX B – MONTHLY TRAFFIC COUNTS ............................................................................................23
APPENDIX C – COLLISION SUMMARY .........................................................................................................26
APPENDIX D – TRAFFIC MONITORING LOCATIONS ..............................................................................27
© 2016 Manitoba Hydro. All Rights Reserved. Page 3
Executive Summary
Construction-related activities associated with the development of the Keeyask Project, Keewatinohk Converter Station Project and Bipole III Transmission Project (BPIII) has generated additional traffic on various segments of the Provincial Road (PR) network, in particular, on PR 280 and PR 290. Three types of traffic are being realized - local traffic, workforce traffic, and traffic generated from shipping materials and equipment for both local and site specific needs. While the Environmental Impact Statements (EIS) for both the Keeyask and BPIII Projects predicted that existing transportation networks and plans for PR 280 upgrades would be able to accommodate the changes associated with Project construction, community concerns remain regarding traffic safety and road conditions. Manitoba Infrastructure (MI) is responsible for the existing provincial highway system, including maintenance and upgrades to PR 280 and PR 290. Monitoring efforts are being undertaken with information from MI, Manitoba Public Insurance (MPI), and the Keeyask and Keewatinohk site access gates to assess EIS predictions and respond to community concerns. Traffic monitoring stations have been installed at five locations on PR 280 and PR 290. MI installed the stations in 2015 with funding provided by Manitoba Hydro (MH) and MI provides ongoing maintenance of the equipment. MI collects the data from the stations and submits the information on a monthly basis to MH. Traffic data collected to date shows an increase in traffic volumes at all monitoring stations, however, these additional traffic volumes still remain within the roadway design tolerances.
© 2016 Manitoba Hydro. All Rights Reserved. Page 4
Background
Traffic Study The Environmental Impact Statements (EIS) for both the Keeyask Project and the Bipole III Transmission Project (BPIII) contain requirements for continual traffic monitoring throughout the lifespan of these Projects. In addition, concerns from local communities have increased the need for a comprehensive traffic monitoring program. MH developed a program based on the monitoring requirements for the Projects which includes five traffic counters on PR 280 and PR 290 as shown on the Traffic Monitoring Locations Map in Appendix D. These traffic counters along with the data from the Keeyask and Keewatinohk Converter Station site access gates will help provide an understanding of traffic patterns in the area. PR 280 and PR 290 are provincial roads that fall under MI jurisdiction. The Conawapa Access Road, which begins at the east end of PR 290 near the Limestone Generating Station, is a MH privately owned roadway. A security gatehouse is installed along the Conawapa Access Road to limit access to construction traffic only during the construction of the Keewatinohk Converter Station. A security gatehouse is also installed on the North Access Road to control traffic accessing the Keeyask site; this road is also privately owned. The security gates are staffed 24 hours per day, 7 days per week and staff document all vehicles that enter and exit the Project sites. The anticipated increase in traffic volumes on PR 280 and PR 290 are not expected to exceed the current design rating for these roads. Localized upgrades were recommended to address safety concerns and improve reliability. Continuous monitoring of traffic volumes on these roads was recommended by two separate engineering studies.
Traffic Monitoring Stations Typically, traffic volumes on provincial roads are monitored through the Manitoba Highway Traffic Information System (MHTIS) which is a partnership between MI and the University of Manitoba Transport Information Group (UMTIG). PR 280 and PR 290 are monitored biennially using temporary coverage traffic count stations. Coverage count stations are short-term traffic count stations where sites within Manitoba are surveyed on a three-year cycle (a two-year cycle was used for PR 280 and PR 290).
MH has worked closely with MI to acquire detailed traffic information on these roads during construction of the BPIII and Keeyask Projects. During the summer of 2015, MI installed permanent traffic monitoring stations at Sites 1, 2 and 3 (see Figure 1). The installation of the permanent monitoring stations at Sites 10 and 11 was delayed until the fall of 2015 as there was ongoing road work underway in the area. To create efficiencies and to have consistent monitoring and data outputs, all five monitoring locations were consolidated in late 2015 to have monitoring data compiled by MI on a monthly basis. Data from all five sites has been consistently collected since the fall of 2015. Refer to Appendix D for a map of the traffic monitoring station locations.

© 2016 Manitoba Hydro. All Rights Reserved. Page 5
Data Collection Processes
Traffic Volume Data Monitoring Stations On-going compilation of data from the five permanent monitoring stations is completed monthly by MI personnel. The data is reviewed and formatted then forwarded to MH. The induction loops are able to differentiate various vehicle types based upon axle count and spacing. Vehicle classifications have been grouped into small, medium and large vehicles as shown in Figure 2.
Figure 1 – Site 1 Traffic Monitoring Station
Site Gates In addition to the physical traffic monitoring stations described above, security gates on the North Access Road into Keeyask and on the Conawapa Access Road into Keewatinohk are collecting data on all vehicles entering the sites. Security personnel located at the gates track the type (see Figure 2) and number of vehicles that enter and leave the sites.
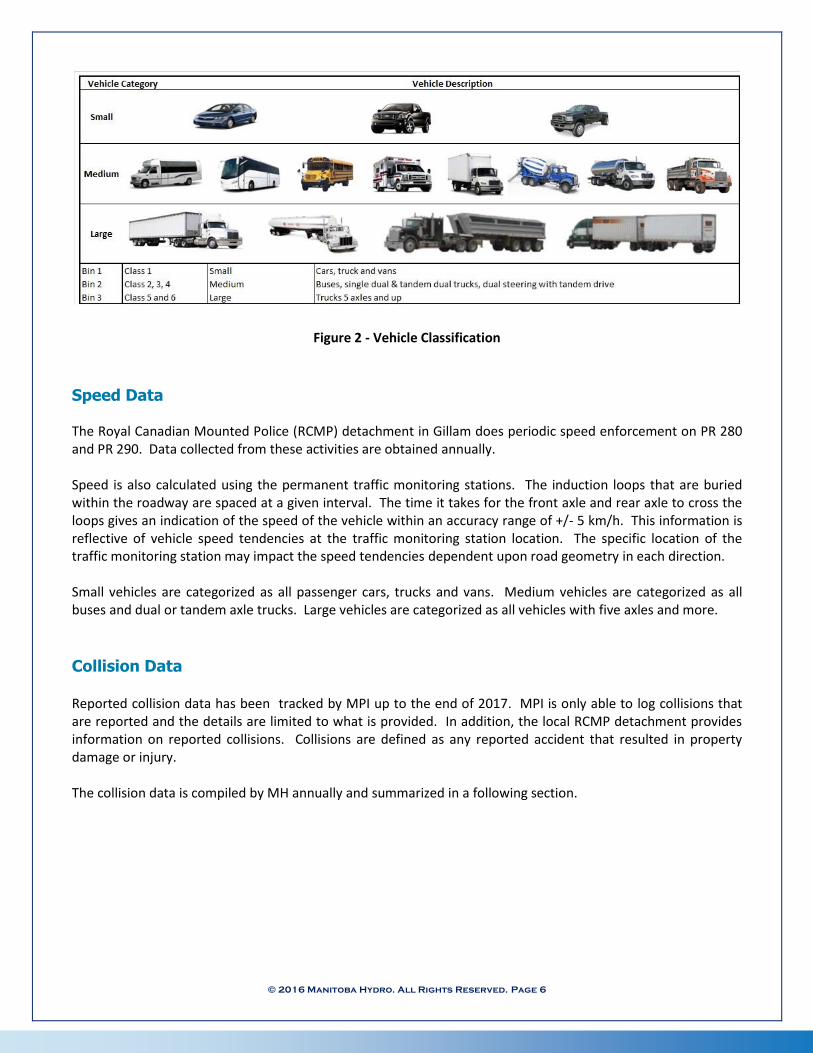
© 2016 Manitoba Hydro. All Rights Reserved. Page 6
Figure 2 - Vehicle Classification
Speed Data The Royal Canadian Mounted Police (RCMP) detachment in Gillam does periodic speed enforcement on PR 280 and PR 290. Data collected from these activities are obtained annually. Speed is also calculated using the permanent traffic monitoring stations. The induction loops that are buried within the roadway are spaced at a given interval. The time it takes for the front axle and rear axle to cross the loops gives an indication of the speed of the vehicle within an accuracy range of +/- 5 km/h. This information is reflective of vehicle speed tendencies at the traffic monitoring station location. The specific location of the traffic monitoring station may impact the speed tendencies dependent upon road geometry in each direction. Small vehicles are categorized as all passenger cars, trucks and vans. Medium vehicles are categorized as all buses and dual or tandem axle trucks. Large vehicles are categorized as all vehicles with five axles and more.
Collision Data
Reported collision data has been tracked by MPI up to the end of 2017. MPI is only able to log collisions that are reported and the details are limited to what is provided. In addition, the local RCMP detachment provides information on reported collisions. Collisions are defined as any reported accident that resulted in property damage or injury. The collision data is compiled by MH annually and summarized in a following section.
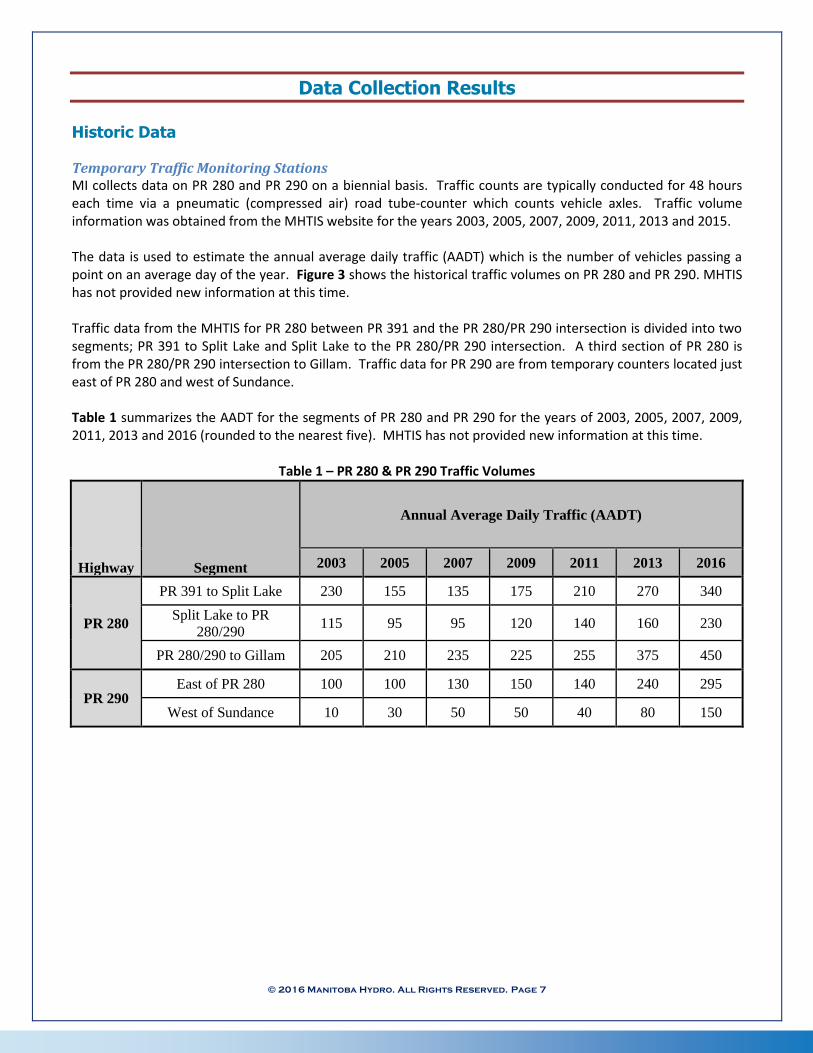
© 2016 Manitoba Hydro. All Rights Reserved. Page 7
Data Collection Results
Historic Data Temporary Traffic Monitoring Stations MI collects data on PR 280 and PR 290 on a biennial basis. Traffic counts are typically conducted for 48 hours each time via a pneumatic (compressed air) road tube-counter which counts vehicle axles. Traffic volume information was obtained from the MHTIS website for the years 2003, 2005, 2007, 2009, 2011, 2013 and 2015. The data is used to estimate the annual average daily traffic (AADT) which is the number of vehicles passing a point on an average day of the year. Figure 3 shows the historical traffic volumes on PR 280 and PR 290. MHTIS has not provided new information at this time. Traffic data from the MHTIS for PR 280 between PR 391 and the PR 280/PR 290 intersection is divided into two segments; PR 391 to Split Lake and Split Lake to the PR 280/PR 290 intersection. A third section of PR 280 is from the PR 280/PR 290 intersection to Gillam. Traffic data for PR 290 are from temporary counters located just east of PR 280 and west of Sundance. Table 1 summarizes the AADT for the segments of PR 280 and PR 290 for the years of 2003, 2005, 2007, 2009, 2011, 2013 and 2016 (rounded to the nearest five). MHTIS has not provided new information at this time.
Table 1 – PR 280 & PR 290 Traffic Volumes
Highway Segment
Annual Average Daily Traffic (AADT)
2003 2005 2007 2009 2011 2013 2016
PR 280
PR 391 to Split Lake 230 155 135 175 210 270 340
Split Lake to PR
280/290 115 95 95 120 140 160 230
PR 280/290 to Gillam 205 210 235 225 255 375 450
PR 290 East of PR 280 100 100 130 150 140 240 295
West of Sundance 10 30 50 50 40 80 150

© 2016 Manitoba Hydro. All Rights Reserved. Page 8
Figure 3 – PR 280 & PR 290 Traffic Volumes Table 2 summarizes the two, four, six, eight, ten and twelve year growth rates for PR 280. Due to the small sample size on PR 290, growth rates would be skewed and are therefore not calculated for this section of roadway.
Table 2 – PR 280 Traffic Growth Rates
Highway Segment Growth Rates
2-year 4-year 6-year 8-year 10-year 12-year
PR 280 PR 391 to Split Lake 12.2% 12.8% 11.7% 12.2% 8.2% 3.3%
Split Lake to PR 280/290 19.9% 13.2% 11.5% 11.7% 9.2% 5.9%
PR 280/290 to Gillam 9.5% 15.3% 12.2% 8.5% 7.9% 6.8%
Current Data Traffic Monitoring Stations Data from the traffic monitoring stations indicates that there has been a steady increase in traffic volumes since monitoring began in 2015. Monitoring Stations 1 and 2 began operating in mid-July 2015 while monitoring Stations 3, 10 and 11 did not begin counts until mid-October 2015. There was a failure at Station 1 in November 2015 that lasted two weeks, therefore these month’s average daily traffic (ADT) were extrapolated based on the partial month’s data collection. Station 1 experienced another failure for three days in June 2016 so results have been based on a 27 day period rather than 30 for this month. Also, another failure occurred in July 2016 for a three week duration, therefore results for this month are skewed. Connectivity issues with Station 1 resulted in the loss of data for July 31, 2017. In September of 2017, Station 2 data is only up to September 13 and Station 11 data has a gap between September 11 – 18.
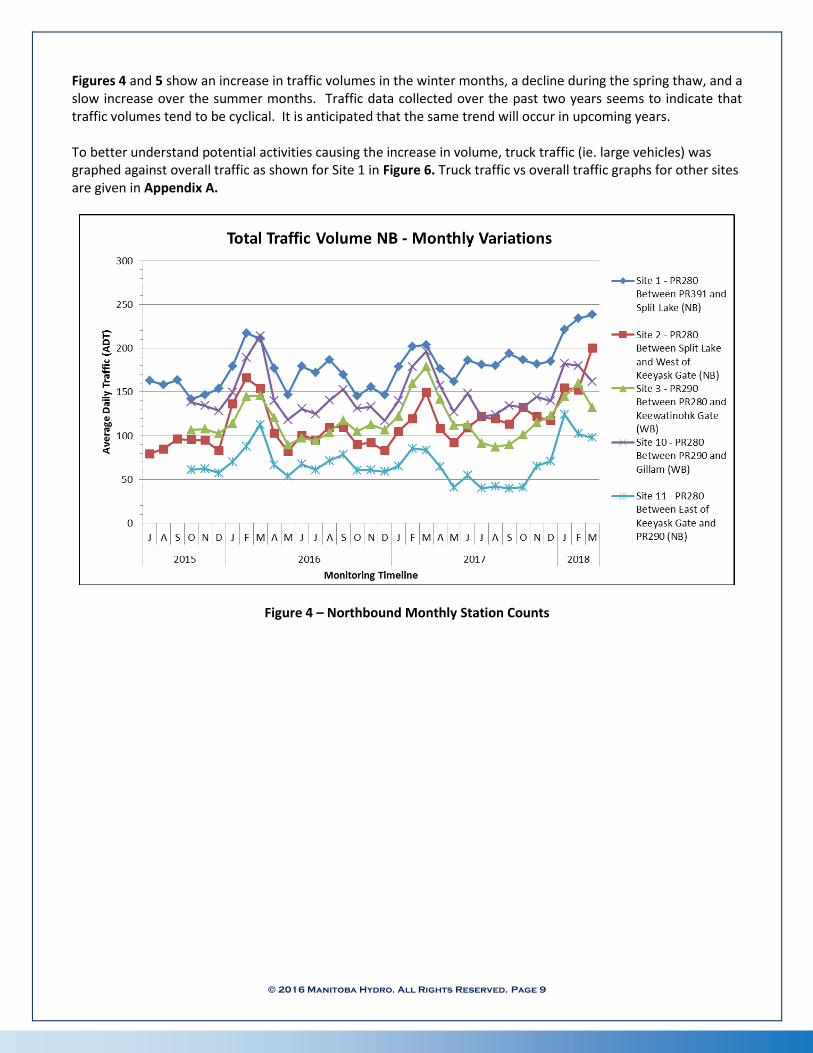
© 2016 Manitoba Hydro. All Rights Reserved. Page 9
Figures 4 and 5 show an increase in traffic volumes in the winter months, a decline during the spring thaw, and a slow increase over the summer months. Traffic data collected over the past two years seems to indicate that traffic volumes tend to be cyclical. It is anticipated that the same trend will occur in upcoming years. To better understand potential activities causing the increase in volume, truck traffic (ie. large vehicles) was graphed against overall traffic as shown for Site 1 in Figure 6. Truck traffic vs overall traffic graphs for other sites are given in Appendix A.
Figure 4 – Northbound Monthly Station Counts
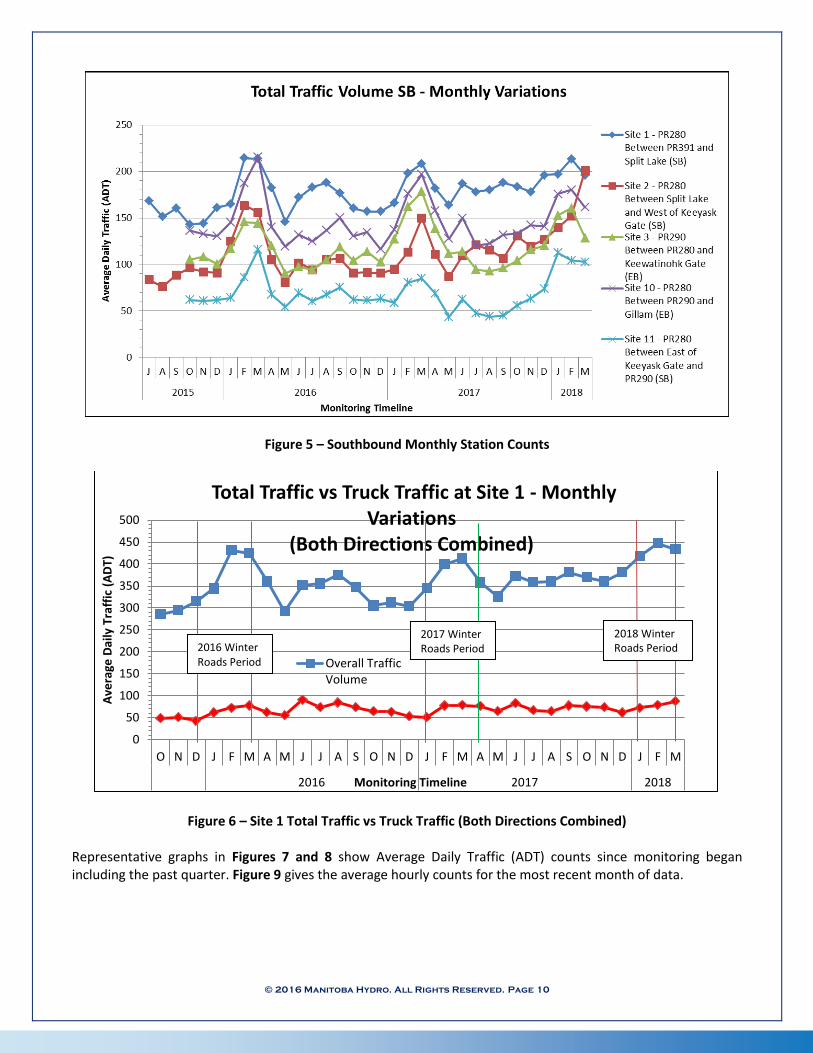
© 2016 Manitoba Hydro. All Rights Reserved. Page 10
Figure 5 – Southbound Monthly Station Counts
Figure 6 – Site 1 Total Traffic vs Truck Traffic (Both Directions Combined) Representative graphs in Figures 7 and 8 show Average Daily Traffic (ADT) counts since monitoring began including the past quarter. Figure 9 gives the average hourly counts for the most recent month of data.
0
50
100
150
200
250
300
350
400
450
500
O N D J F M A M J J A S O N D J F M A M J J A S O N D J F M
2016 2017 2018
Ave
rage
Dai
ly T
raff
ic (
AD
T)
Monitoring Timeline
Total Traffic vs Truck Traffic at Site 1 - Monthly Variations
(Both Directions Combined)
Overall TrafficVolume
2016 Winter Roads Period
2017 Winter Roads Period
2018 Winter Roads Period

© 2016 Manitoba Hydro. All Rights Reserved. Page 11
Figure 7 – Overall Average Daily Traffic Volume by Type of Vehicle (Both Directions Combined)
Figure 8 – Quarterly Average Daily Traffic Volume by Type of Vehicle (Both Directions Combined)
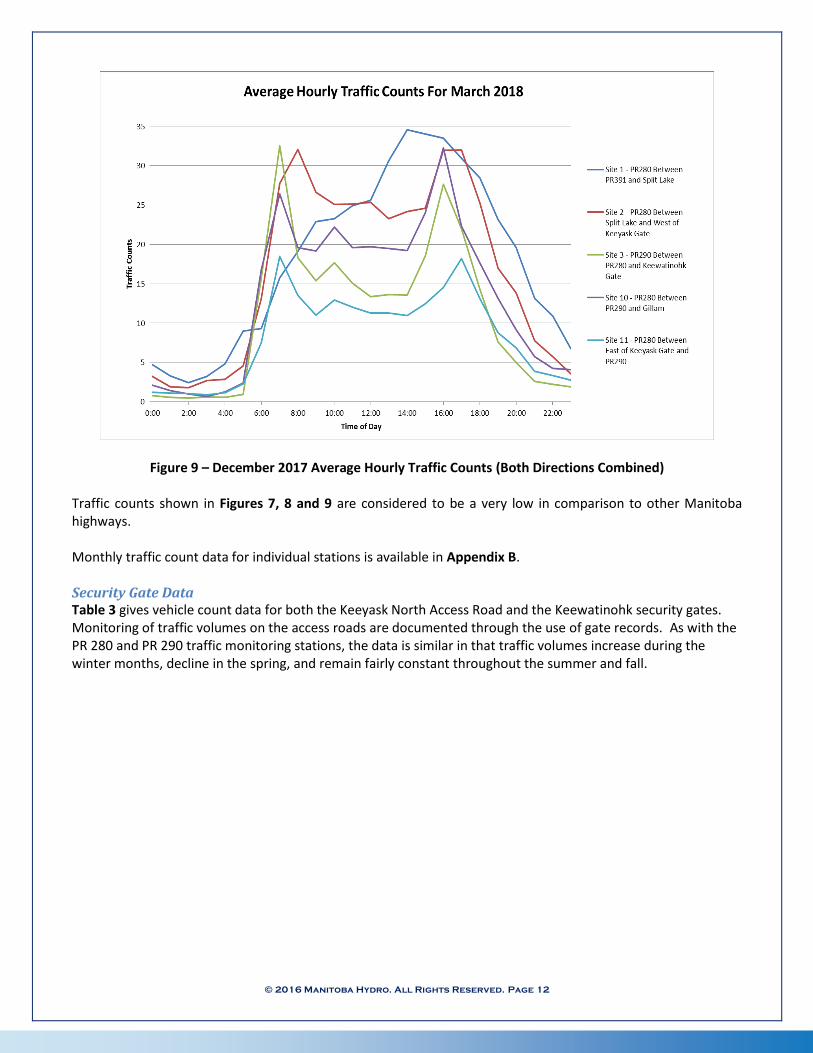
© 2016 Manitoba Hydro. All Rights Reserved. Page 12
Figure 9 – December 2017 Average Hourly Traffic Counts (Both Directions Combined) Traffic counts shown in Figures 7, 8 and 9 are considered to be a very low in comparison to other Manitoba highways. Monthly traffic count data for individual stations is available in Appendix B. Security Gate Data Table 3 gives vehicle count data for both the Keeyask North Access Road and the Keewatinohk security gates. Monitoring of traffic volumes on the access roads are documented through the use of gate records. As with the PR 280 and PR 290 traffic monitoring stations, the data is similar in that traffic volumes increase during the winter months, decline in the spring, and remain fairly constant throughout the summer and fall.
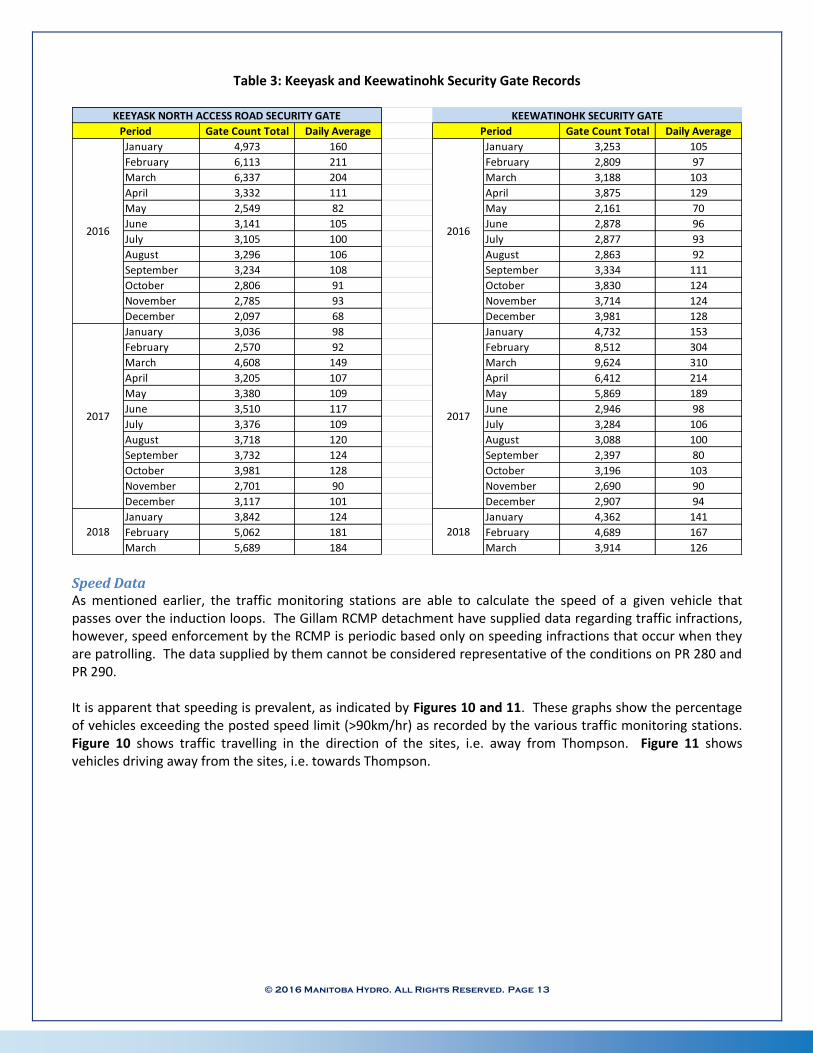
© 2016 Manitoba Hydro. All Rights Reserved. Page 13
Table 3: Keeyask and Keewatinohk Security Gate Records
Speed Data As mentioned earlier, the traffic monitoring stations are able to calculate the speed of a given vehicle that passes over the induction loops. The Gillam RCMP detachment have supplied data regarding traffic infractions, however, speed enforcement by the RCMP is periodic based only on speeding infractions that occur when they are patrolling. The data supplied by them cannot be considered representative of the conditions on PR 280 and PR 290. It is apparent that speeding is prevalent, as indicated by Figures 10 and 11. These graphs show the percentage of vehicles exceeding the posted speed limit (>90km/hr) as recorded by the various traffic monitoring stations. Figure 10 shows traffic travelling in the direction of the sites, i.e. away from Thompson. Figure 11 shows vehicles driving away from the sites, i.e. towards Thompson.
Gate Count Total Daily Average Gate Count Total Daily Average
January 4,973 160 January 3,253 105
February 6,113 211 February 2,809 97
March 6,337 204 March 3,188 103
April 3,332 111 April 3,875 129
May 2,549 82 May 2,161 70
June 3,141 105 June 2,878 96
July 3,105 100 July 2,877 93
August 3,296 106 August 2,863 92
September 3,234 108 September 3,334 111
October 2,806 91 October 3,830 124
November 2,785 93 November 3,714 124
December 2,097 68 December 3,981 128
January 3,036 98 January 4,732 153
February 2,570 92 February 8,512 304
March 4,608 149 March 9,624 310
April 3,205 107 April 6,412 214
May 3,380 109 May 5,869 189
June 3,510 117 June 2,946 98
July 3,376 109 July 3,284 106
August 3,718 120 August 3,088 100
September 3,732 124 September 2,397 80
October 3,981 128 October 3,196 103
November 2,701 90 November 2,690 90
December 3,117 101 December 2,907 94
January 3,842 124 January 4,362 141
February 5,062 181 February 4,689 167
March 5,689 184 March 3,914 126
20182018
2017 2017
Period
2016
KEEYASK NORTH ACCESS ROAD SECURITY GATE KEEWATINOHK SECURITY GATE
Period
2016

© 2016 Manitoba Hydro. All Rights Reserved. Page 14
Figure 10 – Percentage of Vehicles Exceeding Posted Speed Northbound
Figure 11 - Percentage of Vehicles Exceeding Posted Speed Southbound
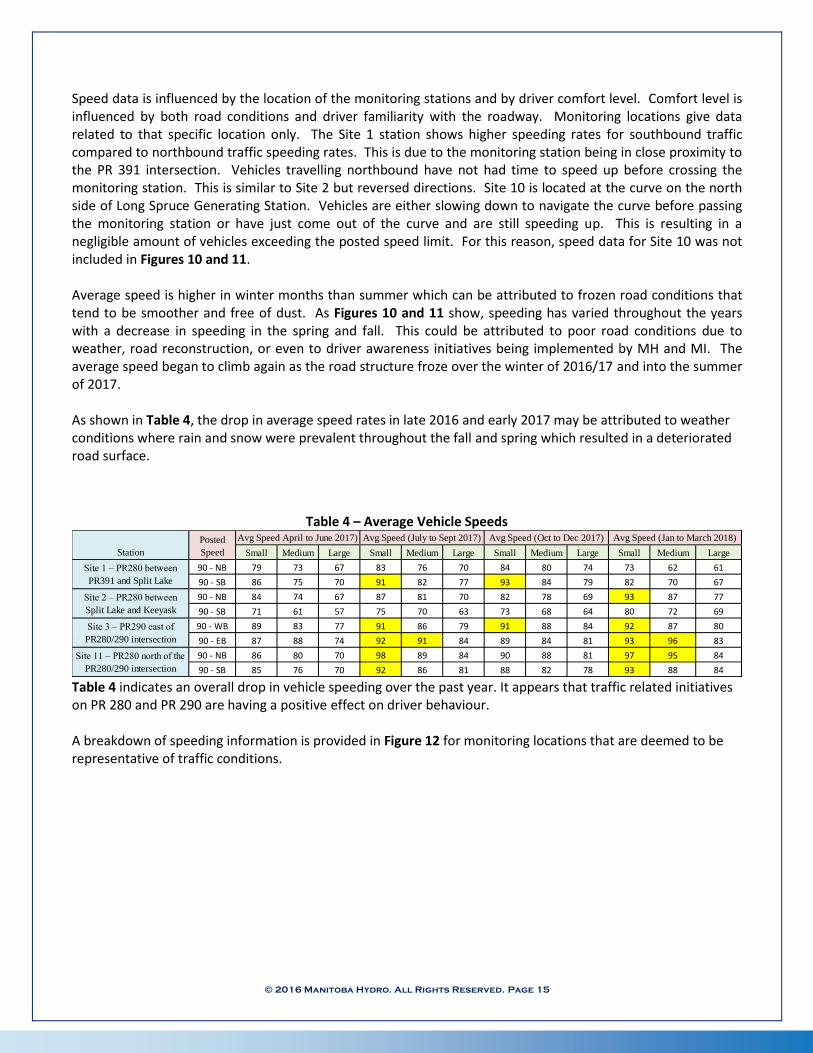
© 2016 Manitoba Hydro. All Rights Reserved. Page 15
Speed data is influenced by the location of the monitoring stations and by driver comfort level. Comfort level is influenced by both road conditions and driver familiarity with the roadway. Monitoring locations give data related to that specific location only. The Site 1 station shows higher speeding rates for southbound traffic compared to northbound traffic speeding rates. This is due to the monitoring station being in close proximity to the PR 391 intersection. Vehicles travelling northbound have not had time to speed up before crossing the monitoring station. This is similar to Site 2 but reversed directions. Site 10 is located at the curve on the north side of Long Spruce Generating Station. Vehicles are either slowing down to navigate the curve before passing the monitoring station or have just come out of the curve and are still speeding up. This is resulting in a negligible amount of vehicles exceeding the posted speed limit. For this reason, speed data for Site 10 was not included in Figures 10 and 11. Average speed is higher in winter months than summer which can be attributed to frozen road conditions that tend to be smoother and free of dust. As Figures 10 and 11 show, speeding has varied throughout the years with a decrease in speeding in the spring and fall. This could be attributed to poor road conditions due to weather, road reconstruction, or even to driver awareness initiatives being implemented by MH and MI. The average speed began to climb again as the road structure froze over the winter of 2016/17 and into the summer of 2017. As shown in Table 4, the drop in average speed rates in late 2016 and early 2017 may be attributed to weather conditions where rain and snow were prevalent throughout the fall and spring which resulted in a deteriorated road surface.
Table 4 – Average Vehicle Speeds
Table 4 indicates an overall drop in vehicle speeding over the past year. It appears that traffic related initiatives on PR 280 and PR 290 are having a positive effect on driver behaviour. A breakdown of speeding information is provided in Figure 12 for monitoring locations that are deemed to be representative of traffic conditions.
Small Medium Large Small Medium Large Small Medium Large Small Medium Large
90 - NB 79 73 67 83 76 70 84 80 74 73 62 61
90 - SB 86 75 70 91 82 77 93 84 79 82 70 67
90 - NB 84 74 67 87 81 70 82 78 69 93 87 77
90 - SB 71 61 57 75 70 63 73 68 64 80 72 69
90 - WB 89 83 77 91 86 79 91 88 84 92 87 80
90 - EB 87 88 74 92 91 84 89 84 81 93 96 83
90 - NB 86 80 70 98 89 84 90 88 81 97 95 84
90 - SB 85 76 70 92 86 81 88 82 78 93 88 84
Posted
Speed
Avg Speed April to June 2017) Avg Speed (July to Sept 2017) Avg Speed (Oct to Dec 2017) Avg Speed (Jan to March 2018)
Station
Site 1 – PR280 between
PR391 and Split Lake
Site 2 – PR280 between
Split Lake and Keeyask
Site 3 – PR290 east of
PR280/290 intersection
Site 11 – PR280 north of the
PR280/290 intersection
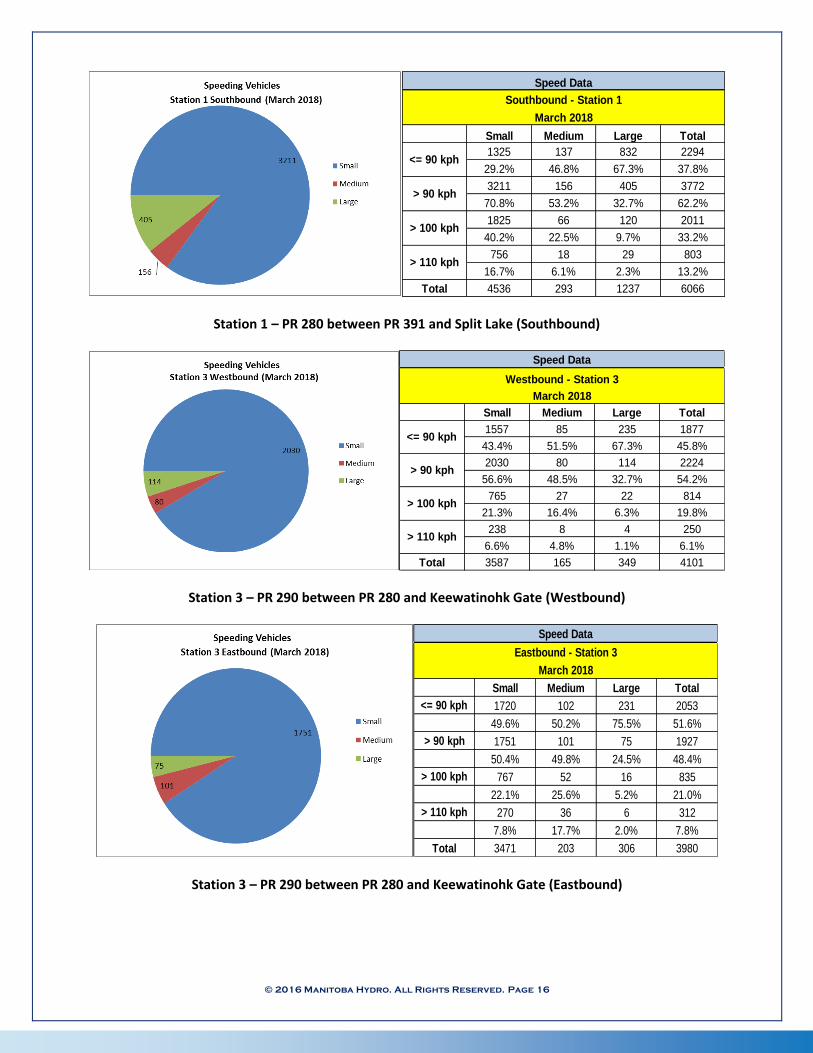
© 2016 Manitoba Hydro. All Rights Reserved. Page 16
Station 1 – PR 280 between PR 391 and Split Lake (Southbound)
Station 3 – PR 290 between PR 280 and Keewatinohk Gate (Westbound)
Station 3 – PR 290 between PR 280 and Keewatinohk Gate (Eastbound)
Small Medium Large Total
1325 137 832 2294
29.2% 46.8% 67.3% 37.8%
3211 156 405 3772
70.8% 53.2% 32.7% 62.2%
1825 66 120 2011
40.2% 22.5% 9.7% 33.2%
756 18 29 803
16.7% 6.1% 2.3% 13.2%
Total 4536 293 1237 6066
Speed Data
<= 90 kph
> 90 kph
> 100 kph
> 110 kph
Southbound - Station 1
March 2018
Small Medium Large Total
1557 85 235 1877
43.4% 51.5% 67.3% 45.8%
2030 80 114 2224
56.6% 48.5% 32.7% 54.2%
765 27 22 814
21.3% 16.4% 6.3% 19.8%
238 8 4 250
6.6% 4.8% 1.1% 6.1%
Total 3587 165 349 4101
Speed Data
<= 90 kph
Westbound - Station 3
March 2018
> 90 kph
> 100 kph
> 110 kph
Small Medium Large Total
<= 90 kph 1720 102 231 2053
49.6% 50.2% 75.5% 51.6%
> 90 kph 1751 101 75 1927
50.4% 49.8% 24.5% 48.4%
> 100 kph 767 52 16 835
22.1% 25.6% 5.2% 21.0%
> 110 kph 270 36 6 312
7.8% 17.7% 2.0% 7.8%
Total 3471 203 306 3980
Eastbound - Station 3
March 2018
Speed Data
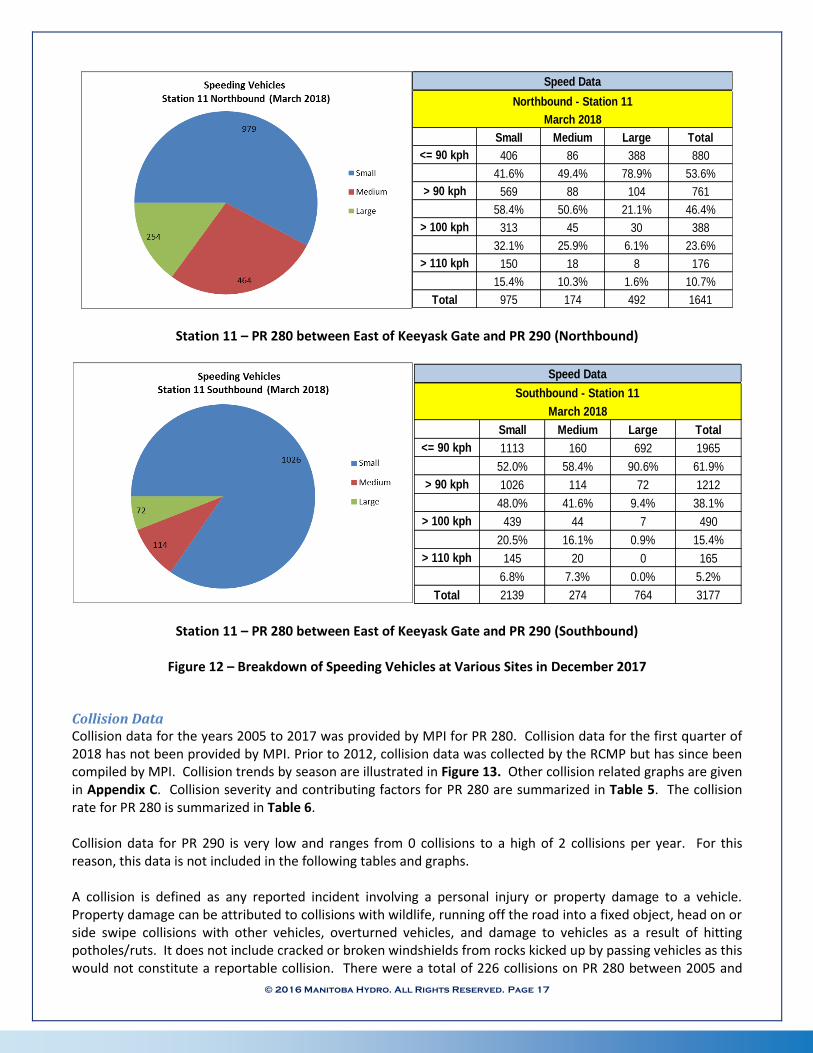
© 2016 Manitoba Hydro. All Rights Reserved. Page 17
Station 11 – PR 280 between East of Keeyask Gate and PR 290 (Northbound)
Station 11 – PR 280 between East of Keeyask Gate and PR 290 (Southbound)
Figure 12 – Breakdown of Speeding Vehicles at Various Sites in December 2017 Collision Data Collision data for the years 2005 to 2017 was provided by MPI for PR 280. Collision data for the first quarter of 2018 has not been provided by MPI. Prior to 2012, collision data was collected by the RCMP but has since been compiled by MPI. Collision trends by season are illustrated in Figure 13. Other collision related graphs are given in Appendix C. Collision severity and contributing factors for PR 280 are summarized in Table 5. The collision rate for PR 280 is summarized in Table 6. Collision data for PR 290 is very low and ranges from 0 collisions to a high of 2 collisions per year. For this reason, this data is not included in the following tables and graphs. A collision is defined as any reported incident involving a personal injury or property damage to a vehicle. Property damage can be attributed to collisions with wildlife, running off the road into a fixed object, head on or side swipe collisions with other vehicles, overturned vehicles, and damage to vehicles as a result of hitting potholes/ruts. It does not include cracked or broken windshields from rocks kicked up by passing vehicles as this would not constitute a reportable collision. There were a total of 226 collisions on PR 280 between 2005 and
Small Medium Large Total
<= 90 kph 406 86 388 880
41.6% 49.4% 78.9% 53.6%
> 90 kph 569 88 104 761
58.4% 50.6% 21.1% 46.4%
> 100 kph 313 45 30 388
32.1% 25.9% 6.1% 23.6%
> 110 kph 150 18 8 176
15.4% 10.3% 1.6% 10.7%
Total 975 174 492 1641
Speed Data
Northbound - Station 11
March 2018
Small Medium Large Total
<= 90 kph 1113 160 692 1965
52.0% 58.4% 90.6% 61.9%
> 90 kph 1026 114 72 1212
48.0% 41.6% 9.4% 38.1%
> 100 kph 439 44 7 490
20.5% 16.1% 0.9% 15.4%
> 110 kph 145 20 0 165
6.8% 7.3% 0.0% 5.2%
Total 2139 274 764 3177
Speed Data
Southbound - Station 11
March 2018
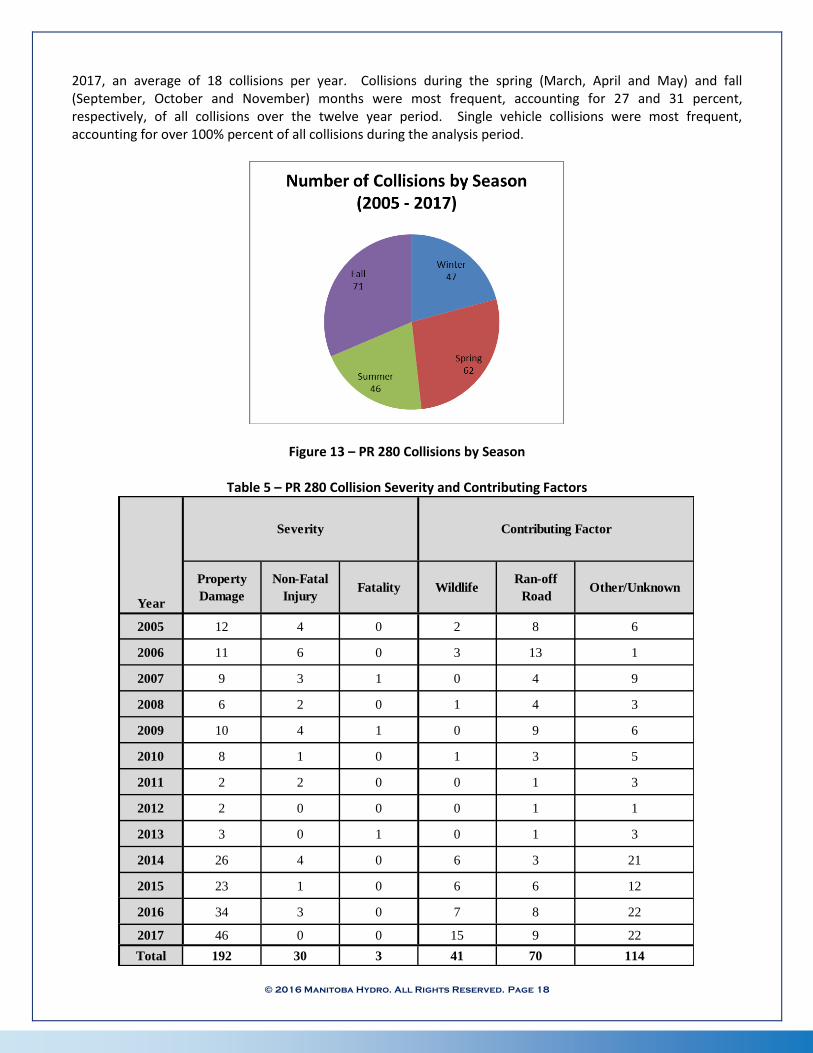
© 2016 Manitoba Hydro. All Rights Reserved. Page 18
2017, an average of 18 collisions per year. Collisions during the spring (March, April and May) and fall (September, October and November) months were most frequent, accounting for 27 and 31 percent, respectively, of all collisions over the twelve year period. Single vehicle collisions were most frequent, accounting for over 100% percent of all collisions during the analysis period.
Figure 13 – PR 280 Collisions by Season
Table 5 – PR 280 Collision Severity and Contributing Factors
2005 12 4 0 2 8 6
2006 11 6 0 3 13 1
2007 9 3 1 0 4 9
2008 6 2 0 1 4 3
2009 10 4 1 0 9 6
2010 8 1 0 1 3 5
2011 2 2 0 0 1 3
2012 2 0 0 0 1 1
2013 3 0 1 0 1 3
2014 26 4 0 6 3 21
2015 23 1 0 6 6 12
2016 34 3 0 7 8 22
2017 46 0 0 15 9 22
Total 192 30 3 41 70 114
Other/UnknownProperty
Damage
Non-Fatal
InjuryFatality Wildlife
Ran-off
Road
Severity Contributing Factor
Year
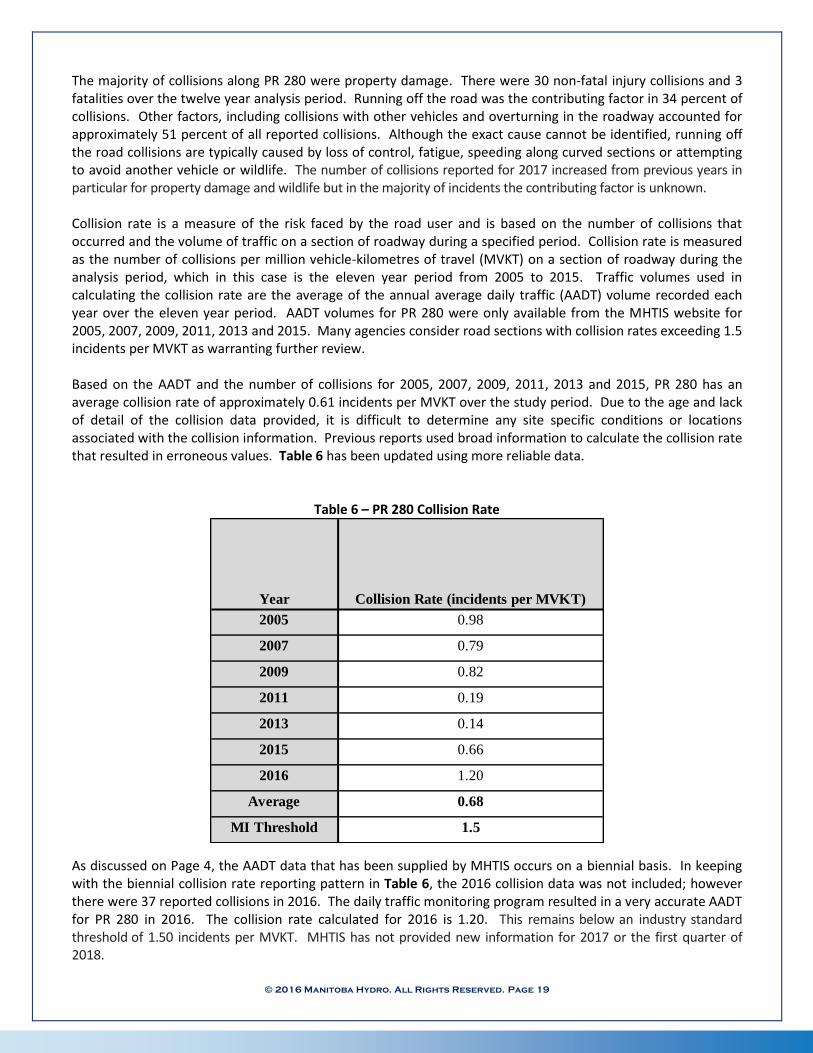
© 2016 Manitoba Hydro. All Rights Reserved. Page 19
The majority of collisions along PR 280 were property damage. There were 30 non-fatal injury collisions and 3 fatalities over the twelve year analysis period. Running off the road was the contributing factor in 34 percent of collisions. Other factors, including collisions with other vehicles and overturning in the roadway accounted for approximately 51 percent of all reported collisions. Although the exact cause cannot be identified, running off the road collisions are typically caused by loss of control, fatigue, speeding along curved sections or attempting to avoid another vehicle or wildlife. The number of collisions reported for 2017 increased from previous years in particular for property damage and wildlife but in the majority of incidents the contributing factor is unknown. Collision rate is a measure of the risk faced by the road user and is based on the number of collisions that occurred and the volume of traffic on a section of roadway during a specified period. Collision rate is measured as the number of collisions per million vehicle-kilometres of travel (MVKT) on a section of roadway during the analysis period, which in this case is the eleven year period from 2005 to 2015. Traffic volumes used in calculating the collision rate are the average of the annual average daily traffic (AADT) volume recorded each year over the eleven year period. AADT volumes for PR 280 were only available from the MHTIS website for 2005, 2007, 2009, 2011, 2013 and 2015. Many agencies consider road sections with collision rates exceeding 1.5 incidents per MVKT as warranting further review. Based on the AADT and the number of collisions for 2005, 2007, 2009, 2011, 2013 and 2015, PR 280 has an average collision rate of approximately 0.61 incidents per MVKT over the study period. Due to the age and lack of detail of the collision data provided, it is difficult to determine any site specific conditions or locations associated with the collision information. Previous reports used broad information to calculate the collision rate that resulted in erroneous values. Table 6 has been updated using more reliable data.
Table 6 – PR 280 Collision Rate
As discussed on Page 4, the AADT data that has been supplied by MHTIS occurs on a biennial basis. In keeping with the biennial collision rate reporting pattern in Table 6, the 2016 collision data was not included; however there were 37 reported collisions in 2016. The daily traffic monitoring program resulted in a very accurate AADT for PR 280 in 2016. The collision rate calculated for 2016 is 1.20. This remains below an industry standard threshold of 1.50 incidents per MVKT. MHTIS has not provided new information for 2017 or the first quarter of 2018.
2005 0.98
2007 0.79
2009 0.82
2011 0.19
2013 0.14
2015 0.66
2016 1.20
Average 0.68
MI Threshold 1.5
Year Collision Rate (incidents per MVKT)
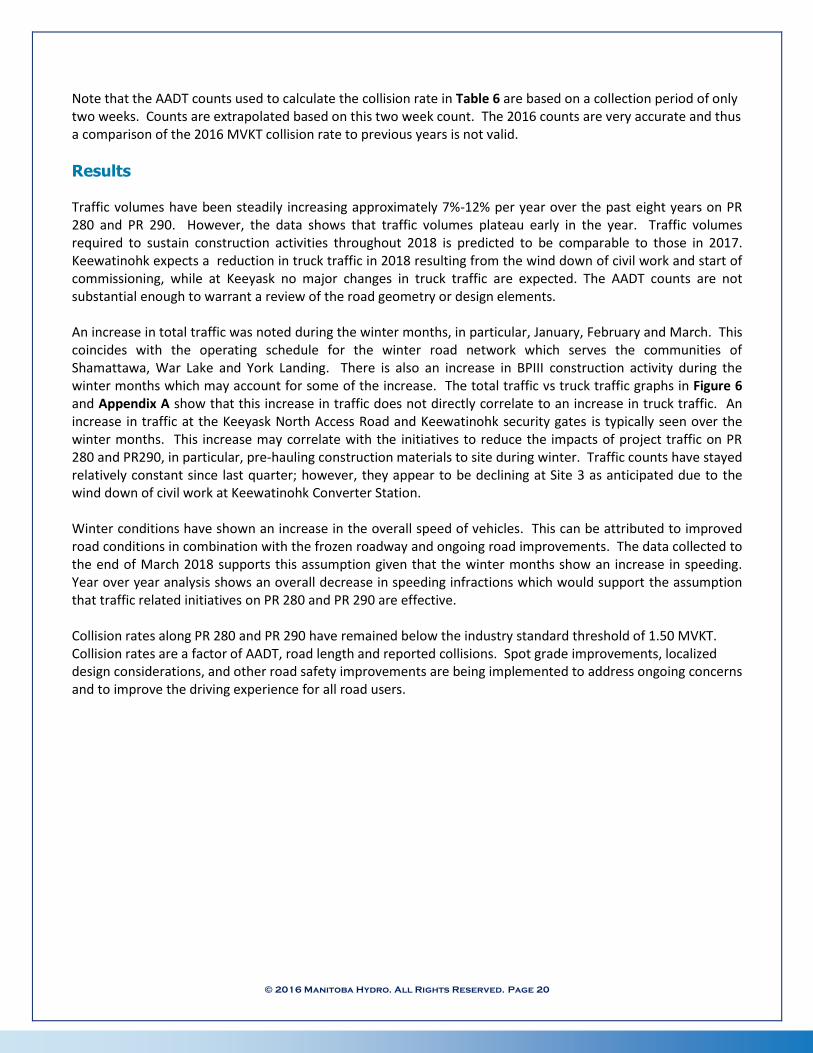
© 2016 Manitoba Hydro. All Rights Reserved. Page 20
Note that the AADT counts used to calculate the collision rate in Table 6 are based on a collection period of only two weeks. Counts are extrapolated based on this two week count. The 2016 counts are very accurate and thus a comparison of the 2016 MVKT collision rate to previous years is not valid.
Results Traffic volumes have been steadily increasing approximately 7%-12% per year over the past eight years on PR 280 and PR 290. However, the data shows that traffic volumes plateau early in the year. Traffic volumes required to sustain construction activities throughout 2018 is predicted to be comparable to those in 2017. Keewatinohk expects a reduction in truck traffic in 2018 resulting from the wind down of civil work and start of commissioning, while at Keeyask no major changes in truck traffic are expected. The AADT counts are not substantial enough to warrant a review of the road geometry or design elements. An increase in total traffic was noted during the winter months, in particular, January, February and March. This coincides with the operating schedule for the winter road network which serves the communities of Shamattawa, War Lake and York Landing. There is also an increase in BPIII construction activity during the winter months which may account for some of the increase. The total traffic vs truck traffic graphs in Figure 6 and Appendix A show that this increase in traffic does not directly correlate to an increase in truck traffic. An increase in traffic at the Keeyask North Access Road and Keewatinohk security gates is typically seen over the winter months. This increase may correlate with the initiatives to reduce the impacts of project traffic on PR 280 and PR290, in particular, pre-hauling construction materials to site during winter. Traffic counts have stayed relatively constant since last quarter; however, they appear to be declining at Site 3 as anticipated due to the wind down of civil work at Keewatinohk Converter Station. Winter conditions have shown an increase in the overall speed of vehicles. This can be attributed to improved road conditions in combination with the frozen roadway and ongoing road improvements. The data collected to the end of March 2018 supports this assumption given that the winter months show an increase in speeding. Year over year analysis shows an overall decrease in speeding infractions which would support the assumption that traffic related initiatives on PR 280 and PR 290 are effective. Collision rates along PR 280 and PR 290 have remained below the industry standard threshold of 1.50 MVKT. Collision rates are a factor of AADT, road length and reported collisions. Spot grade improvements, localized design considerations, and other road safety improvements are being implemented to address ongoing concerns and to improve the driving experience for all road users.
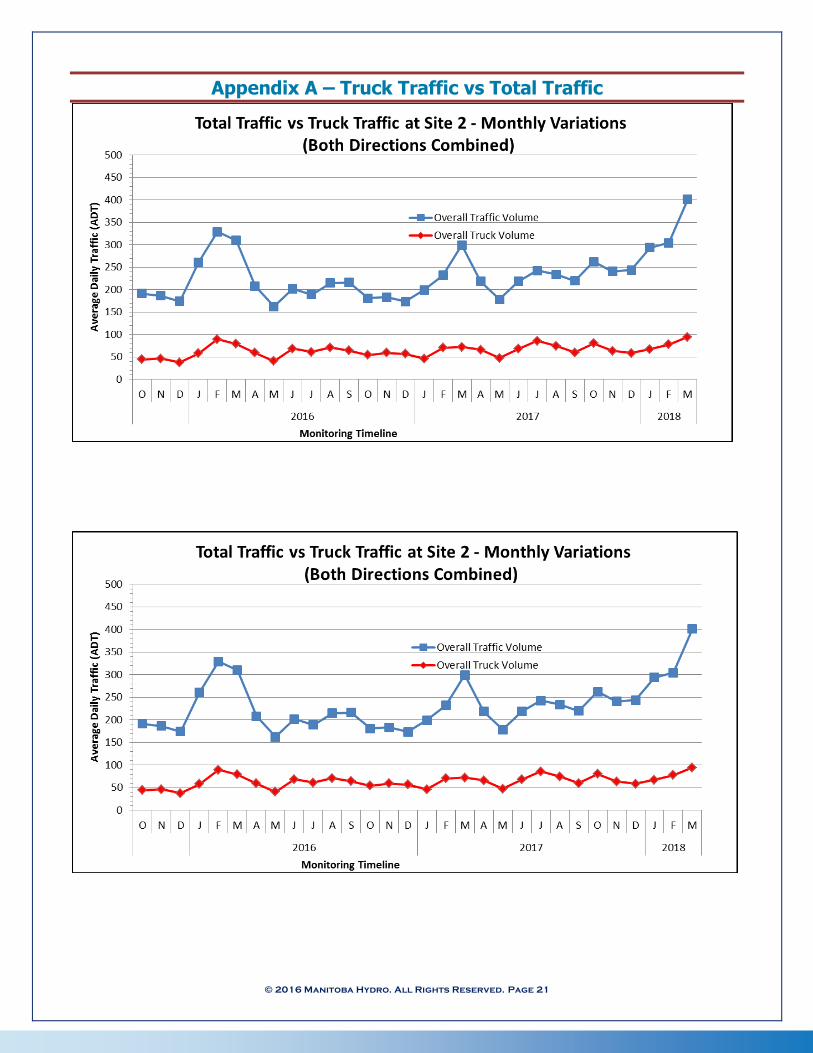
© 2016 Manitoba Hydro. All Rights Reserved. Page 21
Appendix A – Truck Traffic vs Total Traffic
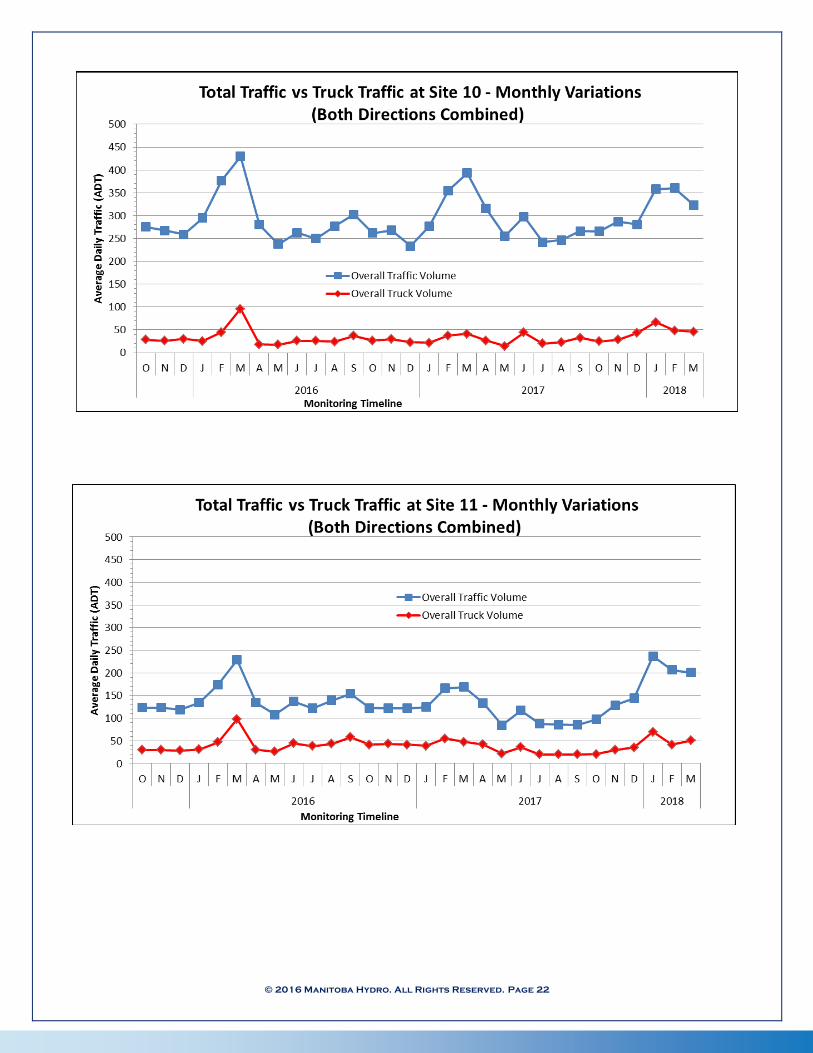
© 2016 Manitoba Hydro. All Rights Reserved. Page 22
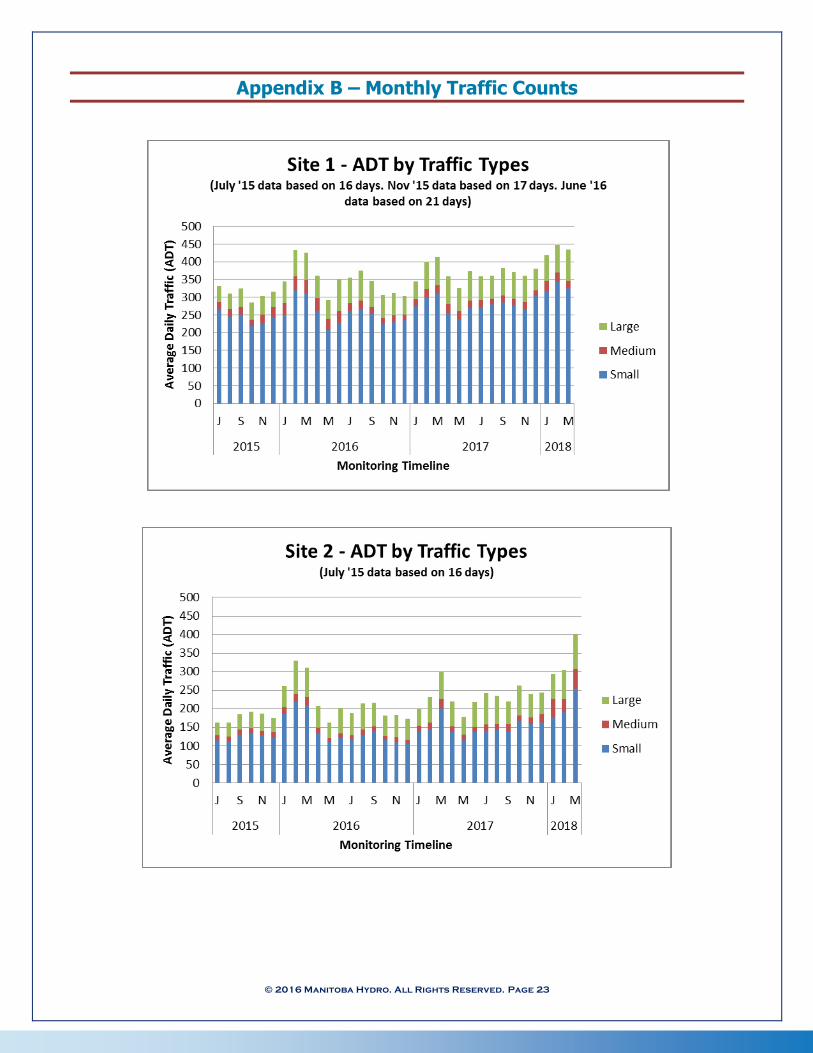
© 2016 Manitoba Hydro. All Rights Reserved. Page 23
Appendix B – Monthly Traffic Counts

© 2016 Manitoba Hydro. All Rights Reserved. Page 24

© 2016 Manitoba Hydro. All Rights Reserved. Page 25
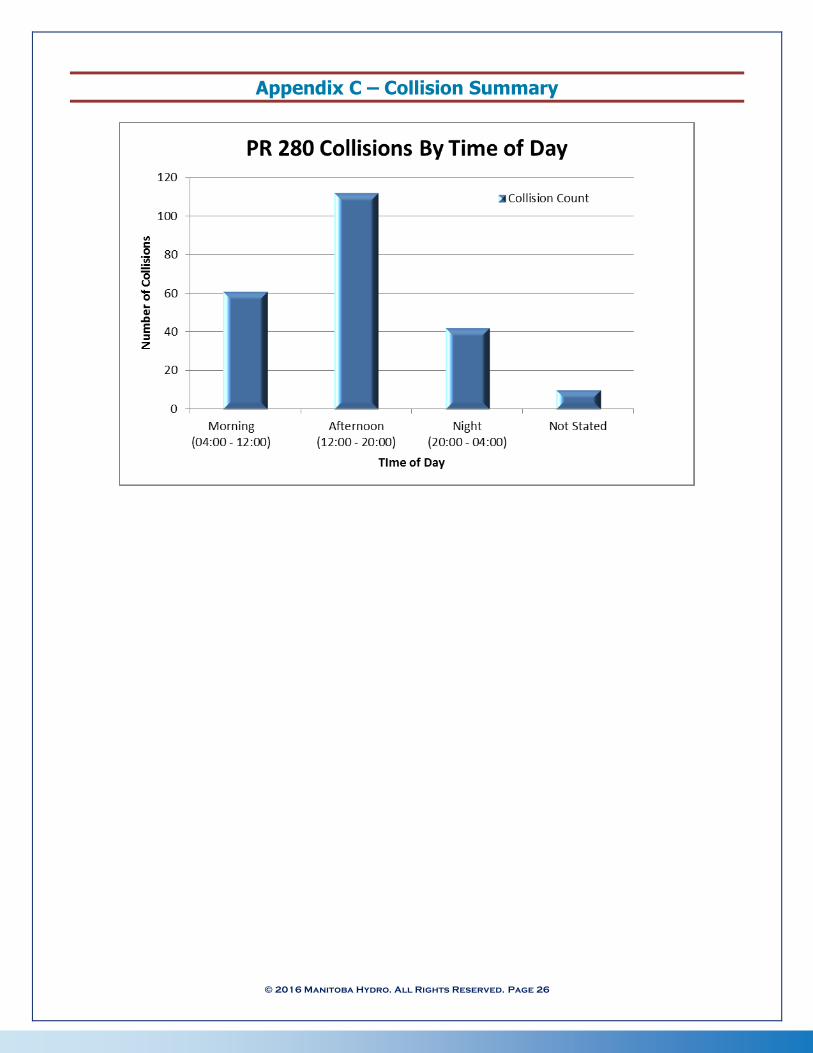
© 2016 Manitoba Hydro. All Rights Reserved. Page 26
Appendix C – Collision Summary
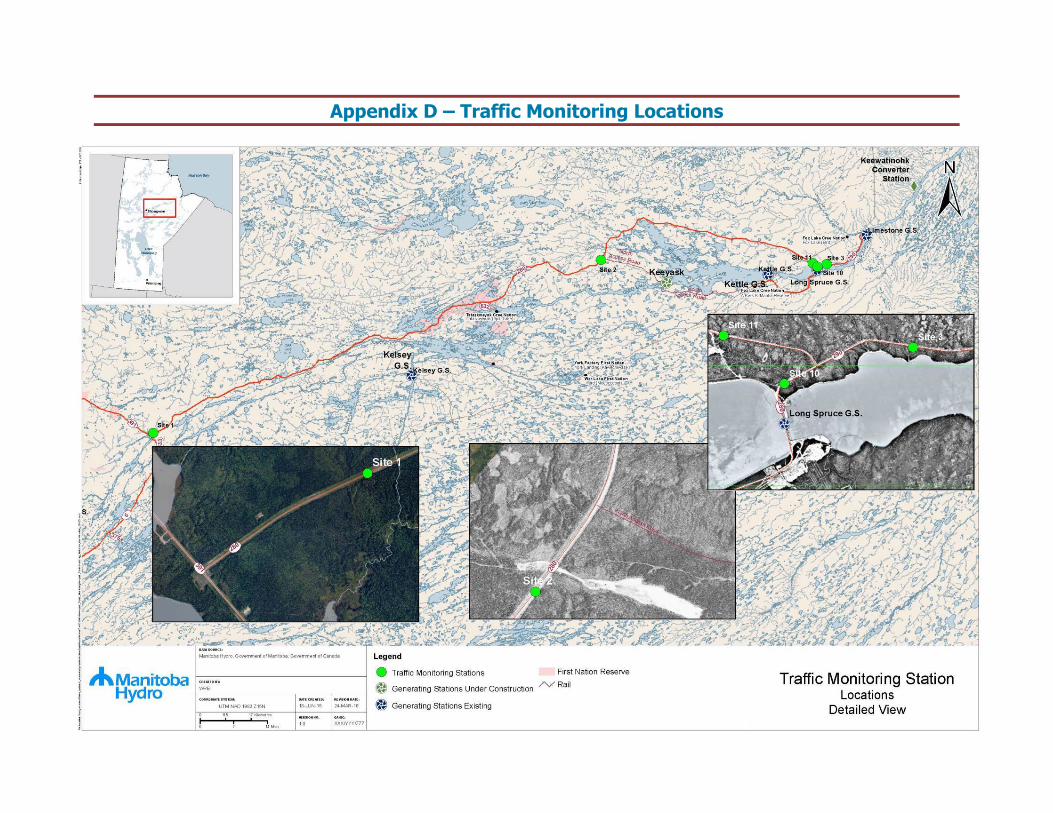
© 2016 Manitoba Hydro. All Rights Reserved. Page 27
Appendix D – Traffic Monitoring Locations