kehl biodiversity in central asia - ifs.du.edu · biodiversity and land use in central asia walter...
TRANSCRIPT

Biodiversity and Land Use
in Central Asia
Walter Kehl Global Futures December 2008

- 2 -
Contents
1 Introduction ............................................................................................. - 3 -
2 Framework ............................................................................................... - 4 -
2.1 The Focus Area................................................................................................ - 4 -
2.2 The Focus Questions ........................................................................................ - 4 -
2.3 Methodology ................................................................................................... - 5 -
3 The Base Case........................................................................................... - 8 -
4 Policy Intervention ................................................................................. - 11 -
4.1 Drivers ......................................................................................................... - 11 -
4.2 The Intervention............................................................................................ - 11 -
4.3 Balancing the intervention .............................................................................. - 15 -
5 Conclusion .............................................................................................. - 18 -
6 References.............................................................................................. - 20 -
7 About the Author .................................................................................... - 21 -

- 3 -
1 INTRODUCTION
One of the overlooked aspects of the global environmental crises is the loss of biodiver-
sity. According to the International Union for Conservation of Nature, one in four mam-
mal species faces extinction. Also many varieties of plants, insects and other life forms
face extinction. Why does this concern us? Besides having an intrinsic value as part of
creation, biodiversity is the basis for a stable ecosystem which provides us with funda-
mental “ecosystem services”: fresh air, water, new soil, recreation. For the survival of
humanity these services are crucial and therefore biodiversity needs to be protected. Also
biodiversity represents a huge pool of genetic capital which might become valuable in the
future.
Central Asia is an area which is very rich in biodiversity: it is a source of many of our
domestic plants; it contains many local species and has been selected as one of the glob-
ally important eco-region of the WWF (WWF 2006). But this special area is in danger of
losing its natural treasures through deforestation, industrialization and population expan-
sion. People in this area depend to a high degree on the local agriculture and are living in
a difficult economic and political situation. Therefore not only biodiversity (the heritage
for future generations) needs to be taken into account but also the welfare of the cur-
rently living people in the region.
This report evaluates a policy to preserve biodiversity in Central Asia while at the same
time protecting agricultural production. It does this using an integrated world model
called IFs (Hughes 2006) to simulate and assess the implications of this policy in Central
Asia for the time period until 2050. Current trends are forecasted in a base line scenario
(this is what most likely is going to happen if nothing will be changed) and this is com-
pared to an alternative, new scenario. Working through this scenario should give respon-
sible planners enough confidence to implement the new policy.

- 4 -
2 FRAMEWORK
2.1 THE FOCUS AREA
The area of interest is the geographical region of Central Asia, comprising Kazakhstan,
Kyrgyzstan, Tajikistan, Turkmenistan and Uzbekistan (see figure 1). It is situated at the
heart of the Eurasian continent with a total of 3,882 thousand square kilometers and a
population of over 53 million people. It is a completely land-locked area characterized by
large grassland planes, steppes and deserts, high mountain ranges and many vast lakes.
It is an area where most of the land suitable for agriculture is already in use. It contains
fragile ecosystems and is confronted with major ecological problems: desertification, wa-
ter scarcity, soil degradation and loss of biodiversity (United Nations Development Pro-
gram 2003). Central Asia is an arid area where life was always dependent on water and
which is suffering additionally through the gigantic mismanagement of the Soviet Union
era. Since the disintegration of the Soviet Union all these countries have become inde-
pendent and are going through a process of political and economical transformation and
of creating new governance structures.
Figure 1: Political map of Central Asia
2.2 THE FOCUS QUESTIONS
The specific questions under consideration are:
� Which are the indicators and drivers for the ecological situation in Central Asia?
� Which of the driving factors have the biggest impact for improving the ecological
situation?

- 5 -
� What is their implication on the area of agriculture?
Because biodiversity is hard to measure, the size of land devoted to nature (mainly for-
ests) will be used as a measure of biodiversity. This is reasonable as to some degree the
amount of available space and the number of species is correlated. However, once a spe-
cies is lost, increasing the forest area will not bring it back.
The forecast period is from 2005 until 2050.
2.3 METHODOLOGY
This study makes use of the IFs model (Hughes 2006), a global system dynamics model
comprising all countries of the world. It consists of a statistical history and of
trend/modeling forecast capabilities for questions of economy, society and environment.
The IFs model is strongest in economical and social questions and is somewhat limited in
environmental modeling, but it is these other factors which bring the most pressure on
the environment.
The most important factors for describing the environmental/agricultural situation in Cen-
tral Asia are:
� Water availability
� Forest area
� Agricultural land
� GDP per capita
As a conceptual framework ecosystem services as defined in (Millennium Ecosystem As-
sessment 2003) will be used to describe the benefits human society derives from nature.
The environmental indicators should be ideally taken from within the framework of the
ecosystem services. Unfortunately IFs provides – outside of the carbon dioxide and global
warming topic - only two environmental indicators: water use and forest land. Theoreti-
cally, they could stand for all the ecosystem services (both for use and over-use):
� Provisioning: water and timber
� Regulating: forests have a part in the local regulation of water and climate
� Supporting: production of oxygen, soil formation
� Cultural: spiritual and recreational value of forests and the biodiversity they
contain
However, these two variables would need to be much more differentiated. For example
there is a big difference in terms of biodiversity and of ecosystem services between a
primal forest and a timber plantation. Also water use in itself is a rough measure because
it says nothing about water quality before and after use, about local/seasonal availability
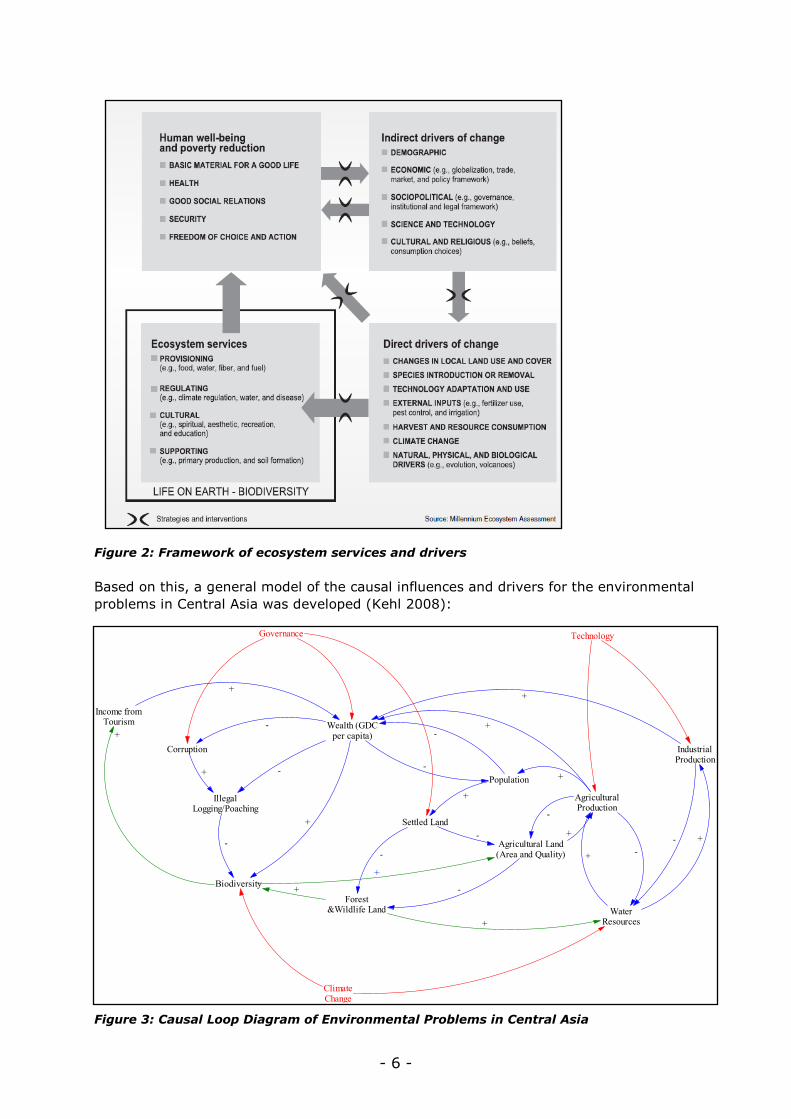
etc. Drivers for ecological change can be both direct and indirect drivers as described in
(Millennium Ecosystem Assessment 2003):
- 6 -
Figure 2: Framework of ecosystem services and drivers
Based on this, a general model of the causal influences and drivers for the environmental
problems in Central Asia was developed (Kehl 2008):
Figure 3: Causal Loop Diagram of Environmental Problems in Central Asia
Forest&Wildlife Land
Population
Settled Land
Agricultural Land(Area and Quality)
+
-
-Biodiversity
+
Wealth (GDCper capita)
WaterResources
AgriculturalProduction
+
+
-+
+
-
-
Income fromTourism
+
+
IndustrialProduction
+-
+
Corruption
-
-
+
ClimateChange
IllegalLogging/Poaching
+
-
-
-
Governance Technology
+
+

- 7 -
Unfortunately, only a limited part of this model can be practically operationalized in IFs:
Figure 4: Causal Loop Diagram of Environmental Problems in Central Asia for use in IFs
Reducing the model in this way is a simplification and a limit to this study. However,
what we can represent in IFs is done in a systematic way and can be backed up with sta-
tistical data. Apart from funding, is not possible to directly extend IFs with new variables.
But even so, this study can build the basis for further modeling work and research.
Forest&Wildlife Land
Population
Settled Land
Agricultural Land(Area and Quality)
+
-
-
Biodiversity
+
WaterResources
AgriculturalProduction
+
+
-+
+
-
-
Technology
+

- 8 -
3 THE BASE CASE
The purpose of the base case is to forecast the current trends of the most important indi-
cator variables in IFs. It should not be taken as an absolute value (in the sense of a
quantitative prediction), but as a reference for policy changes. Two of the most important
indirect drivers of ecological change are population size and personal wealth. Figure 5 is
showing that the population of Central Asia in the forecast period is still growing consid-
erable, but the population size will stabilize around 2050.
Figure 5: Population growth in Central Asia
A similar effect can be observed for individual wealth, which is expected to be continually
increasing until 2050:
Figure 6: Growth of individual wealth in Central Asia
The environmental impact can be measured in IFs, as already mentioned above, mainly
in two ways: in water use (WATUSE) and in forest land (LD – Forest).

- 9 -
Figure 7: Growth of yearly water use in Central Asia
General water use is still expected to rise in Central Asia. Given renewable water re-
sources of about 360 cubic km per year, it looks like there is no water problem. But the
reality looks differently: water is a limiting factor everywhere in a region where the once
huge Aral Sea is drying out and where water is a reason for conflict between neighboring
Central Asian states. Therefore water use is a critical factor which has to be minimized.
Figure 8: Reduction of Forest Land in Central Asia
Looking at figure 8, it becomes clear that biodiversity is under threat in Central Asia and
with it many other ecosystem services. This is one of the main indicators of the underly-
ing problem and the trend which must be turned around. It is expected that after 2050
the overall forest area will increase again. But already lost species cannot be recovered
nor can the quality of the new forest expected to be the same as the original one.
As forest land is diminished, both crop and especially grazing land are growing. Accord-
ingly, agricultural output is rising. However, the growth in figure 9 cannot be explained
with available land alone, but also with increasing productivity through better technology

- 10 -
and organization. An interesting fact in the model is that water availability is not a driving
or limiting factor for agricultural production. This might be correct in the Northern hemi-
sphere, but not in arid Central Asia where 70% of all water is used for irrigation and
where irrigation was already used by the 7th century BCE. This important feedback loop
would need to be closed to give the model more validity.
Figure 9: Reduction of Forest Land in Central Asia
In summary we can say that the future of Central Asia looks moderately positive with
many indicators in IFs (this is also true for others which cannot be displayed here). How-
ever the indicators for the ecological system are showing a downward trend and give rise
to concern for biodiversity and ecological services in the future. This is both motivation
and background for developing a policy to improve the situation in this respect. How to
formulate and evaluate such a policy with the help of IFs is the topic of the next chapter.

- 11 -
4 POLICY INTERVENTION
4.1 DRIVERS
From the causal loop diagram above (figure 3) a list of main and obvious drivers for the
ecological situation in Central Asia can be identified:
� Population
� Land use (for agriculture, grazing, urban settlement, forests, other)
� Economic activities
� Governance
Of these, land use can both be influenced and is a direct driver for forest land (our proxy
variable for biodiversity). There is no effect of a population decrease on land use. An ex-
periment with decreasing the fertility rate even to an unrealistically low level shows no
impact on land use. In general, ecological impact and population are correlated, but in
the case of (undisturbed) forest land, there is probably no effect – even if the population
levels off, land is not automatically given back to nature.
Also, neither economic activities nor governance are represented as direct change pa-
rameters for environmental indicators in IFs.
4.2 THE INTERVENTION
Given the limitations in drivers and causal links in the IFs model, there is only one realis-
tic intervention possible: changing the “Forest Protection Multiplier” (forestm) which di-
rectly causes the area devoted to forest land to change (to increase for values > 1). This
intervention represents a government regulation with the goal of increasing the available
forest area and the biodiversity contained in it. In this intervention, because of the re-
stricted environmental modeling in IFs, there is only a one-to-one linear relationship be-
tween the change of the forestm variable and the dependent LD land use variable. But
this change has other, negative consequences, mainly on agriculture and nutrition. To
balance these side effects, the intervention will be later extended in an iterative way.
The main intervention consists in a moderate change of the forest protection multiplier
over a number of years. The goal is to increase the forest size by a factor of three over a
30 year period and then to stabilize it at that level. Experiments with different numbers
and time periods have shown that there is no negative feedback loop in the model that
limits the effect of increasing forestm. Therefore forestm can be increased only very
moderately, otherwise the growth of forest land would displace all other kinds of land
use. The change is a slow (interpolated) increase of forestm from 2005 until 2030 to a
value of 1.1; immediately after that there is a return to the neutral parameter value of 1
(figure 10).

- 12 -
Figure 10: The forestm intervention
After running the scenario with these values, the main effect on the overall land use can
be seen in figure 11:
Figure 11: Change of Land Use in Central Asia
Here we can see in the working scenario a more than 300 percent increase of the forest
area through this intervention. It is obvious that the bulk of this addition (49 of overall
73 mil hectares) comes from grazing land. The rest of the

- 13 -
Figure 12: Scenario 1 versus base: Other types of Land Use in Central Asia
increase comes from crop land, as can be seen in figure 12. The difference in the crop
land area does not seem to be very big, but it makes quite a difference in the agricultural
effects of this intervention. The two other areas of land use (Urban and Other) are not
affected by this intervention.
There is an immediate effect of the change in crop land on agricultural production, which
can be seen in figure 13:
Figure 13: Scenario 1 versus base: Agricultural Production in Central Asia

- 14 -
Crop production is affected to quite some degree, so that the overall crop production af-
ter the intervention is significantly lower than in the base case. The change is directly
correlated to the available crop land; one can see a similar pattern here as in the crop
land curve above. Interestingly, the production of meat is not so heavily affected, al-
though grazing land is reduced much more than crop land.
The change in agricultural production leads to negative consequences regarding the nu-
tritional situation in Central Asia: agricultural imports are rising and (more alarming) the
number of malnourished people is slightly bigger than in the base case (see figures 14
and 15). So it seems that the increased import of goods is not sufficient to make up for
the loss of crop land.
Figure 14: Scenario 1 versus base: Agricultural Imports to Central Asia
Figure 15: Scenario 1 versus base: Malnourished People in Central Asia

- 15 -
In terms of other consequences of the intervention, economic and social indicators seem
to be completely unchanged – for example GDP per capita (GDPPPC) and the Human-
Development Index (HDI) are not affected at all. In reality one would expect some
changes, e.g. an effect of higher agricultural imports on GDP, but these effects are prob-
ably not significant. There is another ecological consequence of the intervention: the re-
duction of water use in the region, see figure 16. This is a direct result of the fact that
about 70% of water is used for agricultural irrigation – if the agricultural area is reduced,
so is the overall water use. Other positive effects of an increase forest area for the water
situation (e.g. increase of overall water resources and water quality) could be expected
but these kind of causal links are not represented in the IFs model.
Figure 16: Scenario 1 versus base: Water Use in Central Asia
4.3 BALANCING THE INTERVENTION
The results of the intervention show an inherent conflict between improving the ecologi-
cal versus improving the agricultural situation. Whereas this conflict cannot be com-
pletely eliminated, it is possible to modify the intervention to some degree to at least
achieve a more balanced result. Various modifications have been tried out and added to
the original intervention.
One possibility is to change the depreciation rate of agricultural land investment (DKL) to
a lower level: following the same pattern as the original forestm change, DKL was line-
arly decreased from 0.01 to 0.005 until 2035 and then changed back to its original value
of 0.01; DKL stands for land degradation and similar effects. It is fair to assume that with
a bigger forest area the ecosystem services (e.g. better protection from erosion) can ac-
count for this change. However, it does not lead to any significant change in the crop
land size. This indicates that in general the effect of soil degradation and soil loss, which
is a huge environmental problem in Central Asia, is not properly reflected in the model.

- 16 -
Another candidate for influencing the size of land available for food production is to limit
the growth of urban areas. This was done with the parameter ldwf (land withdrawal from
agriculture with population growth). This parameter was changed to a “low” setting with
the basic options in IFs scenario tree. But also this change to the scenario did not affect
the crop land size at all – neither did it change urban land size.
With all parameters for increasing the available agricultural land exhausted, the only way
to balance the intervention is to try and increase agricultural productivity via the agricul-
tural yields multiplier (ylm): an additional change was introduced into the policy inter-
vention to model a somehow realistic increase in agricultural productivity. The yield mul-
tiplier was increased over a period of 10 years to a value of 1.2, then kept at this level
until 2035, at which time it was changed back to the neutral value of 1. This should mod-
el a high effort to increase yields, another effort to keep it at this level and a saturation
effect. Still, improving the agricultural productivity by a factor of 1.2 per year is high and
cannot be explained with technological progress alone. In an area which is dominated by
export crops (e.g. cotton) this could also be achieved by changing away from production
for export to production for domestic food needs. How this would affect the domestic
economic situation and the supply situation in the importing countries cannot be investi-
gated in this study. Another source of agricultural products could be the forests them-
selves which can be harvested to some degree without impacting their ecological stabil-
ity. The result of this change is an increase in agricultural production which improves the
situation but which still cannot fully make up for the decrease in agricultural land (see
figure 17).
Figure 17: Scenario 2 versus base: Agricultural Production in Central Asia
On that basis, the percentage of malnourished people in the population is reduced com-
pared to the original intervention, but it is still higher than in the base case (see figure
8). Also the average number of calories per capita per day (CLPC) is still lower than in
the base line scenario.

- 17 -
Figure 18: Scenario 2 versus base: Malnourished share of population in Central Asia
The only measure which is left to improve the situation even more is to reduce the pro-
jected population by a policy which decreases the fertility rate (tfrm – total fertility rate
multiplier). Setting tfrm to a “low” value in IFs leads (all other factors staying the same)
to a situation where the average calories intake by 2050 will be only 35 calories lower
than in the base case and where the share of malnourished people by 2050 is reduced to
7.73% - slightly less than the 7.978% without population reduction. In this way we have
reached a situation where the original goal of improving forest area and preserving biodi-
versity has been reached and where the negative consequences of reduced agricultural
production have been limited as much as possible.
Although not present in the model, in reality there are more causal relationships between
forest area and economic factors (forest products, possible income through tourism) and
between social factors and biodiversity (it needs good governance to set up, protect and
properly manage forest areas). Also in the timeframe up to 2050 there most certainly will
be effects of global warming on both forest and farming land. These effects have not
been studied here because they are currently too uncertain to model. They could go in
many different ways (reducing crop land in quality and quantity, making more higher-
altitude land available for farming, reducing available water for irrigation …) that they
would introduce too much speculation into this scenario work.
As a summary, the best policy to address the underlying issue in a balanced way is to
protect and increase the forest area, to improve agricultural productivity by a variety of
means and to try to reduce fertility in order to reduce population pressure on agricultural
products.

- 18 -
5 CONCLUSION
This study has shown three important results:
� the planned intervention is possible and can be done together with additional
measures in a relatively balanced way,
� there still is a conflict between different goals which cannot always be solved
� Our modeling approach is helpful but still very far from accurately reflecting
the complexities of real life.
The goal of the study is to simulate and plan a policy which would create a change in
Central Asia towards preserving biodiversity and keeping a stable basis for ecological
services to the population of this region. Given its limitations, is has shown that such an
approach can work and that the negative side effects of such a policy can be contained
with flanking measures. It has also shown which policy parameters have a significant
influence and which can be neglected. In this way this study also gives some hints which
measures should be undertaken first. The whole study has been done in an iterative
process of policy development, which is only possible within the framework of such a
modeling and planning exercise – in reality the measures take such a long time to show
effects that it is usually too late to react when problem symptoms are detected.
The study also shows that following one goal has consequences on other, conflicting
goals. In our case the conflicting goals are obviously the preserving of biodiversity and
agricultural production. The suggested policy contains many measures to balance the
adverse effects of increasing forest land as much as possible. But even in the model it
was not possible to completely harmonize both goals and it is not to be expected that
this will be possible in reality. That means that in the end people still have to decide
which goal they prefer and this decision must be based on their values. Even a helpful
planning tool like this leaves the final responsibility to the people who have to decide, to
their priorities and their images of the future.
This study has also shown the limitations of the underlying model. For all of its virtues as
an integrated world model, ecological questions and causal feedback loops are not well
accounted for in IFs. The model basically assumes in its production functions – like most
of the economic theory it is based on – that economic activity happens independent of
ecosystems services. Also the causal links between the relevant parts of the ecosystem
(water resources, soil quality, native and introduced species, etc) are not present in the
model – which is not so surprising given that environmental data/statistics are complex
and harder to integrate than economical data and that the interactions between them are
not always well understood. Another limitation is the missing differentiation on a local
level. For example the “forest area” does not differentiate between natural forests and
tree plantations, and processes like desertification (expressed as changes in soil quality)
cannot be modeled in the system. Therefore a much more detailed model for a limited
area like Central Asia would be very helpful in order to get more reliable answers. But
even then it must be clear that such a model can never fully represent reality and that
using a model does not excuse from monitoring reality and taking responsibility.
Given all that, using (and further improving) a model like IFs is an important planning
and decision-making tool because it gives our planning a statistical and systematic basis
and because it leads our attention to the multiple and interrelated consequences of any

- 19 -
policy. On this note we are positive that the suggested policy has the desired effect and
will work for the long-term benefit of people and nature.

- 20 -
6 REFERENCES
Regional Environmental Centre for Central Asia (2006), CAREC: A PORTRAIT (2006), Al-
maty, Kazakhstan.
Hughes, Barry and Evan Hillebrand (2006), Exploring and Shaping International Futures .
Boulder , CO: Paradigm Press
Kehl, Walter (2008), Environmental Problems in Central Asia: Guidance for Decision Mak-
ers, Regent University
Millennium Ecosystem Assessment (2003), Ecosystems and Human Well-being: A
Framework for Assessment, Washington: IslandPress
Unesco (2006), Water, A Shared Responsibility, Executive Summary, retrieved 2008-1-
04 from http://www.un.org/publications
United Nations Development Program (2003), Addressing Environmental Risks in Central
Asia, retrieved 2008-10-04 from http://www.un.org/publications
WWF (2006), Middle Asian Montane Steppe & Woodlands - A Global Ecoregion, retrieved
2008-10-25 from
http://www.panda.org/about_wwf/where_we_work/ecoregions/asian_montanesteppe_wo
odlands.cfm
The photos were taken by the author in the mountains of Kyrgyzstan.
- 21 -
7 ABOUT THE AUTHOR
Walter Kehl is currently pursuing a Masters degree in Strategic Foresight at Regent Uni-
versity, Virginia Beach, US. Born and raised in Germany, he has a diploma in Computer
Science and Linguistics. After working in several positions as a Software developer - from
expert systems research to commercial projects - he is currently working as a R&D pro-
ject manager for a global provider of measuring and surveying technology, based in
Switzerland.
His interests in Strategic Foresight are in Systems Thinking, Global Futures and in the
interface between futures thinking and technological innovation. The author can be con-
tacted at [email protected]