keller results 2008 - keller group plc/media/files/k/keller-v2/investor/result...uitdstt m kta l...
TRANSCRIPT

K ll G lKeller Group plcPreliminary Results 2008M h 2009March 2009
Hi hli htHighlights
• Revenue* of £1,196.6m (2007: £955.1m), up 25%Revenue of £1,196.6m (2007: £955.1m), up 25%
• Like-for-like organic revenue growth of 12%
• Excellent operating margin* of 10% (2007: 11 2%)Excellent operating margin of 10% (2007: 11.2%)
• Earnings per share* up 14% to 111.1p (2007: 97.6p)
• Total dividend for the year of 20 7p (2007: 18 0p) up 15%• Total dividend for the year of 20.7p (2007: 18.0p), up 15%
• Cashflow from continuing operations represents 99% of EBITDA
• Net debt of £84.6m (2007: £54.5m) after £20.7m of adverse currency movements; committed facilities of £225m with substantial covenant headroom
1*from continuing operations

Group Income StatementGroup Income StatementContinuing operations
£m 2008 2007%
change Constant currency basis£m 2008 2007 change - revenue up 14%- operating profit flat
A h t
Revenue 1,196.6 955.1 +25%
O ti fit 119 4 107 4 +11% Average exchange rates- US$1.86 (2007: $2.00)- €1.26 (2007: €1.46)
Operating profit 119.4 107.4 +11%
Net finance costs (6.2) (4.2)
Profit before tax 113.2 103.2 +10%
Effective tax rate 32%(2007: 35%)
Tax (35.9) (35.9)
Profit after tax 77.3 67.3 +15%Profit after tax 77.3 67.3 15%
2

G I St t tGroup Income Statement (continued)
£m 2008 2007%
change Discontinued losses relate to £m 2008 2007 changeMakers legacy issues
Minority interests mainly
Profit after tax 77.3 67.3 +15%Discontinued operation(post tax) (1.7) (10.5)
Saudi Arabia and Spain
Dividend policy
(p )75.6 56.8
Minority interests (4.8) (2.8)
Att ib t bl t h h ld 70 8 54 0p y
-15% annual growth, subject to 3x cover
Attributable to shareholders 70.8 54.0
Earnings per share from continuing operations 111.1p 97.6p +14%
Earnings per share 108 6p 81 8p 3.3% of shares repurchased in 2008
Earnings per share 108.6p 81.8p
Dividends per share 20.7p 18.0p +15%
3

O ti P fit & M i *Operating Profit & Margin*2008 2007 Like-for-like organic
revenue growth of 12%
- UK 10%- USA 0%
£m RevenueOp
Profit Margin RevenueOp
Profit Margin
UK 85.2 2.7 3.2% 78.0 3.8 4.9%- CEMEA 28%- Australia 17%
Suncoast represents
USA 532.1 52.1 9.8% 473.2 61.6 13.0%
CEMEA 442.2 49.9 11.3% 296.8 30.4 10.2%
vast majority of US profit decrease
Record margins in
Australia 137.1 19.4 14.2% 107.1 14.7 13.7%
1,196.6 124.1 10.4% 955.1 110.5 11.6%
Central costs - (4 7) - (3 1) Record margins in CEMEA and Australia
Central costs (4.7) (3.1)
1,196.6 119.4 10.0% 955.1 107.4 11.2%
4*from continuing operations

G B l Sh tGroup Balance Sheet£m 2008 2007 Balance sheet carrying
l i d bG d ill/i t ibl 111 8 80 8 values increased by significant weakening of sterling over 2008
Goodwill/intangibles 111.8 80.8Property, plant & equipment 254.7 155.8Other non-current assets 12.5 13.7
379.0 250.3
Year end exchange rates- US$1.45 (2007: $2.00)- €1.03 (2007: €1.36)
379.0 250.3Inventories 50.9 26.9Debtors 364.4 273.6Creditors (323.1) (237.4)
Working capital ratios improved again
Working capital 92.2 63.1Capital employed 471.2 313.4Other liabilities/provisions (48.8) (24.9)Retirement benefits (13 6) (13 9)
Gearing of 28% (2007: 26%)
Retirement benefits (13.6) (13.9)Tax (21.6) (8.6)Net debt (84.6) (54.5)Net assets 302.6 211.5
5

G C h Fl St t tGroup Cash Flow Statement£m 2008 2007 Cash from continuing
operations 99% of EBITDA (2007: 101%)
Cash from continuing operating activities 143.5 127.4EBITDA (2007: 101%)
Underlying capexincrease of £11 4m
Discontinued operation (5.1) (10.2)Capex – net (65.2) (47.1)Tax (27.9) (32.0) increase of £11.4m
targeting growth opportunities
Interest (4.1) (4.0)Free cash flow 41.2 34.1Dividends (15.9) (12.3)
Acquisitions mainly Olden and Boreta
( ) ( )Acquisitions (14.1) (34.5)Other (20.6) (2.3)Net cash flow (9.4) (15.0)
Other includes £17.5m of share buy-backs
Net cash flow (9.4) (15.0)Opening net debt (54.5) (38.6)
Exchange movements (20.7) (0.9)Closing net debt (84 6) (54 5)
6
Closing net debt (84.6) (54.5)

G Fi i P itiGroup Financing Position
• £225m of committed Group facilities, mainly Key Financial Covenants£225m of committed Group facilities, mainly
– £65m and £80m revolving credit facilities, expiring July 2010 and June 2011 respectively
Key Financial Covenants
Test Status
respectively–to date, £65m facility not used
– US$100m private placementUS$30m repayable 2011 US$70m repayable
Net debt < 3x EBITDA 0.6x
EBITDA interest cover > 4x 23.2x–US$30m repayable 2011, US$70m repayable 2014
• Comfortably within key financial covenants
Net Assets > £78m £302.6m
Comfortably within key financial covenants
• A further £75m of other facilities held locally
7

G O dGroup OrdersLast six months’ orders Monthly orders
120
140
down around 20% from previous six months’£m
Monthly orders(rolling 3 month average at constant currency*)
60
80
100 Current order book down around 10% from last year in constant
-
20
40
year in constant currency terms – slightly up in sterling terms
8*at current exchange rates

2009 G id2009 Guidance
• Local currency revenue expected to be significantly down in some countries• Local currency revenue expected to be significantly down in some countries
– especially US, Middle East, UK
• C b fit lik l t b dl ff t thi d ( t t t )• Currency benefits likely to broadly offset this decrease (at current rates)
• Lower volumes will lead to further pressure on margins
• Expected effective tax rate of 32%
• Capital expenditure of around £40m
• £8m of deferred consideration payable, mainly in H1
9

G A l i f RGroup Analysis of RevenueRevenue by Geography Revenue by Product
T t l R £1 197Revenue by End MarketT t l R £1 197
9%
Total Revenue £1,197m Total Revenue £1,197m
18%
Total Revenue £1,197m
7%
36%14%
15% 23%
18%35%12%
44%
37%26%
PilingG d I t
24%
Infrastructure/Public Buildings
37%
USGround ImprovementSpecialty GroutingAnchors/Nails/MinipilesPost-tension Concrete
Office/CommercialPower/Industrial/ManufacturingResidential
CEMEAAustraliaUK
10• Broadly based business by geographies, products and end markets

N th A i A l i f RResidential and
North America Analysis of Revenue2008 Revenue by End Market 2008 Revenue by Region
T l £ 32 office/commercial exposure now 46%, down from 58% in 2007
10%22%
Total revenue £532m Total revenue £532m
Strong growth in power, industrial and manufacturing reflecting
0%
24%
16%25%
25%22%
22%32%
a u actu g e ect gstrength of the market
Excellent geographical
24% 25%
Central (inc Texas)N th E t (i N Y k)
24%
Infrastructure/Public Buildingsprofile serving every corner of the US
North East (inc New York)South East (inc Florida)West Coast (inc California)Mid West (inc Chicago)
ast uctu e/ ub c u d gsOffice/CommercialPower/Industrial/ManufacturingResidential
11

U it d St t M k t A l iUnited States Market AnalysisJanuary 2009 housing starts down to 20%
1,400
1,600
of 2006 monthly peak
Housing now 34% of the construction k (2006 54%)
Housing Starts 000’s
800
1,000
1,200
,market (2006: 54%)
In 2008 private non residential market grew by 15% (2007: 18%)
200
400
600 grew by 15% (2007: 18%)Power and Manufacturing: 48%Commercial (3%)
-
Annualised Housing Starts
Public construction market grew by 7% in 2008 (2007: 13%)
Source: US Census Bureau, Housing Starts12
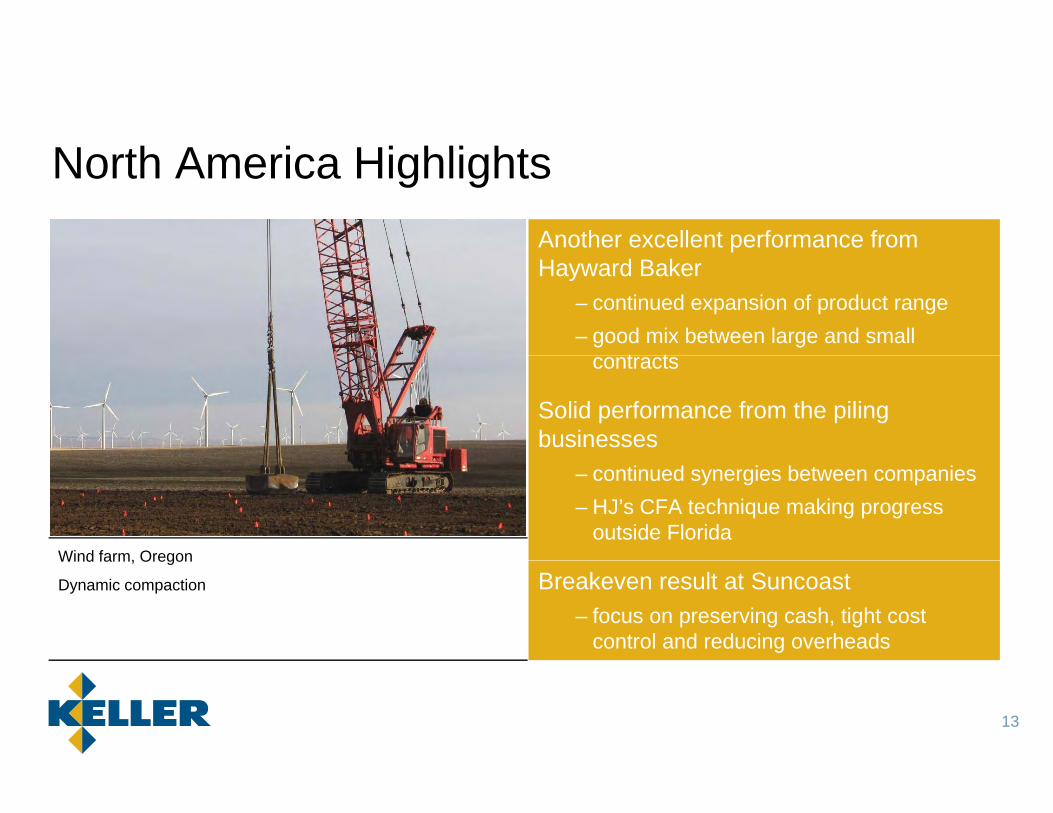
N th A i Hi hli htNorth America HighlightsAnother excellent performance from Hayward Baker
– continued expansion of product range – good mix between large and small
t tcontracts
Solid performance from the piling businesses
– continued synergies between companies– HJ’s CFA technique making progress
outside FloridaWind farm, Oregon
Breakeven result at Suncoast– focus on preserving cash, tight cost
control and reducing overheads
Wind farm, Oregon
Dynamic compaction
13

N th A i Old A i itiNorth America Olden AcquisitionOlden acquired in Q4 for US$13m
– annualised revenue of circa $35m
– leading earth retention contractor in Texas
– preferred supplier of retention solutions to the Texas D of T
Dallas Area Rapid Transport System Texas
the Texas D of T
– 75% of revenue comes from the public sectorDallas Area Rapid Transport System, Texas
Retaining wall with soil nails
– asset-backed acquisition
14

N th A i C St diNorth America Case Studies
Lake Okeechobee Florida Extension at hospital New YorkLake Okeechobee, Florida
Strengthening of dyke using TRD technology
Extension at hospital, New York
Compaction grouting to densify soils
15
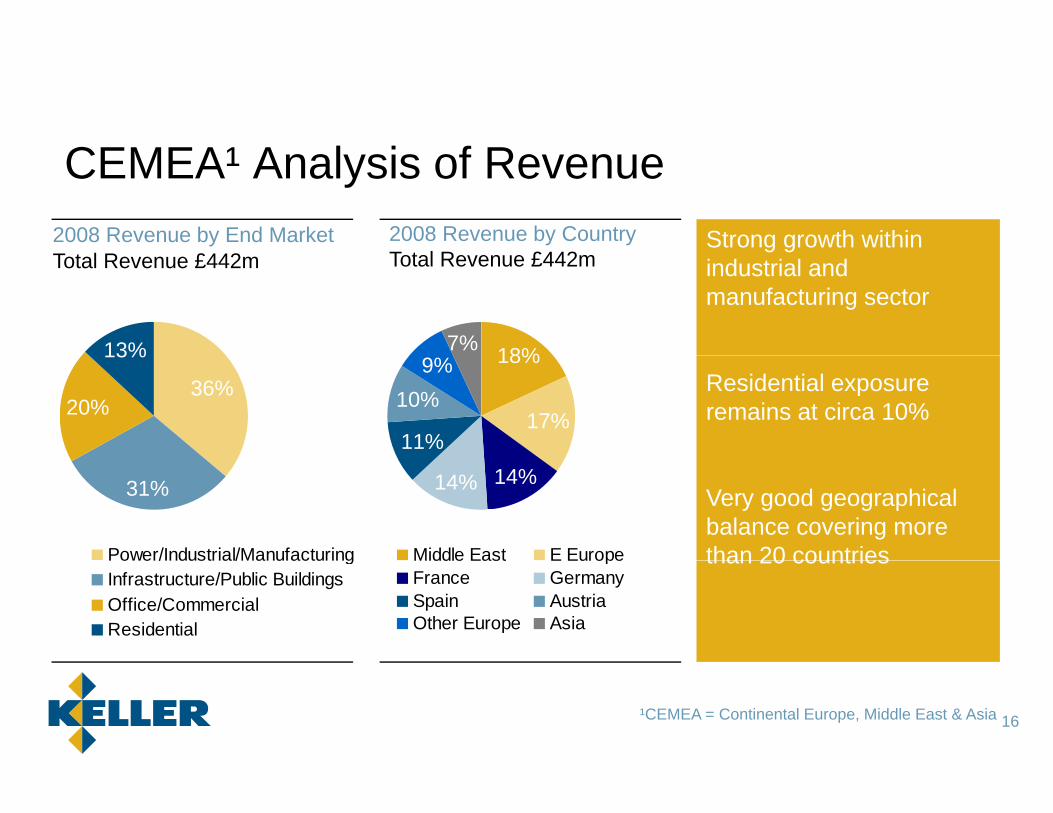
CEMEA¹ A l i f RStrong growth within
CEMEA¹ Analysis of Revenue2008 Revenue by End MarketT l R £442
2008 Revenue by CountryT t l R £442 industrial and
manufacturing sector
7% 18%13%
Total Revenue £442m Total Revenue £442m
Residential exposure remains at circa 10%
11%
10%9% 18%
17%36%
13%
20%
Very good geographical balance covering more than 20 countries
14%14%
Middle East E Europe
31%
Power/Industrial/Manufacturing than 20 countriesMiddle East E EuropeFrance GermanySpain AustriaOther Europe Asia
Power/Industrial/ManufacturingInfrastructure/Public BuildingsOffice/CommercialResidential
16¹CEMEA = Continental Europe, Middle East & Asia

CEMEA Hi hli htCEMEA HighlightsExcellent organic growth with a record operating margin of 11.3%
Good performance in Continental Europe from Germany France & Austriafrom Germany, France & Austria
– Spanish revenue off circa 20% but the business remains profitable
Strong growth in Eastern Europe and the Middle East
D bli f d fit b A iPedang Besar Railway, Malaysia
Ground improvement supporting a new electrified double track
Doubling of revenue and profit by Asia– Expansion of product range in India
17

E t EEastern EuropeRevenue increased by more than 40% to
80
100€m €m Revenue Order Book
50
60nearly €100m
– circa 60% in Poland – Polish zloty weakened against the euro by
20% in 2008
60
80
30
40
20% in 2008
Boreta acquired in Q4 for €8m– complements existing Czech operations
th t i b ildi h f d ti
20
40
10
20
– another step in building a heavy foundations business in Eastern Europe
Year end order book increased significantlyi l i f t t j t i P l d
0 2007 2007 2008 2008 0
10 – mainly infrastructure projects in Poland
Continued growth expected in 2009
18

Middl E tMiddle East
O d B kRRevenue almost doubled to circa €100m
100
120
70
80Order Book €m Revenue €m – circa 40% of revenue from Saudi Arabia
and circa 35% from the UAE– several large contracts in both countries
60
80
40
50
60Shift in revenue from Dubai to Abu Dhabi
– Dubai one third of UAE revenue in 2008 (two thirds in 2007)
20
4020
30 Year end order book halved– no current work in Dubai
better prospects in Abu Dhabi Saudi
0
20
0
10
2007 2008 2007 2008
– better prospects in Abu Dhabi, Saudi Arabia and Bahrain
19

CEMEA C St diCEMEA Case Studies
Eastern Europe Middle Eastp
New S8 Expressway, Warsaw
Diaphragm walls and Jet grouting
Khalifa Bin Zayed National Stadium, Abu Dhabi
Piling and Ground improvement
20

A t li Hi hli htAustralia HighlightsAnother excellent performance with
frevenue and operating profit both up by circa 20%
– more than 50% of revenue from infrastructure projects
– around A$60m of revenue from the Gateway project
All four businesses contributed strongly
New bridge in central Brisbane, Queensland
– wide product offering in the market place
Deterioration in the commercial sector in H2 2008g ,
Bored piling over waterInfrastructure projects in Queensland still coming on stream
21

UK Hi hli htUK HighlightsCirca 80% of profit earned in H1
– significant deterioration in market conditions
Recent acquisitions strengthened the product offering and management
St t k t t th t b i Q4
Foundations for Olympic Main Stadium London
Steps taken to cut the cost base in Q4– £1.3m of annual costs taken out of the
business– headcount reduction of 60Foundations for Olympic Main Stadium, London
Driven piles, CFA piles and Vibro concrete columns
headcount reduction of 60
22

C it l E ditCapital ExpenditureCapex increased significantly in the last two years to continue growth − targeted at Eastern Europe, the Middle East
and Australia
£7m of 2008 increase is due to exchange rate£7m of 2008 increase is due to exchange rate movements
Growing rapidly in heavy foundations which requires more expensive equipmentrequires more expensive equipment
Replacement programmes have improved efficiencies
2009 capex will be around £40m
23
O tl kOutlook• Tougher conditions in most of our markets
– experiencing a move to more publicly financed work
– techniques, people and equipment not sector specific
– actions taken to reduce cost base
– further measures will be taken as necessary
• Current order book down around 10% on a like-for-like basisslightly ahead in sterling terms– slightly ahead in sterling terms
• Well placed to weather the current conditions– broad geographical and product spread
– strong balance sheet
• Expect to outperform the general construction markets over the medium/long term
24

Appendix

G d E i i W ld idGround Engineering WorldwideActivities
% of 2008 revenue Regions of use Applications
Piling 36 % US/UKEastern EuropeMiddle EastAustralia
Foundation supportEarth retention
Ground improvement 26 % US/UKContinental EuropeMiddle East & AsiaAustralia
Foundation supportSeismic risk protection
Speciality Grouting 15 % US/UK Control of building settlementSpeciality Grouting 15 % US/UKContinental EuropeAsiaAustralia
Control of building settlementGroundwater control
Anchors, Nails, Minipiles 14 % US/UKContinental Europe
Excavation supportSlope protectionContinental Europe
AsiaSlope protectionUnderpinning
Post-tension concrete 9 % US Slab-on-grade foundationsHigh rise structures
26
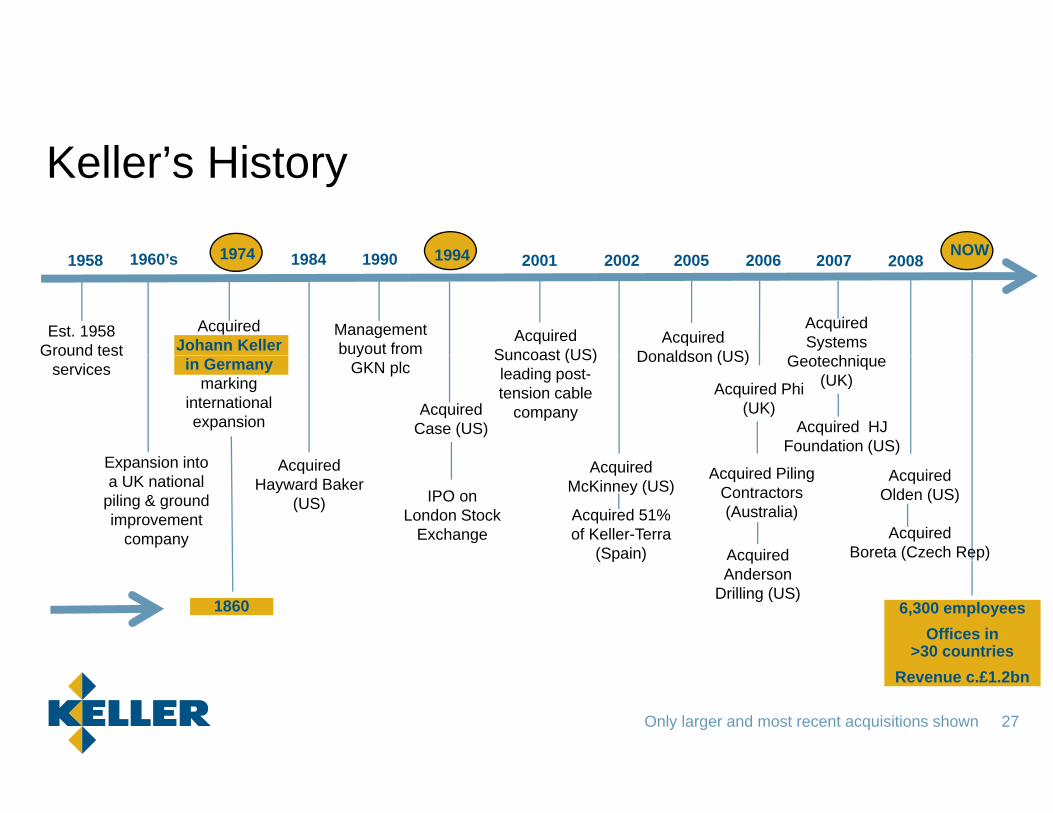
K ll ’ Hi tKeller’s History
1974 1994 NOW1958 1960’s 1974 1984 1990 1994 2001 2002 2005 2006 NOW
Est. 1958Ground test
Acquired Johann Keller
Management buyout from
Acquired Suncoast (US)
Acquired Donaldson (US)
2007
Acquired Systems
G t h i
2008
E i i t
Ground test services in Germany
marking international expansion
yGKN plc
Acquired Case (US)
Suncoast (US) leading post-tension cable
company
Donaldson (US)
Acquired Phi (UK)
Geotechnique (UK)
Acquired HJ Foundation (US)
Expansion into a UK national
piling & ground improvement
company
Acquired McKinney (US)
Acquired 51% of Keller-Terra
(Spain)
Acquired Hayward Baker
(US) IPO on London Stock
Exchange
Acquired Piling Contractors (Australia)
Acquired
Acquired Olden (US)
Acquired Boreta (Czech Rep)( p ) cqu ed
Anderson Drilling (US)
6,300 employeesOffices in
>30 countries
1860
( )
27
Revenue c.£1.2bn
Only larger and most recent acquisitions shown

St tStrategyKeller is the world’s largest and most profitable independent ground engineering contractor with leading market positions in many countrieswith leading market positions in many countries
• Market Drivers– More pressure to build on brownfield/marginal land
M biti d l t d i f t t j t– More ambitious development and infrastructure projects
• Our Objective– To extend our global leadership in specialist ground engineering through:
– Organic growth, particularly in growing markets– Targeted acquisitions
• Our ExecutionOur Execution– Transfer of technologies across our geographic regions– Expansion into new geographic regions– Acquisition and development of new technologies and techniques
28

US G hi CUS Geographic CoverageMAINE
WASHINGTON
CONNECTICUT
IDAHOMASSACHUSETTS
MICHIGAN
MINNESOTA
MONTANANEW HAMPSHIRE
NEW YORK
NORTHDAKOTA
OREGON
PENNSYLVANIA
RHODE ISLANDSOUTHDAKOTA
VERMONT
WASHINGTON
WISCONSIN
WYOMING NEW JERSEY
MARYLAND
CALIFORNIA
COLORADO
DELAWAREIOWA
KANSAS KENTUCKYMISSOURI
NEBRASKA
NEVADAOHIO
PENNSYLVANIA
UTAHVIRGINIA
WASHINGTON D.C.INDIANAILLINOIS
NORTHCAROLINA
NEW JERSEY
WESTVIRGINIA
AndersonCase
ALABAMA
ARKANSAS
GEORGIA
LOUISIANA
MISSISSIPPI
OKLAHOMASOUTH
CAROLINATENNESSEE
NEW MEXICOARIZONA
CAROLINA
McKinneyHayward BakerFLORIDA
TEXAS
MEXICOSuncoastHJ Foundation
29
MEXICO

E G hi CEurope Geographic CoverageSWEDEN
NETHERLANDS
GERMANY POLAND
UK
FRANCE
GERMANY POLAND
CZECH REP.
SLOVAKIA
SWITZERLANDHUNGARY
AUSTRIA
UKRAINE
ROMANIAHUNGARY
CROATIA
PORTUGAL
SPAIN ITALY
SLOVENIA
SERBIA
30
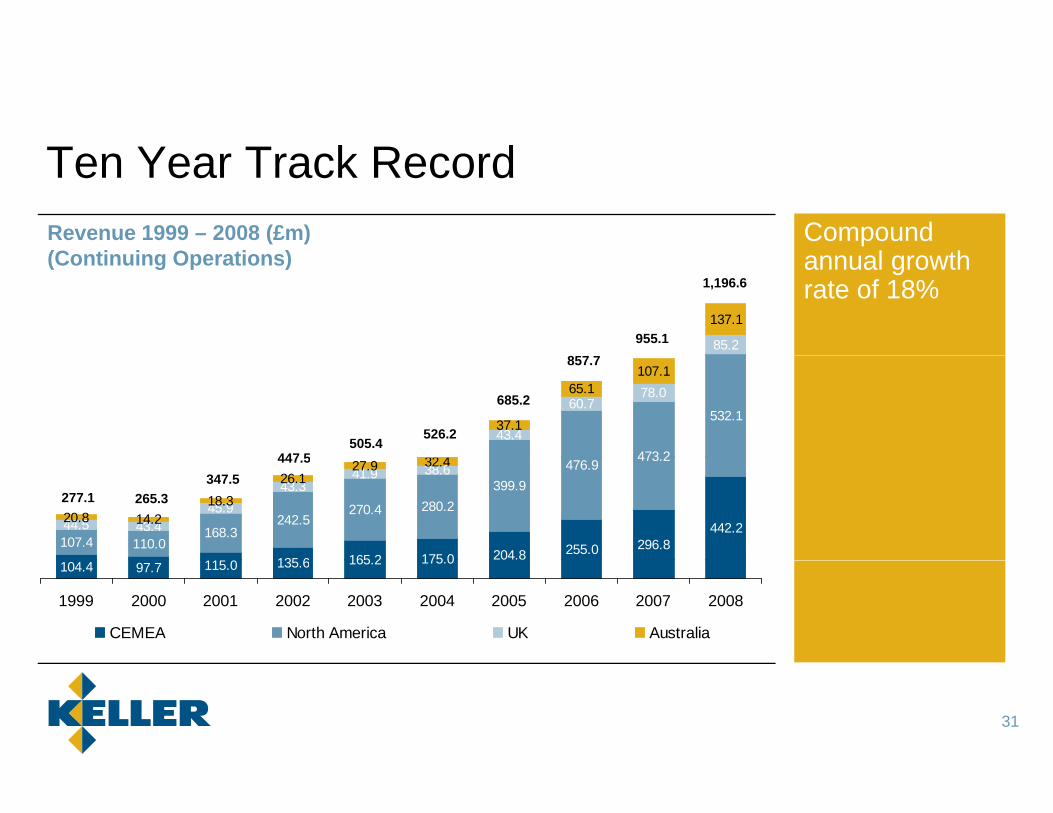
T Y T k R dCompound
l th
Ten Year Track RecordRevenue 1999 – 2008 (£m)(C ti i O ti )
85.2
137.1
annual growth rate of 18%
(Continuing Operations)
955.1
1,196.6
473 2
532.143.4
60.778.0
32 4
37.1
65.1107.1
447 5505.4
526.2
685.2
857.7
115 0 135 6 165 2 175 0 204.8 255.0 296.8442.2
107.4 110.0168.3
242.5270.4 280.2
399.9476.9 473.2
44.5 43.445.9
43.341.9 38.6
20.8 14.218.3
26.127.9 32.4
277.1 265.3347.5
447.5
104.4 97.7 115.0 135.6 165.2 175.0
1999 2000 2001 2002 2003 2004 2005 2006 2007 2008
CEMEA North America UK Australia
31

T Y T k R dCompound
l th
Ten Year Track RecordOperating Profit 1999 – 2008 (£m)(Continuing Operations)
2.714.7
19.4
annual growth rate of 25%
(Continuing Operations)
107.4
119.4
61.6
52.1
1.9
3.4
3.4
1.8
7.0
55.3
89.3
13 8 11 9 12 7 17 930.4
49.9
12.0 9.917.4
22.3 19.3 21.0
42.1
64.1
0.1 1.60.7
1.5 1.4
1.9
1.50.51.8 1.72.0
0.7 14.9
31.5 33.8 * 33.4
16.522.7
-1.8 -1.6 -1.8 -2.2 -2.8 -2.6 -3.2 -3.1 -3.1 -4.75.5 5.1 5.9 8.1 13.8 11.9 12.7 17.99 9
-0.11999 2000 2001 2002 2003 2004 2005 2006 2007 2008
Head Office Costs CEMEA US UK Australia
32*pre-exceptionals

Fi i l P fOperating margin* Dividend policyDividend per share
Financial Performance
10%
12% - 15% annual growth subject to 3x cover 18
20
22
6%
8%
10
12
14
16
2%
4%
4
6
8
10
0%
2%
99 00 01 02 03 04 05 06 07 080
2
99 00 01 02 03 04 05 06 07 08
33*from continuing operations
