kelvin k. droegemeier university of oklahoma 29 september 2010 weather and climate prediction how...
TRANSCRIPT

Kelvin K. DroegemeierKelvin K. DroegemeierUniversity of OklahomaUniversity of Oklahoma
29 September 201029 September 2010
Weather and Climate Weather and Climate PredictionPrediction
How Clear is the Crystal How Clear is the Crystal Ball?Ball?

How Many of You Have Been How Many of You Have Been Impacted by Weather in the Past 6 Impacted by Weather in the Past 6
Months?Months?

How Many of You Have Been How Many of You Have Been Impacted by Climate Change in the Impacted by Climate Change in the
Past 6 Months?Past 6 Months?


Weather, Weather, Climate, and Climate, and Our EconomyOur Economy
40% of the $10T US 40% of the $10T US GDP is Weather & GDP is Weather & Climate-SensitiveClimate-Sensitive
Dutton (2002)Dutton (2002)
$2-3B Spent Annually$2-3B Spent AnnuallyOn Both Weather/ClimateOn Both Weather/ClimateResearch Research andand Operations Operations

Cargo shippingCargo shipping– Most expeditious route can save $40,000 per voyage – thousands of ships travel Most expeditious route can save $40,000 per voyage – thousands of ships travel
continuously!continuously!– ExamplesExamples
High temperature and humidity can cause grain to germinate in cargo holdsHigh temperature and humidity can cause grain to germinate in cargo holds Ships affected differently by wavelength of ocean swellsShips affected differently by wavelength of ocean swells
Commercial aviation Commercial aviation – Single diversion averages $10,000 per domestic flightSingle diversion averages $10,000 per domestic flight– Not unusual for one carrier to have 70 diversions at a hub for a single weather event (1-2 Not unusual for one carrier to have 70 diversions at a hub for a single weather event (1-2
hours)hours)– Cost is $700,000 per eventCost is $700,000 per event– Industry loses $1-2 B per year due to weatherIndustry loses $1-2 B per year due to weather
Specific ExamplesSpecific Examples
Source: Weathernews, Inc.Source: Weathernews, Inc.

About About 50%50% of the loss is of the loss is deemed preventable with deemed preventable with
better weather and better weather and climate forecasts!climate forecasts!

WeatherWeather vs Climate vs Climate

WeatherWeather vs Climate vs Climate
Source: Oklahoma Climatological Survey

Weather vs Weather vs ClimateClimate
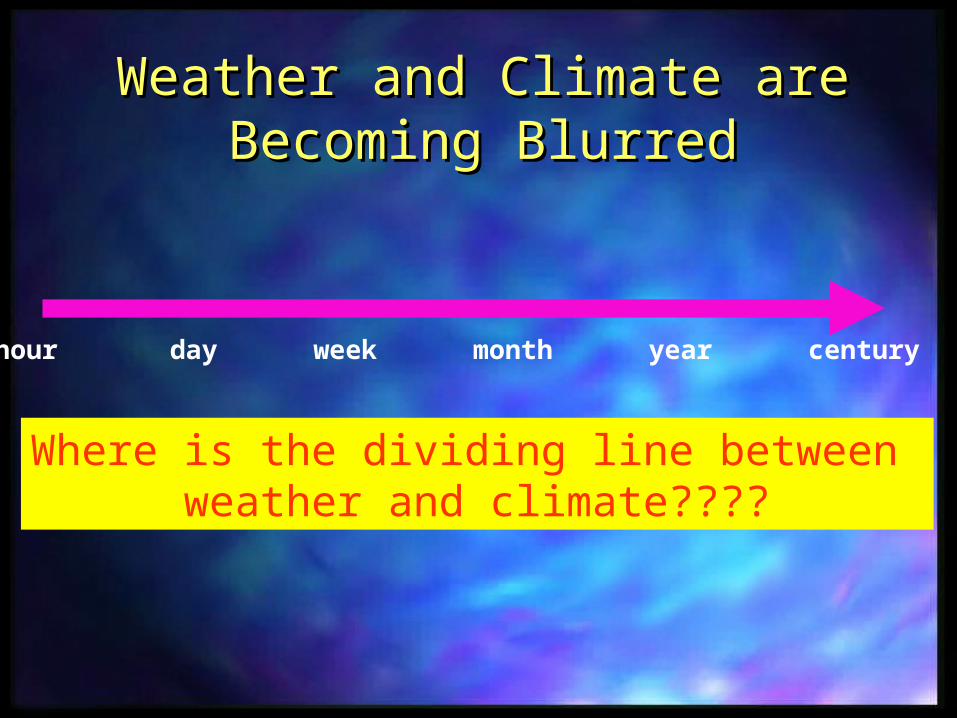
Weather and Climate are Weather and Climate are Becoming BlurredBecoming Blurred
minute hour day week month year century millennium
Where is the dividing line between weather and climate????

Have You Ever Have You Ever Wondered…Wondered…
If astronomers can predict the If astronomers can predict the occurrence of comets decades occurrence of comets decades
in advance, why can’t in advance, why can’t meteorologists meteorologists
predict the weather even 2 predict the weather even 2 weeks from now?weeks from now?

Peterson (2010)
Time and Space Scales…Time and Space Scales…

Copyright © 2003 WGN-TV
Computer ModelsComputer Models are the Primary Source are the Primary Source of Information for All Weather & Climate of Information for All Weather & Climate
PredictionsPredictions

The Prediction ProcessThe Prediction Process
Analyze ResultsAnalyze Results
Com
pare
and
Ver
ify
Com
pare
and
Ver
ify
Observe the AtmosphereObserve the Atmosphere
Identify and ApplyIdentify and ApplyPhysical LawsPhysical Laws
Create a MathematicalCreate a MathematicalModelModel
Create and Run aCreate and Run aComputer ModelComputer Model

Observe the Atmosphere Observe the Atmosphere
Upper-AirUpper-AirBalloonsBalloons
SatellitesSatellites
NEXRAD NEXRAD Doppler Doppler
RadarRadar
Commercial AircraftCommercial Aircraft
AutomatedAutomatedSurface Surface
NetworksNetworks

The Prediction ProcessThe Prediction Process
Analyze ResultsAnalyze Results
Com
pare
and
Ver
ify
Com
pare
and
Ver
ify Identify and ApplyIdentify and Apply
Physical LawsPhysical Laws
Create a MathematicalCreate a MathematicalModelModel
Create and Run aCreate and Run aComputer ModelComputer Model
Observe the AtmosphereObserve the Atmosphere

Identify & Apply Physical Identify & Apply Physical LawsLaws
F=ma

The Prediction ProcessThe Prediction Process
Analyze ResultsAnalyze Results
Com
pare
and
Ver
ify
Com
pare
and
Ver
ify
Create a MathematicalCreate a MathematicalModelModel
Create and Run aCreate and Run aComputer ModelComputer Model
Observe the AtmosphereObserve the Atmosphere
Identify and ApplyIdentify and ApplyPhysical LawsPhysical Laws

Create a Mathematical ModelCreate a Mathematical Model

The Prediction ProcessThe Prediction Process
Analyze ResultsAnalyze Results
Com
pare
and
Ver
ify
Com
pare
and
Ver
ify
Create and Run aCreate and Run aComputer ModelComputer Model
Observe the AtmosphereObserve the Atmosphere
Identify and ApplyIdentify and ApplyPhysical LawsPhysical Laws
Create a MathematicalCreate a MathematicalModelModel

Create Computer Model Create Computer Model
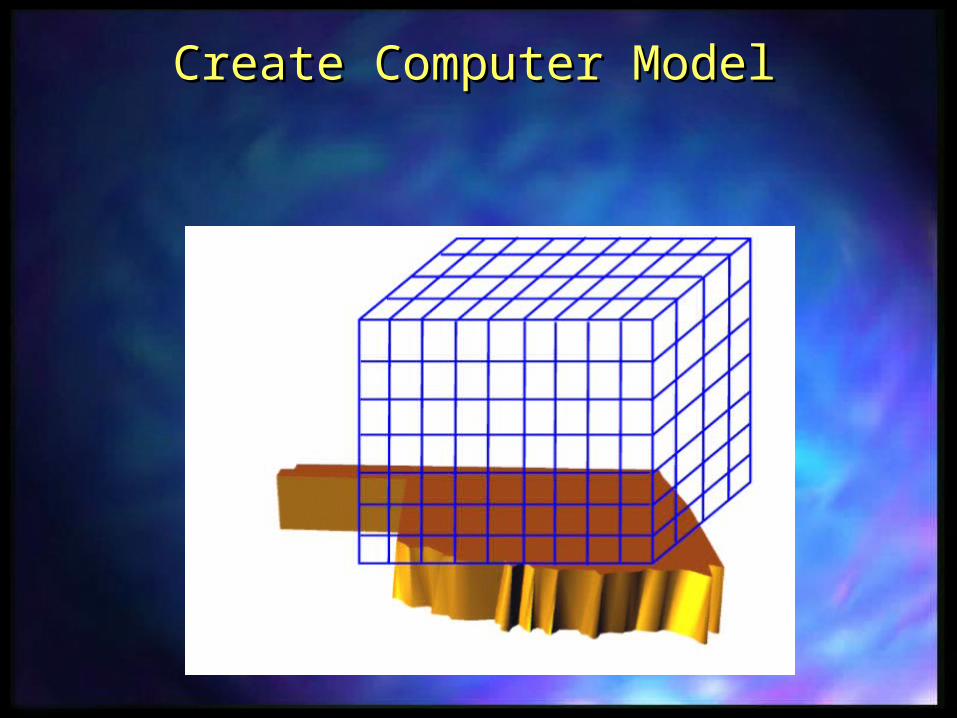
Create Computer Model Create Computer Model

Solve highly nonlinear partial differential equations Solve highly nonlinear partial differential equations East/West WindEast/West Wind North/South WindNorth/South Wind Vertical WindVertical Wind TemperatureTemperature Water VaporWater Vapor Cloud WaterCloud Water Precipitating WaterPrecipitating Water Cloud IceCloud Ice GraupelGraupel HailHail Surface TemperatureSurface Temperature Surface MoistureSurface Moisture Soil TemperatureSoil Temperature Soil MoistureSoil Moisture Sub-Grid TurbulenceSub-Grid Turbulence
Run the Computer Model Run the Computer Model

Over the course of a single forecast, the Over the course of a single forecast, the computercomputermodel solves billions of model solves billions of equationsequations
Requires the fastest Requires the fastest supercomputers in the supercomputers in the world -- capable ofworld -- capable ofperforming trillions of performing trillions of calculationscalculationseach secondeach second
Run the Computer Model Run the Computer Model

The Prediction ProcessThe Prediction Process
Analyze ResultsAnalyze Results
Com
pare
and
Ver
ify
Com
pare
and
Ver
ify
Observe the AtmosphereObserve the Atmosphere
Identify and ApplyIdentify and ApplyPhysical LawsPhysical Laws
Create a MathematicalCreate a MathematicalModelModel
Create and Run aCreate and Run aComputer ModelComputer Model

A Typical Forecast From Today’s A Typical Forecast From Today’s Operational ModelsOperational Models
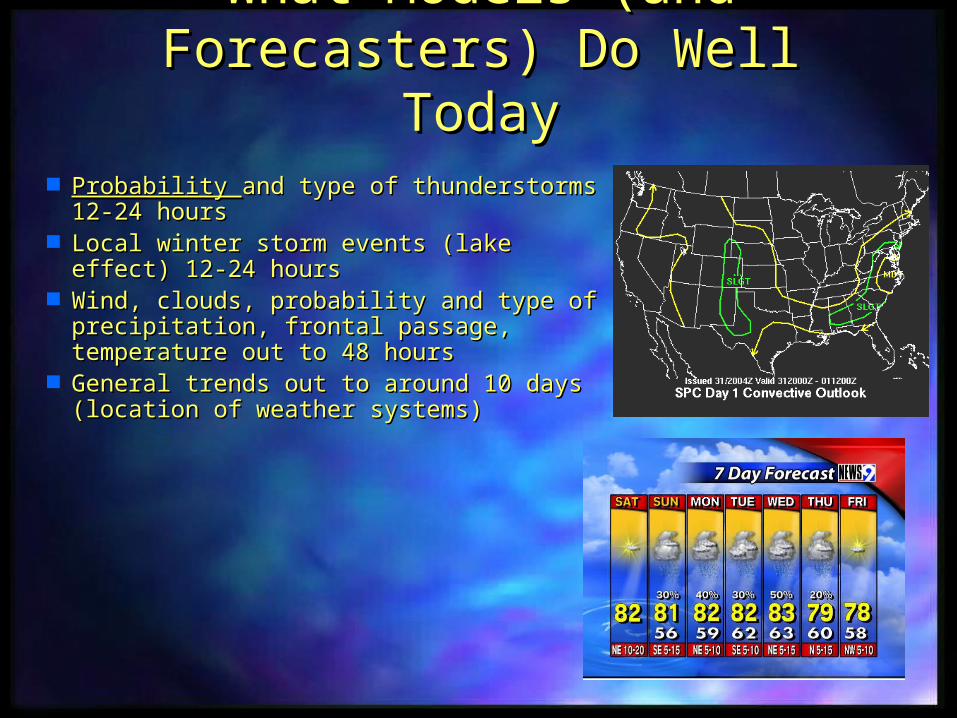
What Models (and What Models (and Forecasters) Do Well TodayForecasters) Do Well Today
Probability Probability and type of thunderstorms and type of thunderstorms 12-24 hours12-24 hours
Local winter storm events (lake effect) Local winter storm events (lake effect) 12-24 hours12-24 hours
Wind, clouds, probability and type of Wind, clouds, probability and type of precipitation, frontal passage, precipitation, frontal passage, temperature out to 48 hourstemperature out to 48 hours
General trends out to around 10 days General trends out to around 10 days (location of weather systems)(location of weather systems)

What Models (and What Models (and Forecasters) Do NOT Do Well Forecasters) Do NOT Do Well
TodayToday Locating and timing of thunderstorm Locating and timing of thunderstorm
development and decaydevelopment and decay Type and timing of winter Type and timing of winter
precipitationprecipitation Amount and location of rainfall, Amount and location of rainfall,
especially from thunderstorms – and especially from thunderstorms – and uncertaintyuncertainty
Hurricane landfallHurricane landfall

Like Politics, Weather is Local!!Like Politics, Weather is Local!!

A Foundational QuestionA Foundational Question
. . . explicitly predict this. . . explicitly predict thistype of weather?type of weather?
Can computer forecastCan computer forecasttechnology. . .technology. . .

Example : March 28, 2000 Fort Example : March 28, 2000 Fort Worth Tornadic StormsWorth Tornadic Storms

Tornado

NWS 12-hr Computer Forecast Valid at 6 pm NWS 12-hr Computer Forecast Valid at 6 pm CDTCDT
No No Explicit EvidenceExplicit Evidence of Precipitation in North of Precipitation in North TexasTexas

Reality Was Quite Different!Reality Was Quite Different!

6 pm 7 pm 8 pmR
adar
Hourly Radar Observations(Fort Worth Shown by the Pink Star)

6 pm 7 pm 8 pmR
adar
Fcs
t W
ith
Rad
ar D
ata
2 hr 3 hr 4 hr
Xue et al. (2003)
Fort Worth
Fort Worth

As a Forecaster As a Forecaster Worried About Worried About This Reality… This Reality…
7 pm

As a Forecaster As a Forecaster Worried About Worried About This Reality… This Reality…
How Much How Much Trust Would Trust Would You Place in You Place in This Model This Model Forecast? Forecast?
3 hr
7 pm

Forecast #1Forecast #1 Forecast #2Forecast #2
Forecast #3Forecast #3 Forecast #5Forecast #5Forecast #4Forecast #4
Actual RadarActual Radar

Probability of Intense PrecipitationProbability of Intense Precipitation
Model Forecast Radar Observations

The Million Dollar The Million Dollar Question: Will Question: Will
Computer Models Ever Computer Models Ever Be Able to Be Able to PredictPredict
Tornadoes?Tornadoes?

Warn on Explicit Warn on Explicit Forecast?Forecast?

What About Climate??What About Climate??


Humans Have Transformed Earth!Humans Have Transformed Earth!
City Lights from Space


““Concentrations Concentrations of atmospheric of atmospheric greenhouse greenhouse gases … have gases … have continued to continued to increase as a increase as a result of human result of human activities”activities”

““The global-average surface temperature The global-average surface temperature has increased over the 20th century by has increased over the 20th century by
0.6±0.2ºC”0.6±0.2ºC”
From the Hadley Centre, UK Source: IPCC

Source: IPCC
““Reconstructions of climate data for the last Reconstructions of climate data for the last 1000 years ... indicate this warming was 1000 years ... indicate this warming was
unusual and is unlikely to be entirely natural in unusual and is unlikely to be entirely natural in origin”origin”
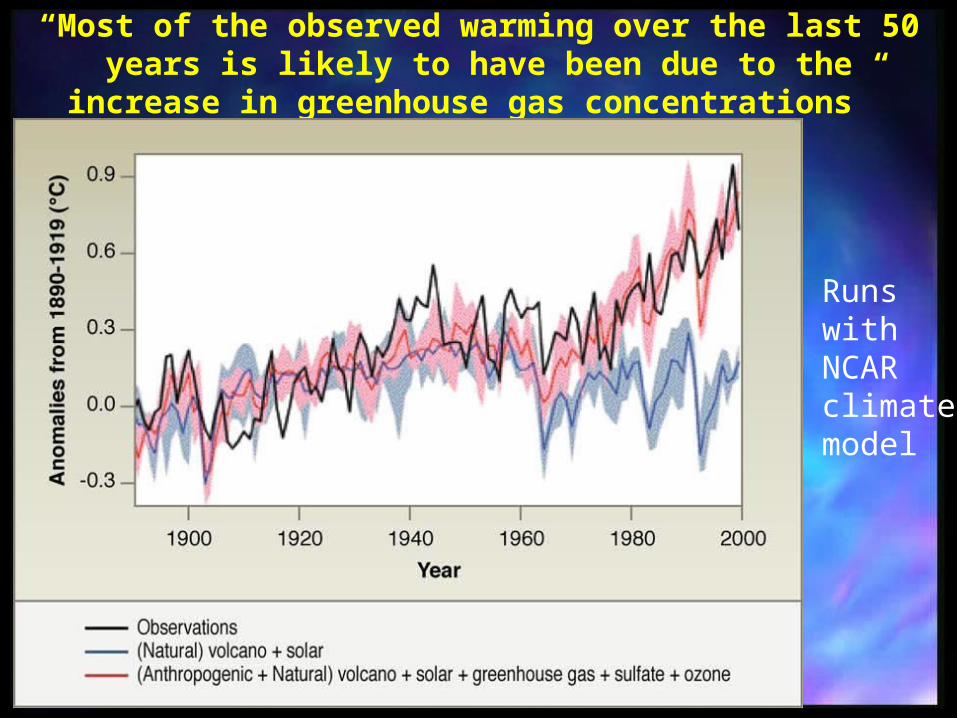
“Most of the observed warming over the last 50 years is likely to have been due to the increase in greenhouse gas
concentrations”
Runs with NCAR climate model

“The projected rate of warming is much larger than the observed changes during the 20th century and is very likely to be without precedent during at least the last 10,000 years”


Seasonal Number of Seasonal Number of Favorable Severe EnvironmentsFavorable Severe Environments

US Central Plains RegionUS Central Plains Region

Normalized Joint CAPE - Shear Normalized Joint CAPE - Shear Distributions Distributions
Central United StatesCentral United States

Continued Reliance Upon Continued Reliance Upon Models Models
IPCC

Global “Warming” isn’t the Global “Warming” isn’t the Only Issue: Precipitation!!!Only Issue: Precipitation!!!

Mean Global Energy Consumption, Mean Global Energy Consumption, 20012001
(Total 13.2 TW; US is 3.2 TW)(Total 13.2 TW; US is 3.2 TW)
Gas Hydro Renew
4.66
2.892.98
0.285
1.24
0.2860.92
0
1
2
3
4
5
TW
Oil Coal Biomass Nuclear
Nate Lewis, Caltech
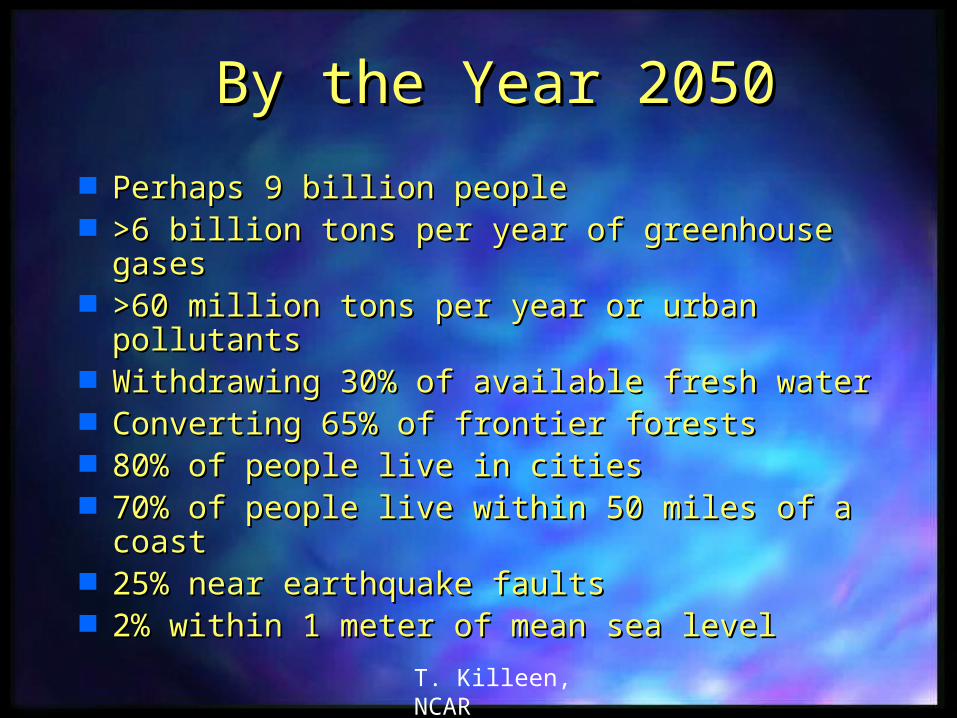
By the Year 2050By the Year 2050
Perhaps 9 billion peoplePerhaps 9 billion people >6 billion tons per year of greenhouse gases>6 billion tons per year of greenhouse gases >60 million tons per year or urban pollutants>60 million tons per year or urban pollutants Withdrawing 30% of available fresh waterWithdrawing 30% of available fresh water Converting 65% of frontier forestsConverting 65% of frontier forests 80% of people live in cities80% of people live in cities 70% of people live within 50 miles of a coast70% of people live within 50 miles of a coast 25% near earthquake faults25% near earthquake faults 2% within 1 meter of mean sea level2% within 1 meter of mean sea level
T. Killeen, NCAR

N. Lewis Caltech

~160,000 km~160,000 km22 of Photovoltaic of Photovoltaic Devices Would Meet US Energy Devices Would Meet US Energy
NeedsNeeds
3.3 TW
C. Somerville, Stanford

(in the U.S. in 2002)
1-4¢ 2.3-5.0¢ 6-8¢ 5-7¢
Now the Bad News!Now the Bad News!
6-7¢
25-50¢
Cos
t , ¢
/kW
-hr
0
5
10
15
20
25
Coal Gas Oil Wind Nuclear Solar
N. Lewis, Caltech
No storage
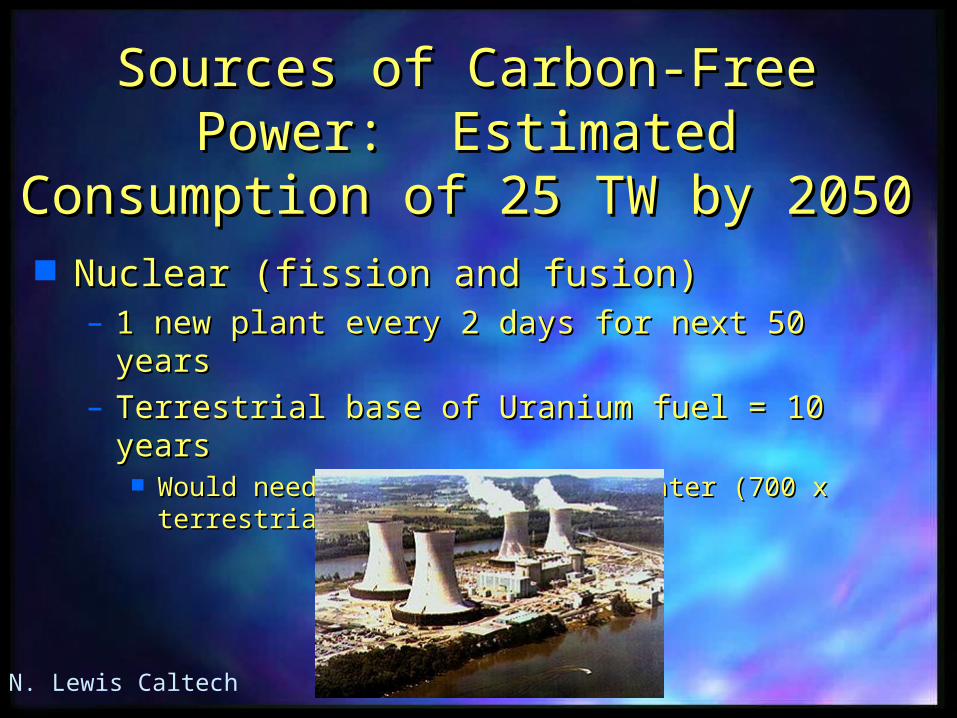
Sources of Carbon-Free Power: Sources of Carbon-Free Power: Estimated Consumption of 25 TW Estimated Consumption of 25 TW
by 2050by 2050 Nuclear (fission and fusion)Nuclear (fission and fusion)
– 1 new plant every 2 days for next 50 years1 new plant every 2 days for next 50 years– Terrestrial base of Uranium fuel = 10 yearsTerrestrial base of Uranium fuel = 10 years
Would need to mine U from sea water (700 x terrestrial Would need to mine U from sea water (700 x terrestrial resource base)resource base)
N. Lewis Caltech

Peering into the Crystal BallPeering into the Crystal Ball Weather forecasting and severe weather Weather forecasting and severe weather
warning are about to experience a quantum warning are about to experience a quantum leap in capability – prediction accuracy and leap in capability – prediction accuracy and quantification of uncertainty (Warn on quantification of uncertainty (Warn on Forecast)Forecast)
International agreement exists about global International agreement exists about global warming and its cause – but the honest warming and its cause – but the honest answer is that we don’t know what the future answer is that we don’t know what the future hold apart from what our models tell us – and hold apart from what our models tell us – and they’re imperfetthey’re imperfet
Failure to diversify energy portfolio could Failure to diversify energy portfolio could mean substantial changes in our way of life – mean substantial changes in our way of life – we’ll know in the next 20 yearswe’ll know in the next 20 years