kelvinator australia pty limited soil vapour ... · parsons brinckerhoff | keswick k3 site vapour...
TRANSCRIPT

Kelvinator Australia Pty Limited Soil Vapour Investigations for Identification of Trichloroethene - Ashford Road & Everard Avenue, Keswick, South Australia [K3 site] 26 February 2015

Document information
Client: Kelvinator Australia Pty Limited Title: Soil Vapour Investigations for Identification of Trichloroethene - Ashford Road & Everard Avenue, Keswick, South Australia [K3 site] Document No: Keswick K3 Site Vapour December 2014_2201557b Date: 26 February 2015 Rev Date Details
0 19/02/2015 Draft - Privileged and Confidential
1 26/02/2015 Final
Author, Reviewer and Approver details
Prepared by: Adrian Heggie Date: 26/02/2015 Signature:
Reviewed by: Nivari Jayasinghe Date: 19/02/2015 Signature:
Approved by: Adrian Heggie Date: 26/02/2015 Signature:
Distribution
Kelvinator Australia Pty Limited, Parsons Brinckerhoff file, Parsons Brinckerhoff Library
©Parsons Brinckerhoff Australia Pty Limited 2015
Copyright in the drawings, information and data recorded in this document (the information) is the property of Parsons Brinckerhoff. This document and the information are solely for the use of the authorised recipient and this document may not be used, copied or reproduced in whole or part for any purpose other than that for which it was supplied by Parsons Brinckerhoff. Parsons Brinckerhoff makes no representation, undertakes no duty and accepts no responsibility to any third party who may use or rely upon this document or the information.
Document owner
Parsons Brinckerhoff Australia Pty Limited ABN 80 078 004 798 Level 27 Ernst & Young Centre 680 George Street Sydney NSW 2000 GPO Box 5394 Sydney NSW 2001 Australia Tel: +61 2 9272 5100 Fax: +61 2 9272 5101 www.pbworld.com Certified to ISO 9001, ISO 14001, OHSAS 18001

Parsons Brinckerhoff | Keswick K3 Site Vapour December 2014_2201557b i
Kelvinator Australia Pty Limited Soil Vapour Investigations for Identification of Trichloroethene - Ashford Road & Everard Avenue, Keswick, South Australia [K3 site]
Contents Page number
Executive summary iv
1. Introduction 1
1.1 Purpose of this report 1
1.2 Background information 1
1.3 Objectives 1
1.4 Scope of works 2
2. Site information 3
2.1 Investigation area identification 3
2.2 Land use 3
2.3 Physical conditions 3
3. Contaminants of interest 4
4. Conceptual model of contaminant migration & exposure pathways 5
5. Sampling plan and methods 6
5.1 Rationale for the selection of sampling methods 6
5.2 Sub-pavement soil vapour sampling plan 6
5.3 Surface mass flux sampling plan 6
5.4 Ambient air sampling plan 7
5.5 Sub-slab soil vapour passive sampling method 7
5.6 Passive flux chamber method 7
5.7 Ambient air sampling method 9
5.8 Groundwater sampling and analysis 9
6. Data quality objectives 10
6.1 Planning process 10
6.2 Data quality control – field and laboratory 10
7. Reference guidance 12
7.1 Soil vapour concentrations 12
7.2 Surface flux rates 12
7.3 Ambient air 13

Parsons Brinckerhoff | Keswick K3 Site Vapour December 2014_2201557b ii
Kelvinator Australia Pty Limited Soil Vapour Investigations for Identification of Trichloroethene - Ashford Road & Everard Avenue, Keswick, South Australia [K3 site]
7.4 Groundwater 13
8. Vapour sampling results & discussion 14
8.1 Weather conditions over sampling periods 14
8.2 Sub-pavement conditions 14
8.3 Sub-pavement vapour concentrations 14
8.4 Surface flux calculations 15
8.5 Ambient indoor and outdoor vapour concentrations 18
9. Groundwater sampling results 19
9.1 Groundwater concentrations – K1 site 19
10. Assessment of data quality 21
10.1 Quality assurance – sub-pavement vapours 21
10.2 Quality assurance – flux and ambient air 21
10.3 Conclusion on data quality assurance 22
11. Summary & Conclusions 23
12. Limitations 25
13. References 27
List of tables Page number
Table 7.1 Interim screening level criteria for soil vapour concentrations of chlorinated VOCs. Criteria are applicable to shallow soil (to 1 m below ground/floor level) 12
Table 7.2 Groundwater investigation levels 13 Table 8.1 Toxicity criteria for TCE and PCE 17 Table 8.2 Exposure parameters – commercial/industrial indoor workers 17 Table 9.1 Groundwater and well depths 19 Table 9.2 Concentrations of TCE and PCE in groundwater on the K1 site, Everard Avenue,
Keswick 19
List of appendices Figures Appendix A Sub-slab soil vapour – summary table Appendix B Flux Results - Summary Tables Appendix C Indoor & Outdoor Ambient Air Measurements - Data Summary Table Appendix D Daily Weather Observations - Adelaide Airport, November & December 2014 Appendix E Laboratory Report - Sub-slab soil vapour Appendix F Laboratory Report - Flux and ambient air Appendix G Photographs

Parsons Brinckerhoff | Keswick K3 Site Vapour December 2014_2201557b iii
Kelvinator Australia Pty Limited Soil Vapour Investigations for Identification of Trichloroethene - Ashford Road & Everard Avenue, Keswick, South Australia [K3 site]

Parsons Brinckerhoff | Keswick K3 Site Vapour December 2014_2201557b iv
Kelvinator Australia Pty Limited Soil Vapour Investigations for Identification of Trichloroethene - Ashford Road & Everard Avenue, Keswick, South Australia [K3 site]
Executive summary In November 2014, Kelvinator Australia Pty Limited (Kelvinator) engaged Parsons Brinckerhoff Australia Pty Limited (Parsons Brinckerhoff), to measure soil vapours at the commercial property 56-60 Everard Avenue, Keswick, South Australia. This report presents the findings of soil vapour, surface flux and indoor air measurements, relating particularly to trichloroethene, in and near to the commercial property. Sampling was carried out over November-December 2014.
A separate and additional component of this report was to carry out another round of sampling of the groundwater at three existing monitoring wells at an adjacent commercial property at 62-70 Everard Avenue, Keswick.
For the purposes of this report, the property subject to the soil vapour investigations was termed the K3 site, while the adjacent property to the east, where groundwater investigations were conducted, was termed the K1 site (refer to Figure 1).
Background Parsons Brinckerhoff understands that Kelvinator was a former owner of the K1 and the K3 sites. The K3 site is currently owned and occupied by a business operating touring coaches.
It is known that the soil and groundwater at the K1 site has been impacted by trichloroethene (TCE), tetrachloroethene (PCE) and some other volatile organic compounds (VOCs) to lesser degrees of impact. Soil vapour investigations conducted by Parsons Brinckerhoff in March 2014 around the perimeter streets of the K1 site indicated that there has been some migration of VOC vapours from the K1 site towards the K3 site.
Because VOCs, particularly TCE, may be migrating away from the K1 site and possibly under the K3 site, and because the former Kelvinator activities on the K3 site are not known with certainty, an assessment of VOC vapours beneath the K3 site was undertaken in November-December 2014 for precautionary purposes.
Investigation objectives The overall objective of the investigations was to ensure that there was no unacceptable health risk to occupants of the commercial building on the K3 site as a consequence of ground vapours, particularly of TCE which was known to be present in the ground vapours beneath the K1 site. A related objective was to assess, to the extent possible given the limited number of sampling locations, whether there were local sources of TCE beneath the K3 site.
Existing groundwater monitoring wells on an adjacent to the K1 site were sampled again to confirm the results reported from sampling 12 months earlier.
Scope of works The scope of works for the vapour measurements on Ashford Road and the K3 commercial building consisted of the following three measurement components:
the measurement of sub-slab VOC vapours at two locations on the footpaths of Ashford Road and at 5 locations within or immediately adjacent to the K3 commercial building;

Parsons Brinckerhoff | Keswick K3 Site Vapour December 2014_2201557b v
Kelvinator Australia Pty Limited Soil Vapour Investigations for Identification of Trichloroethene - Ashford Road & Everard Avenue, Keswick, South Australia [K3 site]
the measurement of surface flux of VOC vapours immediately beside each of the sub-slab sampling locations; and
the measurement of ambient air at three locations within the commercial building and at two locations outside the building.
All three measurement regimes were used as lines of evidence for the evaluation of health risks for occupants of the commercial building. At the time of the vapour measurements at the K3 site and in Ashford Road, three existing groundwater monitoring wells at the K1 property were sampled and analysed for VOCs.
Results Retesting of soil vapours along Ashford Road
Beneath the pavement of the footpaths of Ashford Road, concentrations of TCE and PCE were low in so much as they were less than their respective screening level guidance values given in the NEPM 2013 documentation. TCE and PCE were the only chlorinated VOCs detected in the sub-pavement soil vapour.
TCE and PCE concentrations beneath the floor of the K3 site commercial building
Of the five sub-slab soil vapour test points on the K3 site, TCE concentrations exceeded the NEPM 2013 criterion at four locations. Only one location, in the north-western sector (K3SS7a) could be considered significantly high. With the exception of K3SS7a, the relatively even concentrations over the study area suggests the immediate vapour source is TCE in groundwater beneath the K3 site, although from the small number of sampling locations there is only low level confidence in this conclusion. The higher soil vapour concentration recorded at K3SS7a ( 2,300 µg/m3) suggests there may be a local source of TCE impact in soil in the north-western sector of the building.
Surface fluxes of TCE and PCE from the floor of the commercial building
The NEPM criteria for soil vapour concentrations of chlorinated hydrocarbons (NEPM 2013, Schedule B1, Table 1A(2)) are presented in that guidance document as tier 1 screening level criteria, which, if exceeded, indicate a need for a more site specific investigation. That further investigation was carried out in December 2014, concurrently with the sub-slab vapour testing, by means of surface flux measurements and indoor air sampling. The measurement of surface flux beside each of the sub-slab test points showed that fluxes of TCE and PCE through the floor into the building were trivial. When converted into calculated indoor air concentrations the fluxes were found to contribute only a minor amount to the actual indoor air concentrations, which were greatly less than acceptable air concentrations based on literature toxicity values and acceptable risk levels.
Indoor air measurements of TCE and PCE supported the results of the mass flux chamber measurements in so much as measured ambient air concentrations were low, greatly less than acceptable concentrations. Further evidence that the sub-slab TCE vapour is not adversely affecting the indoor air quality can be seen from the ambient air data showing that indoor air concentrations of TCE were essentially not different from outdoor concentrations of TCE.
Conclusions
In summary, the soil vapour testing on Ashford Road and the K3 site indicated:
The concentrations of TCE and PCE in soil vapour beneath Ashford Road are not significantly high, suggesting that the migration of TCE and PCE from the K1 site to the K2 site is weak, if any.

Parsons Brinckerhoff | Keswick K3 Site Vapour December 2014_2201557b vi
Kelvinator Australia Pty Limited Soil Vapour Investigations for Identification of Trichloroethene - Ashford Road & Everard Avenue, Keswick, South Australia [K3 site]
The low to moderate concentrations of TCE beneath the floor slab of the commercial building on the K3 make only a very minor contribution to the indoor air concentrations in the building. And ,the measured indoor air concentrations of TCE and PCE are greatly less than the acceptable risk based concentrations derived from the literature (WHO and US EPA IRIS data base).
The relatively low TCE and PCE sub-slab soil vapour concentrations on the K3 site suggest the source is from groundwater and not from local areas of impacted soil. However, the single high concentration in the north-western sector of the building, K3SS7a, indicates a local source may exist in the soil.
Finally, resampling of three existing wells at the K1 site showed that concentrations had not changed significantly since previous sampling 12 months earlier. And, one monitoring well again showed substantially high concentrations of TCE. Direction of groundwater gradient flow cannot be determined from these three wells.

Parsons Brinckerhoff | Keswick K3 Site Vapour December 2014_2201557b 1
Kelvinator Australia Pty Limited Soil Vapour Investigations for Identification of Trichloroethene - Ashford Road & Everard Avenue, Keswick, South Australia [K3 site]
1. Introduction 1.1 Purpose of this report In November 2014, Kelvinator Australia Pty Limited (Kelvinator) engaged Parsons Brinckerhoff Australia Pty Limited (Parsons Brinckerhoff), to conduct field investigations in relation to potential soil vapours at the commercial property 56-60 Everard Avenue, Keswick, South Australia. This report presents the findings of soil vapour, surface flux and indoor air measurements, relating particularly to trichloroethene, in and near to the commercial property. Measurements were carried out over November-December 2014.
A separate and additional component of this report was to carry out another round of sampling of the groundwater at three existing monitoring wells at the commercial property at 62-70 Everard Avenue, Keswick.
1.2 Background information Parsons Brinckerhoff understands that Kelvinator was a former owner of the commercial property subject to this investigation, as well as some adjoining and near-by properties. For the purposes of this investigation the property investigated will be referred to as the K3 site. The K3 site is currently owned and occupied by a business operating touring coaches.
The activities conducted on the K3 site during Kelvinator’s former tenure are not currently known with any certainty, however, it is known that the adjacent property to the east, 62-70 Everard Avenue (the K1 site), also formerly owned by Kelvinator, has trichloroethene (TCE), tetrachloroethene (PCE) and some other volatile organic compounds (VOCs) to lesser degrees of impact, in soil and groundwater (BlueSphere Environmental, December 2013; Terra Environment, December 2013). Soil vapour investigations around the perimeter streets of the 62-70 Everard Avenue property conducted by Parsons Brinckerhoff in March 2014 (Parsons Brinckerhoff 28 May 2014), suggest that there has been some migration of VOC vapours from that Everard Avenue property.
Because VOCs, particularly TCE, may be migrating away from the K1 site and possibly under the K3 site, and because the former Kelvinator activities on the K3 site are not known with certainty, an assessment of VOC vapours beneath the K3 site was undertaken for precautionary purposes. The sampling of groundwater was from monitoring wells on the K1 site and on Ashford Road which separates the K1 from the K3 sites.
1.3 Objectives The overall objective of the investigations of soil vapours at the K3 site was to ensure that there was no unacceptable health risk to occupants of the commercial building on the K3 site as a consequence of the possible presence of TCE or other VOC vapours in the ground beneath the building. Such a risk may potentially occur by the intrusion of vapours from the sub-floor soil, through the floor slab and into the building. With respect to this overall objective, the specific objectives of the investigation were to:
compare the measured concentrations of sub-floor TCE vapour against screening level criteria for vapour intrusion health risk evaluation (a Tier 1 assessment of risk),
measure surface flux rates of TCE vapours through the floor into the building so as to calculate the indoor air concentrations of TCE resulting from the floor flux (a Tier 2 assessment of risk), and
measure the actual ambient indoor air concentrations of TCE vapours within the K3 building to allow an assessment of risk to building occupants (a second and parallel Tier 2 assessment of risk).

Parsons Brinckerhoff | Keswick K3 Site Vapour December 2014_2201557b 2
Kelvinator Australia Pty Limited Soil Vapour Investigations for Identification of Trichloroethene - Ashford Road & Everard Avenue, Keswick, South Australia [K3 site]
A related objective was to assess, to the extent possible given the limited number of sampling locations, whether there were local sources of TCE beneath the K3 site.
Limited sampling on the road verge of Ashford Road that separates the K1 site (a source area of TCE) and the K3 site, was also undertaken to further evaluate the significance of TCE vapours found along Ashford Road in the earlier investigations (Parsons Brinckerhoff March 2014).
1.4 Scope of works The scope of works for the vapour measurements on Ashford Road and the K3 commercial building consisted of the following three measurement components:
the measurement of sub-slab VOC vapours at two locations on the footpaths of Ashford Road and at 5 locations within or immediately adjacent to the commercial building;
the measurement of surface flux of VOC vapours immediately beside each of the sub-slab sampling locations; and
the measurement of ambient air at three locations within the commercial building and at two locations outside the building.
All three measurement regimes were used as lines of evidence for the evaluation of health risks for occupants of the commercial building. At the time of the vapour measurements at the K3 site and in Ashford Road, three existing groundwater monitoring wells at the K1 property were sampled and analysed for VOCs.

Parsons Brinckerhoff | Keswick K3 Site Vapour December 2014_2201557b 3
Kelvinator Australia Pty Limited Soil Vapour Investigations for Identification of Trichloroethene - Ashford Road & Everard Avenue, Keswick, South Australia [K3 site]
2. Site information 2.1 Investigation area identification The investigation area was principally the commercial building under use as a coach depot and workshop, goods warehousing and dispatch. The site served as a bus depot, bus servicing facility, parcel dispatch facility, goods warehousing and amenities. The building was located on the corner of Ashford Road and Everard Avenue, Keswick, South Australia. The property address is listed as 56-60 Everard Avenue, Keswick.
The investigation area included the road verge of Ashford Road on the eastern side of the commercial building.
As mentioned earlier in this report, for the purposes of this report, the property has been designated as the K3 site.
2.2 Land use The site is under commercial land use and adjacent properties are also commercial. Further north along Ashford Road is a residential area.
2.3 Physical conditions The topography of the site and surrounding land is almost flat but there is, visually, a very slight slope downwards to the south. Ground cover outside the commercial building in the investigation area consisted of asphalt roads, concrete footpaths on the road reserves and on some stretches of road reserve, gravel/granulated granite or quartz coverage of the natural surface.

Parsons Brinckerhoff | Keswick K3 Site Vapour December 2014_2201557b 4
Kelvinator Australia Pty Limited Soil Vapour Investigations for Identification of Trichloroethene - Ashford Road & Everard Avenue, Keswick, South Australia [K3 site]
3. Contaminants of interest Investigations of soil vapour and groundwater on the K1 site -the recently redeveloped commercial property at 62-70 Everard Avenue, have shown that contaminant impact to the soil and groundwater is predominantly TCE. Some other chlorinated hydrocarbons were present in groundwater, but to a much lesser degree. Those additional compounds were tetrachloroethene (PCE), cis-1,2-dichloroethene (cis-1,2-DCE), vinyl chloride, 1,1-DCA, carbon tetrachloride and trichloromethane (chloroform) (Tierra Environment 18 December 2013). Testing of the soil vapours around the perimeter of the K1 site (Parsons Brinckerhoff 28 May 2014), showed that only TCE and PCE were present in sub-slab soil vapours at concentrations above trace levels.
For the current investigation of the K3 site soil vapours, surface flux and ambient air samples were analysed for a suite of VOCs including those listed above. The analytical suite contains many compounds that may not be associated with the site. The additional analytes have been retained in the analytical suite because it is a standard analytical suite and because they may assist in the interpretation of the data. The analytical suite can be seen in the data summary tables in Appendixes A, B and C. The same analytical suite was used for all analyses – sub-slab soil vapour, flux and ambient air.

Parsons Brinckerhoff | Keswick K3 Site Vapour December 2014_2201557b 5
Kelvinator Australia Pty Limited Soil Vapour Investigations for Identification of Trichloroethene - Ashford Road & Everard Avenue, Keswick, South Australia [K3 site]
4. Conceptual model of contaminant migration & exposure pathways
There are no known investigations of the geological and hydrogeological structure of the K3 site although it is likely to be very similar in its overall characteristics to the K1 site which was subject to groundwater investigations by Tierra Environment, 18 December 2013. From the borehole logs prepared during drilling for the installation of two on-site groundwater monitoring wells (Tierra Environment, 18 December 2013) on the neighbouring K1 site, filling was found in the upper metre of the soil profile, underlain by a deep horizon of silty clay with sandy clay below 12 m. Filling underlain by silty clay was also recorded by BlueSphere Environmental, 17 December 2013, when installing soil vapour bores to depths of 5 m.
The hydrogeological structure has not been adequately defined in the investigations of the K1 site, so the formulation of a conceptual site model for the transport and behaviour of the contaminants on and off-site, is somewhat speculative.
The K1 site is known to be a source area for TCE. Soil vapour measurements at depths of 1.5 m and 5 m (BlueSphere Environmental, 17 December 2013) showed high concentrations of TCE vapours clearly indicative of soils that had been directly impacted by TCE releases. Gauging of groundwater monitoring wells on 10 December 2013 by Tierra Environment showed standing water levels in the two on-site wells, KMW2 and KMW3 to be 13.65 mAHD and 11.48 mAHD, respectively. These two wells are only 13 m apart, so the difference in standing water levels is unexplained. The standing water level for the off-site well on the edge of Ashford Road was much higher at 17.61 mAHD. The large differences in standing water level were found again when Parsons Brinckerhoff re-gauged the three wells on 21 March 2014 and 8 December 2014.
Standing water levels are not necessarily indicative of the depth of the aquifer as the water may have a head pressure. Water strike was indicated at 8.0 m in KMW1, not indicated for KMW2 and saturation was indicated for KMW3 at about 16.5 m below ground level. The depth or depths of the contaminant transport in groundwater is therefore not known.
High concentrations of dissolved phase TCE in groundwater measured in wells KMW2 and KMW3, on-site, indicate the TCE detected in the soil profile has percolated downwards through the soil profile and into the water – the depth of which is unclear. The direction of flow of groundwater cannot be determined from the groundwater gauging data.
Sub-slab soil vapour sampling around the perimeter of the K1 site by Parsons Brinckerhoff in March 2014 showed the presence of TCE in sub-slab vapours on the southern side of the K1 site along Everard Avenue and to a minor degree on Ashford Road between the K1 and K3 sites. Those data suggested that there may be some migration of TCE, in groundwater or only as vapour diffusing through the soil profile, away from the K1 site. The possibility that the K3 site may have been impacted by contaminants in soil or groundwater on the K1 site was considered. The current investigations along Ashford Road and within the K3 building were, in part, designed to address this consideration.
For the occupants of the commercial property of the K3 site, the pathway for potential health risk from TCE, or other contaminant vapour, is vapour intrusion from the sub-grade, through the concrete floor and into the indoor air of the building.

Parsons Brinckerhoff | Keswick K3 Site Vapour December 2014_2201557b 6
Kelvinator Australia Pty Limited Soil Vapour Investigations for Identification of Trichloroethene - Ashford Road & Everard Avenue, Keswick, South Australia [K3 site]
5. Sampling plan and methods 5.1 Rationale for the selection of sampling methods As previously stated in section 1.3, the overall objective of the investigations of soil vapours at the K3 site was to ensure that there was no unacceptable health risk to occupants of the commercial building on the K3 site as a consequence of the possible presence of TCE or other VOC vapours in the ground beneath the building. Such a risk may potentially occur due to the intrusion of vapours from the sub-floor soil, through the floor slab and into the building. The approach taken to the testing of that potential risk was to measure the contaminants, if present, at three points along the exposure pathway – firstly in soil vapour beneath the floor slab, secondly in the flux of the contaminant vapours passing through the floor slab, and thirdly in the concentration of contaminant vapours in the indoor air of the building. This approach could demonstrate that even if contaminant vapours are present beneath the concrete flooring of the building, the presence of those vapours may not pose an unacceptable risk to building occupants. Low flux rates of contaminants entering the building through the floor and low indoor air concentrations, would demonstrate that the vapour intrusion pathway is incomplete.
Guidance criteria on acceptable vapour concentrations of chlorinated volatile compounds, available in the National Environment Protection Council (NEPC) 2013, National Environment Protection (Assessment of Site Contamination) Amendment Measure 2013 (No. 1) apply only to the concentrations of certain individual chlorinated VOC compounds in the soil vapour within the shallow soil profile or directly beneath a floor slab. The criteria are presented as Tier 1 screening level values which, if exceeded, indicate a need for a tier 2, more site specific or a more direct measurement of actual risk posed by the vapours. For the K3 site investigating that tier 2 higher level assessment comprised the measurement of surface flux through the building floor and the measurement of indoor air concentrations of the contaminants of interest. The tier 2 measurements were undertaken concurrently with the sub-slab soil vapour testing on the basis that there was a reasonable probability that soil vapour concentrations would exceed the very conservative criterion for TCE given in the NEPM 2013 guidance document.
5.2 Sub-pavement soil vapour sampling plan VOCs, including the contaminants of interest for this investigation were measured by inserting passive soil vapour sampling tubes (WMS_LU) into sampling holes drilled through the concrete flooring of the commercial building on the K3 site at three location and at a further two locations immediately outside the building wall within pavement. A further two locations were installed into the footpaths along Ashford Road between the K1 site (a known source of TCE vapours) and the K3 site building. Locations are shown in Figure 2.
5.3 Surface mass flux sampling plan The surface mass flux of VOCs was measured by passive flux chambers at each of the seven locations at which sub-slab vapour tube implants were placed.
The five flux chambers on the K3 site were placed on the concrete floor of the building, while the two flux chambers on Ashford Road were placed on the unpaved ground on the road reserves.
For the current investigation, two different types of sampling tubes were used for flux measurements. For the two chambers in the public area of Ashford Road, short duration sampling tubes of the thermal desorption type (TD code 145) were used. This was necessary as the chambers could not be left unattended on public footpaths beyond the eight hours on the sampling day. For the flux chambers in the

Parsons Brinckerhoff | Keswick K3 Site Vapour December 2014_2201557b 7
Kelvinator Australia Pty Limited Soil Vapour Investigations for Identification of Trichloroethene - Ashford Road & Everard Avenue, Keswick, South Australia [K3 site]
commercial building solvent desorption tubes (SD code 130) were used. Deployment time for these tubes is not critical, and usually periods of two to three weeks are used. For this investigation the chambers were deployed for 21 days.
Locations of the flux chambers are shown in Figure 2.
5.4 Ambient air sampling plan Ambient air concentrations of the contaminants of interest were measured at three locations within the commercial building of the K3 site and at two locations immediately outside the building – the latter two located to obtain background ambient air concentrations.
5.5 Sub-slab soil vapour passive sampling method The passive soil vapour sampling tube type used was the Waterloo Membrane Sampler – Low Uptake (WMS_LU™), developed by the University of Waterloo. The sampler has been specifically designed and developed to allow quantification of volatile organic compounds in the soil pore space. The WMS_LU™ sampler is a passive sampler, containing an absorptive carbon medium within a small glass vial with a permeable membrane at the end of the glass vial. A description of the method of passive soil vapour sampling using the WMS samplers is given in McAlary et al., 2009.
The method allows for the calculation of actual concentrations in the soil gas on account of two critical features of the method. Firstly, the samplers are designed to maintain a constant but low uptake rate which, consequently, establishes the second critical factor – prevention of the depletion of the target analyte concentrations (the VOCs in the soil void), i.e., a ‘starvation effect’ is avoided and a constant uptake rate onto the sampler is maintained. Uptake rates for the sampler have been empirically derived and the method has been validated against the TO-15 active sampling method.
Data are expressed also as calculated concentrations of soil vapour, in the unit of µg/m3. The calculation was performed using the manufacturer’s published uptake rates which are specific for each compound and for the type of sampler used (i.e. the WMS_LU™). Expression of the data in concentration terms allows direct comparison of the measured concentrations against health investigation levels (HILs) for soil vapour published in NEPM, 2013.
5.5.1 Method of sample deployment, duration and tube recovery
Pavements were drilled using a 20 mm diameter drill bit on a hand held electric drill to depths of 300 mm below the top of the pavement. For the deploy the WMS-LU™ tubes in the holes, the tubes were first wrapped in metal flyscreen to protect the sampling tube from direct contact with soil. A tube was then lowered into the drilled hole attached by a wire. The holes were sealed using a sand-cement grout to provide an air and water seal. The grout plug was finished flush with the pavement surface.
Sampling tubes were recovered from the sampling holes after three weeks of deployment by pulling up the sampler by the attached wire after breaking the grout seal. Sampling tubes were placed in their glass vials and sent under chain of custody to the analytical laboratory, SGS - Leeder Consulting.
5.6 Passive flux chamber method The passive flux chamber involves the placement of a high uptake rate sorption tube within the void of a stainless steel chamber located directly on the ground surface or pavement. After the predetermined deployment period – typically 8 hours for thermal desorption tubes and three weeks for solvent desorption

Parsons Brinckerhoff | Keswick K3 Site Vapour December 2014_2201557b 8
Kelvinator Australia Pty Limited Soil Vapour Investigations for Identification of Trichloroethene - Ashford Road & Everard Avenue, Keswick, South Australia [K3 site]
tubes, the passive sorption tube was collected for laboratory analysis involving thermal desorption followed by GC-MS analysis.
For the current investigation, two types of Radiello solvent desorption tubes were used. In the public space of the footpaths of Ashford Road thermal desorption tubes (ID code 145 cartridge) were used, allowing a detection limit of 0.005 µg/tube (5 nanograms). These tubes are suitable for deployment periods of several hours to one day. The detection limit, expressed as a calculated flux, is proportional to the deployment (sampling) time. In the commercial building of the K3 site solvent desorption tubes (ID code 130 cartridge) were used. These tubes are suitable for deployment periods of one to several weeks. Like the thermal tubes, the detection limit is proportional to the deployment time. For the 20 day deployment of flux chambers in the commercial building the detection limit was 50 nanograms for most compounds. The detection limits equate to very low flux rates which could be described as trivial in terms of consequential risk.
Radiello sampling tubes are described in: Radiello Fondazione Salvatore Maugeri-IRCCS, http://www.radiello.it/index.html
The principal of operation of the passive flux chamber is that the VOC mass absorbed onto the passive tube placed within the chamber void is a close approximation of the total VOC mass flux into the chamber from the surface on which the chamber is placed. For the mass collected on the sampling sorption tube to be approximately equal to the mass flux into the chamber, a concentration depression within the chamber must be maintained. This is achieved through the high sorption rates (sampling rates) of the Radiello sampler which has a capacity to absorb contaminants at a greater rate than the flux into the chamber. Essentially, the Radiello sampler ‘captures’ the mass flux into the chamber from the ground surface. The concentration depression is maintained unless the sorption tube becomes saturated. Saturation of the sorption tube would not occur under normal sampling conditions. Maintenance of the concentration depression has been previously demonstrated and reported in Heggie & Stavropoulos 2010.
Flux into the passive chamber can thus be expressed as:
Flux (µg/m2/h) = mass on tube (µg) x 1/chamber footprint (m2) x 1/ sampling duration (h)
5.6.1 Deployment method – passive flux chambers
The stainless steel passive flux chambers, 0.35 m in diameter and 8 L capacity, were seated on either a natural surface of the road reserve (i.e., beside the paved footpaths) or on concrete. A Radiello passive absorptive sampling tube was suspended within the void of the chamber. To ensure no advective exchange of air occurred between the ambient air (the atmosphere) and the air within the chamber sand and local surface soil was placed around the rim of the chambers placed on nature surfaces. For the chamber placed on a concrete surface, Blu-Tack™ was placed around the rim of the chamber to provide the seal.
After the predetermined deployment (i.e. sampling) time, the sampling tubes were removed from the chambers and placed in sealed glass vials for transport to the analytical laboratory.
5.6.2 Analytical methodology – passive flux chambers
The sorbent tubes were returned to the laboratory where they were solvent desorbed and analysed by GC-MS.
The masses of a range of VOCs on the tubes is determined by the laboratory analysis.

Parsons Brinckerhoff | Keswick K3 Site Vapour December 2014_2201557b 9
Kelvinator Australia Pty Limited Soil Vapour Investigations for Identification of Trichloroethene - Ashford Road & Everard Avenue, Keswick, South Australia [K3 site]
5.7 Ambient air sampling method Ambient air was sampled using Radiello code 130 solvent desorption tubes. The sorption tubes consist of activated carbon housed in a cylindrical steel gauze. The Radiello tubes were designed for the sampling of volatile organics in ambient air.
Sampling tubes located outside the building were placed within cassette holders and suspended within rain shelters and affixed to fences or other structures around the perimeter of the building at heights of about 1.5 m. Sampling tubes located inside the building were identically housed except the rain shelters were not required.
Deployment period for ambient air sampling is not critical and for ambient air sampling is normally conducted over periods of days or weeks. Providing the tubes remain dry (sheltered from rain), the length of exposure is not crucial to effective sampling. For the investigations at the K3 site the ambient air sampling tubes were deployed for a period of 20 days.
At the completion of the sampling period, the sorption tubes were recovered from the Radiello cassette holders and placed into dedicated glass vials for transport to the analytical laboratory. Analysis of the passive samplers was performed by solvent desorption and gas chromatography/mass spectrometry (GC-MS). Detection limits are typically around 0.05 µg/tube which equates to about to around 0.03 µg/m3 or less for the 20 day deployment times.
5.8 Groundwater sampling and analysis The three groundwater wells at the K1 site were sampled by disposable bailers after purging dry the water column. Field parameters of pH, electrical conductivity, redox potential and temperature were measured during purging and recorded. Water samples were collected from the wells after the field parameters had stabilised. Samples were analysed for a standard suite of VOCs and for major cations and anions.

Parsons Brinckerhoff | Keswick K3 Site Vapour December 2014_2201557b 10
Kelvinator Australia Pty Limited Soil Vapour Investigations for Identification of Trichloroethene - Ashford Road & Everard Avenue, Keswick, South Australia [K3 site]
6. Data quality objectives Schedule B2 of the NEPM 2013, recommends that a systematic planning process is used for defining the objectives of the assessment and the sampling plan that can meet those objectives. The NEPM 2013 states:
“In its simplest form, the planning process should consider:
the overall objective of the site assessment
the decision(s) to be made on the basis of the site assessment findings
the constraints on the assessment (financial, time and logistical) and
the degree of flexibility to conduct follow-up investigations.”
The intent of the above planning process is to identify the methodologies needed to undertake measurements that are achievable and collect data that are adequate to meet the study objectives. A second aspect of data quality control is the process of assuring the quality of the data collected which in turn involves the controls on how samples are collected. A third aspect is the means by which the reliability of the analytical results is quantified.
6.1 Planning process With regard to controls on project quality planning and design, the following comments are relevant.
The overall and principal objective of the work planned and undertaken in December 2014 by Parsons Brinckerhoff at and near to the K3 site, were to identify the possible presence of chlorinated solvent soil vapours in the sub-floor-slab soils, in the floor flux and in the ambient indoor air. The data were required to be sufficient to show whether or not there was an unacceptable health risk to building occupants from sub-floor vapours intruding into the building.
With regard to the decisions to be made on the basis of the findings, the results may assist in any considerations of possible further work or in any control measures if unacceptable risks were indicated by the data.
Restrictions to available sampling locations were a constraint on the sampling design. However, the final locations used for sampling vapours were considered suitable for the objectives.
6.2 Data quality control – field and laboratory 6.2.1 Surface flux measurements
Field data quality control for passive flux chambers is a relatively simple process that involves:
proper handling of the sampling tubes to avoid contaminating the tubes during deployment into the chambers and collection from the chambers, and avoiding any exposure of the sampling tubes to contaminants other than during the deployment within the chambers. This process is easily achieved by the use of clean nitrile gloves when handling the tubes and avoiding any contact of the tubes by hand.
careful handling of the cleaned flux chambers to ensure the internal chamber surface remains untouched during transport and deployment;

Parsons Brinckerhoff | Keswick K3 Site Vapour December 2014_2201557b 11
Kelvinator Australia Pty Limited Soil Vapour Investigations for Identification of Trichloroethene - Ashford Road & Everard Avenue, Keswick, South Australia [K3 site]
ensuring no gap exists between the chamber rim and the ground surface through which an advective air exchange could occur;
taking duplicate samples within one or more of the chambers to provide a measurement of the precision of the measurements. For the current investigation duplicate tubes were placed in one of the flux chambers. There are no Australian reference guidelines for the acceptable degree of difference (as measured as relative percent difference (RPD)) for flux measurements, nor even for soil vapour concentration measurements. Acceptability of an RPD value is dependent on measured mass, relative to the detection limit. Generally, where the measured mass is more than one order of magnitude greater than the detection limit, RPDs within 100% are acceptable.
analysing one trip blank to quantify any background contaminants on the sampling tubes.
These actions to ensure the quality of the field samples are not difficult to achieve and certainty in their achievement is easy to verify at the time of the field sampling.
Laboratory quality control can be evaluated by the results from method blank testing and from recoveries from spiked samples. For the current investigation the analytical laboratory undertook one method blank analysis and one method spike analysis – conducted in duplicate. Two types of sampling tubes were used in the flux measurements, thermal desorption and solvent desorption. One method blank was analysed for each type of tube.
6.2.2 Sub-slab vapour measurements
Field data quality control for sub-slab vapour measurements is, like the process for flux, a relatively simple process that involves:
proper handling of the sampling tubes to avoid contaminating the tubes during deployment into the drilled holes and collection from the holes at conclusion of sampling, and avoiding any exposure of the sampling tubes to contaminants other than during their deployment. This process is easily achieved by the use of clean nitrile gloves when handling the tubes and avoiding any contact of the tubes by hand.
Deploying the sampling tubes into the drilled holes in a manner that protects the tubes from direct contact with soil and water; and the sealing of the holes to prevent the entry of air or water for the duration of the sampling period.
taking duplicate samples within one or more of the soil vapour testing holes to provide a measurement of the precision of the measurements. For the current investigation duplicate tubes were placed in four of the sub-slab drilled holes. There are no Australian reference guidelines for the acceptable degree of difference (as measured as relative percent difference (RPD)) for soil vapour concentration measurements. Acceptability of an RPD value is dependent on measured mass, relative to the detection limit. Generally, where the measured mass is more than one order of magnitude greater than the detection limit, RPDs within 100% are acceptable.
It is critical to ensure that any supporting materials deployed with the sampling tubes – such as the protecting wire screen in which the sampling tubes are wrapped before deployment into the holes, is laboratory tested to ensure it is free from VOCs.
Upon collection of the sampling tubes from the holes, placement of the tubes immediately into their vials and ensuring complete sealing of the vials.
Laboratory quality control can be evaluated by the results from method blank testing and from recoveries from spiked samples. For the current investigation the analytical laboratory undertook one method blank analyses and one method spike analysis.

Parsons Brinckerhoff | Keswick K3 Site Vapour December 2014_2201557b 12
Kelvinator Australia Pty Limited Soil Vapour Investigations for Identification of Trichloroethene - Ashford Road & Everard Avenue, Keswick, South Australia [K3 site]
7. Reference guidance 7.1 Soil vapour concentrations Relevant screening level (tier 1) guidelines, for human health effects, relating to soil vapour concentrations are Interim soil vapour health investigation levels for volatile organic chlorinated compounds (HILs) presented in Schedule B1 Investigation Levels for Soil and Groundwater in the NEPM. HILs for the contaminants of interest for this investigation are listed in Table 7.1.
Table 7.1 Interim screening level criteria for soil vapour concentrations of chlorinated VOCs. Criteria are applicable to shallow soil (to 1 m below ground/floor level)
Chemical Interim soil vapour HIL (µg/m3)
Commercial/industrial land use Low density residential land use
tetrachloroethene 8,000 2,000
trichloroethene 80 20
cis-1,2-dichloroethene 300 80
vinyl chloride 100 30
Of the HILs the NEPM states:
“Interim HILs for VOCs are conservative soil vapour concentrations that can be adopted for the purpose of screening sites where further investigation is required on a site-specific basis. They are based on the potential for vapour intrusion using an indoor air-to-soil vapour attenuation factor of 0.1...”
Thus the guideline can be interpreted to mean that a sub-slab concentration of 80 µg/m3 of TCE may result (taking a conservative statistical approach) in an indoor air concentration of 8 µg/m3, which, if exceeded, would represent a possible health risk to building occupiers.
7.2 Surface flux rates There are no published reference values for flux rates. It would not be appropriate to produce and present such reference values as the effect of the flux is dependent on the resulting concentration which itself is dependent on the mixing rate within the receiving air (such as a room within a building).
For the present investigation, flux has been used for two purposes, firstly to identify the presence or absence of detectable VOC vapours (TCE was of principle interest) in the soil profile, and secondly to provide an indication of whether, if present, TCE represented a potential health risk, via the vapour intrusion process, for occupants of the on-site building.
With regard to the use of flux as a method to evaluate and quantify potential vapour intrusion health risks, both Australian and overseas guidance refers to surface flux as a further line of evidence and allows a measurement near to the end of the vapour intrusion pathway.

Parsons Brinckerhoff | Keswick K3 Site Vapour December 2014_2201557b 13
Kelvinator Australia Pty Limited Soil Vapour Investigations for Identification of Trichloroethene - Ashford Road & Everard Avenue, Keswick, South Australia [K3 site]
7.3 Ambient air There are no published Australian reference values for indoor ambient air concentrations of chlorinated VOCs other than reference concentrations published by the NSW Department of Environment, Climate Change and Water in the document Vapour Intrusion: Technical Practice Note, September 2010. The document lists a reference concentration for TCE of 23 µg/m3. The value is referenced as being sourced from WHO 2000 and is derived from a 1 x 10⁻⁵ risk level and a carcinogen unit risk of 4.3 x 10⁻⁷ per µg/m3. Although not discussed in the reference document, the value of 23 µg/m3 listed for acceptable ambient air, applies to a 24 hour per day exposure for a person’s lifetime. Without adjustment for a typical commercial worker’s period of exposure, this value is highly conservative.
Usually when evaluating the vapour intrusion risk to which a commercial worker may be exposed, the acceptable value is calculated from the chosen unit risk value for the chemical of concern, the acceptable risk level for a health effect and the time of exposure.
7.4 Groundwater Reference guidelines used for the evaluation of groundwater quality should relate to the use and potential use of the groundwater and to the use of receiving water bodies – streams, lakes, estuarine and marine waters. Monitoring of the three groundwater wells on the K1 site was to confirm earlier results (Terra Environment, 18 December 2013). The fate of the impact to groundwater is currently not known, nor are the receptors. Consequently, appropriate water quality criteria for the groundwater has not been identified (with respect to groundwater beneath that site). Nevertheless, for the purpose of providing reference values, both ecological and drinking water guidelines are presented here for selected chlorinated VOCs.
Table 7-1 summarises the groundwater assessment criteria used in this investigation.
Table 7.2 Groundwater investigation levels
Analyte A – Freshwater Ecosystem (µg/L)
B – Marine Water Guidelines (µg/L)
C – Drinking Water Guidelines (µg/L)
Site Assessment Criteria
TCE 3301 3301 20# 20
PCE 701 701 50 50
cis-1,2-DCE - - 60 60
Vinyl Chloride 1001 1001 0.3 0.3
1,2-dichloroethane - - 3 3
1,1,2-trichloroethane 6,500 1,900 - 1,900
1,1,2,2-tetrachloroethane - - - -
(1) No investigation level available. (2) A. Australian and New Zealand Guidelines for Fresh and Marine Water Quality (ANZECC/ARMCANZ, 2000) Trigger values for
freshwater, 95% level of protection. (3) B. Guidelines for recreational water quality and aesthetics (ANZECC/ARMCANZ, 2000). (4) C. Australian Drinking Water Guidelines (NHMRC, 2011). (5) # WHO 2004 interim guideline. (6) 1. Australian and New Zealand Guidelines for Fresh and Marine Water Quality (ANZECC/ARMCAN Z, 2000). Low Reliability
trigger values for freshwater.

Parsons Brinckerhoff | Keswick K3 Site Vapour December 2014_2201557b 14
Kelvinator Australia Pty Limited Soil Vapour Investigations for Identification of Trichloroethene - Ashford Road & Everard Avenue, Keswick, South Australia [K3 site]
8. Vapour sampling results & discussion
8.1 Weather conditions over sampling periods Weather conditions may influence shallow soil vapour concentrations and fluxes. For that reason weather records for November and December 2014, which cover the period leading up to and during the sampling time, have been included in Appendix C. The magnitude of the effect of changes in soil vapour concentration in response to changes in soil moisture content has not been clearly established in the literature. However, increasing moisture content in the soil profile is expected to have a minor impact on soil vapour concentrations but for diffusive mass flux rates the influence of increasing moisture within the soil profile may be significant. Five of the seven flux measurement locations were within the commercial building on the K3 site, so for those measurements the influence of recent rainfall was negligible.
In the 48 hours leading up to the measurement of flux on the road reserve of Ashford Road, no rainfall was recorded at the Adelaide Airport weather station (Appendix D). In the three weeks prior to sampling a total of 25.2 mm fell. Over that three week period evaporation was considerably greater at 148.4 mm, indicating that soil conditions were relatively dry in the upper horizon during the sampling period (25 November 2014). It was observed that the natural surface of the road reserve – gravel and crushed rock, was dry at the time of deployment of the flux chambers.
Temperature of the soil profile also has an effect on soil pore vapour concentrations, although the effect is relatively small. The expected seasonal range in profile temperature, of about 5 oC would result in a change of about 25% in vapour concentration. The temperature of the soil profile will also influence the mass flux through the profile such that rates of flux will increase with temperature.
The weather conditions prevailing during the period leading up to the vapour testing and during the time of the testing are considered to be normal and typical for the early summer season. Accordingly, the vapour results can be considered to be representative of normal conditions.
8.2 Sub-pavement conditions Because the vapour investigation for the current study involved surface flux and sub-slab soil vapour measurements, the soil profile was not examined. Information on the soil profile just beyond the boundary of the site along Ashford Street is available from a borehole log in a report prepared by Tierra Environment dated 18 December 2013. The borehole log shows a profile of silty clay from the surface to 11 m below ground level at which depth a clayey silty sand horizon was encountered. The log records saturation at a depth of 8 m.
8.3 Sub-pavement vapour concentrations Soil vapour concentrations were measured at two locations along the footpaths of Ashford Road and at three locations within the commercial building on the K3 site and a further two immediately outside the western wall of the building. All sub-slab vapour samples were analysed for a suite of 48 volatile organic compounds comprising chlorinated compounds and petroleum hydrocarbons. Results for all sampling locations are tabulated in Table A1 of Appendix A. Concentrations of TCE and PCE are shown in Figure 3 and Figure 4, respectively. Figures 3 and 4 also show results for surface fluxes which were measured alongside each of

Parsons Brinckerhoff | Keswick K3 Site Vapour December 2014_2201557b 15
Kelvinator Australia Pty Limited Soil Vapour Investigations for Identification of Trichloroethene - Ashford Road & Everard Avenue, Keswick, South Australia [K3 site]
the sub-slab testing points. An interpretation of the flux results is discussed in section 8.4. Ambient air results are also shown in the two figures.
The contaminant of greatest interest to the investigation was TCE which is known to be present in soil vapour on the K1 site. PCE was also found in soil vapour on the K1 site (BlueSphere 17 December 2013). In March 2014 Parsons Brinckerhoff tested sub-slab soil vapour along Ashford Road between the K1 and K3 sites and found both TCE and PCE at low concentrations, albeit, one marginally exceeded the NEPM 2013 interim health screening level criterion for TCE. In the December 2014 sampling, one sampling point on the Ashford road footpath, K3SS1a, was installed in the same location as sample SS10 from the March 2014 sampling. In March concentrations were: TCE 100 µg/m3; PCE 6.6 µg/m3. In December the concentrations were not significantly different with TCE 49 µg/m3 and PCE 16 µg/m3.
For the current investigation of sub-slab soil vapour concentrations in the commercial building on the K3 site, and on the road verge of Ashford Road, sampling locations and results for TCE and PCE are shown in Figures 3 and 4, respectively. Results for all analytes are listed in Table A1, Appendix A.
In terms of relative concentrations and extent of occurrence, TCE was the dominant compound and PCE was also consistently detected, but a lower concentrations. The NEPM 2013 criterion for TCE vapours in shallow soil, i.e. the “interim soil vapour health investigation level”, was exceeded at four of the five sub-slab sampling locations in or adjacent to the commercial building on the K3 site. Although slightly exceeding the reference criterion of 80 µg/m3, the TCE concentrations were characteristically 1,000 to 10,000 times lower than those measured on the K1 site by BlueSphere, 17 December 2013.
As can be seen from Figure 3, the highest measured TCE concentration was found at location K3SS7a with a value of 2,300 µg/m3. Other values were around 10 times lower.
With the exception of K3SS7a, the relatively even concentrations over the study area suggests the immediate vapour source is TCE in groundwater beneath the K3 site, although from the small number of sampling locations there is only low level confidence in this conclusion. The higher soil vapour concentration recorded at K3SS7a suggests there may be a local source of TCE impact in soil.
TCE concentrations in the two sub-slab sampling locations on Ashford Road did not exceed the criterion.
As stated above, four of the five locations showed TCE at concentrations exceeding the interim health based criterion of 80 µg/m3. Whether or not the measured concentrations presented an actual unacceptable health risk from vapour intrusion into the building was examined further by surface flux measurements (described in section 8.4 below) and by indoor air measurements (section 8.5).
The measured concentrations of PCE in the test points on the K3 site and in Ashford road were greatly lower than the NEPM 2013 interim criterion (8,000 ug/m3) and can be considered of no consequence with respect to human health risks from intrusion into the commercial building. The highest measured value of PCE was 50 µg/m3 at K3SS7a.
8.4 Surface flux calculations 8.4.1 Detected contaminants on flux sampling tubes
Results of the laboratory calculations of the mass of contaminants on the tubes within the flux chambers are tabulated in Table B1, Appendix B. The values listed in Table B1 are not flux values, but rather, the mass collected on the absorbtion tubes placed within the flux chambers over the duration of the chamber deployment. The magnitude of the values are comparable between compounds and thus show the relative strengths of the fluxes through the pavement or flooring. However, it should be noted that the two flux chambers on Ashford Road used short duration sampling tubes (TD code 145 tubes) with deployment period of 9.5 hours while the flux chambers on the K3 property used longer duration SD code 130 tubes. The data

Parsons Brinckerhoff | Keswick K3 Site Vapour December 2014_2201557b 16
Kelvinator Australia Pty Limited Soil Vapour Investigations for Identification of Trichloroethene - Ashford Road & Everard Avenue, Keswick, South Australia [K3 site]
are normalised between TD and SD tubes through the process of calculating the mass flux rates which is expressed as mass per unit time per unit area. The process of calculating flux and the resulting risk levels is presented in section 8.4.2.
Data in Table B1, Appendix B is presented primarily to provide a documented record of results. Fluxes have been calculated for only the compounds of interest – TCE and PCE. It is apparent from the low mass collected on the sampling tubes in the flux chambers that flux rates were low in all locations. This observation applies not just to the contaminants of interest, but to all analyte compounds. Calculated fluxes for TCE and PCE are presented in Table B2 of Appendix B. The flux data for TCE and PCE are also presented alongside the sub-slab concentration results in Figures 3 and 4.
Other detected compounds
Daughter compounds, derived from the degradation of TCE are, firstly, cis-DCE and vinyl chloride. Neither was detected in any flux chamber.
One other chlorinated VOC, trichloromethane, commonly known as chloroform, was detected as a flux in four of the 7 flux chambers, but only just over the detection limit. Chloroform occurs naturally in the soil profile (Hoekstra et al, 1998), and it is not uncommon to find it as a soil vapour in Australian soils. It is thus reasonable to assume it is not related to the site’s former use. In any case, the amount of chloroform detected can be considered trace. Similarly, carbon tetrachloride was detected just above the laboratory detection limit at four locations. Carbon tetrachloride occurs as a background contaminant in the atmosphere, which the likely source – i.e. through sorption into the concrete slab, followed by ‘off-gassing’ as a flux into the chamber.
Several VOCs associated with petrol, in particular, benzene and 2-methylbutane, were present in most of the flux chambers. Some, if not most of these detected VOCs may have had their origin in the atmosphere. Petrol fuelled vehicles in the workshop is the likely major source.
8.4.2 Measured surface flux rates and risk evaluation
As mentioned earlier in section 5 Sampling Methodology, the mass collected on the passive sampling tube within the flux chamber can be expressed as a mass per unit area per unit time as:
Flux (µg/m2/h) = mass on tube (µg) x 1/chamber footprint (m2) x 1/ sampling duration (h)
Flux chamber primary measurement data – i.e. mass of each analyte compound on the sorption tube, as listed in Table B1, show no strong fluxes. All could be considered very weak. Flux rates for only the two contaminants of interest, TCE and PCE have been calculated and are presented in Table B2 of Appendix B.
For vapour intrusion investigations, mass flux measurements are used to calculate indoor air concentrations. Indoor air concentrations were calculated using the following equation.
rateexchangeairVAFlux
Cbuilding
floorair
where, Cair = concentration in indoor air (µg/m3) Flux = measured flux (µg/m2/h) Afloor = floor area of the office or warehouse (m2) Vbuilding = floor area x ceiling height (m3) air exchange rate = volume exchange per hour (h)

Parsons Brinckerhoff | Keswick K3 Site Vapour December 2014_2201557b 17
Kelvinator Australia Pty Limited Soil Vapour Investigations for Identification of Trichloroethene - Ashford Road & Everard Avenue, Keswick, South Australia [K3 site]
Flux rates for TCE, and all other VOCs, were very low, thus the indoor air concentrations resulting from the fluxes were also low. To illustrate this condition, the highest measured flux for TCE (0.065µg/m2/h) measured at K3PF5a, was converted to an indoor air concentration.
The area of the floor is not a critical variable if it is assumed that the flux is equal over the entire floor area, because the factor cancels out in the equation. The volume term in the equation is set by assuming a ceiling (i.e., mixing) height and an air exchange rate. For commercial buildings NEPM, 2013 recommends a ceiling height of 3 m and an air exchange rate of 1.24 volumes per hour. Using those assumptions the resulting indoor air concentration of TCE would be 0.017 µg/m3. To place this very low concentration into a human health risk context, using World Health Organisation (WHO) 2000 toxicity and risk guidance values (a unit risk of 4.3 x10⁻⁷) at a risk level of 10-5, the acceptable ambient (indoor) air concentration, without exposure adjustment, is 23 µg/m3. The US EPA’s IRIS data base lists a lower value for unit risk (a more stringent criterion) at 4.1 x 10⁻⁶. Using this ‘toxicity’ derived value and an acceptable risk level of 10-5, an acceptable indoor air concentration of 2.4 µg/m3 is derived. The flux derived indoor air concentration of 0.017 µg/m3 is also much lower than the IRIS derived indoor air acceptable concentration.
The carcinogenic risk resulting from the flux calculated indoor air concentration of 0.017 µg/m3 is determined using the equation:
Risk = the exposure adjusted concentration x unit risk
The adjustment used in the risk calculations is in accordance with the referenced factors listed in Table 8.2 and the equation for the conversion of indoor air concentrations (Cair) to exposure concentrations (EC) is:
EC = Cair x ET x EF x ED / AT
Toxicity values are listed in Table 8.1 and exposure adjustment factors for indoor commercial/industrial workers are shown in Table 8.2.
Table 8.1 Toxicity criteria for TCE and PCE
Compound Reference Unit risk (carcinogens) (risk per µg/m3)
Reference dose (non-carcinogens)
units: µg/m3) TCE US EPA IRIS database 4.1 x 10⁻⁶ 2
WHO 4.3 x 10⁻⁷ not given
PCE US EPA IRIS database 2.6 x 10⁻⁷ 40
WHO 2010 not classified as a carcinogen
250
Table 8.2 Exposure parameters – commercial/industrial indoor workers
Exposure parameter
Unit Value Reference Note
Exposure time (ET) h/day 8 CRC CARE (2011)
Exposure frequency (EF)
days/year 240 CRC CARE (2011) Working days per year
Exposure duration (ED)
years 30 CRC CARE (2011) Number of years in one occupation
Averaging time for carcinogenic effects (ATc)
years 82 CRC CARE (2011) Life expectancy (enHealth (2012))

Parsons Brinckerhoff | Keswick K3 Site Vapour December 2014_2201557b 18
Kelvinator Australia Pty Limited Soil Vapour Investigations for Identification of Trichloroethene - Ashford Road & Everard Avenue, Keswick, South Australia [K3 site]
Exposure parameter
Unit Value Reference Note
Averaging time for non-carcinogenic effects (ATnc)
years 30 CRC CARE (2011) set equal to the exposure duration
In accordance with the exposure factors listed in Table 8.2, the factors to adjust the ambient air concentration to the exposure adjusted concentration are 0.08 for carcinogens and 0.22 for non-carcinogens. The potential indoor air concentration determined from the highest measured flux rate, i.e., 0.017 µg/m3 , adjusted for exposure becomes 0.0014 µg/m3 .
Risk of excess cancer effects is determined from the equation:
Risk = Unit Risk x exposure adjusted concentration in air
And risk of non-cancer health effects is determined by the equation:
Risk = exposure adjusted concentration in air / Reference Dose
Using the WHO Unit Risk value of 4.7 x 10⁻⁷, the excess cancer risk from an exposure adjusted concentration of TCE of 0.0014 µg/m3 is 6.0 x 10⁻¹⁰, which is more than four orders of magnitude below the acceptable risk level of 10-5. Using the US EPA IRIS data base Unit Risk of 4.1 x 10⁻⁶ the resultant cancer risk is still very low and acceptable at 5.7 x 10⁻⁹.
The US EPA IRIS data base lists a reference dose for TCE of 2 µg/m3. WHO does not list a reference dose for non-cancer health effects. The exposure adjusted concentration of TCE in air was greatly less than the US EPA reference dose.
These calculations show that there is no indication of an unacceptable health risk from the vapour intrusion pathway into the commercial building on the K3 site, and in fact, the contribution of sub-floor contaminant vapours to indoor air is negligible.
8.5 Ambient indoor and outdoor vapour concentrations Ambient air concentrations of a suite of VOCs, including the compounds of interest, TCE and PCE, were sample at three indoor and two outdoor locations at the K3 commercial building. Sampling locations are shown in Figure 2. Compared to the health risk based acceptable air concentrations derived from toxicity values published by WHO and US EPA, 23 µg/m3 and 2.4 µg/m3, respectively, the measured concentrations of TCE were very low. The highest TCE concentration measured was 0.11 µg/m3. PCE concentrations in ambient indoor and outdoor air were similarly low.
Concentrations of TCE and PCE were not consistently different between indoor and outdoor sample locations and all locations showed very similar concentrations. This result indicates that TCE and PCE vapours in the sub-floor soil profile are not contributing significantly to the indoor air load of those compounds. This result also supports the finding of the flux measurements which identified very low flux rates through the flooring.

Parsons Brinckerhoff | Keswick K3 Site Vapour December 2014_2201557b 19
Kelvinator Australia Pty Limited Soil Vapour Investigations for Identification of Trichloroethene - Ashford Road & Everard Avenue, Keswick, South Australia [K3 site]
9. Groundwater sampling results
9.1 Groundwater concentrations – K1 site Three existing wells on the K1 site were sampled on 8 December 2014 in order to confirm earlier sampling on 10 December 2013 by Terra Environment. Terra Environment had installed the three groundwater monitoring wells prior to the redevelopment of the site. The wells were preserved and remain in operational condition post redevelopment, however, the original levels of the well heads for the KMW2 and KMW3 wells have been altered to fit the current ground or floor levels of the new building. Thus, the depths to water should not be compared for those two wells, between the two sampling occasions. However, well KMW1 is located on the road verge of Ashford Road and the level of that well head has not changed. Monitoring well locations are shown on Figure 5.
Groundwater well depths and depths to water for the two sampling rounds have been tabulated in Table 9.1
Table 9.1 Groundwater and well depths
Gauging date KMW1 KMW2 KMW3
Depth of well (m) 8 December 2014 12.0 16.6 17.7
10 December 2013 12.0 15.3 16.5
Depth to water (m) 8 December 2014 7.830 13.595 14.748
10 December 2013 7.625 11.673 13.890
Note:
8 December 2014 – sampled by Parsons Brinckerhoff (current investigation)
10 December 2013 - sampled by Terra Environment (report dated 18 December 2013)
Concentrations of TCE and PCE are shown in Table 9.2 and in Figure 5.
Table 9.2 Concentrations of TCE and PCE in groundwater on the K1 site, Everard Avenue, Keswick
Compound Sampling date Units KMW1 KMW2 KMW3
TCE 8 December 2014 µg/L 264 16,300 1,380
10 December 2013 µg/L 180 22,000 2,400
PCE 8 December 2014 µg/L 7 19 <5
10 December 2013 µg/L 26 37 5
Cis-1,2-DCE 8 December 2014 µg/L 34 80 25
10 December 2013 µg/L 26 88 2
Note:
8 December 2014 – sampled by Parsons Brinckerhoff (current investigation)
10 December 2013 - sampled by Terra Environment (report dated 18 December 2013)

Parsons Brinckerhoff | Keswick K3 Site Vapour December 2014_2201557b 20
Kelvinator Australia Pty Limited Soil Vapour Investigations for Identification of Trichloroethene - Ashford Road & Everard Avenue, Keswick, South Australia [K3 site]
It is not the intention of this report to consider the risks associated with the groundwater impacts, but rather to confirm the existence of significant concentrations measured in the earlier round of sampling.
The concentrations measured in the 8 December 2014 sampling round had not significantly changed since the previous sampling event one year earlier. The concentrations of TCE measured in KMW2 can be described as being at significant concentrations in terms of potential ecological and human health effects.
Large differences in standing water levels in each of the three wells indicates the water in each well may be in unconnected or poorly connected water bearing zones. Similar differences in water levels occurred in the earlier sampling round (Terra Environment, 10 December 2013). Accurate measurement of the inter-well differences in standing water levels can only be made after the wells have been resurveyed following the changes made during site rebuilding works.

Parsons Brinckerhoff | Keswick K3 Site Vapour December 2014_2201557b 21
Kelvinator Australia Pty Limited Soil Vapour Investigations for Identification of Trichloroethene - Ashford Road & Everard Avenue, Keswick, South Australia [K3 site]
10. Assessment of data quality 10.1 Quality assurance – sub-pavement vapours One duplicate sample pair was analysed. The duplicate pair – for sample location K3SS5 in the commercial building, showed detections of three compounds, TCE, PCE, 1,1,1-trichloroethane and total recoverable hydrocarbons in the carbon 6 to carbon 10 chain length (TRH C6-C10).
The highest RPD measured was an acceptable value of 44 % (TRH C6-C10). For the contaminants of interest, TCE and PCE, the greatest RPD was 9 % which represents very close agreement between pairs. As stated in the above section on data quality control planning, there are no Australian guidelines for acceptable values of RPDs for soil vapour measurements. For this study an RPD of 100 % is considered acceptable where the values are greater than 10 times the detection limit. As the highest RPD for all compounds analysed was 44 %, it is concluded that the measurement and analytical methods produced reliable replicable results. Results of the RPD calculations are shown in Table A2 of Appendix A.
One trip blank was analysed and no compound was detected. However, TRH C6-C10 was detected marginally above the detection limit. Results are shown in Table A3 of Appendix A.
The laboratory performed one method blank analysis to test that the extraction and analytical procedures did not introduce any false positives into the results. There were no detections in the blank.
To test the recovery of the extraction process, the laboratory performed one spike recovery analysis in duplicate. Percentage recoveries all fell within an acceptable range, from a low of 96% to a high of 101 %.
Results for the laboratory analyses of method blanks and recoveries are given in the laboratory reports included in Appendix E.
10.2 Quality assurance – flux and ambient air The sampling tubes used for flux chambers in the commercial building and for the ambient air measurements in and around the building were of the same type and from the same batch and analysed in the same run (Radiello SD code 130, solvent desorption). Consequently, the quality assurance measures apply equally to both.
The two flux chambers in Ashford Road used thermal desorption tubes (Radeillo TD code 145 thermal desorption) were different and the quality assurance was assessed separately to the solvent tubes.
One duplicate sample was run for the solvent tubes – at location K3PF3a – a flux chamber on the floor of the commercial building. RPDs were very low for all of the 28 compounds with detections. The highest measured RPD was 17% for benzene. For the contaminants of concern, TCE and PCE, only TCE had a detected flux and the RPD was 0%. Results are shown in Table B3 of Appendix B.
A duplicate flux was not run for the two TD tube type flux chambers on Ashford Road.
Trip blanks were analysed for the SD and the TD tube samples. The SD blank showed no detection of any compound. The TD blank showed a value of 9 µg/tube for toluene. Although the detection is undesirable, the value was very low and would correspond to a trivial flux of no consequence.
Method blanks were analysed for the SD and the TD tubes. There were no detections of any compound in either of the analyses.

Parsons Brinckerhoff | Keswick K3 Site Vapour December 2014_2201557b 22
Kelvinator Australia Pty Limited Soil Vapour Investigations for Identification of Trichloroethene - Ashford Road & Everard Avenue, Keswick, South Australia [K3 site]
Spike samples were analysed for SD and TD tubes, in duplicate. For the TD tubes, percentage recoveries were analysed for the contaminants of interest, TCE and PCE, and a range of other VOCs. Recoveries were between 98% and 102%, indicating very good recovery. For the SD tubes, recoveries were analysed for BTEX compounds, but not TCE and PCE (a function of laboratory quality assurance protocols and procedures). Recoveries for the BTEX compounds were very good, ranging from 97% to 108%.
10.3 Conclusion on data quality assurance The laboratory quality assurance results were sufficiently good to provide confidence in the accuracy of the measurements. While the detection of low concentrations of TRH C6-C10 in the blank tube for the sub-slab sampling tubes and toluene in the TD flux tubes was undesirable, those occurrences were of little consequence due to their low values. Furthermore, the contaminants of interest showed no detections on the blank samples.
Of more importance to the overall assessment of quality assurance was the close agreement between the duplicate pairs for flux and for sub-slab soil vapour concentrations, and the good results for method blanks and spike recoveries.

Parsons Brinckerhoff | Keswick K3 Site Vapour December 2014_2201557b 23
Kelvinator Australia Pty Limited Soil Vapour Investigations for Identification of Trichloroethene - Ashford Road & Everard Avenue, Keswick, South Australia [K3 site]
11. Summary & Conclusions Field testing of the possible presence of TCE and PCE vapours in soils beneath the commercial property 56-60 Everard Avenue, Keswick, and beneath adjacent Ashford Road was conducted in November – December 2014. The overall objective of the investigations was to ensure that there was no unacceptable health risk to occupants of the commercial building on that property (i.e. the K3 site) as a consequence of ground vapours. Retesting of groundwater at existing monitoring wells on the adjacent commercial property, designated the K1 site in this report, was also carried out.
Vapour testing consisted of measuring the sub-slab vapour concentrations of TCE and PCE (and a range of other VOCs which were included in the analytical suite) at seven locations, plus measuring the contaminant flux rates through the pavement surface at those same seven locations. The same VOCs were monitored in ambient air, inside the commercial building on the K3 site and in outdoor air.
Beneath the pavement of the footpaths of Ashford Road, concentrations of TCE and PCE were very low in so much as they were less than their respective screening level guidance values given in the NEPM 2013 documentation. TCE and PCE were the only chlorinated VOCs detected in the sub-pavement soil vapour.
Of the five sub-slab soil vapour test points on the K3 site, TCE concentrations exceeded the NEPM 2013 criterion at four locations. Only one location, in the north-western sector (K3SS7a) could be considered significantly high. With the exception of K3SS7a, the relatively even concentrations over the study area suggests the immediate vapour source is TCE in groundwater beneath the K3 site, although from the small number of sampling locations there is only low level confidence in this conclusion. The higher soil vapour concentration recorded at K3SS7a (2,300 µg/m3) suggests there may be a local source of TCE impact in soil.
The NEPM criteria for soil vapour concentrations of chlorinated hydrocarbons (NEPM 2013, Schedule B1, Table 1A(2)) are presented in that guidance document as tier 1 screening level criteria, which, if exceeded, indicate a need for a more site specific investigation. That further investigation was carried out in December 2014, concurrently with the sub-slab vapour testing, by means of surface flux measurements and indoor air sampling. The measurement of surface flux beside each of the sub-slab test points showed that fluxes of TCE and PCE through the floor into the building were trivial. When converted into calculated indoor air concentrations the fluxes were found to contribute only a minor amount to the actual indoor air concentrations, which were greatly less than acceptable air concentrations based on literature toxicity values and acceptable risk levels.
Indoor air measurements of TCE and PCE supported the results of the mass flux chamber measurements in so much as measured ambient air concentrations were low, greatly less than acceptable concentrations. Further evidence that the sub-slab TCE vapour is not adversely affecting the indoor air quality can be seen from the ambient air data showing that indoor and outdoor concentrations of TCE are not different.
In summary, the soil vapour testing on Ashford Road and the K3 site indicated:
The concentrations of TCE and PCE in soil vapour beneath Ashford Road are not significantly high, suggesting that the migration of TCE and PCE from the K1 site to the K2 site is weak, if any.
The low to moderate concentrations of TCE vapours beneath the floor slab of the commercial building on the K3 site make only a very minor contribution to the indoor air concentrations in the building. And, the measured indoor air concentrations of TCE and PCE are greatly less than the acceptable risk based concentrations derived from the literature (WHO and US EPA IRIS data base).
The relatively low TCE and PCE sub-slab soil vapour concentrations on the K3 site suggest the source is from groundwater and not from local areas of impacted soil. However, the single high concentration in the north-western sector of the building, K3SS7a, indicates a local source may exist in the soil.

Parsons Brinckerhoff | Keswick K3 Site Vapour December 2014_2201557b 24
Kelvinator Australia Pty Limited Soil Vapour Investigations for Identification of Trichloroethene - Ashford Road & Everard Avenue, Keswick, South Australia [K3 site]
Finally, resampling of three existing wells at the K1 site showed that concentrations had not changed significantly since previous sampling 12 months earlier. And, one monitoring well again showed substantially high concentrations of TCE. Direction of groundwater gradient flow cannot be determined from these three wells.

Parsons Brinckerhoff | Keswick K3 Site Vapour December 2014_2201557b 25
Kelvinator Australia Pty Limited Soil Vapour Investigations for Identification of Trichloroethene - Ashford Road & Everard Avenue, Keswick, South Australia [K3 site]
12. Limitations Scope of Services
This soil vapour measurement report (‘the report’) has been prepared in accordance with the scope of services set out in the contract, or as otherwise agreed, between the Client and PB (‘scope of services’). In some circumstances the scope of services may have been limited by a range of factors such as time, budget, access and/or site disturbance constraints.
Reliance on Data
In preparing the report, PB has relied upon data, surveys, analyses, designs, plans and other information provided by the Client and other individuals and organisations, most of which are referred to in the report (‘the data’). Except as otherwise stated in the report, PB has not verified the accuracy or completeness of the data. To the extent that the statements, opinions, facts, information, conclusions and/or recommendations in the report (‘conclusions’) are based in whole or part on the data, those conclusions are contingent upon the accuracy and completeness of the data. PB will not be liable in relation to incorrect conclusions should any data, information or condition be incorrect or have been concealed, withheld, misrepresented or otherwise not fully disclosed to PB.
Environmental Conclusions
In accordance with the scope of services, PB has relied upon the data and has conducted environmental field monitoring and/or testing in the preparation of the report. The nature and extent of monitoring and/or testing conducted is described in the report.
On all sites, varying degrees of non-uniformity of the vertical and horizontal soil or groundwater conditions are encountered. Hence no monitoring, common testing or sampling technique can eliminate the possibility that monitoring or testing results/samples are not totally representative of soil vapour, soil and/or groundwater conditions encountered. The conclusions are based upon the data and the environmental field monitoring and/or testing and are therefore merely indicative of the environmental condition of the site at the time of preparing the report, including the presence or otherwise of contaminants or emissions.
Also, it should be recognised that site conditions, including the extent and concentration of contaminants, can change with time.
Within the limitations imposed by the scope of services, the monitoring, testing, sampling and preparation of this report have been undertaken and performed in a professional manner, in accordance with generally accepted practices and using a degree of skill and care ordinarily exercised by reputable environmental consultants under similar circumstances. No other warranty, expressed or implied, is made.
Report for Benefit of Client
The report has been prepared for the benefit of the Client and no other party. PB assumes no responsibility and will not be liable to any other person or organisation for or in relation to any matter dealt with or conclusions expressed in the report, or for any loss or damage suffered by any other person or organisation arising from matters dealt with or conclusions expressed in the report (including without limitation matters arising from any negligent act or omission of PB or for any loss or damage suffered by any other party relying upon the matters dealt with or conclusions expressed in the report). Other parties should not rely upon the report or the accuracy or completeness of any conclusions and should make their own enquiries and obtain independent advice in relation to such matters.

Parsons Brinckerhoff | Keswick K3 Site Vapour December 2014_2201557b 26
Kelvinator Australia Pty Limited Soil Vapour Investigations for Identification of Trichloroethene - Ashford Road & Everard Avenue, Keswick, South Australia [K3 site]
Other Limitations
PB will not be liable to update or revise the report to take into account any events or emergent circumstances or facts occurring or becoming apparent after the date of the report.
The scope of services did not include any assessment of the title to or ownership of the properties, buildings and structures referred to in the report nor the application or interpretation of laws in the jurisdiction in which those properties, buildings and structures are located.

Parsons Brinckerhoff | Keswick K3 Site Vapour December 2014_2201557b 27
Kelvinator Australia Pty Limited Soil Vapour Investigations for Identification of Trichloroethene - Ashford Road & Everard Avenue, Keswick, South Australia [K3 site]
13. References BlueSphere Environmental, 17 December 2013, Re: Soil Vapour Investigation at U-Store-It Keswick, Letter report to John Eastwood, U-Store-It Pty Ltd.
CRC Care September 2011. Health screening levels for petroleum hydrocarbons in soil and groundwater. Part 1: Technical development document. CRC CARE Technical Report No 10. CRC for Contamination Assessment and Remediation of the Environment, Adelaide, Australia.
Hoekstra, E.J; De Leer, E. W. B; Brinkman, U. A. T.h. Natural formation of chloroform and brominated trihalomethanes in soil. Environ. Sci, Technol. 1998, 32,3724 – 3729
McAlary, T; Groenevelt, H; Gorecki, T; Seethapathy, S. PDMS Membrane Samplers for Quantitative Passive Monitoring of Soil Vapor Intrusion to Indoor Air. A&WMA ‘Vapor Intrusion 2009’, January 27-30, San Diego, CA Heggie, A. C; Stavropoulos, B. Evaluating vapour intrusion risk using comparative dynamic and passive flux chambers at a TCE impacted site in Sydney, Australia. A&WMA Vapor Intrusion 2010, September 2010
National Environment Protection Council (NEPC) 2013, National Environment Protection (Assessment of Site Contamination) Amendment Measure 2013 (No. 1)
Parsons Brinckerhoff, 28 May 2014, Surface Mass Flux & Sub-slab Soil Vapour Measurements for Idenfication of Trichloroethene, March 2014 Keswick, South Australia
Terra Environment, 18 December 2013, 62-70 Everard Avenue, Keswick Limited Groundwater Investigations Monitoring Report Prepared for JE Pty Ltd.
US EPA, 2004 User’s guide for evaluating subsurface vapour intrusion into buildings, prepared by Environmental Quality Management Inc., North Carolina
US EPA Guidance for the Data Objective Process and Data Quality Objectives Process for Hazardous Waste Site Investigations, January 2000, EPA/600/R-00/007
USEPA EPA On-line tools for Site Assessment Calculation http://www.epa.gov/Athens/learn2model/part-two/onsite/esthenry.html World Health Organisation Regional Office for Europe, WHO guidelines for indoor air quality: selected pollutants, Denmark, 2010
World Health Organisation Regional Office for Europe, Air quality guidelines for Europe, second edition, WHO regional publications, European series, no 91, Copenhagen, 2000

Figures

Figu
re 1
Inve
stig
atio
n ar
ea, D
ecem
ber 2
014
Ever
ard
Aven
ue K
esw
ick,
Sou
th A
ustr
alia
Kel
vina
tor A
ustra
lia P
ty L
imite
d
Bas
e m
ap s
ourc
e: G
oogl
e E
arth
Pro
LEG
END
Pro
perty
bou
ndar
ies
K3
Com
mer
cial
build
ing
K1 si
teK3
site

EVER
AR
D S
TREE
T, K
ESW
ICK
SOU
TH A
UST
RA
LIA
Kel
vina
tor P
ty L
td
Source: Image @ 2014 Aerometrex/@ 2014 Google Earth Pro
EV
ER
AR
D A
VE
NU
E
ASHFORD ROAD
CROYDON ROAD
HAM
PTON
RO
AD
Pre
vile
ge
d a
nd
co
nfi
de
nti
al:
pre
par
ed in
co
ntem
pla
tion
of
leg
al p
roce
edin
gs
EV
ER
AR
D A
VE
NU
E
030m
N
xx
8
Sub
-sla
b sa
mpl
ing
loc-
atio
n
Flux
sam
plin
g lo
catio
n
Am
bien
t air
sam
plin
glo
catio
n
Figu
re 2
. Sam
plin
g lo
catio
ns fo
r tric
hlor
oeth
ene
inve
stig
atio
ns a
t Eve
rard
Ave
& A
shfo
rd R
d, K
esw
ick
SA (K
3 Si
te),
Dec
embe
r 201
4
AVEN
UE,
Lege
nd

Figu
re 3
Con
cent
ratio
ns o
f sub
-sla
b va
pour
s; s
urfa
ce fl
ux ra
tes
and
ambi
ent a
ir fo
r TC
E D
ecem
ber 2
014
Ever
ard
Aven
ue K
esw
ick,
Sou
th A
ustr
alia
Kel
vina
tor A
ustra
lia P
ty L
imite
d
Bas
e m
ap s
ourc
e: G
oogl
e E
arth
Pro
)LE
GEN
DP
rope
rties
Sub-
slab
vapo
ur te
st p
oint
Surf
ace
flux
test
poi
nt
K3SS
7a2,
300
µg/m
3
K3PF
7a0.
003
µg/m
2 /h
K3SS
5a28
0 µg
/m3
K3SS
6a25
0 µg
/m3
K3SS
4a73
µg/
m3
K3SS
3a16
0 µg
/m3
K3SS
1a49
µg/
m3
K3SS
2a6.
3 µg
/m3
K3PF
6a0.
052
µg/m
2 /h
K3PF
5a0.
065
µg/m
2 /h
K3PF
3a0.
002
µg/m
2 /h
K3PF
4a0.
004
µg/m
2 /h
K3PF
1a<0
.005
µg/
m2 /
h
K3PF
2a0.
018
µg/m
2 /h
Ambi
ent
air s
ampl
e
K3AA
40.
09 µ
g/m
3
K3AA
30.
11 µ
g/m
3
K3AA
20.
09 µ
g/m
3
K3AA
50.
07 µ
g/m
3
K3AA
10.
11 µ
g/m
3
K3 S
ite
Com
mer
cial
Bu
ildin
g
K1 S
ite

Figu
re 4
Con
cent
ratio
ns o
f sub
-sla
b va
pour
s; s
urfa
ce fl
ux ra
tes
and
ambi
ent a
ir fo
r PC
ED
ecem
ber 2
014
Ever
ard
Aven
ue K
esw
ick,
Sou
th A
ustr
alia
Kel
vina
tor A
ustra
lia P
ty L
imite
d
Bas
e m
ap s
ourc
e: G
oogl
e E
arth
Pro
)LE
GEN
DP
rope
rties
Sub-
slab
vapo
ur te
st p
oint
Surf
ace
flux
test
poi
nt
K3SS
7a50
µg/
m3
K3PF
7a0.
003
µg/m
2 /h
K3SS
5a12
µg/
m3
K3SS
6a12
µg/
m3
K3SS
4a3.
9 µg
/m3
K3SS
3a15
µg/
m3
K3SS
1a16
µg/
m3
K3SS
2a<1
.5 µ
g/m
3
K3PF
6a0.
003
µg/m
2 /h
K3PF
5a0.
005
µg/m
2 /h
K3PF
3a<0
.001
µg/m
2 /h
K3PF
4a0.
005
µg/m
2 /h
K3PF
1a0.
009
µg/m
2 /h
K3PF
2a<0
.000
5 µg
/m2 /
h
Ambi
ent
air s
ampl
e
K3AA
40.
15 µ
g/m
3
K3AA
30.
14 µ
g/m
3
K3AA
20.
13 µ
g/m
3
K3AA
50.
14 µ
g/m
3
K3AA
10.
13 µ
g/m
3
K3 S
ite
Com
mer
cial
Bu
ildin
g
K1 S
ite

Figu
re 5
TC
E &
PCE
conc
entra
tions
in G
roun
dwat
er.
Sam
plin
g in
Dec
embe
r 201
4
Ever
ard
Aven
ue K
esw
ick,
Sou
th A
ustr
alia
Kel
vina
tor A
ustra
lia P
ty L
imite
d
Bas
e m
ap s
ourc
e: G
oogl
e E
arth
Pro
LEG
END
Pro
perti
es
Gro
undw
ater
mon
itorin
g w
ell
KMW
3
KMW
2KM
W1
K3
Com
mer
cial
build
ing
K1 si
te
TCE
1,3
80 µ
g/L
PCE
<5
µg/L
TCE
16,
300
µg/L
PCE
19
µg/L
TCE
264
µg/
LPC
E 7
µg/
L
K3 si
te

Appendix A
Sub-slab soil vapour – summary table

Table A1Sub-slab Soil Vapour ConcentrationsK3 Commercial Building & Ashford Road, KeswickDecember 2014
Units K3SS1a K3SS2a K3SS3a K3SS4a K3SS5a K3SS5a dup K3SS6a K3SS7a
Benzene µg/m3 <2.6 6.2 <2.6 <2.7 <2.9 <3 <3.2 <3.22-butanone(MEK) µg/m3 <4.9 <4.9 <4.9 <5.2 <5.5 <5.8 <6.2 <6.2n-Butylbenzene µg/m3 <0.95 <0.95 <0.95 <1 <1.1 <1.1 <1.2 <1.2Carbon tetrachloride µg/m3 <4 8.9 <4 <4.2 <4.5 <4.7 <5 <5Chloroethane µg/m3 <6.4 <6.4 <6.4 <6.8 <7.1 <7.6 <8 <8Chloromethane µg/m3 <6.4 <6.4 <6.4 <6.8 <7.1 <7.6 <8 <8Cyclohexane µg/m3 <3.4 <3.4 <3.4 <3.6 <3.8 <4 <4.2 <4.2n-Decane µg/m3 <29 <29 <29 <30 <32 <34 <36 <36Dibromochloromethane µg/m3 <1.9 <1.9 <1.9 <2 <2.2 <2.3 <2.4 <2.41,2-Dibromoethane µg/m3 <1.9 <1.9 <1.9 <2 <2.2 <2.3 <2.4 <2.4Dichlorodifluoromethane µg/m3 <34 <34 <34 <36 <38 <40 <42 <421,1-Dichloroethane µg/m3 <6.4 <6.4 <6.4 <6.8 <7.1 <7.6 <8 <81,2-Dichloroethane µg/m3 <2.6 <2.6 <2.6 <2.7 <2.9 <3 <3.2 <3.21,1-Dichloroethene µg/m3 <7.5 <7.5 <7.5 <7.9 <8.4 <8.9 <9.4 <9.4cis-1,2-Dichloroethene µg/m3 <3.3 <3.3 <3.3 <3.4 <3.6 <3.8 <4.1 9.8trans-1,2-Dichloroethene µg/m3 <3.4 <3.4 <3.4 <3.6 <3.8 <4 <4.2 <4.22,4-dimethylpentane µg/m3 <3.4 <3.4 <3.4 <3.6 <3.8 <4 <4.2 <4.2n-Dodecane µg/m3 <290 <290 <290 <300 <320 <340 <360 <360Ethylbenzene µg/m3 <1.4 <1.4 <1.4 <1.5 <1.5 <1.6 <1.7 <1.7Ethylcyclohexane µg/m3 <3.4 <3.4 <3.4 <3.6 <3.8 <4 <4.2 <4.2n-Heptane µg/m3 <3.4 <3.4 <3.4 <3.6 <3.8 <4 <4.2 <4.2n-Hexane µg/m3 <34 <34 <34 <36 <38 <40 <42 <42Isopropanol µg/m3 <490 <490 <490 <520 <550 <580 <620 <620Isopropylbenzene µg/m3 <1.4 <1.4 <1.4 <1.5 <1.6 <1.7 <1.8 <1.84-Isopropyltoluene µg/m3 <1.4 <1.4 <1.4 <1.5 <1.6 <1.7 <1.8 <1.82-Methyl butane µg/m3 <34 <34 <34 <36 <38 <40 <42 <42Methyl tert-butyl ether µg/m3 <3.4 <3.4 <3.4 <3.6 <3.8 <4 <4.2 <4.2Methylcyclohexane µg/m3 <3.4 <3.4 5.4 <3.6 <3.8 <4 <4.2 <4.22-Methylhexane µg/m3 <3.4 <3.4 <3.4 <3.6 <3.8 <4 <4.2 <4.23-Methylhexane µg/m3 <3.4 <3.4 <3.4 <3.6 <3.8 <4 <4.2 <4.22-Methylpentane µg/m3 <3.4 <3.4 <3.4 <3.6 <3.8 <4 <4.2 <4.23-Methylpentane µg/m3 <3.4 <3.4 <3.4 <3.6 <3.8 <4 <4.2 <4.2Naphthalene µg/m3 <1.7 <1.7 <1.7 <1.8 <1.9 <2 <2.2 <2.2n-Nonane µg/m3 <1.4 <1.4 <1.4 <1.5 <1.6 <1.7 <1.8 <1.8n-Octane µg/m3 <3.4 <3.4 <3.4 <3.6 <3.8 <4 <4.2 <4.2n-Pentane µg/m3 <34 <34 <34 <36 <38 <40 <42 <42propylbenzene µg/m3 <1.4 <1.4 <1.4 <1.5 <1.6 <1.7 <1.8 <1.8Tetrachloroethene µg/m3 16 <1.5 15 3.9 12 11 12 50Toluene µg/m3 <1.7 6.6 <1.7 <1.8 <1.9 <2.1 <2.2 <2.21,1,1-trichloroethane µg/m3 <4.9 <4.9 7.9 <5.2 7.7 9.3 <6.2 <6.21,1,2-trichloroethane µg/m3 <1.9 <1.9 <1.9 <2 <2.2 <2.3 <2.4 <2.4Trichloroethene µg/m3 49 6.3 160 73 280 280 250 2300Trichloromethane µg/m3 <3.2 <3.2 <3.2 <3.4 <3.6 <3.8 <4 5.61,2,4-Trimethylbenzene µg/m3 <0.95 <0.95 <0.95 <1 <1.1 <1.1 <1.2 <1.21,3,5-Trimethylbenzene µg/m3 <0.95 <0.95 <0.95 <1 <1.1 <1.1 <1.2 <1.2n-Undecane µg/m3 <9.5 <9.5 <9.5 <10 <11 <11 <12 <12Vinyl Chloride µg/m3 <12 <12 <12 <13 <14 <15 <15 <15o-Xylene µg/m3 <1.4 <1.4 <1.4 <1.5 <1.6 <1.7 <1.8 <1.8m&p-Xylenes µg/m3 <1.4 1.7 <1.4 <1.5 <1.6 <1.7 <1.8 <1.8TRH C6-C10 µg/m3 240 190 220 370 660 420 740 2600TRH > C10-C16 µg/m3 <1400 <1400 <1400 <1500 <1600 <1700 <1800 <1800
NOTE:Compounds of interest

K3 Site and Ashford Road, Keswick; December 2014
Compound Units K3SS5a K3SS5a dup RPD (%)
Benzene µg/m3 <2.9 <3 -2-butanone(MEK) µg/m3 <5.5 <5.8 -n-Butylbenzene µg/m3 <1.1 <1.1 -Carbon tetrachloride µg/m3 <4.5 <4.7 -Chloroethane µg/m3 <7.1 <7.6 -Chloromethane µg/m3 <7.1 <7.6 -Cyclohexane µg/m3 <3.8 <4 -n-Decane µg/m3 <32 <34 -Dibromochloromethane µg/m3 <2.2 <2.3 -1,2-Dibromoethane µg/m3 <2.2 <2.3 -Dichlorodifluoromethane µg/m3 <38 <40 -1,1-Dichloroethane µg/m3 <7.1 <7.6 -1,2-Dichloroethane µg/m3 <2.9 <3 -1,1-Dichloroethene µg/m3 <8.4 <8.9 -cis-1,2-Dichloroethene µg/m3 <3.6 <3.8 -trans-1,2-Dichloroethene µg/m3 <3.8 <4 -2,4-dimethylpentane µg/m3 <3.8 <4 -n-Dodecane µg/m3 <320 <340 -Ethylbenzene µg/m3 <1.5 <1.6 -Ethylcyclohexane µg/m3 <3.8 <4 -n-Heptane µg/m3 <3.8 <4 -n-Hexane µg/m3 <38 <40 -Isopropanol µg/m3 <550 <580 -Isopropylbenzene µg/m3 <1.6 <1.7 -4-Isopropyltoluene µg/m3 <1.6 <1.7 -2-Methyl butane µg/m3 <38 <40 -Methyl tert-butyl ether µg/m3 <3.8 <4 -Methylcyclohexane µg/m3 <3.8 <4 -2-Methylhexane µg/m3 <3.8 <4 -3-Methylhexane µg/m3 <3.8 <4 -2-Methylpentane µg/m3 <3.8 <4 -3-Methylpentane µg/m3 <3.8 <4 -Naphthalene µg/m3 <1.9 <2 -n-Nonane µg/m3 <1.6 <1.7 -n-Octane µg/m3 <3.8 <4 -n-Pentane µg/m3 <38 <40 -propylbenzene µg/m3 <1.6 <1.7 -Tetrachloroethene µg/m3 12 11 9%Toluene µg/m3 <1.9 <2.1 -1,1,1-trichloroethane µg/m3 7.7 9.3 19%1,1,2-trichloroethane µg/m3 <2.2 <2.3 -Trichloroethene µg/m3 280 280 0%Trichloromethane µg/m3 <3.6 <3.8 -1,2,4-Trimethylbenzene µg/m3 <1.1 <1.1 -1,3,5-Trimethylbenzene µg/m3 <1.1 <1.1 -n-Undecane µg/m3 <11 <11 -Vinyl Chloride µg/m3 <14 <15 -o-Xylene µg/m3 <1.6 <1.7 -m&p-Xylenes µg/m3 <1.6 <1.7 -TRH C6-C10 µg/m3 660 420 44%TRH > C10-C16 µg/m3 <1600 <1700 -Note:
Compounds of interest
Table A2 Relative Percent Differences for Sub-slab Vapour Duplicate Samples

K3 Site & Ashford Road, Keswick; December 2014
Units PQL Trip Blank 1Benzene µg total 0.05 nd2-butanone(MEK) µg total 0.05 ndn-Butylbenzene µg total 0.05 ndCarbon tetrachloride µg total 0.05 ndChloroethane µg total 0.05 ndChloromethane µg total 0.05 ndCyclohexane µg total 0.05 ndn-Decane µg total 5 ndDibromochloromethane µg total 0.05 nd1,2-Dibromoethane µg total 0.05 ndDichlorodifluoromethane µg total 0.05 nd1,1-Dichloroethane µg total 0.05 nd1,2-Dichloroethane µg total 0.05 nd1,1-Dichloroethene µg total 0.05 ndcis-1,2-Dichloroethene µg total 0.05 ndtrans-1,2-Dichloroethene µg total 0.05 nd2,4-dimethylpentane µg total 0.05 ndn-Dodecane µg total 25 ndEthylbenzene µg total 0.05 ndEthylcyclohexane µg total 0.05 ndn-Heptane µg total 0.05 ndn-Hexane µg total 1 ndIsopropanol µg total 0.05 ndIsopropylbenzene µg total 0.05 nd4-Isopropyltoluene µg total 0.05 nd2-Methyl butane µg total 0.5 ndMethyl tert-butyl ether µg total 0.05 ndMethylcyclohexane µg total 0.05 nd2-Methylhexane µg total 0.05 nd3-Methylhexane µg total 0.05 nd2-Methylpentane µg total 5 nd3-Methylpentane µg total 0.05 ndNaphthalene µg total 0.05 ndn-Nonane µg total 0.05 ndn-Octane µg total 0.05 ndn-Pentane µg total 1 ndpropylbenzene µg total 0.05 ndTetrachloroethene µg total 0.05 ndToluene µg total 0.05 nd1,1,1-trichloroethane µg total 0.05 nd1,1,2-trichloroethane µg total 0.05 ndTrichloroethene µg total 0.05 ndTrichloromethane µg total 0.05 nd1,2,4-Trimethylbenzene µg total 0.05 nd1,3,5-Trimethylbenzene µg total 0.05 ndn-Undecane µg total 0.2 ndVinyl Chloride µg total 0.05 ndo-Xylene µg total 0.05 ndm&p-Xylenes µg total 0.05 ndTRH C6-C10 µg total 15 17TRH > C6-C10 µg total 15 nd
Table A3 Sub-slab trip blank (mass on tube (µg))

Appendix B
Flux Results - Summary Tables

Units PQL1 K3PF1a K3PF2a PQL2 K3PF3a K3PF3a dup K3PF4a K3PF5a K3PF6a K3PF7a
Benzene µg/tube 0.005 0.019 0.016 0.05 0.22 0.26 0.42 0.66 0.36 0.56
2-butanone(MEK) µg/tube 0.005 nd nd 0.05 0.5 0.48 0.88 4.2 0.58 1.5
n-Butylbenzene µg/tube 0.005 nd nd 0.05 nd nd 0.36 0.48 0.06 nd
Carbon tetrachloride µg/tube 0.005 nd nd 0.05 nd nd 0.14 0.08 0.08 0.24
Chloroethane µg/tube 0.005 nd nd 0.05 nd nd nd nd nd nd
Chloromethane µg/tube 0.005 nd nd 0.05 nd nd nd nd 0.18 nd
Cyclohexane µg/tube 0.005 nd nd 0.05 0.56 0.48 1.3 1.3 0.96 0.84
n-Decane µg/tube 0.005 nd nd 1 6 6 13 27 9 15
Dibromochloromethane µg/tube 0.005 nd nd 0.05 nd nd nd nd 0.14 nd
1,2-Dibromoethane µg/tube 0.005 nd nd 0.05 nd nd nd nd nd nd
Dichlorodifluoromethane µg/tube 0.005 nd nd 0.05 nd nd nd nd nd nd
1,1-Dichloroethane µg/tube 0.005 nd nd 0.05 nd nd nd nd 0.3 nd
1,2-Dichloroethane µg/tube 0.005 nd nd 0.05 nd nd nd nd nd nd
1,1-Dichloroethene µg/tube 0.005 nd nd 0.05 nd nd nd nd 1 nd
cis-1,2-Dichloroethene µg/tube 0.005 nd 0.008 0.05 nd nd nd nd nd nd
trans-1,2-Dichloroethene µg/tube 0.005 nd nd 0.05 nd nd nd nd nd nd
2,4-dimethylpentane µg/tube 0.005 nd nd 0.05 nd nd 0.22 0.2 nd nd
n-Dodecane µg/tube 0.005 nd nd 5 48 46 84 69 55 75
Ethylbenzene µg/tube 0.005 nd nd 0.05 2.6 2.5 19 1.8 0.84 0.8
Ethylcyclohexane µg/tube 0.005 nd nd 0.05 nd nd 0.22 0.58 0.14 0.12
n-Heptane µg/tube 0.005 nd nd 0.05 0.82 0.88 1.9 1.9 1.4 1.2
n-Hexane µg/tube 0.005 0.013 0.006 0.05 0.98 1 3.3 2.3 1.9 1.8
Isopropanol µg/tube 0.050 nd nd 5 nd nd nd nd nd nd
Isopropylbenzene µg/tube 0.005 nd nd 0.05 0.3 0.32 3.1 0.28 0.1 0.14
4-Isopropyltoluene µg/tube 0.005 nd 0.005 0.05 0.16 0.16 1.4 0.82 0.32 0.28
2-Methyl butane µg/tube 0.005 0.034 0.035 0.5 1.4 1.4 5 4.9 2.4 3.6
Methyl tert-butyl ether µg/tube 0.005 nd nd 0.05 nd nd nd nd nd nd
Methylcyclohexane µg/tube 0.005 nd nd 0.05 0.3 0.3 0.84 0.96 0.62 0.54
2-Methylhexane µg/tube 0.005 nd nd 0.05 0.44 0.42 1.1 1.1 0.82 0.82
3-Methylhexane µg/tube 0.005 nd nd 0.05 0.48 0.46 1.3 1.2 0.9 0.9
2-Methylpentane µg/tube 0.005 0.02 0.007 0.05 0.78 0.86 2.5 2.6 1.5 1.8
3-Methylpentane µg/tube 0.005 0.008 nd 0.05 0.5 0.46 1.5 1.1 0.8 0.88
Naphthalene µg/tube 0.005 nd nd 0.05 nd nd 0.44 0.52 0.28 0.22
n-Nonane µg/tube 0.005 nd nd 0.05 0.52 0.52 2.1 2.8 1.2 1.1
n-Octane µg/tube 0.005 nd nd 0.05 1 1 0.78 1.5 0.72 0.5
n-Pentane µg/tube 0.005 0.034 0.028 0.5 1.4 1.4 2 3 1.8 2.2
propylbenzene µg/tube 0.005 nd nd 0.05 0.32 0.34 2.8 0.7 0.26 0.22
Tetrachloroethene µg/tube 0.005 0.008 nd 0.05 nd nd 0.22 0.22 0.16 0.12
Toluene µg/tube 0.005 0.021 0.043 0.05 2.3 2.2 8 13 3.3 4.6
1,1,1-trichloroethane µg/tube 0.005 nd nd 0.05 nd nd nd 0.1 nd nd
1,1,2-trichloroethane µg/tube 0.005 nd nd 0.05 nd nd nd nd 0.18 nd
Trichloroethene µg/tube 0.005 nd 0.062 0.05 0.08 0.08 0.18 3 2.4 0.12
Trichloromethane µg/tube 0.005 nd nd 0.05 0.18 0.18 0.42 nd nd 0.34
1,2,4-Trimethylbenzene µg/tube 0.005 nd nd 0.05 1.4 1.3 10 6.9 1.7 1.5
1,3,5-Trimethylbenzene µg/tube 0.005 nd nd 0.05 0.52 0.5 4.4 2.2 1.3 0.42
n-Undecane µg/tube 0.005 nd nd 0.05 27 25 43 42 38 44
Vinyl Chloride µg/tube 0.005 nd nd 0.05 nd nd nd nd nd nd
o-Xylene µg/tube 0.005 nd nd 0.05 16 16 96 3.3 1.1 1.2
m&p-Xylenes µg/tube 0.005 nd 0.005 0.05 20 19 110 7.6 2.7 2.7
TRH C6-C10 µg/tube 5.0 98 110 440 230 76 100
TRH >C10-C16 µg/tube 5.0 1700 1700 2800 2000 1800 2300Notes:Bold: detected compoundChlorinated solvent compounds of interestPQL1 for thermal tubesPQL2 for solvent tubes
Table B1Surface Flux Chambers: Mass on sampling tubes K3 Site & Ashford Road, Keswick; December 2014

Table B2Surface flux of TCE & PCE (µg/m2/h) K3 Site & Ashford Road, Keswick: December 2014
Analyte Units K3PF1a K3PF2a K3PF3a K3PF3a duplicate K3PF4a K3PF5a K3PF6a K3PF7a
Trichloroethene µg/m2/h <0.005 0.018 0.002 0.002 0.004 0.065 0.052 0.003Tetrachloroethene µg/m2/h 0.009 <0.005 <0.001 <0.001 0.005 0.005 0.003 0.003

Table B3
K3 Site & Ashford Road, Keswick; December 2014
Benzene ng 0.22 0.26 17%
2-butanone(MEK) ng 0.5 0.48 4%
n-Butylbenzene ng nd nd -
Carbon tetrachloride ng nd nd -
Chloroethane ng nd nd -
Chloromethane ng nd nd -
Cyclohexane ng 0.56 0.48 15%
n-Decane ng 6 6 0%
Dibromochloromethane ng nd nd -
1,2-Dibromoethane ng nd nd -
Dichlorodifluoromethane ng nd nd -
1,1-Dichloroethane ng nd nd -
1,2-Dichloroethane ng nd nd -
1,1-Dichloroethene ng nd nd -
cis-1,2-Dichloroethene ng nd nd -
trans-1,2-Dichloroethene ng nd nd -
2,4-dimethylpentane ng nd nd -
n-Dodecane ng 48 46 4%
Ethylbenzene ng 2.6 2.5 4%
Ethylcyclohexane ng nd nd -
n-Heptane ng 0.82 0.88 7%
n-Hexane ng 0.98 1 2%
Isopropanol ng nd nd -
Isopropylbenzene ng 0.3 0.32 6%
4-Isopropyltoluene ng 0.16 0.16 0%
2-Methyl butane ng 1.4 1.4 0%
Methyl tert-butyl ether ng nd nd -
Methylcyclohexane ng 0.3 0.3 0%
2-Methylhexane ng 0.44 0.42 5%
3-Methylhexane ng 0.48 0.46 4%
2-Methylpentane ng 0.78 0.86 10%
3-Methylpentane ng 0.5 0.46 8%
Naphthalene ng nd nd -
n-Nonane ng 0.52 0.52 0%
n-Octane ng 1 1 0%
n-Pentane ng 1.4 1.4 0%
propylbenzene ng 0.32 0.34 6%
Tetrachloroethene ng nd nd -
Toluene ng 2.3 2.2 4%
1,1,1-trichloroethane ng nd nd -
1,1,2-trichloroethane ng nd nd -
Trichloroethene ng 0.08 0.08 0%
Trichloromethane ng 0.18 0.18 0%
1,2,4-Trimethylbenzene ng 1.4 1.3 7%
1,3,5-Trimethylbenzene ng 0.52 0.5 4%
n-Undecane ng 27 25 8%
Vinyl Chloride ng nd nd -
o-Xylene ng 16 16 0%
m&p-Xylenes ng 20 19 5%
TRH C6-C10 µg 98 110 12%
TRH >C10-C16 µg 1700 1700 0%
Italics: A value equal to the PQL has been used for the calculation of RPDsBOLD RPD exceeds acceptable levels.
Compounds of interest
Relative Percent Differences for Flux Duplicate SamplesMass on tube (ng)
Compound Units K3PF3a K3PF3a dup RPD %

K3 Site & Ashford Road, Keswick; December 2014
Compound Units PQL Trip BlankBenzene ng 5 nd
2-butanone(MEK) ng 5 nd
n-Butylbenzene ng 5 nd
Carbon tetrachloride ng 5 nd
Chloroethane ng 5 nd
Chloromethane ng 5 nd
Cyclohexane ng 5 nd
n-Decane ng 5 nd
Dibromochloromethane ng 5 nd
1,2-Dibromoethane ng 5 nd
Dichlorodifluoromethane ng 5 nd
1,1-Dichloroethane ng 5 nd
1,2-Dichloroethane ng 5 nd
1,1-Dichloroethene ng 5 nd
cis-1,2-Dichloroethene ng 5 nd
trans-1,2-Dichloroethene ng 5 nd
2,4-dimethylpentane ng 5 nd
n-Dodecane ng 5 nd
Ethylbenzene ng 5 nd
Ethylcyclohexane ng 5 nd
n-Heptane ng 5 nd
n-Hexane ng 5 nd
Isopropanol ng 5 nd
Isopropylbenzene ng 5 nd
4-Isopropyltoluene ng 5 nd
2-Methyl butane ng 5 nd
Methyl tert-butyl ether ng 5 nd
Methylcyclohexane ng 5 nd
2-Methylhexane ng 5 nd
3-Methylhexane ng 5 nd
2-Methylpentane ng 5 nd
3-Methylpentane ng 5 nd
Naphthalene ng 5 nd
n-Nonane ng 5 nd
n-Octane ng 5 nd
n-Pentane ng 5 nd
propylbenzene ng 5 nd
Tetrachloroethene ng 5 nd
Toluene ng 5 9
1,1,1-trichloroethane ng 5 nd
1,1,2-trichloroethane ng 5 nd
Trichloroethene ng 5 nd
Trichloromethane ng 5 nd
1,2,4-Trimethylbenzene ng 5 nd
1,3,5-Trimethylbenzene ng 5 nd
n-Undecane ng 5 nd
Vinyl Chloride ng 5 nd
o-Xylene ng 5 nd
m&p-Xylenes ng 5 nd
Table B4 Trip blank (mass on tube (ng)), Radiello TD Code 145 tube

K3 Site & Ashford Road, Keswick; December 2014
Compound Units PQL Trip BlankBenzene µg 0.05 nd2-butanone(MEK) µg 0.05 ndn-Butylbenzene µg 0.05 ndCarbon tetrachloride µg 0.05 ndChloroethane µg 0.05 ndChloromethane µg 0.05 ndCyclohexane µg 0.05 ndn-Decane µg 1 ndDibromochloromethane µg 0.05 nd1,2-Dibromoethane µg 0.05 ndDichlorodifluoromethane µg 0.05 nd1,1-Dichloroethane µg 0.05 nd1,2-Dichloroethane µg 0.05 nd1,1-Dichloroethene µg 0.05 ndcis-1,2-Dichloroethene µg 0.05 ndtrans-1,2-Dichloroethene µg 0.05 nd2,4-dimethylpentane µg 0.05 ndn-Dodecane µg 5 ndEthylbenzene µg 0.05 ndEthylcyclohexane µg 0.05 ndn-Heptane µg 0.05 ndn-Hexane µg 0.05 ndIsopropanol µg 5 ndIsopropylbenzene µg 0.05 nd4-Isopropyltoluene µg 0.05 nd2-Methyl butane µg 0.5 ndMethyl tert-butyl ether µg 0.05 ndMethylcyclohexane µg 0.05 nd2-Methylhexane µg 0.05 nd3-Methylhexane µg 0.05 nd2-Methylpentane µg 0.05 nd3-Methylpentane µg 0.05 ndNaphthalene µg 0.05 ndn-Nonane µg 0.05 ndn-Octane µg 0.05 ndn-Pentane µg 0.5 ndpropylbenzene µg 0.05 ndTetrachloroethene µg 0.05 ndToluene µg 0.05 nd1,1,1-trichloroethane µg 0.05 nd1,1,2-trichloroethane µg 0.05 ndTrichloroethene µg 0.05 ndTrichloromethane µg 0.05 nd1,2,4-Trimethylbenzene µg 0.05 nd1,3,5-Trimethylbenzene µg 0.05 ndn-Undecane µg 0.05 ndVinyl Chloride µg 0.05 ndo-Xylene µg 0.05 ndm&p-Xylenes µg 0.05 nd
Table B5 Trip blank (mass on tube (µg)), Radiello SD Code 130 tube [for ambient air and SD flux tubes]

Appendix C
Indoor & Outdoor Ambient Air Measurements - Data Summary
Table

Table C1Indoor and Outdoor ambient air concentrations of volatile organic compounds (µg/m3)K3 Site, Commercial Building, Everard Ave, Keswick South Australia
Compound Units K3AA1 Building NE
K3AA2Building store
area south
K3AA3 Building admin
area
K3AA4 Outdoor north
western
K3AA5Outdoor SE on
fenceBenzene µg/m3 0.54 0.82 0.65 0.29 0.342-butanone(MEK) µg/m3 0.05 0.33 0.13 <0.02 <0.02n-Butylbenzene µg/m3 0.07 0.07 0.05 <0.03 <0.03Carbon tetrachloride µg/m3 0.5 0.42 0.47 0.5 0.5Chloroethane µg/m3 <0.02 <0.02 <0.02 <0.02 <0.02Chloromethane µg/m3 <0.02 <0.02 <0.02 <0.02 <0.02Cyclohexane µg/m3 4.1 2.5 3.4 0.36 0.32n-Decane µg/m3 2.7 1.6 1.9 <0.80 <0.81Dibromochloromethane µg/m3 <0.03 <0.03 <0.03 <0.03 <0.031,2-Dibromoethane µg/m3 <0.03 <0.03 <0.03 <0.03 <0.03Dichlorodifluoromethane µg/m3 0.05 0.05 0.06 0.05 0.051,1-Dichloroethane µg/m3 <0.02 <0.02 <0.02 <0.02 <0.021,2-Dichloroethane µg/m3 <0.02 <0.02 <0.02 <0.02 <0.021,1-Dichloroethene µg/m3 <0.02 <0.02 <0.02 <0.02 <0.02cis-1,2-Dichloroethene µg/m3 <0.02 <0.02 <0.02 <0.02 <0.02trans-1,2-Dichloroethene µg/m3 0.17 0.07 0.09 <0.02 <0.022,4-dimethylpentane µg/m3 0.75 0.51 0.66 <0.03 <0.03n-Dodecane µg/m3 <22 <22 <22 <22 <22Ethylbenzene µg/m3 1.5 1.6 1.4 0.32 0.33Ethylcyclohexane µg/m3 0.4 0.2 0.38 0.04 0.04n-Heptane µg/m3 12 6 9.6 0.42 0.29n-Hexane µg/m3 14 7.4 12 0.51 0.35Isopropanol µg/m3 <3.3 <3.3 <3.3 <3.3 <3.3Isopropylbenzene µg/m3 0.16 0.16 0.13 <0.03 0.044-Isopropyltoluene µg/m3 0.13 0.18 0.13 0.07 0.092-Methyl butane µg/m3 4.8 6.6 5.6 2.4 2.3Methyl tert-butyl ether µg/m3 <0.03 <0.03 <0.03 <0.03 <0.03Methylcyclohexane µg/m3 4.8 2.3 3.6 0.2 0.172-Methylhexane µg/m3 5.6 3.1 4.6 0.29 0.253-Methylhexane µg/m3 6.4 3.6 5.3 0.32 0.272-Methylpentane µg/m3 5.9 4.2 5.5 0.6 0.623-Methylpentane µg/m3 3.2 2.1 3 0.3 0.28Naphthalene µg/m3 <0.07 <0.07 <0.07 <0.07 <0.07n-Nonane µg/m3 2.3 1.2 1.4 0.2 0.14n-Octane µg/m3 1.8 0.86 1.1 0.17 0.16n-Pentane µg/m3 2.3 3 2.8 1.1 1propylbenzene µg/m3 0.32 0.36 0.29 0.06 0.06Tetrachloroethene µg/m3 0.13 0.13 0.14 0.15 0.14Toluene µg/m3 6.6 10 7.9 1.6 1.71,1,1-trichloroethane µg/m3 <0.03 <0.03 <0.03 <0.03 <0.031,1,2-trichloroethane µg/m3 <0.03 <0.03 <0.03 <0.03 <0.03Trichloroethene µg/m3 0.11 0.09 0.11 0.09 0.07Trichloromethane µg/m3 0.1 0.1 0.09 0.06 0.061,2,4-Trimethylbenzene µg/m3 1.9 2.1 1.7 0.36 0.431,3,5-Trimethylbenzene µg/m3 0.66 0.65 0.57 0.11 0.12n-Undecane µg/m3 3.5 2.4 2.4 0.58 0.52Vinyl Chloride µg/m3 <0.02 <0.02 <0.02 <0.02 <0.02o-Xylene µg/m3 1.5 2 1.6 0.3 0.32m&p-Xylenes µg/m3 4.5 5.6 4.5 0.79 0.86
NOTES:Compounds of interest
Method: Radiello Code 130 solvent desorption tubesSampling period: 25 November - 15 December 2014
December 2014

Appendix D
Daily Weather Observations - Adelaide Airport, November &
December 2014
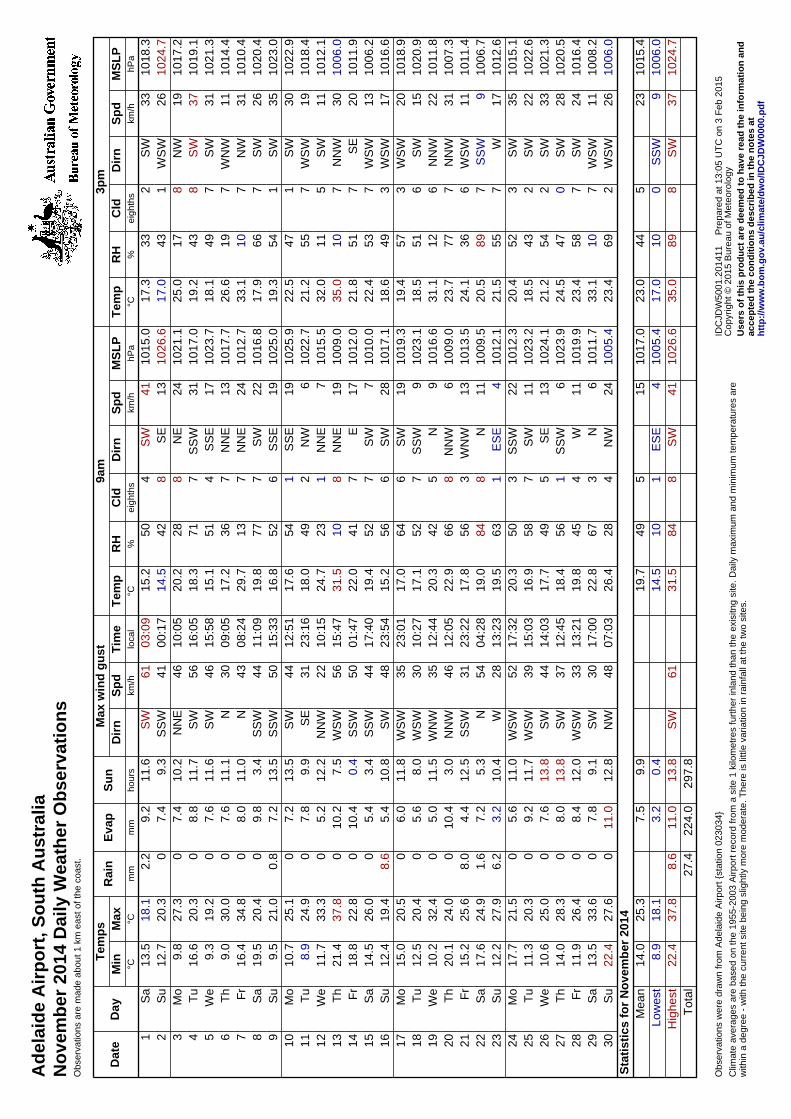
Ad
elai
de
Air
po
rt, S
ou
th A
ust
ralia
No
vem
ber
201
4 D
aily
Wea
ther
Ob
serv
atio
ns
Obs
erva
tions
are
mad
e ab
out 1
km
eas
t of t
he c
oast
.
IDC
JDW
5001
.201
411
Pre
pare
d at
13:
05 U
TC
on
3 F
eb 2
015
Cop
yrig
ht ©
201
5 B
urea
u of
Met
eoro
logy
Use
rs o
f th
is p
rod
uct
are
dee
med
to
hav
e re
ad t
he
info
rmat
ion
an
dac
cep
ted
th
e co
nd
itio
ns
des
crib
ed in
th
e n
ote
s at
htt
p:/
/ww
w.b
om
.go
v.au
/clim
ate/
dw
o/ID
CJD
W00
00.p
df
Obs
erva
tions
wer
e dr
awn
from
Ade
laid
e A
irpor
t {st
atio
n 02
3034
}
Clim
ate
aver
ages
are
bas
ed o
n th
e 19
55-2
003
Airp
ort r
ecor
d fr
om a
site
1 k
ilom
etre
s fu
rthe
r in
land
than
the
exis
itng
site
. Dai
ly m
axim
um a
nd m
inim
um te
mpe
ratu
res
are
with
in a
deg
ree
- w
ith th
e cu
rren
t site
bei
ng s
light
ly m
ore
mod
erat
e. T
here
is li
ttle
varia
tion
in r
ainf
all a
t the
two
site
s.
3pm
9am
Max
win
d g
ust
Su
nE
vap
Rai
nT
emp
sD
ayD
ate
MS
LP
Sp
dD
irn
Cld
RH
Tem
pM
SL
PS
pd
Dir
nC
ldR
HT
emp
Tim
eS
pd
Dir
nM
axM
inhP
akm
/hei
ghth
s%
°ChP
akm
/hei
ghth
s%
°Clo
cal
km/h
hour
sm
mm
m°C
°C
1018
.333
SW
233
17.3
1015
.041
SW
450
15.2
03:0
961
SW
11.6
9.2
2.2
18.1
13.5
Sa
110
24.7
26W
SW
143
17.0
1026
.613
SE
842
14.5
00:1
741
SS
W9.
37.
40
20.3
12.7
Su
210
17.2
19N
W8
1725
.010
21.1
24N
E8
2820
.210
:05
46N
NE
10.2
7.4
027
.39.
8M
o3
1019
.137
SW
843
19.2
1017
.031
SS
W7
7118
.316
:05
56S
W11
.78.
80
20.3
16.6
Tu
410
21.3
31S
W7
4918
.110
23.7
17S
SE
451
15.1
15:5
846
SW
11.6
7.6
019
.29.
3W
e5
1014
.411
WN
W7
1926
.610
17.7
13N
NE
736
17.2
09:0
530
N11
.17.
60
30.0
9.0
Th
610
10.4
31N
W7
1033
.110
12.7
24N
NE
713
29.7
08:2
443
N11
.08.
00
34.8
16.4
Fr
710
20.4
26S
W7
6617
.910
16.8
22S
W7
7719
.811
:09
44S
SW
3.4
9.8
020
.419
.5S
a8
1023
.035
SW
154
19.3
1025
.019
SS
E6
5216
.815
:33
50S
SW
13.5
7.2
0.8
21.0
9.5
Su
910
22.9
30S
W1
4722
.510
25.9
19S
SE
154
17.6
12:5
144
SW
13.5
7.2
025
.110
.7M
o10
1018
.419
WS
W7
5521
.210
22.7
6N
W2
4918
.023
:16
31S
E9.
97.
80
24.9
8.9
Tu
1110
12.1
11S
W5
1132
.010
15.5
7N
NE
123
24.7
10:1
522
NN
W12
.25.
20
33.3
11.7
We
1210
06.0
30N
NW
710
35.0
1009
.019
NN
E8
1031
.515
:47
56W
SW
7.5
10.2
037
.821
.4T
h13
1011
.920
SE
751
21.8
1012
.017
E7
4122
.001
:47
50S
SW
0.4
10.4
022
.818
.8F
r14
1006
.213
WS
W7
5322
.410
10.0
7S
W7
5219
.417
:40
44S
SW
3.4
5.4
026
.014
.5S
a15
1016
.617
WS
W3
4918
.610
17.1
28S
W6
5615
.223
:54
48S
W10
.85.
48.
619
.412
.4S
u16
1018
.920
WS
W3
5719
.410
19.3
19S
W6
6417
.023
:01
35W
SW
11.8
6.0
020
.515
.0M
o17
1020
.915
SW
651
18.5
1023
.19
SS
W7
5217
.110
:27
30W
SW
8.0
5.6
020
.412
.5T
u18
1011
.822
NN
W6
1231
.110
16.6
9N
542
20.3
12:4
435
WN
W11
.55.
00
32.4
10.2
We
1910
07.3
31N
NW
777
23.7
1009
.06
NN
W8
6622
.912
:05
46N
NW
3.0
10.4
024
.020
.1T
h20
1011
.411
WS
W6
3624
.110
13.5
13W
NW
356
17.8
23:2
231
SS
W12
.54.
48.
025
.615
.2F
r21
1006
.79
SS
W7
8920
.510
09.5
11N
884
19.0
04:2
854
N5.
37.
21.
624
.917
.6S
a22
1012
.617
W7
5521
.510
12.1
4E
SE
163
19.5
13:2
328
W10
.43.
26.
227
.912
.2S
u23
1015
.135
SW
352
20.4
1012
.322
SS
W3
5020
.317
:32
52W
SW
11.0
5.6
021
.517
.7M
o24
1022
.622
SW
243
18.5
1023
.211
SW
758
16.9
15:0
339
WS
W11
.79.
20
20.3
11.3
Tu
2510
21.3
33S
W2
5421
.210
24.1
13S
E5
4917
.714
:03
44S
W13
.87.
60
25.0
10.6
We
2610
20.5
28S
W0
4724
.510
23.9
6S
SW
156
18.4
12:4
537
SW
13.8
8.0
028
.314
.0T
h27
1016
.424
SW
758
23.4
1019
.911
W4
4519
.813
:21
33W
SW
12.0
8.4
026
.411
.9F
r28
1008
.211
WS
W7
1033
.110
11.7
6N
367
22.8
17:0
030
SW
9.1
7.8
033
.613
.5S
a29
1006
.026
WS
W2
6923
.410
05.4
24N
W4
2826
.407
:03
48N
W12
.811
.00
27.6
22.4
Su
30S
tati
stic
s fo
r N
ove
mb
er 2
014
1015
.423
544
23.0
1017
.015
549
19.7
9.9
7.5
25.3
14.0
Mea
n10
06.0
9S
SW
010
17.0
1005
.44
ES
E1
1014
.50.
43.
218
.18.
9Lo
wes
t10
24.7
37S
W8
8935
.010
26.6
41S
W8
8431
.561
SW
13.8
11.0
8.6
37.8
22.4
Hig
hest
297.
822
4.0
27.4
Tot
al

Ad
elai
de
Air
po
rt, S
ou
th A
ust
ralia
Dec
emb
er 2
014
Dai
ly W
eath
er O
bse
rvat
ion
sO
bser
vatio
ns a
re m
ade
abou
t 1 k
m e
ast o
f the
coa
st.
IDC
JDW
5001
.201
412
Pre
pare
d at
16:
05 U
TC
on
2 F
eb 2
015
Cop
yrig
ht ©
201
5 B
urea
u of
Met
eoro
logy
Use
rs o
f th
is p
rod
uct
are
dee
med
to
hav
e re
ad t
he
info
rmat
ion
an
dac
cep
ted
th
e co
nd
itio
ns
des
crib
ed in
th
e n
ote
s at
htt
p:/
/ww
w.b
om
.go
v.au
/clim
ate/
dw
o/ID
CJD
W00
00.p
df
Obs
erva
tions
wer
e dr
awn
from
Ade
laid
e A
irpor
t {st
atio
n 02
3034
}
Clim
ate
aver
ages
are
bas
ed o
n th
e 19
55-2
003
Airp
ort r
ecor
d fr
om a
site
1 k
ilom
etre
s fu
rthe
r in
land
than
the
exis
itng
site
. Dai
ly m
axim
um a
nd m
inim
um te
mpe
ratu
res
are
with
in a
deg
ree
- w
ith th
e cu
rren
t site
bei
ng s
light
ly m
ore
mod
erat
e. T
here
is li
ttle
varia
tion
in r
ainf
all a
t the
two
site
s.
3pm
9am
Max
win
d g
ust
Su
nE
vap
Rai
nT
emp
sD
ayD
ate
MS
LP
Sp
dD
irn
Cld
RH
Tem
pM
SL
PS
pd
Dir
nC
ldR
HT
emp
Tim
eS
pd
Dir
nM
axM
inhP
akm
/hei
ghth
s%
°ChP
akm
/hei
ghth
s%
°Clo
cal
km/h
hour
sm
mm
m°C
°C
1009
.219
SS
W3
5321
.410
10.2
15W
776
18.2
05:0
137
WN
W6.
17.
60
22.4
17.4
Mo
110
09.0
17S
W7
6921
.810
10.1
19S
SW
659
20.5
12:0
430
WS
W5.
25.
80
27.5
12.4
Tu
210
06.9
19W
SW
143
28.7
1007
.720
NE
343
27.4
17:0
539
SW
12.5
3.8
030
.019
.0W
e3
1012
.624
SW
165
21.1
1013
.622
SW
774
19.6
16:4
839
SW
10.1
10.2
022
.618
.2T
h4
1011
.030
SW
359
21.9
1012
.519
SS
W7
5919
.314
:50
44W
SW
10.7
6.6
022
.717
.3F
r5
1010
.524
SE
746
21.7
1012
.426
SS
E6
6518
.513
:25
43S
SE
9.2
7.4
023
.516
.2S
a6
1007
.231
SW
664
21.4
1009
.019
SS
W7
8018
.316
:26
44S
W9.
77.
20
23.8
16.0
Su
710
10.3
37S
W3
5723
.310
11.2
11S
SW
666
20.1
11.1
6.8
024
.716
.0M
o8
1011
.226
SW
359
25.3
1012
.89
W1
6020
.812
:55
33S
W12
.78.
00
26.9
13.0
Tu
910
11.7
19S
E7
7919
.410
11.0
9S
SW
757
21.7
18:4
443
S0.
38.
00
21.7
17.2
We
1010
16.9
24S
144
24.0
1016
.330
SE
156
18.7
06:4
459
SE
12.8
3.2
1.4
25.5
16.3
Th
1110
15.6
28S
W1
5224
.910
18.8
7E
NE
044
22.1
05:4
041
ES
E13
.08.
80
29.6
13.3
Fr
1210
08.9
20N
W1
1134
.110
12.1
26N
022
27.6
17:2
144
WS
W12
.810
.40
34.8
15.9
Sa
1310
09.8
26S
W1
5723
.910
10.1
15W
SW
138
23.9
10:4
337
SW
12.9
8.8
0.4
24.6
20.0
Su
1410
04.0
28S
W0
4924
.010
07.7
4E
NE
348
20.1
17:3
043
SW
12.8
10.2
024
.614
.2M
o15
1005
.548
SW
148
21.1
1003
.022
NW
672
20.1
13:5
861
SW
10.5
8.0
023
.112
.6T
u16
1009
.113
WS
W2
3420
.610
11.7
9N
W7
5217
.111
:00
30W
9.9
8.4
022
.311
.7W
e17
1013
.035
SW
348
21.6
1011
.328
W5
5619
.411
:04
48W
SW
9.8
6.8
023
.116
.3T
h18
1020
.326
WS
W2
4720
.510
20.3
15S
SW
248
17.9
17:5
943
SW
12.0
9.2
021
.911
.6F
r19
1015
.320
SW
139
24.6
1019
.67
ES
E0
5419
.511
:59
30S
W12
.07.
80
30.6
11.9
Sa
2010
09.7
22S
SW
617
32.1
1011
.222
NN
E3
1830
.209
:40
46N
6.8
7.6
034
.015
.4S
u21
1007
.213
S8
6024
.210
07.0
9E
NE
857
24.1
08:0
535
WN
W0.
010
.40
25.4
21.3
Mo
2210
15.6
33S
SW
759
20.6
1013
.020
SS
W7
6919
.512
:02
54S
SW
9.1
2.6
1.6
22.9
18.1
Tu
2310
15.3
33S
W3
4721
.110
18.0
19S
SE
748
18.0
16:4
346
SW
11.2
7.4
022
.811
.3W
e24
1013
.333
SW
761
19.8
1014
.615
WS
W7
5817
.316
:29
50S
W7.
69.
40
22.7
12.4
Th
2510
18.4
35S
W1
3521
.110
20.4
22S
SW
551
15.9
14:3
057
SS
W10
.87.
80
22.5
10.7
Fr
2610
18.3
28S
W1
4721
.610
21.1
7S
SW
149
18.4
15:3
037
SS
W12
.48.
60
23.0
12.6
Sa
2710
10.5
15W
SW
148
23.5
1015
.27
NN
W0
4721
.516
:05
35S
W11
.88.
60
25.6
11.4
Su
2810
10.4
35W
SW
150
20.9
1008
.148
WS
W7
9117
.208
:07
69W
SW
10.7
7.8
1.4
21.9
14.8
Mo
2910
16.1
28S
W3
5921
.910
15.9
28S
W8
6418
.606
:15
46W
SW
7.5
9.6
023
.116
.3T
u30
1013
.724
SW
551
22.8
1017
.69
N3
6018
.414
:29
35S
W12
.35.
80
24.9
11.8
We
31S
tati
stic
s fo
r D
ecem
ber
201
410
11.8
263
5023
.110
13.0
174
5620
.39.
97.
725
.014
.9M
ean
1004
.013
#0
1119
.410
03.0
4E
NE
018
15.9
0.0
2.6
21.7
10.7
Low
est
1020
.348
SW
879
34.1
1021
.148
WS
W8
9130
.269
WS
W13
.010
.41.
634
.821
.3H
ighe
st30
6.3
238.
64.
8T
otal

Appendix E
Laboratory Report - Sub-slab soil vapour

Chartered Chemists
A.B.N. 44 000 964 2783 - 5, 18 Redland DriveMitcham, Vic, 3132Telephone: (03) 9874 1988Fax: (03) 9874 1933
Level 27/680 George StreetSydneyNSW 2000Attention: Adrian Heggie
SAMPLES:
DATE RECEIVED:
DATE COMMENCED:
METHODS:
RESULTS: Please refer to attached pages for results.
REPORTED BY:
Ernst & Young Centre
18-Dec-2014
Nine samples were received for analysis
18-Dec-2014
CERTIFICATE OF ANALYSIS
Evan Jones
See Attached Results
Laboratory Manager
Note: Results are based on samples as received at SGS Leeder Consulting's laboratoriesResults in airbourne concentrations are calculated using data provided by the client
Parsons Brinckerhoff
14-Jan-2015
REPORT NUMBER:
Site/Client Ref:
Order No: 2201557B
M142557
2201557B
NATA Accredited Laboratory Number: 14429
Accredited for compliance with ISO/IEC 17025.
Page 1 of 16

(I) RESULTS Report N°: M142557
Matrix: Passive Sampler
Method: MA-5.WL.06 Volatile Organics (w/v)
Sample units are expressed in µg/m³
Analyte Name PQL
Client ID
Leeder ID
<2.6
<4.9
<0.95
<4
<6.4
<6.4
<3.4
<29
<1.9
<1.9
<34
<6.4
<2.6
<7.5
<3.3
<3.4
<3.4
<290
<1.4
<3.4
<3.4
<34
<490
<1.4
6.2
<4.9
<0.95
8.9
<6.4
<6.4
<3.4
<29
<1.9
<1.9
<34
<6.4
<2.6
<7.5
<3.3
<3.4
<3.4
<290
<1.4
<3.4
<3.4
<34
<490
<1.4
<2.6
<4.9
<0.95
<4
<6.4
<6.4
<3.4
<29
<1.9
<1.9
<34
<6.4
<2.6
<7.5
<3.3
<3.4
<3.4
<290
<1.4
<3.4
<3.4
<34
<490
<1.4
<2.7
<5.2
<1
<4.2
<6.8
<6.8
<3.6
<30
<2
<2
<36
<6.8
<2.7
<7.9
<3.4
<3.6
<3.6
<300
<1.5
<3.6
<3.6
<36
<520
<1.5Isopropylbenzene
Isopropanol
n-Hexane
n-Heptane
Ethylcyclohexane
Ethylbenzene
n-Dodecane
2,4-dimethylpentane
trans-1,2-Dichloroethene
cis-1,2-Dichloroethene
1,1-Dichloroethene
1,2-Dichloroethane
1,1-Dichloroethane
Dichlorodifluoromethane
1,2-Dibromoethane
Dibromochloromethane
n-Decane
Cyclohexane
Chloromethane
Chloroethane
Carbon tetrachloride
n-Butylbenzene
2-butanone(MEK)
Benzene
K3SS4aBld SE side
1408-AN-LU-54
2014025254
K3SS3aBld NE side
1408-AN-LU-53
2014025253
K3SS2aAshford Rd east1408-AN-LU-52
2014025252
K3SS1aAshford Rd west1408-AN-LU-51
2014025251
Page 2 of 16

(I) RESULTS Report N°: M142557
Matrix: Passive Sampler
Method: MA-5.WL.06 Volatile Organics (w/v)
Sample units are expressed in µg/m³
Analyte Name PQL
Client ID
Leeder ID
<1.4
<34
<3.4
<3.4
<3.4
<3.4
<3.4
<3.4
<1.7
<1.4
<3.4
<34
<1.4
16
<1.7
<4.9
<1.9
49
<3.2
<0.95
<0.95
<9.5
<12
<1.4
<1.4
<1.4
<34
<3.4
<3.4
<3.4
<3.4
<3.4
<3.4
<1.7
<1.4
<3.4
<34
<1.4
<1.5
6.6
<4.9
<1.9
6.3
<3.2
<0.95
<0.95
<9.5
<12
<1.4
1.7
<1.4
<34
<3.4
5.4
<3.4
<3.4
<3.4
<3.4
<1.7
<1.4
<3.4
<34
<1.4
15
<1.7
7.9
<1.9
160
<3.2
<0.95
<0.95
<9.5
<12
<1.4
<1.4
<1.5
<36
<3.6
<3.6
<3.6
<3.6
<3.6
<3.6
<1.8
<1.5
<3.6
<36
<1.5
3.9
<1.8
<5.2
<2
73
<3.4
<1
<1
<10
<13
<1.5
<1.5m&p-Xylenes
o-Xylene
Vinyl Chloride
n-Undecane
1,3,5-Trimethylbenzene
1,2,4-Trimethylbenzene
Trichloromethane
Trichloroethene
1,1,2-trichloroethane
1,1,1-trichloroethane
Toluene
Tetrachloroethene
propylbenzene
n-Pentane
n-Octane
n-Nonane
Naphthalene
3-Methylpentane
2-Methylpentane
3-Methylhexane
2-Methylhexane
Methylcyclohexane
Methyl tert-butyl ether
2-Methyl butane
4-Isopropyltoluene
K3SS4aBld SE side
1408-AN-LU-54
2014025254
K3SS3aBld NE side
1408-AN-LU-53
2014025253
K3SS2aAshford Rd east1408-AN-LU-52
2014025252
K3SS1aAshford Rd west1408-AN-LU-51
2014025251
Page 3 of 16

(I) RESULTS Report N°: M142557
Matrix: Passive Sampler
Method: MA-5.WL.06 Volatile Organics (w/v)
Sample units are expressed in µg/m³
Analyte Name PQL
Client ID
Leeder ID
<2.9
<5.5
<1.1
<4.5
<7.1
<7.1
<3.8
<32
<2.2
<2.2
<38
<7.1
<2.9
<8.4
<3.6
<3.8
<3.8
<320
<1.5
<3.8
<3.8
<38
<550
<1.6
<3
<5.8
<1.1
<4.7
<7.6
<7.6
<4
<34
<2.3
<2.3
<40
<7.6
<3
<8.9
<3.8
<4
<4
<340
<1.6
<4
<4
<40
<580
<1.7
<3.2
<6.2
<1.2
<5
<8
<8
<4.2
<36
<2.4
<2.4
<42
<8
<3.2
<9.4
<4.1
<4.2
<4.2
<360
<1.7
<4.2
<4.2
<42
<620
<1.8
<3.2
<6.2
<1.2
<5
<8
<8
<4.2
<36
<2.4
<2.4
<42
<8
<3.2
<9.4
9.8
<4.2
<4.2
<360
<1.7
<4.2
<4.2
<42
<620
<1.8Isopropylbenzene
Isopropanol
n-Hexane
n-Heptane
Ethylcyclohexane
Ethylbenzene
n-Dodecane
2,4-dimethylpentane
trans-1,2-Dichloroethene
cis-1,2-Dichloroethene
1,1-Dichloroethene
1,2-Dichloroethane
1,1-Dichloroethane
Dichlorodifluoromethane
1,2-Dibromoethane
Dibromochloromethane
n-Decane
Cyclohexane
Chloromethane
Chloroethane
Carbon tetrachloride
n-Butylbenzene
2-butanone(MEK)
Benzene
K3SS7aDriveway west side north
1408-AN-LU-57
2014025258
K3SS6aDriveway west side south
1408-AN-LU-56
2014025257
K3SS5aBld Store at south Dup
1408-AN-LU-58
2014025256
K3SS5aBld Store at south1408-AN-LU-55
2014025255
Page 4 of 16

(I) RESULTS Report N°: M142557
Matrix: Passive Sampler
Method: MA-5.WL.06 Volatile Organics (w/v)
Sample units are expressed in µg/m³
Analyte Name PQL
Client ID
Leeder ID
<1.6
<38
<3.8
<3.8
<3.8
<3.8
<3.8
<3.8
<1.9
<1.6
<3.8
<38
<1.6
12
<1.9
7.7
<2.2
280
<3.6
<1.1
<1.1
<11
<14
<1.6
<1.6
<1.7
<40
<4
<4
<4
<4
<4
<4
<2
<1.7
<4
<40
<1.7
11
<2.1
9.3
<2.3
280
<3.8
<1.1
<1.1
<11
<15
<1.7
<1.7
<1.8
<42
<4.2
<4.2
<4.2
<4.2
<4.2
<4.2
<2.2
<1.8
<4.2
<42
<1.8
12
<2.2
<6.2
<2.4
250
<4
<1.2
<1.2
<12
<15
<1.8
<1.8
<1.8
<42
<4.2
<4.2
<4.2
<4.2
<4.2
<4.2
<2.2
<1.8
<4.2
<42
<1.8
50
<2.2
<6.2
<2.4
2300
5.6
<1.2
<1.2
<12
<15
<1.8
<1.8m&p-Xylenes
o-Xylene
Vinyl Chloride
n-Undecane
1,3,5-Trimethylbenzene
1,2,4-Trimethylbenzene
Trichloromethane
Trichloroethene
1,1,2-trichloroethane
1,1,1-trichloroethane
Toluene
Tetrachloroethene
propylbenzene
n-Pentane
n-Octane
n-Nonane
Naphthalene
3-Methylpentane
2-Methylpentane
3-Methylhexane
2-Methylhexane
Methylcyclohexane
Methyl tert-butyl ether
2-Methyl butane
4-Isopropyltoluene
K3SS7aDriveway west side north
1408-AN-LU-57
2014025258
K3SS6aDriveway west side south
1408-AN-LU-56
2014025257
K3SS5aBld Store at south Dup
1408-AN-LU-58
2014025256
K3SS5aBld Store at south1408-AN-LU-55
2014025255
Page 5 of 16

(I) RESULTS Report N°: M142557
Matrix: Passive Sampler
Method: MA-5.WL.05 Volatile Organics
Sample units are expressed in µg total
Analyte Name PQL
Client ID
Leeder ID
nd
nd
nd
nd
nd
nd
nd
nd
nd
nd
nd
nd
nd
nd
nd
nd
nd
nd
nd
nd
nd
nd
nd
nd
0.12
nd
nd
0.11
nd
nd
nd
nd
nd
nd
nd
nd
nd
nd
nd
nd
nd
nd
nd
nd
nd
nd
nd
nd
nd
nd
nd
nd
nd
nd
nd
nd
nd
nd
nd
nd
nd
nd
nd
nd
nd
nd
nd
nd
nd
nd
nd
nd
nd
nd
nd
nd
nd
nd
nd
nd
nd
nd
nd
nd
nd
nd
nd
nd
nd
nd
nd
nd
nd
nd
nd
nd0.05Isopropylbenzene
5Isopropanol
0.5n-Hexane
0.05n-Heptane
0.05Ethylcyclohexane
0.05Ethylbenzene
15n-Dodecane
0.052,4-dimethylpentane
0.05trans-1,2-Dichloroethene
0.05cis-1,2-Dichloroethene
0.051,1-Dichloroethene
0.051,2-Dichloroethane
0.051,1-Dichloroethane
0.05Dichlorodifluoromethane
0.051,2-Dibromoethane
0.05Dibromochloromethane
1n-Decane
0.05Cyclohexane
0.05Chloromethane
0.05Chloroethane
0.05Carbon tetrachloride
0.05n-Butylbenzene
0.052-butanone(MEK)
0.05Benzene
K3SS4aBld SE side
1408-AN-LU-54
2014025254
K3SS3aBld NE side
1408-AN-LU-53
2014025253
K3SS2aAshford Rd east1408-AN-LU-52
2014025252
K3SS1aAshford Rd west1408-AN-LU-51
2014025251
Page 6 of 16

(I) RESULTS Report N°: M142557
Matrix: Passive Sampler
Method: MA-5.WL.05 Volatile Organics
Sample units are expressed in µg total
Analyte Name PQL
Client ID
Leeder ID
nd
nd
nd
nd
nd
nd
nd
nd
nd
nd
nd
nd
nd
0.52
nd
nd
nd
1.3
nd
nd
nd
nd
nd
nd
nd
nd
nd
nd
nd
nd
nd
nd
nd
nd
nd
nd
nd
nd
nd
0.19
nd
nd
0.16
nd
nd
nd
nd
nd
nd
0.06
nd
nd
nd
0.08
nd
nd
nd
nd
nd
nd
nd
nd
nd
0.48
nd
0.08
nd
4.1
nd
nd
nd
nd
nd
nd
nd
nd
nd
nd
nd
nd
nd
nd
nd
nd
nd
nd
nd
nd
0.12
nd
nd
nd
1.8
nd
nd
nd
nd
nd
nd
nd0.05m&p-Xylenes
0.05o-Xylene
0.05Vinyl Chloride
0.5n-Undecane
0.051,3,5-Trimethylbenzene
0.051,2,4-Trimethylbenzene
0.05Trichloromethane
0.05Trichloroethene
0.051,1,2-trichloroethane
0.051,1,1-trichloroethane
0.05Toluene
0.05Tetrachloroethene
0.05propylbenzene
0.5n-Pentane
0.05n-Octane
0.05n-Nonane
0.05Naphthalene
0.053-Methylpentane
0.052-Methylpentane
0.053-Methylhexane
0.052-Methylhexane
0.05Methylcyclohexane
0.05Methyl tert-butyl ether
0.52-Methyl butane
0.054-Isopropyltoluene
K3SS4aBld SE side
1408-AN-LU-54
2014025254
K3SS3aBld NE side
1408-AN-LU-53
2014025253
K3SS2aAshford Rd east1408-AN-LU-52
2014025252
K3SS1aAshford Rd west1408-AN-LU-51
2014025251
Page 7 of 16

(I) RESULTS Report N°: M142557
Matrix: Passive Sampler
Method: MA-5.WL.05 Volatile Organics
Sample units are expressed in µg total
Analyte Name PQL
Client ID
Leeder ID
nd
nd
nd
nd
nd
nd
nd
nd
nd
nd
nd
nd
nd
nd
nd
nd
nd
nd
nd
nd
nd
nd
nd
nd
nd
nd
nd
nd
nd
nd
nd
nd
nd
nd
nd
nd
nd
nd
nd
nd
nd
nd
nd
nd
nd
nd
nd
nd
nd
nd
nd
nd
nd
nd
nd
nd
nd
nd
nd
nd
nd
nd
nd
nd
nd
nd
nd
nd
nd
nd
nd
nd
nd
nd
nd
nd
nd
nd
nd
nd
nd
nd
nd
nd
nd
nd
0.12
nd
nd
nd
nd
nd
nd
nd
nd
nd0.05Isopropylbenzene
5Isopropanol
0.5n-Hexane
0.05n-Heptane
0.05Ethylcyclohexane
0.05Ethylbenzene
15n-Dodecane
0.052,4-dimethylpentane
0.05trans-1,2-Dichloroethene
0.05cis-1,2-Dichloroethene
0.051,1-Dichloroethene
0.051,2-Dichloroethane
0.051,1-Dichloroethane
0.05Dichlorodifluoromethane
0.051,2-Dibromoethane
0.05Dibromochloromethane
1n-Decane
0.05Cyclohexane
0.05Chloromethane
0.05Chloroethane
0.05Carbon tetrachloride
0.05n-Butylbenzene
0.052-butanone(MEK)
0.05Benzene
K3SS7aDriveway west side north
1408-AN-LU-57
2014025258
K3SS6aDriveway west side south
1408-AN-LU-56
2014025257
K3SS5aBld Store at south Dup
1408-AN-LU-58
2014025256
K3SS5aBld Store at south1408-AN-LU-55
2014025255
Page 8 of 16

(I) RESULTS Report N°: M142557
Matrix: Passive Sampler
Method: MA-5.WL.05 Volatile Organics
Sample units are expressed in µg total
Analyte Name PQL
Client ID
Leeder ID
nd
nd
nd
nd
nd
nd
nd
nd
nd
nd
nd
nd
nd
0.35
nd
0.07
nd
6.5
nd
nd
nd
nd
nd
nd
nd
nd
nd
nd
nd
nd
nd
nd
nd
nd
nd
nd
nd
nd
0.31
nd
0.08
nd
6.1
nd
nd
nd
nd
nd
nd
nd
nd
nd
nd
nd
nd
nd
nd
nd
nd
nd
nd
nd
nd
0.32
nd
nd
nd
5.1
nd
nd
nd
nd
nd
nd
nd
nd
nd
nd
nd
nd
nd
nd
nd
nd
nd
nd
nd
nd
1.3
nd
nd
nd
46
0.07
nd
nd
nd
nd
nd
nd0.05m&p-Xylenes
0.05o-Xylene
0.05Vinyl Chloride
0.5n-Undecane
0.051,3,5-Trimethylbenzene
0.051,2,4-Trimethylbenzene
0.05Trichloromethane
0.05Trichloroethene
0.051,1,2-trichloroethane
0.051,1,1-trichloroethane
0.05Toluene
0.05Tetrachloroethene
0.05propylbenzene
0.5n-Pentane
0.05n-Octane
0.05n-Nonane
0.05Naphthalene
0.053-Methylpentane
0.052-Methylpentane
0.053-Methylhexane
0.052-Methylhexane
0.05Methylcyclohexane
0.05Methyl tert-butyl ether
0.52-Methyl butane
0.054-Isopropyltoluene
K3SS7aDriveway west side north
1408-AN-LU-57
2014025258
K3SS6aDriveway west side south
1408-AN-LU-56
2014025257
K3SS5aBld Store at south Dup
1408-AN-LU-58
2014025256
K3SS5aBld Store at south1408-AN-LU-55
2014025255
Page 9 of 16

(I) RESULTS Report N°: M142557
Matrix: Passive Sampler
Method: MA-5.WL.05 Volatile Organics
Sample units are expressed in µg total
Analyte Name PQL
Client ID
Leeder ID
nd
nd
nd
nd
nd
nd
nd
nd
nd
nd
nd
nd
nd
nd
nd
nd
nd
nd
nd
nd
nd
nd
nd
nd
nd
nd
nd
nd
nd
nd
nd
nd
nd
nd
nd
nd
nd
nd
nd
nd
nd
nd
nd
nd
nd
nd
nd
nd0.05Isopropylbenzene
5Isopropanol
0.5n-Hexane
0.05n-Heptane
0.05Ethylcyclohexane
0.05Ethylbenzene
15n-Dodecane
0.052,4-dimethylpentane
0.05trans-1,2-Dichloroethene
0.05cis-1,2-Dichloroethene
0.051,1-Dichloroethene
0.051,2-Dichloroethane
0.051,1-Dichloroethane
0.05Dichlorodifluoromethane
0.051,2-Dibromoethane
0.05Dibromochloromethane
1n-Decane
0.05Cyclohexane
0.05Chloromethane
0.05Chloroethane
0.05Carbon tetrachloride
0.05n-Butylbenzene
0.052-butanone(MEK)
0.05Benzene
Blank
Method
2014025260
TRIP BLANK1408-AN-LU-59
2014025259
Page 10 of 16

(I) RESULTS Report N°: M142557
Matrix: Passive Sampler
Method: MA-5.WL.05 Volatile Organics
Sample units are expressed in µg total
Analyte Name PQL
Client ID
Leeder ID
nd
nd
nd
nd
nd
nd
nd
nd
nd
nd
nd
nd
nd
nd
nd
nd
nd
nd
nd
nd
nd
nd
nd
nd
nd
nd
nd
nd
nd
nd
nd
nd
nd
nd
nd
nd
nd
nd
nd
nd
nd
nd
nd
nd
nd
nd
nd
nd
nd
nd0.05m&p-Xylenes
0.05o-Xylene
0.05Vinyl Chloride
0.5n-Undecane
0.051,3,5-Trimethylbenzene
0.051,2,4-Trimethylbenzene
0.05Trichloromethane
0.05Trichloroethene
0.051,1,2-trichloroethane
0.051,1,1-trichloroethane
0.05Toluene
0.05Tetrachloroethene
0.05propylbenzene
0.5n-Pentane
0.05n-Octane
0.05n-Nonane
0.05Naphthalene
0.053-Methylpentane
0.052-Methylpentane
0.053-Methylhexane
0.052-Methylhexane
0.05Methylcyclohexane
0.05Methyl tert-butyl ether
0.52-Methyl butane
0.054-Isopropyltoluene
Blank
Method
2014025260
TRIP BLANK1408-AN-LU-59
2014025259
Page 11 of 16

(I) RESULTS Report N°: M142557
Matrix: Passive Sampler
Method: MA-30.AIR.04 Total Recoverable Hydrocarbons
Sample units are expressed in µg/m³
Analyte Name PQL
Client ID
Leeder ID
240
<1400
190
<1400
220
<1400
370
<1500>C10-C16
C6-C10
K3SS4aBld SE side
1408-AN-LU-54
2014025254
K3SS3aBld NE side
1408-AN-LU-53
2014025253
K3SS2aAshford Rd east1408-AN-LU-52
2014025252
K3SS1aAshford Rd west1408-AN-LU-51
2014025251
Matrix: Passive Sampler
Method: MA-30.AIR.04 Total Recoverable Hydrocarbons
Sample units are expressed in µg/m³
Analyte Name PQL
Client ID
Leeder ID
660
<1600
420
<1700
740
<1800
2600
<1800>C10-C16
C6-C10
K3SS7aDriveway west side north
1408-AN-LU-57
2014025258
K3SS6aDriveway west side south
1408-AN-LU-56
2014025257
K3SS5aBld Store at south Dup
1408-AN-LU-58
2014025256
K3SS5aBld Store at south1408-AN-LU-55
2014025255
Page 12 of 16

(I) RESULTS Report N°: M142557
Matrix: Passive Sampler
Method: MA-30.AIR.03 Total Recoverable Hydrocarbons
Sample units are expressed in µg total
Analyte Name PQL
Client ID
Leeder ID
7
nd
6
nd
6
nd
10
nd50>C10-C16
5C6-C10
K3SS4aBld SE side
1408-AN-LU-54
2014025254
K3SS3aBld NE side
1408-AN-LU-53
2014025253
K3SS2aAshford Rd east1408-AN-LU-52
2014025252
K3SS1aAshford Rd west1408-AN-LU-51
2014025251
Matrix: Passive Sampler
Method: MA-30.AIR.03 Total Recoverable Hydrocarbons
Sample units are expressed in µg total
Analyte Name PQL
Client ID
Leeder ID
17
nd
10
nd
17
nd
61
nd50>C10-C16
5C6-C10
K3SS7aDriveway west side north
1408-AN-LU-57
2014025258
K3SS6aDriveway west side south
1408-AN-LU-56
2014025257
K3SS5aBld Store at south Dup
1408-AN-LU-58
2014025256
K3SS5aBld Store at south1408-AN-LU-55
2014025255
Page 13 of 16

(I) RESULTS Report N°: M142557
Matrix: Passive Sampler
Method: MA-30.AIR.03 Total Recoverable Hydrocarbons
Sample units are expressed in µg total
Analyte Name PQL
Client ID
Leeder ID
17
nd
nd
nd50>C10-C16
5C6-C10
Blank
Method
2014025260
TRIP BLANK1408-AN-LU-59
2014025259
Page 14 of 16

(II) QUALITY CONTROL Report N°: M142557
Matrix: Passive Sampler
Method: MA-5.WL.05 Volatile Organics
Quality Control Results are expressed in Percent Recovery of expected result
Analyte Name PQL
Client ID
Leeder ID
96
96
102
96
97
101Isopropanol
Ethylbenzene
Benzene
Spike Duplicate
Method
2014025262
Spike
Method
2014025261
Matrix: Passive Sampler
Method: MA-5.WL.05 Volatile Organics
Quality Control Results are expressed in Percent Recovery of expected result
Analyte Name PQL
Client ID
Leeder ID
99
99
99
100
101
100m&p-Xylenes
o-Xylene
Toluene
Spike Duplicate
Method
2014025262
Spike
Method
2014025261
Page 15 of 16

Report N°: M142557
Q U A L IF IE R S / N O T E S FO R R E P O R T E D R E SU L T S P Q L P ra ctical Q uan ti tat ion L imit is In su ff ic ien t S am ple to pe rfo r m this analys is. T T e n tative ide n tific ation ba sed on c ompu ter l ib ra ry se ar ch o f m ass spe ctra . N D N ot D ete cted – T he analy te w as no t dete cted above the re po rte d P Q L . N C N ot ca lc u lated , R esu lts be low P Q L nr N o t Re ques ted fo r a na lysis . R R eje cted Re su lt – r esu lts fo r th is ana lys is f ai led Q C che cks. S Q S em i- Q uan ti tat ive r esu lt – quan ti ta t ion base d on a gene ric response fa cto r fo r th is c la ss o f ana ly te . IM Ina pp rop r iate me thod o f ana lys is f o r th is c om pound U U na b le to p rov ide Q ua li ty C ontro l da ta – h igh le vels o f com pounds in sam ple in ter fer ed w ith ana lys is o f
Q C r esu lts. U F U na b le to p rov ide Q ua li ty C ontro l da ta- Sur roga te s fa i le d Q Cc hec ks due to sa mple m atrix e ffe cts L A na ly te dete cted at a le vel above the line ar re sponse o f c alib ra tion cu rve . E E s tima te d r esu lt . N A T A ac cr ed itat ion doe s no t c over e st im ated re sults . C 1 T he se com pounds c o -elu te. C 2 T he se com pounds c o -elu te. C T E leva ted conc en tra tion . R esu lts re ported fr om ca rbon tube a nalys is ** S am ple show s non-petro le um hydroc arbon p rof ile
This document is issued, on the Client 's behalf, by the Company under its General Conditions of Service available on request and accessible at http://www.sgs .com/en/Terms-and-Conditions/General-Conditions-of-Services-English.aspx . The Client's at tention is drawn to the limitation of liability, indemnificat ion and jurisdictionissues defined therein. Any other holder of this document is advised that information contained hereon reflects the Company's f indings at the t ime of its intervent ion only and within the limits of Client's instructions , if any. The Company's sole responsibility is to its Client and this document does not exonerate parties to a transaction from exercising all their rights and obligations under the transact ion documents This report must not be reproduced, except in full.
Page 16 of 16

APPENDIX ONE. CHAIN OF CUSTODY DOCUMENT


Appendix F
Laboratory Report - Flux and ambient air

Chartered Chemists
A.B.N. 44 000 964 2783 - 5, 18 Redland DriveMitcham, Vic, 3132Telephone: (03) 9874 1988Fax: (03) 9874 1933
Level 27/680 George StreetSydneyNSW 2000Attention: Adrian Heggie
SAMPLES:
DATE RECEIVED:
DATE COMMENCED:
METHODS:
RESULTS: Please refer to attached pages for results.
REPORTED BY:
Ernst & Young Centre
28-Nov-2014
Three samples were received for analysis
28-Nov-2014
CERTIFICATE OF ANALYSIS
Evan Jones
See Attached Results
Laboratory Manager
VOC uptake rates are attached at the end of the report
Note: Results are based on samples as received at SGS Leeder Consulting's laboratories
Parsons Brinckerhoff
5-Dec-2014
REPORT NUMBER:
Site/Client Ref:
Order No: 2201557B
M142414
2201557B
NATA Accredited Laboratory Number: 14429
Accredited for compliance with ISO/IEC 17025.
Page 1 of 6

(I) RESULTS Report N°: M142414
Matrix: Thermal Desorption Radiello
Method: TO-17.09 Volatile Organics
Sample units are expressed in ng total
Analyte Name PQL
Client ID
Leeder ID
19
nd
nd
nd
nd
nd
nd
nd
nd
nd
nd
nd
nd
nd
nd
nd
nd
nd
nd
nd
nd
13
nd
nd
16
nd
nd
nd
nd
nd
nd
nd
nd
nd
nd
nd
nd
nd
8
nd
nd
nd
nd
nd
nd
6
nd
nd
nd
nd
nd
nd
nd
nd
nd
nd
nd
nd
nd
nd
nd
nd
nd
nd
nd
nd
nd
nd
nd
nd
nd
nd
nd
nd
nd
nd
nd
nd
nd
nd
nd
nd
nd
nd
nd
nd
nd
nd
nd
nd
nd
nd
nd
nd
nd
nd5Isopropylbenzene
50Isopropanol
5n-Hexane
5n-Heptane
5Ethylcyclohexane
5Ethylbenzene
5n-Dodecane
52,4-dimethylpentane
5trans-1,2-Dichloroethene
5cis-1,2-Dichloroethene
51,1-Dichloroethene
51,2-Dichloroethane
51,1-Dichloroethane
5Dichlorodifluoromethane
51,2-Dibromoethane
5Dibromochloromethane
5n-Decane
5Cyclohexane
5Chloromethane
5Chloroethane
5Carbon tetrachloride
5n-Butylbenzene
52-butanone(MEK)
5Benzene
Blank
Method
2014023688
TRIP BLANKOM828
2014023687
K3PF2aAshford Rd east side
OM827
2014023686
K3PF1aAshford Rd west side
OM826
2014023685
Page 2 of 6

(I) RESULTS Report N°: M142414
Matrix: Thermal Desorption Radiello
Method: TO-17.09 Volatile Organics
Sample units are expressed in ng total
Analyte Name PQL
Client ID
Leeder ID
nd
34
nd
nd
nd
nd
20
8
nd
nd
nd
34
nd
8
21
nd
nd
nd
nd
nd
nd
nd
nd
nd
nd
5
35
nd
nd
nd
nd
7
nd
nd
nd
nd
28
nd
nd
43
nd
nd
62
nd
nd
nd
nd
nd
nd
5
nd
nd
nd
nd
nd
nd
nd
nd
nd
nd
nd
nd
nd
nd
9
nd
nd
nd
nd
nd
nd
nd
nd
nd
nd
nd
nd
nd
nd
nd
nd
nd
nd
nd
nd
nd
nd
nd
nd
nd
nd
nd
nd
nd
nd
nd
nd
nd
nd
nd5m&p-Xylenes
5o-Xylene
5Vinyl Chloride
5n-Undecane
51,3,5-Trimethylbenzene
51,2,4-Trimethylbenzene
5Trichloromethane
5Trichloroethene
51,1,2-trichloroethane
51,1,1-trichloroethane
5Toluene
5Tetrachloroethene
5propylbenzene
5n-Pentane
5n-Octane
5n-Nonane
5Naphthalene
53-Methylpentane
52-Methylpentane
53-Methylhexane
52-Methylhexane
5Methylcyclohexane
5Methyl tert-butyl ether
52-Methyl butane
54-Isopropyltoluene
Blank
Method
2014023688
TRIP BLANKOM828
2014023687
K3PF2aAshford Rd east side
OM827
2014023686
K3PF1aAshford Rd west side
OM826
2014023685
Page 3 of 6

(II) QUALITY CONTROL Report N°: M142414
Matrix: Thermal Desorption Radiello
Method: TO-17.09 Volatile Organics
Quality Control Results are expressed in Percent Recovery of expected result
Analyte Name PQL
Client ID
Leeder ID
96
87
94
76
80
96
97
89
91
92
78
96
82
80
76
99
88
96
79
82
97
99
93
93
95
73
98
84
83
80n-Hexane
n-Heptane
Ethylcyclohexane
Ethylbenzene
n-Dodecane
trans-1,2-Dichloroethene
cis-1,2-Dichloroethene
1,1-Dichloroethene
1,2-Dichloroethane
Dibromochloromethane
n-Decane
Cyclohexane
Carbon tetrachloride
2-butanone(MEK)
Benzene
Spike Duplicate
Method
2014023690
Spike
Method
2014023689
Page 4 of 6

(II) QUALITY CONTROL Report N°: M142414
Matrix: Thermal Desorption Radiello
Method: TO-17.09 Volatile Organics
Quality Control Results are expressed in Percent Recovery of expected result
Analyte Name PQL
Client ID
Leeder ID
84
77
82
83
75
101
96
96
101
98
98
77
73
98
97
88
81
84
84
80
103
101
99
105
102
100
78
75
100
99m&p-Xylenes
o-Xylene
Vinyl Chloride
n-Undecane
Trichloromethane
Trichloroethene
1,1,2-trichloroethane
1,1,1-trichloroethane
Toluene
Tetrachloroethene
n-Pentane
n-Octane
n-Nonane
Methylcyclohexane
Methyl tert-butyl ether
Spike Duplicate
Method
2014023690
Spike
Method
2014023689
Page 5 of 6

Report N°: M142414
Q U A L IF IE R S / N O T E S FO R R E P O R T E D R E SU L T S P Q L P ra ctical Q uan ti tat ion L imit is In su ff ic ien t S am ple to pe rfo r m this analys is. T T e n tative ide n tific ation ba sed on c ompu ter l ib ra ry se ar ch o f m ass spe ctra . N D N ot D ete cted – T he analy te w as no t dete cted above the re po rte d P Q L . N C N ot ca lc u lated , R esu lts be low P Q L nr N o t Re ques ted fo r a na lysis . R R eje cted Re su lt – r esu lts fo r th is ana lys is f ai led Q C che cks. S Q S em i- Q uan ti tat ive r esu lt – quan ti ta t ion base d on a gene ric response fa cto r fo r th is c la ss o f ana ly te . IM Ina pp rop r iate me thod o f ana lys is f o r th is c om pound U U na b le to p rov ide Q ua li ty C ontro l da ta – h igh le vels o f com pounds in sam ple in ter fer ed w ith ana lys is o f
Q C r esu lts. U F U na b le to p rov ide Q ua li ty C ontro l da ta- Sur roga te s fa i le d Q Cc hec ks due to sa mple m atrix e ffe cts L A na ly te dete cted at a le vel above the line ar re sponse o f c alib ra tion cu rve . E E s tima te d r esu lt . N A T A ac cr ed itat ion doe s no t c over e st im ated re sults . C 1 T he se com pounds c o -elu te. C 2 T he se com pounds c o -elu te. C T E leva ted conc en tra tion . R esu lts re ported fr om ca rbon tube a nalys is ** S am ple show s non-petro le um hydroc arbon p rof ile
This document is issued, on the Client 's behalf, by the Company under its General Conditions of Service available on request and accessible at http://www.sgs .com/en/Terms-and-Conditions/General-Conditions-of-Services-English.aspx . The Client's at tention is drawn to the limitation of liability, indemnificat ion and jurisdictionissues defined therein. Any other holder of this document is advised that information contained hereon reflects the Company's f indings at the t ime of its intervent ion only and within the limits of Client's instructions , if any. The Company's sole responsibility is to its Client and this document does not exonerate parties to a transaction from exercising all their rights and obligations under the transact ion documents This report must not be reproduced, except in full.
Page 6 of 6

APPENDIX ONE. CHAIN OF CUSTODY DOCUMENT


APPENDIX TWO


Chartered Chemists
A.B.N. 44 000 964 2783 - 5, 18 Redland DriveMitcham, Vic, 3132Telephone: (03) 9874 1988Fax: (03) 9874 1933
Level 27/680 George StreetSydneyNSW 2000Attention: Adrian Heggie
SAMPLES:
DATE RECEIVED:
DATE COMMENCED:
METHODS:
RESULTS: Please refer to attached pages for results.
REPORTED BY:
Ernst & Young Centre
18-Dec-2014
Twelve samples were received for analysis
18-Dec-2014
CERTIFICATE OF ANALYSIS
Evan Jones
See Attached Results
Laboratory Manager
Note: Results are based on samples as received at SGS Leeder Consulting's laboratoriesResults in airbourne concentrations are calculated using data provided by the client
Parsons Brinckerhoff
15-Jan-2015
REPORT NUMBER:
Site/Client Ref:
Order No: 2201557B
M142558
2201557B
NATA Accredited Laboratory Number: 14429
Accredited for compliance with ISO/IEC 17025.
Page 1 of 18

(I) RESULTS Report N°: M142558
Matrix: Radiello Tube
Method: MA-5.RAD.09 Volatile Organics (w/v)
Sample units are expressed in µg/m³
Analyte Name PQL
Client ID
Leeder ID
0.54
0.050
0.070
0.50
<0.02
<0.02
4.1
2.7
<0.03
<0.03
0.050
<0.02
<0.02
<0.02
<0.02
0.17
0.75
<22
1.5
0.40
12
14
<3.3
0.16
0.82
0.33
0.070
0.42
<0.02
<0.02
2.5
1.6
<0.03
<0.03
0.050
<0.02
<0.02
<0.02
<0.02
0.070
0.51
<22
1.6
0.20
6.0
7.4
<3.3
0.16
0.65
0.13
0.050
0.47
<0.02
<0.02
3.4
1.9
<0.03
<0.03
0.060
<0.02
<0.02
<0.02
<0.02
0.090
0.66
<22
1.4
0.38
9.6
12
<3.3
0.13
0.29
<0.02
<0.03
0.50
<0.02
<0.02
0.36
<0.80
<0.03
<0.03
0.050
<0.02
<0.02
<0.02
<0.02
<0.02
<0.03
<22
0.32
0.040
0.42
0.51
<3.3
<0.03Isopropylbenzene
Isopropanol
n-Hexane
n-Heptane
Ethylcyclohexane
Ethylbenzene
n-Dodecane
2,4-dimethylpentane
trans-1,2-Dichloroethene
cis-1,2-Dichloroethene
1,1-Dichloroethene
1,2-Dichloroethane
1,1-Dichloroethane
Dichlorodifluoromethane
1,2-Dibromoethane
Dibromochloromethane
n-Decane
Cyclohexane
Chloromethane
Chloroethane
Carbon tetrachloride
n-Butylbenzene
2-butanone(MEK)
Benzene
K3AA4 outdoornorth-western
LO570
2014025270
K3AA3 buildingadmin area
LO567
2014025269
K3AA2 buildingstore area south
LO566
2014025268
K3AA1building indoor NE
LO565
2014025267
Page 2 of 18

(I) RESULTS Report N°: M142558
Matrix: Radiello Tube
Method: MA-5.RAD.09 Volatile Organics (w/v)
Sample units are expressed in µg/m³
Analyte Name PQL
Client ID
Leeder ID
0.13
4.8
<0.03
4.8
5.6
6.4
5.9
3.2
<0.07
2.3
1.8
2.3
0.32
0.13
6.6
<0.03
<0.03
0.11
0.10
1.9
0.66
3.5
<0.02
1.5
4.5
0.18
6.6
<0.03
2.3
3.1
3.6
4.2
2.1
<0.07
1.2
0.86
3.0
0.36
0.13
10
<0.03
<0.03
0.090
0.10
2.1
0.65
2.4
<0.02
2.0
5.6
0.13
5.6
<0.03
3.6
4.6
5.3
5.5
3.0
<0.07
1.4
1.1
2.8
0.29
0.14
7.9
<0.03
<0.03
0.11
0.090
1.7
0.57
2.4
<0.02
1.6
4.5
0.070
2.4
<0.03
0.20
0.29
0.32
0.60
0.30
<0.07
0.20
0.17
1.1
0.060
0.15
1.6
<0.03
<0.03
0.090
0.060
0.36
0.11
0.58
<0.02
0.30
0.79m&p-Xylenes
o-Xylene
Vinyl Chloride
n-Undecane
1,3,5-Trimethylbenzene
1,2,4-Trimethylbenzene
Trichloromethane
Trichloroethene
1,1,2-trichloroethane
1,1,1-trichloroethane
Toluene
Tetrachloroethene
propylbenzene
n-Pentane
n-Octane
n-Nonane
Naphthalene
3-Methylpentane
2-Methylpentane
3-Methylhexane
2-Methylhexane
Methylcyclohexane
Methyl tert-butyl ether
2-Methyl butane
4-Isopropyltoluene
K3AA4 outdoornorth-western
LO570
2014025270
K3AA3 buildingadmin area
LO567
2014025269
K3AA2 buildingstore area south
LO566
2014025268
K3AA1building indoor NE
LO565
2014025267
Page 3 of 18

(I) RESULTS Report N°: M142558
Matrix: Radiello Tube
Method: MA-5.RAD.09 Volatile Organics (w/v)
Sample units are expressed in µg/m³
Analyte Name PQL
Client ID
Leeder ID
0.34
<0.02
<0.03
0.50
<0.02
<0.02
0.32
<0.81
<0.03
<0.03
0.050
<0.02
<0.02
<0.02
<0.02
<0.02
<0.03
<22
0.33
0.040
0.29
0.35
<3.3
0.040Isopropylbenzene
Isopropanol
n-Hexane
n-Heptane
Ethylcyclohexane
Ethylbenzene
n-Dodecane
2,4-dimethylpentane
trans-1,2-Dichloroethene
cis-1,2-Dichloroethene
1,1-Dichloroethene
1,2-Dichloroethane
1,1-Dichloroethane
Dichlorodifluoromethane
1,2-Dibromoethane
Dibromochloromethane
n-Decane
Cyclohexane
Chloromethane
Chloroethane
Carbon tetrachloride
n-Butylbenzene
2-butanone(MEK)
Benzene
K3AA5 outdoorsouth-east on fence
LO568
2014025271
Page 4 of 18

(I) RESULTS Report N°: M142558
Matrix: Radiello Tube
Method: MA-5.RAD.09 Volatile Organics (w/v)
Sample units are expressed in µg/m³
Analyte Name PQL
Client ID
Leeder ID
0.090
2.3
<0.03
0.17
0.25
0.27
0.62
0.28
<0.07
0.14
0.16
1.0
0.060
0.14
1.7
<0.03
<0.03
0.070
0.060
0.43
0.12
0.52
<0.02
0.32
0.86m&p-Xylenes
o-Xylene
Vinyl Chloride
n-Undecane
1,3,5-Trimethylbenzene
1,2,4-Trimethylbenzene
Trichloromethane
Trichloroethene
1,1,2-trichloroethane
1,1,1-trichloroethane
Toluene
Tetrachloroethene
propylbenzene
n-Pentane
n-Octane
n-Nonane
Naphthalene
3-Methylpentane
2-Methylpentane
3-Methylhexane
2-Methylhexane
Methylcyclohexane
Methyl tert-butyl ether
2-Methyl butane
4-Isopropyltoluene
K3AA5 outdoorsouth-east on fence
LO568
2014025271
Page 5 of 18

(I) RESULTS Report N°: M142558
Matrix: Radiello Tube
Method: MA-5.RAD.08 Volatile Organics
Sample units are expressed in µg total
Analyte Name PQL
Client ID
Leeder ID
1.2
0.12
0.12
0.96
nd
nd
6.4
3
nd
nd
0.14
nd
nd
nd
nd
0.44
1.3
nd
3.0
0.76
20
27
nd
0.26
1.9
0.76
0.12
0.82
nd
nd
3.9
2
nd
nd
0.14
nd
nd
nd
nd
0.18
0.86
nd
3.2
0.38
10
14
nd
0.26
1.5
0.30
0.08
0.92
nd
nd
5.3
2
nd
nd
0.16
nd
nd
nd
nd
0.24
1.1
nd
2.8
0.72
16
23
nd
0.22
0.66
nd
nd
0.96
nd
nd
0.56
nd
nd
nd
0.12
nd
nd
nd
nd
nd
nd
nd
0.62
0.08
0.70
0.98
nd
nd0.05Isopropylbenzene
5Isopropanol
0.05n-Hexane
0.05n-Heptane
0.05Ethylcyclohexane
0.05Ethylbenzene
5n-Dodecane
0.052,4-dimethylpentane
0.05trans-1,2-Dichloroethene
0.05cis-1,2-Dichloroethene
0.051,1-Dichloroethene
0.051,2-Dichloroethane
0.051,1-Dichloroethane
0.05Dichlorodifluoromethane
0.051,2-Dibromoethane
0.05Dibromochloromethane
1n-Decane
0.05Cyclohexane
0.05Chloromethane
0.05Chloroethane
0.05Carbon tetrachloride
0.05n-Butylbenzene
0.052-butanone(MEK)
0.05Benzene
K3AA4 outdoornorth-western
LO570
2014025270
K3AA3 buildingadmin area
LO567
2014025269
K3AA2 buildingstore area south
LO566
2014025268
K3AA1building indoor NE
LO565
2014025267
Page 6 of 18

(I) RESULTS Report N°: M142558
Matrix: Radiello Tube
Method: MA-5.RAD.08 Volatile Organics
Sample units are expressed in µg total
Analyte Name PQL
Client ID
Leeder ID
0.22
9.2
nd
9.3
9.4
11
12
6.5
nd
3.1
2.8
5.0
0.52
0.22
14
nd
nd
0.22
0.22
2.7
0.96
2.4
nd
2.9
9.2
0.30
13
nd
4.5
5.2
6.0
8.6
4.2
nd
1.6
1.3
6.5
0.60
0.22
22
nd
nd
0.18
0.22
3.1
0.94
1.7
nd
3.7
11
0.22
11
nd
6.8
7.7
8.9
11
6.0
nd
2.0
1.6
6.0
0.48
0.24
17
nd
nd
0.22
0.20
2.5
0.82
1.7
nd
2.9
9.1
0.12
4.5
nd
0.38
0.48
0.54
1.2
0.60
nd
0.28
0.26
2.3
0.10
0.26
3.4
nd
nd
0.18
0.12
0.52
0.16
0.40
nd
0.56
1.60.05m&p-Xylenes
0.05o-Xylene
0.05Vinyl Chloride
0.05n-Undecane
0.051,3,5-Trimethylbenzene
0.051,2,4-Trimethylbenzene
0.05Trichloromethane
0.05Trichloroethene
0.051,1,2-trichloroethane
0.051,1,1-trichloroethane
0.05Toluene
0.05Tetrachloroethene
0.05propylbenzene
0.5n-Pentane
0.05n-Octane
0.05n-Nonane
0.05Naphthalene
0.053-Methylpentane
0.052-Methylpentane
0.053-Methylhexane
0.052-Methylhexane
0.05Methylcyclohexane
0.05Methyl tert-butyl ether
0.52-Methyl butane
0.054-Isopropyltoluene
K3AA4 outdoornorth-western
LO570
2014025270
K3AA3 buildingadmin area
LO567
2014025269
K3AA2 buildingstore area south
LO566
2014025268
K3AA1building indoor NE
LO565
2014025267
Page 7 of 18

(I) RESULTS Report N°: M142558
Matrix: Radiello Tube
Method: MA-5.RAD.08 Volatile Organics
Sample units are expressed in µg total
Analyte Name PQL
Client ID
Leeder ID
0.78
nd
nd
0.96
nd
nd
0.50
nd
nd
nd
0.12
nd
nd
nd
nd
nd
nd
nd
0.64
0.08
0.48
0.66
nd
0.06
0.22
0.50
nd
nd
nd
nd
0.56
6
nd
nd
nd
nd
nd
nd
nd
nd
nd
48
2.6
nd
0.82
0.98
nd
0.30
0.26
0.48
nd
nd
nd
nd
0.48
6
nd
nd
nd
nd
nd
nd
nd
nd
nd
46
2.5
nd
0.88
1.0
nd
0.32
0.42
0.88
0.36
0.14
nd
nd
1.3
13
nd
nd
nd
nd
nd
nd
nd
nd
0.22
84
19
0.22
1.9
3.3
nd
3.10.05Isopropylbenzene
5Isopropanol
0.05n-Hexane
0.05n-Heptane
0.05Ethylcyclohexane
0.05Ethylbenzene
5n-Dodecane
0.052,4-dimethylpentane
0.05trans-1,2-Dichloroethene
0.05cis-1,2-Dichloroethene
0.051,1-Dichloroethene
0.051,2-Dichloroethane
0.051,1-Dichloroethane
0.05Dichlorodifluoromethane
0.051,2-Dibromoethane
0.05Dibromochloromethane
1n-Decane
0.05Cyclohexane
0.05Chloromethane
0.05Chloroethane
0.05Carbon tetrachloride
0.05n-Butylbenzene
0.052-butanone(MEK)
0.05Benzene
K3PF4abuilding SE
FJ014
2014025274
K3PF3a DUPbuilding NE
FJ013
2014025273
K3PF3abuilding NE
FJ012
2014025272
K3AA5 outdoorsouth-east on fence
LO568
2014025271
Page 8 of 18

(I) RESULTS Report N°: M142558
Matrix: Radiello Tube
Method: MA-5.RAD.08 Volatile Organics
Sample units are expressed in µg total
Analyte Name PQL
Client ID
Leeder ID
0.14
4.4
nd
0.32
0.42
0.46
1.3
0.56
nd
0.20
0.24
2.2
0.10
0.24
3.6
nd
nd
0.14
0.12
0.62
0.18
0.36
nd
0.60
1.7
0.16
1.4
nd
0.30
0.44
0.48
0.78
0.50
nd
0.52
1.0
1.4
0.32
nd
2.3
nd
nd
0.08
0.18
1.4
0.52
27
nd
16
20
0.16
1.4
nd
0.30
0.42
0.46
0.86
0.46
nd
0.52
1.0
1.4
0.34
nd
2.2
nd
nd
0.08
0.18
1.3
0.50
25
nd
16
19
1.4
5.0
nd
0.84
1.1
1.3
2.5
1.5
0.44
2.1
0.78
2.0
2.8
0.22
8.0
nd
nd
0.18
0.42
10
4.4
43
nd
96
1100.05m&p-Xylenes
0.05o-Xylene
0.05Vinyl Chloride
0.05n-Undecane
0.051,3,5-Trimethylbenzene
0.051,2,4-Trimethylbenzene
0.05Trichloromethane
0.05Trichloroethene
0.051,1,2-trichloroethane
0.051,1,1-trichloroethane
0.05Toluene
0.05Tetrachloroethene
0.05propylbenzene
0.5n-Pentane
0.05n-Octane
0.05n-Nonane
0.05Naphthalene
0.053-Methylpentane
0.052-Methylpentane
0.053-Methylhexane
0.052-Methylhexane
0.05Methylcyclohexane
0.05Methyl tert-butyl ether
0.52-Methyl butane
0.054-Isopropyltoluene
K3PF4abuilding SE
FJ014
2014025274
K3PF3a DUPbuilding NE
FJ013
2014025273
K3PF3abuilding NE
FJ012
2014025272
K3AA5 outdoorsouth-east on fence
LO568
2014025271
Page 9 of 18

(I) RESULTS Report N°: M142558
Matrix: Radiello Tube
Method: MA-5.RAD.08 Volatile Organics
Sample units are expressed in µg total
Analyte Name PQL
Client ID
Leeder ID
0.66
4.2
0.48
0.08
nd
nd
1.3
27
nd
nd
nd
nd
nd
nd
nd
nd
0.20
69
1.8
0.58
1.9
2.3
nd
0.28
0.36
0.58
0.06
0.08
nd
0.18
0.96
9
0.14
nd
nd
0.30
nd
1.0
nd
nd
nd
55
0.84
0.14
1.4
1.9
nd
0.10
0.56
1.5
nd
0.24
nd
nd
0.84
15
nd
nd
nd
nd
nd
nd
nd
nd
nd
75
0.80
0.12
1.2
1.8
nd
0.14
nd
nd
nd
nd
nd
nd
nd
nd
nd
nd
nd
nd
nd
nd
nd
nd
nd
nd
nd
nd
nd
nd
nd
nd0.05Isopropylbenzene
5Isopropanol
0.05n-Hexane
0.05n-Heptane
0.05Ethylcyclohexane
0.05Ethylbenzene
5n-Dodecane
0.052,4-dimethylpentane
0.05trans-1,2-Dichloroethene
0.05cis-1,2-Dichloroethene
0.051,1-Dichloroethene
0.051,2-Dichloroethane
0.051,1-Dichloroethane
0.05Dichlorodifluoromethane
0.051,2-Dibromoethane
0.05Dibromochloromethane
1n-Decane
0.05Cyclohexane
0.05Chloromethane
0.05Chloroethane
0.05Carbon tetrachloride
0.05n-Butylbenzene
0.052-butanone(MEK)
0.05Benzene
TRIP BLANKFJ018
2014025278
K3PF7a buildingwest wall north
FJ017
2014025277
K3PF6abuilding west wall south
FJ016
2014025276
K3PF5abuilding store area south
FJ015
2014025275
Page 10 of 18

(I) RESULTS Report N°: M142558
Matrix: Radiello Tube
Method: MA-5.RAD.08 Volatile Organics
Sample units are expressed in µg total
Analyte Name PQL
Client ID
Leeder ID
0.82
4.9
nd
0.96
1.1
1.2
2.6
1.1
0.52
2.8
1.5
3.0
0.70
0.22
13
0.10
nd
3.0
nd
6.9
2.2
42
nd
3.3
7.6
0.32
2.4
nd
0.62
0.82
0.90
1.5
0.80
0.28
1.2
0.72
1.8
0.26
0.16
3.3
nd
0.18
2.4
nd
1.7
1.3
38
nd
1.1
2.7
0.28
3.6
nd
0.54
0.82
0.90
1.8
0.88
0.22
1.1
0.50
2.2
0.22
0.12
4.6
nd
nd
0.12
0.34
1.5
0.42
44
nd
1.2
2.7
nd
nd
nd
nd
nd
nd
nd
nd
nd
nd
nd
nd
nd
nd
nd
nd
nd
nd
nd
nd
nd
nd
nd
nd
nd0.05m&p-Xylenes
0.05o-Xylene
0.05Vinyl Chloride
0.05n-Undecane
0.051,3,5-Trimethylbenzene
0.051,2,4-Trimethylbenzene
0.05Trichloromethane
0.05Trichloroethene
0.051,1,2-trichloroethane
0.051,1,1-trichloroethane
0.05Toluene
0.05Tetrachloroethene
0.05propylbenzene
0.5n-Pentane
0.05n-Octane
0.05n-Nonane
0.05Naphthalene
0.053-Methylpentane
0.052-Methylpentane
0.053-Methylhexane
0.052-Methylhexane
0.05Methylcyclohexane
0.05Methyl tert-butyl ether
0.52-Methyl butane
0.054-Isopropyltoluene
TRIP BLANKFJ018
2014025278
K3PF7a buildingwest wall north
FJ017
2014025277
K3PF6abuilding west wall south
FJ016
2014025276
K3PF5abuilding store area south
FJ015
2014025275
Page 11 of 18

(I) RESULTS Report N°: M142558
Matrix: Radiello Tube
Method: MA-5.RAD.08 Volatile Organics
Sample units are expressed in µg total
Analyte Name PQL
Client ID
Leeder ID
nd
nd
nd
nd
nd
nd
nd
nd
nd
nd
nd
nd
nd
nd
nd
nd
nd
nd
nd
nd
nd
nd
nd
nd0.05Isopropylbenzene
5Isopropanol
0.05n-Hexane
0.05n-Heptane
0.05Ethylcyclohexane
0.05Ethylbenzene
5n-Dodecane
0.052,4-dimethylpentane
0.05trans-1,2-Dichloroethene
0.05cis-1,2-Dichloroethene
0.051,1-Dichloroethene
0.051,2-Dichloroethane
0.051,1-Dichloroethane
0.05Dichlorodifluoromethane
0.051,2-Dibromoethane
0.05Dibromochloromethane
1n-Decane
0.05Cyclohexane
0.05Chloromethane
0.05Chloroethane
0.05Carbon tetrachloride
0.05n-Butylbenzene
0.052-butanone(MEK)
0.05Benzene
Blank
Method
2014025279
Page 12 of 18

(I) RESULTS Report N°: M142558
Matrix: Radiello Tube
Method: MA-5.RAD.08 Volatile Organics
Sample units are expressed in µg total
Analyte Name PQL
Client ID
Leeder ID
nd
nd
nd
nd
nd
nd
nd
nd
nd
nd
nd
nd
nd
nd
nd
nd
nd
nd
nd
nd
nd
nd
nd
nd
nd0.05m&p-Xylenes
0.05o-Xylene
0.05Vinyl Chloride
0.05n-Undecane
0.051,3,5-Trimethylbenzene
0.051,2,4-Trimethylbenzene
0.05Trichloromethane
0.05Trichloroethene
0.051,1,2-trichloroethane
0.051,1,1-trichloroethane
0.05Toluene
0.05Tetrachloroethene
0.05propylbenzene
0.5n-Pentane
0.05n-Octane
0.05n-Nonane
0.05Naphthalene
0.053-Methylpentane
0.052-Methylpentane
0.053-Methylhexane
0.052-Methylhexane
0.05Methylcyclohexane
0.05Methyl tert-butyl ether
0.52-Methyl butane
0.054-Isopropyltoluene
Blank
Method
2014025279
Page 13 of 18

(I) RESULTS Report N°: M142558
Matrix: Radiello Tube
Method: MA-30.AIR.04 Total Recoverable Hydrocarbons
Sample units are expressed in µg/m³
Analyte Name PQL
Client ID
Leeder ID
120
130
93
180
100
160
16
120>C10-C16
C6-C10
K3AA4 outdoornorth-western
LO570
2014025270
K3AA3 buildingadmin area
LO567
2014025269
K3AA2 buildingstore area south
LO566
2014025268
K3AA1building indoor NE
LO565
2014025267
Matrix: Radiello Tube
Method: MA-30.AIR.04 Total Recoverable Hydrocarbons
Sample units are expressed in µg/m³
Analyte Name PQL
Client ID
Leeder ID
13
120>C10-C16
C6-C10
K3AA5 outdoorsouth-east on fence
LO568
2014025271
Page 14 of 18

(I) RESULTS Report N°: M142558
Matrix: Radiello Tube
Method: MA-30.AIR.03 Total Recoverable Hydrocarbons
Sample units are expressed in µg total
Analyte Name PQL
Client ID
Leeder ID
180
89
140
120
160
110
24
815>C10-C16
5C6-C10
K3AA4 outdoornorth-western
LO570
2014025270
K3AA3 buildingadmin area
LO567
2014025269
K3AA2 buildingstore area south
LO566
2014025268
K3AA1building indoor NE
LO565
2014025267
Matrix: Radiello Tube
Method: MA-30.AIR.03 Total Recoverable Hydrocarbons
Sample units are expressed in µg total
Analyte Name PQL
Client ID
Leeder ID
20
81
98
1700
110
1700
440
28005>C10-C16
5C6-C10
K3PF4abuilding SE
FJ014
2014025274
K3PF3a DUPbuilding NE
FJ013
2014025273
K3PF3abuilding NE
FJ012
2014025272
K3AA5 outdoorsouth-east on fence
LO568
2014025271
Page 15 of 18

(I) RESULTS Report N°: M142558
Matrix: Radiello Tube
Method: MA-30.AIR.03 Total Recoverable Hydrocarbons
Sample units are expressed in µg total
Analyte Name PQL
Client ID
Leeder ID
230
2000
76
1800
100
2300
nd
nd5>C10-C16
5C6-C10
TRIP BLANKFJ018
2014025278
K3PF7a buildingwest wall north
FJ017
2014025277
K3PF6abuilding west wall south
FJ016
2014025276
K3PF5abuilding store area south
FJ015
2014025275
Matrix: Radiello Tube
Method: MA-30.AIR.03 Total Recoverable Hydrocarbons
Sample units are expressed in µg total
Analyte Name PQL
Client ID
Leeder ID
nd
nd5>C10-C16
5C6-C10
Blank
Method
2014025279
Page 16 of 18

(II) QUALITY CONTROL Report N°: M142558
Matrix: Radiello Tube
Method: MA-5.RAD.08 Volatile Organics
Quality Control Results are expressed in Percent Recovery of expected result
Analyte Name PQL
Client ID
Leeder ID
100
104
102
100
98
101Isopropanol
Ethylbenzene
Benzene
Spike Duplicate
Method
2014025281
Spike
Method
2014025280
Matrix: Radiello Tube
Method: MA-5.RAD.08 Volatile Organics
Quality Control Results are expressed in Percent Recovery of expected result
Analyte Name PQL
Client ID
Leeder ID
105
108
107
97
101
101m&p-Xylenes
o-Xylene
Toluene
Spike Duplicate
Method
2014025281
Spike
Method
2014025280
Page 17 of 18

Report N°: M142558
Q U A L IF IE R S / N O T E S FO R R E P O R T E D R E SU L T S P Q L P ra ctical Q uan ti tat ion L imit is In su ff ic ien t S am ple to pe rfo r m this analys is. T T e n tative ide n tific ation ba sed on c ompu ter l ib ra ry se ar ch o f m ass spe ctra . N D N ot D ete cted – T he analy te w as no t dete cted above the re po rte d P Q L . N C N ot ca lc u lated , R esu lts be low P Q L nr N o t Re ques ted fo r a na lysis . R R eje cted Re su lt – r esu lts fo r th is ana lys is f ai led Q C che cks. S Q S em i- Q uan ti tat ive r esu lt – quan ti ta t ion base d on a gene ric response fa cto r fo r th is c la ss o f ana ly te . IM Ina pp rop r iate me thod o f ana lys is f o r th is c om pound U U na b le to p rov ide Q ua li ty C ontro l da ta – h igh le vels o f com pounds in sam ple in ter fer ed w ith ana lys is o f
Q C r esu lts. U F U na b le to p rov ide Q ua li ty C ontro l da ta- Sur roga te s fa i le d Q Cc hec ks due to sa mple m atrix e ffe cts L A na ly te dete cted at a le vel above the line ar re sponse o f c alib ra tion cu rve . E E s tima te d r esu lt . N A T A ac cr ed itat ion doe s no t c over e st im ated re sults . C 1 T he se com pounds c o -elu te. C 2 T he se com pounds c o -elu te. C T E leva ted conc en tra tion . R esu lts re ported fr om ca rbon tube a nalys is ** S am ple show s non-petro le um hydroc arbon p rof ile
This document is issued, on the Client 's behalf, by the Company under its General Conditions of Service available on request and accessible at http://www.sgs .com/en/Terms-and-Conditions/General-Conditions-of-Services-English.aspx . The Client's at tention is drawn to the limitation of liability, indemnificat ion and jurisdictionissues defined therein. Any other holder of this document is advised that information contained hereon reflects the Company's f indings at the t ime of its intervent ion only and within the limits of Client's instructions , if any. The Company's sole responsibility is to its Client and this document does not exonerate parties to a transaction from exercising all their rights and obligations under the transact ion documents This report must not be reproduced, except in full.
Page 18 of 18

APPENDIX ONE. CHAIN OF CUSTODY DOCUMENT


Appendix G
Photographs

Kelvinator Pty Limited Soil Vapour Investigations for Identification of Trichloroethene - Ashford Road & Everard Avenue, Keswick, South Australia [K3 site] - Privileged & Confidential: Prepared in contemplation of legal proceedings
Parsons Brinckerhoff | Keswick K3 Site Vapour December 2014_2201557b | Privileged and confidential: Prepared in contemplation of legal proceedings G-1
Photo 1. Flux location K3PF1a on the road verge of Ashford Road, eastern side of K3 site
Photo 2. Flux location K3PF2a, adjacent to monitoring well KMW1, on road verge of Ashford Road, adjacent to K1 site boundary

Kelvinator Pty Limited Soil Vapour Investigations for Identification of Trichloroethene - Ashford Road & Everard Avenue, Keswick, South Australia [K3 site] - Privileged & Confidential: Prepared in contemplation of legal proceedings
Parsons Brinckerhoff | Keswick K3 Site Vapour December 2014_2201557b | Privileged and confidential: Prepared in contemplation of legal proceedings G-2
Photo 3. Sub-slab and flux locations in the commercial building on K3 site
Ambient air sampling tube

Kelvinator Pty Limited Soil Vapour Investigations for Identification of Trichloroethene - Ashford Road & Everard Avenue, Keswick, South Australia [K3 site] - Privileged & Confidential: Prepared in contemplation of legal proceedings
Parsons Brinckerhoff | Keswick K3 Site Vapour December 2014_2201557b | Privileged and confidential: Prepared in contemplation of legal proceedings G-3
Photo 4. Sub-slab vapour test point K3SS7a in driveway on western side of K3 commercial building

Kelvinator Pty Limited Soil Vapour Investigations for Identification of Trichloroethene - Ashford Road & Everard Avenue, Keswick, South Australia [K3 site] - Privileged & Confidential: Prepared in contemplation of legal proceedings
Parsons Brinckerhoff | Keswick K3 Site Vapour December 2014_2201557b | Privileged and confidential: Prepared in contemplation of legal proceedings G-4
Photo 5. Monitoring well KMW1 on Ashford Road
Photo 6. Monitoring well KMW2 inside building on K1 site