keno parbo na a community based strategy for reduction of undernutrition in young children
TRANSCRIPT
Keno Parbo NaA community based strategy
for reduction of undernutrition in young children
Why Positive Deviance?
• Malnutrition in young children is more due to incorrect feeding and caring practices rather than only lack of availability of food
• Preventing Malnutrition as early as possible and Promoting Early Child Development is crucial and there needs to be a focus on under-three children
• Lancet says that a single change in behavior can bring down the IMR by 13% and that behavior is Exclusive Breast Feeding

Who is a Positive Deviant?
• A positive deviant child is a healthy and developed child in a poor, disadvantaged and distressed family
• A positive deviant family is one which has PD children• The special practices of a PD family which enables a
child to grow and develop well inspite of poor socioeconomic conditions are called PD practices
• The attempt is to find out these practices in the community and formulate strategies and activities which motivate all families with children to adopt these best practices through participatory learning
How Positive Deviance Works• Making Malnutrition Visible to the families and
community through weighing of children and using colour-coded charts, maps and other tools
• Finding out prevalent child care and feeding practices in the area – both good and bad and identifying young children who have good or bad (Grade 2,3,4) nutritional status as a result of these practices
• Bringing the moderate to severe malnourished young children (0-3 years) and their care-givers regularly to the AWCs (Nutrition Counseling and Child Care Session-NCCS). AWWs along with community, positive deviant mothers & SHGs and teach them the correct feeding and care practices through hands-on demonstration and urge them to follow the same care practices at home
• Close monitoring and follow up
Steps of Positive Deviance• Sensitisation workshop at the district and block level• Training – Joint Training on Community Mobilization & PD approach
for AWWs, ANMs, PRI members, SHGs• Community Mobilization at the village level to make malnutrition
visible• Identifying prevalent common practices – Focus Group Discussion
(FGD)• Identifying PD Child / Families – PD Inquiry• Sharing findings with Community by VHC/ SHGs/ ICDS• Setting up Nutrition Counseling & Childcare Session (NCCS)-12 days
monthly session at AWCs, followed by 18 days home-based practice on child feeding and care
• Monitoring and follow-up• For implementation, AWWs and supervisors take lead role, assisted by
PRI members, ANMs, SHG members, community and care-givers in the family
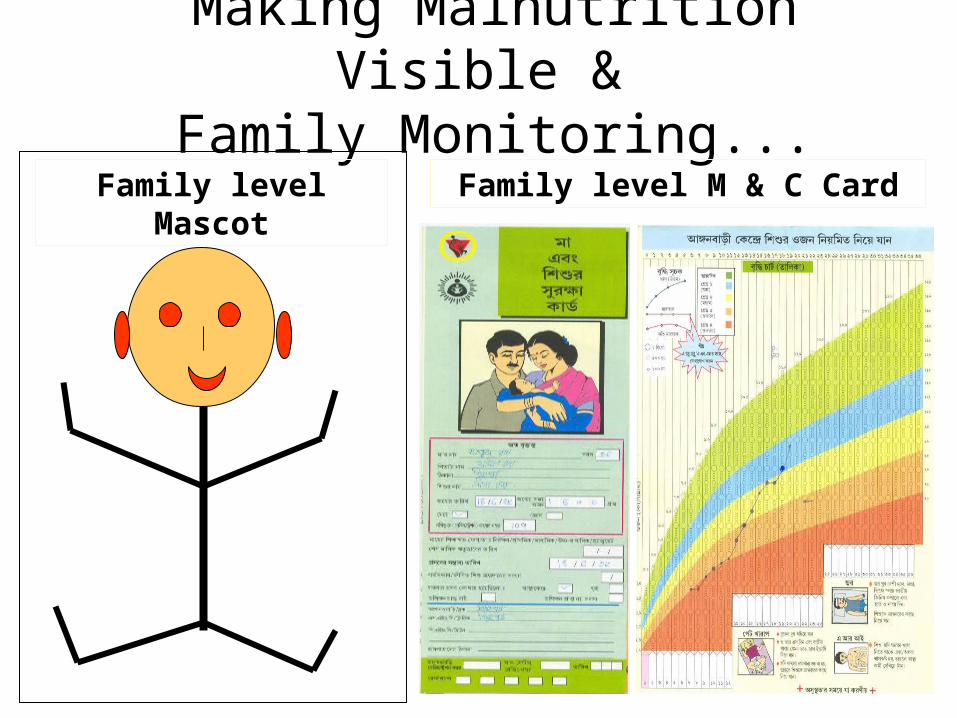
Making Malnutrition Visible & Family Monitoring...
Family level Mascot Family level M & C Card
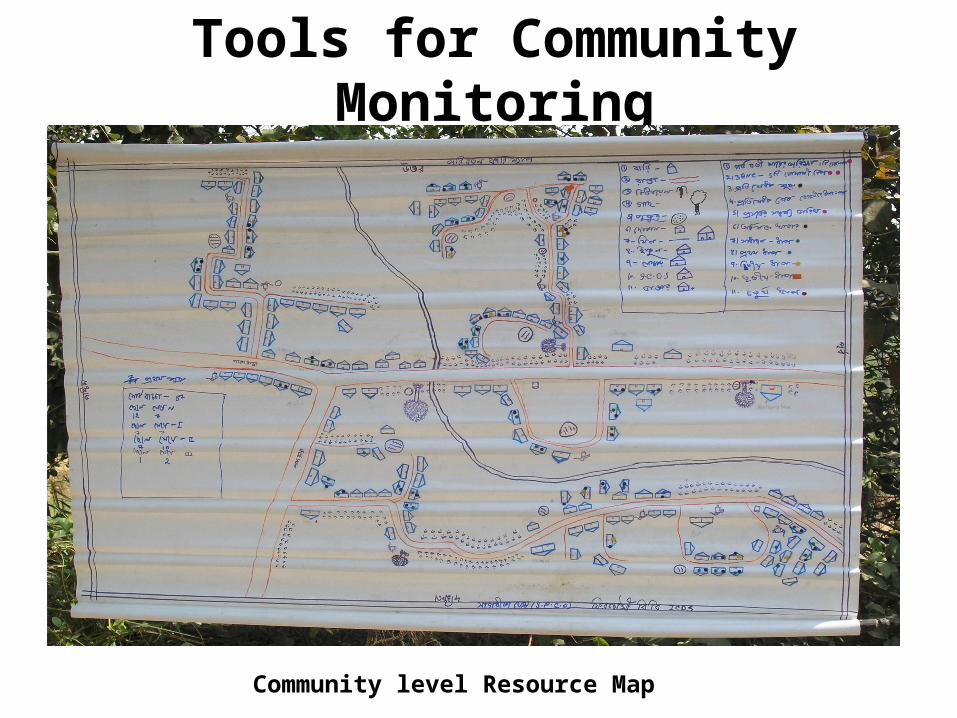
Tools for Community Monitoring
Community level Resource Map
BANKURAPURULIA
PASCHIM MEDINIPUR 24 PG (S)
D DINAJPUR
MURSHIDABAD
U DINAJPUR
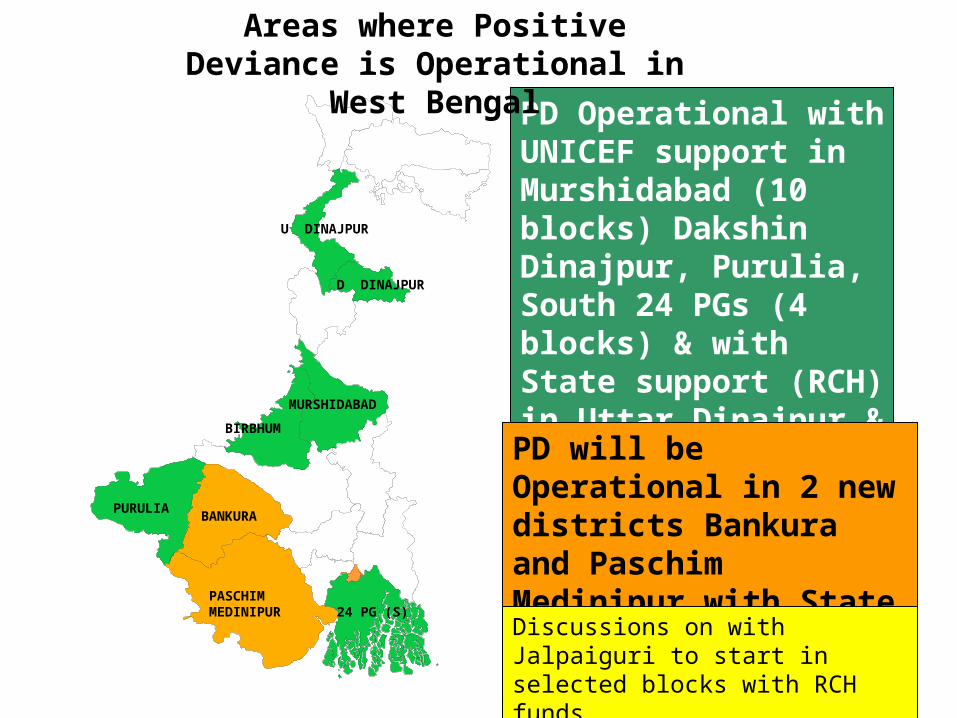
PD Operational with UNICEF support in Murshidabad (10 blocks) Dakshin Dinajpur, Purulia, South 24 PGs (4 blocks) & with State support (RCH) in Uttar Dinajpur & Birbhum.
PD will be Operational in 2 new districts Bankura and Paschim Medinipur with State support (SW) in 2007.
BIRBHUM
Areas where Positive Deviance is Operational in West Bengal
Discussions on with Jalpaiguri to start in selected blocks with RCH funds

Operational Structure• Implemented through ICDS, using its regular staff
• In Purulia- Zilla Parishad also implementing with ICDS
• In D Dinajpur facilitated by NGO (SPCO) ; In 3 blocks of Murshidabad facilitated by NGO (ASHA)
• In all districts, Programme and/or MIS Coordinators at district level coordinate and assist DPO-ICDS to implement the project. They report to the district administration
• In some districts, facilitators present at block level coordinate and help in monitoring and reporting

Is PD making any change?• National Institute of Nutrition conducted an independent
evaluation in 2006
• Survey done in about 1000 children in 40 AWCs implementing PD for atleast one year and compared with equal no.s in matched non PD control areas
• Positive impact found in:– Young child care and feeding practices– Utilization of health & nutrition services, quality improvement of
ICDS – Improved community participation in PD areas
• Relatively better nutrition status of children in PD areas:– Better mean heights and weights of <3 yr children,– Lower prevalence of stunting and underweight in 12-17
months children
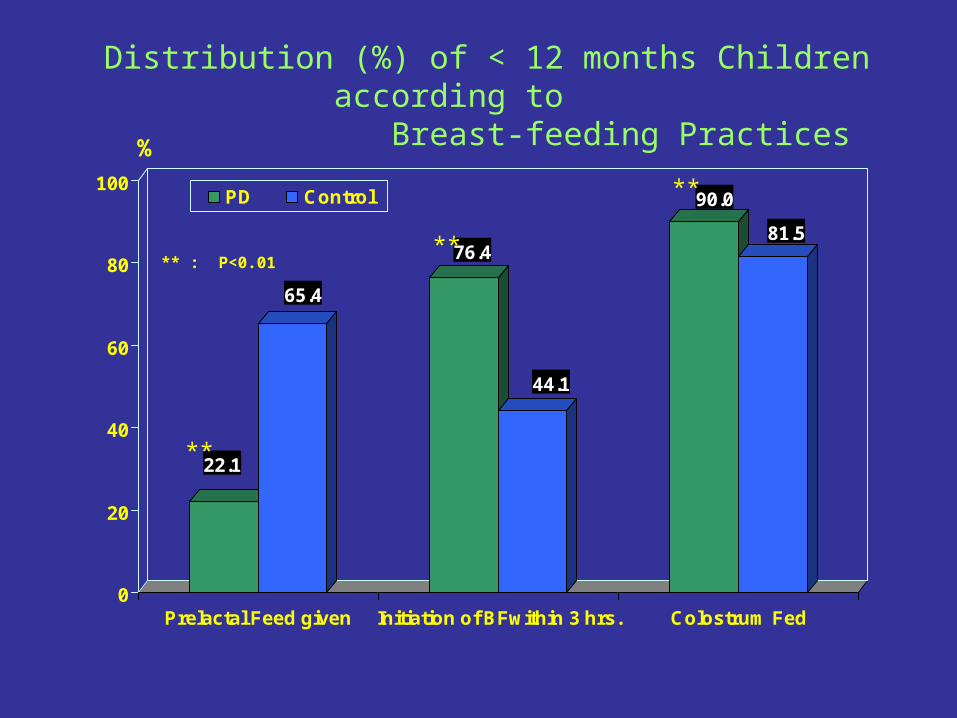
Distribution (%) of < 12 months Children according to
Breast-feeding Practices
22.1
65.4
76.4
44.1
90.0
81.5
0
20
40
60
80
100
Prelactal Feed given Initiation of BFwithin 3 hrs. Colostrum Fed
PD Control
** : P<0.01
**
**
**
%
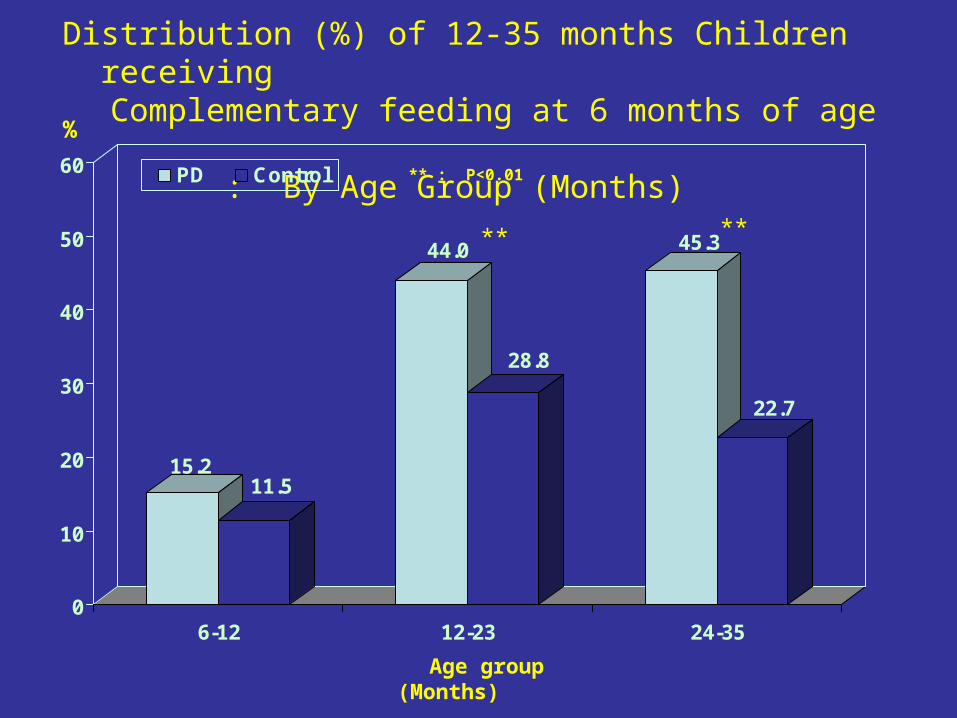
Distribution (%) of 12-35 months Children receiving
Complementary feeding at 6 months of age : By Age Group (Months)
15.211.5
44.0
28.8
45.3
22.7
0
10
20
30
40
50
60
6-12 12-23 24-35
PD Control
Age group (Months)
** : P<0.01
** **
%
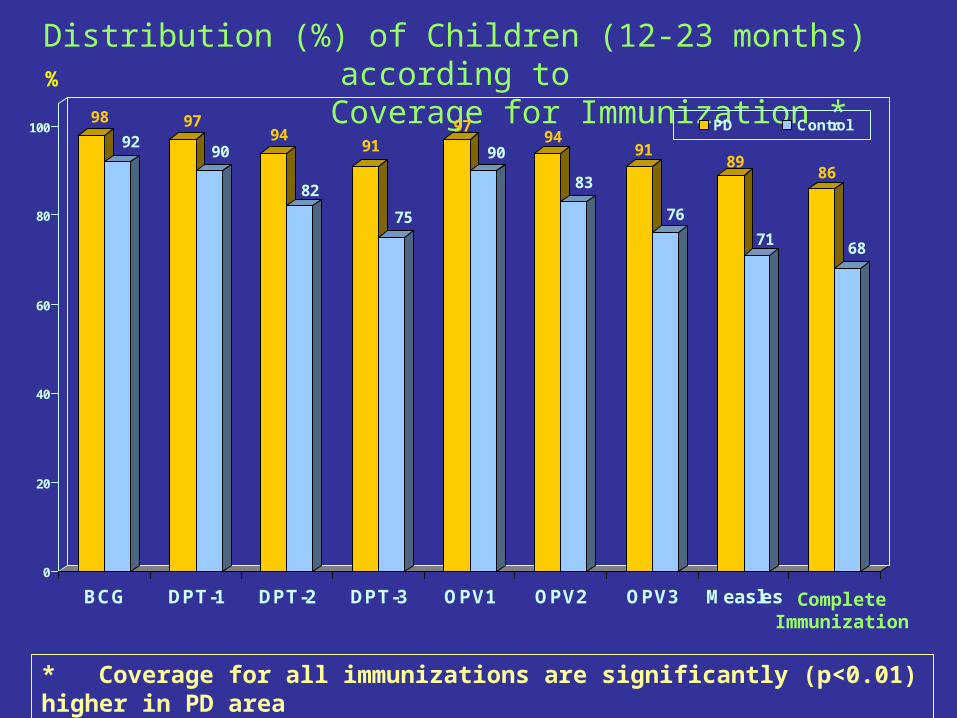
Distribution (%) of Children (12-23 months) according to
Coverage for Immunization *98
9297
9094
82
91
75
97
9094
83
91
76
89
71
86
68
0
20
40
60
80
100
BCG DPT-1 DPT-2 DPT-3 OPV1 OPV2 OPV3 Measles
PD Control
Complete Immunization
%
* Coverage for all immunizations are significantly (p<0.01) higher in PD area

Distribution (%) of 18-35 months Children according to
Receipt of Massive Dose of Vitamin A
34.2
40.7
50.2
33.0
15.6
26.2
0
10
20
30
40
50
60
70
1 Dose 2 Doses Not Received + DNK
PD Control** p<0.01
**
**
%
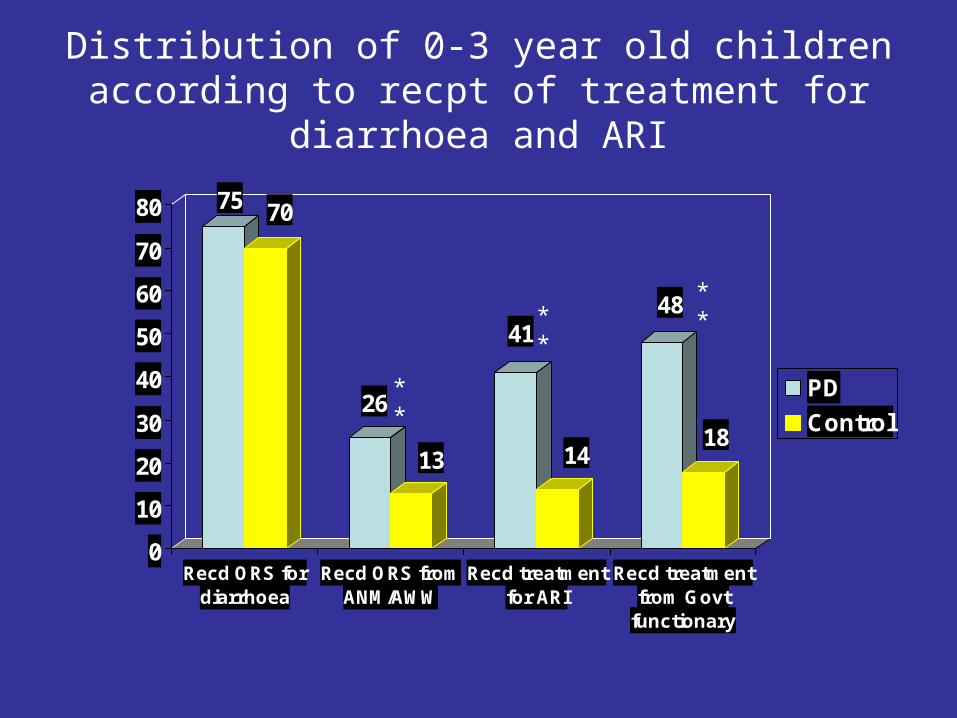
Distribution of 0-3 year old children according to recpt of treatment for diarrhoea
and ARI
75 70
26
13
41
14
48
18
0
10
20
30
40
50
60
70
80
Recd ORS fordiarrhoea
Recd ORS fromANM/AWW
Recd treatmentfor ARI
Recd treatmentfrom Govt
functionary
PD
Control
****
**

Distribution (%) of Anganwadi Centers by type of social organizations functioning in the village
PARTICULARSTYPE OF AREA
PD CONTROL
Type of Social Organizations
Self Help Groups 82.5 70.0
Village Education Committee 60.0 65.0
Youth club 55.0 55.0
Mahila Mandal 45.0** 5.0
Mother’s Committees 45.0** 12.5
Women’s Working group 25.0** 5.0
Village Health Committee 25.0** 5.0
Adolescent Girls Working group 10.0 2.5
Cultural Organization 7.5 7.5
** p< 0.01

Distribution (%) of <3 Yrs. Children according to Nutritional Status : By SD Classification (<Median-
2SD)
43.044.8
26.5
32.0
13.812.3
0
10
20
30
40
50
Per
cen
t
Underweight Stunting Wasting
PD Control
*
* Statistically significant

Distribution (%) of <3 Yrs. Children according to Weight for Age: IAP Classification
0.7 0.51.7
3.0
15.4 15.5
36.735.7
45.5 45.3
0
10
20
30
40
50
Pe
r c
en
t
Grade IV Grade III Grade II Grade I Normal
PD Control

Statistically significant difference among 12-17 months children
• IAP Classification: Undernutrition • PD area-55% • non-PD area- 64%
• SD Classification: – Undernutrition:
• PD area- 45.6%• Non-PD area- 63.2%
– Stunting:• PD area- 25.2%• Non-PD area- 37.4%
In conclusion
• Positive Deviance has been accepted as a best practice in ICDS in the state
• It is now being replicated in different districts using funds from the state
• The challenges are– To maintain the quality of intervention with up-scaling – To mainstream the PD strategy for improving quality
of ICDS, especially focusing on care and feeding practices of under-three children and involving the community in monitoring and combating malnutrition