kentucky coal facts - department for energy development and
TRANSCRIPT
energy.ky.gov kentuckycoal.com
Table of Contents HIGHLIGHTS .......................................................................................................... 4
COAL PRODUCTION ............................................................................................. 5
U.S. Coal Production ................................................................................................5
Types of Coal Mining .............................................................................................6
Statewide Production by County ..........................................................................7
Statewide Production by Mine Type ...................................................................8
Eastern Kentucky Coal Production ........................................................................9
Western Kentucky Coal Production .................................................................. 10
COAL DISTRIBUTION & MARKETS ....................................................................... 11
Kentucky Coal Distribution by Destination ....................................................... 11
Kentucky Coal Domestic Exports ....................................................................... 12
Kentucky Coal In-State Coal Consumption ...................................................... 13
Eastern Kentucky Coal Deliveries ...................................................................... 14
Western Kentucky Coal Deliveries ................................................................... 17
Kentucky Coal Distribution by Consumer & Transportation ......................... 18
PRODUCTIVITY, EMPLOYMENT, & SEVERANCE REVENUE .................................. 19
Kentucky Coal Mine Productivity ....................................................................... 19
Kentucky Coal Mine Employment ...................................................................... 20
Kentucky Coal Severance Revenue................................................................... 23
COAL PRICES & CHEMICAL PROPERTIES ............................................................. 25
Price of Coal by Coal Mine State ..................................................................... 25
Price of Coal by Kentucky Coal Mine County ................................................ 26
Steam Coal Properties by Coal Mine State ................................................... 27
Steam Coal Properties by Kentucky Coal Mine County ............................... 29
ELECTRICITY GENERATION, EMISSIONS, & PRICES ............................................. 31
Coal-fired Power Plants in Kentucky ................................................................ 31
Why Kentucky Uses Coal .................................................................................... 32
Kentucky Electricity Generation ......................................................................... 33
Kentucky Electricity Prices ................................................................................... 34
Kentucky Electric Power Emissions ..................................................................... 36
KENTUCKY & COAL ............................................................................................ 37
Coal Formation & Properties ............................................................................. 37
History of Coal in Kentucky ................................................................................ 38
2 energy.ky.gov kentuckycoal.com
Table of Contents MINE SAFETY, LICENSING, & RECLAMATION ......................................................41
Coal Mine Safety & Training ............................................................................. 41
Active Mines & Licensing ..................................................................................... 42
Mine Reclamation ................................................................................................. 44
Post-Mining Land Use .......................................................................................... 46
COUNTY LEVEL PRODUCTION, EMPLOYMENT, & MARKETS ...............................49
Bell County ............................................................................................................ 50
Boyd County .......................................................................................................... 52
Breathitt County .................................................................................................... 53
Clay County .......................................................................................................... 55
Daviess County ..................................................................................................... 57
Floyd County ......................................................................................................... 59
Harlan County ....................................................................................................... 61
Henderson County ................................................................................................ 64
Hopkins County ..................................................................................................... 66
Johnson County ..................................................................................................... 68
Knott County .......................................................................................................... 69
Knox County .......................................................................................................... 71
Lawrence County .................................................................................................. 72
Leslie County ......................................................................................................... 73
Letcher County ...................................................................................................... 75
Magoffin County .................................................................................................. 77
Marshall County ................................................................................................... 79
Martin County ....................................................................................................... 80
Muhlenberg County ............................................................................................. 82
Ohio County .......................................................................................................... 84
Perry County ......................................................................................................... 86
Pike County ........................................................................................................... 89
Union County ......................................................................................................... 92
Webster County ................................................................................................... 94
Whitley County ..................................................................................................... 96
DATA SOURCES & AGENCY CONTACT INFORMATION ......................................98
3 energy.ky.gov kentuckycoal.com
2011 Highlights
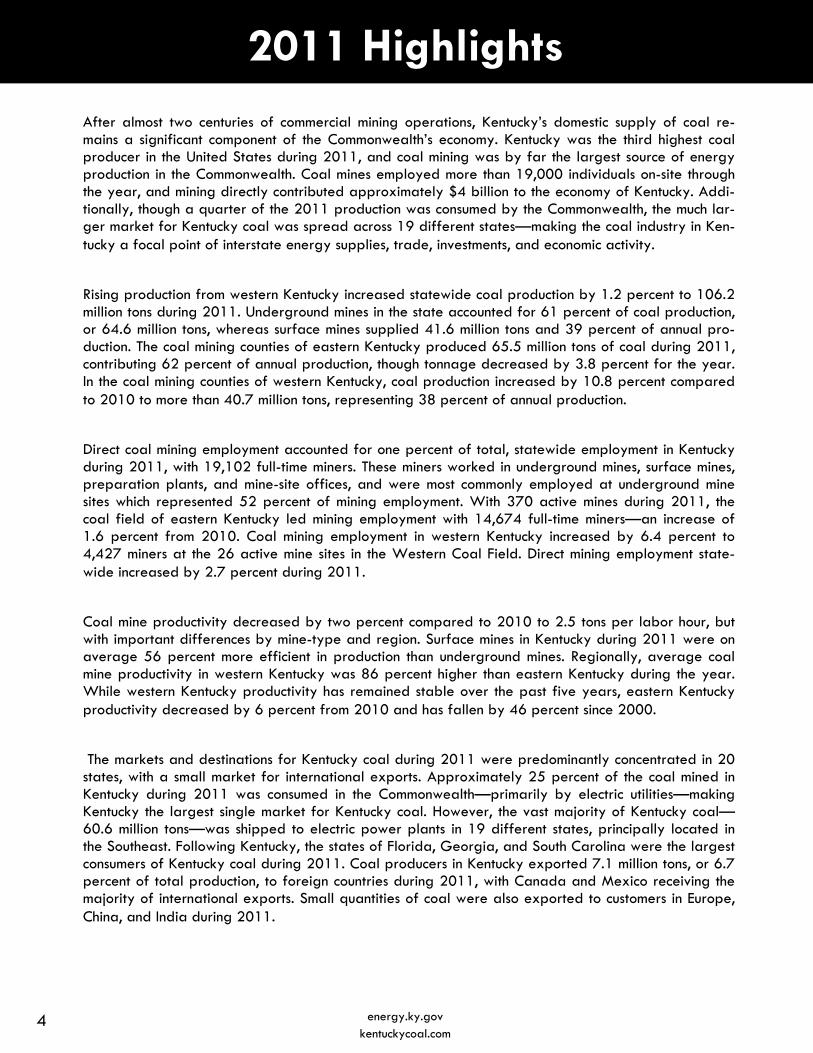
After almost two centuries of commercial mining operations, Kentucky’s domestic supply of coal re-mains a significant component of the Commonwealth’s economy. Kentucky was the third highest coal producer in the United States during 2011, and coal mining was by far the largest source of energy production in the Commonwealth. Coal mines employed more than 19,000 individuals on-site through the year, and mining directly contributed approximately $4 billion to the economy of Kentucky. Addi-tionally, though a quarter of the 2011 production was consumed by the Commonwealth, the much lar-ger market for Kentucky coal was spread across 19 different states—making the coal industry in Ken-tucky a focal point of interstate energy supplies, trade, investments, and economic activity.
Rising production from western Kentucky increased statewide coal production by 1.2 percent to 106.2 million tons during 2011. Underground mines in the state accounted for 61 percent of coal production, or 64.6 million tons, whereas surface mines supplied 41.6 million tons and 39 percent of annual pro-duction. The coal mining counties of eastern Kentucky produced 65.5 million tons of coal during 2011, contributing 62 percent of annual production, though tonnage decreased by 3.8 percent for the year. In the coal mining counties of western Kentucky, coal production increased by 10.8 percent compared to 2010 to more than 40.7 million tons, representing 38 percent of annual production.
Direct coal mining employment accounted for one percent of total, statewide employment in Kentucky during 2011, with 19,102 full-time miners. These miners worked in underground mines, surface mines, preparation plants, and mine-site offices, and were most commonly employed at underground mine sites which represented 52 percent of mining employment. With 370 active mines during 2011, the coal field of eastern Kentucky led mining employment with 14,674 full-time miners—an increase of 1.6 percent from 2010. Coal mining employment in western Kentucky increased by 6.4 percent to 4,427 miners at the 26 active mine sites in the Western Coal Field. Direct mining employment state-wide increased by 2.7 percent during 2011.
Coal mine productivity decreased by two percent compared to 2010 to 2.5 tons per labor hour, but with important differences by mine-type and region. Surface mines in Kentucky during 2011 were on average 56 percent more efficient in production than underground mines. Regionally, average coal mine productivity in western Kentucky was 86 percent higher than eastern Kentucky during the year. While western Kentucky productivity has remained stable over the past five years, eastern Kentucky productivity decreased by 6 percent from 2010 and has fallen by 46 percent since 2000.
The markets and destinations for Kentucky coal during 2011 were predominantly concentrated in 20 states, with a small market for international exports. Approximately 25 percent of the coal mined in Kentucky during 2011 was consumed in the Commonwealth—primarily by electric utilities—making Kentucky the largest single market for Kentucky coal. However, the vast majority of Kentucky coal— 60.6 million tons—was shipped to electric power plants in 19 different states, principally located in the Southeast. Following Kentucky, the states of Florida, Georgia, and South Carolina were the largest consumers of Kentucky coal during 2011. Coal producers in Kentucky exported 7.1 million tons, or 6.7 percent of total production, to foreign countries during 2011, with Canada and Mexico receiving the majority of international exports. Small quantities of coal were also exported to customers in Europe, China, and India during 2011.
4 energy.ky.gov kentuckycoal.com
U.S. Coal Production, 2011
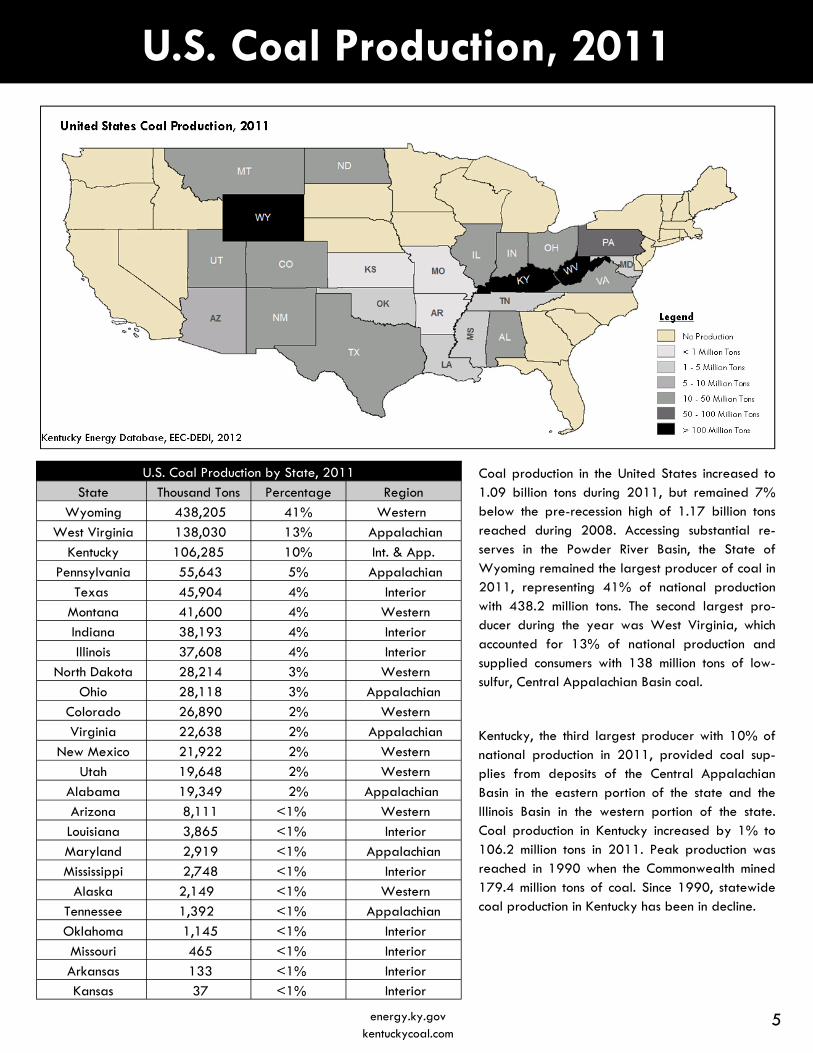
Coal production in the United States increased to 1.09 billion tons during 2011, but remained 7% below the pre-recession high of 1.17 billion tons reached during 2008. Accessing substantial re-serves in the Powder River Basin, the State of Wyoming remained the largest producer of coal in 2011, representing 41% of national production with 438.2 million tons. The second largest pro-ducer during the year was West Virginia, which accounted for 13% of national production and supplied consumers with 138 million tons of low-sulfur, Central Appalachian Basin coal.
Kentucky, the third largest producer with 10% of national production in 2011, provided coal sup-plies from deposits of the Central Appalachian Basin in the eastern portion of the state and the Illinois Basin in the western portion of the state. Coal production in Kentucky increased by 1% to 106.2 million tons in 2011. Peak production was reached in 1990 when the Commonwealth mined 179.4 million tons of coal. Since 1990, statewide coal production in Kentucky has been in decline.
U.S. Coal Production by State, 2011 State Thousand Tons Percentage Region
Wyoming 438,205 41% Western
West Virginia 138,030 13% Appalachian
Kentucky 106,285 10% Int. & App.
Pennsylvania 55,643 5% Appalachian
Texas 45,904 4% Interior
Montana 41,600 4% Western
Indiana 38,193 4% Interior
Illinois 37,608 4% Interior
North Dakota 28,214 3% Western
Ohio 28,118 3% Appalachian
Colorado 26,890 2% Western
Virginia 22,638 2% Appalachian
New Mexico 21,922 2% Western
Utah 19,648 2% Western
Alabama 19,349 2% Appalachian
Arizona 8,111 <1% Western
Louisiana 3,865 <1% Interior
Maryland 2,919 <1% Appalachian
Mississippi 2,748 <1% Interior
Alaska 2,149 <1% Western
Tennessee 1,392 <1% Appalachian
Oklahoma 1,145 <1% Interior
Missouri 465 <1% Interior
Arkansas 133 <1% Interior Kansas 37 <1% Interior
5 energy.ky.gov kentuckycoal.com
Types of Coal Mining
*Source: Processed data in table, Kentucky Department of Energy Development & Independence, Kentucky Energy Data-base, 2012. Raw data, U.S. Department of Labor, Mine Safety and Health Administration, “Quarterly Mine Employment and Coal Production Report” (MSHA Form 7000-02). The above table summarizes the five most common mining methods or mine types used in 2011 to access coal seams in Kentucky. As a result of this summarization, small quantities of coal that are counted in total statewide production may not necessarily be represented in the above totals.
Refuse recovery mines and culm bank mines register production only when new coal is brought to market. These types of mines extract new coal from waste material discarded or impounded by previous mining operations.
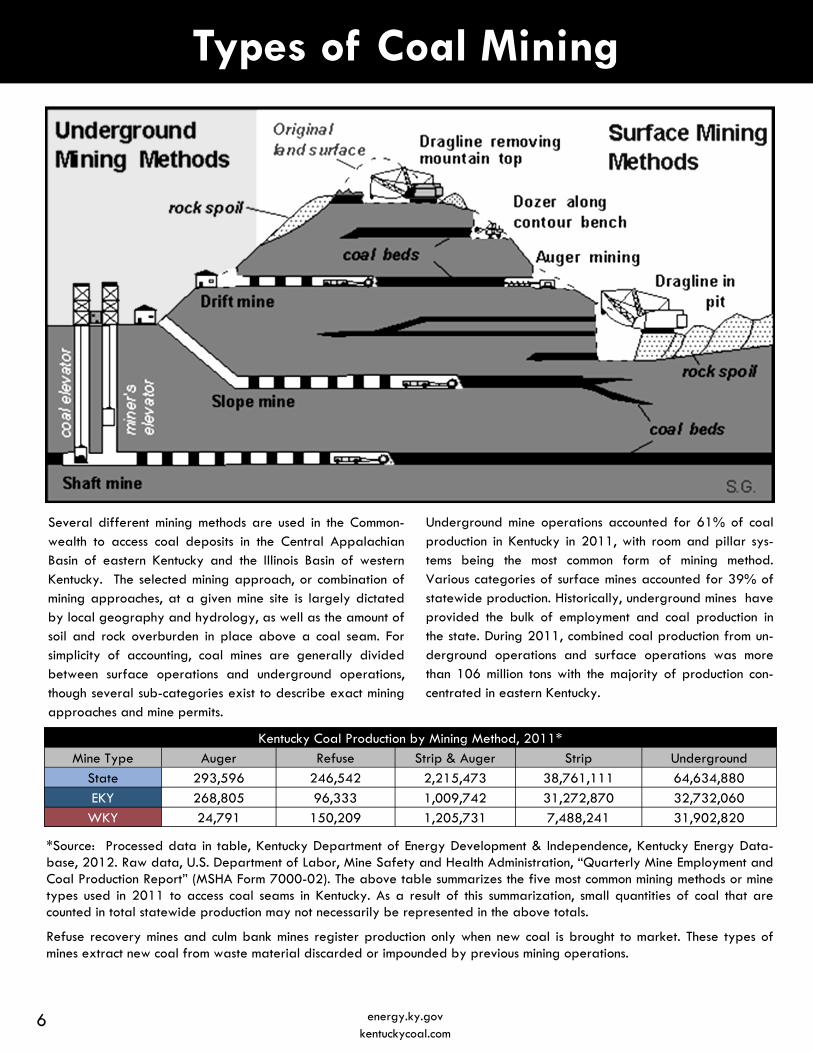
Several different mining methods are used in the Common-wealth to access coal deposits in the Central Appalachian Basin of eastern Kentucky and the Illinois Basin of western Kentucky. The selected mining approach, or combination of mining approaches, at a given mine site is largely dictated by local geography and hydrology, as well as the amount of soil and rock overburden in place above a coal seam. For simplicity of accounting, coal mines are generally divided between surface operations and underground operations, though several sub-categories exist to describe exact mining approaches and mine permits.
Underground mine operations accounted for 61% of coal production in Kentucky in 2011, with room and pillar sys-tems being the most common form of mining method. Various categories of surface mines accounted for 39% of statewide production. Historically, underground mines have provided the bulk of employment and coal production in the state. During 2011, combined coal production from un-derground operations and surface operations was more than 106 million tons with the majority of production con-centrated in eastern Kentucky.
Kentucky Coal Production by Mining Method, 2011*
Mine Type Auger Refuse Strip & Auger Strip Underground
State 293,596 246,542 2,215,473 38,761,111 64,634,880
EKY 268,805 96,333 1,009,742 31,272,870 32,732,060 WKY 24,791 150,209 1,205,731 7,488,241 31,902,820
6 energy.ky.gov kentuckycoal.com
Kentucky Coal Production, 2011
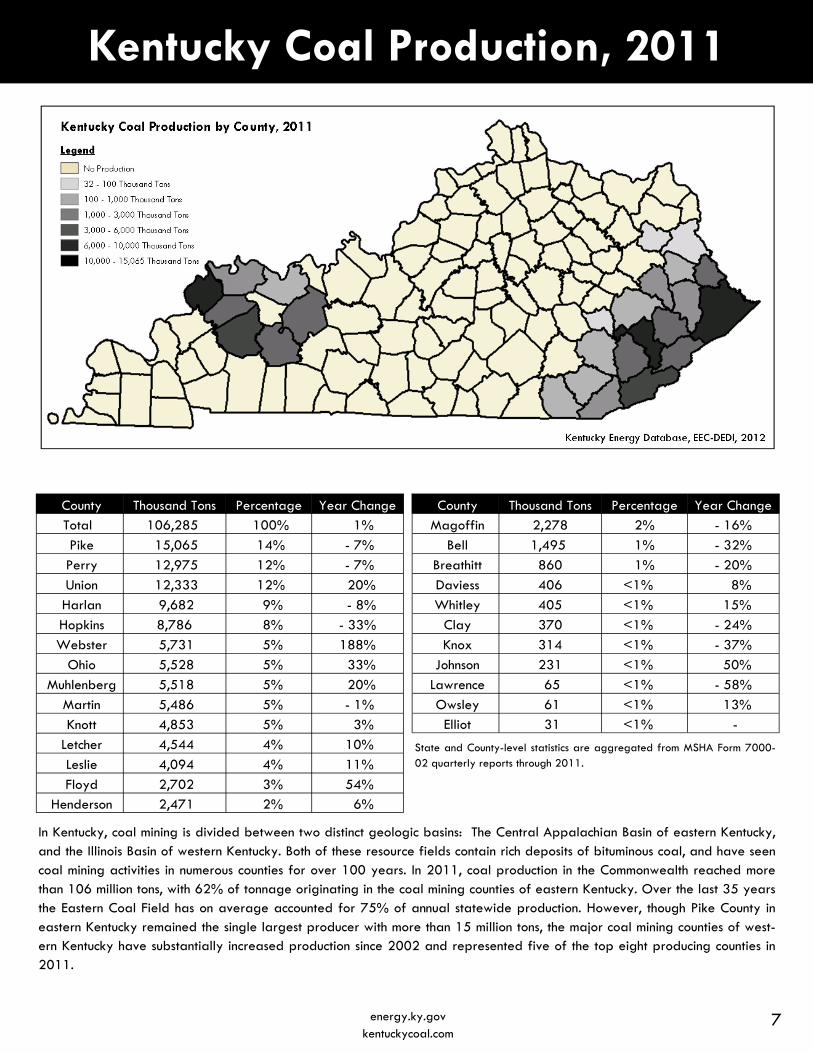
In Kentucky, coal mining is divided between two distinct geologic basins: The Central Appalachian Basin of eastern Kentucky, and the Illinois Basin of western Kentucky. Both of these resource fields contain rich deposits of bituminous coal, and have seen coal mining activities in numerous counties for over 100 years. In 2011, coal production in the Commonwealth reached more than 106 million tons, with 62% of tonnage originating in the coal mining counties of eastern Kentucky. Over the last 35 years the Eastern Coal Field has on average accounted for 75% of annual statewide production. However, though Pike County in eastern Kentucky remained the single largest producer with more than 15 million tons, the major coal mining counties of west-ern Kentucky have substantially increased production since 2002 and represented five of the top eight producing counties in 2011.
County Thousand Tons Percentage Year Change Total 106,285 100% 1%
Pike 15,065 14% - 7%
Perry 12,975 12% - 7%
Union 12,333 12% 20%
Harlan 9,682 9% - 8%
Hopkins 8,786 8% - 33%
Webster 5,731 5% 188%
Ohio 5,528 5% 33%
Muhlenberg 5,518 5% 20%
Martin 5,486 5% - 1%
Knott 4,853 5% 3%
Letcher 4,544 4% 10%
Leslie 4,094 4% 11%
Floyd 2,702 3% 54% Henderson 2,471 2% 6%
County Thousand Tons Percentage Year Change Magoffin 2,278 2% - 16%
Bell 1,495 1% - 32%
Breathitt 860 1% - 20%
Daviess 406 <1% 8%
Whitley 405 <1% 15%
Clay 370 <1% - 24%
Knox 314 <1% - 37%
Johnson 231 <1% 50%
Lawrence 65 <1% - 58%
Owsley 61 <1% 13% Elliot 31 <1% -
State and County-level statistics are aggregated from MSHA Form 7000-02 quarterly reports through 2011.
7 energy.ky.gov kentuckycoal.com
Mine Type Thousand Tons Percentage
Total 106,285 100%
Underground 64,635 61%
Surface 41,650 39%
Region Thousand Tons Percentage Total 106,285 100%
Eastern Kentucky 65,514 62%
Western Kentucky 40,771 38%
8 energy.ky.gov kentuckycoal.com
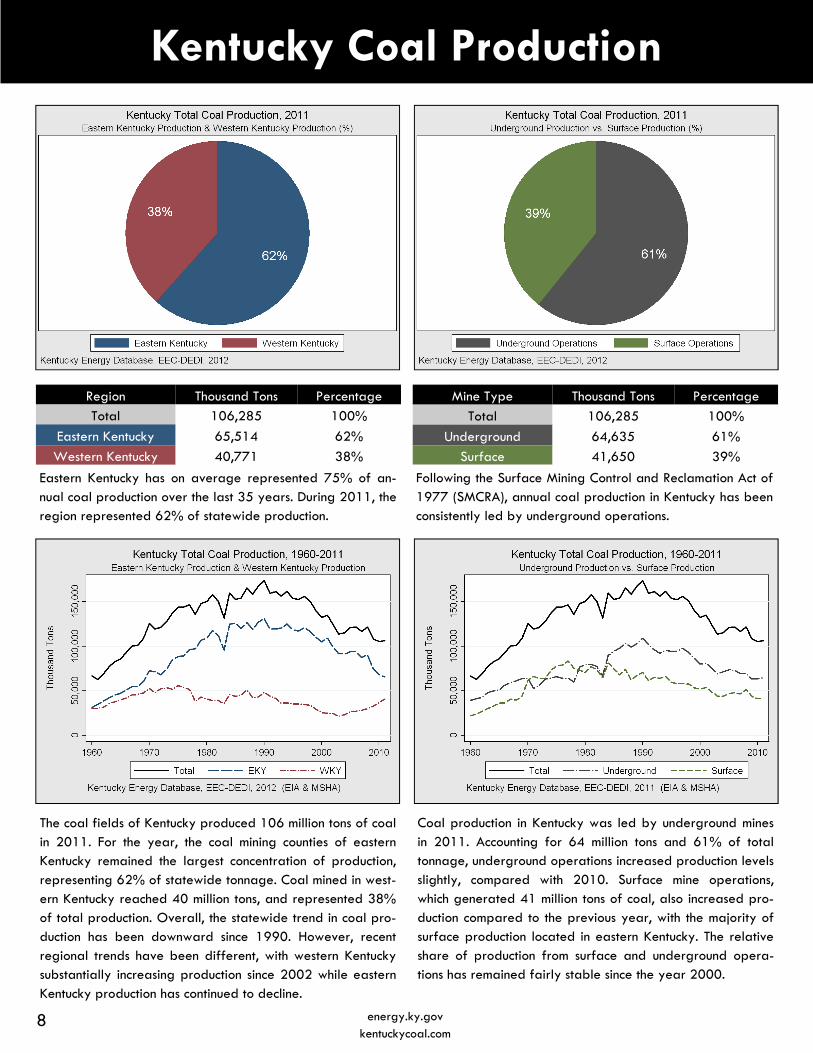
The coal fields of Kentucky produced 106 million tons of coal in 2011. For the year, the coal mining counties of eastern Kentucky remained the largest concentration of production, representing 62% of statewide tonnage. Coal mined in west-ern Kentucky reached 40 million tons, and represented 38% of total production. Overall, the statewide trend in coal pro-duction has been downward since 1990. However, recent regional trends have been different, with western Kentucky substantially increasing production since 2002 while eastern Kentucky production has continued to decline.
Coal production in Kentucky was led by underground mines in 2011. Accounting for 64 million tons and 61% of total tonnage, underground operations increased production levels slightly, compared with 2010. Surface mine operations, which generated 41 million tons of coal, also increased pro-duction compared to the previous year, with the majority of surface production located in eastern Kentucky. The relative share of production from surface and underground opera-tions has remained fairly stable since the year 2000.
Kentucky Coal Production
Eastern Kentucky has on average represented 75% of an-nual coal production over the last 35 years. During 2011, the region represented 62% of statewide production.
Following the Surface Mining Control and Reclamation Act of 1977 (SMCRA), annual coal production in Kentucky has been consistently led by underground operations.
Eastern Kentucky Coal Production
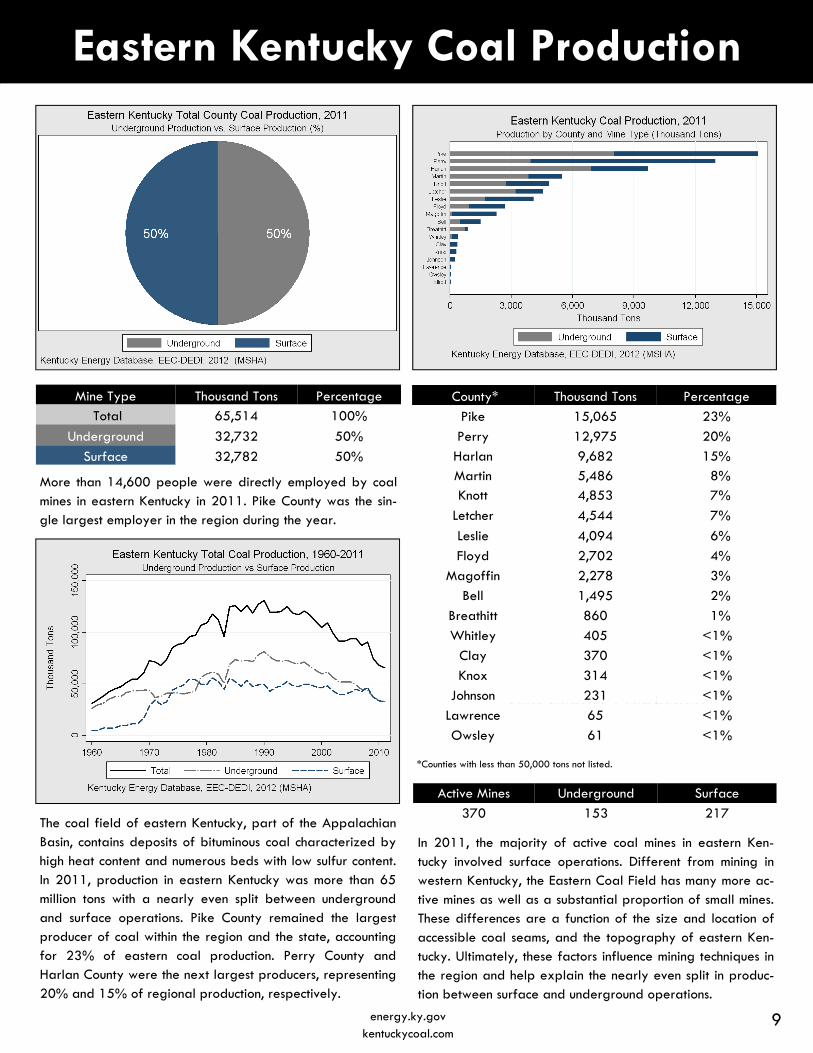
Mine Type Thousand Tons Percentage Total 65,514 100%
Underground 32,732 50%
Surface 32,782 50%
9 energy.ky.gov kentuckycoal.com
The coal field of eastern Kentucky, part of the Appalachian Basin, contains deposits of bituminous coal characterized by high heat content and numerous beds with low sulfur content. In 2011, production in eastern Kentucky was more than 65 million tons with a nearly even split between underground and surface operations. Pike County remained the largest producer of coal within the region and the state, accounting for 23% of eastern coal production. Perry County and Harlan County were the next largest producers, representing 20% and 15% of regional production, respectively.
Text County Production
County* Thousand Tons Percentage
Pike 15,065 23%
Perry 12,975 20% Harlan 9,682 15% Martin 5,486 8% Knott 4,853 7%
Letcher 4,544 7%
Leslie 4,094 6%
Floyd 2,702 4%
Magoffin 2,278 3%
Bell 1,495 2%
Breathitt 860 1%
Whitley 405 <1%
Clay 370 <1%
Knox 314 <1%
Johnson 231 <1%
Lawrence 65 <1%
Owsley 61 <1%
Active Mines Underground Surface
370 153 217
In 2011, the majority of active coal mines in eastern Ken-tucky involved surface operations. Different from mining in western Kentucky, the Eastern Coal Field has many more ac-tive mines as well as a substantial proportion of small mines. These differences are a function of the size and location of accessible coal seams, and the topography of eastern Ken-tucky. Ultimately, these factors influence mining techniques in the region and help explain the nearly even split in produc-tion between surface and underground operations.
More than 14,600 people were directly employed by coal mines in eastern Kentucky in 2011. Pike County was the sin-gle largest employer in the region during the year.
*Counties with less than 50,000 tons not listed.
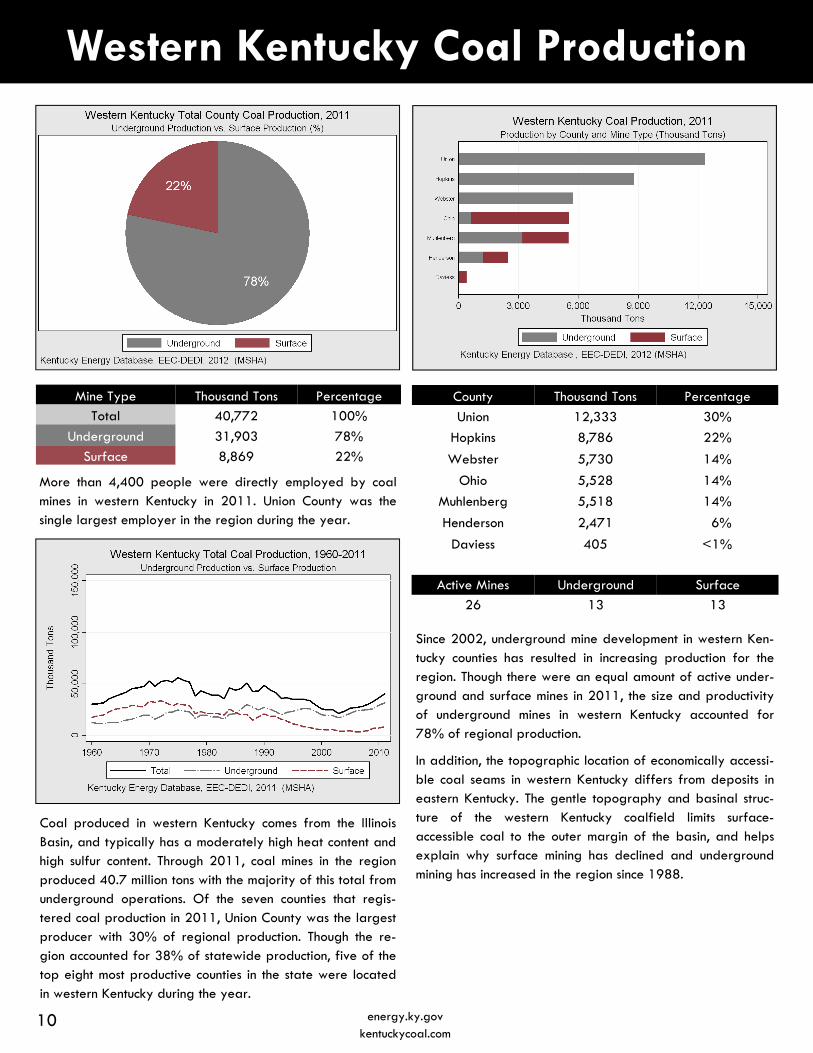
Mine Type Thousand Tons Percentage Total 40,772 100%
Underground 31,903 78%
Surface 8,869 22%
10 energy.ky.gov kentuckycoal.com
Coal produced in western Kentucky comes from the Illinois Basin, and typically has a moderately high heat content and high sulfur content. Through 2011, coal mines in the region produced 40.7 million tons with the majority of this total from underground operations. Of the seven counties that regis-tered coal production in 2011, Union County was the largest producer with 30% of regional production. Though the re-gion accounted for 38% of statewide production, five of the top eight most productive counties in the state were located in western Kentucky during the year.
County Thousand Tons Percentage
Union 12,333 30%
Hopkins 8,786 22%
Webster 5,730 14%
Ohio 5,528 14%
Muhlenberg 5,518 14%
Henderson 2,471 6%
Daviess 405 <1%
Western Kentucky Coal Production
Active Mines Underground Surface
26 13 13
Since 2002, underground mine development in western Ken-tucky counties has resulted in increasing production for the region. Though there were an equal amount of active under-ground and surface mines in 2011, the size and productivity of underground mines in western Kentucky accounted for 78% of regional production.
In addition, the topographic location of economically accessi-ble coal seams in western Kentucky differs from deposits in eastern Kentucky. The gentle topography and basinal struc-ture of the western Kentucky coalfield limits surface-accessible coal to the outer margin of the basin, and helps explain why surface mining has declined and underground mining has increased in the region since 1988.
More than 4,400 people were directly employed by coal mines in western Kentucky in 2011. Union County was the single largest employer in the region during the year.
Kentucky Coal Distribution
11 energy.ky.gov kentuckycoal.com
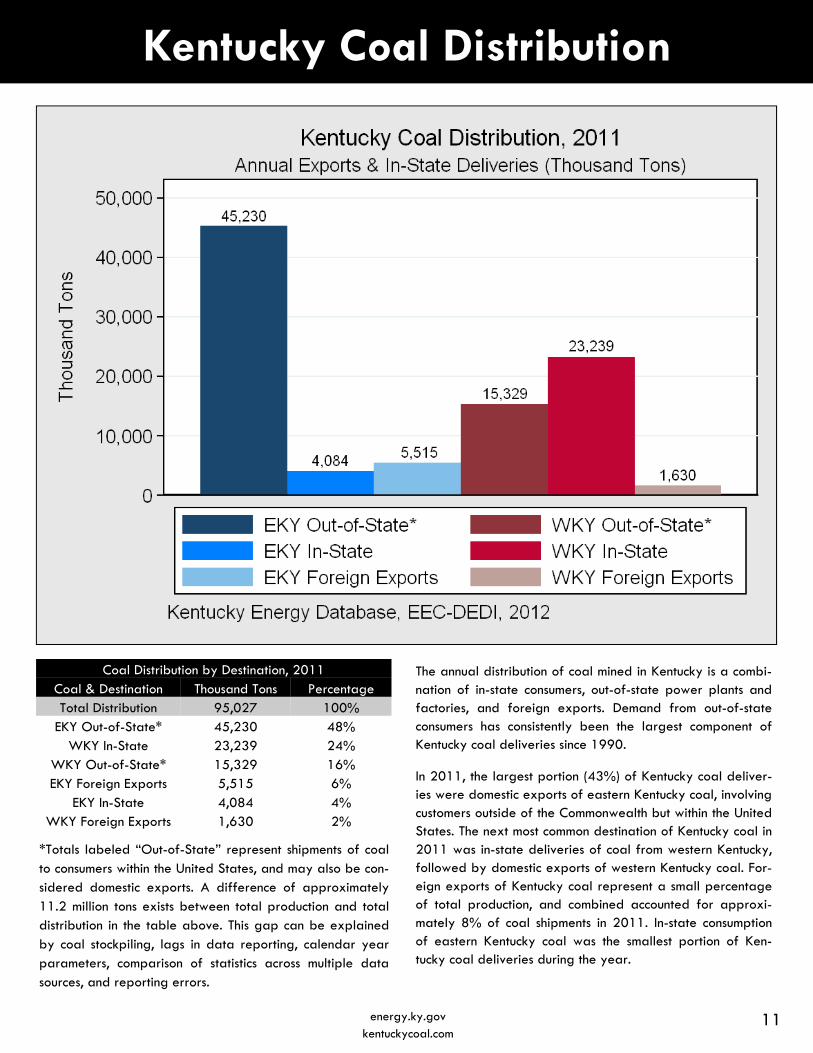
The annual distribution of coal mined in Kentucky is a combi-nation of in-state consumers, out-of-state power plants and factories, and foreign exports. Demand from out-of-state consumers has consistently been the largest component of Kentucky coal deliveries since 1990.
In 2011, the largest portion (43%) of Kentucky coal deliver-ies were domestic exports of eastern Kentucky coal, involving customers outside of the Commonwealth but within the United States. The next most common destination of Kentucky coal in 2011 was in-state deliveries of coal from western Kentucky, followed by domestic exports of western Kentucky coal. For-eign exports of Kentucky coal represent a small percentage of total production, and combined accounted for approxi-mately 8% of coal shipments in 2011. In-state consumption of eastern Kentucky coal was the smallest portion of Ken-tucky coal deliveries during the year.
Coal Distribution by Destination, 2011 Coal & Destination Thousand Tons Percentage Total Distribution 95,027 100%
EKY Out-of-State* 45,230 48% WKY In-State 23,239 24%
WKY Out-of-State* 15,329 16% EKY Foreign Exports 5,515 6%
EKY In-State 4,084 4% WKY Foreign Exports 1,630 2%
*Totals labeled “Out-of-State” represent shipments of coal to consumers within the United States, and may also be con-sidered domestic exports. A difference of approximately 11.2 million tons exists between total production and total distribution in the table above. This gap can be explained by coal stockpiling, lags in data reporting, calendar year parameters, comparison of statistics across multiple data sources, and reporting errors.
Kentucky Coal Domestic Exports
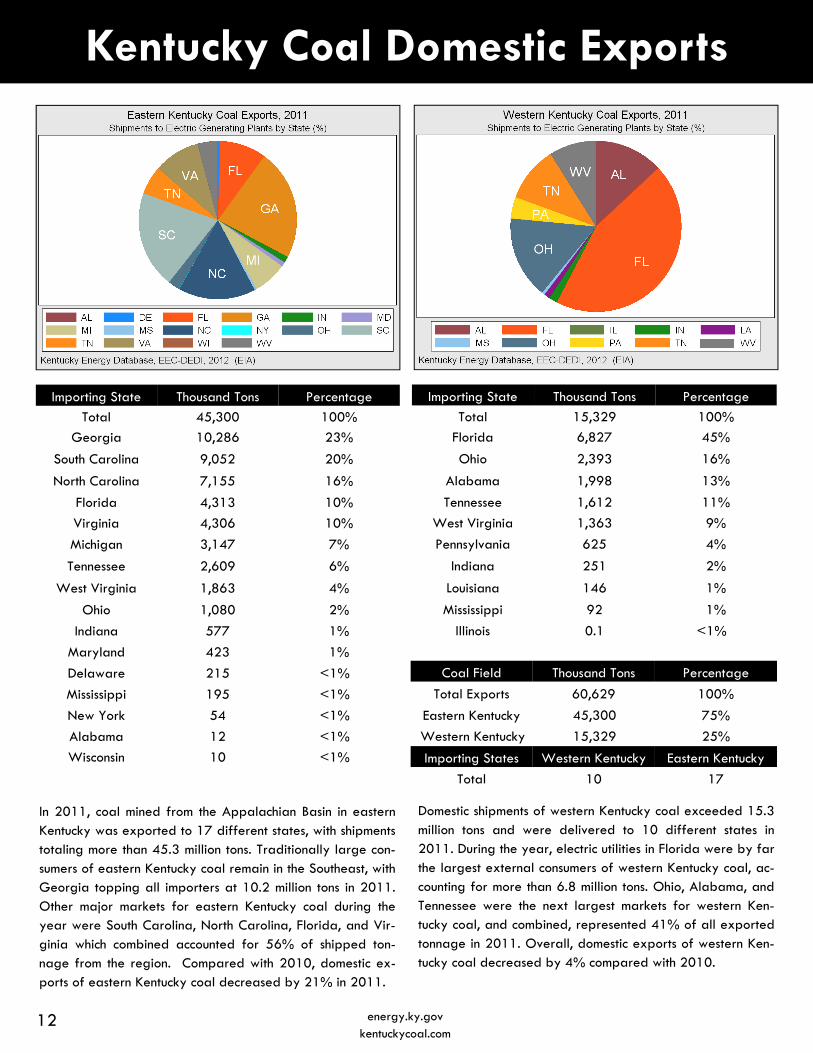
Importing State Thousand Tons Percentage
Total 45,300 100%
Georgia 10,286 23%
South Carolina 9,052 20%
North Carolina 7,155 16%
Florida 4,313 10%
Virginia 4,306 10%
Michigan 3,147 7%
Tennessee 2,609 6%
West Virginia 1,863 4%
Ohio 1,080 2%
Indiana 577 1%
Maryland 423 1%
Delaware 215 <1%
Mississippi 195 <1%
New York 54 <1%
Alabama 12 <1%
Wisconsin 10 <1%
In 2011, coal mined from the Appalachian Basin in eastern Kentucky was exported to 17 different states, with shipments totaling more than 45.3 million tons. Traditionally large con-sumers of eastern Kentucky coal remain in the Southeast, with Georgia topping all importers at 10.2 million tons in 2011. Other major markets for eastern Kentucky coal during the year were South Carolina, North Carolina, Florida, and Vir-ginia which combined accounted for 56% of shipped ton-nage from the region. Compared with 2010, domestic ex-ports of eastern Kentucky coal decreased by 21% in 2011.
Coal Field Thousand Tons Percentage
Total Exports 60,629 100%
Eastern Kentucky 75%
25%
Importing States Western Kentucky Eastern Kentucky
Total 10 17
Domestic shipments of western Kentucky coal exceeded 15.3 million tons and were delivered to 10 different states in 2011. During the year, electric utilities in Florida were by far the largest external consumers of western Kentucky coal, ac-counting for more than 6.8 million tons. Ohio, Alabama, and Tennessee were the next largest markets for western Ken-tucky coal, and combined, represented 41% of all exported tonnage in 2011. Overall, domestic exports of western Ken-tucky coal decreased by 4% compared with 2010.
Importing State Thousand Tons Percentage
Total 15,329 100%
Florida 6,827 45%
Ohio 2,393 16%
Alabama 1,998 13%
Tennessee 1,612 11%
West Virginia 1,363 9%
Pennsylvania 625 4%
Indiana 251 2%
Louisiana 146 1%
Mississippi 92 1%
Illinois 0.1 <1%
45,300
Western Kentucky 15,329 25%
12 energy.ky.gov kentuckycoal.com
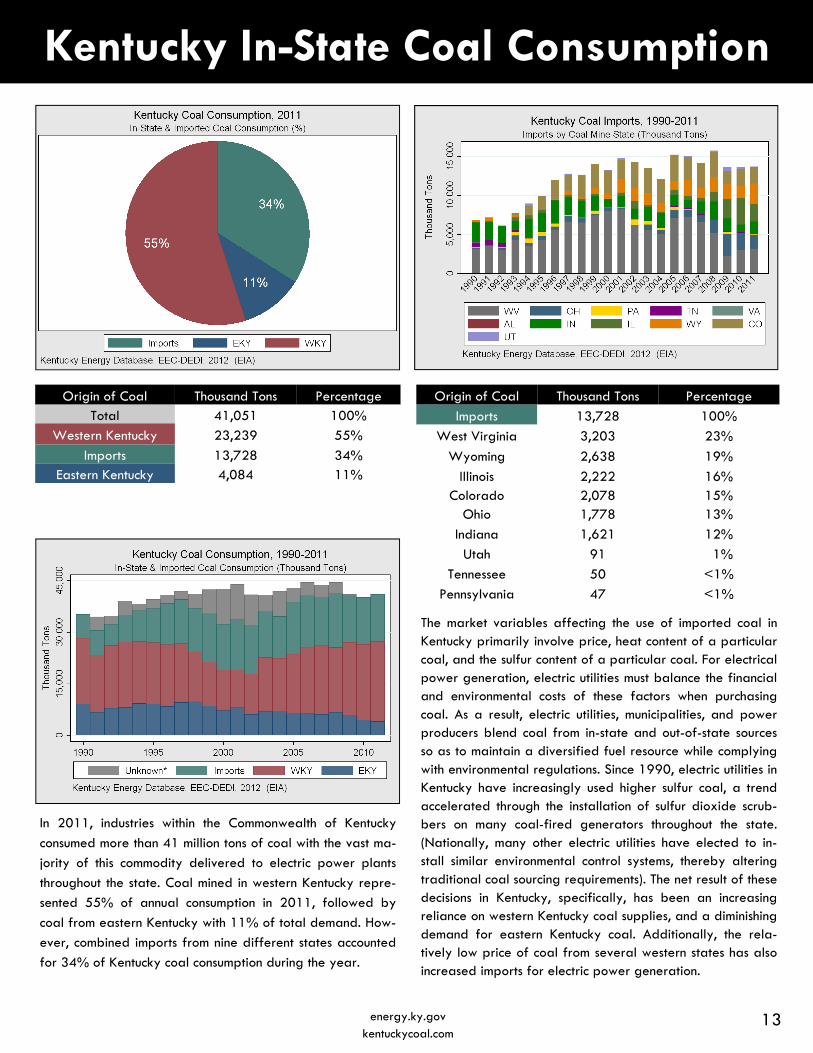
Origin of Coal Thousand Tons Percentage Total 41,051 100%
Western Kentucky 23,239 55%
Imports 13,728 34% Eastern Kentucky 4,084 11%
In 2011, industries within the Commonwealth of Kentucky
consumed more than 41 million tons of coal with the vast ma-
jority of this commodity delivered to electric power plants
throughout the state. Coal mined in western Kentucky repre-
sented 55% of annual consumption in 2011, followed by
coal from eastern Kentucky with 11% of total demand. How-
ever, combined imports from nine different states accounted
for 34% of Kentucky coal consumption during the year.
Origin of Coal Thousand Tons Percentage
Imports 13,728 100%
West Virginia 3,203 23%
Wyoming 2,638 19%
Illinois 2,222 16% Colorado 2,078 15%
Ohio 1,778 13%
Indiana 1,621 12%
Utah 91 1%
Tennessee 50 <1%
Pennsylvania 47 <1%
The market variables affecting the use of imported coal in Kentucky primarily involve price, heat content of a particular coal, and the sulfur content of a particular coal. For electrical power generation, electric utilities must balance the financial and environmental costs of these factors when purchasing coal. As a result, electric utilities, municipalities, and power producers blend coal from in-state and out-of-state sources so as to maintain a diversified fuel resource while complying with environmental regulations. Since 1990, electric utilities in Kentucky have increasingly used higher sulfur coal, a trend accelerated through the installation of sulfur dioxide scrub-bers on many coal-fired generators throughout the state. (Nationally, many other electric utilities have elected to in-stall similar environmental control systems, thereby altering traditional coal sourcing requirements). The net result of these decisions in Kentucky, specifically, has been an increasing reliance on western Kentucky coal supplies, and a diminishing demand for eastern Kentucky coal. Additionally, the rela-tively low price of coal from several western states has also increased imports for electric power generation.
Kentucky In-State Coal Consumption
13 energy.ky.gov kentuckycoal.com
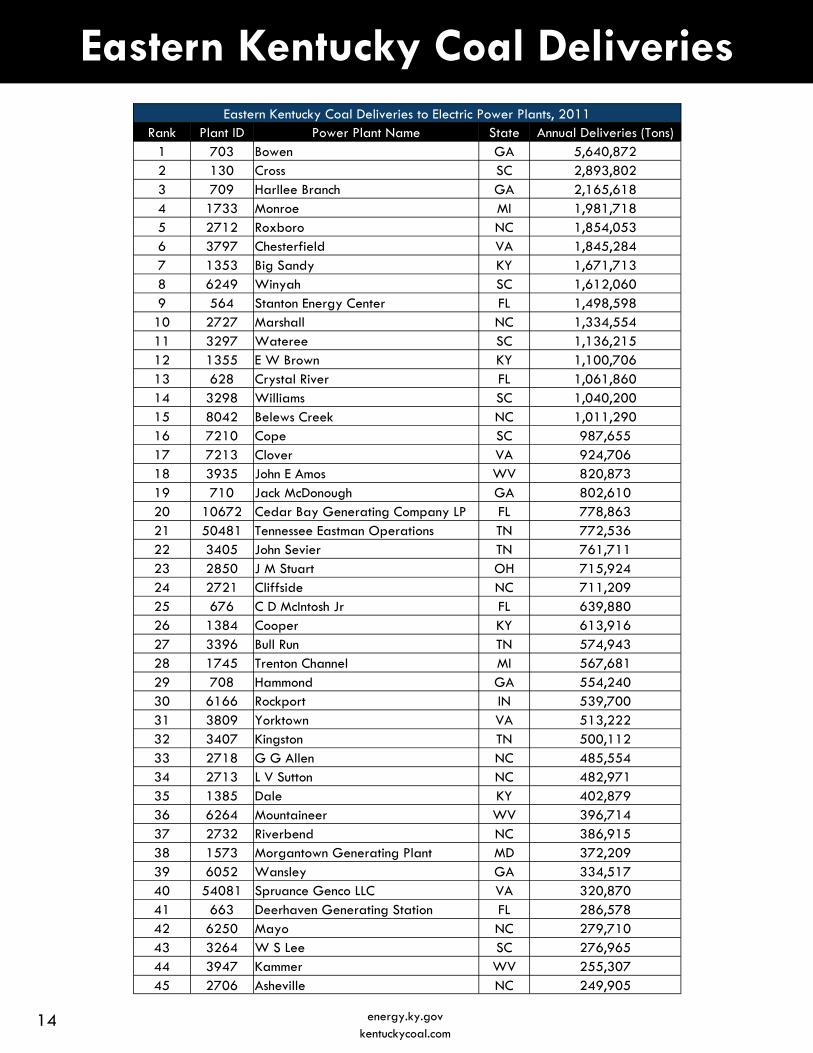
Eastern Kentucky Coal Deliveries Eastern Kentucky Coal Deliveries to Electric Power Plants, 2011
Rank Plant ID Power Plant Name State Annual Deliveries (Tons) 1 703 Bowen GA 5,640,872 2 130 Cross SC 2,893,802 3 709 Harllee Branch GA 2,165,618 4 1733 Monroe MI 1,981,718 5 2712 Roxboro NC 1,854,053 6 3797 Chesterfield VA 1,845,284 7 1353 Big Sandy KY 1,671,713 8 6249 Winyah SC 1,612,060 9 564 Stanton Energy Center FL 1,498,598
10 2727 Marshall NC 1,334,554 11 3297 Wateree SC 1,136,215 12 1355 E W Brown KY 1,100,706 13 628 Crystal River FL 1,061,860 14 3298 Williams SC 1,040,200 15 8042 Belews Creek NC 1,011,290 16 7210 Cope SC 987,655 17 7213 Clover VA 924,706 18 3935 John E Amos WV 820,873 19 710 Jack McDonough GA 802,610 20 10672 Cedar Bay Generating Company LP FL 778,863 21 50481 Tennessee Eastman Operations TN 772,536 22 3405 John Sevier TN 761,711 23 2850 J M Stuart OH 715,924 24 2721 Cliffside NC 711,209 25 676 C D McIntosh Jr FL 639,880 26 1384 Cooper KY 613,916 27 3396 Bull Run TN 574,943 28 1745 Trenton Channel MI 567,681 29 708 Hammond GA 554,240 30 6166 Rockport IN 539,700 31 3809 Yorktown VA 513,222 32 3407 Kingston TN 500,112 33 2718 G G Allen NC 485,554 34 2713 L V Sutton NC 482,971 35 1385 Dale KY 402,879 36 6264 Mountaineer WV 396,714 37 2732 Riverbend NC 386,915 38 1573 Morgantown Generating Plant MD 372,209 39 6052 Wansley GA 334,517 40 54081 Spruance Genco LLC VA 320,870 41 663 Deerhaven Generating Station FL 286,578 42 6250 Mayo NC 279,710 43 3264 W S Lee SC 276,965 44 3947 Kammer WV 255,307 45 2706 Asheville NC 249,905
14 energy.ky.gov kentuckycoal.com
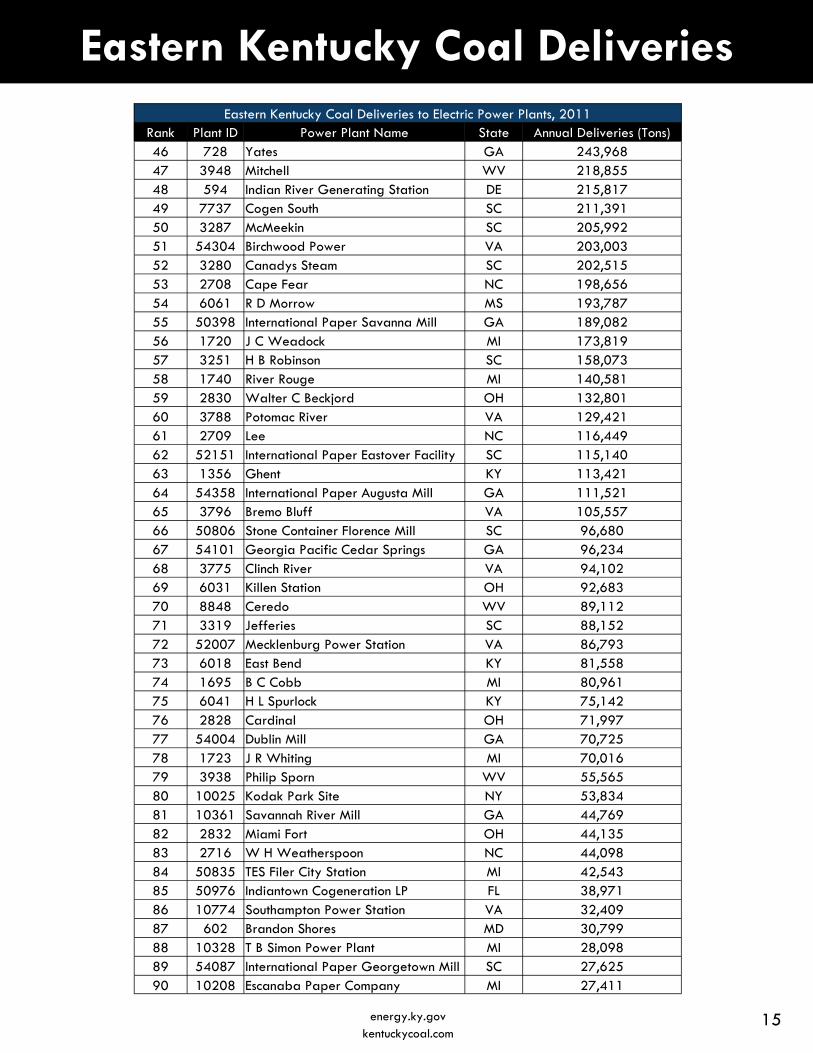
Eastern Kentucky Coal Deliveries Eastern Kentucky Coal Deliveries to Electric Power Plants, 2011
Rank Plant ID Power Plant Name State Annual Deliveries (Tons) 46 728 Yates GA 243,968 47 3948 Mitchell WV 218,855 48 594 Indian River Generating Station DE 215,817 49 7737 Cogen South SC 211,391 50 3287 McMeekin SC 205,992 51 54304 Birchwood Power VA 203,003 52 3280 Canadys Steam SC 202,515 53 2708 Cape Fear NC 198,656 54 6061 R D Morrow MS 193,787 55 50398 International Paper Savanna Mill GA 189,082 56 1720 J C Weadock MI 173,819 57 3251 H B Robinson SC 158,073 58 1740 River Rouge MI 140,581 59 2830 Walter C Beckjord OH 132,801 60 3788 Potomac River VA 129,421 61 2709 Lee NC 116,449 62 52151 International Paper Eastover Facility SC 115,140 63 1356 Ghent KY 113,421 64 54358 International Paper Augusta Mill GA 111,521 65 3796 Bremo Bluff VA 105,557 66 50806 Stone Container Florence Mill SC 96,680 67 54101 Georgia Pacific Cedar Springs GA 96,234 68 3775 Clinch River VA 94,102 69 6031 Killen Station OH 92,683 70 8848 Ceredo WV 89,112 71 3319 Jefferies SC 88,152 72 52007 Mecklenburg Power Station VA 86,793 73 6018 East Bend KY 81,558 74 1695 B C Cobb MI 80,961 75 6041 H L Spurlock KY 75,142 76 2828 Cardinal OH 71,997 77 54004 Dublin Mill GA 70,725 78 1723 J R Whiting MI 70,016 79 3938 Philip Sporn WV 55,565 80 10025 Kodak Park Site NY 53,834 81 10361 Savannah River Mill GA 44,769 82 2832 Miami Fort OH 44,135 83 2716 W H Weatherspoon NC 44,098 84 50835 TES Filer City Station MI 42,543 85 50976 Indiantown Cogeneration LP FL 38,971 86 10774 Southampton Power Station VA 32,409 87 602 Brandon Shores MD 30,799 88 10328 T B Simon Power Plant MI 28,098 89 54087 International Paper Georgetown Mill SC 27,625 90 10208 Escanaba Paper Company MI 27,411
15 energy.ky.gov kentuckycoal.com
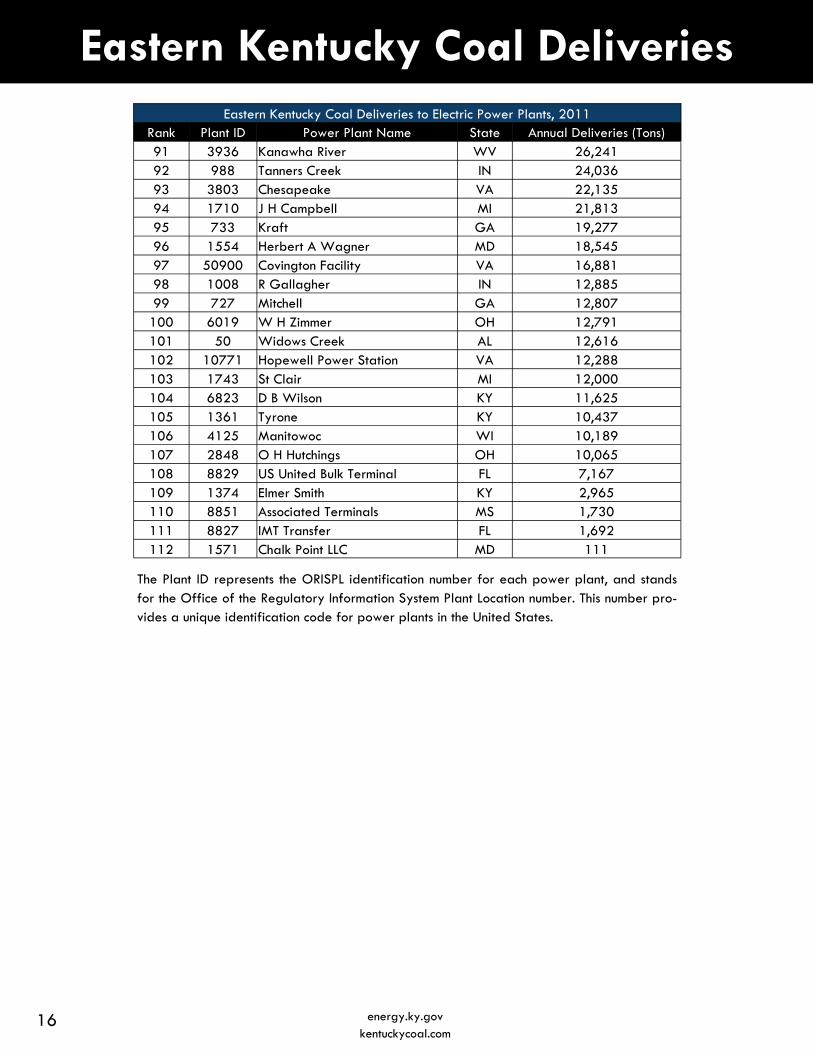
Eastern Kentucky Coal Deliveries Eastern Kentucky Coal Deliveries to Electric Power Plants, 2011
Rank Plant ID Power Plant Name State Annual Deliveries (Tons) 91 3936 Kanawha River WV 26,241 92 988 Tanners Creek IN 24,036 93 3803 Chesapeake VA 22,135 94 1710 J H Campbell MI 21,813 95 733 Kraft GA 19,277 96 1554 Herbert A Wagner MD 18,545 97 50900 Covington Facility VA 16,881 98 1008 R Gallagher IN 12,885 99 727 Mitchell GA 12,807
100 6019 W H Zimmer OH 12,791 101 50 Widows Creek AL 12,616 102 10771 Hopewell Power Station VA 12,288 103 1743 St Clair MI 12,000 104 6823 D B Wilson KY 11,625 105 1361 Tyrone KY 10,437 106 4125 Manitowoc WI 10,189 107 2848 O H Hutchings OH 10,065 108 8829 US United Bulk Terminal FL 7,167 109 1374 Elmer Smith KY 2,965 110 8851 Associated Terminals MS 1,730 111 8827 IMT Transfer FL 1,692 112 1571 Chalk Point LLC MD 111
The Plant ID represents the ORISPL identification number for each power plant, and stands for the Office of the Regulatory Information System Plant Location number. This number pro-vides a unique identification code for power plants in the United States.
16 energy.ky.gov kentuckycoal.com

Western Kentucky Coal Deliveries Western Kentucky Coal Deliveries to Electric Power Plants, 2011
Rank Plant ID Power Plant Name State Annual Deliveries (Tons) 1 1378 Paradise KY 4,297,619 2 1364 Mill Creek KY 3,839,085 3 1356 Ghent KY 3,261,454 4 136 Seminole FL 2,474,422 5 6071 Trimble County KY 2,370,779 6 50 Widows Creek AL 1,955,495 7 645 Big Bend FL 1,827,709 8 6041 H L Spurlock KY 1,598,579 9 1381 Kenneth C Coleman KY 1,506,539
10 6018 East Bend KY 1,375,831 11 3399 Cumberland TN 1,345,166 12 1374 Elmer Smith KY 1,235,539 13 8816 Davant Transfer FL 1,220,347 14 6639 R D Green KY 1,129,516 15 6823 D B Wilson KY 1,017,519 16 1363 Cane Run KY 889,840 17 2850 J M Stuart OH 831,562 18 8827 IMT Transfer FL 739,694 19 1382 HMP&L Station Two Henderson KY 717,054 20 6004 FirstEnergy Pleasants Power Station WV 683,043 21 8848 Ceredo WV 612,174 22 6031 Killen Station OH 529,930 23 8829 US United Bulk Terminal FL 442,525 24 2832 Miami Fort OH 433,737 25 6019 W H Zimmer OH 324,912 26 3181 FirstEnergy Mitchell Power Station PA 302,256 27 3407 Kingston TN 265,021 28 2830 Walter C Beckjord OH 244,369 29 3179 FirstEnergy Hatfields Ferry PA 220,492 30 6190 Brame Energy Center LA 164,953 31 6705 Warrick IN 160,280 32 8851 Associated Terminals MS 92,839 33 667 Northside Generating Station FL 87,357 34 3943 FirstEnergy Fort Martin Power Station WV 67,837 35 983 Clifty Creek IN 58,226 36 6094 FirstEnergy Bruce Mansfield PA 58,158 37 3178 FirstEnergy Armstrong Power Station PA 44,210 38 56 Charles R Lowman AL 43,348 39 1008 R Gallagher IN 32,694 40 2866 FirstEnergy W H Sammis OH 28,985 41 564 Stanton Energy Center FL 22,345 42 676 C D McIntosh Jr FL 12,778 43 3406 Johnsonville TN 1,408 44 3149 PPL Montour PA 195 45 10865 Archer Daniels Midland Decatur IL 149
17 energy.ky.gov kentuckycoal.com
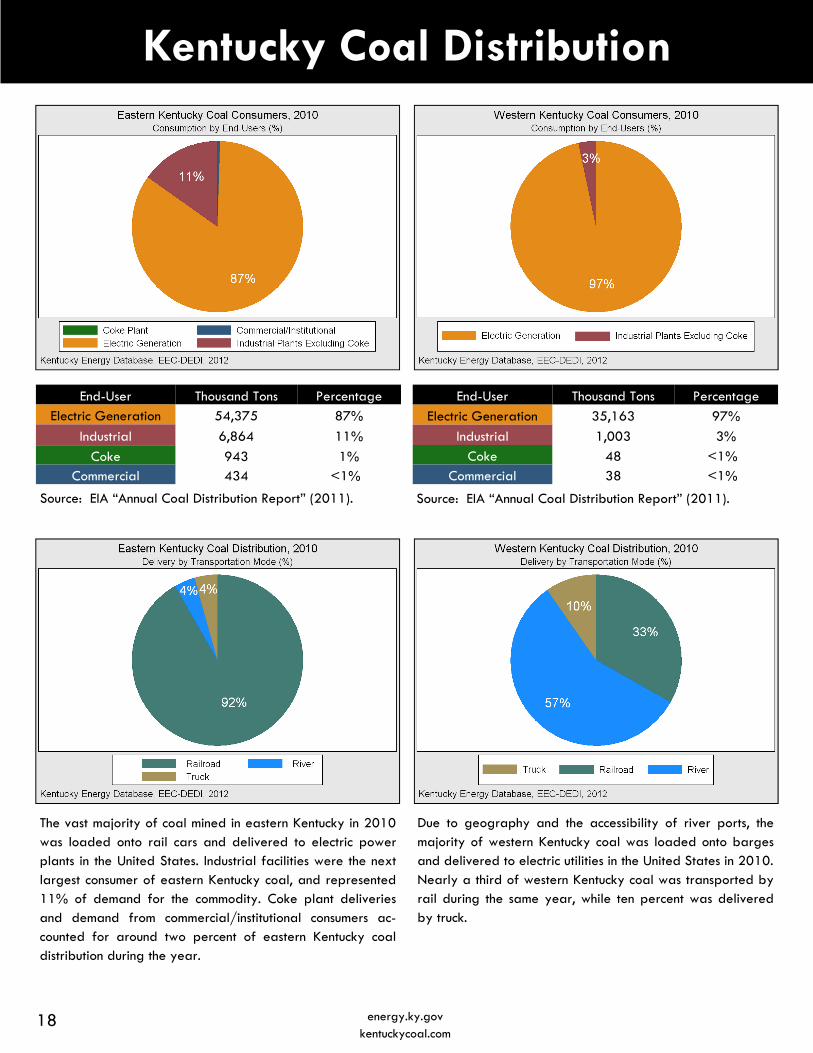
End-User Thousand Tons Percentage
Electric Generation 35,163 97%
Industrial 1,003 3%
Coke 48 <1% Commercial 38 <1%
End-User Thousand Tons Percentage Electric Generation 54,375 87%
Industrial 6,864 11%
Coke 943 1% Commercial 434 <1%
The vast majority of coal mined in eastern Kentucky in 2010 was loaded onto rail cars and delivered to electric power plants in the United States. Industrial facilities were the next largest consumer of eastern Kentucky coal, and represented 11% of demand for the commodity. Coke plant deliveries and demand from commercial/institutional consumers ac-counted for around two percent of eastern Kentucky coal distribution during the year.
Due to geography and the accessibility of river ports, the majority of western Kentucky coal was loaded onto barges and delivered to electric utilities in the United States in 2010. Nearly a third of western Kentucky coal was transported by rail during the same year, while ten percent was delivered by truck.
Kentucky Coal Distribution
Source: EIA “Annual Coal Distribution Report” (2011). Source: EIA “Annual Coal Distribution Report” (2011).
18 energy.ky.gov kentuckycoal.com

Region Mine Type Tons/Hour
Western Kentucky All* 3.74
Western Kentucky Underground 3.44
Western Kentucky Surface 5.48
Total Labor Hours Underground Surface
10,897,110 9,280,072 1,617,038
Region Mine Type Tons/Hour Eastern Kentucky All* 2.01
Eastern Kentucky Underground 1.52
Eastern Kentucky Surface 2.96
Total Labor Hours Underground Surface
32,565,740 21,497,030 11,068,710
Coal mining productivity in both coal fields of Kentucky has been falling over the last decade. Yet, the decline in eastern Kentucky productivity during this time has been substantial. At an average of 2.01 tons per labor hour in 2011, produc-tivity in the Eastern Coal Field is down 46% from the year 2000. Moreover, productivity for both surface mines and underground mines in eastern Kentucky has been falling con-sistently over the last eleven years. However, surface mines in eastern Kentucky remained the most efficient form of coal mining in the region, nearly twice as productive as under-ground mines in 2011.
At 3.74 tons per labor hour in 2011, average coal mining productivity in western Kentucky was 86% higher than east-ern Kentucky. Interestingly, while surface mine productivity was 5.48 tons per hour in 2011, surface mine production accounted for only 22% of regional production; meaning, western Kentucky productivity was most influenced by under-ground operations. Additionally, though overall coal mine productivity in western Kentucky has fallen by 15% since 2000, productivity in the coal field has held relatively stable over the past 5 years.
Coal Mine Productivity
Source: U.S. Department of Labor, Mine Safety and Health Administration, “Quarterly Mine Employment and Coal Production Report” (MSHA Form 7000-02). Coal mine productivity is defined as total coal production (tons) divided by total employee labor hours. Total labor hours include the combination by mine site of direct miner hours, preparation plant hours, and on-site office employee hours. *Productivity values in the tables above represent the summation of production divided by the summation of labor hours, separated by region and by mine type. As of publication, processed data for productivity as displayed above was only available for the years 2000-2011. Historical and current reporting on mine productivity state-wide and nationwide indicates a trend of declining productivity across all coal fields in the United States since the year 2000, further illustrated by eastern Kentucky and western Kentucky.
19 energy.ky.gov kentuckycoal.com
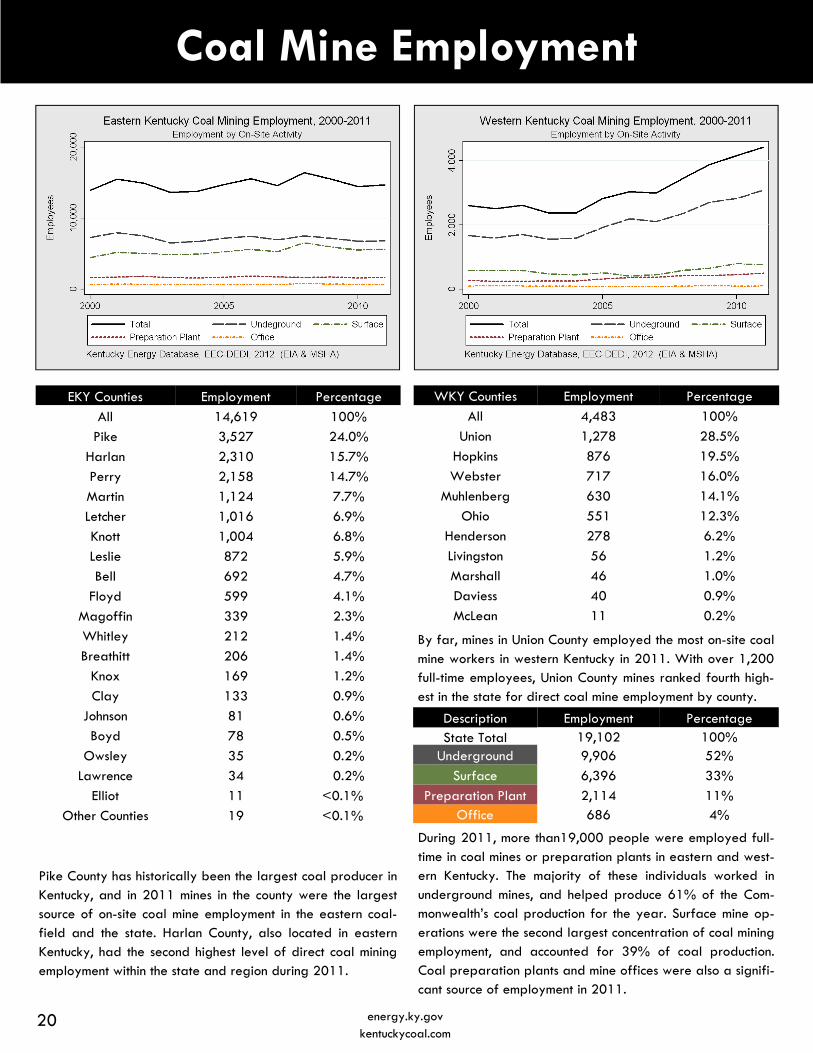
During 2011, more than19,000 people were employed full-time in coal mines or preparation plants in eastern and west-ern Kentucky. The majority of these individuals worked in underground mines, and helped produce 61% of the Com-monwealth’s coal production for the year. Surface mine op-erations were the second largest concentration of coal mining employment, and accounted for 39% of coal production. Coal preparation plants and mine offices were also a signifi-cant source of employment in 2011.
Coal Mine Employment
EKY Counties Employment Percentage
All 14,619 100%
Pike 3,527 24.0%
Harlan 2,310 15.7%
Perry 2,158 14.7%
Martin 1,124 7.7%
Letcher 1,016 6.9%
Knott 1,004 6.8%
Leslie 872 5.9%
Bell 692 4.7%
Floyd 599 4.1%
Magoffin 339 2.3%
Whitley 212 1.4%
Breathitt 206 1.4%
Knox 169 1.2%
Clay 133 0.9%
Johnson 81 0.6%
Boyd 78 0.5%
Owsley 35 0.2%
Lawrence 34 0.2%
Elliot 11 <0.1%
Other Counties 19 <0.1%
By far, mines in Union County employed the most on-site coal mine workers in western Kentucky in 2011. With over 1,200 full-time employees, Union County mines ranked fourth high-est in the state for direct coal mine employment by county.
Pike County has historically been the largest coal producer in Kentucky, and in 2011 mines in the county were the largest source of on-site coal mine employment in the eastern coal-field and the state. Harlan County, also located in eastern Kentucky, had the second highest level of direct coal mining employment within the state and region during 2011.
WKY Counties Employment Percentage
All 4,483 100%
Union 1,278 28.5%
Hopkins 876 19.5%
Webster 717 16.0%
Muhlenberg 630 14.1%
Ohio 551 12.3%
Henderson 278 6.2%
Livingston 56 1.2%
Marshall 46 1.0%
Daviess 40 0.9%
McLean 11 0.2%
Description Employment Percentage State Total 19,102 100%
Underground 9,906 52%
Surface 6,396 33%
Preparation Plant 2,114 11% Office 686 4%
20 energy.ky.gov kentuckycoal.com
Employment (2011)
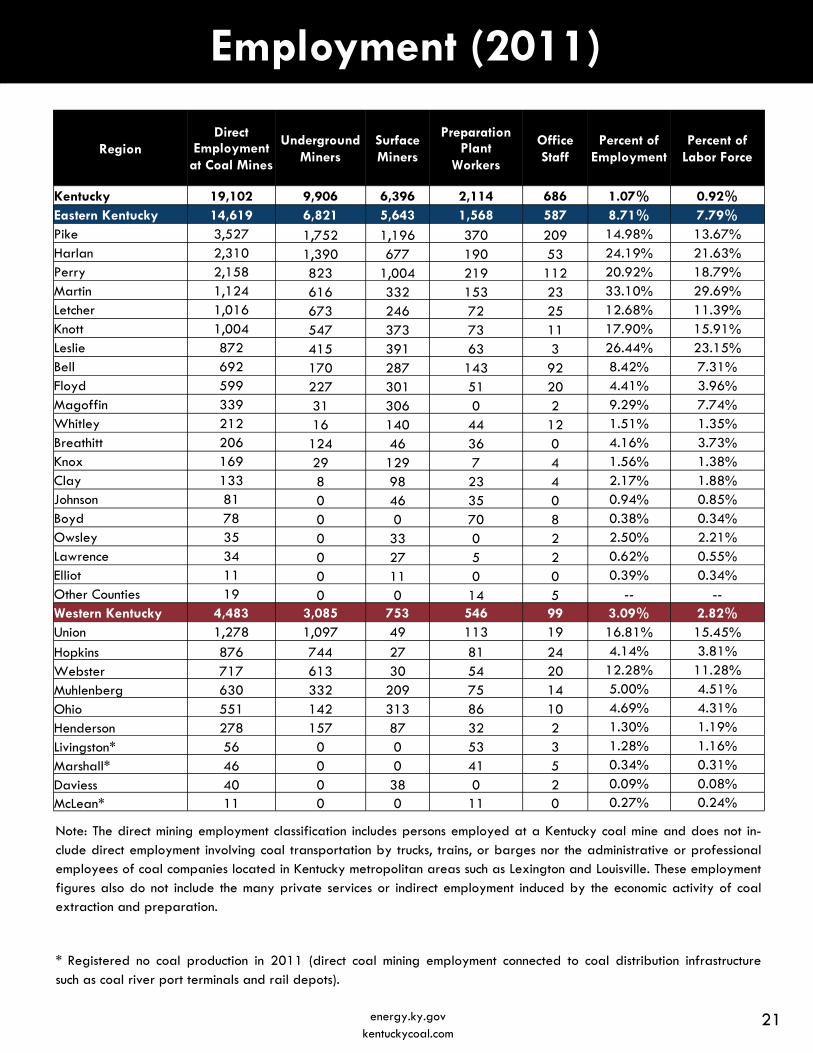
Note: The direct mining employment classification includes persons employed at a Kentucky coal mine and does not in-clude direct employment involving coal transportation by trucks, trains, or barges nor the administrative or professional employees of coal companies located in Kentucky metropolitan areas such as Lexington and Louisville. These employment figures also do not include the many private services or indirect employment induced by the economic activity of coal extraction and preparation.
* Registered no coal production in 2011 (direct coal mining employment connected to coal distribution infrastructure such as coal river port terminals and rail depots).
Region Direct
Employment at Coal Mines
Underground Miners
Surface Miners
Preparation Plant
Workers
Office Staff
Percent of Employment
Percent of Labor Force
Kentucky 19,102 9,906 6,396 2,114 686 1.07% 0.92% Eastern Kentucky 14,619 6,821 5,643 1,568 587 8.71% 7.79% Pike 3,527 1,752 1,196 370 209 14.98% 13.67% Harlan 2,310 1,390 677 190 53 24.19% 21.63% Perry 2,158 823 1,004 219 112 20.92% 18.79% Martin 1,124 616 332 153 23 33.10% 29.69% Letcher 1,016 673 246 72 25 12.68% 11.39% Knott 1,004 547 373 73 11 17.90% 15.91% Leslie 872 415 391 63 3 26.44% 23.15% Bell 692 170 287 143 92 8.42% 7.31% Floyd 599 227 301 51 20 4.41% 3.96% Magoffin 339 31 306 0 2 9.29% 7.74% Whitley 212 16 140 44 12 1.51% 1.35% Breathitt 206 124 46 36 0 4.16% 3.73% Knox 169 29 129 7 4 1.56% 1.38% Clay 133 8 98 23 4 2.17% 1.88% Johnson 81 0 46 35 0 0.94% 0.85% Boyd 78 0 0 70 8 0.38% 0.34% Owsley 35 0 33 0 2 2.50% 2.21% Lawrence 34 0 27 5 2 0.62% 0.55% Elliot 11 0 11 0 0 0.39% 0.34% Other Counties 19 0 0 14 5 -- -- Western Kentucky 4,483 3,085 753 546 99 3.09% 2.82% Union 1,278 1,097 49 113 19 16.81% 15.45%
Hopkins 876 744 27 81 24 4.14% 3.81%
Webster 717 613 30 54 20 12.28% 11.28%
Muhlenberg 630 332 209 75 14 5.00% 4.51%
Ohio 551 142 313 86 10 4.69% 4.31%
Henderson 278 157 87 32 2 1.30% 1.19%
Livingston* 56 0 0 53 3 1.28% 1.16%
Marshall* 46 0 0 41 5 0.34% 0.31%
Daviess 40 0 38 0 2 0.09% 0.08% McLean* 11 0 0 11 0 0.27% 0.24%
21 energy.ky.gov kentuckycoal.com
Employment
Direct Benefits
The Kentucky coal industry provides direct benefits in terms of coal severance revenue, jobs, and wages to miners. These direct benefits are as follows:
Employed 18,850 miners in 2009, with 3,703 in Western Kentucky and 15,147 in Eastern Kentucky.
Paid wages of $1.473 billion in 2009, resulting in an average weekly wage of $1,214 per miner.
Produced over 107 million tons of coal with an approximate value of $6.3 billion dollars.
Severance taxes on FY 2009-2010 coal production were $241 million with a total of $270 million being collected (includes some previous year assessments).
$97.3 million in coal severance tax receipts were returned to coal-producing counties for infrastructure improvements and economic development projects.
$16.9 million in unmined mineral taxes were collected in FY 2009-2010.
Induced Effects
In addition to indirect effects, induced effects also contribute to the economic impact of new spending in the coal industry in Kentucky. Induced effects occur when money that is received as income by employees and/or owners either at the di-rect or indirect level is spent on personal expenditures such as household goods and services.
Indirect Benefits
The coal industry provides many benefits to Kentucky in addition to the direct benefits mentioned above. Indirect benefits include new income flowing into the coal industry that is then re-spent creating a multiplier effect. Economic impact models trace the flow of these dollars for new spending in the economy. Economic impact models are not designed to calculate the impact for an existing industry. We can, however, gauge the industries that will receive the greatest impact for any new investment. Below are the top five types of industries that receive the greatest percentage of an indirect impact.
20% of indirect spending would be spent in industries defined as mining coal and support activities for mining. This is essentially intra-industry trade that does show up as new revenue.
15% would be spent in the transportation industry by rail or truck.
14% would be spent in professional services industries. These are typically industries such as architectural and indus-trial engineering, management companies, legal services, financial institutions and other industries that provide services that might not be offered in house.
9% would be spent in the petroleum industry, natural gas and electric power transmission.
9% would be spent in industries that sell or maintain commercial equipment and structures used to support the coal industry.
Source: Dr. Christopher Jepsen, Associate Director and Dr. Anna Stewart, Economic Analyst, University of Kentucky Gatton College of Business and Economics, Center for Business and Economic Research.
22 energy.ky.gov kentuckycoal.com
DEFINITION OF SEVERANCE
"Severing" or "severed" means the physical removal of the natural resource from the earth or waters of this state by any means; however, "severing" or "severed" shall not include the removal of natural gas from under-ground storage facilities into which the natural gas has been mechanically injected following its initial removal from the earth. (KRS 143A.010 (3)).
COAL SEVERANCE TAX CALCULATION
For the privilege of severing or processing natural resources in this state, a tax is hereby levied at the rate of four and one-half percent (4.5%) on natural gas and four and one-half percent (4.5%) on all other natural re-sources, such rates to apply to the gross value of the natural resource severed or processed except that no tax shall be imposed on the processing of ball clay. (KRS 143A.020 (1)).
Specifically for coal, this means that a tax of 4.5% is levied on the sale price of every ton of coal mined in Ken-tucky. For example, if a ton of coal mined in Kentucky sells for $50, then the coal severance tax revenue for the Commonwealth from this sale will be $2.25. (1 Ton X $50 X 0.045 = $2.25).
COAL SEVERANCE TAX REVENUE, PROGRAMS, & OUTLAYS
Severance tax revenue generated through the production of coal is distributed to several state budgetary pro-grams including the Kentucky General Fund, the Local Government Economic Assistance Fund (LGEAF), and the Local Government Economic Development Fund (LGEDF).
Coal Severance
23 energy.ky.gov kentuckycoal.com
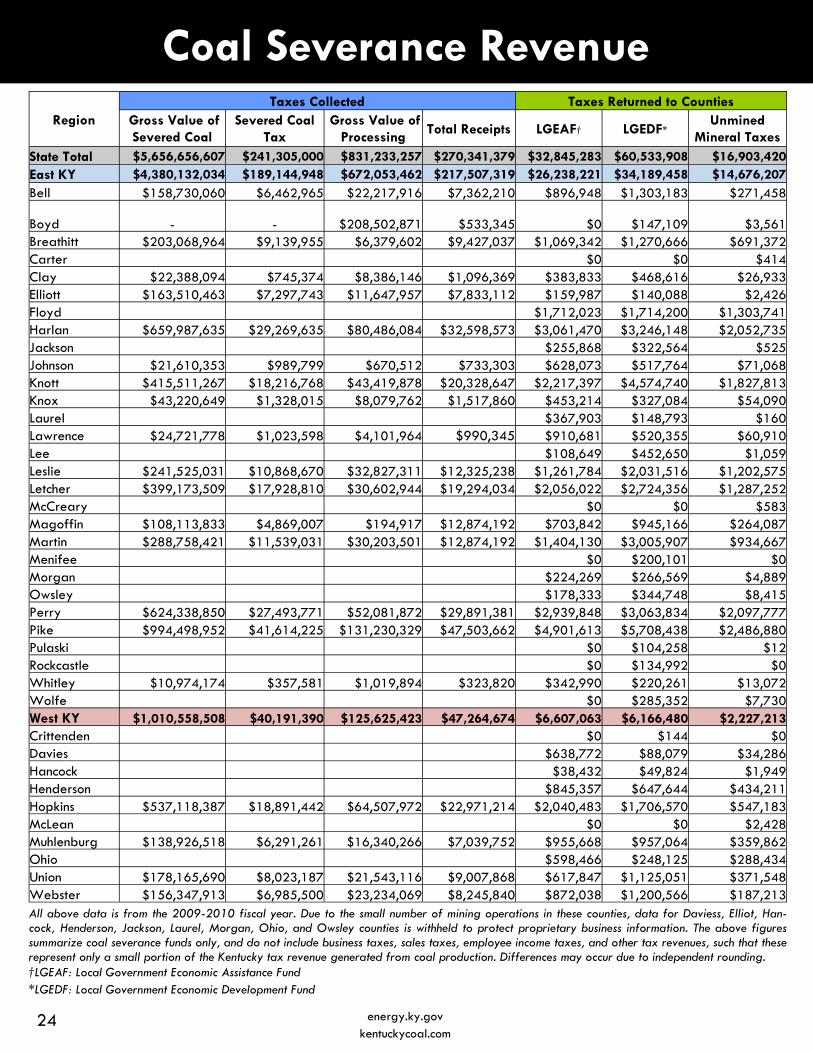
Coal Severance Revenue Region
Taxes Collected Taxes Returned to Counties Gross Value of Severed Coal
Severed Coal Tax
Gross Value of Processing
Total Receipts LGEAF† LGEDF* Unmined
Mineral Taxes State Total $5,656,656,607 $241,305,000 $831,233,257 $270,341,379 $32,845,283 $60,533,908 $16,903,420 East KY $4,380,132,034 $189,144,948 $672,053,462 $217,507,319 $26,238,221 $34,189,458 $14,676,207 Bell $158,730,060 $6,462,965 $22,217,916 $7,362,210 $896,948 $1,303,183 $271,458
Boyd -
- $208,502,871 $533,345 $0 $147,109 $3,561
Breathitt $203,068,964 $9,139,955 $6,379,602 $9,427,037 $1,069,342 $1,270,666 $691,372 Carter $0 $0 $414 Clay $22,388,094 $745,374 $8,386,146 $1,096,369 $383,833 $468,616 $26,933 Elliott $163,510,463 $7,297,743 $11,647,957 $7,833,112 $159,987 $140,088 $2,426 Floyd $1,712,023 $1,714,200 $1,303,741 Harlan $659,987,635 $29,269,635 $80,486,084 $32,598,573 $3,061,470 $3,246,148 $2,052,735 Jackson $255,868 $322,564 $525 Johnson $21,610,353 $989,799 $670,512 $733,303 $628,073 $517,764 $71,068 Knott $415,511,267 $18,216,768 $43,419,878 $20,328,647 $2,217,397 $4,574,740 $1,827,813 Knox $43,220,649 $1,328,015 $8,079,762 $1,517,860 $453,214 $327,084 $54,090 Laurel $367,903 $148,793 $160 Lawrence $24,721,778 $1,023,598 $4,101,964 $990,345 $910,681 $520,355 $60,910 Lee $108,649 $452,650 $1,059 Leslie $241,525,031 $10,868,670 $32,827,311 $12,325,238 $1,261,784 $2,031,516 $1,202,575 Letcher $399,173,509 $17,928,810 $30,602,944 $19,294,034 $2,056,022 $2,724,356 $1,287,252 McCreary $0 $0 $583 Magoffin $108,113,833 $4,869,007 $194,917 $12,874,192 $703,842 $945,166 $264,087 Martin $288,758,421 $11,539,031 $30,203,501 $12,874,192 $1,404,130 $3,005,907 $934,667 Menifee $0 $200,101 $0 Morgan $224,269 $266,569 $4,889 Owsley $178,333 $344,748 $8,415 Perry $624,338,850 $27,493,771 $52,081,872 $29,891,381 $2,939,848 $3,063,834 $2,097,777 Pike $994,498,952 $41,614,225 $131,230,329 $47,503,662 $4,901,613 $5,708,438 $2,486,880 Pulaski $0 $104,258 $12 Rockcastle $0 $134,992 $0 Whitley $10,974,174 $357,581 $1,019,894 $323,820 $342,990 $220,261 $13,072 Wolfe $0 $285,352 $7,730 West KY $1,010,558,508 $40,191,390 $125,625,423 $47,264,674 $6,607,063 $6,166,480 $2,227,213 Crittenden $0 $144 $0 Davies $638,772 $88,079 $34,286 Hancock $38,432 $49,824 $1,949 Henderson $845,357 $647,644 $434,211 Hopkins $537,118,387 $18,891,442 $64,507,972 $22,971,214 $2,040,483 $1,706,570 $547,183 McLean $0 $0 $2,428 Muhlenburg $138,926,518 $6,291,261 $16,340,266 $7,039,752 $955,668 $957,064 $359,862 Ohio $598,466 $248,125 $288,434 Union $178,165,690 $8,023,187 $21,543,116 $9,007,868 $617,847 $1,125,051 $371,548 Webster $156,347,913 $6,985,500 $23,234,069 $8,245,840 $872,038 $1,200,566 $187,213 All above data is from the 2009-2010 fiscal year. Due to the small number of mining operations in these counties, data for Daviess, Elliot, Han-cock, Henderson, Jackson, Laurel, Morgan, Ohio, and Owsley counties is withheld to protect proprietary business information. The above figures summarize coal severance funds only, and do not include business taxes, sales taxes, employee income taxes, and other tax revenues, such that these represent only a small portion of the Kentucky tax revenue generated from coal production. Differences may occur due to independent rounding. †LGEAF: Local Government Economic Assistance Fund *LGEDF: Local Government Economic Development Fund
24 energy.ky.gov kentuckycoal.com
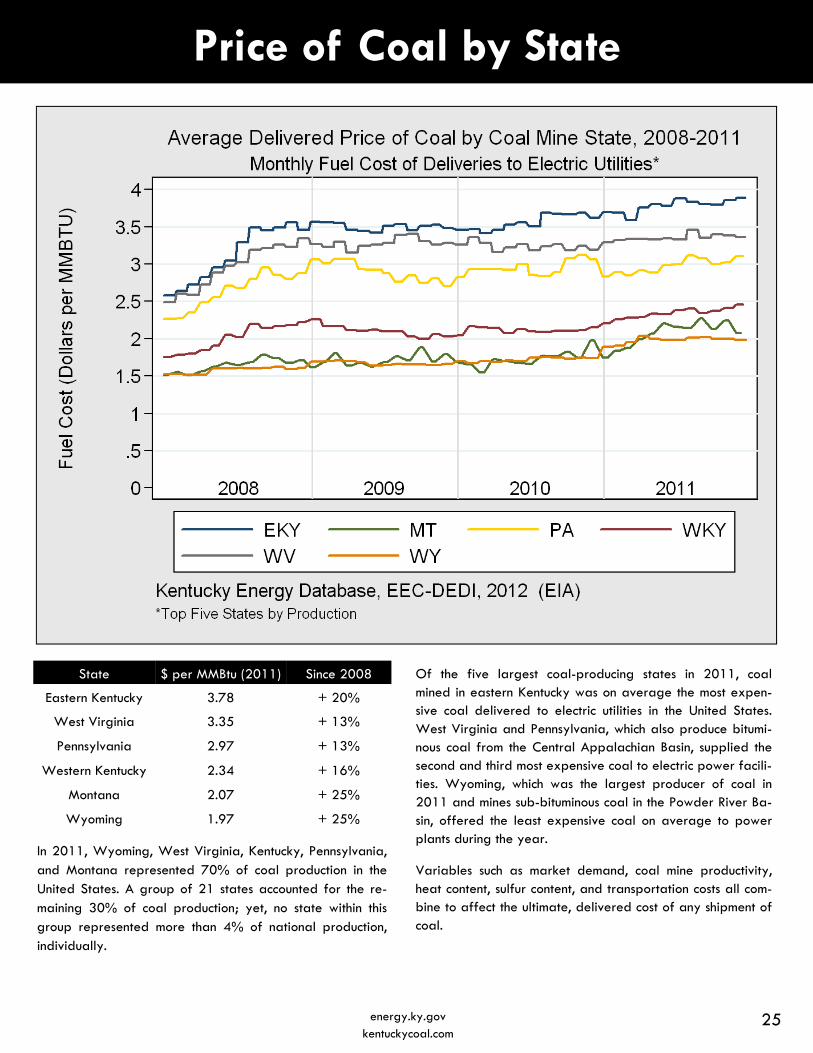
Price of Coal by State
Of the five largest coal-producing states in 2011, coal mined in eastern Kentucky was on average the most expen-sive coal delivered to electric utilities in the United States. West Virginia and Pennsylvania, which also produce bitumi-nous coal from the Central Appalachian Basin, supplied the second and third most expensive coal to electric power facili-ties. Wyoming, which was the largest producer of coal in 2011 and mines sub-bituminous coal in the Powder River Ba-sin, offered the least expensive coal on average to power plants during the year.
Variables such as market demand, coal mine productivity, heat content, sulfur content, and transportation costs all com-bine to affect the ultimate, delivered cost of any shipment of coal.
State $ per MMBtu (2011) Since 2008
Eastern Kentucky 3.78 + 20%
West Virginia 3.35 + 13%
Pennsylvania 2.97 + 13%
Western Kentucky 2.34 + 16%
Montana 2.07 + 25%
Wyoming 1.97 + 25%
In 2011, Wyoming, West Virginia, Kentucky, Pennsylvania, and Montana represented 70% of coal production in the United States. A group of 21 states accounted for the re-maining 30% of coal production; yet, no state within this group represented more than 4% of national production, individually.
25 energy.ky.gov kentuckycoal.com
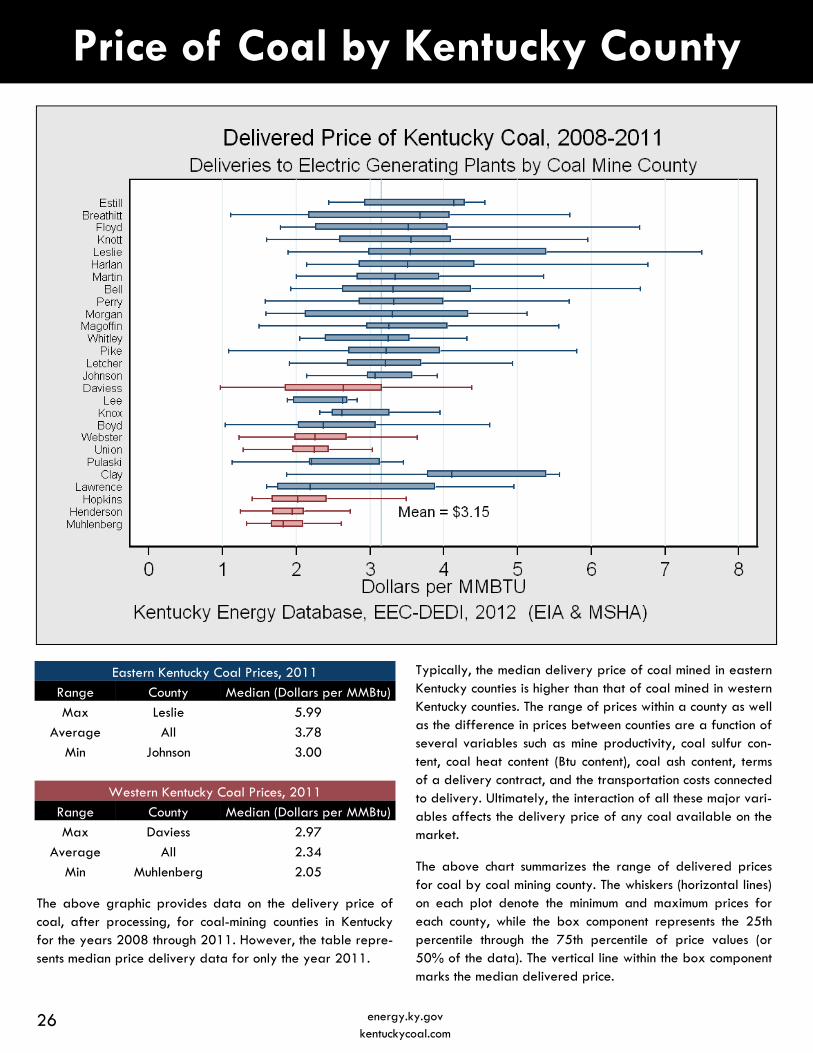
Price of Coal by Kentucky County
Typically, the median delivery price of coal mined in eastern Kentucky counties is higher than that of coal mined in western Kentucky counties. The range of prices within a county as well as the difference in prices between counties are a function of several variables such as mine productivity, coal sulfur con-tent, coal heat content (Btu content), coal ash content, terms of a delivery contract, and the transportation costs connected to delivery. Ultimately, the interaction of all these major vari-ables affects the delivery price of any coal available on the market.
The above chart summarizes the range of delivered prices for coal by coal mining county. The whiskers (horizontal lines) on each plot denote the minimum and maximum prices for each county, while the box component represents the 25th percentile through the 75th percentile of price values (or 50% of the data). The vertical line within the box component marks the median delivered price.
Eastern Kentucky Coal Prices, 2011
Range County Median (Dollars per MMBtu)
Max Leslie 5.99
Average All 3.78
Min Johnson 3.00
Western Kentucky Coal Prices, 2011
Range County Median (Dollars per MMBtu)
Max Daviess 2.97
Average All 2.34
Min Muhlenberg 2.05
The above graphic provides data on the delivery price of coal, after processing, for coal-mining counties in Kentucky for the years 2008 through 2011. However, the table repre-sents median price delivery data for only the year 2011.
26 energy.ky.gov kentuckycoal.com
27 energy.ky.gov kentuckycoal.com
U.S. Market Steam Coal Properties
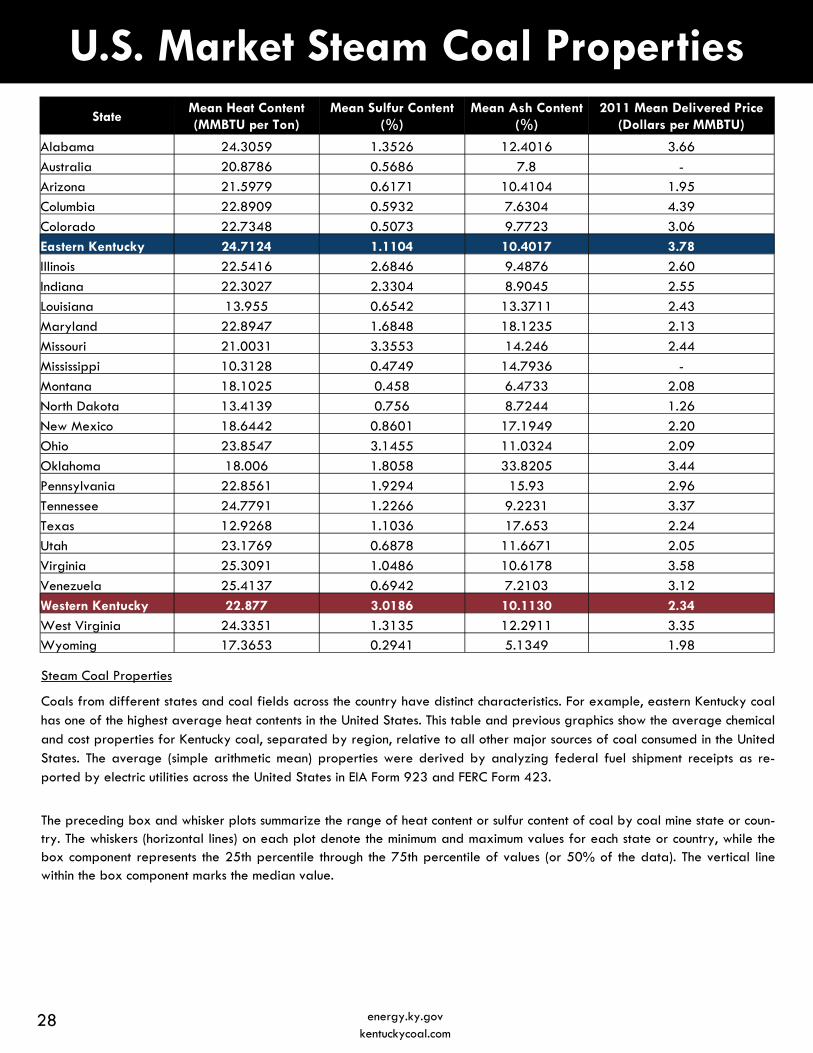
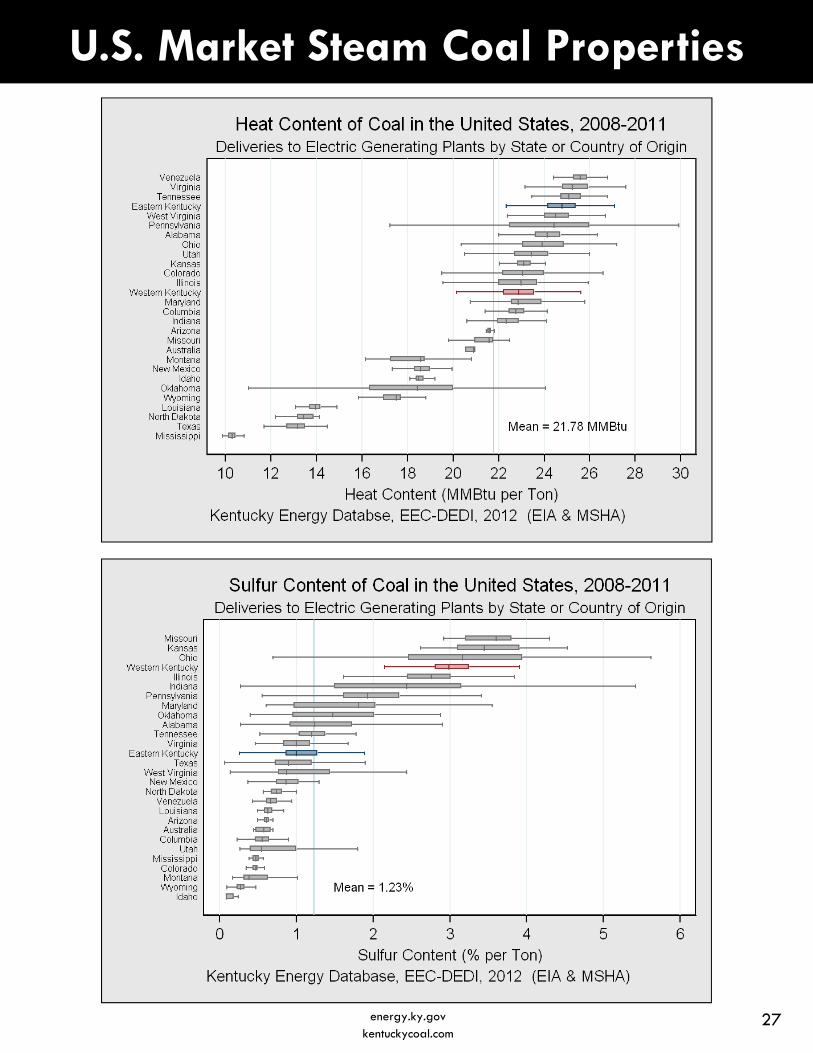
Steam Coal Properties
Coals from different states and coal fields across the country have distinct characteristics. For example, eastern Kentucky coal has one of the highest average heat contents in the United States. This table and previous graphics show the average chemical and cost properties for Kentucky coal, separated by region, relative to all other major sources of coal consumed in the United States. The average (simple arithmetic mean) properties were derived by analyzing federal fuel shipment receipts as re-ported by electric utilities across the United States in EIA Form 923 and FERC Form 423.
The preceding box and whisker plots summarize the range of heat content or sulfur content of coal by coal mine state or coun-try. The whiskers (horizontal lines) on each plot denote the minimum and maximum values for each state or country, while the box component represents the 25th percentile through the 75th percentile of values (or 50% of the data). The vertical line within the box component marks the median value.
U.S. Market Steam Coal Properties State
Mean Heat Content (MMBTU per Ton)
Mean Sulfur Content (%)
Mean Ash Content (%)
2011 Mean Delivered Price (Dollars per MMBTU)
Alabama 24.3059 1.3526 12.4016 3.66
Australia 20.8786 0.5686 7.8 -
Arizona 21.5979 0.6171 10.4104 1.95
Columbia 22.8909 0.5932 7.6304 4.39
Colorado 22.7348 0.5073 9.7723 3.06
Eastern Kentucky 24.7124 1.1104 10.4017 3.78
Illinois 22.5416 2.6846 9.4876 2.60
Indiana 22.3027 2.3304 8.9045 2.55
Louisiana 13.955 0.6542 13.3711 2.43
Maryland 22.8947 1.6848 18.1235 2.13
Missouri 21.0031 3.3553 14.246 2.44
Mississippi 10.3128 0.4749 14.7936 -
Montana 18.1025 0.458 6.4733 2.08
North Dakota 13.4139 0.756 8.7244 1.26
New Mexico 18.6442 0.8601 17.1949 2.20
Ohio 23.8547 3.1455 11.0324 2.09
Oklahoma 18.006 1.8058 33.8205 3.44
Pennsylvania 22.8561 1.9294 15.93 2.96
Tennessee 24.7791 1.2266 9.2231 3.37
Texas 12.9268 1.1036 17.653 2.24
Utah 23.1769 0.6878 11.6671 2.05
Virginia 25.3091 1.0486 10.6178 3.58
Venezuela 25.4137 0.6942 7.2103 3.12
Western Kentucky 22.877 3.0186 10.1130 2.34
West Virginia 24.3351 1.3135 12.2911 3.35 Wyoming 17.3653 0.2941 5.1349 1.98
28 energy.ky.gov kentuckycoal.com
Kentucky Steam Coal Properties
29 energy.ky.gov kentuckycoal.com
Region Mean Heat Content (MMBTU per Ton)
Mean Sulfur Content (%)
Mean Ash Content (%)
2011 Mean Delivered Price (Dollars per MMBTU)
Kentucky 24.3037 1.5474 10.3356 3.32
Eastern Kentucky 24.7124 1.1104 10.4017 3.78
Bell 25.1871 1.3658 9.4795 3.62 Boyd 23.5447 1.1745 12.3378 2.92 Breathitt 24.2176 1.1079 10.9979 3.79 Clay 24.3283 1.1964 11.7361 4.42 Estill 24.1900 1.6440 11.0400 3.83 Floyd 24.5063 0.9395 10.4118 3.68 Harlan 25.1087 1.1091 9.9704 4.34 Johnson 24.1035 0.9441 9.8148 2.96 Knott 24.9953 1.3000 10.1368 3.81 Knox 24.4871 2.1109 10.5727 3.54 Lawrence 24.0800 2.8200 12.9167 Insufficient Data Leslie 24.8295 1.1603 10.3333 5.06 Letcher 25.5353 1.5734 8.7143 3.46 Magoffin 24.1275 1.0703 10.1070 2.88 Martin 24.8589 1.1632 9.1256 3.66 Perry 24.7278 1.1207 10.3056 3.94
Pike 24.8386 1.0760 10.3810 3.57
Whitley 24.9693 1.2037 10.3947 3.76 Western Kentucky 22.8877 3.0186 10.1130 2.34
Daviess 21.9493 3.2818 10.9297 2.69
Henderson 22.1445 3.0388 9.8159 2.08
Hopkins 23.7770 3.1621 9.8794 2.68
Marshall 22.3875 1.1950 8.2429 3.59
Muhlenberg 22.0557 3.1021 12.0279 2.12
Ohio 22.4310 3.0359 10.0066 2.07
Union 23.2165 2.8577 8.7395 2.44 Webster 23.7710 2.7788 9.4972 2.53
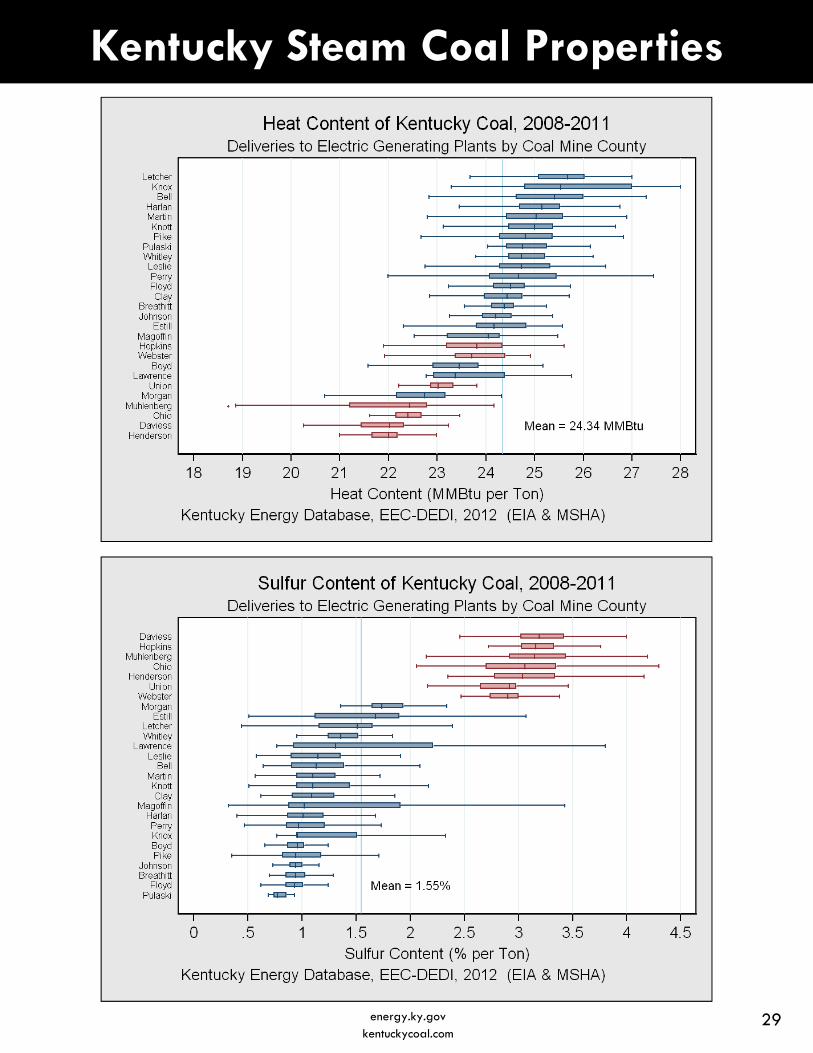
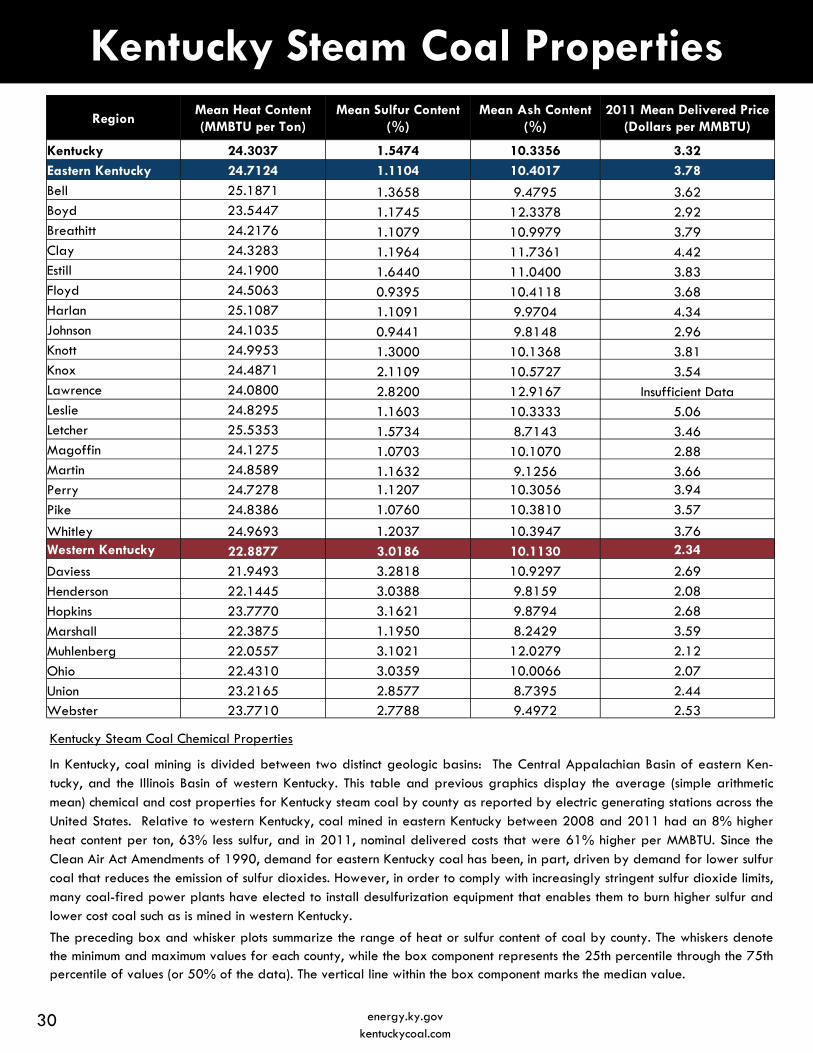
Kentucky Steam Coal Chemical Properties
In Kentucky, coal mining is divided between two distinct geologic basins: The Central Appalachian Basin of eastern Ken-tucky, and the Illinois Basin of western Kentucky. This table and previous graphics display the average (simple arithmetic mean) chemical and cost properties for Kentucky steam coal by county as reported by electric generating stations across the United States. Relative to western Kentucky, coal mined in eastern Kentucky between 2008 and 2011 had an 8% higher heat content per ton, 63% less sulfur, and in 2011, nominal delivered costs that were 61% higher per MMBTU. Since the Clean Air Act Amendments of 1990, demand for eastern Kentucky coal has been, in part, driven by demand for lower sulfur coal that reduces the emission of sulfur dioxides. However, in order to comply with increasingly stringent sulfur dioxide limits, many coal-fired power plants have elected to install desulfurization equipment that enables them to burn higher sulfur and lower cost coal such as is mined in western Kentucky.
The preceding box and whisker plots summarize the range of heat or sulfur content of coal by county. The whiskers denote the minimum and maximum values for each county, while the box component represents the 25th percentile through the 75th percentile of values (or 50% of the data). The vertical line within the box component marks the median value.
Kentucky Steam Coal Properties
30 energy.ky.gov kentuckycoal.com
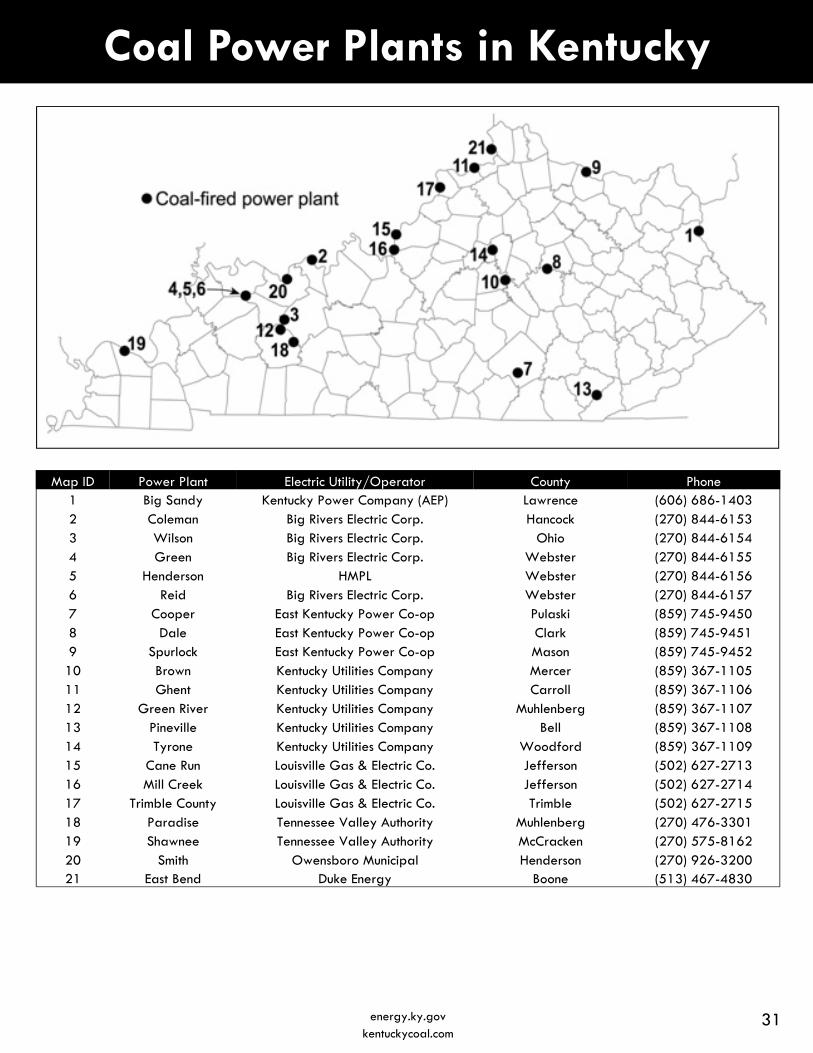
Coal Power Plants in Kentucky
Map ID Power Plant Electric Utility/Operator County Phone 1 Big Sandy Kentucky Power Company (AEP) Lawrence (606) 686-1403 2 Coleman Big Rivers Electric Corp. Hancock (270) 844-6153 3 Wilson Big Rivers Electric Corp. Ohio (270) 844-6154 4 Green Big Rivers Electric Corp. Webster (270) 844-6155 5 Henderson HMPL Webster (270) 844-6156 6 Reid Big Rivers Electric Corp. Webster (270) 844-6157 7 Cooper East Kentucky Power Co-op Pulaski (859) 745-9450 8 Dale East Kentucky Power Co-op Clark (859) 745-9451 9 Spurlock East Kentucky Power Co-op Mason (859) 745-9452 10 Brown Kentucky Utilities Company Mercer (859) 367-1105 11 Ghent Kentucky Utilities Company Carroll (859) 367-1106 12 Green River Kentucky Utilities Company Muhlenberg (859) 367-1107 13 Pineville Kentucky Utilities Company Bell (859) 367-1108 14 Tyrone Kentucky Utilities Company Woodford (859) 367-1109 15 Cane Run Louisville Gas & Electric Co. Jefferson (502) 627-2713 16 Mill Creek Louisville Gas & Electric Co. Jefferson (502) 627-2714 17 Trimble County Louisville Gas & Electric Co. Trimble (502) 627-2715 18 Paradise Tennessee Valley Authority Muhlenberg (270) 476-3301 19 Shawnee Tennessee Valley Authority McCracken (270) 575-8162 20 Smith Owensboro Municipal Henderson (270) 926-3200 21 East Bend Duke Energy Boone (513) 467-4830
31 energy.ky.gov kentuckycoal.com
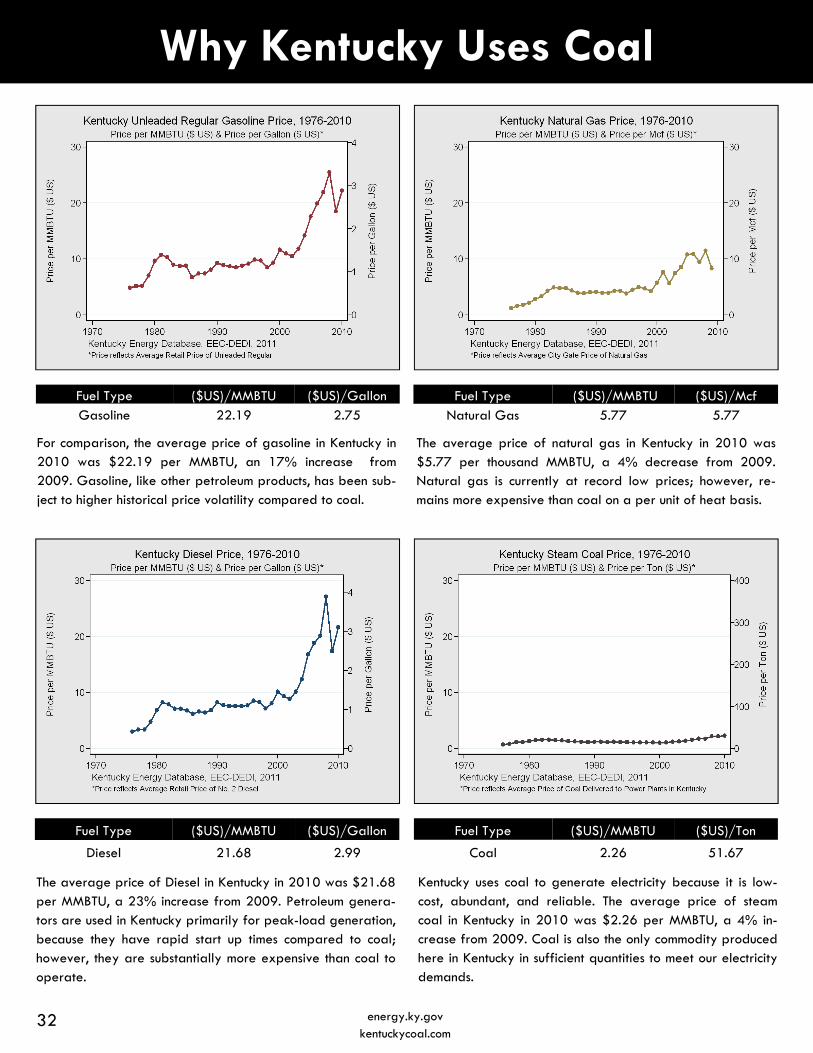
Fuel Type ($US)/MMBTU ($US)/Gallon Gasoline 22.19 2.75
Fuel Type (($US)/MMBTU ($US)/Mcf Natural Gas 5.77 5.77
Fuel Type ($US)/MMBTU ($US)/Ton
Coal 2.26 51.67
Fuel Type ($US)/MMBTU ($US)/Gallon
Diesel 21.68 2.99
For comparison, the average price of gasoline in Kentucky in 2010 was $22.19 per MMBTU, an 17% increase from 2009. Gasoline, like other petroleum products, has been sub-ject to higher historical price volatility compared to coal.
The average price of natural gas in Kentucky in 2010 was $5.77 per thousand MMBTU, a 4% decrease from 2009. Natural gas is currently at record low prices; however, re-mains more expensive than coal on a per unit of heat basis.
Kentucky uses coal to generate electricity because it is low-cost, abundant, and reliable. The average price of steam coal in Kentucky in 2010 was $2.26 per MMBTU, a 4% in-crease from 2009. Coal is also the only commodity produced here in Kentucky in sufficient quantities to meet our electricity demands.
The average price of Diesel in Kentucky in 2010 was $21.68 per MMBTU, a 23% increase from 2009. Petroleum genera-tors are used in Kentucky primarily for peak-load generation, because they have rapid start up times compared to coal; however, they are substantially more expensive than coal to operate.
Why Kentucky Uses Coal
32 energy.ky.gov kentuckycoal.com
Electricity Generation
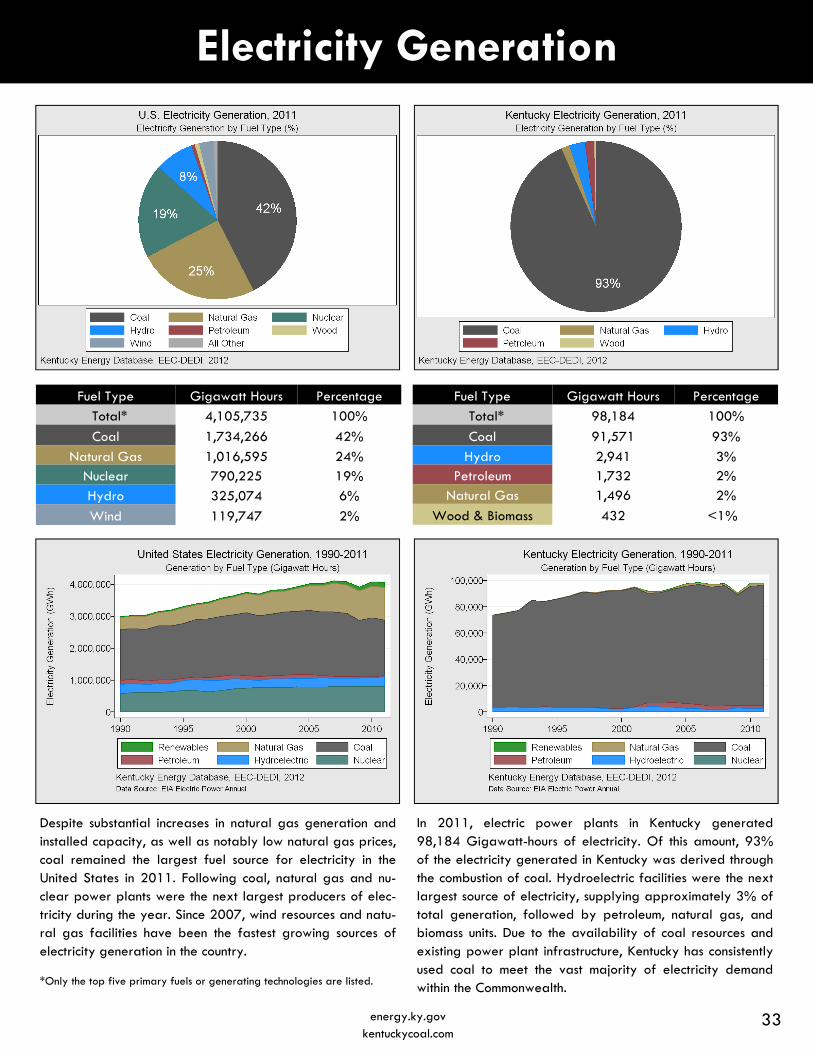
Fuel Type Gigawatt Hours Percentage
Total* 98,184 100%
Coal 91,571 93%
Hydro 2,941 3% Petroleum 1,732 2%
Natural Gas 1,496 2%
Wood & Biomass 432 <1%
In 2011, electric power plants in Kentucky generated 98,184 Gigawatt-hours of electricity. Of this amount, 93% of the electricity generated in Kentucky was derived through the combustion of coal. Hydroelectric facilities were the next largest source of electricity, supplying approximately 3% of total generation, followed by petroleum, natural gas, and biomass units. Due to the availability of coal resources and existing power plant infrastructure, Kentucky has consistently used coal to meet the vast majority of electricity demand within the Commonwealth.
Fuel Type Gigawatt Hours Percentage
Total* 4,105,735 100%
Coal 1,734,266 42%
Natural Gas 1,016,595 24% Nuclear 790,225 19% Hydro 325,074 6%
Wind 119,747 2%
Despite substantial increases in natural gas generation and installed capacity, as well as notably low natural gas prices, coal remained the largest fuel source for electricity in the United States in 2011. Following coal, natural gas and nu-clear power plants were the next largest producers of elec-tricity during the year. Since 2007, wind resources and natu-ral gas facilities have been the fastest growing sources of electricity generation in the country.
*Only the top five primary fuels or generating technologies are listed.
33 energy.ky.gov kentuckycoal.com
Kentucky Electricity Prices
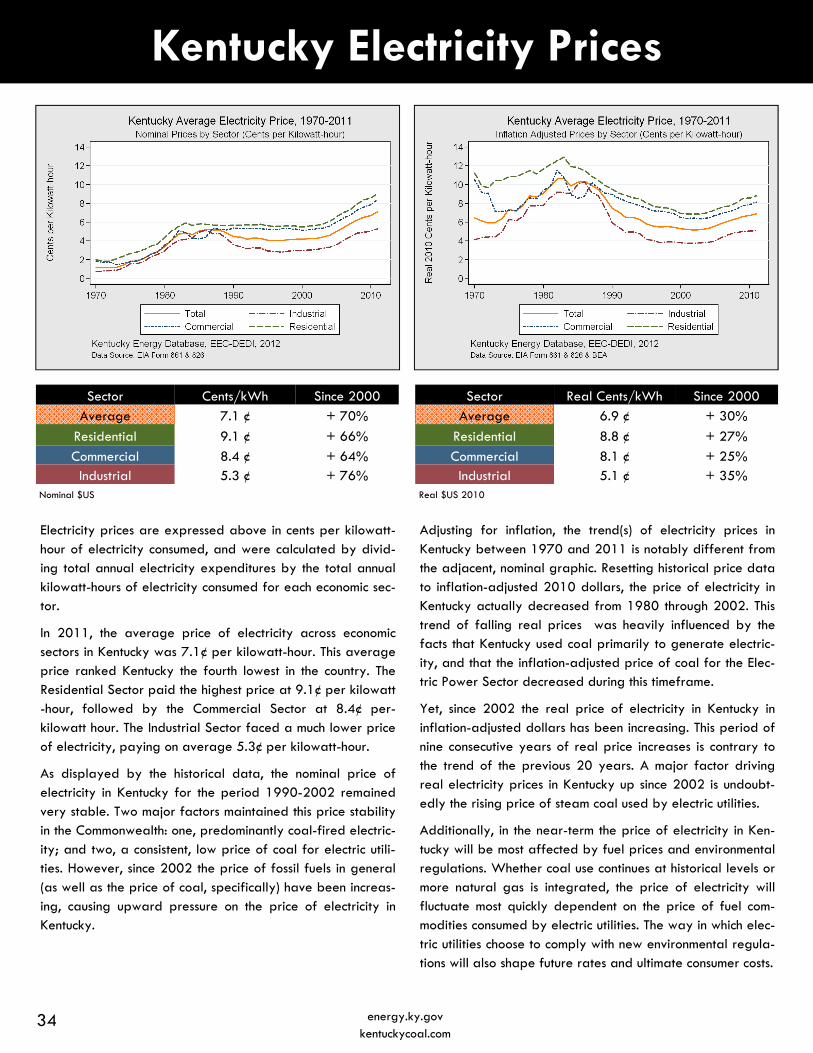
Sector Real Cents/kWh Since 2000 Average 6.9 ¢ + 30%
Residential 8.8 ¢ + 27%
Commercial 8.1 ¢ + 25% Industrial 5.1 ¢ + 35%
Adjusting for inflation, the trend(s) of electricity prices in Kentucky between 1970 and 2011 is notably different from the adjacent, nominal graphic. Resetting historical price data to inflation-adjusted 2010 dollars, the price of electricity in Kentucky actually decreased from 1980 through 2002. This trend of falling real prices was heavily influenced by the facts that Kentucky used coal primarily to generate electric-ity, and that the inflation-adjusted price of coal for the Elec-tric Power Sector decreased during this timeframe.
Yet, since 2002 the real price of electricity in Kentucky in inflation-adjusted dollars has been increasing. This period of nine consecutive years of real price increases is contrary to the trend of the previous 20 years. A major factor driving real electricity prices in Kentucky up since 2002 is undoubt-edly the rising price of steam coal used by electric utilities.
Additionally, in the near-term the price of electricity in Ken-tucky will be most affected by fuel prices and environmental regulations. Whether coal use continues at historical levels or more natural gas is integrated, the price of electricity will fluctuate most quickly dependent on the price of fuel com-modities consumed by electric utilities. The way in which elec-tric utilities choose to comply with new environmental regula-tions will also shape future rates and ultimate consumer costs.
Sector Cents/kWh Since 2000 Average 7.1 ¢ + 70%
Residential 9.1 ¢ + 66%
Commercial 8.4 ¢ + 64% Industrial 5.3 ¢ + 76%
Electricity prices are expressed above in cents per kilowatt-hour of electricity consumed, and were calculated by divid-ing total annual electricity expenditures by the total annual kilowatt-hours of electricity consumed for each economic sec-tor.
In 2011, the average price of electricity across economic sectors in Kentucky was 7.1¢ per kilowatt-hour. This average price ranked Kentucky the fourth lowest in the country. The Residential Sector paid the highest price at 9.1¢ per kilowatt-hour, followed by the Commercial Sector at 8.4¢ per-kilowatt hour. The Industrial Sector faced a much lower price of electricity, paying on average 5.3¢ per kilowatt-hour.
As displayed by the historical data, the nominal price of electricity in Kentucky for the period 1990-2002 remained very stable. Two major factors maintained this price stability in the Commonwealth: one, predominantly coal-fired electric-ity; and two, a consistent, low price of coal for electric utili-ties. However, since 2002 the price of fossil fuels in general (as well as the price of coal, specifically) have been increas-ing, causing upward pressure on the price of electricity in Kentucky.
Nominal $US Real $US 2010
34 energy.ky.gov kentuckycoal.com
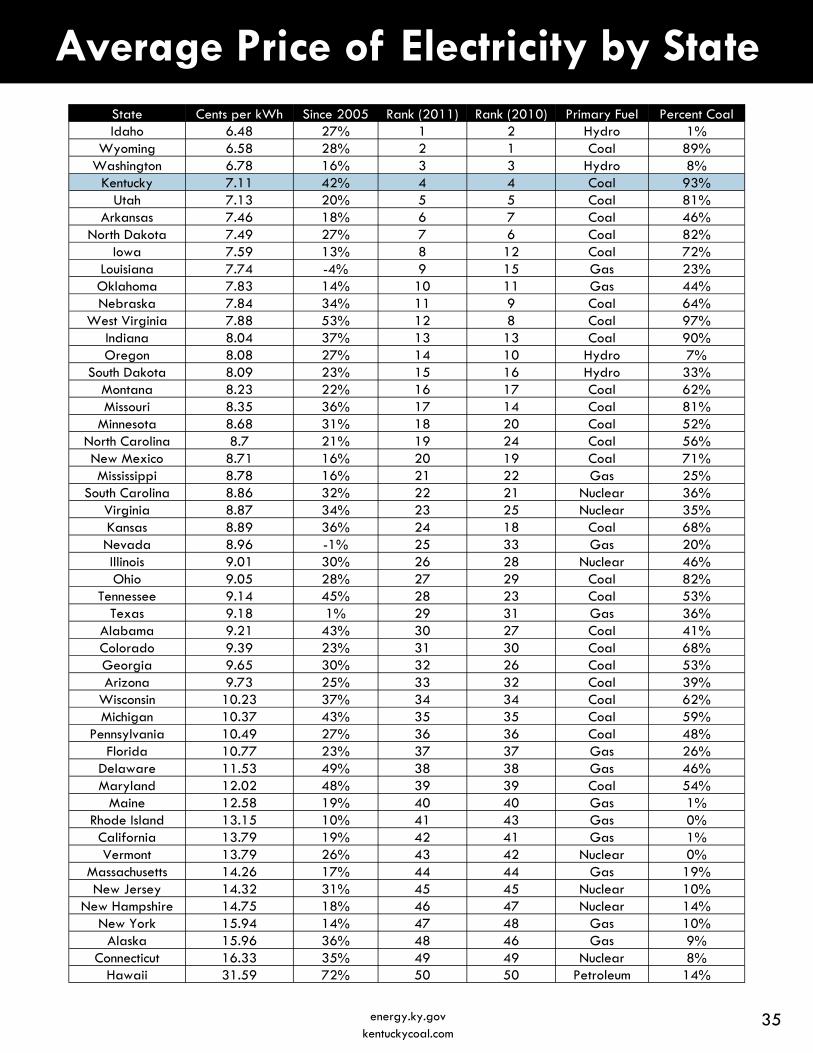
Average Price of Electricity by State State Cents per kWh Since 2005 Rank (2011) Rank (2010) Primary Fuel Percent Coal Idaho 6.48 27% 1 2 Hydro 1%
Wyoming 6.58 28% 2 1 Coal 89% Washington 6.78 16% 3 3 Hydro 8%
Kentucky 7.11 42% 4 4 Coal 93% Utah 7.13 20% 5 5 Coal 81%
Arkansas 7.46 18% 6 7 Coal 46% North Dakota 7.49 27% 7 6 Coal 82%
Iowa 7.59 13% 8 12 Coal 72% Louisiana 7.74 -4% 9 15 Gas 23% Oklahoma 7.83 14% 10 11 Gas 44% Nebraska 7.84 34% 11 9 Coal 64%
West Virginia 7.88 53% 12 8 Coal 97% Indiana 8.04 37% 13 13 Coal 90% Oregon 8.08 27% 14 10 Hydro 7%
South Dakota 8.09 23% 15 16 Hydro 33% Montana 8.23 22% 16 17 Coal 62% Missouri 8.35 36% 17 14 Coal 81%
Minnesota 8.68 31% 18 20 Coal 52% North Carolina 8.7 21% 19 24 Coal 56% New Mexico 8.71 16% 20 19 Coal 71% Mississippi 8.78 16% 21 22 Gas 25%
South Carolina 8.86 32% 22 21 Nuclear 36% Virginia 8.87 34% 23 25 Nuclear 35% Kansas 8.89 36% 24 18 Coal 68% Nevada 8.96 -1% 25 33 Gas 20% Illinois 9.01 30% 26 28 Nuclear 46% Ohio 9.05 28% 27 29 Coal 82%
Tennessee 9.14 45% 28 23 Coal 53% Texas 9.18 1% 29 31 Gas 36%
Alabama 9.21 43% 30 27 Coal 41% Colorado 9.39 23% 31 30 Coal 68% Georgia 9.65 30% 32 26 Coal 53% Arizona 9.73 25% 33 32 Coal 39%
Wisconsin 10.23 37% 34 34 Coal 62% Michigan 10.37 43% 35 35 Coal 59%
Pennsylvania 10.49 27% 36 36 Coal 48% Florida 10.77 23% 37 37 Gas 26%
Delaware 11.53 49% 38 38 Gas 46% Maryland 12.02 48% 39 39 Coal 54%
Maine 12.58 19% 40 40 Gas 1% Rhode Island 13.15 10% 41 43 Gas 0%
California 13.79 19% 42 41 Gas 1% Vermont 13.79 26% 43 42 Nuclear 0%
Massachusetts 14.26 17% 44 44 Gas 19% New Jersey 14.32 31% 45 45 Nuclear 10%
New Hampshire 14.75 18% 46 47 Nuclear 14% New York 15.94 14% 47 48 Gas 10%
Alaska 15.96 36% 48 46 Gas 9% Connecticut 16.33 35% 49 49 Nuclear 8%
Hawaii 31.59 72% 50 50 Petroleum 14%
35 energy.ky.gov kentuckycoal.com
36 energy.ky.gov kentuckycoal.com
* The dual display of electricity generation and regulated emissions indicates that over time, though electricity demand and
generation have increased, the release of targeted pollutants has actually decreased. Therefore, both the aggregate emis-
sions as well as intensity of emissions per Gigawatt-hour of criteria pollutants, such as Sulfur Dioxide (SO2) and Nitrogen Ox-
ides (NOx), have been decreasing in the Commonwealth since 1990. These reductions have been made through a combination
of burning low sulfur coal, and the installation of SO2 Scrubbers and Select Catalytic Reduction (SCR) systems at coal-fired
power plants in Kentucky.
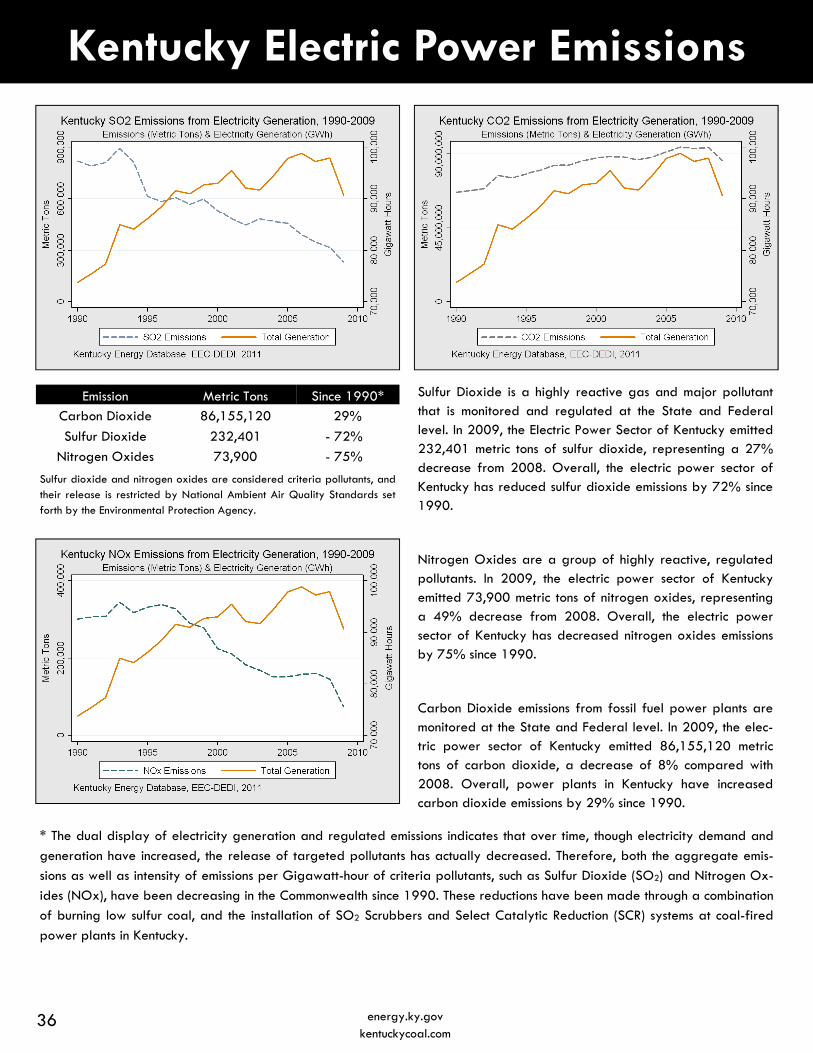
Emission Metric Tons Since 1990* Carbon Dioxide 86,155,120 29%
Sulfur Dioxide 232,401 - 72%
Nitrogen Oxides 73,900 - 75%
Sulfur Dioxide is a highly reactive gas and major pollutant that is monitored and regulated at the State and Federal level. In 2009, the Electric Power Sector of Kentucky emitted 232,401 metric tons of sulfur dioxide, representing a 27% decrease from 2008. Overall, the electric power sector of Kentucky has reduced sulfur dioxide emissions by 72% since 1990.
Nitrogen Oxides are a group of highly reactive, regulated pollutants. In 2009, the electric power sector of Kentucky emitted 73,900 metric tons of nitrogen oxides, representing a 49% decrease from 2008. Overall, the electric power sector of Kentucky has decreased nitrogen oxides emissions by 75% since 1990.
Carbon Dioxide emissions from fossil fuel power plants are monitored at the State and Federal level. In 2009, the elec-tric power sector of Kentucky emitted 86,155,120 metric tons of carbon dioxide, a decrease of 8% compared with 2008. Overall, power plants in Kentucky have increased carbon dioxide emissions by 29% since 1990.
Kentucky Electric Power Emissions
Sulfur dioxide and nitrogen oxides are considered criteria pollutants, and their release is restricted by National Ambient Air Quality Standards set forth by the Environmental Protection Agency.
Coal Formation & Properties
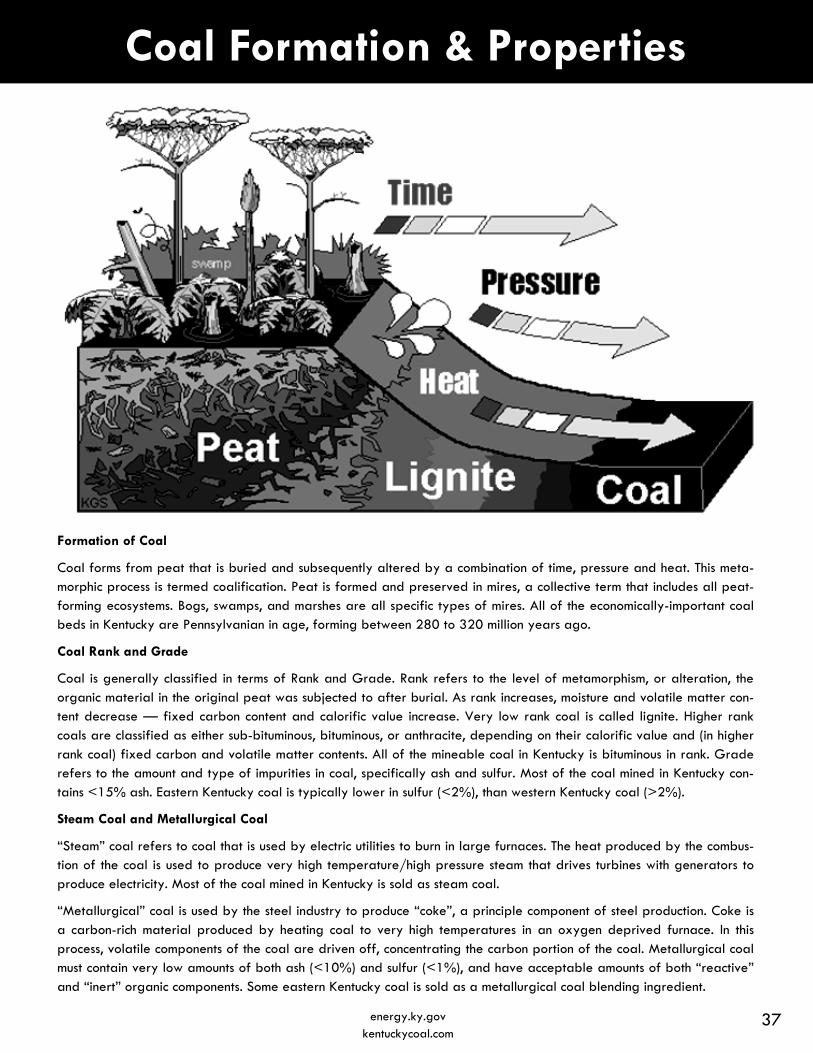
Formation of Coal
Coal forms from peat that is buried and subsequently altered by a combination of time, pressure and heat. This meta-morphic process is termed coalification. Peat is formed and preserved in mires, a collective term that includes all peat-forming ecosystems. Bogs, swamps, and marshes are all specific types of mires. All of the economically-important coal beds in Kentucky are Pennsylvanian in age, forming between 280 to 320 million years ago.
Coal Rank and Grade
Coal is generally classified in terms of Rank and Grade. Rank refers to the level of metamorphism, or alteration, the organic material in the original peat was subjected to after burial. As rank increases, moisture and volatile matter con-tent decrease — fixed carbon content and calorific value increase. Very low rank coal is called lignite. Higher rank coals are classified as either sub-bituminous, bituminous, or anthracite, depending on their calorific value and (in higher rank coal) fixed carbon and volatile matter contents. All of the mineable coal in Kentucky is bituminous in rank. Grade refers to the amount and type of impurities in coal, specifically ash and sulfur. Most of the coal mined in Kentucky con-tains <15% ash. Eastern Kentucky coal is typically lower in sulfur (<2%), than western Kentucky coal (>2%).
Steam Coal and Metallurgical Coal
“Steam” coal refers to coal that is used by electric utilities to burn in large furnaces. The heat produced by the combus-tion of the coal is used to produce very high temperature/high pressure steam that drives turbines with generators to produce electricity. Most of the coal mined in Kentucky is sold as steam coal.
“Metallurgical” coal is used by the steel industry to produce “coke”, a principle component of steel production. Coke is a carbon-rich material produced by heating coal to very high temperatures in an oxygen deprived furnace. In this process, volatile components of the coal are driven off, concentrating the carbon portion of the coal. Metallurgical coal must contain very low amounts of both ash (<10%) and sulfur (<1%), and have acceptable amounts of both “reactive” and “inert” organic components. Some eastern Kentucky coal is sold as a metallurgical coal blending ingredient.
37 energy.ky.gov kentuckycoal.com
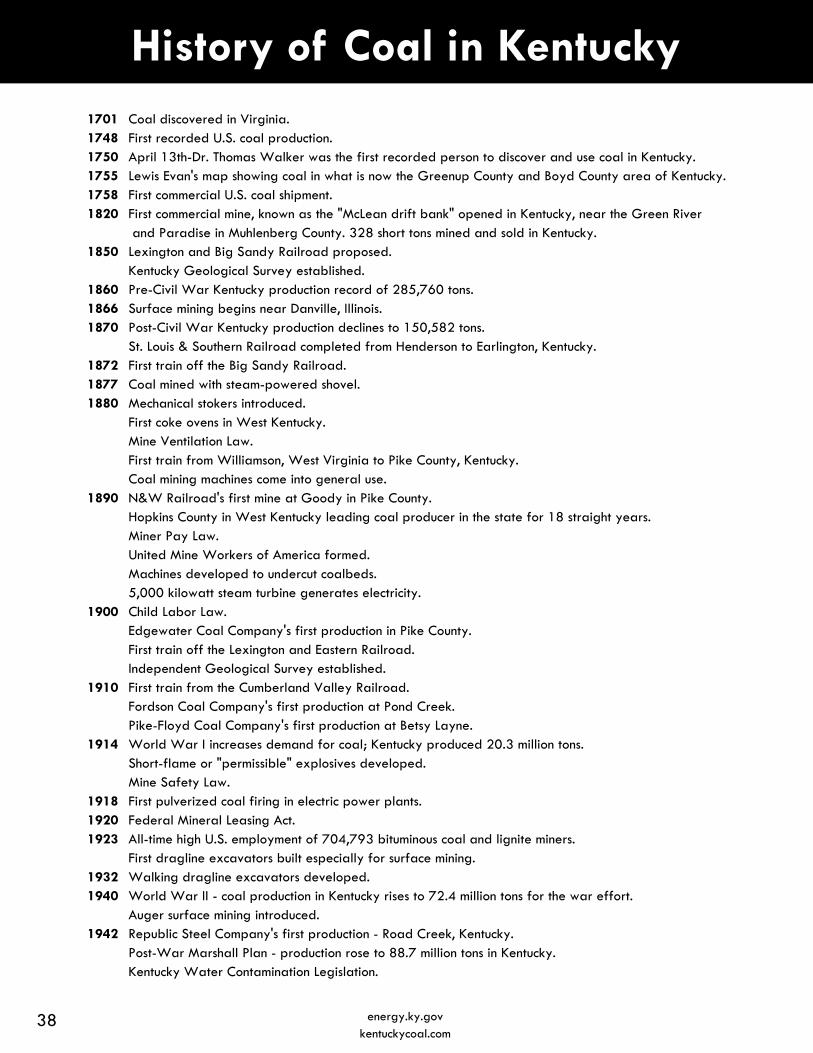
History of Coal in Kentucky 1701 Coal discovered in Virginia. 1748 First recorded U.S. coal production. 1750 April 13th-Dr. Thomas Walker was the first recorded person to discover and use coal in Kentucky. 1755 Lewis Evan's map showing coal in what is now the Greenup County and Boyd County area of Kentucky. 1758 First commercial U.S. coal shipment. 1820 First commercial mine, known as the "McLean drift bank" opened in Kentucky, near the Green River
and Paradise in Muhlenberg County. 328 short tons mined and sold in Kentucky. 1850 Lexington and Big Sandy Railroad proposed.
Kentucky Geological Survey established. 1860 Pre-Civil War Kentucky production record of 285,760 tons. 1866 Surface mining begins near Danville, Illinois. 1870 Post-Civil War Kentucky production declines to 150,582 tons.
St. Louis & Southern Railroad completed from Henderson to Earlington, Kentucky. 1872 First train off the Big Sandy Railroad. 1877 Coal mined with steam-powered shovel. 1880 Mechanical stokers introduced.
First coke ovens in West Kentucky. Mine Ventilation Law. First train from Williamson, West Virginia to Pike County, Kentucky. Coal mining machines come into general use.
1890 N&W Railroad's first mine at Goody in Pike County. Hopkins County in West Kentucky leading coal producer in the state for 18 straight years. Miner Pay Law. United Mine Workers of America formed. Machines developed to undercut coalbeds. 5,000 kilowatt steam turbine generates electricity.
1900 Child Labor Law. Edgewater Coal Company's first production in Pike County. First train off the Lexington and Eastern Railroad. Independent Geological Survey established.
1910 First train from the Cumberland Valley Railroad. Fordson Coal Company's first production at Pond Creek. Pike-Floyd Coal Company's first production at Betsy Layne.
1914 World War I increases demand for coal; Kentucky produced 20.3 million tons. Short-flame or "permissible" explosives developed. Mine Safety Law.
1918 First pulverized coal firing in electric power plants. 1920 Federal Mineral Leasing Act. 1923 All-time high U.S. employment of 704,793 bituminous coal and lignite miners.
First dragline excavators built especially for surface mining. 1932 Walking dragline excavators developed. 1940 World War II - coal production in Kentucky rises to 72.4 million tons for the war effort.
Auger surface mining introduced. 1942 Republic Steel Company's first production - Road Creek, Kentucky.
Post-War Marshall Plan - production rose to 88.7 million tons in Kentucky. Kentucky Water Contamination Legislation.
38 energy.ky.gov kentuckycoal.com
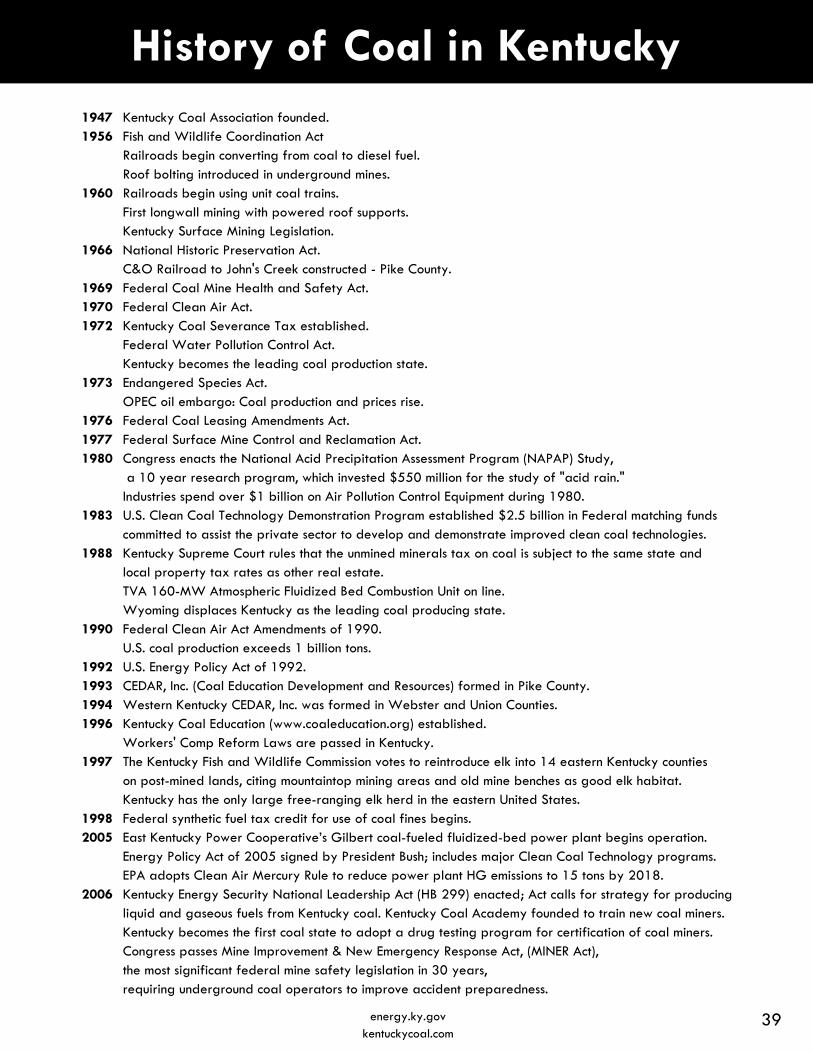
History of Coal in Kentucky 1947 Kentucky Coal Association founded. 1956 Fish and Wildlife Coordination Act
Railroads begin converting from coal to diesel fuel. Roof bolting introduced in underground mines.
1960 Railroads begin using unit coal trains. First longwall mining with powered roof supports. Kentucky Surface Mining Legislation.
1966 National Historic Preservation Act. C&O Railroad to John's Creek constructed - Pike County.
1969 Federal Coal Mine Health and Safety Act. 1970 Federal Clean Air Act. 1972 Kentucky Coal Severance Tax established.
Federal Water Pollution Control Act. Kentucky becomes the leading coal production state.
1973 Endangered Species Act. OPEC oil embargo: Coal production and prices rise.
1976 Federal Coal Leasing Amendments Act. 1977 Federal Surface Mine Control and Reclamation Act. 1980 Congress enacts the National Acid Precipitation Assessment Program (NAPAP) Study,
a 10 year research program, which invested $550 million for the study of "acid rain." Industries spend over $1 billion on Air Pollution Control Equipment during 1980.
1983 U.S. Clean Coal Technology Demonstration Program established $2.5 billion in Federal matching funds committed to assist the private sector to develop and demonstrate improved clean coal technologies.
1988 Kentucky Supreme Court rules that the unmined minerals tax on coal is subject to the same state and local property tax rates as other real estate. TVA 160-MW Atmospheric Fluidized Bed Combustion Unit on line. Wyoming displaces Kentucky as the leading coal producing state.
1990 Federal Clean Air Act Amendments of 1990. U.S. coal production exceeds 1 billion tons.
1992 U.S. Energy Policy Act of 1992. 1993 CEDAR, Inc. (Coal Education Development and Resources) formed in Pike County. 1994 Western Kentucky CEDAR, Inc. was formed in Webster and Union Counties. 1996 Kentucky Coal Education (www.coaleducation.org) established.
Workers' Comp Reform Laws are passed in Kentucky. 1997 The Kentucky Fish and Wildlife Commission votes to reintroduce elk into 14 eastern Kentucky counties
on post-mined lands, citing mountaintop mining areas and old mine benches as good elk habitat. Kentucky has the only large free-ranging elk herd in the eastern United States.
1998 Federal synthetic fuel tax credit for use of coal fines begins. 2005 East Kentucky Power Cooperative’s Gilbert coal-fueled fluidized-bed power plant begins operation.
Energy Policy Act of 2005 signed by President Bush; includes major Clean Coal Technology programs. EPA adopts Clean Air Mercury Rule to reduce power plant HG emissions to 15 tons by 2018.
2006 Kentucky Energy Security National Leadership Act (HB 299) enacted; Act calls for strategy for producing liquid and gaseous fuels from Kentucky coal. Kentucky Coal Academy founded to train new coal miners. Kentucky becomes the first coal state to adopt a drug testing program for certification of coal miners. Congress passes Mine Improvement & New Emergency Response Act, (MINER Act), the most significant federal mine safety legislation in 30 years, requiring underground coal operators to improve accident preparedness.
39 energy.ky.gov kentuckycoal.com
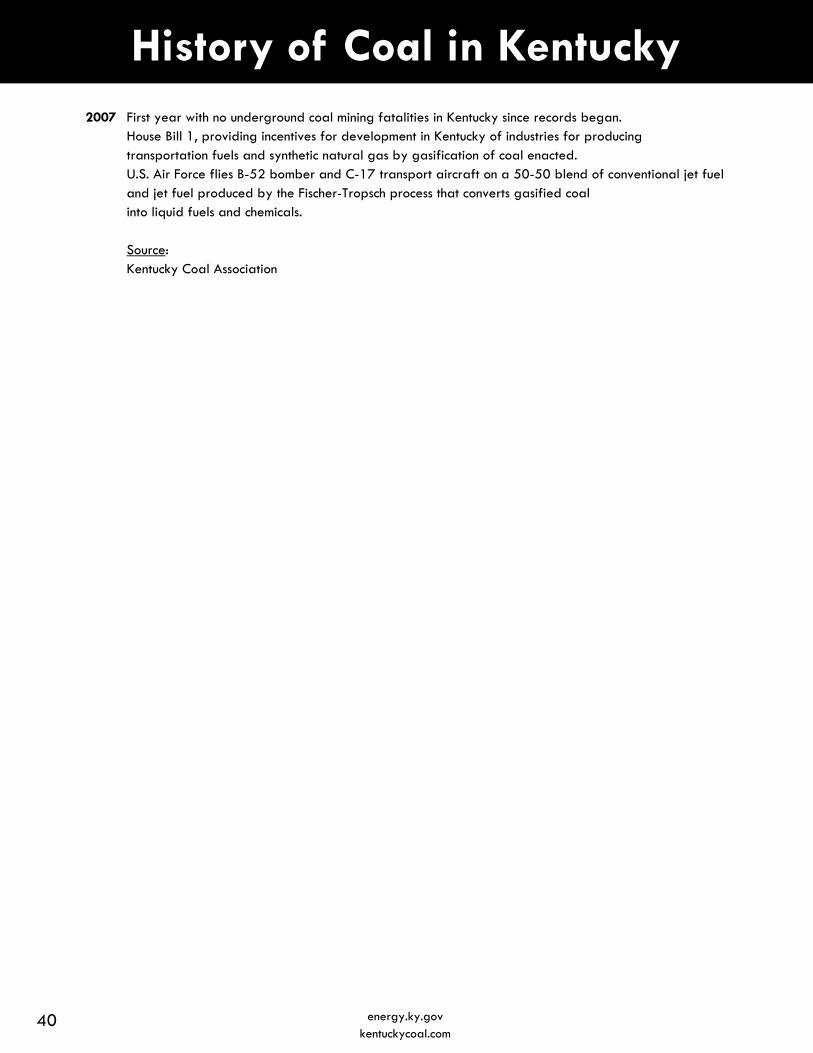
History of Coal in Kentucky 2007 First year with no underground coal mining fatalities in Kentucky since records began.
House Bill 1, providing incentives for development in Kentucky of industries for producing transportation fuels and synthetic natural gas by gasification of coal enacted. U.S. Air Force flies B-52 bomber and C-17 transport aircraft on a 50-50 blend of conventional jet fuel and jet fuel produced by the Fischer-Tropsch process that converts gasified coal into liquid fuels and chemicals.
Source: Kentucky Coal Association
40 energy.ky.gov kentuckycoal.com
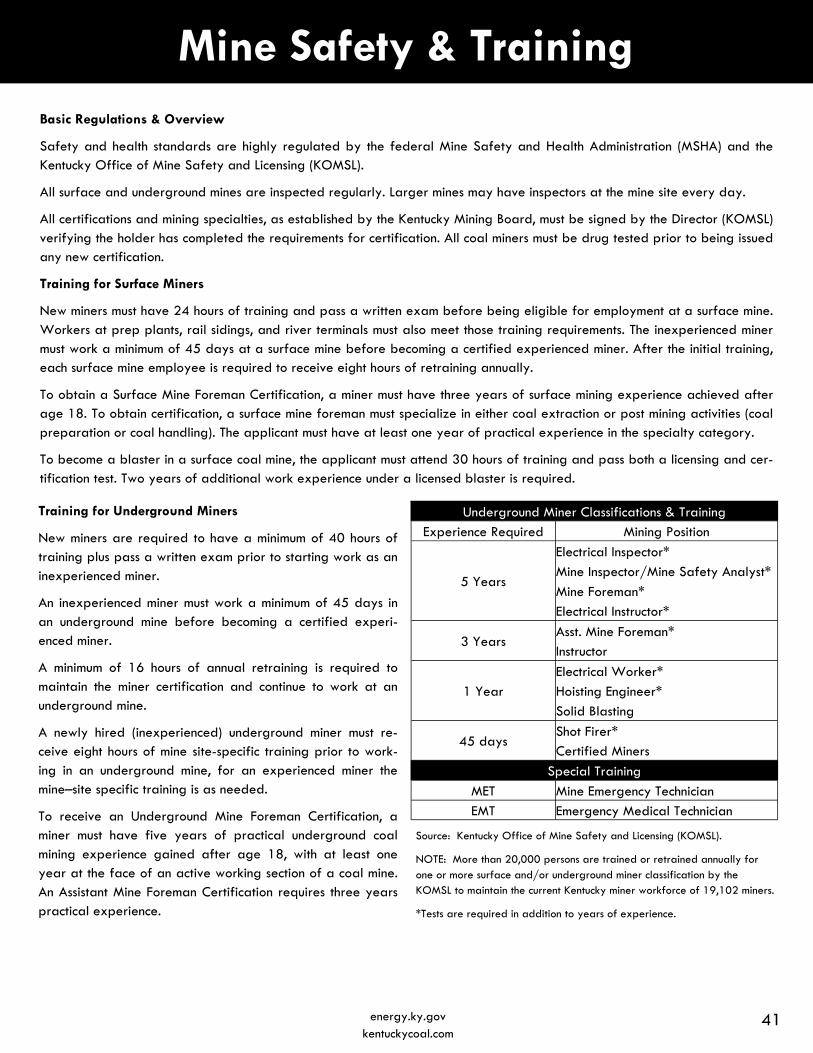
Mine Safety & Training Basic Regulations & Overview
Safety and health standards are highly regulated by the federal Mine Safety and Health Administration (MSHA) and the Kentucky Office of Mine Safety and Licensing (KOMSL).
All surface and underground mines are inspected regularly. Larger mines may have inspectors at the mine site every day.
All certifications and mining specialties, as established by the Kentucky Mining Board, must be signed by the Director (KOMSL) verifying the holder has completed the requirements for certification. All coal miners must be drug tested prior to being issued any new certification.
Training for Surface Miners
New miners must have 24 hours of training and pass a written exam before being eligible for employment at a surface mine. Workers at prep plants, rail sidings, and river terminals must also meet those training requirements. The inexperienced miner must work a minimum of 45 days at a surface mine before becoming a certified experienced miner. After the initial training, each surface mine employee is required to receive eight hours of retraining annually.
To obtain a Surface Mine Foreman Certification, a miner must have three years of surface mining experience achieved after age 18. To obtain certification, a surface mine foreman must specialize in either coal extraction or post mining activities (coal preparation or coal handling). The applicant must have at least one year of practical experience in the specialty category.
To become a blaster in a surface coal mine, the applicant must attend 30 hours of training and pass both a licensing and cer-tification test. Two years of additional work experience under a licensed blaster is required.
Underground Miner Classifications & Training Experience Required Mining Position
5 Years
Electrical Inspector* Mine Inspector/Mine Safety Analyst*
Mine Foreman* Electrical Instructor*
3 Years Asst. Mine Foreman* Instructor
1 Year Electrical Worker* Hoisting Engineer* Solid Blasting
45 days Shot Firer* Certified Miners
Special Training
MET Mine Emergency Technician EMT Emergency Medical Technician
Training for Underground Miners
New miners are required to have a minimum of 40 hours of training plus pass a written exam prior to starting work as an inexperienced miner.
An inexperienced miner must work a minimum of 45 days in an underground mine before becoming a certified experi-enced miner.
A minimum of 16 hours of annual retraining is required to maintain the miner certification and continue to work at an underground mine.
A newly hired (inexperienced) underground miner must re-ceive eight hours of mine site-specific training prior to work-ing in an underground mine, for an experienced miner the mine–site specific training is as needed.
To receive an Underground Mine Foreman Certification, a miner must have five years of practical underground coal mining experience gained after age 18, with at least one year at the face of an active working section of a coal mine. An Assistant Mine Foreman Certification requires three years practical experience.
Source: Kentucky Office of Mine Safety and Licensing (KOMSL).
NOTE: More than 20,000 persons are trained or retrained annually for one or more surface and/or underground miner classification by the KOMSL to maintain the current Kentucky miner workforce of 19,102 miners.
*Tests are required in addition to years of experience.
41 energy.ky.gov kentuckycoal.com
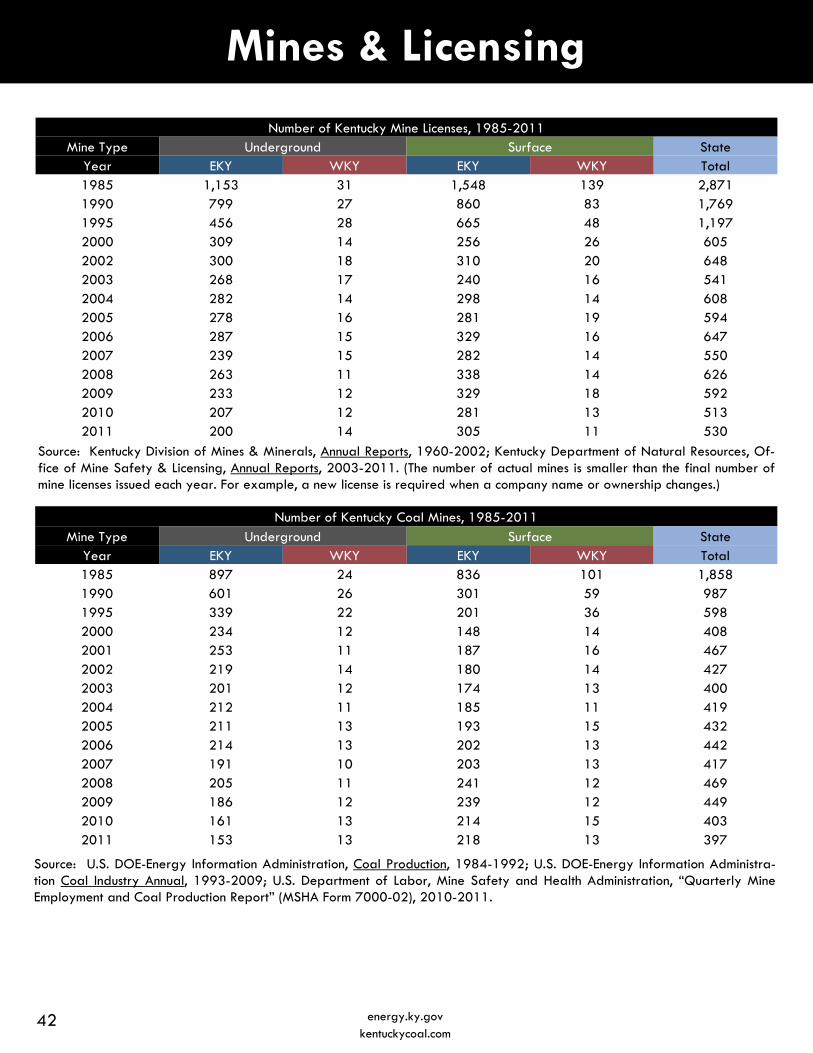
Mines & Licensing
Source: U.S. DOE-Energy Information Administration, Coal Production, 1984-1992; U.S. DOE-Energy Information Administra-tion Coal Industry Annual, 1993-2009; U.S. Department of Labor, Mine Safety and Health Administration, “Quarterly Mine Employment and Coal Production Report” (MSHA Form 7000-02), 2010-2011.
Number of Kentucky Mine Licenses, 1985-2011 Mine Type Underground Surface State
Year EKY WKY EKY WKY Total 1985 1,153 31 1,548 139 2,871 1990 799 27 860 83 1,769 1995 456 28 665 48 1,197 2000 309 14 256 26 605 2002 300 18 310 20 648 2003 268 17 240 16 541 2004 282 14 298 14 608 2005 278 16 281 19 594 2006 287 15 329 16 647 2007 239 15 282 14 550 2008 263 11 338 14 626 2009 233 12 329 18 592 2010 207 12 281 13 513 2011 200 14 305 11 530
Source: Kentucky Division of Mines & Minerals, Annual Reports, 1960-2002; Kentucky Department of Natural Resources, Of-fice of Mine Safety & Licensing, Annual Reports, 2003-2011. (The number of actual mines is smaller than the final number of mine licenses issued each year. For example, a new license is required when a company name or ownership changes.)
Number of Kentucky Coal Mines, 1985-2011 Mine Type Underground Surface State
Year EKY WKY EKY WKY Total 1985 897 24 836 101 1,858 1990 601 26 301 59 987 1995 339 22 201 36 598 2000 234 12 148 14 408 2001 253 11 187 16 467 2002 219 14 180 14 427 2003 201 12 174 13 400 2004 212 11 185 11 419 2005 211 13 193 15 432 2006 214 13 202 13 442 2007 191 10 203 13 417 2008 205 11 241 12 469 2009 186 12 239 12 449 2010 161 13 214 15 403 2011 153 13 218 13 397
42 energy.ky.gov kentuckycoal.com
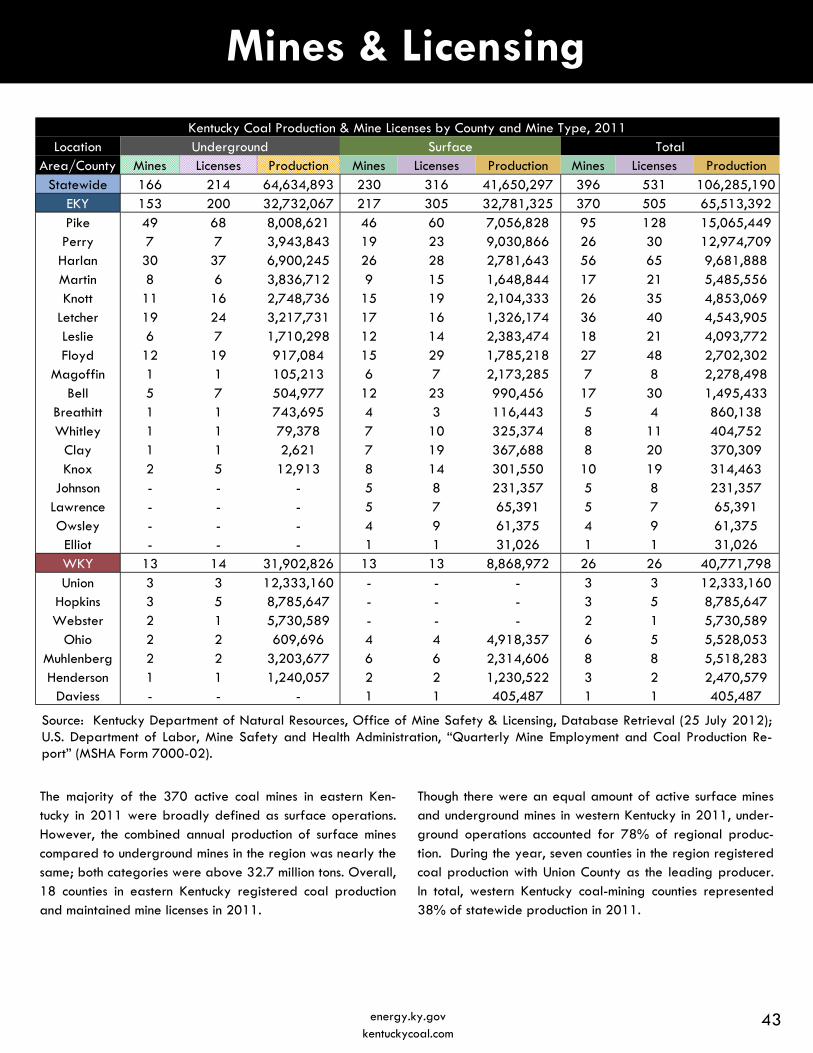
Mines & Licensing
Kentucky Coal Production & Mine Licenses by County and Mine Type, 2011 Location Underground Surface Total
Area/County Mines Licenses Production Mines Licenses Production Mines Licenses Production Statewide 166 214 64,634,893 230 316 41,650,297 396 531 106,285,190
EKY 153 200 32,732,067 217 305 32,781,325 370 505 65,513,392 Pike 49 68 8,008,621 46 60 7,056,828 95 128 15,065,449 Perry 7 7 3,943,843 19 23 9,030,866 26 30 12,974,709 Harlan 30 37 6,900,245 26 28 2,781,643 56 65 9,681,888 Martin 8 6 3,836,712 9 15 1,648,844 17 21 5,485,556 Knott 11 16 2,748,736 15 19 2,104,333 26 35 4,853,069
Letcher 19 24 3,217,731 17 16 1,326,174 36 40 4,543,905 Leslie 6 7 1,710,298 12 14 2,383,474 18 21 4,093,772 Floyd 12 19 917,084 15 29 1,785,218 27 48 2,702,302
Magoffin 1 1 105,213 6 7 2,173,285 7 8 2,278,498 Bell 5 7 504,977 12 23 990,456 17 30 1,495,433
Breathitt 1 1 743,695 4 3 116,443 5 4 860,138 Whitley 1 1 79,378 7 10 325,374 8 11 404,752
Clay 1 1 2,621 7 19 367,688 8 20 370,309 Knox 2 5 12,913 8 14 301,550 10 19 314,463
Johnson - - - 5 8 231,357 5 8 231,357 Lawrence - - - 5 7 65,391 5 7 65,391 Owsley - - - 4 9 61,375 4 9 61,375
Elliot - - - 1 1 31,026 1 1 31,026 WKY 13 14 31,902,826 13 13 8,868,972 26 26 40,771,798 Union 3 3 12,333,160 - - - 3 3 12,333,160
Hopkins 3 5 8,785,647 - - - 3 5 8,785,647 Webster 2 1 5,730,589 - - - 2 1 5,730,589
Ohio 2 2 609,696 4 4 4,918,357 6 5 5,528,053 Muhlenberg 2 2 3,203,677 6 6 2,314,606 8 8 5,518,283 Henderson 1 1 1,240,057 2 2 1,230,522 3 2 2,470,579
Daviess - - - 1 1 405,487 1 1 405,487
Source: Kentucky Department of Natural Resources, Office of Mine Safety & Licensing, Database Retrieval (25 July 2012); U.S. Department of Labor, Mine Safety and Health Administration, “Quarterly Mine Employment and Coal Production Re-port” (MSHA Form 7000-02).
The majority of the 370 active coal mines in eastern Ken-tucky in 2011 were broadly defined as surface operations. However, the combined annual production of surface mines compared to underground mines in the region was nearly the same; both categories were above 32.7 million tons. Overall, 18 counties in eastern Kentucky registered coal production and maintained mine licenses in 2011.
Though there were an equal amount of active surface mines and underground mines in western Kentucky in 2011, under-ground operations accounted for 78% of regional produc-tion. During the year, seven counties in the region registered coal production with Union County as the leading producer. In total, western Kentucky coal-mining counties represented 38% of statewide production in 2011.
43 energy.ky.gov kentuckycoal.com
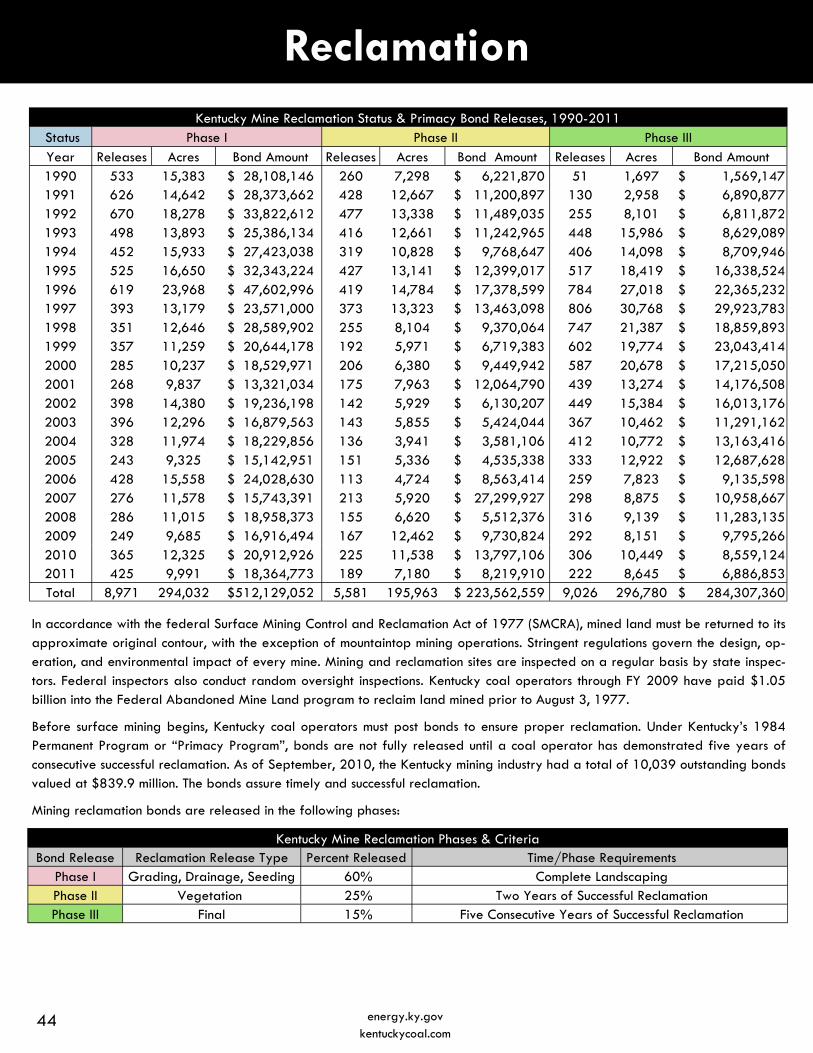
Reclamation
In accordance with the federal Surface Mining Control and Reclamation Act of 1977 (SMCRA), mined land must be returned to its approximate original contour, with the exception of mountaintop mining operations. Stringent regulations govern the design, op-eration, and environmental impact of every mine. Mining and reclamation sites are inspected on a regular basis by state inspec-tors. Federal inspectors also conduct random oversight inspections. Kentucky coal operators through FY 2009 have paid $1.05 billion into the Federal Abandoned Mine Land program to reclaim land mined prior to August 3, 1977.
Before surface mining begins, Kentucky coal operators must post bonds to ensure proper reclamation. Under Kentucky’s 1984 Permanent Program or “Primacy Program”, bonds are not fully released until a coal operator has demonstrated five years of consecutive successful reclamation. As of September, 2010, the Kentucky mining industry had a total of 10,039 outstanding bonds valued at $839.9 million. The bonds assure timely and successful reclamation.
Mining reclamation bonds are released in the following phases:
Kentucky Mine Reclamation Status & Primacy Bond Releases, 1990-2011 Status Phase I Phase II Phase III Year Releases Acres Bond Amount Releases Acres Bond Amount Releases Acres Bond Amount 1990 533 15,383 $ 28,108,146 260 7,298 $ 6,221,870 51 1,697 $ 1,569,147 1991 626 14,642 $ 28,373,662 428 12,667 $ 11,200,897 130 2,958 $ 6,890,877 1992 670 18,278 $ 33,822,612 477 13,338 $ 11,489,035 255 8,101 $ 6,811,872 1993 498 13,893 $ 25,386,134 416 12,661 $ 11,242,965 448 15,986 $ 8,629,089 1994 452 15,933 $ 27,423,038 319 10,828 $ 9,768,647 406 14,098 $ 8,709,946 1995 525 16,650 $ 32,343,224 427 13,141 $ 12,399,017 517 18,419 $ 16,338,524 1996 619 23,968 $ 47,602,996 419 14,784 $ 17,378,599 784 27,018 $ 22,365,232 1997 393 13,179 $ 23,571,000 373 13,323 $ 13,463,098 806 30,768 $ 29,923,783 1998 351 12,646 $ 28,589,902 255 8,104 $ 9,370,064 747 21,387 $ 18,859,893 1999 357 11,259 $ 20,644,178 192 5,971 $ 6,719,383 602 19,774 $ 23,043,414 2000 285 10,237 $ 18,529,971 206 6,380 $ 9,449,942 587 20,678 $ 17,215,050 2001 268 9,837 $ 13,321,034 175 7,963 $ 12,064,790 439 13,274 $ 14,176,508 2002 398 14,380 $ 19,236,198 142 5,929 $ 6,130,207 449 15,384 $ 16,013,176 2003 396 12,296 $ 16,879,563 143 5,855 $ 5,424,044 367 10,462 $ 11,291,162 2004 328 11,974 $ 18,229,856 136 3,941 $ 3,581,106 412 10,772 $ 13,163,416 2005 243 9,325 $ 15,142,951 151 5,336 $ 4,535,338 333 12,922 $ 12,687,628 2006 428 15,558 $ 24,028,630 113 4,724 $ 8,563,414 259 7,823 $ 9,135,598 2007 276 11,578 $ 15,743,391 213 5,920 $ 27,299,927 298 8,875 $ 10,958,667 2008 286 11,015 $ 18,958,373 155 6,620 $ 5,512,376 316 9,139 $ 11,283,135 2009 249 9,685 $ 16,916,494 167 12,462 $ 9,730,824 292 8,151 $ 9,795,266 2010 365 12,325 $ 20,912,926 225 11,538 $ 13,797,106 306 10,449 $ 8,559,124 2011 425 9,991 $ 18,364,773 189 7,180 $ 8,219,910 222 8,645 $ 6,886,853 Total 8,971 294,032 $512,129,052 5,581 195,963 $ 223,562,559 9,026 296,780 $ 284,307,360
Kentucky Mine Reclamation Phases & Criteria Bond Release Reclamation Release Type Percent Released Time/Phase Requirements
Phase I Grading, Drainage, Seeding 60% Complete Landscaping Phase II Vegetation 25% Two Years of Successful Reclamation Phase III Final 15% Five Consecutive Years of Successful Reclamation
44 energy.ky.gov kentuckycoal.com
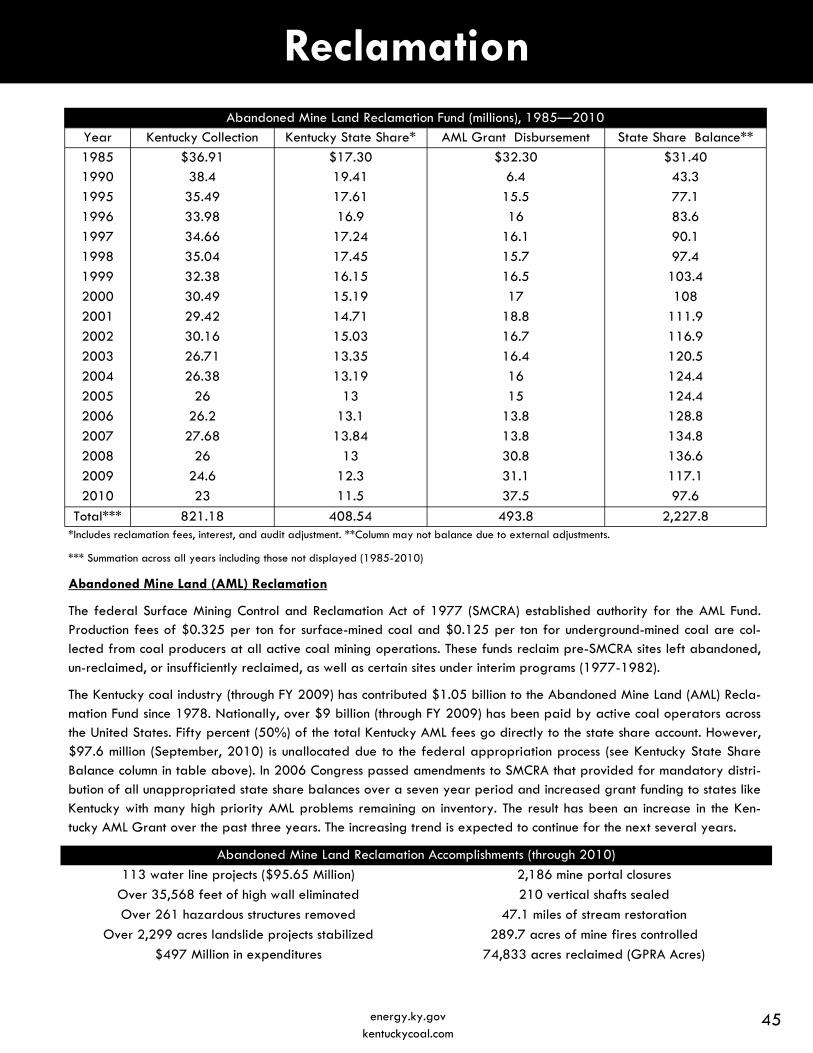
Reclamation
*Includes reclamation fees, interest, and audit adjustment. **Column may not balance due to external adjustments.
*** Summation across all years including those not displayed (1985-2010)
Abandoned Mine Land Reclamation Fund (millions), 1985—2010 Year Kentucky Collection Kentucky State Share* AML Grant Disbursement State Share Balance**
1985 $36.91 $17.30 $32.30 $31.40 1990 38.4 19.41 6.4 43.3
1995 35.49 17.61 15.5 77.1
1996 33.98 16.9 16 83.6
1997 34.66 17.24 16.1 90.1
1998 35.04 17.45 15.7 97.4
1999 32.38 16.15 16.5 103.4
2000 30.49 15.19 17 108
2001 29.42 14.71 18.8 111.9
2002 30.16 15.03 16.7 116.9
2003 26.71 13.35 16.4 120.5
2004 26.38 13.19 16 124.4
2005 26 13 15 124.4
2006 26.2 13.1 13.8 128.8
2007 27.68 13.84 13.8 134.8
2008 26 13 30.8 136.6
2009 24.6 12.3 31.1 117.1
2010 23 11.5 37.5 97.6
Total*** 821.18 408.54 493.8 2,227.8
Abandoned Mine Land (AML) Reclamation
The federal Surface Mining Control and Reclamation Act of 1977 (SMCRA) established authority for the AML Fund. Production fees of $0.325 per ton for surface-mined coal and $0.125 per ton for underground-mined coal are col-lected from coal producers at all active coal mining operations. These funds reclaim pre-SMCRA sites left abandoned, un-reclaimed, or insufficiently reclaimed, as well as certain sites under interim programs (1977-1982).
The Kentucky coal industry (through FY 2009) has contributed $1.05 billion to the Abandoned Mine Land (AML) Recla-mation Fund since 1978. Nationally, over $9 billion (through FY 2009) has been paid by active coal operators across the United States. Fifty percent (50%) of the total Kentucky AML fees go directly to the state share account. However, $97.6 million (September, 2010) is unallocated due to the federal appropriation process (see Kentucky State Share Balance column in table above). In 2006 Congress passed amendments to SMCRA that provided for mandatory distri-bution of all unappropriated state share balances over a seven year period and increased grant funding to states like Kentucky with many high priority AML problems remaining on inventory. The result has been an increase in the Ken-tucky AML Grant over the past three years. The increasing trend is expected to continue for the next several years.
45 energy.ky.gov kentuckycoal.com
Abandoned Mine Land Reclamation Accomplishments (through 2010)
113 water line projects ($95.65 Million) 2,186 mine portal closures
Over 35,568 feet of high wall eliminated 210 vertical shafts sealed
Over 261 hazardous structures removed 47.1 miles of stream restoration
Over 2,299 acres landslide projects stabilized 289.7 acres of mine fires controlled
$497 Million in expenditures 74,833 acres reclaimed (GPRA Acres)
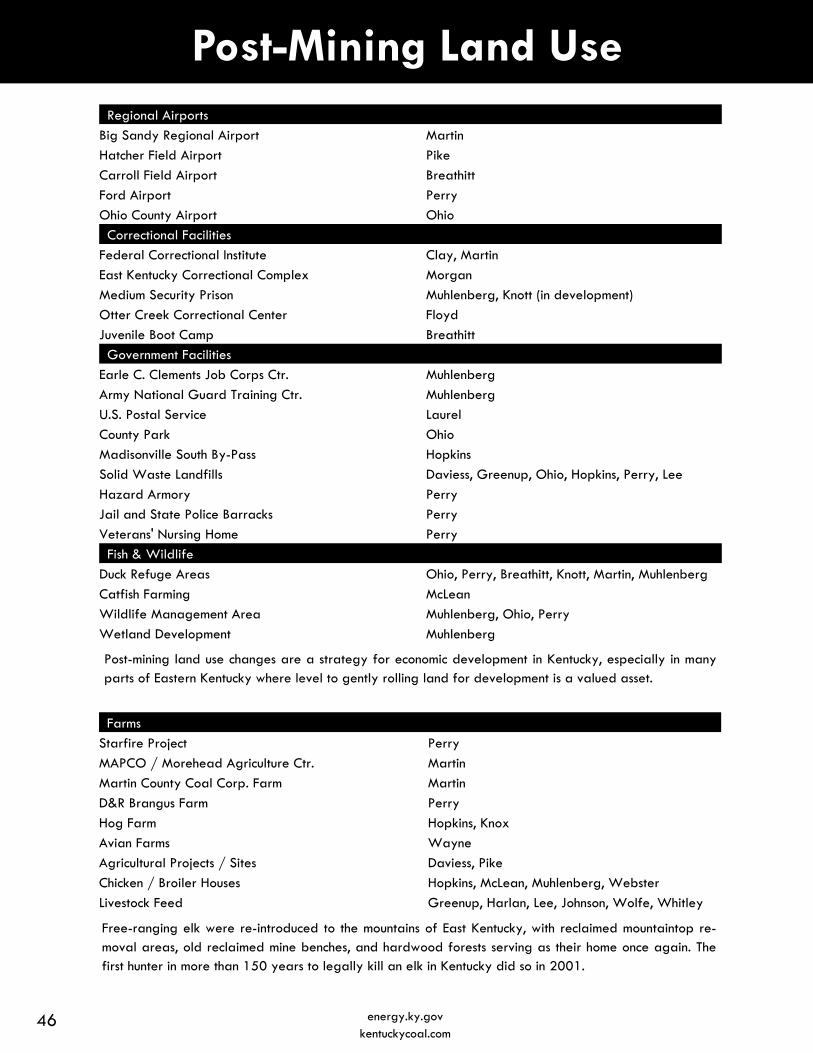
Post-Mining Land Use Regional Airports
Big Sandy Regional Airport Martin
Hatcher Field Airport Pike
Carroll Field Airport Breathitt
Ford Airport Perry
Ohio County Airport Ohio
Correctional Facilities
Federal Correctional Institute Clay, Martin
East Kentucky Correctional Complex Morgan
Medium Security Prison Muhlenberg, Knott (in development)
Otter Creek Correctional Center Floyd
Juvenile Boot Camp Breathitt
Government Facilities
Earle C. Clements Job Corps Ctr. Muhlenberg
Army National Guard Training Ctr. Muhlenberg
U.S. Postal Service Laurel
County Park Ohio
Madisonville South By-Pass Hopkins
Solid Waste Landfills Daviess, Greenup, Ohio, Hopkins, Perry, Lee
Hazard Armory Perry
Jail and State Police Barracks Perry
Veterans' Nursing Home Perry
Fish & Wildlife
Duck Refuge Areas Ohio, Perry, Breathitt, Knott, Martin, Muhlenberg
Catfish Farming McLean
Wildlife Management Area Muhlenberg, Ohio, Perry
Wetland Development Muhlenberg
Farms
Starfire Project Perry
MAPCO / Morehead Agriculture Ctr. Martin
Martin County Coal Corp. Farm Martin
D&R Brangus Farm Perry
Hog Farm Hopkins, Knox
Avian Farms Wayne
Agricultural Projects / Sites Daviess, Pike
Chicken / Broiler Houses Hopkins, McLean, Muhlenberg, Webster
Livestock Feed Greenup, Harlan, Lee, Johnson, Wolfe, Whitley
Post-mining land use changes are a strategy for economic development in Kentucky, especially in many parts of Eastern Kentucky where level to gently rolling land for development is a valued asset.
Free-ranging elk were re-introduced to the mountains of East Kentucky, with reclaimed mountaintop re-moval areas, old reclaimed mine benches, and hardwood forests serving as their home once again. The first hunter in more than 150 years to legally kill an elk in Kentucky did so in 2001.
46 energy.ky.gov kentuckycoal.com
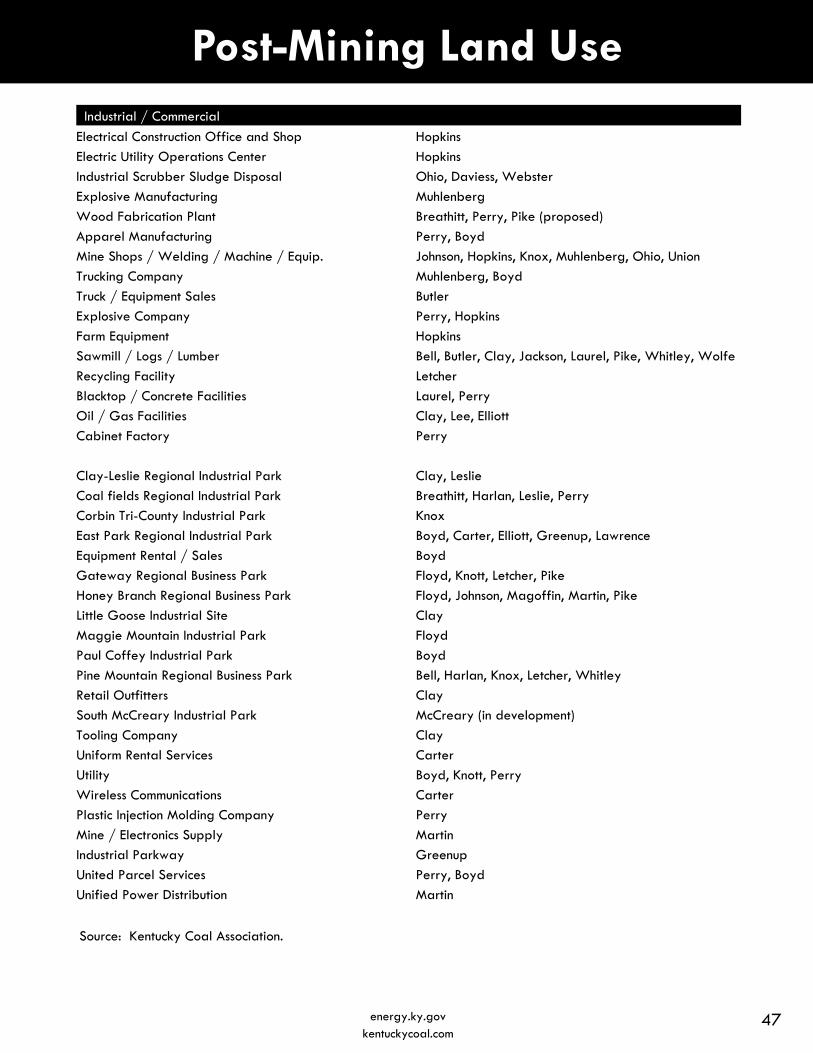
Post-Mining Land Use Industrial / Commercial
Electrical Construction Office and Shop Hopkins
Electric Utility Operations Center Hopkins
Industrial Scrubber Sludge Disposal Ohio, Daviess, Webster
Explosive Manufacturing Muhlenberg
Wood Fabrication Plant Breathitt, Perry, Pike (proposed)
Apparel Manufacturing Perry, Boyd
Mine Shops / Welding / Machine / Equip. Johnson, Hopkins, Knox, Muhlenberg, Ohio, Union
Trucking Company Muhlenberg, Boyd
Truck / Equipment Sales Butler
Explosive Company Perry, Hopkins
Farm Equipment Hopkins
Sawmill / Logs / Lumber Bell, Butler, Clay, Jackson, Laurel, Pike, Whitley, Wolfe
Recycling Facility Letcher
Blacktop / Concrete Facilities Laurel, Perry
Oil / Gas Facilities Clay, Lee, Elliott
Cabinet Factory Perry
Clay-Leslie Regional Industrial Park Clay, Leslie
Coal fields Regional Industrial Park Breathitt, Harlan, Leslie, Perry
Corbin Tri-County Industrial Park Knox
East Park Regional Industrial Park Boyd, Carter, Elliott, Greenup, Lawrence
Equipment Rental / Sales Boyd
Gateway Regional Business Park Floyd, Knott, Letcher, Pike
Honey Branch Regional Business Park Floyd, Johnson, Magoffin, Martin, Pike
Little Goose Industrial Site Clay
Maggie Mountain Industrial Park Floyd
Paul Coffey Industrial Park Boyd
Pine Mountain Regional Business Park Bell, Harlan, Knox, Letcher, Whitley
Retail Outfitters Clay
South McCreary Industrial Park McCreary (in development)
Tooling Company Clay
Uniform Rental Services Carter
Utility Boyd, Knott, Perry
Wireless Communications Carter
Plastic Injection Molding Company Perry
Mine / Electronics Supply Martin
Industrial Parkway Greenup
United Parcel Services Perry, Boyd
Unified Power Distribution Martin
Source: Kentucky Coal Association.
47 energy.ky.gov kentuckycoal.com
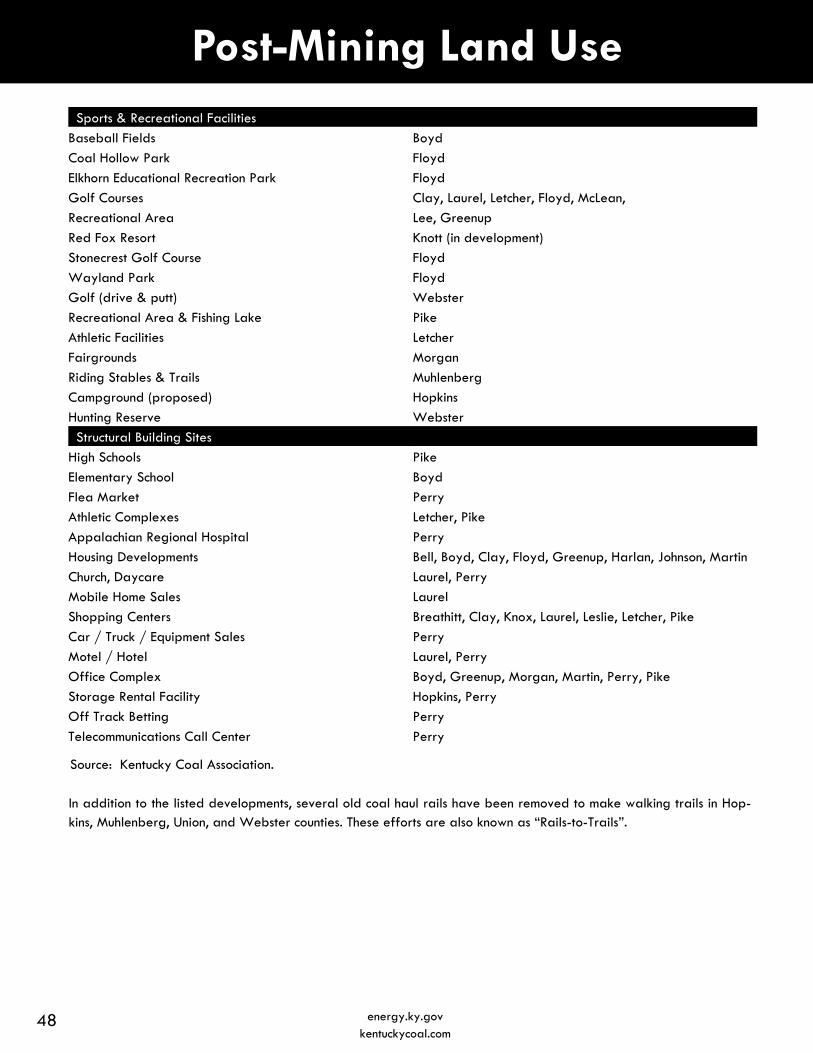
Post-Mining Land Use Sports & Recreational Facilities
Baseball Fields Boyd
Coal Hollow Park Floyd
Elkhorn Educational Recreation Park Floyd
Golf Courses Clay, Laurel, Letcher, Floyd, McLean,
Recreational Area Lee, Greenup
Red Fox Resort Knott (in development)
Stonecrest Golf Course Floyd
Wayland Park Floyd
Golf (drive & putt) Webster
Recreational Area & Fishing Lake Pike
Athletic Facilities Letcher
Fairgrounds Morgan
Riding Stables & Trails Muhlenberg
Campground (proposed) Hopkins
Hunting Reserve Webster
Structural Building Sites
High Schools Pike
Elementary School Boyd
Flea Market Perry
Athletic Complexes Letcher, Pike
Appalachian Regional Hospital Perry
Housing Developments Bell, Boyd, Clay, Floyd, Greenup, Harlan, Johnson, Martin
Church, Daycare Laurel, Perry
Mobile Home Sales Laurel
Shopping Centers Breathitt, Clay, Knox, Laurel, Leslie, Letcher, Pike
Car / Truck / Equipment Sales Perry
Motel / Hotel Laurel, Perry
Office Complex Boyd, Greenup, Morgan, Martin, Perry, Pike
Storage Rental Facility Hopkins, Perry
Off Track Betting Perry
Telecommunications Call Center Perry
Source: Kentucky Coal Association.
In addition to the listed developments, several old coal haul rails have been removed to make walking trails in Hop-kins, Muhlenberg, Union, and Webster counties. These efforts are also known as “Rails-to-Trails”.
48 energy.ky.gov kentuckycoal.com
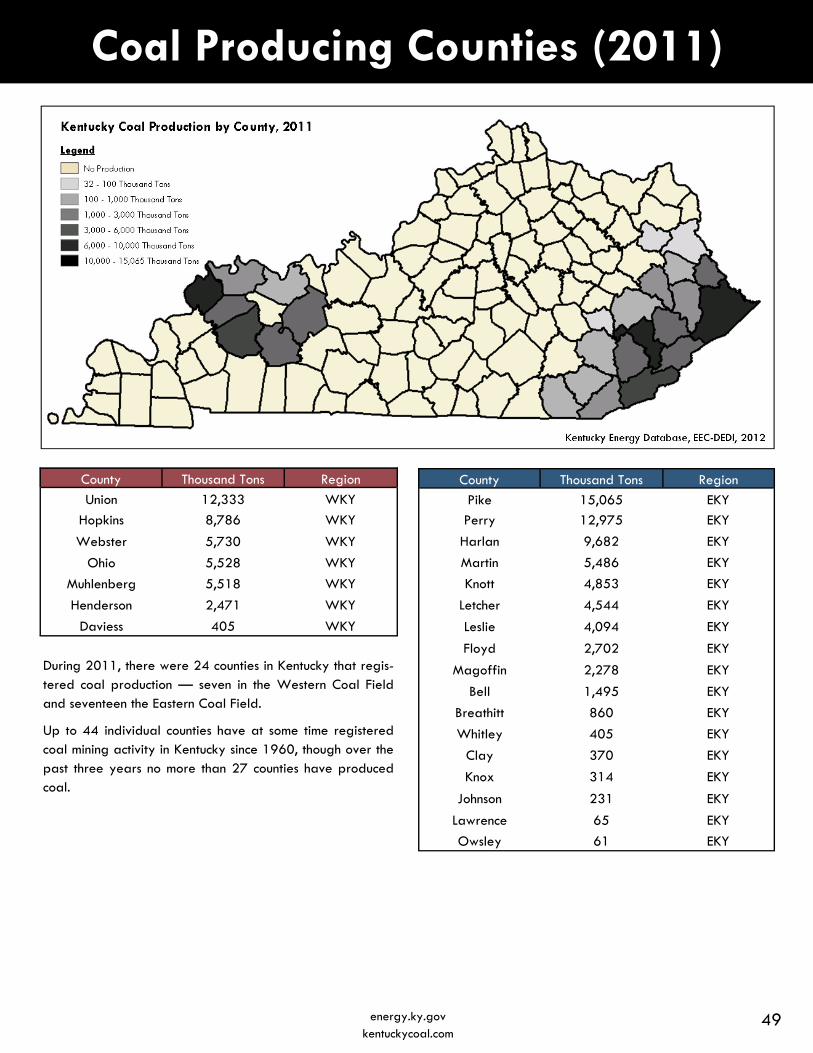
Coal Producing Counties (2011)
County Thousand Tons Region
Pike 15,065 EKY
Perry 12,975 EKY
Harlan 9,682 EKY
Martin 5,486 EKY
Knott 4,853 EKY
Letcher 4,544 EKY
Leslie 4,094 EKY
Floyd 2,702 EKY
Magoffin 2,278 EKY
Bell 1,495 EKY
Breathitt 860 EKY
Whitley 405 EKY
Clay 370 EKY
Knox 314 EKY
Johnson 231 EKY
Lawrence 65 EKY
Owsley 61 EKY
County Thousand Tons Region
Union 12,333 WKY
Hopkins 8,786 WKY
Webster 5,730 WKY
Ohio 5,528 WKY
Muhlenberg 5,518 WKY
Henderson 2,471 WKY
Daviess 405 WKY
During 2011, there were 24 counties in Kentucky that regis-tered coal production — seven in the Western Coal Field and seventeen the Eastern Coal Field.
Up to 44 individual counties have at some time registered coal mining activity in Kentucky since 1960, though over the past three years no more than 27 counties have produced coal.
49 energy.ky.gov kentuckycoal.com
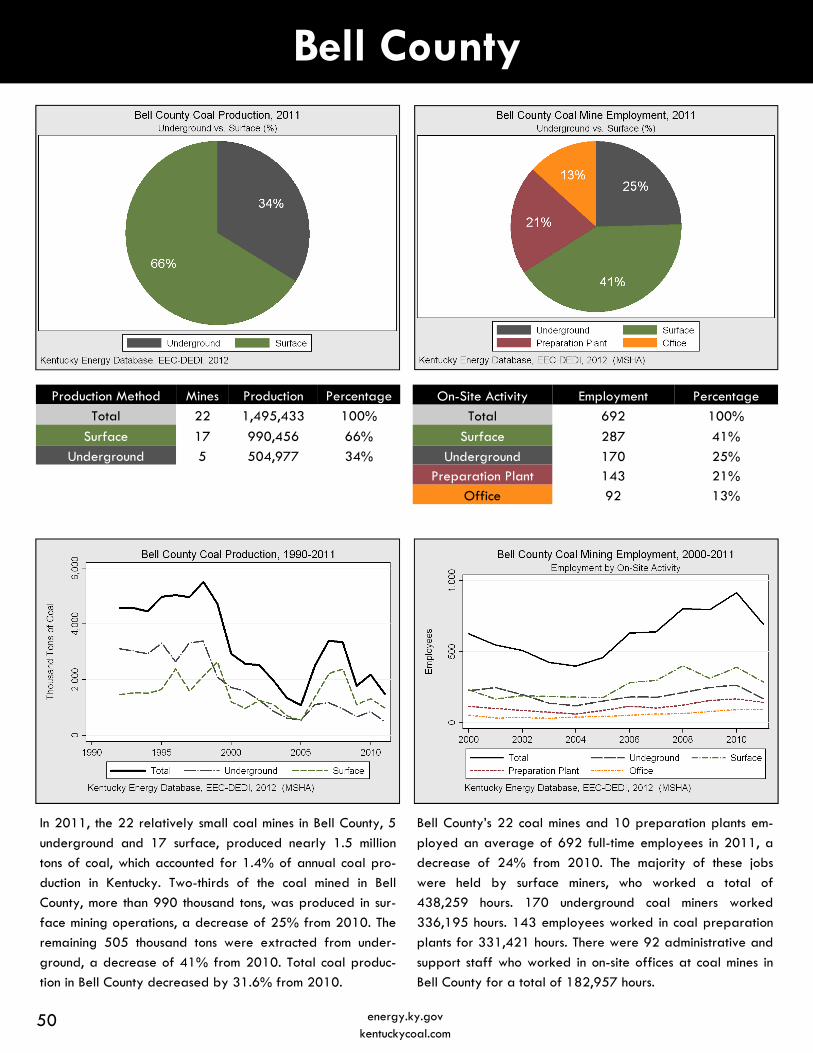
Bell County
On-Site Activity Employment Percentage
Total 692 100%
Surface 287 41%
Underground 170 25% Preparation Plant 143 21%
Office 92 13%
In 2011, the 22 relatively small coal mines in Bell County, 5
underground and 17 surface, produced nearly 1.5 million
tons of coal, which accounted for 1.4% of annual coal pro-
duction in Kentucky. Two-thirds of the coal mined in Bell
County, more than 990 thousand tons, was produced in sur-
face mining operations, a decrease of 25% from 2010. The
remaining 505 thousand tons were extracted from under-
ground, a decrease of 41% from 2010. Total coal produc-
tion in Bell County decreased by 31.6% from 2010.
Bell County’s 22 coal mines and 10 preparation plants em-
ployed an average of 692 full-time employees in 2011, a
decrease of 24% from 2010. The majority of these jobs
were held by surface miners, who worked a total of
438,259 hours. 170 underground coal miners worked
336,195 hours. 143 employees worked in coal preparation
plants for 331,421 hours. There were 92 administrative and
support staff who worked in on-site offices at coal mines in
Bell County for a total of 182,957 hours.
Production Method Production Percentage
Total 1,495,433 100%
Surface 990,456 66%
Underground 504,977 34%
Mines
22
17
5
50 energy.ky.gov kentuckycoal.com
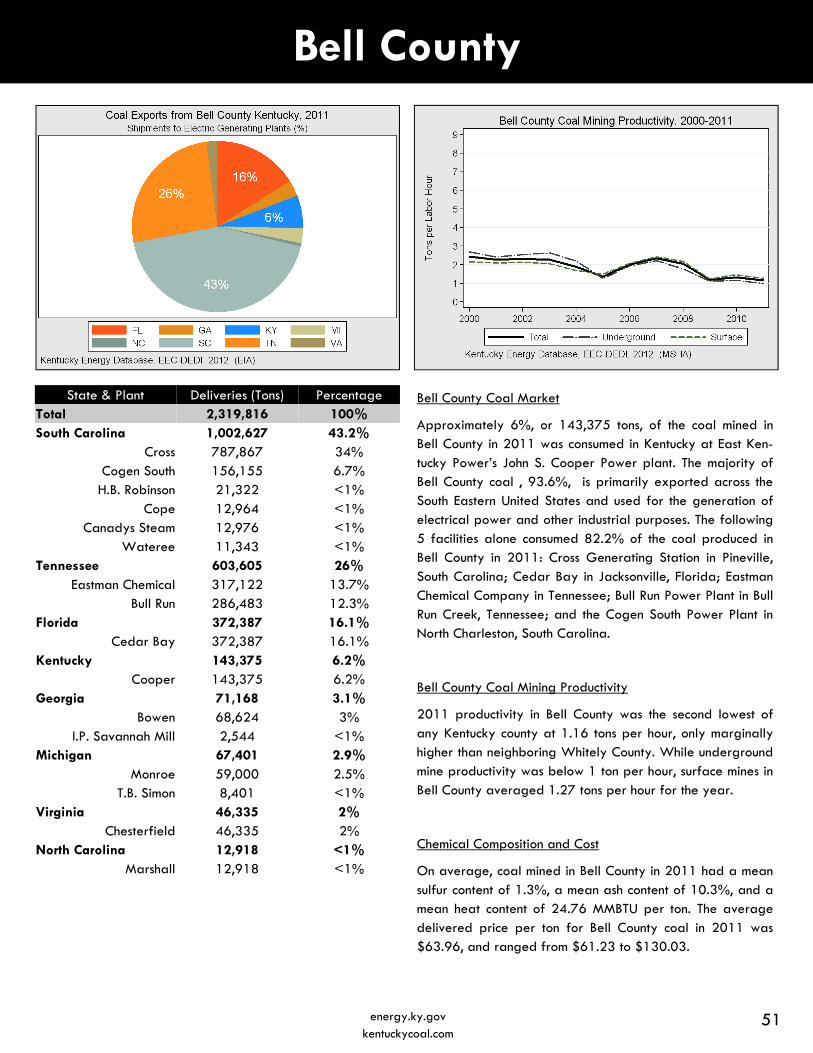
Bell County
Bell County Coal Market
Approximately 6%, or 143,375 tons, of the coal mined in Bell County in 2011 was consumed in Kentucky at East Ken-tucky Power’s John S. Cooper Power plant. The majority of Bell County coal , 93.6%, is primarily exported across the South Eastern United States and used for the generation of electrical power and other industrial purposes. The following 5 facilities alone consumed 82.2% of the coal produced in Bell County in 2011: Cross Generating Station in Pineville, South Carolina; Cedar Bay in Jacksonville, Florida; Eastman Chemical Company in Tennessee; Bull Run Power Plant in Bull Run Creek, Tennessee; and the Cogen South Power Plant in North Charleston, South Carolina.
Bell County Coal Mining Productivity
2011 productivity in Bell County was the second lowest of any Kentucky county at 1.16 tons per hour, only marginally higher than neighboring Whitely County. While underground mine productivity was below 1 ton per hour, surface mines in Bell County averaged 1.27 tons per hour for the year.
Chemical Composition and Cost
On average, coal mined in Bell County in 2011 had a mean sulfur content of 1.3%, a mean ash content of 10.3%, and a mean heat content of 24.76 MMBTU per ton. The average delivered price per ton for Bell County coal in 2011 was $63.96, and ranged from $61.23 to $130.03.
State & Plant Deliveries (Tons) Percentage Total 2,319,816 100% South Carolina 1,002,627 43.2%
Cross 787,867 34% Cogen South 156,155 6.7%
H.B. Robinson 21,322 <1% Cope 12,964 <1%
Canadys Steam 12,976 <1% Wateree 11,343 <1%
Tennessee 603,605 26% Eastman Chemical 317,122 13.7%
Bull Run 286,483 12.3% Florida 372,387 16.1%
Cedar Bay 372,387 16.1% Kentucky 143,375 6.2%
Cooper 143,375 6.2% Georgia 71,168 3.1%
Bowen 68,624 3% I.P. Savannah Mill 2,544 <1%
Michigan 67,401 2.9% Monroe 59,000 2.5%
T.B. Simon 8,401 <1% Virginia 46,335 2%
Chesterfield 46,335 2% North Carolina 12,918 <1%
Marshall 12,918 <1%
51 energy.ky.gov kentuckycoal.com
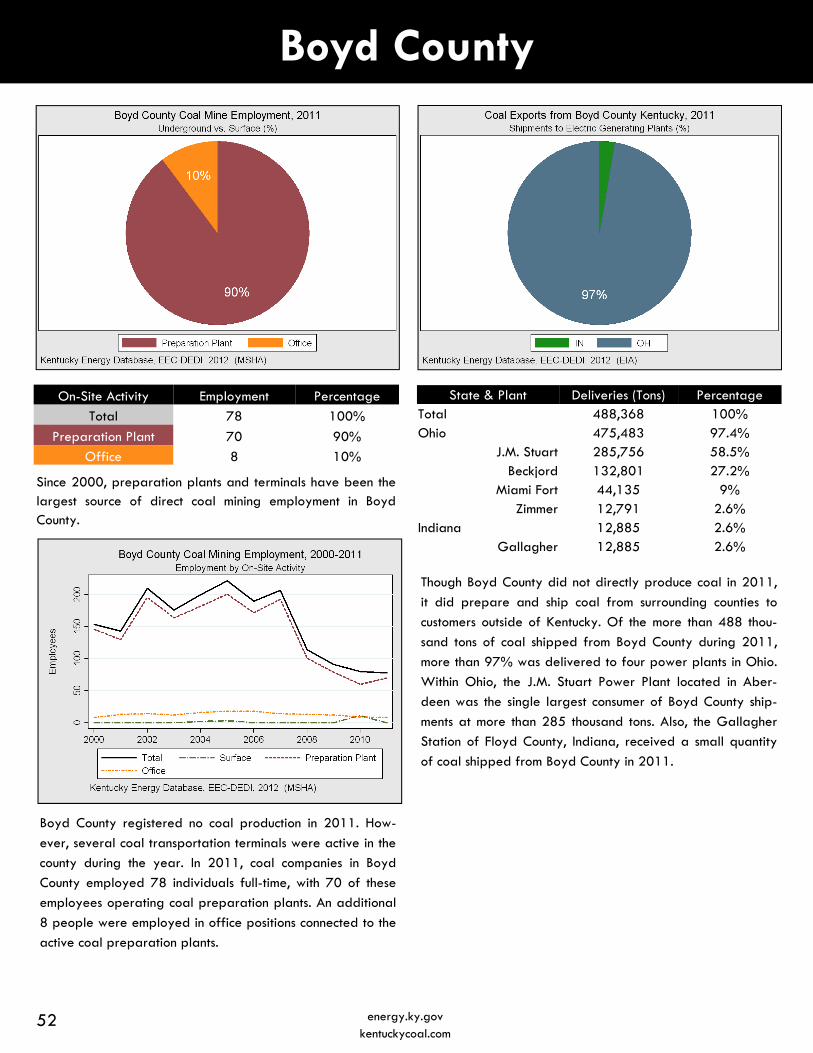
Boyd County
On-Site Activity Employment Percentage
Total 78 100%
Preparation Plant 70 90%
Office 8 10%
Boyd County registered no coal production in 2011. How-
ever, several coal transportation terminals were active in the
county during the year. In 2011, coal companies in Boyd
County employed 78 individuals full-time, with 70 of these
employees operating coal preparation plants. An additional
8 people were employed in office positions connected to the
active coal preparation plants.
Though Boyd County did not directly produce coal in 2011,
it did prepare and ship coal from surrounding counties to
customers outside of Kentucky. Of the more than 488 thou-
sand tons of coal shipped from Boyd County during 2011,
more than 97% was delivered to four power plants in Ohio.
Within Ohio, the J.M. Stuart Power Plant located in Aber-
deen was the single largest consumer of Boyd County ship-
ments at more than 285 thousand tons. Also, the Gallagher
Station of Floyd County, Indiana, received a small quantity
of coal shipped from Boyd County in 2011.
State & Plant Deliveries (Tons) Percentage Total 488,368 100% Ohio 475,483 97.4%
J.M. Stuart 285,756 58.5% Beckjord 132,801 27.2%
Miami Fort 44,135 9% Zimmer 12,791 2.6%
Indiana 12,885 2.6% Gallagher 12,885 2.6%
Since 2000, preparation plants and terminals have been the largest source of direct coal mining employment in Boyd County.
52 energy.ky.gov kentuckycoal.com
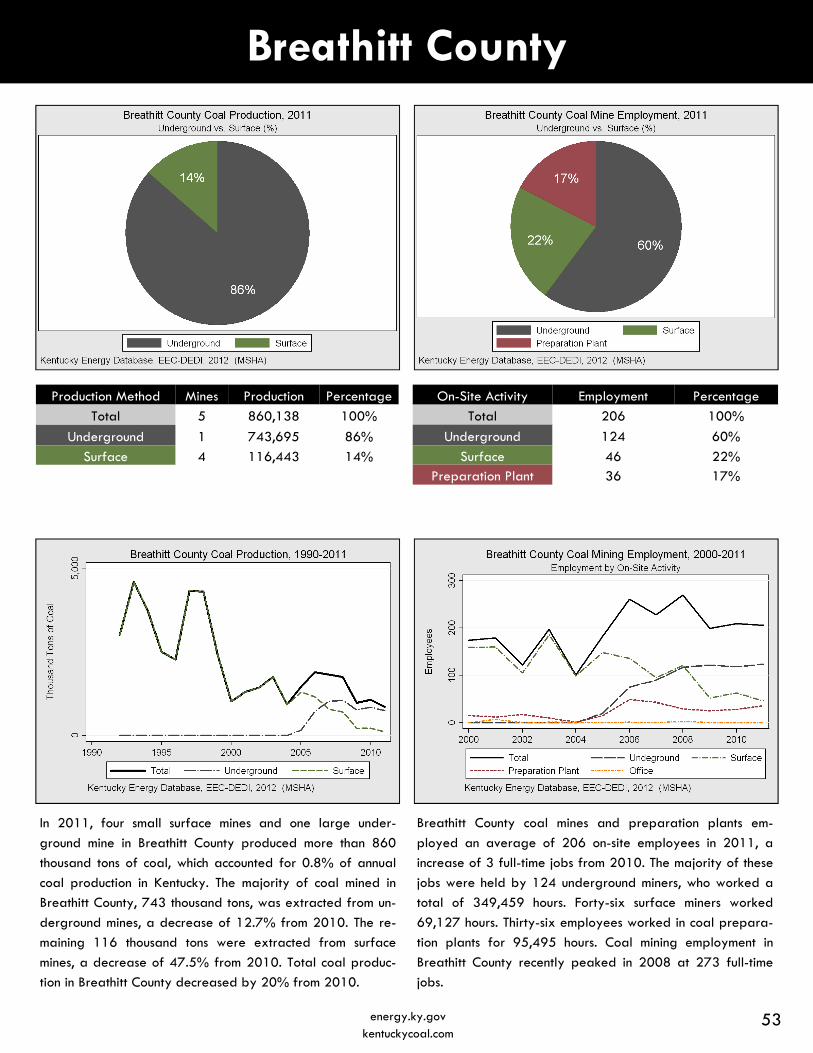
Breathitt County
On-Site Activity Employment Percentage
Total 206 100%
Underground 124 60%
Surface 46 22% Preparation Plant 36 17%
Production Method Production Percentage
Total 860,138 100%
Underground 743,695 86%
Surface 116,443 14%
Mines
5
1
4
In 2011, four small surface mines and one large under-
ground mine in Breathitt County produced more than 860
thousand tons of coal, which accounted for 0.8% of annual
coal production in Kentucky. The majority of coal mined in
Breathitt County, 743 thousand tons, was extracted from un-
derground mines, a decrease of 12.7% from 2010. The re-
maining 116 thousand tons were extracted from surface
mines, a decrease of 47.5% from 2010. Total coal produc-
tion in Breathitt County decreased by 20% from 2010.
Breathitt County coal mines and preparation plants em-
ployed an average of 206 on-site employees in 2011, a
increase of 3 full-time jobs from 2010. The majority of these
jobs were held by 124 underground miners, who worked a
total of 349,459 hours. Forty-six surface miners worked
69,127 hours. Thirty-six employees worked in coal prepara-
tion plants for 95,495 hours. Coal mining employment in
Breathitt County recently peaked in 2008 at 273 full-time
jobs.
53 energy.ky.gov kentuckycoal.com
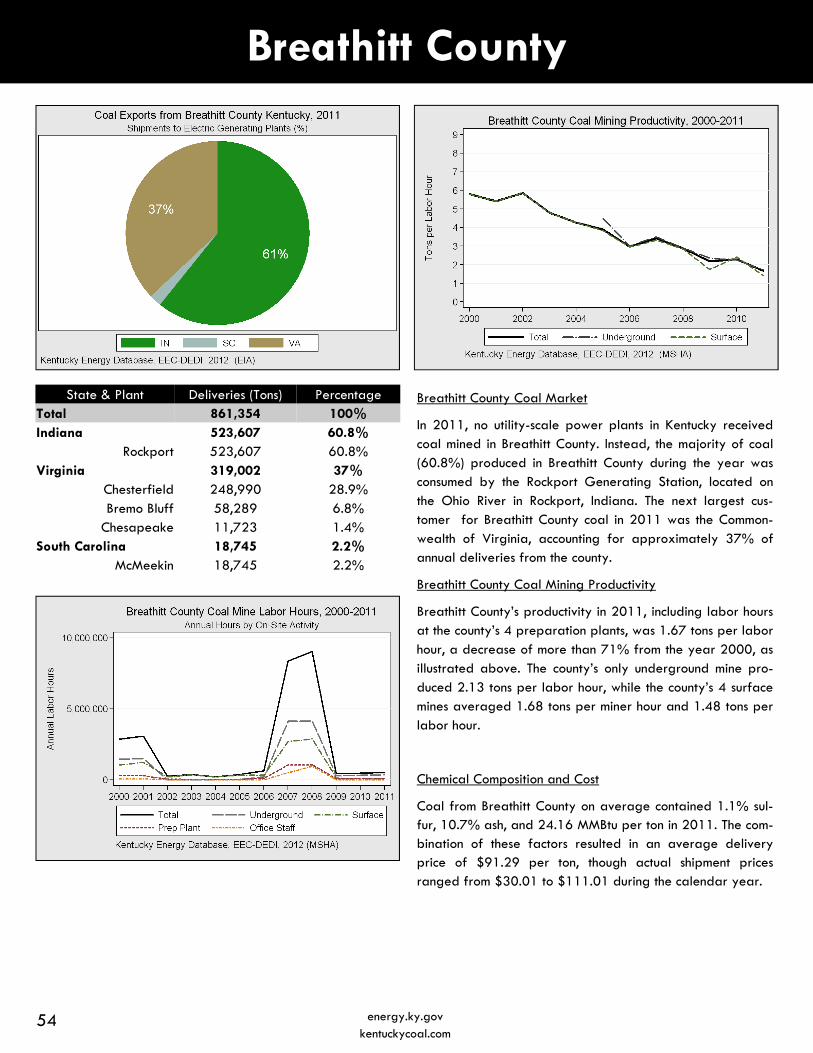
Breathitt County
Breathitt County Coal Market
In 2011, no utility-scale power plants in Kentucky received coal mined in Breathitt County. Instead, the majority of coal (60.8%) produced in Breathitt County during the year was consumed by the Rockport Generating Station, located on the Ohio River in Rockport, Indiana. The next largest cus-tomer for Breathitt County coal in 2011 was the Common-wealth of Virginia, accounting for approximately 37% of annual deliveries from the county.
Breathitt County Coal Mining Productivity
Breathitt County’s productivity in 2011, including labor hours at the county’s 4 preparation plants, was 1.67 tons per labor hour, a decrease of more than 71% from the year 2000, as illustrated above. The county’s only underground mine pro-duced 2.13 tons per labor hour, while the county’s 4 surface mines averaged 1.68 tons per miner hour and 1.48 tons per labor hour.
Chemical Composition and Cost
Coal from Breathitt County on average contained 1.1% sul-fur, 10.7% ash, and 24.16 MMBtu per ton in 2011. The com-bination of these factors resulted in an average delivery price of $91.29 per ton, though actual shipment prices ranged from $30.01 to $111.01 during the calendar year.
State & Plant Deliveries (Tons) Percentage Total 861,354 100% Indiana 523,607 60.8%
Rockport 523,607 60.8% Virginia 319,002 37%
Chesterfield 248,990 28.9% Bremo Bluff 58,289 6.8%
Chesapeake 11,723 1.4% South Carolina 18,745 2.2%
McMeekin 18,745 2.2%
54 energy.ky.gov kentuckycoal.com
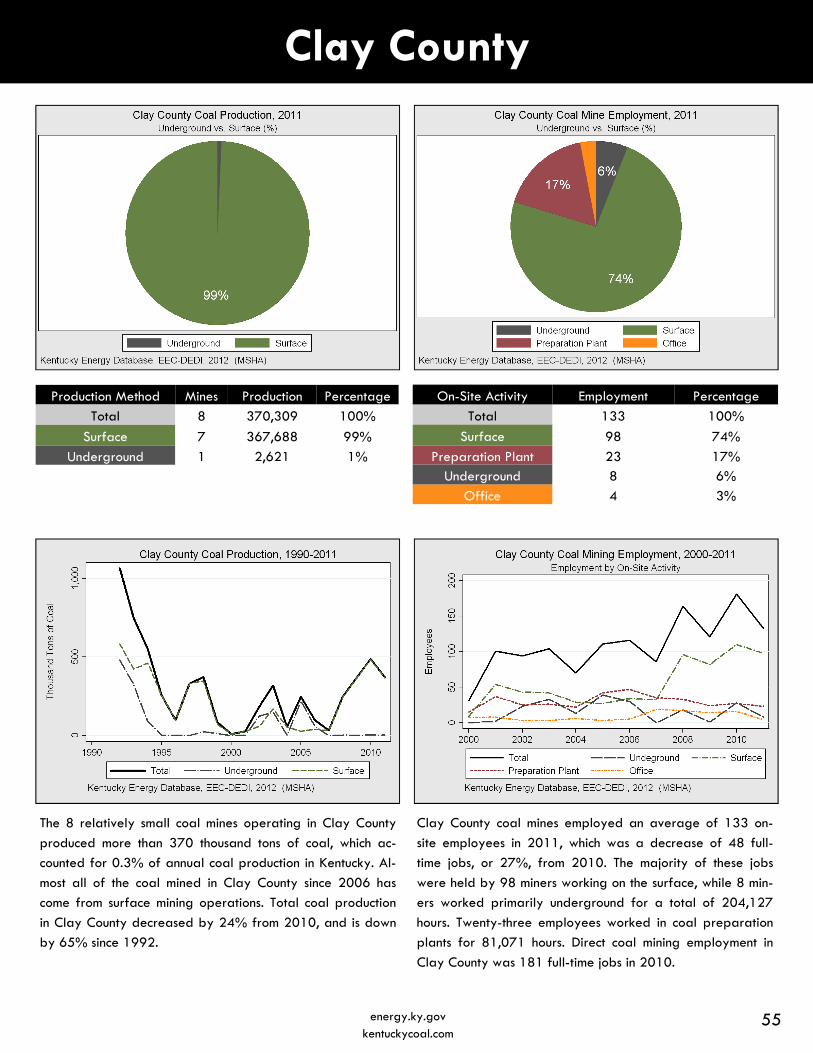
Clay County
On-Site Activity Employment Percentage
Total 133 100%
Surface 98 74%
Preparation Plant 23 17% Underground 8 6%
Office 4 3%
The 8 relatively small coal mines operating in Clay County
produced more than 370 thousand tons of coal, which ac-
counted for 0.3% of annual coal production in Kentucky. Al-
most all of the coal mined in Clay County since 2006 has
come from surface mining operations. Total coal production
in Clay County decreased by 24% from 2010, and is down
by 65% since 1992.
Clay County coal mines employed an average of 133 on-
site employees in 2011, which was a decrease of 48 full-
time jobs, or 27%, from 2010. The majority of these jobs
were held by 98 miners working on the surface, while 8 min-
ers worked primarily underground for a total of 204,127
hours. Twenty-three employees worked in coal preparation
plants for 81,071 hours. Direct coal mining employment in
Clay County was 181 full-time jobs in 2010.
Production Method Production Percentage
Total 370,309 100%
Surface 367,688 99%
Underground 2,621 1%
Mines
8
7
1
55 energy.ky.gov kentuckycoal.com
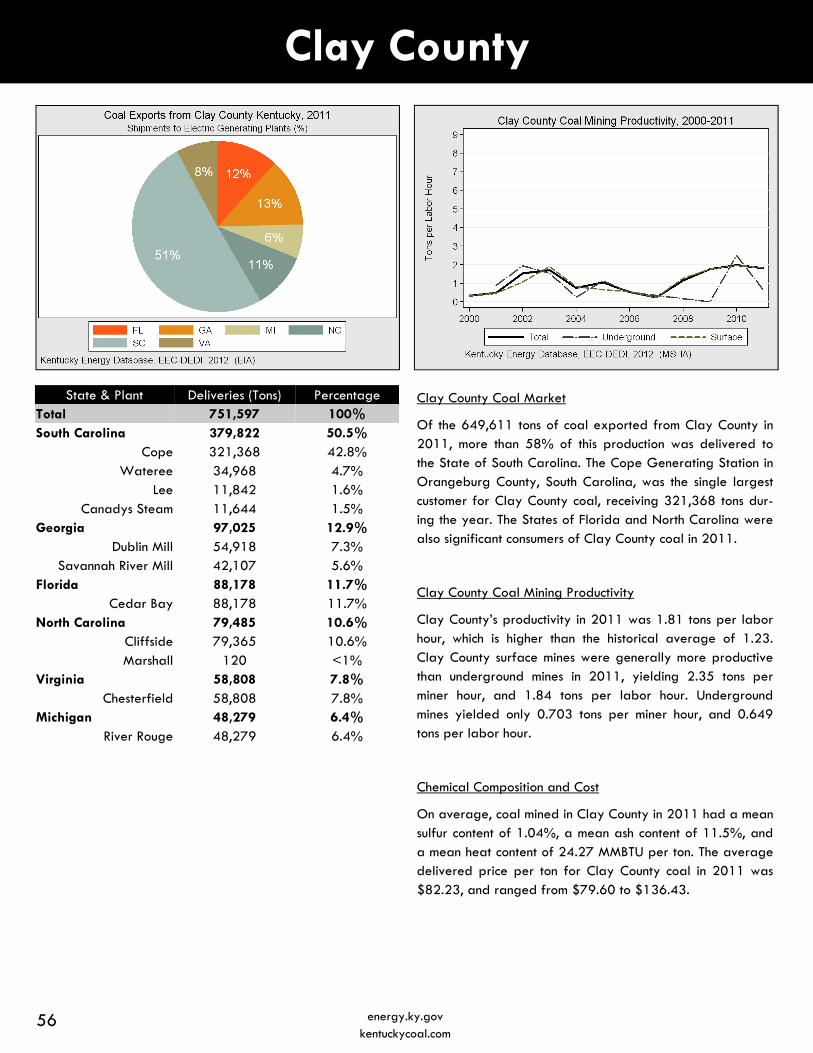
Clay County
Clay County Coal Market
Of the 649,611 tons of coal exported from Clay County in 2011, more than 58% of this production was delivered to the State of South Carolina. The Cope Generating Station in Orangeburg County, South Carolina, was the single largest customer for Clay County coal, receiving 321,368 tons dur-ing the year. The States of Florida and North Carolina were also significant consumers of Clay County coal in 2011.
Clay County Coal Mining Productivity
Clay County’s productivity in 2011 was 1.81 tons per labor hour, which is higher than the historical average of 1.23. Clay County surface mines were generally more productive than underground mines in 2011, yielding 2.35 tons per miner hour, and 1.84 tons per labor hour. Underground mines yielded only 0.703 tons per miner hour, and 0.649 tons per labor hour.
Chemical Composition and Cost
On average, coal mined in Clay County in 2011 had a mean sulfur content of 1.04%, a mean ash content of 11.5%, and a mean heat content of 24.27 MMBTU per ton. The average delivered price per ton for Clay County coal in 2011 was $82.23, and ranged from $79.60 to $136.43.
State & Plant Deliveries (Tons) Percentage Total 751,597 100% South Carolina 379,822 50.5%
Cope 321,368 42.8% Wateree 34,968 4.7%
Lee 11,842 1.6% Canadys Steam 11,644 1.5%
Georgia 97,025 12.9% Dublin Mill 54,918 7.3%
Savannah River Mill 42,107 5.6% Florida 88,178 11.7%
Cedar Bay 88,178 11.7% North Carolina 79,485 10.6%
Cliffside 79,365 10.6% Marshall 120 <1%
Virginia 58,808 7.8% Chesterfield 58,808 7.8%
Michigan 48,279 6.4% River Rouge 48,279 6.4%
56 energy.ky.gov kentuckycoal.com
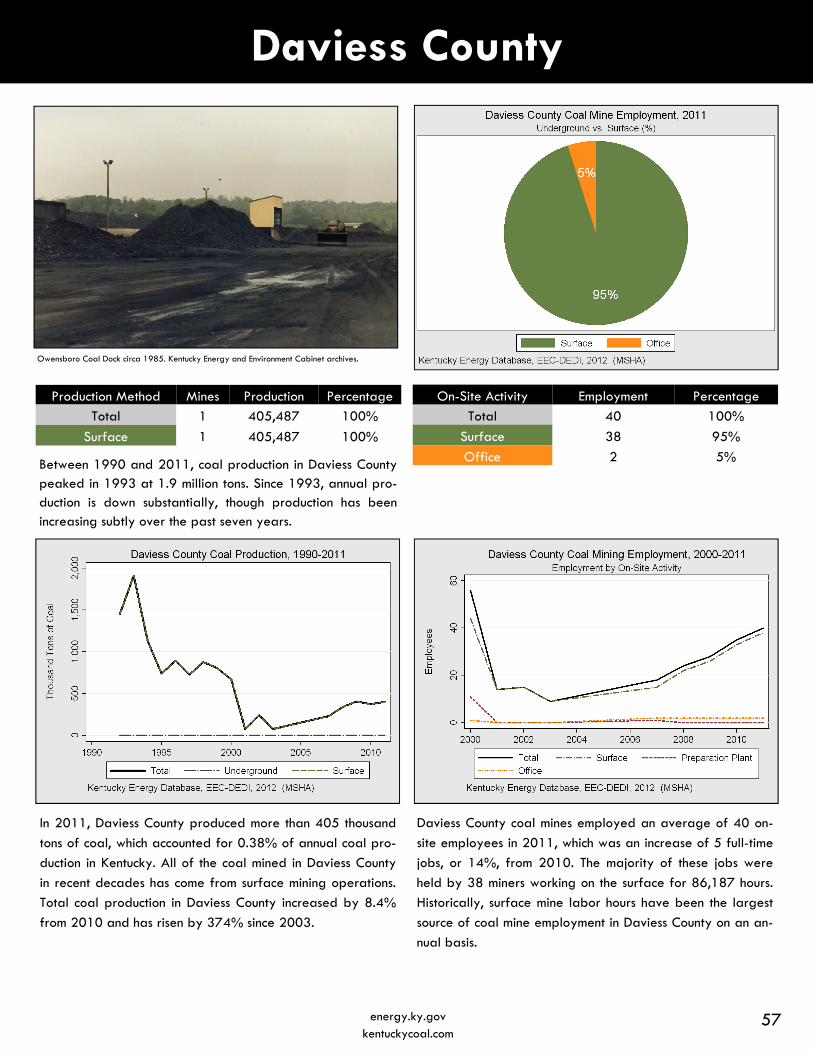
Production Method Production Percentage
Total 405,487 100%
Surface 405,487 100%
Mines
1
1
Daviess County
On-Site Activity Employment Percentage
Total 40 100%
Surface 38 95%
Office 2 5%
In 2011, Daviess County produced more than 405 thousand
tons of coal, which accounted for 0.38% of annual coal pro-
duction in Kentucky. All of the coal mined in Daviess County
in recent decades has come from surface mining operations.
Total coal production in Daviess County increased by 8.4%
from 2010 and has risen by 374% since 2003.
Daviess County coal mines employed an average of 40 on-
site employees in 2011, which was an increase of 5 full-time
jobs, or 14%, from 2010. The majority of these jobs were
held by 38 miners working on the surface for 86,187 hours.
Historically, surface mine labor hours have been the largest
source of coal mine employment in Daviess County on an an-
nual basis.
Between 1990 and 2011, coal production in Daviess County peaked in 1993 at 1.9 million tons. Since 1993, annual pro-duction is down substantially, though production has been increasing subtly over the past seven years.
Owensboro Coal Dock circa 1985. Kentucky Energy and Environment Cabinet archives.
57 energy.ky.gov kentuckycoal.com
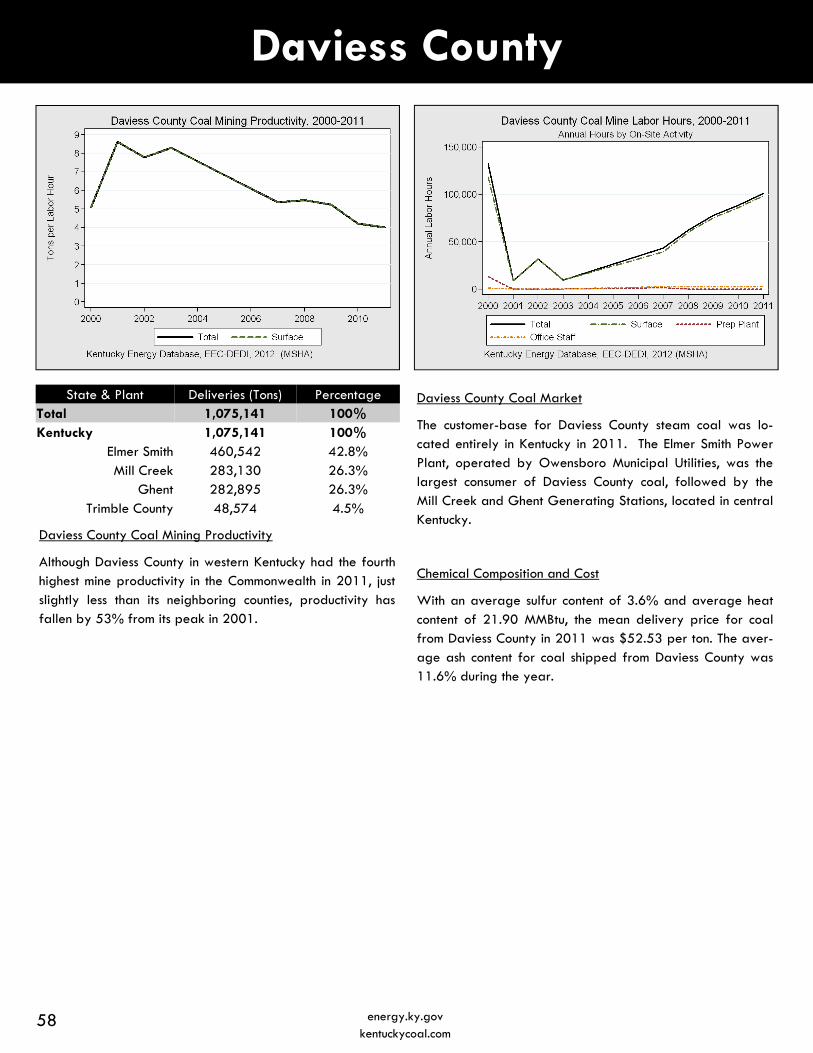
Daviess County
Daviess County Coal Market
The customer-base for Daviess County steam coal was lo-cated entirely in Kentucky in 2011. The Elmer Smith Power Plant, operated by Owensboro Municipal Utilities, was the largest consumer of Daviess County coal, followed by the Mill Creek and Ghent Generating Stations, located in central Kentucky.
Chemical Composition and Cost
With an average sulfur content of 3.6% and average heat content of 21.90 MMBtu, the mean delivery price for coal from Daviess County in 2011 was $52.53 per ton. The aver-age ash content for coal shipped from Daviess County was 11.6% during the year.
State & Plant Deliveries (Tons) Percentage Total 1,075,141 100% Kentucky 1,075,141 100%
Elmer Smith 460,542 42.8% Mill Creek 283,130 26.3%
Ghent 282,895 26.3% Trimble County 48,574 4.5%
Daviess County Coal Mining Productivity
Although Daviess County in western Kentucky had the fourth highest mine productivity in the Commonwealth in 2011, just slightly less than its neighboring counties, productivity has fallen by 53% from its peak in 2001.
58 energy.ky.gov kentuckycoal.com

Floyd County
On-Site Activity Employment Percentage
Total 599 100%
Surface 301 50%
Underground 227 38% Preparation Plant 51 9%
Office 20 3%
The 30 coal mines and 4 preparation plants in Floyd County
produced more than 2.7 million tons of coal in 2011, which
accounted for 2.5% of annual coal production in Kentucky.
Two-thirds of the coal mined in Floyd County came from sur-
face mining operations and one-third from underground
mines. While Floyd County production increased by 54%
from 2010, it has fallen by 63% from 1994 when the county
produced more than 7 million tons.
Coal mines and preparation plants in Floyd County em-
ployed approximately 600 persons on-site in 2011, which
was an increase of 209 full-time jobs, or 53%, from 2010.
Half of these jobs were held by surface miners who worked
a total of 590,677 hours. 227 coal miners worked primarily
underground for a total of 384,911 hours. 59 coal prepara-
tion plant employees worked 113,069 hours, and 20 admin-
istrative staff logged a total of 40,252 hours.
Production Method Production Percentage
Total 2,702,302 100%
Surface 1,785,218 66%
Underground 917,084 34%
Mines
30
18
12
59 energy.ky.gov kentuckycoal.com
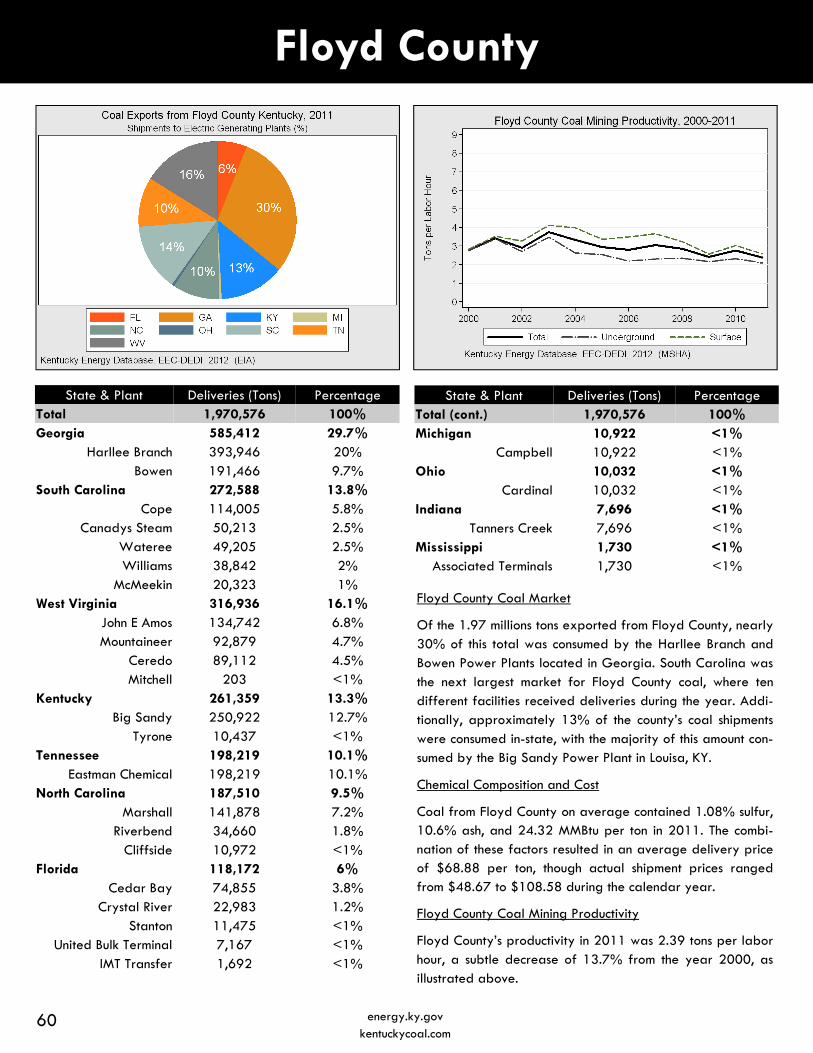
Floyd County
60 energy.ky.gov kentuckycoal.com
Floyd County Coal Market
Of the 1.97 millions tons exported from Floyd County, nearly 30% of this total was consumed by the Harllee Branch and Bowen Power Plants located in Georgia. South Carolina was the next largest market for Floyd County coal, where ten different facilities received deliveries during the year. Addi-tionally, approximately 13% of the county’s coal shipments were consumed in-state, with the majority of this amount con-sumed by the Big Sandy Power Plant in Louisa, KY.
Chemical Composition and Cost
Coal from Floyd County on average contained 1.08% sulfur, 10.6% ash, and 24.32 MMBtu per ton in 2011. The combi-nation of these factors resulted in an average delivery price of $68.88 per ton, though actual shipment prices ranged from $48.67 to $108.58 during the calendar year.
Floyd County Coal Mining Productivity
Floyd County’s productivity in 2011 was 2.39 tons per labor hour, a subtle decrease of 13.7% from the year 2000, as illustrated above.
State & Plant Deliveries (Tons) Percentage Total 1,970,576 100% Georgia 585,412 29.7%
Harllee Branch 393,946 20% Bowen 191,466 9.7%
South Carolina 272,588 13.8% Cope 114,005 5.8%
Canadys Steam 50,213 2.5% Wateree 49,205 2.5% Williams 38,842 2%
McMeekin 20,323 1% West Virginia 316,936 16.1%
John E Amos 134,742 6.8% Mountaineer 92,879 4.7%
Ceredo 89,112 4.5% Mitchell 203 <1%
Kentucky 261,359 13.3% Big Sandy 250,922 12.7%
Tyrone 10,437 <1% Tennessee 198,219 10.1%
Eastman Chemical 198,219 10.1% North Carolina 187,510 9.5%
Marshall 141,878 7.2% Riverbend 34,660 1.8%
Cliffside 10,972 <1% Florida 118,172 6%
Cedar Bay 74,855 3.8% Crystal River 22,983 1.2%
Stanton 11,475 <1% United Bulk Terminal 7,167 <1%
IMT Transfer 1,692 <1%
State & Plant Deliveries (Tons) Percentage Total (cont.) 1,970,576 100% Michigan 10,922 <1%
Campbell 10,922 <1% Ohio 10,032 <1%
Cardinal 10,032 <1% Indiana 7,696 <1%
Tanners Creek 7,696 <1% Mississippi 1,730 <1%
Associated Terminals 1,730 <1%

Harlan County
On-Site Activity Employment Percentage
Total 2,310 100%
Underground 1,390 60%
Surface 677 22% Preparation Plant 190 17%
Office 53 2%
Harlan County produced nearly 9.7 million tons of coal in
2011, which was 9.1% of total production in the Common-
wealth, making it the fourth-largest coal-producing county in
Kentucky. Yet, production decreased by 7.9% from 2010.
Seventy-one percent of the coal produced in 2011 in Harlan
County came from underground mining operations, while only
29% from surface mines. From 2001 to 2010, Harlan
County’s production averaged 10 million tons annually.
The 2,310 individuals employed at Harlan County’s 62 coal
mines and 13 preparation plants in 2011 represented 12%
of all mining employment across Kentucky. While employ-
ment decreased by 6% from 2010, it has risen steadily over
the past decade, adding 708 jobs since 2000. The majority
of these jobs were held by 1,390 underground miners, who
worked a total of 3.25 million hours. 677 surface miners
worked 1.5 million hours. 190 employees worked in prepa-
ration plants and 53 in on-site offices. 56thousand hours.
Production Method Production Percentage
Total 9,681,888 100%
Underground 6,900,245 71%
Surface 2,781,643 29%
Mines
62
29
33
61 energy.ky.gov kentuckycoal.com
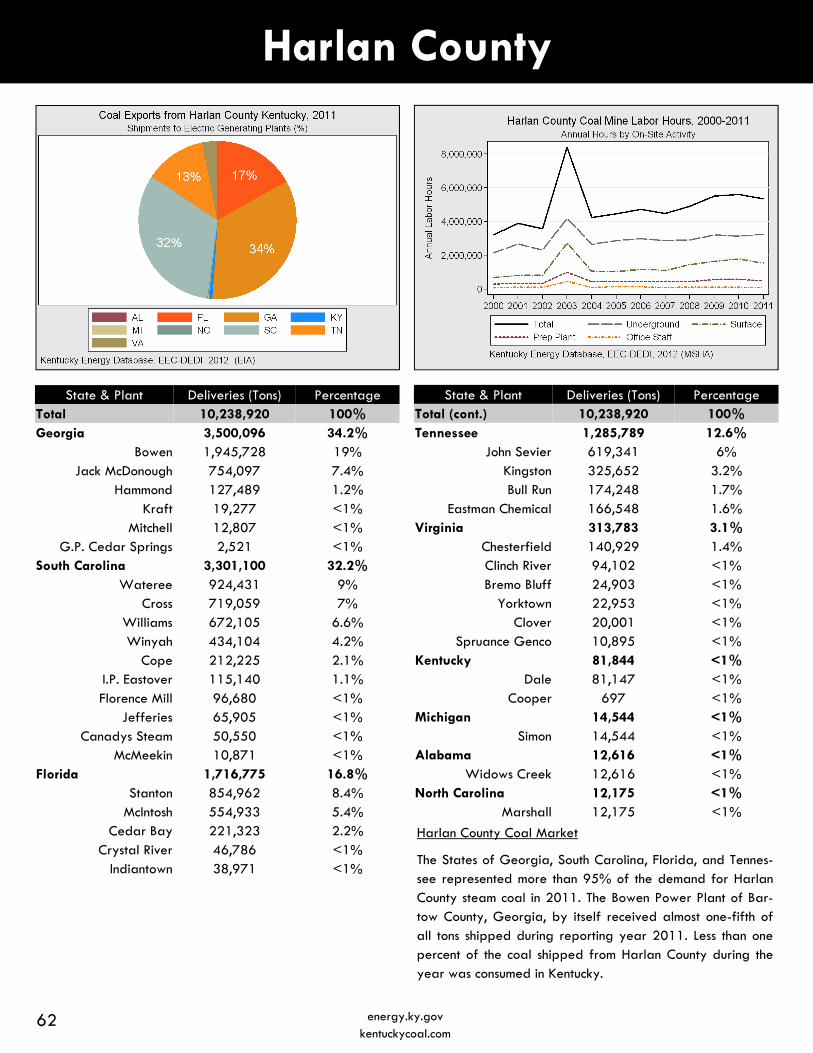
Harlan County
62 energy.ky.gov kentuckycoal.com
Harlan County Coal Market
The States of Georgia, South Carolina, Florida, and Tennes-see represented more than 95% of the demand for Harlan County steam coal in 2011. The Bowen Power Plant of Bar-tow County, Georgia, by itself received almost one-fifth of all tons shipped during reporting year 2011. Less than one percent of the coal shipped from Harlan County during the year was consumed in Kentucky.
State & Plant Deliveries (Tons) Percentage Total 10,238,920 100% Georgia 3,500,096 34.2%
Bowen 1,945,728 19% Jack McDonough 754,097 7.4%
Hammond 127,489 1.2% Kraft 19,277 <1%
Mitchell 12,807 <1% G.P. Cedar Springs 2,521 <1%
South Carolina 3,301,100 32.2% Wateree 924,431 9%
Cross 719,059 7% Williams 672,105 6.6% Winyah 434,104 4.2%
Cope 212,225 2.1% I.P. Eastover 115,140 1.1% Florence Mill 96,680 <1%
Jefferies 65,905 <1% Canadys Steam 50,550 <1%
McMeekin 10,871 <1% Florida 1,716,775 16.8%
Stanton 854,962 8.4% McIntosh 554,933 5.4%
Cedar Bay 221,323 2.2% Crystal River 46,786 <1%
Indiantown 38,971 <1%
State & Plant Deliveries (Tons) Percentage Total (cont.) 10,238,920 100% Tennessee 1,285,789 12.6%
John Sevier 619,341 6% Kingston 325,652 3.2% Bull Run 174,248 1.7%
Eastman Chemical 166,548 1.6% Virginia 313,783 3.1%
Chesterfield 140,929 1.4% Clinch River 94,102 <1% Bremo Bluff 24,903 <1%
Yorktown 22,953 <1% Clover 20,001 <1%
Spruance Genco 10,895 <1% Kentucky 81,844 <1%
Dale 81,147 <1% Cooper 697 <1%
Michigan 14,544 <1% Simon 14,544 <1%
Alabama 12,616 <1% Widows Creek 12,616 <1%
North Carolina 12,175 <1% Marshall 12,175 <1%
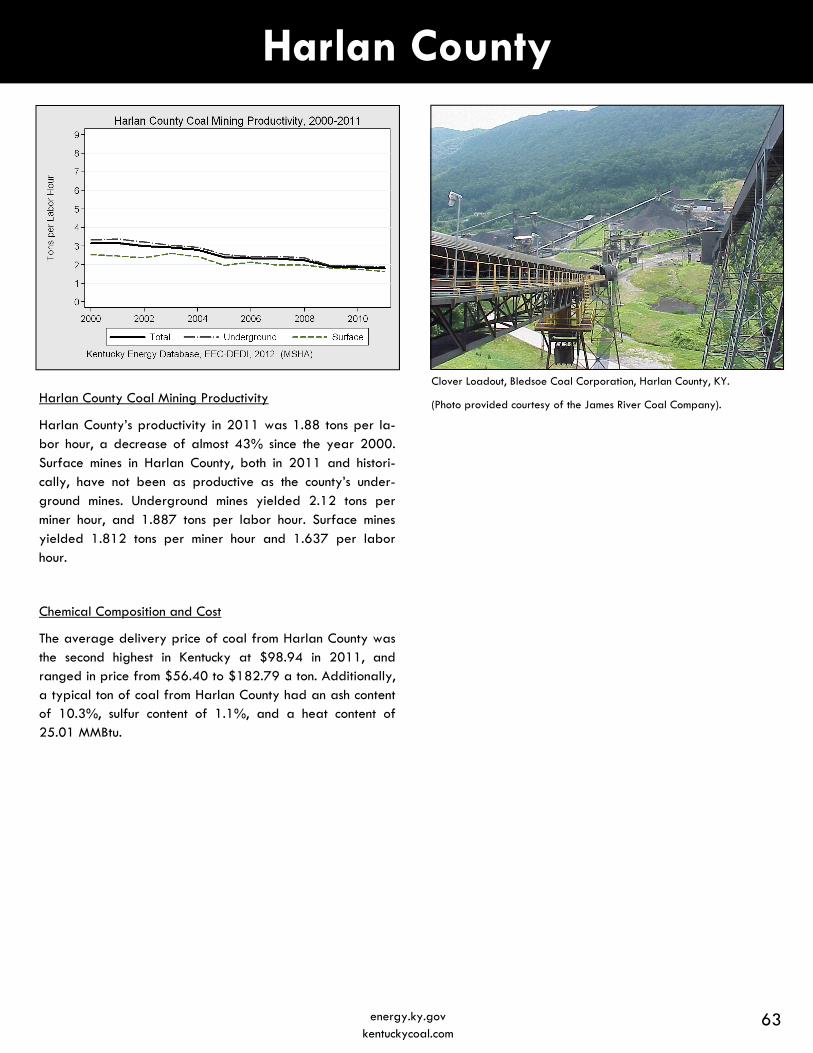
Harlan County
Harlan County Coal Mining Productivity
Harlan County’s productivity in 2011 was 1.88 tons per la-bor hour, a decrease of almost 43% since the year 2000. Surface mines in Harlan County, both in 2011 and histori-cally, have not been as productive as the county’s under-ground mines. Underground mines yielded 2.12 tons per miner hour, and 1.887 tons per labor hour. Surface mines yielded 1.812 tons per miner hour and 1.637 per labor hour.
Chemical Composition and Cost
The average delivery price of coal from Harlan County was the second highest in Kentucky at $98.94 in 2011, and ranged in price from $56.40 to $182.79 a ton. Additionally, a typical ton of coal from Harlan County had an ash content of 10.3%, sulfur content of 1.1%, and a heat content of 25.01 MMBtu.
Clover Loadout, Bledsoe Coal Corporation, Harlan County, KY.
(Photo provided courtesy of the James River Coal Company).
63 energy.ky.gov kentuckycoal.com
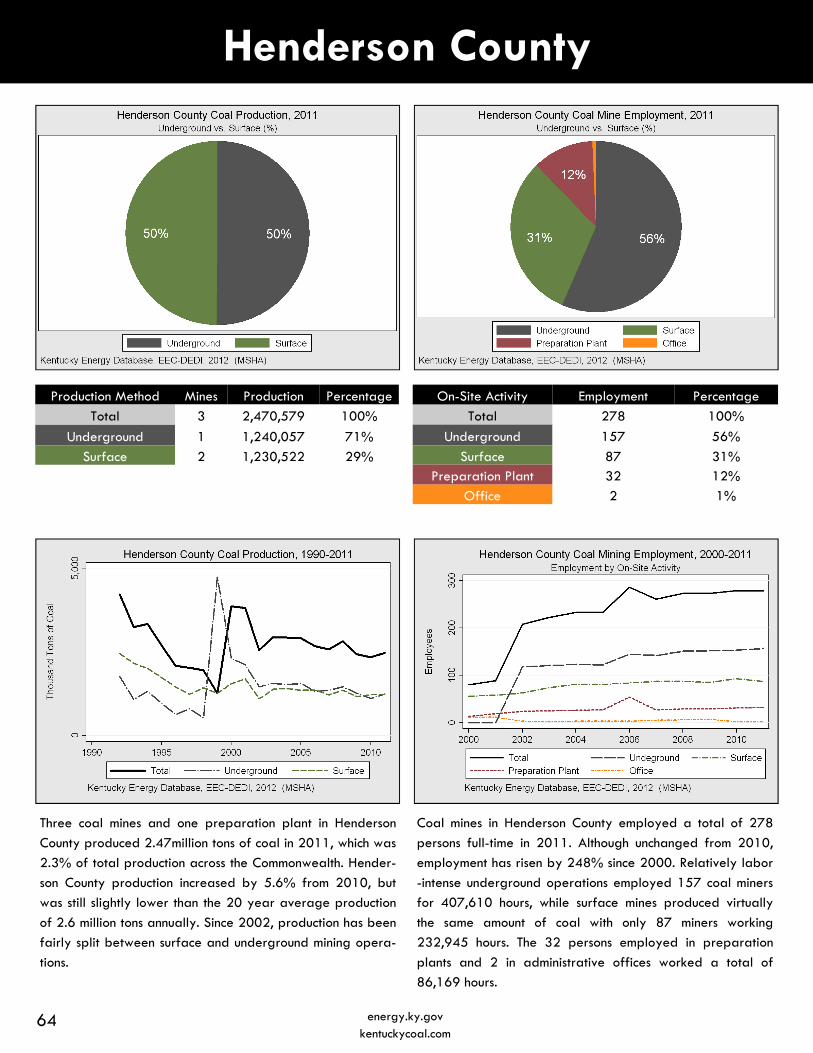
Henderson County
On-Site Activity Employment Percentage
Total 278 100%
Underground 157 56%
Surface 87 31% Preparation Plant 32 12%
Office 2 1%
Three coal mines and one preparation plant in Henderson
County produced 2.47million tons of coal in 2011, which was
2.3% of total production across the Commonwealth. Hender-
son County production increased by 5.6% from 2010, but
was still slightly lower than the 20 year average production
of 2.6 million tons annually. Since 2002, production has been
fairly split between surface and underground mining opera-
tions.
Coal mines in Henderson County employed a total of 278
persons full-time in 2011. Although unchanged from 2010,
employment has risen by 248% since 2000. Relatively labor
-intense underground operations employed 157 coal miners
for 407,610 hours, while surface mines produced virtually
the same amount of coal with only 87 miners working
232,945 hours. The 32 persons employed in preparation
plants and 2 in administrative offices worked a total of
86,169 hours.
Production Method Production Percentage
Total 2,470,579 100%
Underground 1,240,057 71%
Surface 1,230,522 29%
Mines
3
1
2
64 energy.ky.gov kentuckycoal.com
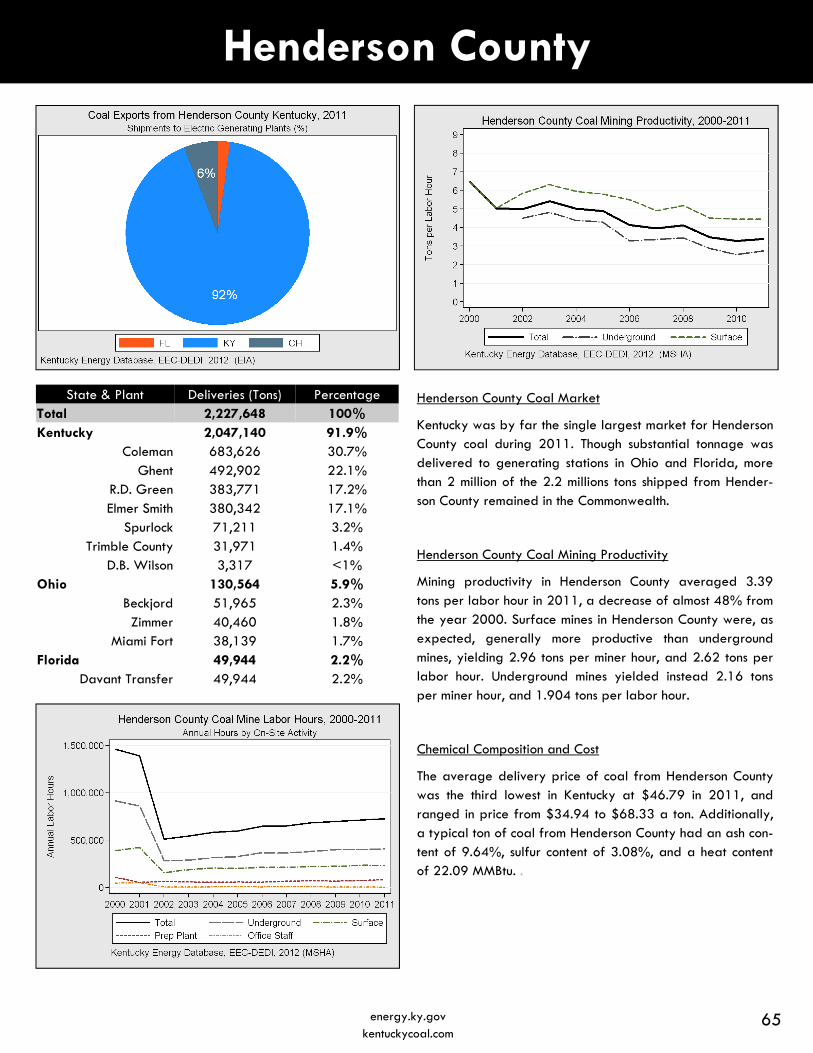
Henderson County
Henderson County Coal Market
Kentucky was by far the single largest market for Henderson County coal during 2011. Though substantial tonnage was delivered to generating stations in Ohio and Florida, more than 2 million of the 2.2 millions tons shipped from Hender-son County remained in the Commonwealth.
Henderson County Coal Mining Productivity
Mining productivity in Henderson County averaged 3.39 tons per labor hour in 2011, a decrease of almost 48% from the year 2000. Surface mines in Henderson County were, as expected, generally more productive than underground mines, yielding 2.96 tons per miner hour, and 2.62 tons per labor hour. Underground mines yielded instead 2.16 tons per miner hour, and 1.904 tons per labor hour.
Chemical Composition and Cost
The average delivery price of coal from Henderson County was the third lowest in Kentucky at $46.79 in 2011, and ranged in price from $34.94 to $68.33 a ton. Additionally, a typical ton of coal from Henderson County had an ash con-tent of 9.64%, sulfur content of 3.08%, and a heat content of 22.09 MMBtu. .
State & Plant Deliveries (Tons) Percentage Total 2,227,648 100% Kentucky 2,047,140 91.9%
Coleman 683,626 30.7% Ghent 492,902 22.1%
R.D. Green 383,771 17.2% Elmer Smith 380,342 17.1%
Spurlock 71,211 3.2% Trimble County 31,971 1.4%
D.B. Wilson 3,317 <1% Ohio 130,564 5.9%
Beckjord 51,965 2.3% Zimmer 40,460 1.8%
Miami Fort 38,139 1.7% Florida 49,944 2.2%
Davant Transfer 49,944 2.2%
65 energy.ky.gov kentuckycoal.com
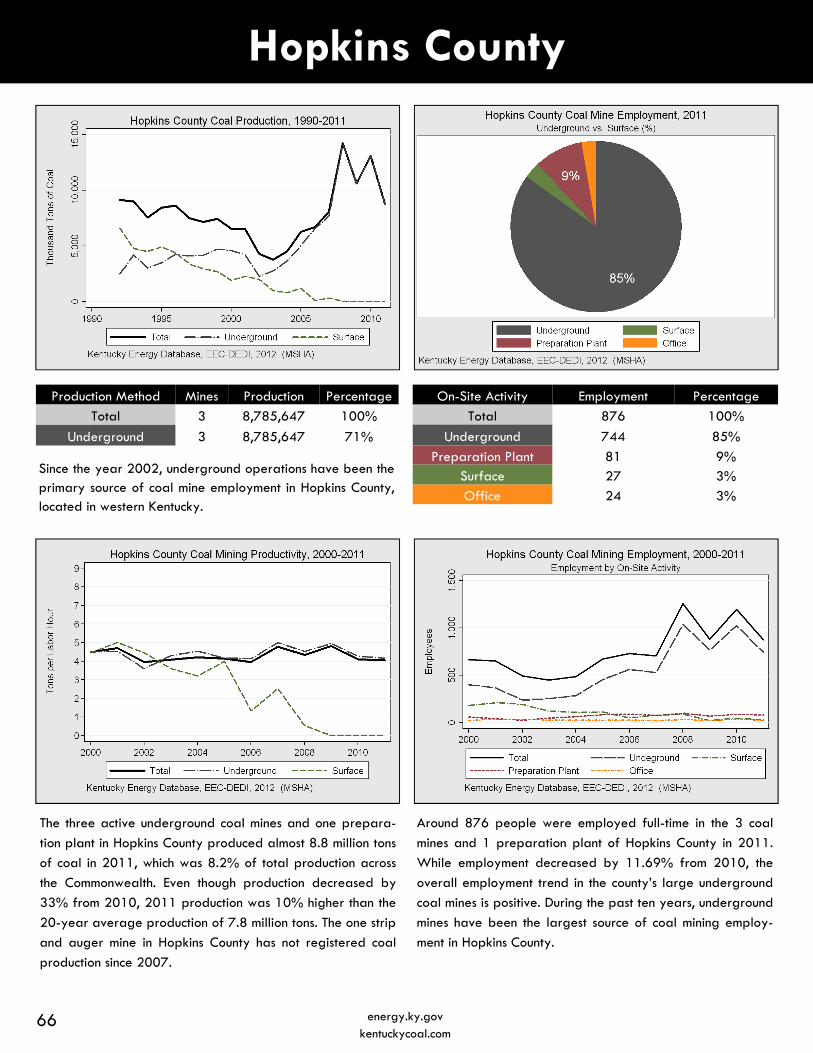
Hopkins County
On-Site Activity Employment Percentage
Total 876 100%
Underground 744 85%
Preparation Plant 81 9% Surface 27 3% Office 24 3%
The three active underground coal mines and one prepara-
tion plant in Hopkins County produced almost 8.8 million tons
of coal in 2011, which was 8.2% of total production across
the Commonwealth. Even though production decreased by
33% from 2010, 2011 production was 10% higher than the
20-year average production of 7.8 million tons. The one strip
and auger mine in Hopkins County has not registered coal
production since 2007.
Around 876 people were employed full-time in the 3 coal
mines and 1 preparation plant of Hopkins County in 2011.
While employment decreased by 11.69% from 2010, the
overall employment trend in the county’s large underground
coal mines is positive. During the past ten years, underground
mines have been the largest source of coal mining employ-
ment in Hopkins County.
Production Method Production Percentage
Total 8,785,647 100%
Underground 8,785,647 71%
Mines
3
3
Since the year 2002, underground operations have been the primary source of coal mine employment in Hopkins County, located in western Kentucky.
66 energy.ky.gov kentuckycoal.com
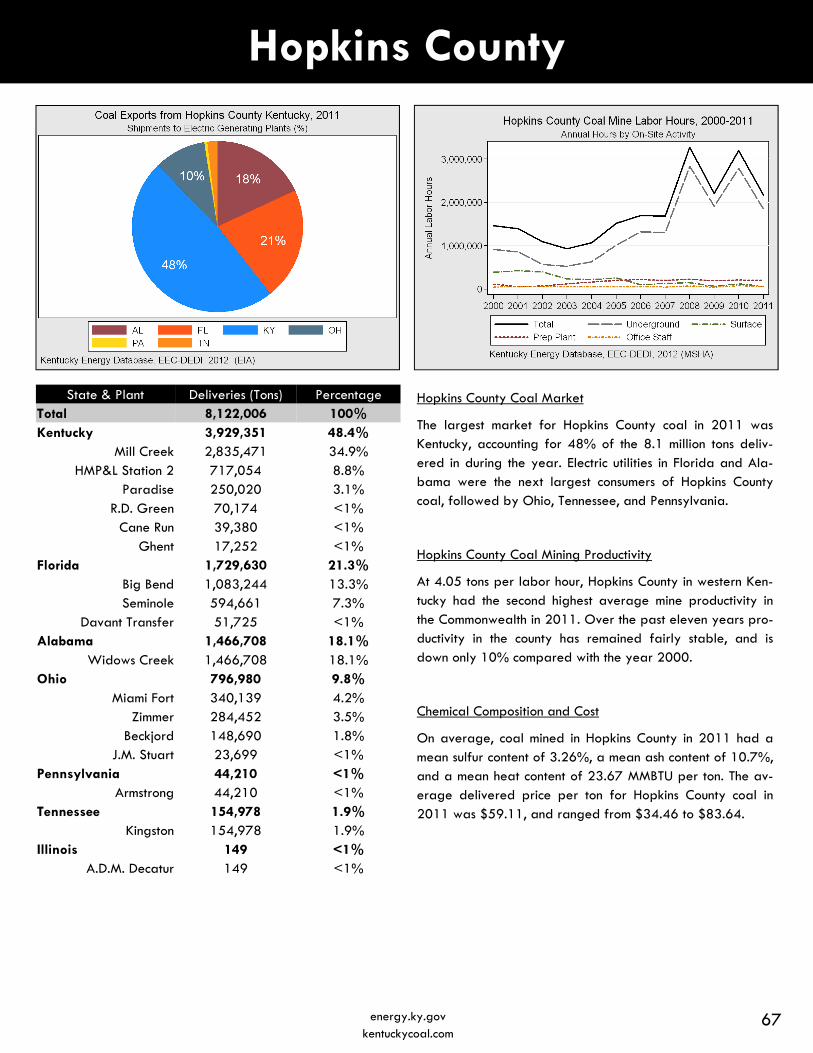
Hopkins County
Hopkins County Coal Market
The largest market for Hopkins County coal in 2011 was Kentucky, accounting for 48% of the 8.1 million tons deliv-ered in during the year. Electric utilities in Florida and Ala-bama were the next largest consumers of Hopkins County coal, followed by Ohio, Tennessee, and Pennsylvania.
Hopkins County Coal Mining Productivity
At 4.05 tons per labor hour, Hopkins County in western Ken-tucky had the second highest average mine productivity in the Commonwealth in 2011. Over the past eleven years pro-ductivity in the county has remained fairly stable, and is down only 10% compared with the year 2000.
Chemical Composition and Cost
On average, coal mined in Hopkins County in 2011 had a mean sulfur content of 3.26%, a mean ash content of 10.7%, and a mean heat content of 23.67 MMBTU per ton. The av-erage delivered price per ton for Hopkins County coal in 2011 was $59.11, and ranged from $34.46 to $83.64.
State & Plant Deliveries (Tons) Percentage Total 8,122,006 100% Kentucky 3,929,351 48.4%
Mill Creek 2,835,471 34.9% HMP&L Station 2 717,054 8.8%
Paradise 250,020 3.1% R.D. Green 70,174 <1%
Cane Run 39,380 <1% Ghent 17,252 <1%
Florida 1,729,630 21.3% Big Bend 1,083,244 13.3% Seminole 594,661 7.3%
Davant Transfer 51,725 <1% Alabama 1,466,708 18.1%
Widows Creek 1,466,708 18.1% Ohio 796,980 9.8%
Miami Fort 340,139 4.2% Zimmer 284,452 3.5%
Beckjord 148,690 1.8% J.M. Stuart 23,699 <1%
Pennsylvania 44,210 <1% Armstrong 44,210 <1%
Tennessee 154,978 1.9% Kingston 154,978 1.9%
Illinois 149 <1% A.D.M. Decatur 149 <1%
67 energy.ky.gov kentuckycoal.com
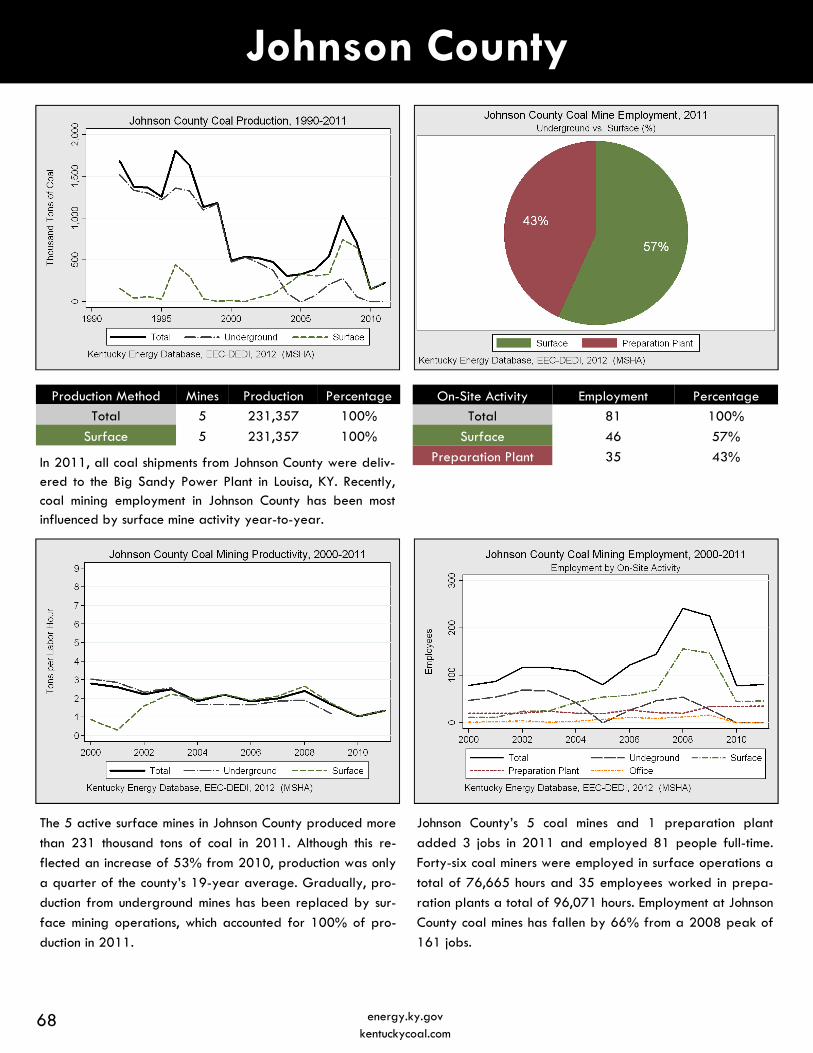
Johnson County
On-Site Activity Employment Percentage
Total 81 100%
Surface 46 57%
Preparation Plant 35 43%
The 5 active surface mines in Johnson County produced more
than 231 thousand tons of coal in 2011. Although this re-
flected an increase of 53% from 2010, production was only
a quarter of the county’s 19-year average. Gradually, pro-
duction from underground mines has been replaced by sur-
face mining operations, which accounted for 100% of pro-
duction in 2011.
Johnson County’s 5 coal mines and 1 preparation plant
added 3 jobs in 2011 and employed 81 people full-time.
Forty-six coal miners were employed in surface operations a
total of 76,665 hours and 35 employees worked in prepa-
ration plants a total of 96,071 hours. Employment at Johnson
County coal mines has fallen by 66% from a 2008 peak of
161 jobs.
Production Method Production Percentage
Total 231,357 100%
Surface 231,357 100%
Mines
5
5
In 2011, all coal shipments from Johnson County were deliv-ered to the Big Sandy Power Plant in Louisa, KY. Recently, coal mining employment in Johnson County has been most influenced by surface mine activity year-to-year.
68 energy.ky.gov kentuckycoal.com

Knott County
On-Site Activity Employment Percentage
Total 1,004 100%
Underground 547 54%
Surface 373 37% Preparation Plant 73 7%
Office 11 1%
The 30 active coal mines and 5 preparation plants in Knott
County produced more than 4.8 million tons of coal in 2011,
which was 4.6% of total production in Kentucky. All but three
Knott County coal mines today are relatively small, averag-
ing under 140 thousand tons annually. Although production
increased by 3.2% from 2010, it remained only a third of
historical peaks and less than half the 20-year average of
10 million tons annually.
The 30 coal mines and 5 preparation plants operating in
Knott County employed a total of 1,004 persons full-time in
2011. Although unchanged from 2010, total employment has
fallen by 38% from 2001. 547 coal miners worked primar-
ily underground for a total of 1,325,393 hours, while 373
miners worked above ground for 711,322 labor hours.
Preparation plants employed 73 for 198,346 hours and 11
administrative staff worked in on-site offices for 10,387
hours.
Production Method Production Percentage
Total 4,853,069 100%
Underground 2,748,736 57%
Surface 2,104,333 43%
Mines
30
15
15
Between 1992 and 2011, coal production in Knott County was highest at 14.4 million tons, achieved in 1993.
69 energy.ky.gov kentuckycoal.com
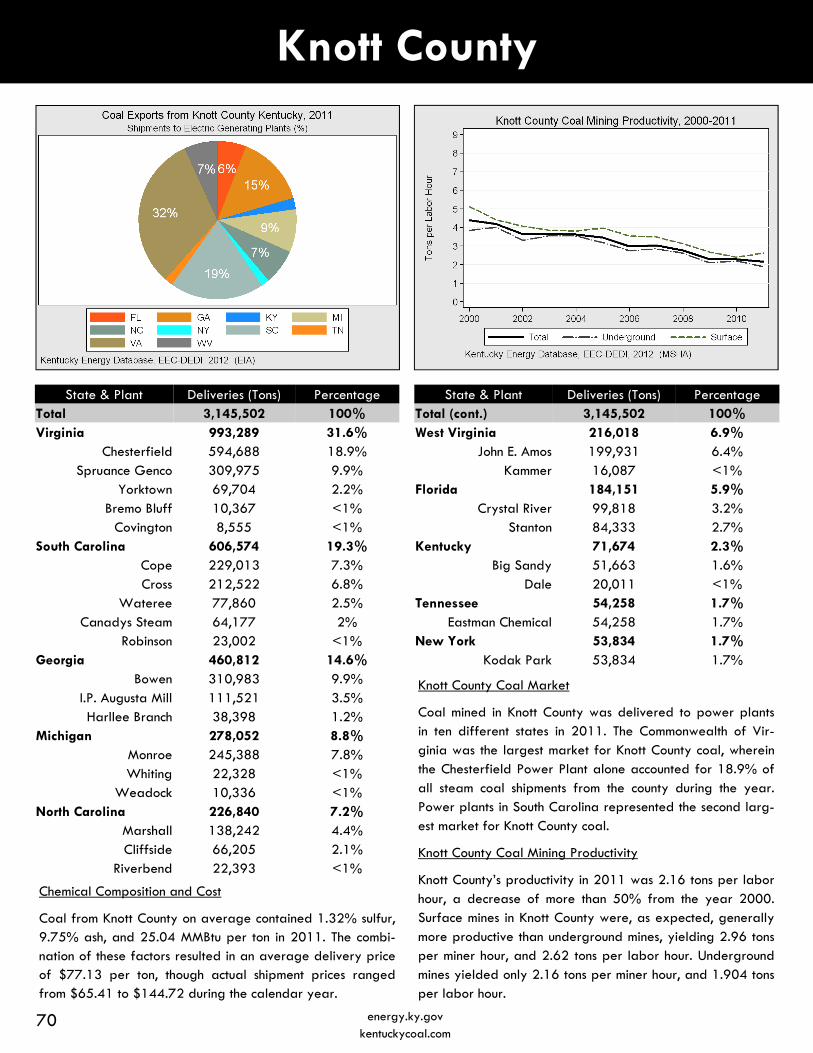
Knott County
70 energy.ky.gov kentuckycoal.com
Knott County Coal Market
Coal mined in Knott County was delivered to power plants in ten different states in 2011. The Commonwealth of Vir-ginia was the largest market for Knott County coal, wherein the Chesterfield Power Plant alone accounted for 18.9% of all steam coal shipments from the county during the year. Power plants in South Carolina represented the second larg-est market for Knott County coal.
Knott County Coal Mining Productivity
Knott County’s productivity in 2011 was 2.16 tons per labor hour, a decrease of more than 50% from the year 2000. Surface mines in Knott County were, as expected, generally more productive than underground mines, yielding 2.96 tons per miner hour, and 2.62 tons per labor hour. Underground mines yielded only 2.16 tons per miner hour, and 1.904 tons per labor hour.
State & Plant Deliveries (Tons) Percentage Total 3,145,502 100% Virginia 993,289 31.6%
Chesterfield 594,688 18.9% Spruance Genco 309,975 9.9%
Yorktown 69,704 2.2% Bremo Bluff 10,367 <1%
Covington 8,555 <1% South Carolina 606,574 19.3%
Cope 229,013 7.3% Cross 212,522 6.8%
Wateree 77,860 2.5% Canadys Steam 64,177 2%
Robinson 23,002 <1% Georgia 460,812 14.6%
Bowen 310,983 9.9% I.P. Augusta Mill 111,521 3.5% Harllee Branch 38,398 1.2%
Michigan 278,052 8.8% Monroe 245,388 7.8% Whiting 22,328 <1%
Weadock 10,336 <1% North Carolina 226,840 7.2%
Marshall 138,242 4.4% Cliffside 66,205 2.1%
Riverbend 22,393 <1%
State & Plant Deliveries (Tons) Percentage Total (cont.) 3,145,502 100% West Virginia 216,018 6.9%
John E. Amos 199,931 6.4% Kammer 16,087 <1%
Florida 184,151 5.9% Crystal River 99,818 3.2%
Stanton 84,333 2.7% Kentucky 71,674 2.3%
Big Sandy 51,663 1.6% Dale 20,011 <1%
Tennessee 54,258 1.7% Eastman Chemical 54,258 1.7%
New York 53,834 1.7% Kodak Park 53,834 1.7%
Chemical Composition and Cost
Coal from Knott County on average contained 1.32% sulfur, 9.75% ash, and 25.04 MMBtu per ton in 2011. The combi-nation of these factors resulted in an average delivery price of $77.13 per ton, though actual shipment prices ranged from $65.41 to $144.72 during the calendar year.
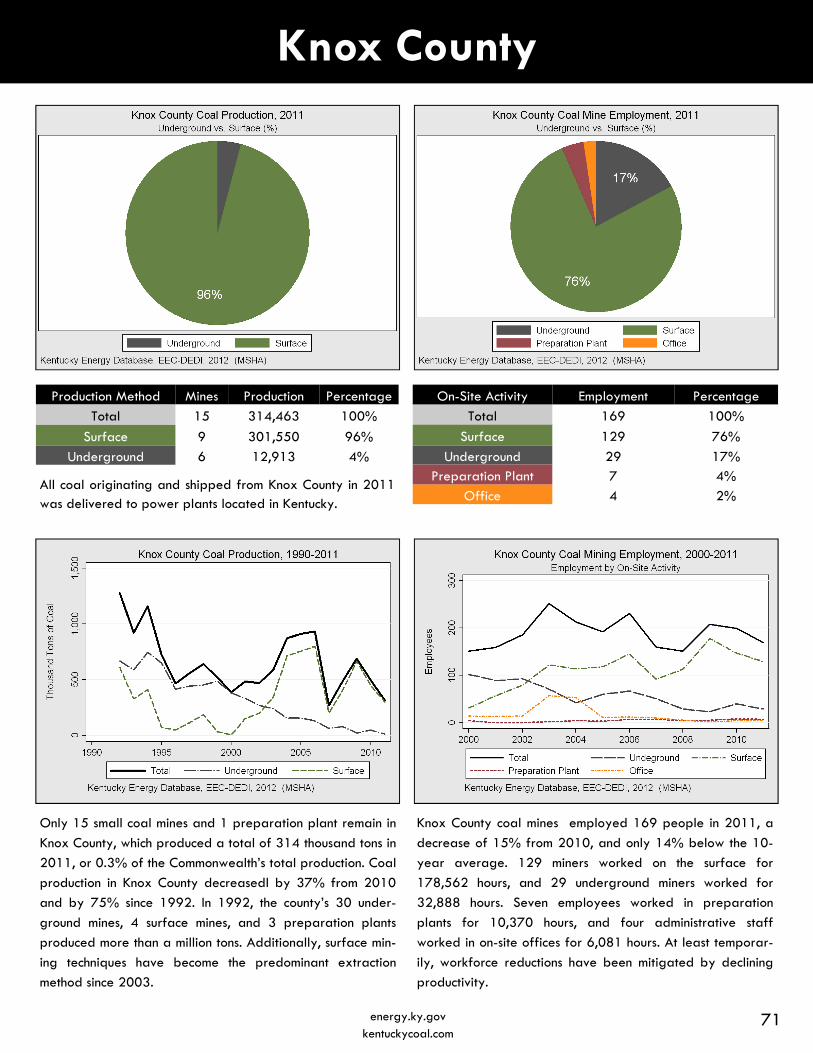
Knox County
On-Site Activity Employment Percentage
Total 169 100%
Surface 129 76%
Underground 29 17% Preparation Plant 7 4%
Office 4 2%
Only 15 small coal mines and 1 preparation plant remain in
Knox County, which produced a total of 314 thousand tons in
2011, or 0.3% of the Commonwealth’s total production. Coal
production in Knox County decreasedl by 37% from 2010
and by 75% since 1992. In 1992, the county’s 30 under-
ground mines, 4 surface mines, and 3 preparation plants
produced more than a million tons. Additionally, surface min-
ing techniques have become the predominant extraction
method since 2003.
Knox County coal mines employed 169 people in 2011, a
decrease of 15% from 2010, and only 14% below the 10-
year average. 129 miners worked on the surface for
178,562 hours, and 29 underground miners worked for
32,888 hours. Seven employees worked in preparation
plants for 10,370 hours, and four administrative staff
worked in on-site offices for 6,081 hours. At least temporar-
ily, workforce reductions have been mitigated by declining
productivity.
Production Method Production Percentage
Total 314,463 100%
Surface 301,550 96%
Underground 12,913 4%
Mines
15
9
6
All coal originating and shipped from Knox County in 2011 was delivered to power plants located in Kentucky.
71 energy.ky.gov kentuckycoal.com
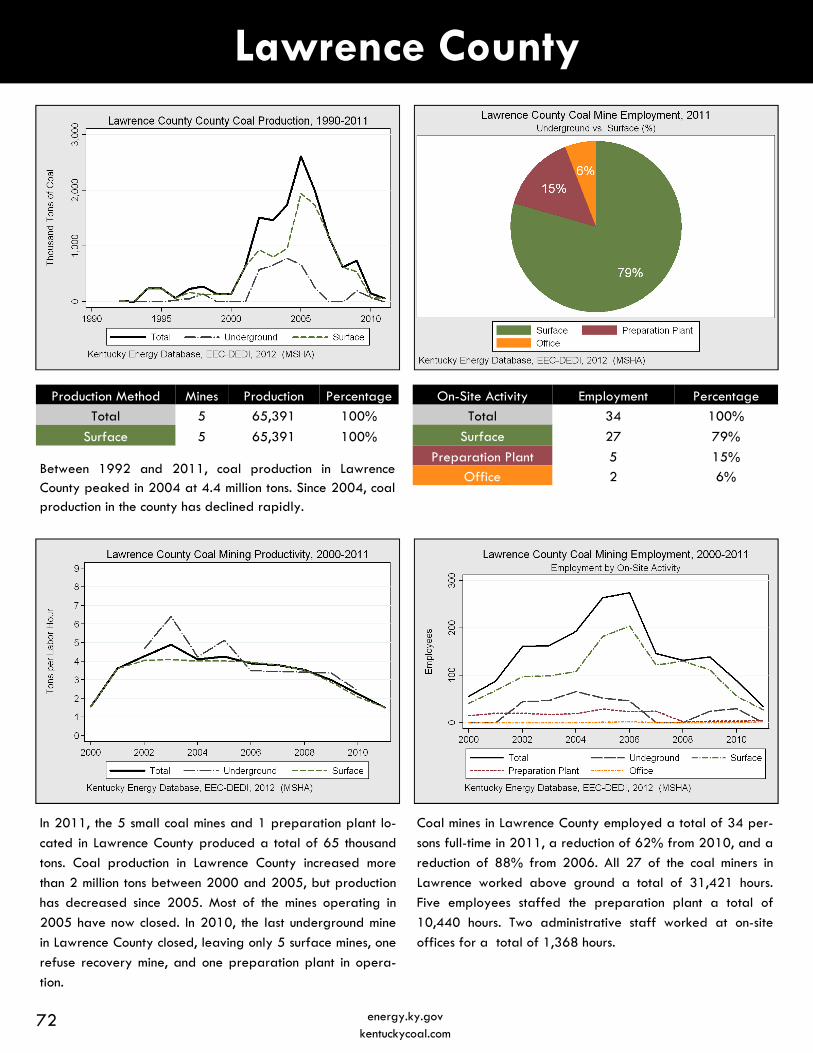
Lawrence County
On-Site Activity Employment Percentage
Total 34 100%
Surface 27 79%
Preparation Plant 5 15% Office 2 6%
In 2011, the 5 small coal mines and 1 preparation plant lo-
cated in Lawrence County produced a total of 65 thousand
tons. Coal production in Lawrence County increased more
than 2 million tons between 2000 and 2005, but production
has decreased since 2005. Most of the mines operating in
2005 have now closed. In 2010, the last underground mine
in Lawrence County closed, leaving only 5 surface mines, one
refuse recovery mine, and one preparation plant in opera-
tion.
Coal mines in Lawrence County employed a total of 34 per-
sons full-time in 2011, a reduction of 62% from 2010, and a
reduction of 88% from 2006. All 27 of the coal miners in
Lawrence worked above ground a total of 31,421 hours.
Five employees staffed the preparation plant a total of
10,440 hours. Two administrative staff worked at on-site
offices for a total of 1,368 hours.
Production Method Production Percentage
Total 65,391 100%
Surface 65,391 100%
Mines
5
5
Between 1992 and 2011, coal production in Lawrence County peaked in 2004 at 4.4 million tons. Since 2004, coal production in the county has declined rapidly.
72 energy.ky.gov kentuckycoal.com
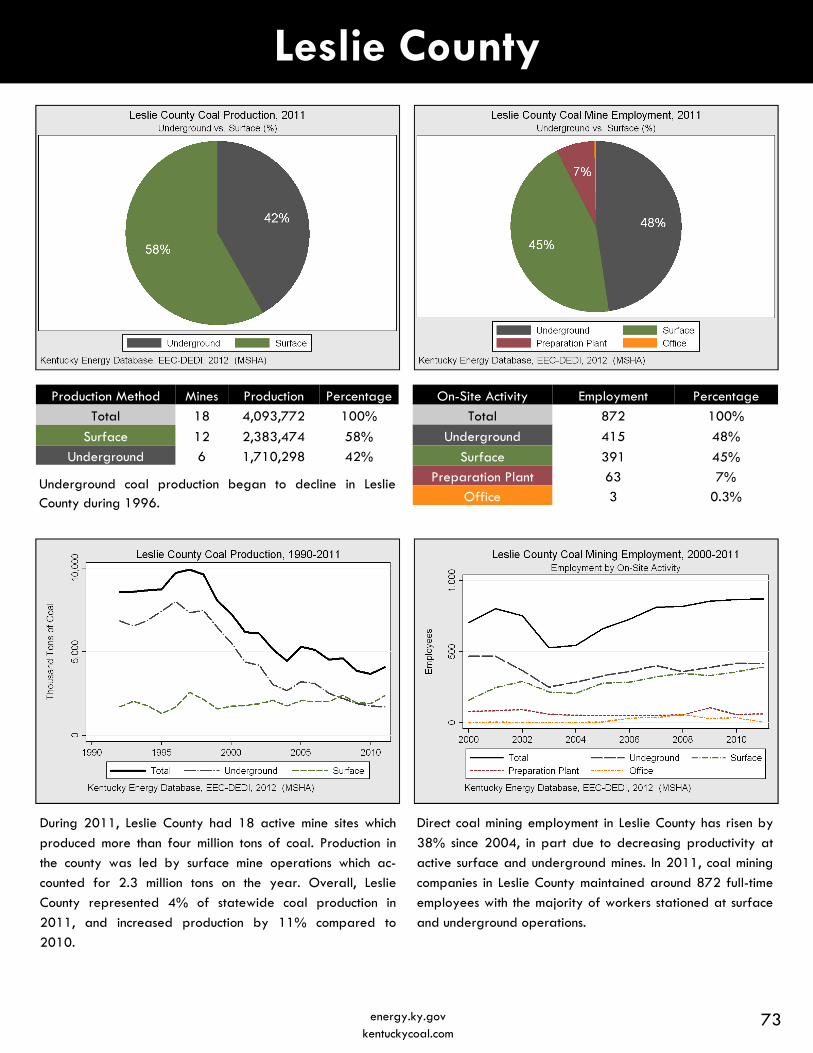
Leslie County
On-Site Activity Employment Percentage
Total 872 100%
Underground 415 48%
Preparation Plant 63 7% Office 3 0.3%
Surface 391 45%
During 2011, Leslie County had 18 active mine sites which
produced more than four million tons of coal. Production in
the county was led by surface mine operations which ac-
counted for 2.3 million tons on the year. Overall, Leslie
County represented 4% of statewide coal production in
2011, and increased production by 11% compared to
2010.
Direct coal mining employment in Leslie County has risen by
38% since 2004, in part due to decreasing productivity at
active surface and underground mines. In 2011, coal mining
companies in Leslie County maintained around 872 full-time
employees with the majority of workers stationed at surface
and underground operations.
Production Method Production Percentage
Total 4,093,772 100%
Surface 2,383,474 58%
Underground 1,710,298 42%
Mines
18
12
6
Underground coal production began to decline in Leslie County during 1996.
73 energy.ky.gov kentuckycoal.com
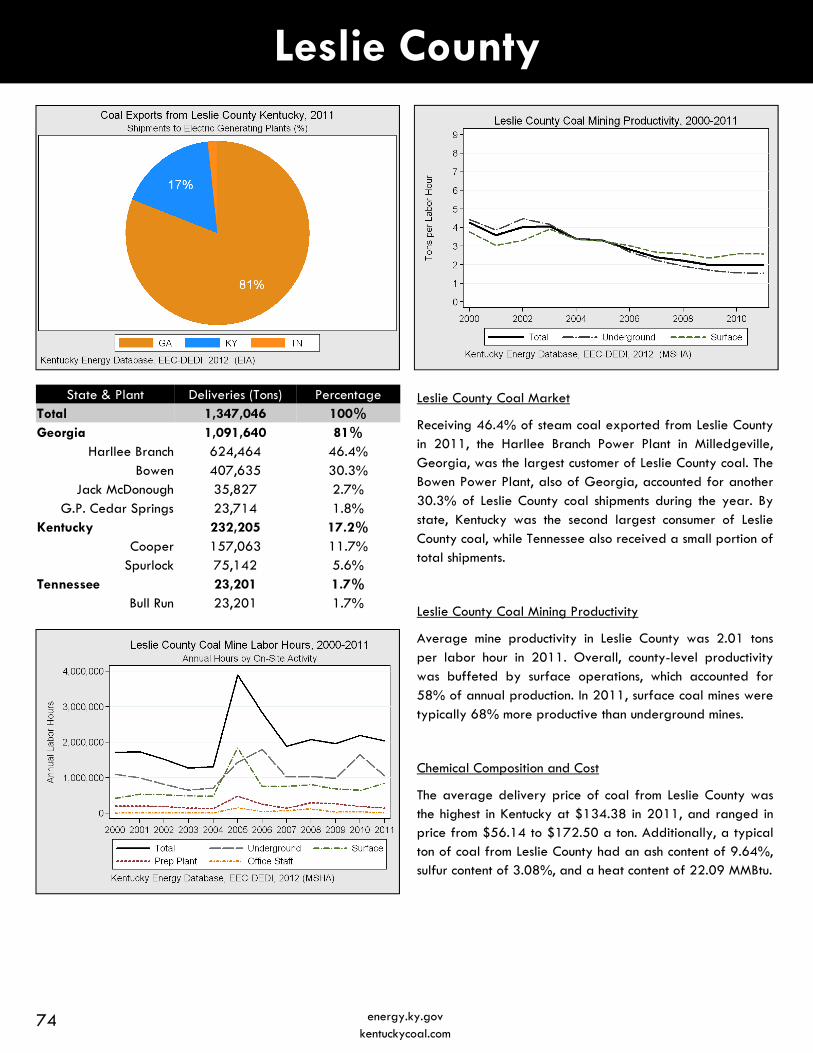
Leslie County
Leslie County Coal Market
Receiving 46.4% of steam coal exported from Leslie County in 2011, the Harllee Branch Power Plant in Milledgeville, Georgia, was the largest customer of Leslie County coal. The Bowen Power Plant, also of Georgia, accounted for another 30.3% of Leslie County coal shipments during the year. By state, Kentucky was the second largest consumer of Leslie County coal, while Tennessee also received a small portion of total shipments.
Leslie County Coal Mining Productivity
Average mine productivity in Leslie County was 2.01 tons per labor hour in 2011. Overall, county-level productivity was buffeted by surface operations, which accounted for 58% of annual production. In 2011, surface coal mines were typically 68% more productive than underground mines.
Chemical Composition and Cost
The average delivery price of coal from Leslie County was the highest in Kentucky at $134.38 in 2011, and ranged in price from $56.14 to $172.50 a ton. Additionally, a typical ton of coal from Leslie County had an ash content of 9.64%, sulfur content of 3.08%, and a heat content of 22.09 MMBtu.
State & Plant Deliveries (Tons) Percentage Total 1,347,046 100% Georgia 1,091,640 81%
Harllee Branch 624,464 46.4% Bowen 407,635 30.3%
Jack McDonough 35,827 2.7% G.P. Cedar Springs 23,714 1.8%
Kentucky 232,205 17.2% Cooper 157,063 11.7%
Spurlock 75,142 5.6% Tennessee 23,201 1.7%
Bull Run 23,201 1.7%
74 energy.ky.gov kentuckycoal.com

Letcher County
On-Site Activity Employment Percentage
Total 1,016 100%
Underground 673 66%
Surface 246 24% Preparation Plant 72 7%
Office 25 3%
With 40 active mine sites in 2011, Letcher County produced
4.5 million tons of coal (or 4% of statewide production). In-
terestingly, Letcher County was home to many small mines,
with 26 sites producing less than 100,000 tons during the
year. Overall, coal production was led by underground op-
erations which accounted for 71% of annual production.
Coal mine operations in Letcher County employed more than
1,000 people full-time during 2011. Greater than two thirds
of coal mining employment involved underground labor
hours, followed by surface sites which represented a quarter
of full-time jobs. In addition, 72 individuals operated prepa-
ration plants within the county, while 25 people worked in
offices directly supporting mine operations.
Production Method Production Percentage
Total 4,543,905 100%
Underground 3,217,731 71%
Surface 1,326,174 29%
Mines
40
23
17
75 energy.ky.gov kentuckycoal.com
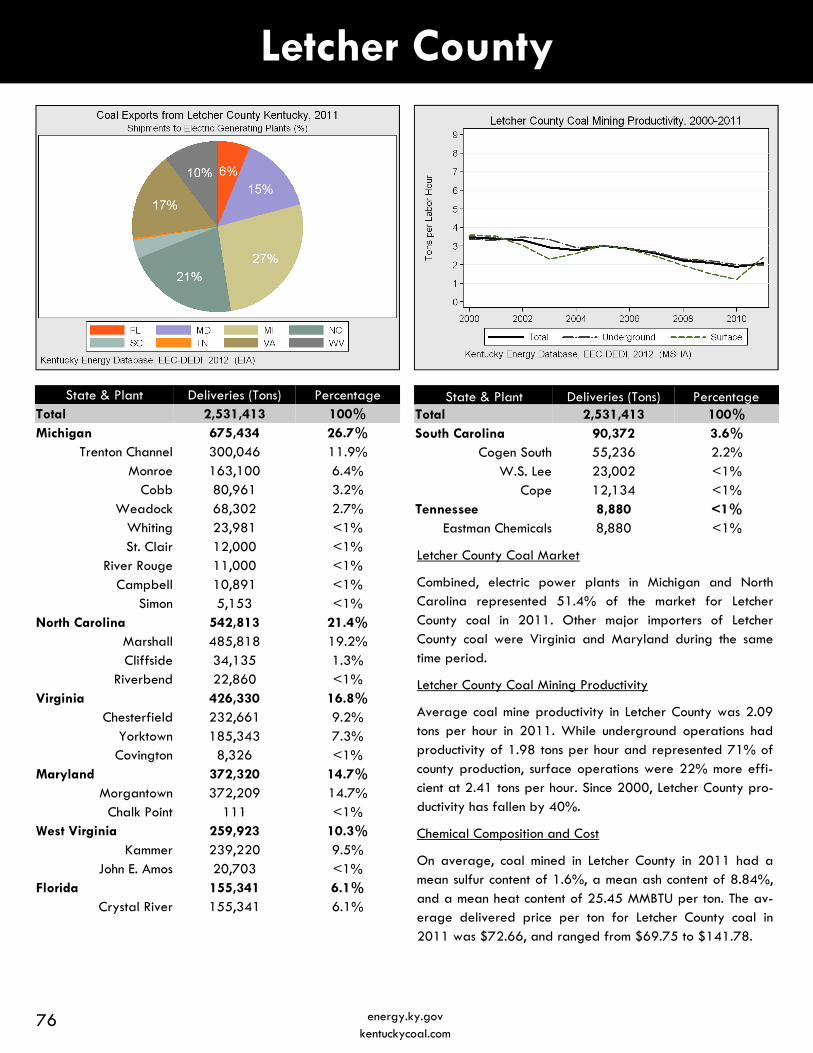
Letcher County
76 energy.ky.gov kentuckycoal.com
Letcher County Coal Market
Combined, electric power plants in Michigan and North Carolina represented 51.4% of the market for Letcher County coal in 2011. Other major importers of Letcher County coal were Virginia and Maryland during the same time period.
Letcher County Coal Mining Productivity
Average coal mine productivity in Letcher County was 2.09 tons per hour in 2011. While underground operations had productivity of 1.98 tons per hour and represented 71% of county production, surface operations were 22% more effi-cient at 2.41 tons per hour. Since 2000, Letcher County pro-ductivity has fallen by 40%.
Chemical Composition and Cost
On average, coal mined in Letcher County in 2011 had a mean sulfur content of 1.6%, a mean ash content of 8.84%, and a mean heat content of 25.45 MMBTU per ton. The av-erage delivered price per ton for Letcher County coal in 2011 was $72.66, and ranged from $69.75 to $141.78.
State & Plant Deliveries (Tons) Percentage Total 2,531,413 100% Michigan 675,434 26.7%
Trenton Channel 300,046 11.9% Monroe 163,100 6.4%
Cobb 80,961 3.2% Weadock 68,302 2.7%
Whiting 23,981 <1% St. Clair 12,000 <1%
River Rouge 11,000 <1% Campbell 10,891 <1%
Simon 5,153 <1% North Carolina 542,813 21.4%
Marshall 485,818 19.2% Cliffside 34,135 1.3%
Riverbend 22,860 <1% Virginia 426,330 16.8%
Chesterfield 232,661 9.2% Yorktown 185,343 7.3% Covington 8,326 <1%
Maryland 372,320 14.7% Morgantown 372,209 14.7%
Chalk Point 111 <1% West Virginia 259,923 10.3%
Kammer 239,220 9.5% John E. Amos 20,703 <1%
Florida 155,341 6.1% Crystal River 155,341 6.1%
State & Plant Deliveries (Tons) Percentage Total 2,531,413 100% South Carolina 90,372 3.6%
Cogen South 55,236 2.2% W.S. Lee 23,002 <1%
Cope 12,134 <1% Tennessee 8,880 <1%
Eastman Chemicals 8,880 <1%
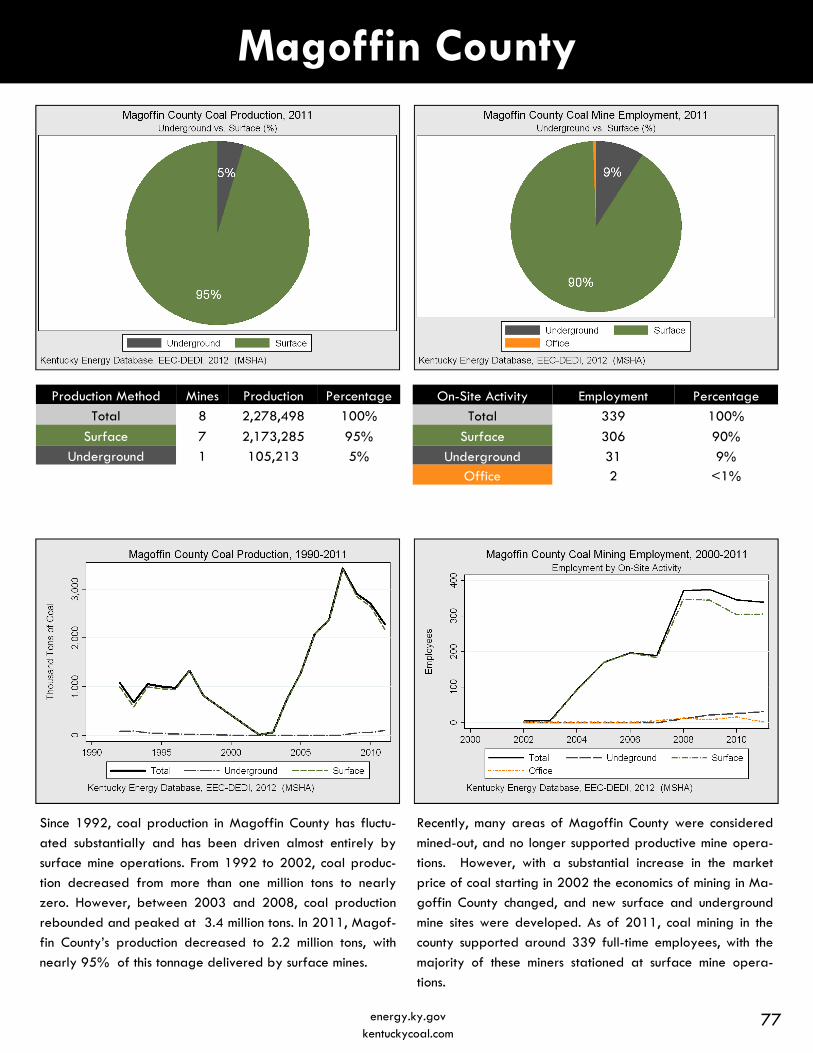
Magoffin County
On-Site Activity Employment Percentage
Total 339 100%
Surface 306 90%
Underground 31 9% Office 2 <1%
Since 1992, coal production in Magoffin County has fluctu-
ated substantially and has been driven almost entirely by
surface mine operations. From 1992 to 2002, coal produc-
tion decreased from more than one million tons to nearly
zero. However, between 2003 and 2008, coal production
rebounded and peaked at 3.4 million tons. In 2011, Magof-
fin County’s production decreased to 2.2 million tons, with
nearly 95% of this tonnage delivered by surface mines.
Recently, many areas of Magoffin County were considered
mined-out, and no longer supported productive mine opera-
tions. However, with a substantial increase in the market
price of coal starting in 2002 the economics of mining in Ma-
goffin County changed, and new surface and underground
mine sites were developed. As of 2011, coal mining in the
county supported around 339 full-time employees, with the
majority of these miners stationed at surface mine opera-
tions.
Production Method Production Percentage
Total 2,278,498 100%
Surface 2,173,285 95%
Underground 105,213 5%
Mines
8
7
1
77 energy.ky.gov kentuckycoal.com
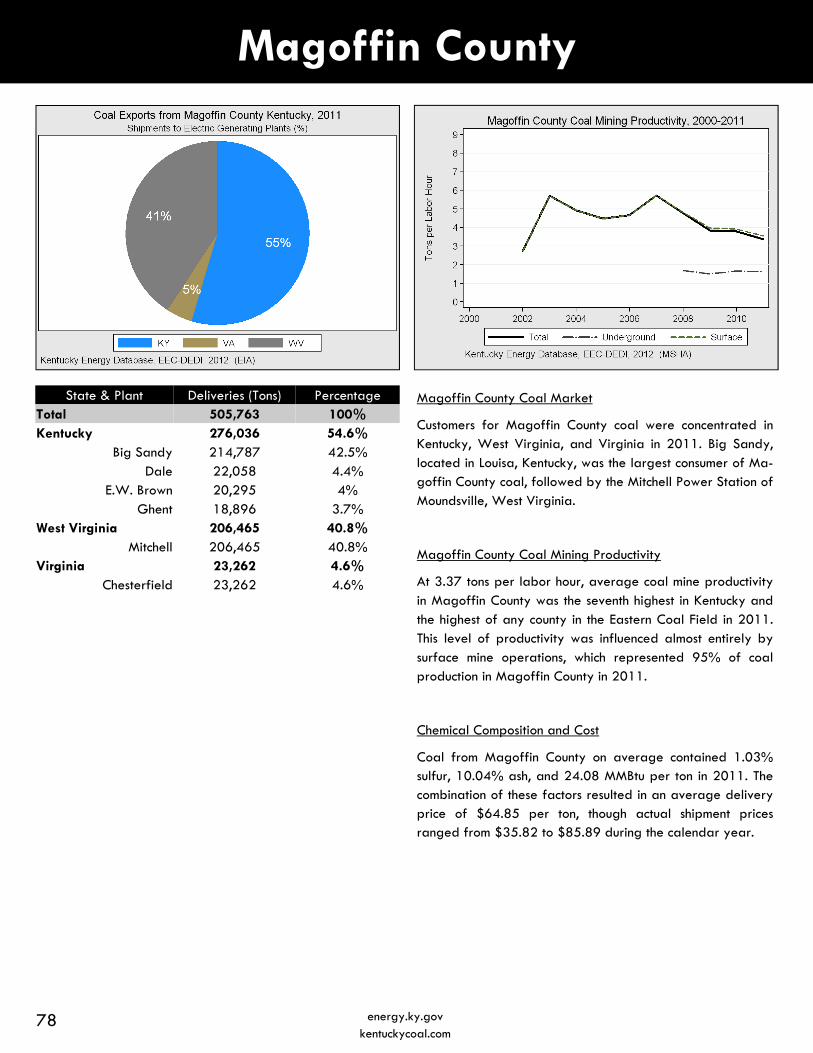
Magoffin County
Magoffin County Coal Market
Customers for Magoffin County coal were concentrated in Kentucky, West Virginia, and Virginia in 2011. Big Sandy, located in Louisa, Kentucky, was the largest consumer of Ma-goffin County coal, followed by the Mitchell Power Station of Moundsville, West Virginia.
Magoffin County Coal Mining Productivity
At 3.37 tons per labor hour, average coal mine productivity in Magoffin County was the seventh highest in Kentucky and the highest of any county in the Eastern Coal Field in 2011. This level of productivity was influenced almost entirely by surface mine operations, which represented 95% of coal production in Magoffin County in 2011.
Chemical Composition and Cost
Coal from Magoffin County on average contained 1.03% sulfur, 10.04% ash, and 24.08 MMBtu per ton in 2011. The combination of these factors resulted in an average delivery price of $64.85 per ton, though actual shipment prices ranged from $35.82 to $85.89 during the calendar year.
State & Plant Deliveries (Tons) Percentage Total 505,763 100% Kentucky 276,036 54.6%
Big Sandy 214,787 42.5% Dale 22,058 4.4%
E.W. Brown 20,295 4% Ghent 18,896 3.7%
West Virginia 206,465 40.8% Mitchell 206,465 40.8%
Virginia 23,262 4.6% Chesterfield 23,262 4.6%
78 energy.ky.gov kentuckycoal.com
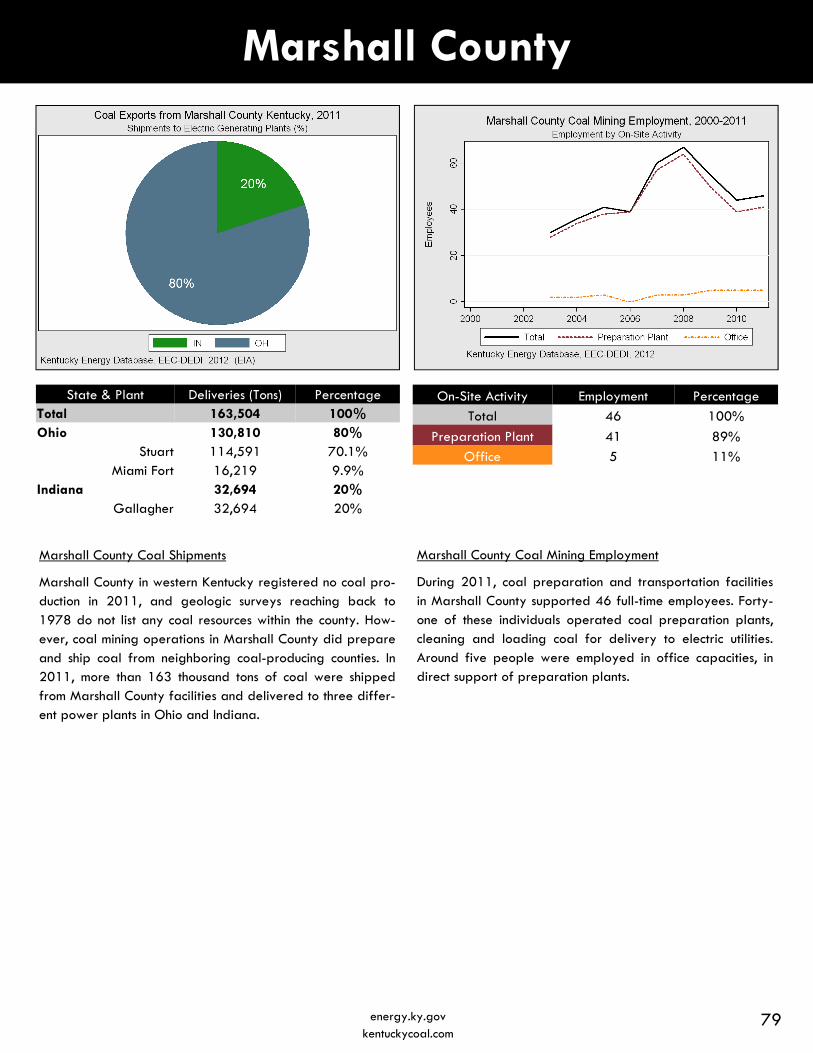
Marshall County
Marshall County Coal Mining Employment
During 2011, coal preparation and transportation facilities in Marshall County supported 46 full-time employees. Forty-one of these individuals operated coal preparation plants, cleaning and loading coal for delivery to electric utilities. Around five people were employed in office capacities, in direct support of preparation plants.
State & Plant Deliveries (Tons) Percentage Total 163,504 100% Ohio 130,810 80%
Stuart 114,591 70.1% Miami Fort 16,219 9.9%
Indiana 32,694 20% Gallagher 32,694 20%
On-Site Activity Employment Percentage
Total 46 100%
Preparation Plant 41 89%
Office 5 11%
Marshall County Coal Shipments
Marshall County in western Kentucky registered no coal pro-duction in 2011, and geologic surveys reaching back to 1978 do not list any coal resources within the county. How-ever, coal mining operations in Marshall County did prepare and ship coal from neighboring coal-producing counties. In 2011, more than 163 thousand tons of coal were shipped from Marshall County facilities and delivered to three differ-ent power plants in Ohio and Indiana.
79 energy.ky.gov kentuckycoal.com
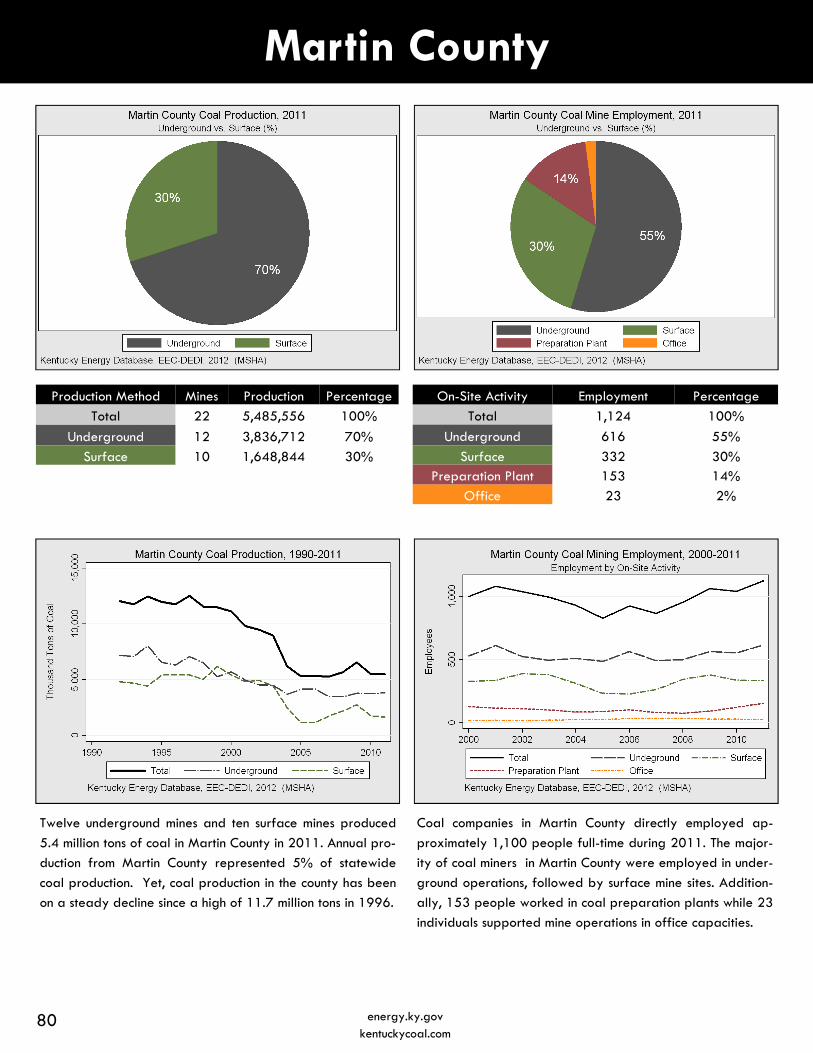
Martin County
On-Site Activity Employment Percentage
Total 1,124 100%
Underground 616 55%
Surface 332 30% Preparation Plant 153 14%
Office 23 2%
Twelve underground mines and ten surface mines produced
5.4 million tons of coal in Martin County in 2011. Annual pro-
duction from Martin County represented 5% of statewide
coal production. Yet, coal production in the county has been
on a steady decline since a high of 11.7 million tons in 1996.
Coal companies in Martin County directly employed ap-
proximately 1,100 people full-time during 2011. The major-
ity of coal miners in Martin County were employed in under-
ground operations, followed by surface mine sites. Addition-
ally, 153 people worked in coal preparation plants while 23
individuals supported mine operations in office capacities.
Production Method Production Percentage
Total 5,485,556 100%
Underground 3,836,712 70%
Surface 1,648,844 30%
Mines
22
12
10
80 energy.ky.gov kentuckycoal.com
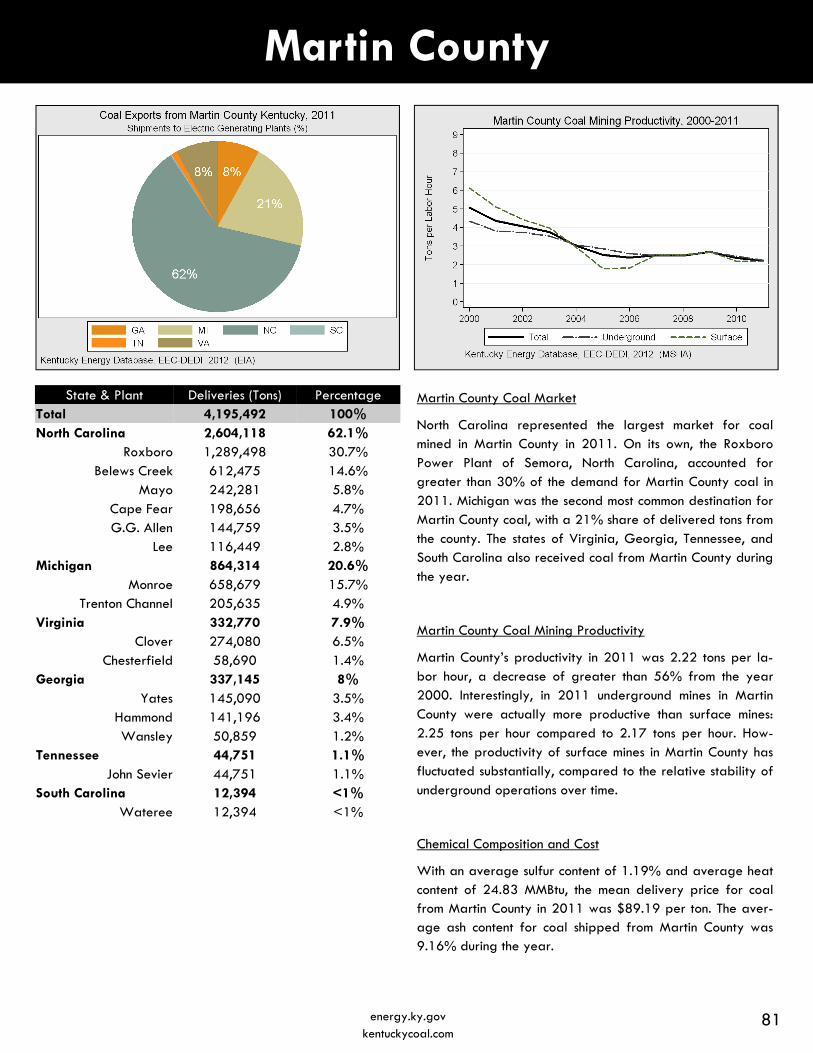
Martin County
Martin County Coal Market
North Carolina represented the largest market for coal mined in Martin County in 2011. On its own, the Roxboro Power Plant of Semora, North Carolina, accounted for greater than 30% of the demand for Martin County coal in 2011. Michigan was the second most common destination for Martin County coal, with a 21% share of delivered tons from the county. The states of Virginia, Georgia, Tennessee, and South Carolina also received coal from Martin County during the year.
Martin County Coal Mining Productivity
Martin County’s productivity in 2011 was 2.22 tons per la-bor hour, a decrease of greater than 56% from the year 2000. Interestingly, in 2011 underground mines in Martin County were actually more productive than surface mines: 2.25 tons per hour compared to 2.17 tons per hour. How-ever, the productivity of surface mines in Martin County has fluctuated substantially, compared to the relative stability of underground operations over time.
Chemical Composition and Cost
With an average sulfur content of 1.19% and average heat content of 24.83 MMBtu, the mean delivery price for coal from Martin County in 2011 was $89.19 per ton. The aver-age ash content for coal shipped from Martin County was 9.16% during the year.
State & Plant Deliveries (Tons) Percentage Total 4,195,492 100% North Carolina 2,604,118 62.1%
Roxboro 1,289,498 30.7% Belews Creek 612,475 14.6%
Mayo 242,281 5.8% Cape Fear 198,656 4.7% G.G. Allen 144,759 3.5%
Lee 116,449 2.8% Michigan 864,314 20.6%
Monroe 658,679 15.7% Trenton Channel 205,635 4.9%
Virginia 332,770 7.9% Clover 274,080 6.5%
Chesterfield 58,690 1.4% Georgia 337,145 8%
Yates 145,090 3.5% Hammond 141,196 3.4% Wansley 50,859 1.2%
Tennessee 44,751 1.1% John Sevier 44,751 1.1%
South Carolina 12,394 <1% Wateree 12,394 <1%
81 energy.ky.gov kentuckycoal.com
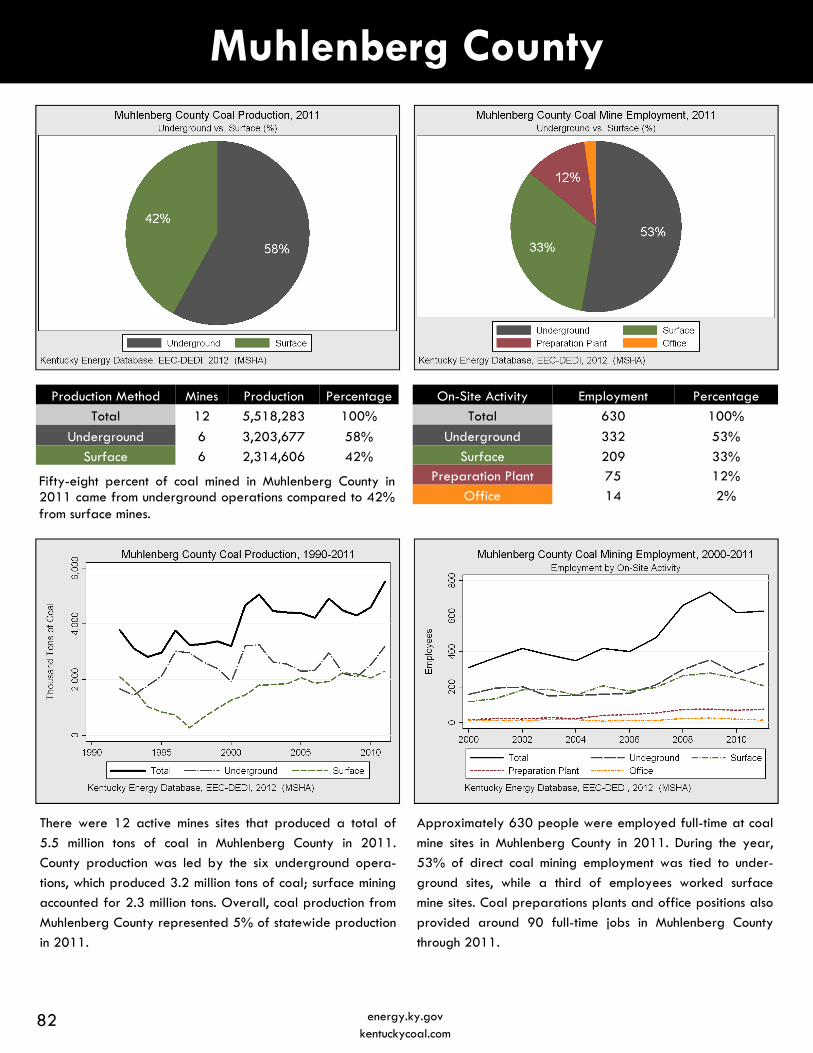
Muhlenberg County
On-Site Activity Employment Percentage
Total 630 100%
Underground 332 53%
Surface 209 33% Preparation Plant 75 12%
Office 14 2%
There were 12 active mines sites that produced a total of
5.5 million tons of coal in Muhlenberg County in 2011.
County production was led by the six underground opera-
tions, which produced 3.2 million tons of coal; surface mining
accounted for 2.3 million tons. Overall, coal production from
Muhlenberg County represented 5% of statewide production
in 2011.
Approximately 630 people were employed full-time at coal
mine sites in Muhlenberg County in 2011. During the year,
53% of direct coal mining employment was tied to under-
ground sites, while a third of employees worked surface
mine sites. Coal preparations plants and office positions also
provided around 90 full-time jobs in Muhlenberg County
through 2011.
Production Method Production Percentage
Total 5,518,283 100%
Underground 3,203,677 58%
Surface 2,314,606 42%
Mines
12
6
6
Fifty-eight percent of coal mined in Muhlenberg County in 2011 came from underground operations compared to 42% from surface mines.
82 energy.ky.gov kentuckycoal.com

Muhlenberg County
Muhlenberg County Coal Market
The vast majority of coal mined in Muhlenberg County was delivered to power plants within Kentucky in 2011. More than 46% of all the coal shipped from Muhlenberg County during the year was delivered to TVA’s Paradise Fossil Plant located in western Kentucky. Paradise is the largest power plant by capacity in the Commonwealth of Kentucky.
Muhlenberg County Coal Mining Productivity
While average productivity at underground mines in Muhlen-berg County was 3.29 tons per hour in 2011, productivity at surface mines was closer to 3.90 tons per hour (or 19% higher). Overall productivity for coal mine operations in Muhlenberg County during 2011 was 3.52 tons per labor hour.
Chemical Composition and Cost
On average, coal mined in Muhlenberg County in 2011 had a mean sulfur content of 3.1%, a mean ash content of 11.6%, and a mean heat content of 22.52 MMBTU per ton. The average delivered price per ton for Muhlenberg County coal in 2011 was $49.18, and ranged from $34.64 to $72.36.
State & Plant Deliveries (Tons) Percentage Total 5,516,571 100% Kentucky 5,065,742 91.8%
Paradise 2,544,054 46.1% D.B. Wilson 758,191 13.7% R.D. Green 574,115 10.4% East Bend 429,898 7.8% Spurlock 305,221 5.5%
Ghent 220,168 4% Trimble County 168,757 3.1%
Mill Creek 65,338 1.2% Florida 441,279 8%
Davant Transfer 441,279 8% Ohio 9,550 <1%
Miami Fort 9,550 <1%
83 energy.ky.gov kentuckycoal.com
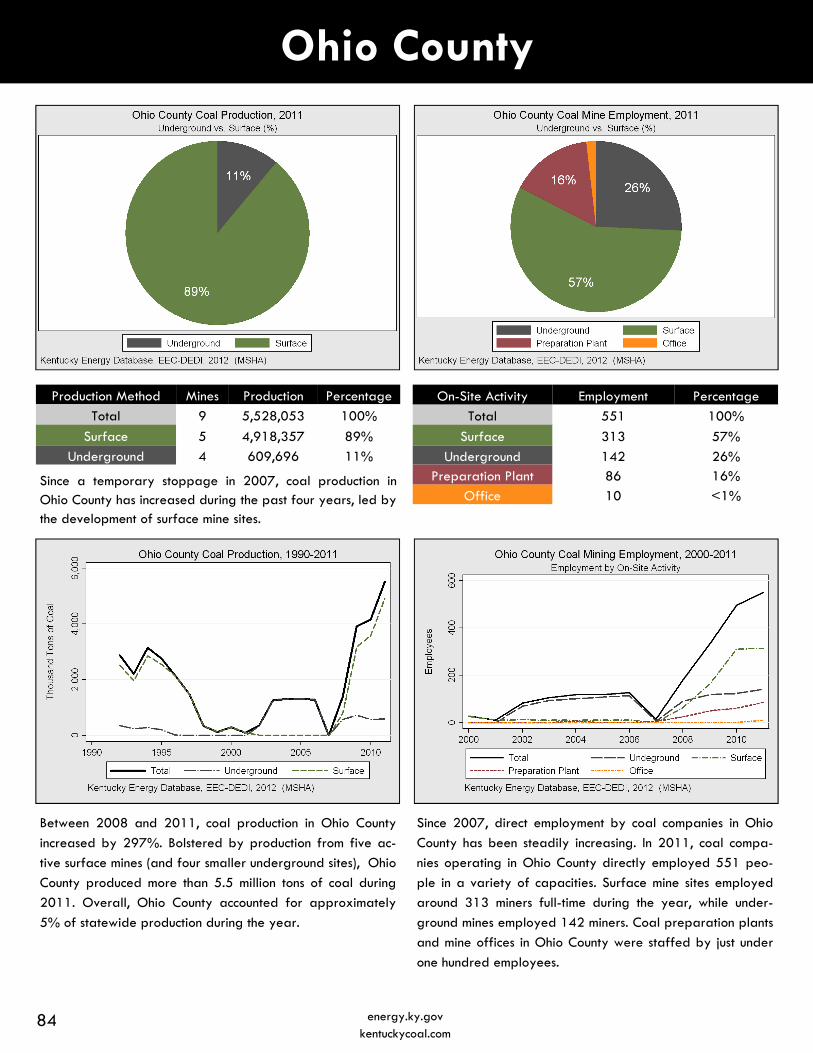
Ohio County
On-Site Activity Employment Percentage
Total 551 100%
Surface 313 57%
Underground 142 26% Preparation Plant 86 16%
Office 10 <1%
Between 2008 and 2011, coal production in Ohio County
increased by 297%. Bolstered by production from five ac-
tive surface mines (and four smaller underground sites), Ohio
County produced more than 5.5 million tons of coal during
2011. Overall, Ohio County accounted for approximately
5% of statewide production during the year.
Since 2007, direct employment by coal companies in Ohio
County has been steadily increasing. In 2011, coal compa-
nies operating in Ohio County directly employed 551 peo-
ple in a variety of capacities. Surface mine sites employed
around 313 miners full-time during the year, while under-
ground mines employed 142 miners. Coal preparation plants
and mine offices in Ohio County were staffed by just under
one hundred employees.
Production Method Production Percentage
Total 5,528,053 100%
Surface 4,918,357 89%
Underground 609,696 11%
Mines
9
5
4
Since a temporary stoppage in 2007, coal production in Ohio County has increased during the past four years, led by the development of surface mine sites.
84 energy.ky.gov kentuckycoal.com
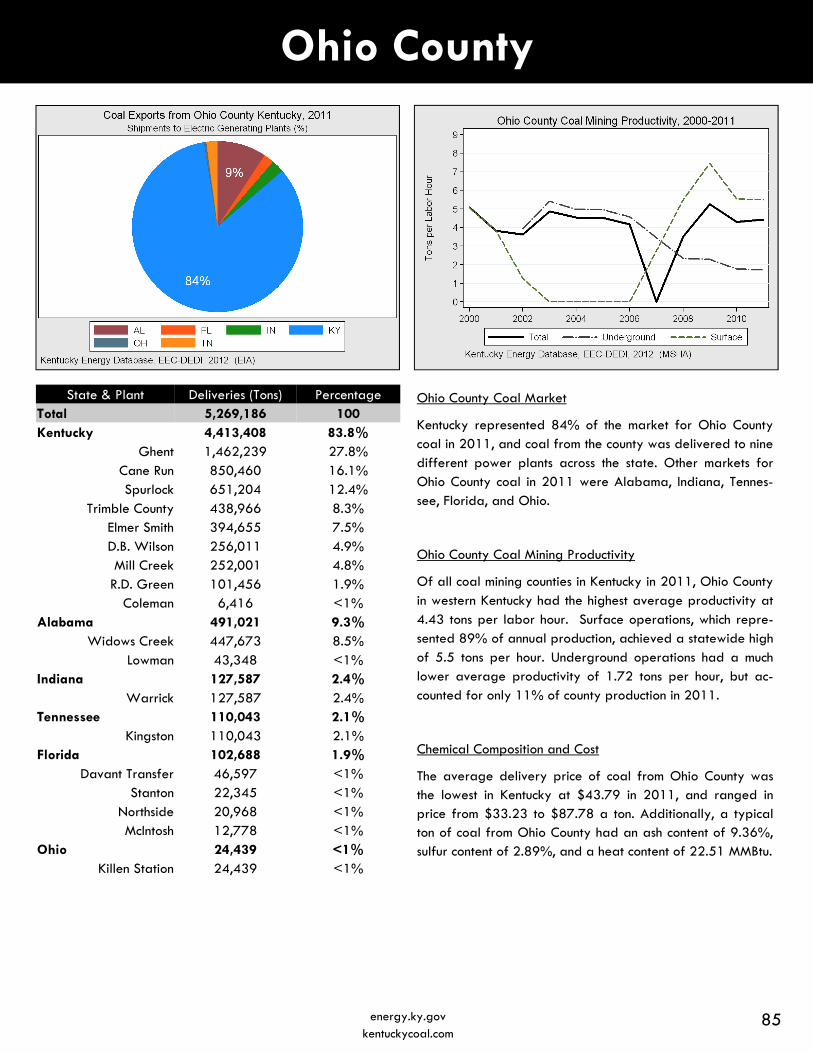
Ohio County
Ohio County Coal Market
Kentucky represented 84% of the market for Ohio County coal in 2011, and coal from the county was delivered to nine different power plants across the state. Other markets for Ohio County coal in 2011 were Alabama, Indiana, Tennes-see, Florida, and Ohio.
Ohio County Coal Mining Productivity
Of all coal mining counties in Kentucky in 2011, Ohio County in western Kentucky had the highest average productivity at 4.43 tons per labor hour. Surface operations, which repre-sented 89% of annual production, achieved a statewide high of 5.5 tons per hour. Underground operations had a much lower average productivity of 1.72 tons per hour, but ac-counted for only 11% of county production in 2011.
Chemical Composition and Cost
The average delivery price of coal from Ohio County was the lowest in Kentucky at $43.79 in 2011, and ranged in price from $33.23 to $87.78 a ton. Additionally, a typical ton of coal from Ohio County had an ash content of 9.36%, sulfur content of 2.89%, and a heat content of 22.51 MMBtu.
State & Plant Deliveries (Tons) Percentage Total 5,269,186 100 Kentucky 4,413,408 83.8%
Ghent 1,462,239 27.8% Cane Run 850,460 16.1% Spurlock 651,204 12.4%
Trimble County 438,966 8.3% Elmer Smith 394,655 7.5% D.B. Wilson 256,011 4.9% Mill Creek 252,001 4.8%
R.D. Green 101,456 1.9% Coleman 6,416 <1%
Alabama 491,021 9.3% Widows Creek 447,673 8.5%
Lowman 43,348 <1% Indiana 127,587 2.4%
Warrick 127,587 2.4% Tennessee 110,043 2.1%
Kingston 110,043 2.1% Florida 102,688 1.9%
Davant Transfer 46,597 <1% Stanton 22,345 <1%
Northside 20,968 <1% McIntosh 12,778 <1%
Ohio 24,439 <1% Killen Station 24,439 <1%
85 energy.ky.gov kentuckycoal.com
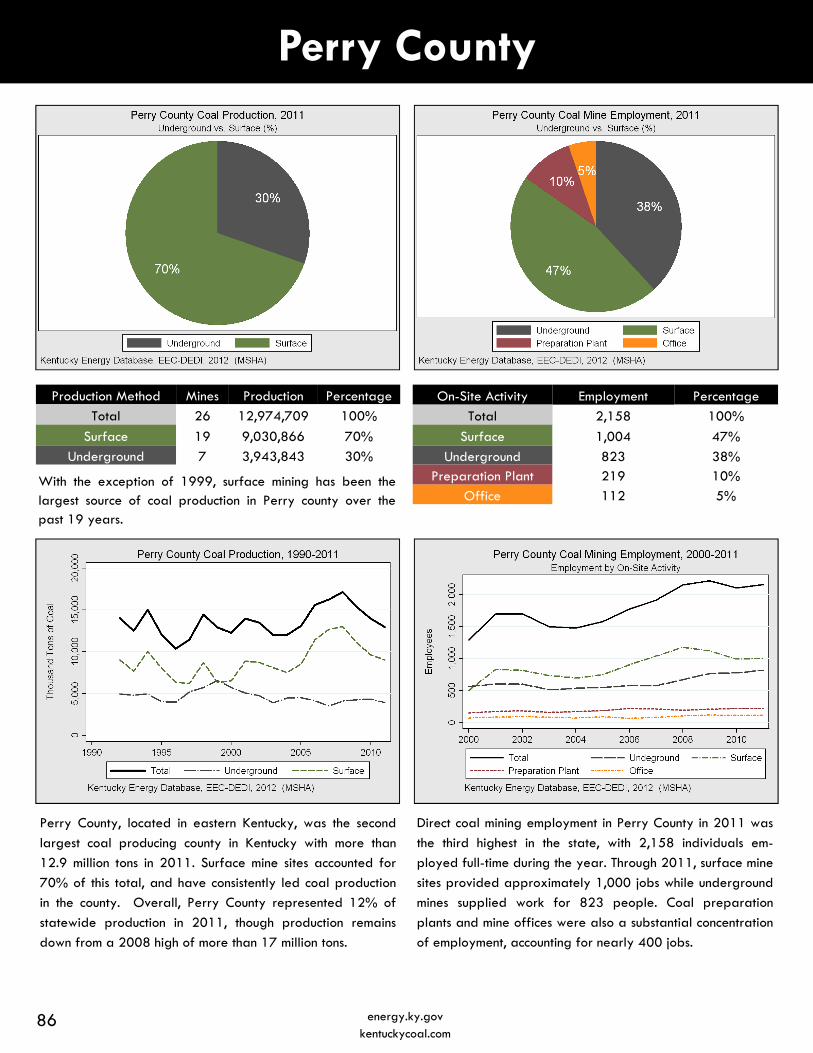
Perry County
Perry County, located in eastern Kentucky, was the second
largest coal producing county in Kentucky with more than
12.9 million tons in 2011. Surface mine sites accounted for
70% of this total, and have consistently led coal production
in the county. Overall, Perry County represented 12% of
statewide production in 2011, though production remains
down from a 2008 high of more than 17 million tons.
Direct coal mining employment in Perry County in 2011 was
the third highest in the state, with 2,158 individuals em-
ployed full-time during the year. Through 2011, surface mine
sites provided approximately 1,000 jobs while underground
mines supplied work for 823 people. Coal preparation
plants and mine offices were also a substantial concentration
of employment, accounting for nearly 400 jobs.
Production Method Production Percentage
Total 12,974,709 100%
Surface 9,030,866 70%
Underground 3,943,843 30%
Mines
26
19
7
On-Site Activity Employment Percentage
Total 2,158 100%
Surface 1,004 47%
Underground 823 38% Preparation Plant 219 10%
Office 112 5% With the exception of 1999, surface mining has been the largest source of coal production in Perry county over the past 19 years.
86 energy.ky.gov kentuckycoal.com
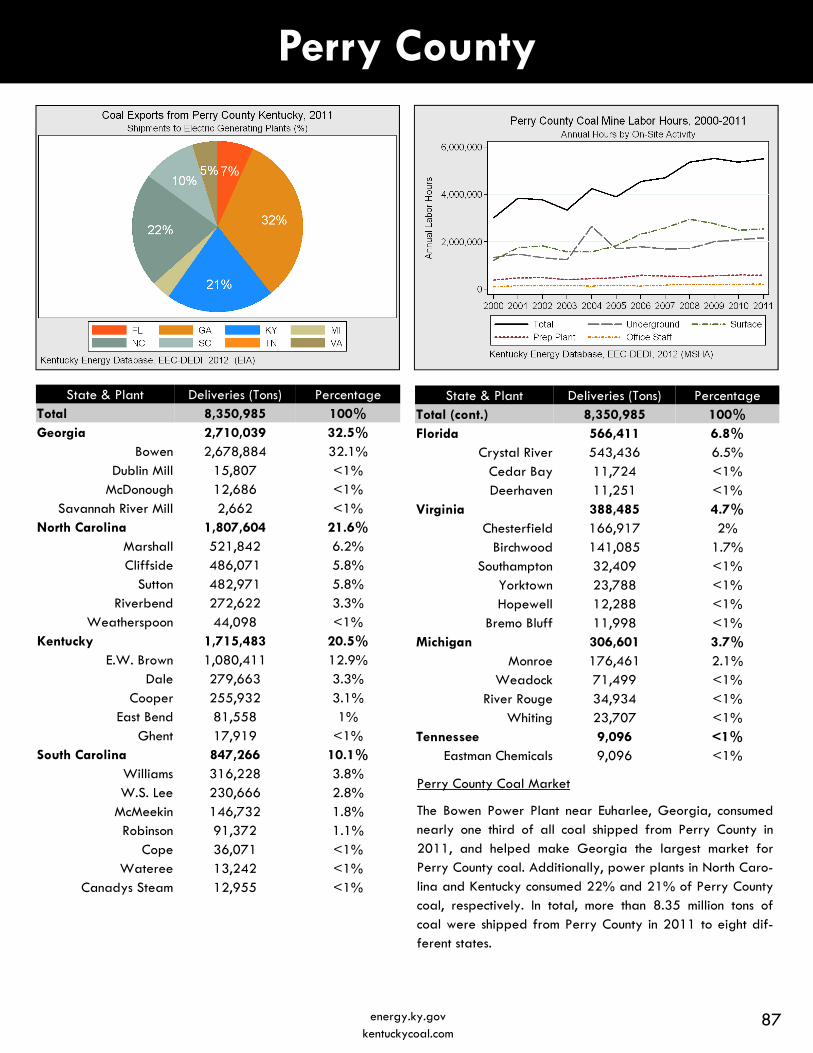
Perry County
Perry County Coal Market
The Bowen Power Plant near Euharlee, Georgia, consumed nearly one third of all coal shipped from Perry County in 2011, and helped make Georgia the largest market for Perry County coal. Additionally, power plants in North Caro-lina and Kentucky consumed 22% and 21% of Perry County coal, respectively. In total, more than 8.35 million tons of coal were shipped from Perry County in 2011 to eight dif-ferent states.
State & Plant Deliveries (Tons) Percentage Total 8,350,985 100% Georgia 2,710,039 32.5%
Bowen 2,678,884 32.1% Dublin Mill 15,807 <1%
McDonough 12,686 <1% Savannah River Mill 2,662 <1%
North Carolina 1,807,604 21.6% Marshall 521,842 6.2% Cliffside 486,071 5.8%
Sutton 482,971 5.8% Riverbend 272,622 3.3%
Weatherspoon 44,098 <1% Kentucky 1,715,483 20.5%
E.W. Brown 1,080,411 12.9% Dale 279,663 3.3%
Cooper 255,932 3.1% East Bend 81,558 1%
Ghent 17,919 <1% South Carolina 847,266 10.1%
Williams 316,228 3.8% W.S. Lee 230,666 2.8%
McMeekin 146,732 1.8% Robinson 91,372 1.1%
Cope 36,071 <1% Wateree 13,242 <1%
Canadys Steam 12,955 <1%
State & Plant Deliveries (Tons) Percentage Total (cont.) 8,350,985 100% Florida 566,411 6.8%
Crystal River 543,436 6.5% Cedar Bay 11,724 <1% Deerhaven 11,251 <1%
Virginia 388,485 4.7% Chesterfield 166,917 2%
Birchwood 141,085 1.7% Southampton 32,409 <1%
Yorktown 23,788 <1% Hopewell 12,288 <1%
Bremo Bluff 11,998 <1% Michigan 306,601 3.7%
Monroe 176,461 2.1% Weadock 71,499 <1%
River Rouge 34,934 <1% Whiting 23,707 <1%
Tennessee 9,096 <1% Eastman Chemicals 9,096 <1%
87 energy.ky.gov kentuckycoal.com
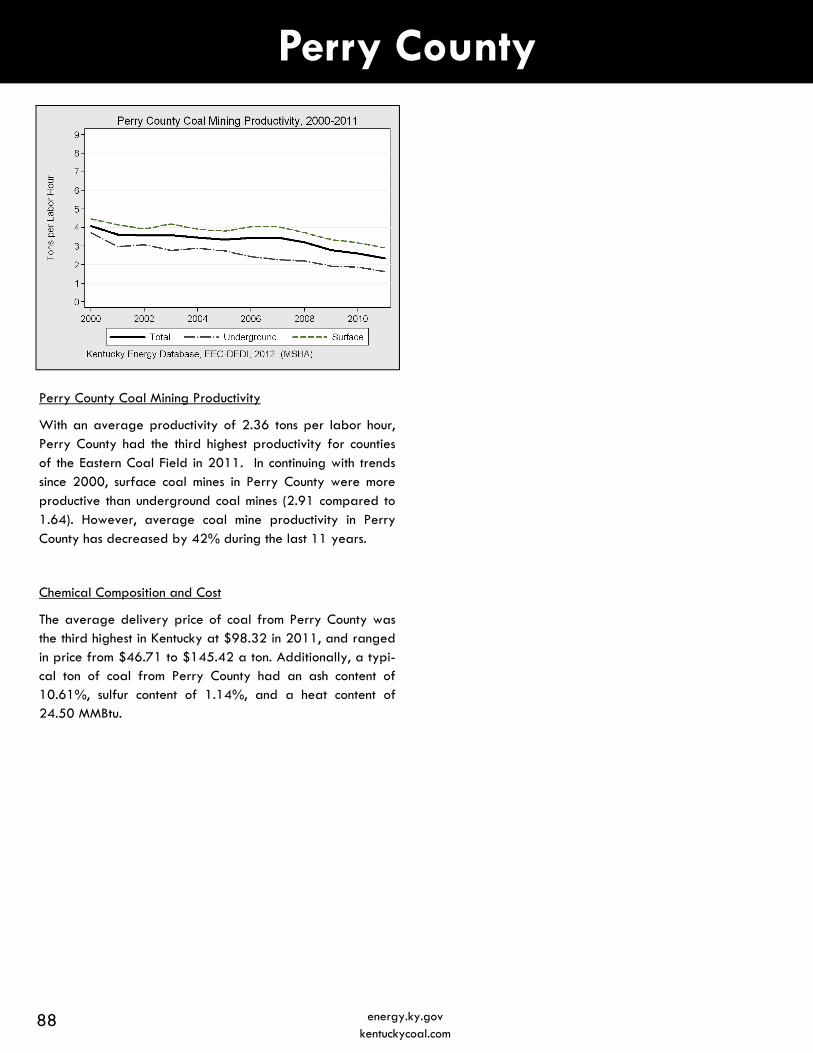
Perry County
Perry County Coal Mining Productivity
With an average productivity of 2.36 tons per labor hour, Perry County had the third highest productivity for counties of the Eastern Coal Field in 2011. In continuing with trends since 2000, surface coal mines in Perry County were more productive than underground coal mines (2.91 compared to 1.64). However, average coal mine productivity in Perry County has decreased by 42% during the last 11 years.
Chemical Composition and Cost
The average delivery price of coal from Perry County was the third highest in Kentucky at $98.32 in 2011, and ranged in price from $46.71 to $145.42 a ton. Additionally, a typi-cal ton of coal from Perry County had an ash content of 10.61%, sulfur content of 1.14%, and a heat content of 24.50 MMBtu.
88 energy.ky.gov kentuckycoal.com
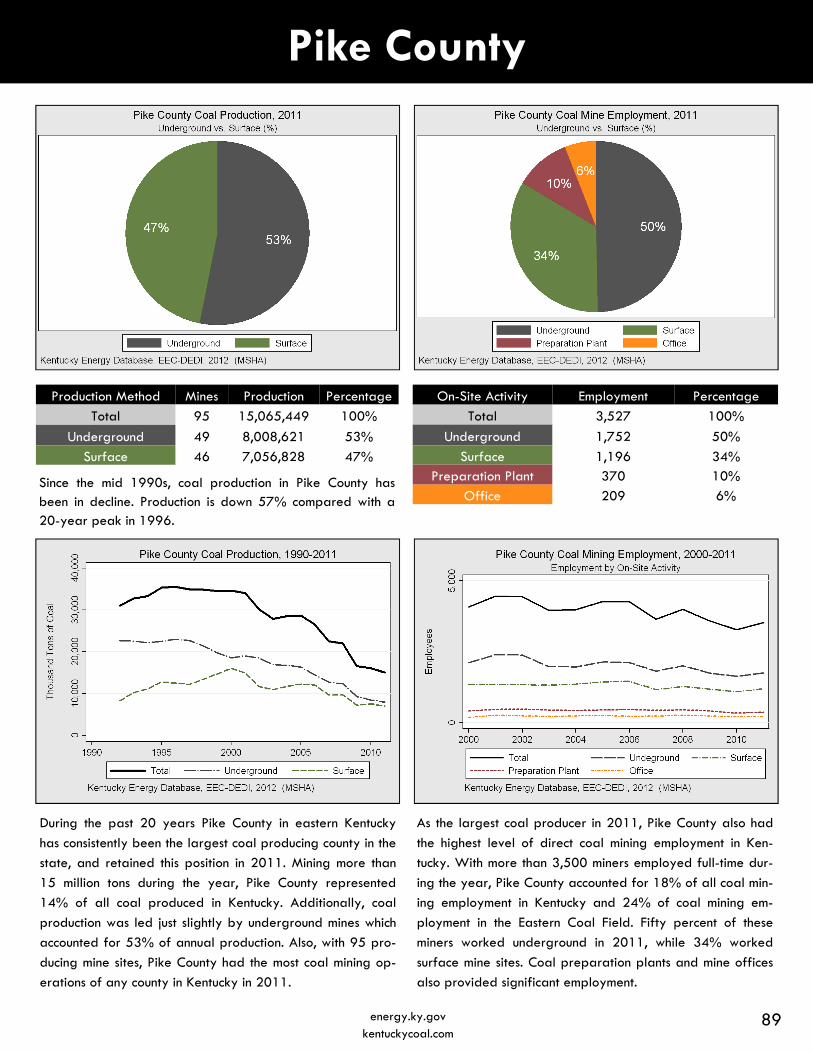
Pike County
During the past 20 years Pike County in eastern Kentucky
has consistently been the largest coal producing county in the
state, and retained this position in 2011. Mining more than
15 million tons during the year, Pike County represented
14% of all coal produced in Kentucky. Additionally, coal
production was led just slightly by underground mines which
accounted for 53% of annual production. Also, with 95 pro-
ducing mine sites, Pike County had the most coal mining op-
erations of any county in Kentucky in 2011.
89 energy.ky.gov kentuckycoal.com
As the largest coal producer in 2011, Pike County also had
the highest level of direct coal mining employment in Ken-
tucky. With more than 3,500 miners employed full-time dur-
ing the year, Pike County accounted for 18% of all coal min-
ing employment in Kentucky and 24% of coal mining em-
ployment in the Eastern Coal Field. Fifty percent of these
miners worked underground in 2011, while 34% worked
surface mine sites. Coal preparation plants and mine offices
also provided significant employment.
Production Method Production Percentage
Total 15,065,449 100%
Underground 8,008,621 53%
Surface 7,056,828 47%
Mines
95
49
46
On-Site Activity Employment Percentage
Total 3,527 100%
Underground 1,752 50%
Surface 1,196 34% Preparation Plant 370 10%
Office 209 6% Since the mid 1990s, coal production in Pike County has been in decline. Production is down 57% compared with a 20-year peak in 1996.
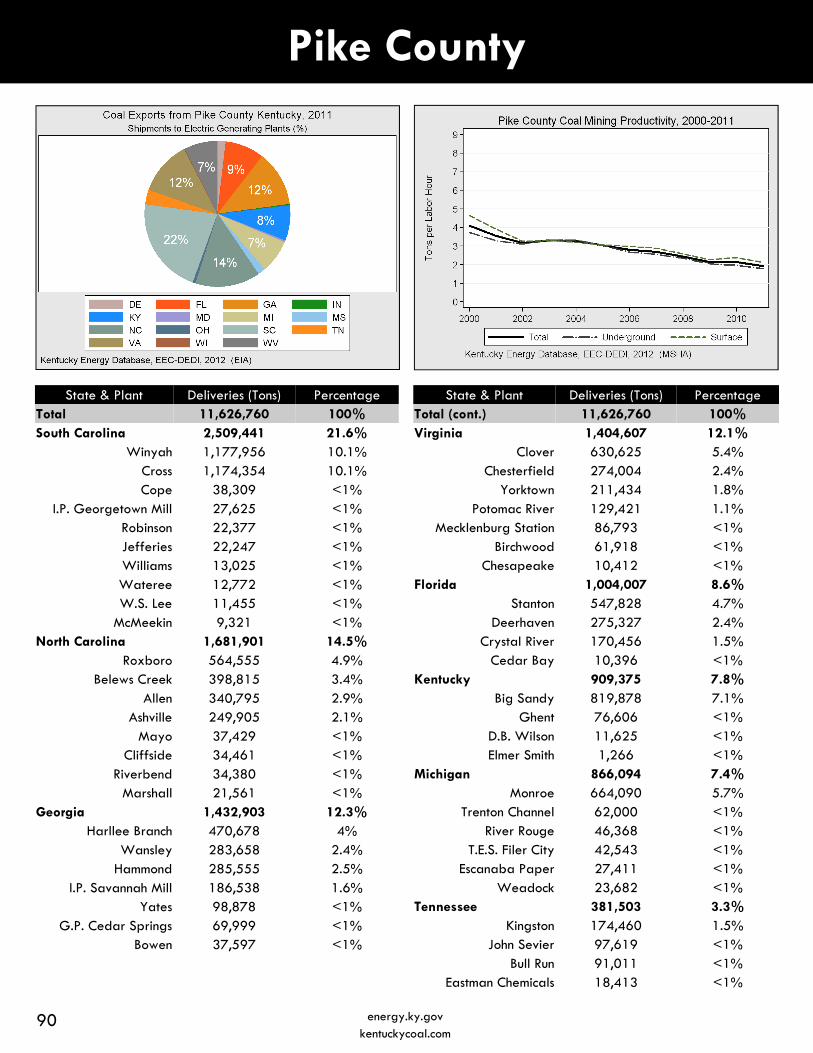
Pike County
State & Plant Deliveries (Tons) Percentage Total 11,626,760 100% South Carolina 2,509,441 21.6%
Winyah 1,177,956 10.1% Cross 1,174,354 10.1% Cope 38,309 <1%
I.P. Georgetown Mill 27,625 <1% Robinson 22,377 <1% Jefferies 22,247 <1% Williams 13,025 <1% Wateree 12,772 <1% W.S. Lee 11,455 <1%
McMeekin 9,321 <1% North Carolina 1,681,901 14.5%
Roxboro 564,555 4.9% Belews Creek 398,815 3.4%
Allen 340,795 2.9% Ashville 249,905 2.1%
Mayo 37,429 <1% Cliffside 34,461 <1%
Riverbend 34,380 <1% Marshall 21,561 <1%
Georgia 1,432,903 12.3% Harllee Branch 470,678 4%
Wansley 283,658 2.4% Hammond 285,555 2.5%
I.P. Savannah Mill 186,538 1.6% Yates 98,878 <1%
G.P. Cedar Springs 69,999 <1% Bowen 37,597 <1%
State & Plant Deliveries (Tons) Percentage Total (cont.) 11,626,760 100% Virginia 1,404,607 12.1%
Clover 630,625 5.4% Chesterfield 274,004 2.4%
Yorktown 211,434 1.8% Potomac River 129,421 1.1%
Mecklenburg Station 86,793 <1% Birchwood 61,918 <1%
Chesapeake 10,412 <1% Florida 1,004,007 8.6%
Stanton 547,828 4.7% Deerhaven 275,327 2.4%
Crystal River 170,456 1.5% Cedar Bay 10,396 <1%
Kentucky 909,375 7.8% Big Sandy 819,878 7.1%
Ghent 76,606 <1% D.B. Wilson 11,625 <1% Elmer Smith 1,266 <1%
Michigan 866,094 7.4% Monroe 664,090 5.7%
Trenton Channel 62,000 <1% River Rouge 46,368 <1%
T.E.S. Filer City 42,543 <1% Escanaba Paper 27,411 <1%
Weadock 23,682 <1% Tennessee 381,503 3.3%
Kingston 174,460 1.5% John Sevier 97,619 <1%
Bull Run 91,011 <1% Eastman Chemicals 18,413 <1%
90 energy.ky.gov kentuckycoal.com
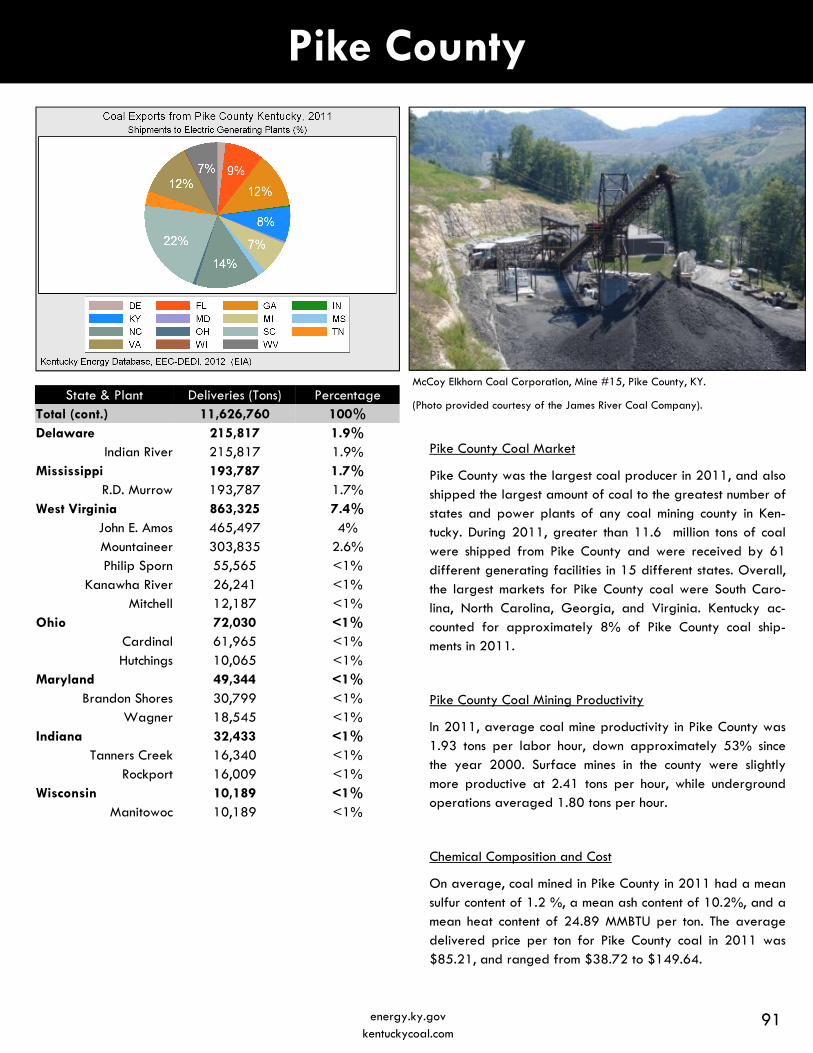
Pike County
91 energy.ky.gov kentuckycoal.com
Pike County Coal Market
Pike County was the largest coal producer in 2011, and also shipped the largest amount of coal to the greatest number of states and power plants of any coal mining county in Ken-tucky. During 2011, greater than 11.6 million tons of coal were shipped from Pike County and were received by 61 different generating facilities in 15 different states. Overall, the largest markets for Pike County coal were South Caro-lina, North Carolina, Georgia, and Virginia. Kentucky ac-counted for approximately 8% of Pike County coal ship-ments in 2011.
Pike County Coal Mining Productivity
In 2011, average coal mine productivity in Pike County was 1.93 tons per labor hour, down approximately 53% since the year 2000. Surface mines in the county were slightly more productive at 2.41 tons per hour, while underground operations averaged 1.80 tons per hour.
Chemical Composition and Cost
On average, coal mined in Pike County in 2011 had a mean sulfur content of 1.2 %, a mean ash content of 10.2%, and a mean heat content of 24.89 MMBTU per ton. The average delivered price per ton for Pike County coal in 2011 was $85.21, and ranged from $38.72 to $149.64.
State & Plant Deliveries (Tons) Percentage Total (cont.) 11,626,760 100% Delaware 215,817 1.9%
Indian River 215,817 1.9% Mississippi 193,787 1.7%
R.D. Murrow 193,787 1.7% West Virginia 863,325 7.4%
John E. Amos 465,497 4% Mountaineer 303,835 2.6% Philip Sporn 55,565 <1%
Kanawha River 26,241 <1% Mitchell 12,187 <1%
Ohio 72,030 <1% Cardinal 61,965 <1% Hutchings 10,065 <1%
Maryland 49,344 <1% Brandon Shores 30,799 <1%
Wagner 18,545 <1% Indiana 32,433 <1%
Tanners Creek 16,340 <1% Rockport 16,009 <1%
Wisconsin 10,189 <1% Manitowoc 10,189 <1%
McCoy Elkhorn Coal Corporation, Mine #15, Pike County, KY.
(Photo provided courtesy of the James River Coal Company).

Union County
On-Site Activity Employment Percentage
Total 1,278 100%
Underground 1,097 86%
Preparation Plant 113 9% Surface 49 4% Office 19 1%
The 3 large underground coal mines and 1 preparation
plant operating in Union County produced 12.3 million tons
of coal in 2011, which was 12% of the Commonwealth’s pro-
duction. Union County not only broke its single-year coal pro-
duction mark during 2011, but has also increased production
by 153% since 2006. A major factor in the direction of Un-
ion County’s coal production has been the development of
the River View Mine, which now holds the record in Kentucky
for the most production by one mine in a year.
Union County’s coal mines employed 1,278 persons in 2011,
an increase of 7.8% from 2010 and an increase of 98%
from 2000. Just under 1,100 coal miners worked primarily
underground for a total of 2,623,928 labor hours. Coal
preparation plants employed 113 persons for 283,172 la-
bor hours. Surface mine sites provided 49 jobs for miners
and 19 administrative staff worked in on-site offices sup-
porting direct mining operations.
Production Method Production Percentage
Total 12,333,160 100%
Underground 12,333,160 100%
Mines
3
3
Unlike most coal-producing counties in Kentucky, mine pro-ductivity in Union County has been stable since 2004 and has actually increased over the past three years.
92 energy.ky.gov kentuckycoal.com
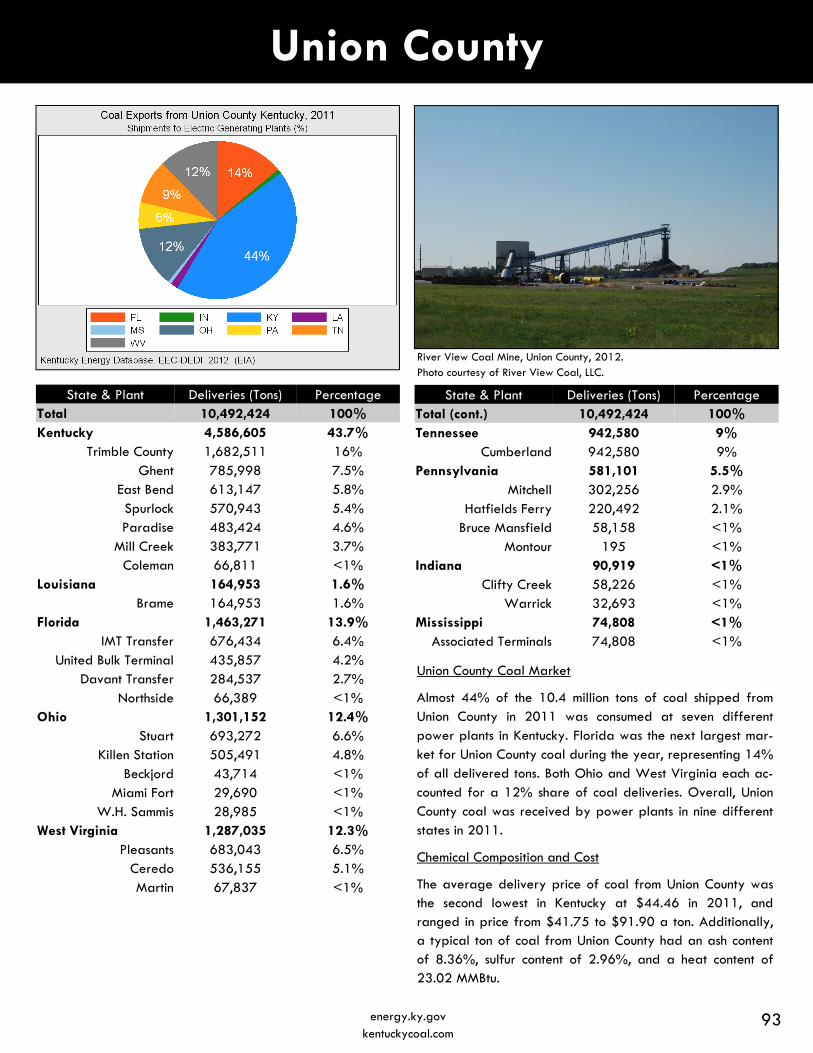
Union County
Union County Coal Market
Almost 44% of the 10.4 million tons of coal shipped from Union County in 2011 was consumed at seven different power plants in Kentucky. Florida was the next largest mar-ket for Union County coal during the year, representing 14% of all delivered tons. Both Ohio and West Virginia each ac-counted for a 12% share of coal deliveries. Overall, Union County coal was received by power plants in nine different states in 2011.
Chemical Composition and Cost
The average delivery price of coal from Union County was the second lowest in Kentucky at $44.46 in 2011, and ranged in price from $41.75 to $91.90 a ton. Additionally, a typical ton of coal from Union County had an ash content of 8.36%, sulfur content of 2.96%, and a heat content of 23.02 MMBtu.
State & Plant Deliveries (Tons) Percentage Total 10,492,424 100% Kentucky 4,586,605 43.7%
Trimble County 1,682,511 16% Ghent 785,998 7.5%
East Bend 613,147 5.8% Spurlock 570,943 5.4% Paradise 483,424 4.6%
Mill Creek 383,771 3.7% Coleman 66,811 <1%
Louisiana 164,953 1.6% Brame 164,953 1.6%
Florida 1,463,271 13.9% IMT Transfer 676,434 6.4%
United Bulk Terminal 435,857 4.2% Davant Transfer 284,537 2.7%
Northside 66,389 <1% Ohio 1,301,152 12.4%
Stuart 693,272 6.6% Killen Station 505,491 4.8%
Beckjord 43,714 <1% Miami Fort 29,690 <1%
W.H. Sammis 28,985 <1% West Virginia 1,287,035 12.3%
Pleasants 683,043 6.5% Ceredo 536,155 5.1% Martin 67,837 <1%
State & Plant Deliveries (Tons) Percentage Total (cont.) 10,492,424 100% Tennessee 942,580 9%
Cumberland 942,580 9% Pennsylvania 581,101 5.5%
Mitchell 302,256 2.9% Hatfields Ferry 220,492 2.1%
Bruce Mansfield 58,158 <1% Montour 195 <1%
Indiana 90,919 <1% Clifty Creek 58,226 <1%
Warrick 32,693 <1% Mississippi 74,808 <1%
Associated Terminals 74,808 <1%
River View Coal Mine, Union County, 2012. Photo courtesy of River View Coal, LLC.
93 energy.ky.gov kentuckycoal.com

Webster County
On-Site Activity Employment Percentage
Total 717 100%
Underground 613 85%
Preparation Plant 54 8% Surface 30 4% Office 20 3%
Coal production in Webster County came entirely from un-
derground operations during 2011. Webster County pro-
duced more than 5.7 million tons of coal which represented
5% of the Commonwealth’s total annual production. Interest-
ingly, since 2006 coal production levels in the county have
fluctuated dramatically depending on the year. However,
Webster County annual production remains notably down
from a recent peak of 10.6 million tons in 1997.
Coal mines in Webster County directly employed 717 peo-
ple full-time during 2011. Underground mine sites by far
represented the largest concentration of direct coal mining
jobs, employing 613 miners through the year. Coal prepara-
tion plants provided 54 full-time jobs, surface operations
employed 30 miners, and mine offices were staffed by 20
individuals. Unsurprisingly, underground mine employment
has fluctuated directly with underground coal production dur-
ing the last five years.
Production Method Production Percentage
Total 5,730,589 100%
Underground 5,730,589 100%
Mines
2
2
Relative to many other coal-producing counties in Kentucky, mine productivity in Webster County has been stable since 2005.
94 energy.ky.gov kentuckycoal.com
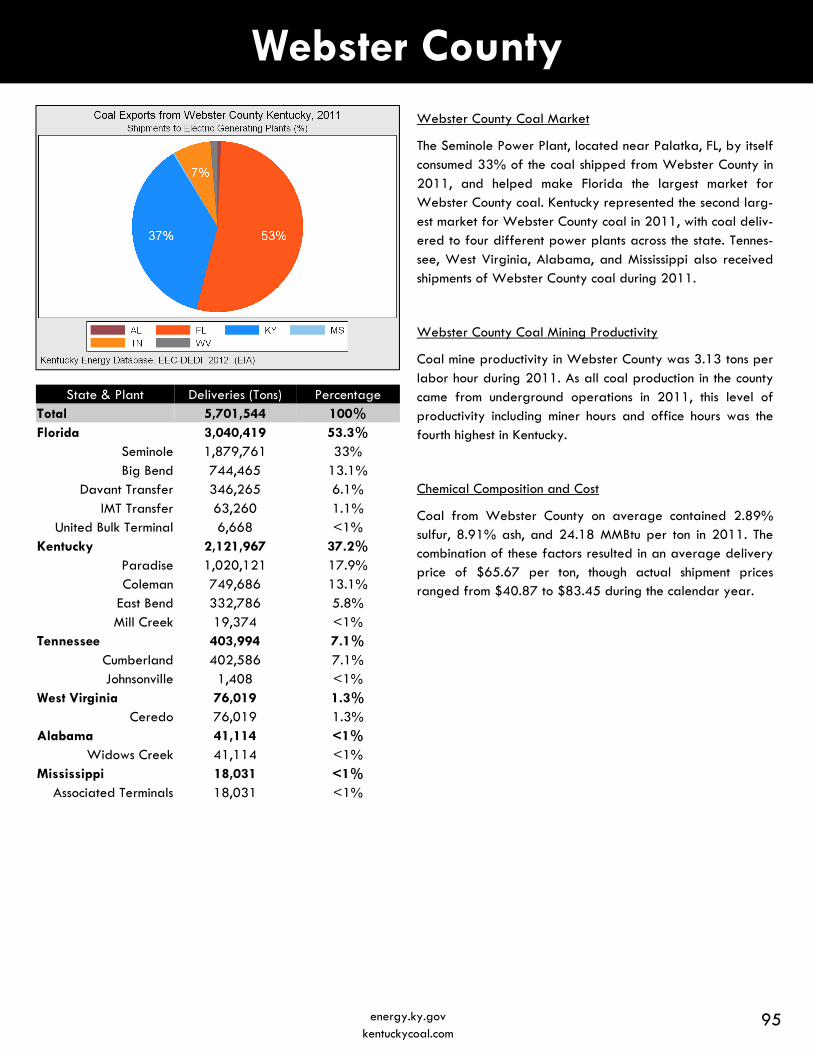
Webster County Webster County Coal Market
The Seminole Power Plant, located near Palatka, FL, by itself consumed 33% of the coal shipped from Webster County in 2011, and helped make Florida the largest market for Webster County coal. Kentucky represented the second larg-est market for Webster County coal in 2011, with coal deliv-ered to four different power plants across the state. Tennes-see, West Virginia, Alabama, and Mississippi also received shipments of Webster County coal during 2011.
Webster County Coal Mining Productivity
Coal mine productivity in Webster County was 3.13 tons per labor hour during 2011. As all coal production in the county came from underground operations in 2011, this level of productivity including miner hours and office hours was the fourth highest in Kentucky.
Chemical Composition and Cost
Coal from Webster County on average contained 2.89% sulfur, 8.91% ash, and 24.18 MMBtu per ton in 2011. The combination of these factors resulted in an average delivery price of $65.67 per ton, though actual shipment prices ranged from $40.87 to $83.45 during the calendar year.
State & Plant Deliveries (Tons) Percentage Total 5,701,544 100% Florida 3,040,419 53.3%
Seminole 1,879,761 33% Big Bend 744,465 13.1%
Davant Transfer 346,265 6.1% IMT Transfer 63,260 1.1%
United Bulk Terminal 6,668 <1% Kentucky 2,121,967 37.2%
Paradise 1,020,121 17.9% Coleman 749,686 13.1%
East Bend 332,786 5.8% Mill Creek 19,374 <1%
Tennessee 403,994 7.1% Cumberland 402,586 7.1% Johnsonville 1,408 <1%
West Virginia 76,019 1.3% Ceredo 76,019 1.3%
Alabama 41,114 <1% Widows Creek 41,114 <1%
Mississippi 18,031 <1% Associated Terminals 18,031 <1%
95 energy.ky.gov kentuckycoal.com
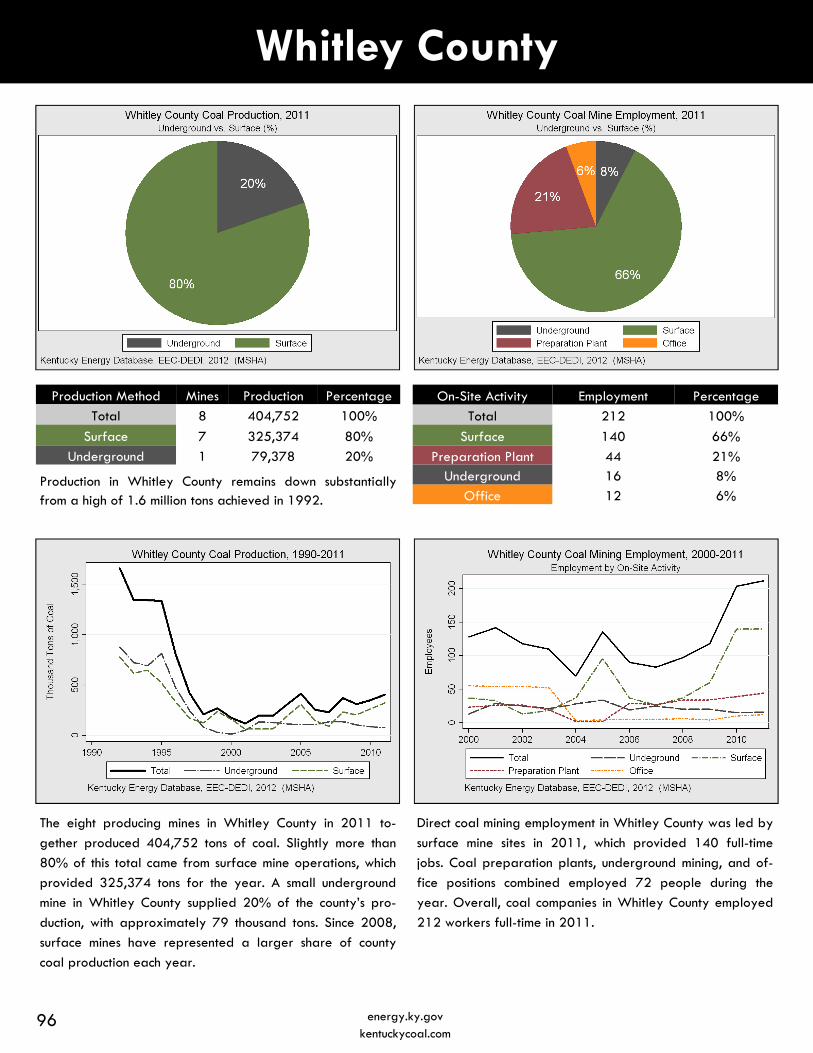
Whitley County
On-Site Activity Employment Percentage
Total 212 100%
Surface 140 66%
Preparation Plant 44 21% Underground 16 8%
Office 12 6%
The eight producing mines in Whitley County in 2011 to-
gether produced 404,752 tons of coal. Slightly more than
80% of this total came from surface mine operations, which
provided 325,374 tons for the year. A small underground
mine in Whitley County supplied 20% of the county’s pro-
duction, with approximately 79 thousand tons. Since 2008,
surface mines have represented a larger share of county
coal production each year.
Direct coal mining employment in Whitley County was led by
surface mine sites in 2011, which provided 140 full-time
jobs. Coal preparation plants, underground mining, and of-
fice positions combined employed 72 people during the
year. Overall, coal companies in Whitley County employed
212 workers full-time in 2011.
Production Method Production Percentage
Total 404,752 100%
Surface 325,374 80%
Underground 79,378 20%
Mines
8
7
1
Production in Whitley County remains down substantially from a high of 1.6 million tons achieved in 1992.
96 energy.ky.gov kentuckycoal.com
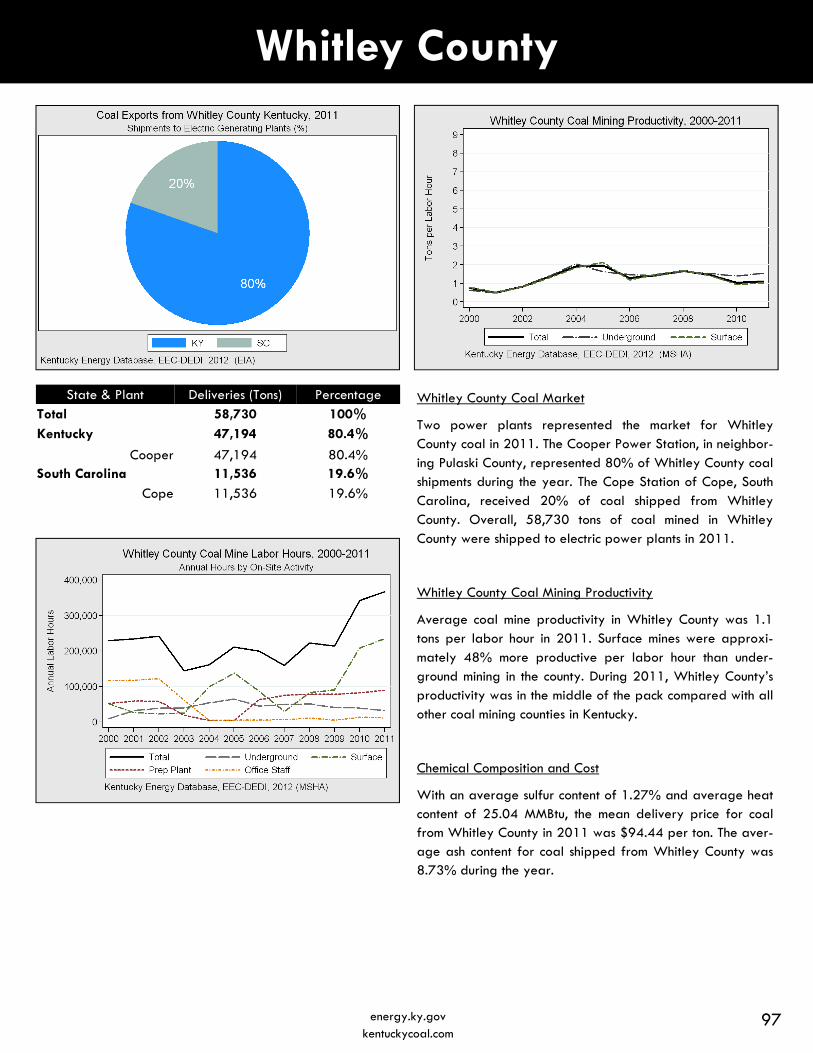
Whitley County
Whitley County Coal Market
Two power plants represented the market for Whitley County coal in 2011. The Cooper Power Station, in neighbor-ing Pulaski County, represented 80% of Whitley County coal shipments during the year. The Cope Station of Cope, South Carolina, received 20% of coal shipped from Whitley County. Overall, 58,730 tons of coal mined in Whitley County were shipped to electric power plants in 2011.
Whitley County Coal Mining Productivity
Average coal mine productivity in Whitley County was 1.1 tons per labor hour in 2011. Surface mines were approxi-mately 48% more productive per labor hour than under-ground mining in the county. During 2011, Whitley County’s productivity was in the middle of the pack compared with all other coal mining counties in Kentucky.
Chemical Composition and Cost
With an average sulfur content of 1.27% and average heat content of 25.04 MMBtu, the mean delivery price for coal from Whitley County in 2011 was $94.44 per ton. The aver-age ash content for coal shipped from Whitley County was 8.73% during the year.
State & Plant Deliveries (Tons) Percentage Total 58,730 100% Kentucky 47,194 80.4%
Cooper 47,194 80.4% South Carolina 11,536 19.6%
Cope 11,536 19.6%
97 energy.ky.gov kentuckycoal.com
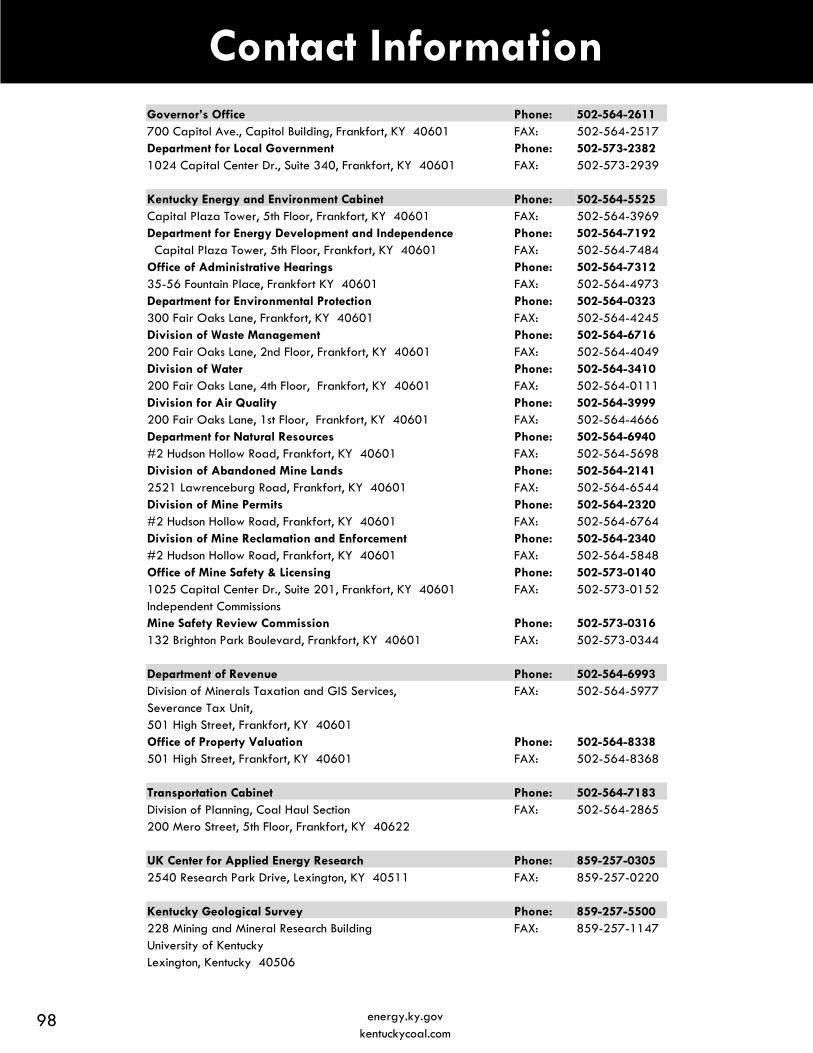
Contact Information Governor’s Office Phone: 502-564-2611 700 Capitol Ave., Capitol Building, Frankfort, KY 40601 FAX: 502-564-2517 Department for Local Government Phone: 502-573-2382 1024 Capital Center Dr., Suite 340, Frankfort, KY 40601 FAX: 502-573-2939
Kentucky Energy and Environment Cabinet Phone: 502-564-5525 Capital Plaza Tower, 5th Floor, Frankfort, KY 40601 FAX: 502-564-3969 Department for Energy Development and Independence Phone: 502-564-7192 Capital Plaza Tower, 5th Floor, Frankfort, KY 40601 FAX: 502-564-7484 Office of Administrative Hearings Phone: 502-564-7312 35-56 Fountain Place, Frankfort KY 40601 FAX: 502-564-4973 Department for Environmental Protection Phone: 502-564-0323 300 Fair Oaks Lane, Frankfort, KY 40601 FAX: 502-564-4245 Division of Waste Management Phone: 502-564-6716 200 Fair Oaks Lane, 2nd Floor, Frankfort, KY 40601 FAX: 502-564-4049 Division of Water Phone: 502-564-3410 200 Fair Oaks Lane, 4th Floor, Frankfort, KY 40601 FAX: 502-564-0111 Division for Air Quality Phone: 502-564-3999 200 Fair Oaks Lane, 1st Floor, Frankfort, KY 40601 FAX: 502-564-4666 Department for Natural Resources Phone: 502-564-6940 #2 Hudson Hollow Road, Frankfort, KY 40601 FAX: 502-564-5698 Division of Abandoned Mine Lands Phone: 502-564-2141 2521 Lawrenceburg Road, Frankfort, KY 40601 FAX: 502-564-6544 Division of Mine Permits Phone: 502-564-2320 #2 Hudson Hollow Road, Frankfort, KY 40601 FAX: 502-564-6764 Division of Mine Reclamation and Enforcement Phone: 502-564-2340 #2 Hudson Hollow Road, Frankfort, KY 40601 FAX: 502-564-5848 Office of Mine Safety & Licensing Phone: 502-573-0140 1025 Capital Center Dr., Suite 201, Frankfort, KY 40601 FAX: 502-573-0152 Independent Commissions
Mine Safety Review Commission Phone: 502-573-0316 132 Brighton Park Boulevard, Frankfort, KY 40601 FAX: 502-573-0344
Department of Revenue Phone: 502-564-6993 Division of Minerals Taxation and GIS Services, FAX: 502-564-5977 Severance Tax Unit,
501 High Street, Frankfort, KY 40601
Office of Property Valuation Phone: 502-564-8338 501 High Street, Frankfort, KY 40601 FAX: 502-564-8368
Transportation Cabinet Phone: 502-564-7183 Division of Planning, Coal Haul Section FAX: 502-564-2865 200 Mero Street, 5th Floor, Frankfort, KY 40622
UK Center for Applied Energy Research Phone: 859-257-0305 2540 Research Park Drive, Lexington, KY 40511 FAX: 859-257-0220
Kentucky Geological Survey Phone: 859-257-5500 228 Mining and Mineral Research Building FAX: 859-257-1147 University of Kentucky
Lexington, Kentucky 40506
98 energy.ky.gov kentuckycoal.com

Information Assistance Kentucky Energy and Environment Cabinet 502-564-5525 500 Mero Street, Capital Plaza Tower, Frankfort, KY 40601 Fax 502-564-3969 Office of Communications and Outreach [email protected] Department for Energy Development and Independence (www.energy.gov)
Kentucky Coal Association 859-233-4743 2800 Palumbo Drive, Suite 200 Fax 859-233-4745 Lexington, Kentucky 40509 (www.kentuckycoal.org) Bill Bissett, President [email protected] David Moss, Vice President [email protected]
Kentucky Cabinet for Economic Development 502-564-7140 Old Capitol Annex, 300 West Broadway, Frankfort, KY 40601 (www.thinkkentucky.com) Larry Hayes, Secretary [email protected]
Kentucky Geological Survey 859-257-3896 228 Mining and Mineral Resources Bldg., University of Kentucky Fax 859-257-1147 Lexington, KY 40506 (www.uky.edu/kgs) James C. Cobb, Director and State Geologist [email protected]
University of Kentucky Mining Engineering Department 859-257-8026 230 Mining & Mineral Resources Building Fax 859-323-1962 Lexington, KY 40506 (www.engr.uky.edu/mng) Rick Honaker, Chair [email protected]
Midway College Mining Magagement and Safety Program 800-952-4122 512 East Stephens St. (www.midway.edu/academic-programs/) Midway, KY 40347 [email protected] Shannon Lusk, Coordinator
CEDAR, Inc. 606-477-3456 Box 2152, Pikeville, KY 41502 [email protected] John F. Justice, President (www.cedarinc.org)
CEDAR WEST, Inc. 270-333-2839 Box 23, Sturgis, KY 42459 Fax 270-333-3443 Ben Spears, Chairman (www.wkycedar.org)
Kentucky Coal Academy 859-246-0041 Kentucky Community & Technical College System Fax 859-246-0048 2780 Research Park Drive, Lexington, KY 40511 (http://coalacademy.kctcs.edu) Bill Higginbotham, Executive Director [email protected]
Kentucky NEED Project 866/-736-8941 Box 176055, Covington, KY 41017 (www.need.org/states/kentucky) Karen Reagor, Coordinator [email protected]
99 energy.ky.gov kentuckycoal.com
Data Sources
Kentucky Energy and Environment Cabinet Department for Energy Development and Independence (DEDI) Department for Natural Resources (DNR) Department for Environmental Protection (DEP) Kentucky Geological Survey United States Department of Energy (DOE) Energy Information Administration (EIA) Federal Energy Regulatory Commission (FERC) United State Department of Commerce (DOC) Bureau of Economic Analysis U.S. Census Bureau United States Department of the Interior (DOI) Environmental Protection Agency (EPA) United States Department of Labor (DOL) Mine Safety Health Administration (MSHA) Bureau of Labor Statistics (BLS)
Additional Reference and Educational Materials (Not Used in this Document) U. S. Department of Energy (www.fossil.energy.gov/education/) American Coal Foundation (www.teachcoal.org) UK Center for Applied Energy Research (www.caer.uky.edu) Coal In Kentucky University of Kentucky, documentary (2010) (www.coalinkentucky.com)
100 energy.ky.gov kentuckycoal.com

101 energy.ky.gov kentuckycoal.com

102 energy.ky.gov kentuckycoal.com