kenya: how equitable was the - internationalbudget.org · kenya: how equitable was the projects ......
TRANSCRIPT

1
Dissatisfaction with the way in which resources have been shared in Kenya has colored the country’s post-
independence history and has been a key driver of legal and fiscal reform. Prior to 2010, the introduction of
decentralization and the Constituency Development Fund were intended to address this dissatisfaction. With the
new constitution, Kenya created a new revenue allocation formula for counties and an Equalization Fund to
address continuing tensions over resource sharing.
However, while principles of equity have clearly informed these reforms, there remains little discussion of equity in
regard to the massive funds that remain with the national government. The national government still spends the
largest share of revenue through its Ministries, Departments and Agencies (MDAs). In 2017/18 the development
budget at the national level, of Ksh. 642 billion, is more than double the total equitable share to all 47 counties in
Kenya (Ksh. 302 billion).
One factor that has hampered discussions of equity in national government spending is the lack of disaggregated
information about spending, especially regarding capital expenditure. However, in 2016/17, the national
government began to provide additional information in its line-item budget. For the first time, MDA development
budgets were broken down to the individual project level, showing the distribution of development projects across
the country in all the ministries, departments, and agencies.
This budget brief looks at the geographical distribution of capital projects in the State Department for
Infrastructure and State Department for Water Services in the 2016/17 budget. The Department for Infrastructure
was selected because it is one of the biggest spenders of capital funds, second only to the State Department for
Transport, whose budget was mainly allocated to the Standard Gauge Railway in 2016/17. In the case of the State
Department for Water Services, while water and sanitation functions are devolved, a large portion of what is spent
on water in the country is still spent by state corporations at the national level.
These two MDAs are allocated Ksh. 187 billion for development, which is 23 percent of the total development
budget in 2016/17. The State Department for Infrastructure has the largest share of the two MDAs at 18 percent of
the total MDAs development budget, while Water Services accounts for 5 percent of the budget. An analysis of the
Kenya: How Equitable Was the Distribution of National Roads and Water Projects in 2016/17?
John Kinuthia | January 2018

2
two MDAs therefore covers about one quarter of spending in capital projects by the national government for that
year. Though we hope this breakdown will also be presented for the 2017/18 budget year, the line-item budget for
2017/18 is not yet publicly available as of the time of writing.
WHAT WE DID
The first step in this analysis was to link all projects to counties and regions because there are some projects that
cover broader geographical regions beyond individual counties. The line-item budget estimates in 2016/17 provide
data of individual projects with their allocations for the budget year, and projections for 2017/18 and 2018/19.
However, the data does not indicate the specific locations of each project. Therefore, we assigned all projects to
counties based on their names where possible. Names were found through internet search, websites of state
corporations involved with construction of roads, and water service boards for water projects. We coded all of the
projects in the budget except for a single project that we could not identify.1
Some projects in the budget covered a geographical area that is larger than one county, so we assigned them to
regions comprising several counties. Budgetary allocations at county and regional levels were then analyzed
against roads and water access data to establish the level of need for both types of investment at county and
regional levels. Data on the kilometers (KMs) of paved and unpaved roads per county was obtained from the
World Bank and Commission on Revenue Allocation’s recommendation for the second-generation formula.2 Water
access data was obtained from, “Exploring Kenya’s Inequality” a report by Kenya National Bureau of Statistics and
Society for International Development. 3
Our analysis covers only one year of spending, 2016/17, which is the only year in which data showing individual
capital projects has been included in the budget estimates. No data is available from previous years, so it is difficult
to know whether the projects in 2016/17 are new or ongoing projects (and no clarification of this is offered in the
2016/17 budget itself). It is therefore impossible to know how the distribution of capital investments is changing at
the current time.
The costs of infrastructure projects can also be affected by aspects like the land terrain or population density in the
areas where they are located. However, the variations in costs caused by such factors is not given in any public
document. Sector reports, which inform government planning over the medium term, lack data explaining the
criteria for distributing projects or costs. There is no publicly available information on how the government takes
1 The only project we could not identify was “Ruwaciondo Dam.” 2 http://www.crakenya.org/wp-content/uploads/2013/10/CRA-RECOMMENDATION-ON-EQUITABLE-REVENUE-SHARING-
November-2014.pdf 3 http://inequalities.sidint.net/kenya/national/water-sources/

3
unique needs into account when allocating the capital budget. Therefore, while the presentation of the 2016/17
development budget is better than in previous years, it is still challenging to interpret the data in a meaningful
way. These gaps also hinder the National Assembly from playing its role in approving and monitoring the budget.
BOX 1. DATA USED IN THE ANALYSIS
ROADS INFRASTRUCTURE
The table below shows the country’s overall expenditure on roads in the last two years (2015/16 and 2016/17).
Construction of roads is a function that is now shared among the two levels of government. Based on the spending
on these functions in the two years, a large part of what was spent was at the national government level.
TABLE 1. EXPENDITURE ON ROADS IN 2015/16 AND 2016/17
Infrastructure/Roads and Transport
2015/16 ( Ksh. billions)
2016/17 (Ksh. billions)
Share of Total Sector Spending (2015/16)
Share of Total Sector Spending (2016/17)
National 63.00 176.75 62% 80%
County 39.34 44.26 38% 20%
Total 102.34 221.01 100% 100%
Source: Estimates of Development Expenditure 2016/17, National Treasury and Vertical Recommendations for 2016/17 and 2017/18, CRA
In April 2016, the Transition Authority released data on all roads in the country as part of unbundling of
functions in the sector. However, the data has two main weakness. First the data does not show how roads
under the national government are spread across the country either by counties or by broader regions.
Secondly, the data seems to show the total distance of all roads and does not separate paved roads and
unpaved roads. Therefore, that data would not be useful in this analysis. As a result, the county data used in
this analysis are indicative of the status of roads (and therefore the need for investments in roads) around the
country, but we lack data on the exact distribution of national roads.
4
DISTRIBUTION OF ROADS PROJECT
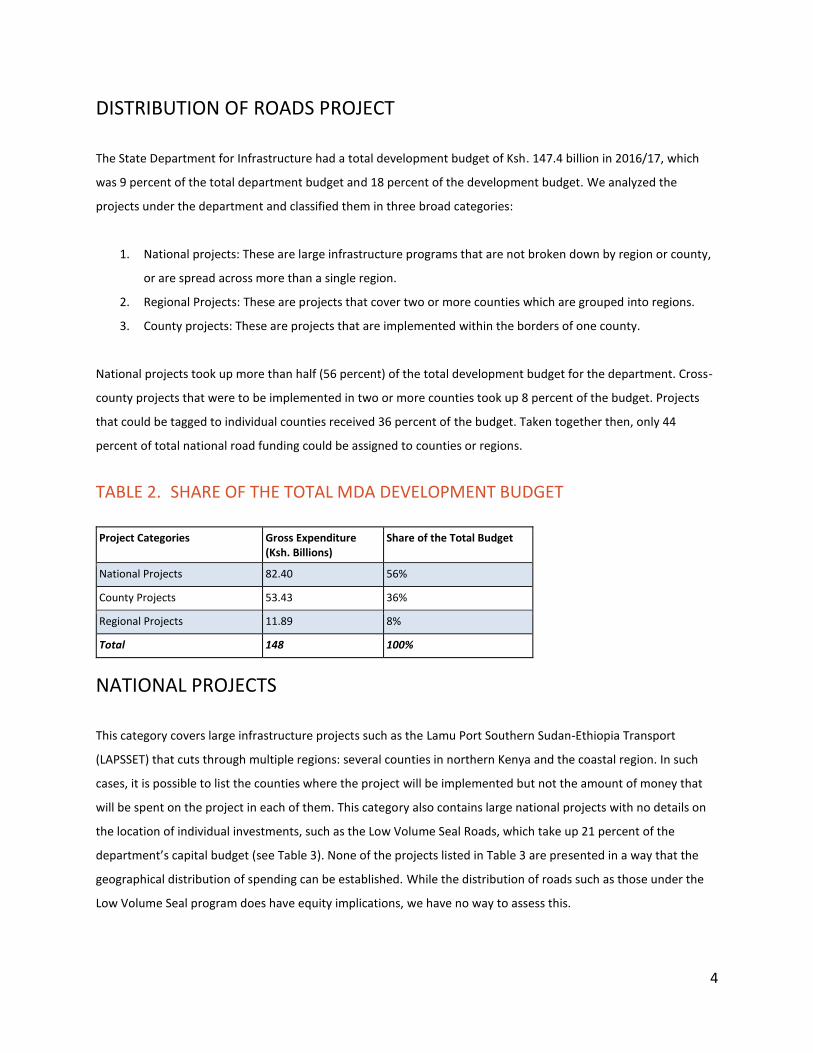
The State Department for Infrastructure had a total development budget of Ksh. 147.4 billion in 2016/17, which
was 9 percent of the total department budget and 18 percent of the development budget. We analyzed the
projects under the department and classified them in three broad categories:
1. National projects: These are large infrastructure programs that are not broken down by region or county,
or are spread across more than a single region.
2. Regional Projects: These are projects that cover two or more counties which are grouped into regions.
3. County projects: These are projects that are implemented within the borders of one county.
National projects took up more than half (56 percent) of the total development budget for the department. Cross-
county projects that were to be implemented in two or more counties took up 8 percent of the budget. Projects
that could be tagged to individual counties received 36 percent of the budget. Taken together then, only 44
percent of total national road funding could be assigned to counties or regions.
TABLE 2. SHARE OF THE TOTAL MDA DEVELOPMENT BUDGET
Project Categories Gross Expenditure (Ksh. Billions)
Share of the Total Budget
National Projects 82.40 56%
County Projects 53.43 36%
Regional Projects 11.89 8%
Total 148 100%
NATIONAL PROJECTS
This category covers large infrastructure projects such as the Lamu Port Southern Sudan-Ethiopia Transport
(LAPSSET) that cuts through multiple regions: several counties in northern Kenya and the coastal region. In such
cases, it is possible to list the counties where the project will be implemented but not the amount of money that
will be spent on the project in each of them. This category also contains large national projects with no details on
the location of individual investments, such as the Low Volume Seal Roads, which take up 21 percent of the
department’s capital budget (see Table 3). None of the projects listed in Table 3 are presented in a way that the
geographical distribution of spending can be established. While the distribution of roads such as those under the
Low Volume Seal program does have equity implications, we have no way to assess this.

5
The national projects category also includes allocations for the Kenya Highways Building Institute (KHBI). This is a
tertiary institution that serves students from across the county. While the institution and its satellite schools are
located in particular areas, we cannot say that these local offices are for the benefit of the host county or any
specific region.
As shown in Table 2, the national projects take up more than half the capital budget for 2016/17, but there is little
information on what projects they are and where they are to be implemented. This lack of transparency makes it
difficult to monitor implementation or discuss the way that these funds are distributed.
TABLE 3. TOP TEN NATIONAL PROJECTS
Project Gross capital Expenditure (Ksh. Billions)(?)
Kenya Transport Sector Support Programme 14.50
Low Volume Seal Roads Batch 1 12.37
Low Volume Seals Phase 1 Batch 2 9.80
Annuity Low Volume Seal Roads 9.49
South Sudan Eastern Africa Transport, Trade & Development Facilitation
8.20
National Urban Transport Improvement Project (NUTRIP) 8.04
Low Volume Sealed Roads (Lvsr); Phase 1 - Batch 1A 5.23
Northern Corridor Transport Improvement Project 4.53
Eu Missing Links (Eu Funded 67% & 33% GOK) 1.70
Low Volume Seals Phase 1 Batch 2 1.62
Subtotal for top 10 projects 75.47
Total for National projects 82.40
Top 10 projects as a share of all national projects 92%
COUNTY PROJECTS
The second category of projects are those which remain within the boundaries of one county. This does not
include any roads funded and constructed by county governments. Spending by national government was spread
across all but eight of the 47 counties. For counties with no funding, it is possible that some of the expenditure in
the national category is for projects in these counties.

6
In the 2016/17 development budget, Nairobi and Mombasa had the largest share of the national budget at 23 and
16 percent respectively, taking up more than one-third of funding in projects under this category. While the
distribution of funding appears to be dispersed across many of the 47 counties, 75 percent of these road funds
were allocated to the top 10 counties in terms of allocations.
There are challenges in finding good and accurate data that provide information on access to roads at county level
access across the country. The best indicator we have found is the number of paved and unpaved kilometers of
roads in 2013 from the World Bank. This data contains classes of roads that were expected to be under the county
governments at that time. Some of these roads were later moved to the national level by the Transition Authority,
so the data is imperfect: it contains county and some national roads, but not all national roads.
We assessed budget allocations for roads against three measures of need. First, we looked at need based on the
share of unpaved roads in a county; unpaved roads should ideally be paved and the larger the network of unpaved
roads, the greater the need for investment in paving. However, this does not address other types of need, such as
the need for roads relative to the land area of a county. We therefore also consider paved roads relative to each
county’s land area, assuming that those counties with fewer paved roads per square kilometer have greater need.
Finally, because land area does not tell us about population needs, we also look at population per kilometer of
paved road as a measure of need. These are complementary approaches, since roads are needed both to connect
distant areas, and to serve populations.
The 10 counties with the highest shares of unpaved roads contain 40 percent of all unpaved roads in the country.
However, these counties were only allocated 12 percent of the capital budget in the infrastructure department. On
the other hand, the ten counties with the smallest share of unpaved roads took up 43 percent of the capital
budget. So, from the perspective of financing the paving of unpaved roads, this distribution appears inequitable.
TABLE 4. FIRST MEASURE OF NEED: SHARE OF UNPAVED ROADS PER COUNTY
County Unpaved (KMs) County Share of Unpaved Roads
County share of Gross Capital Expenditure
Top Ten Counties
Nakuru 8,718 6% 1%
Kitui 7,992 6% 1%
Makueni 7,254 5% 0%
Machakos 5,426 4% 2%
Kajiado 5,175 4% 0%
Kiambu 4,419 3% 2%

7
Meru 4,260 3% 6%
Wajir 4,195 3% 0%
Turkana 4,132 3% 0%
Narok 3,996 3% 0%
Subtotal 55,566 40% 12%
Bottom Ten Counties
Tharaka Nithi 1,687 1% 0%
Nairobi 1,624 1% 23%
Trans Nzoia 1,556 1% 1%
Elgeyo Marakwet 1,511 1% 2%
Busia 1,384 1% 1%
Bomet 1,279 1% 0%
Nyamira 959 1% 0%
Lamu 697 0% 0%
Mombasa 689 0% 16%
Vihiga 607 0% 0%
Subtotal 11,993 9% 43%
Total 140,315 100% 100%
When we look at the access to paved roads per square kilometer of land area, Nairobi has the highest share with a
kilometer of paved road for every 0.5km2. The top 10 counties have a kilometer of paved roads for every 8 km2 of
land. This set of counties is allocated 55 percent of the capital budget. The bottom ten counties have a kilometer of
paved road for every 6,814 km2 against a national average of 146 km2. Despite the lower access to paved roads,
these counties were allocated only 10 percent of the capital budget. Based on this measure, counties with good
road access still receive a higher budgetary allocation compared to those with poor access, which does not appear
equitable.
TABLE 5. SECOND MEASURE OF NEED: KILOMETERS OF PAVED ROAD PER KM2 OF
LAND AREA
County Paved Roads (KMs)
Area in Square Km.
Land Area (km2) per Km of Paved Road
County share of Gross Capital expenditure
Top Ten Counties
Nairobi 1,279 695 1 23%
Mombasa 226 219 1 16%
Kiambu 333 2,543 8 2%

8
Vihiga 41 531 13 0%
Murang'a 172 2,559 15 5%
Kisumu 120 2,086 17 2%
Nyeri 169 3,337 20 5%
Nyamira 45 899 20 0%
Kericho 99 2,479 25 1%
Nakuru 276 7,495 27 1%
Subtotal 2,760 22,844 8 55%
Bottom Ten Counties
Kitui 23 30,497 1,331 1%
Narok 8 17,933 2,288 0%
Wajir 8 56,686 6,903 0%
Samburu 3 21,022 8,201 2%
Tana river 3 38,437 11,220 0%
Garissa 3 44,175 15,096 5%
Isiolo 2 25,336 15,562 0%
Lamu - 6,273 N/A 0%
Mandera - 25,992 N/A 1%
Marsabit - 70,961 N/A 0%
Subtotal 50 337,311 6,814 10%
Total 3,969 581,313 146 100%
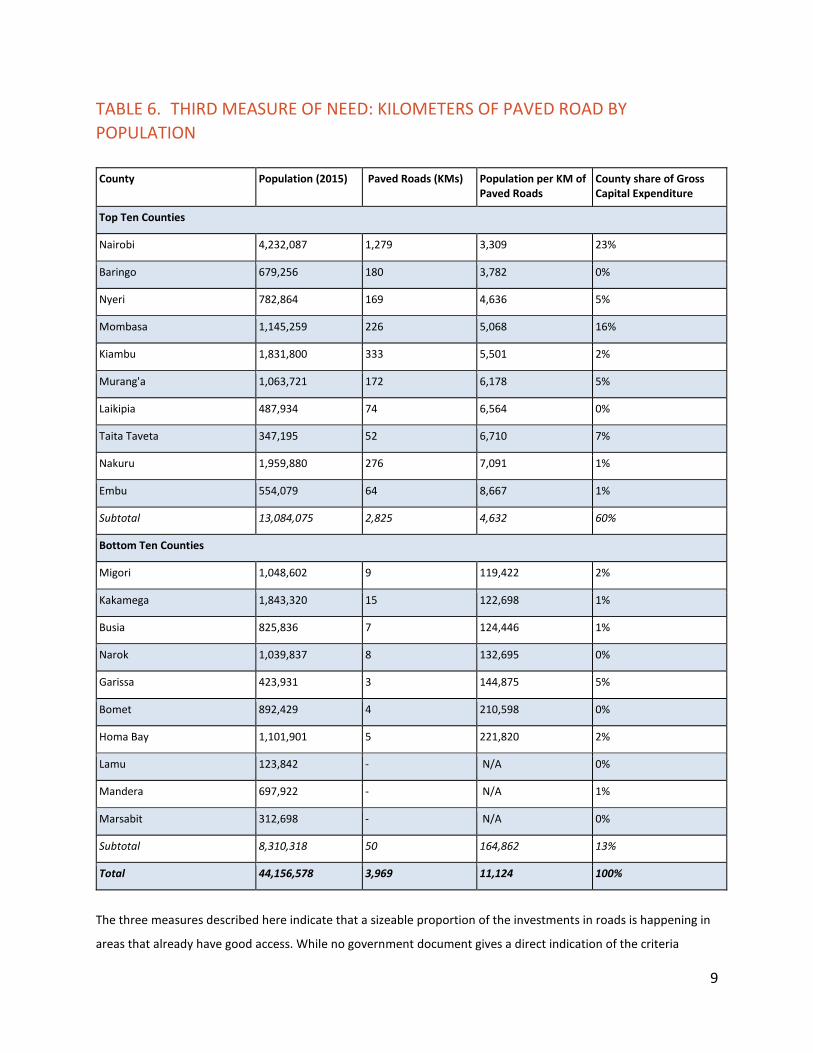
Turning to our third measures of need, the fewer the people using each kilometer of road, the better the access.
Based on this measure, Nairobi has better access to paved roads with 3,309 people per kilometer of paved road
while the bottom 10 counties have an average of 164,862 people per kilometer of paved road. The top 10 counties
which have an average of 4,632 people per km of paved roads were allocated 60 percent of the budget while the
10 counties whose population has the lowest access were allocated 13 percent of the budget.
9
TABLE 6. THIRD MEASURE OF NEED: KILOMETERS OF PAVED ROAD BY
POPULATION
County Population (2015) Paved Roads (KMs) Population per KM of Paved Roads
County share of Gross Capital Expenditure
Top Ten Counties
Nairobi 4,232,087 1,279 3,309 23%
Baringo 679,256 180 3,782 0%
Nyeri 782,864 169 4,636 5%
Mombasa 1,145,259 226 5,068 16%
Kiambu 1,831,800 333 5,501 2%
Murang'a 1,063,721 172 6,178 5%
Laikipia 487,934 74 6,564 0%
Taita Taveta 347,195 52 6,710 7%
Nakuru 1,959,880 276 7,091 1%
Embu 554,079 64 8,667 1%
Subtotal 13,084,075 2,825 4,632 60%
Bottom Ten Counties
Migori 1,048,602 9 119,422 2%
Kakamega 1,843,320 15 122,698 1%
Busia 825,836 7 124,446 1%
Narok 1,039,837 8 132,695 0%
Garissa 423,931 3 144,875 5%
Bomet 892,429 4 210,598 0%
Homa Bay 1,101,901 5 221,820 2%
Lamu 123,842 - N/A 0%
Mandera 697,922 - N/A 1%
Marsabit 312,698 - N/A 0%
Subtotal 8,310,318 50 164,862 13%
Total 44,156,578 3,969 11,124 100%
The three measures described here indicate that a sizeable proportion of the investments in roads is happening in
areas that already have good access. While no government document gives a direct indication of the criteria

10
applied when formulating the budget, better data and information in the budget would help clarify the reasons for
these distributional choices, such as whether they relate to economic objectives beyond distributional fairness.
REGIONAL CLASSIFICATION OF PROJECTS
We also look at the regional distribution of road projects, by grouping together all the county projects and the
broader regional projects into 14 regions (see Annex 1). Coast and Nairobi regions have the highest share of the
total allocations at 25 and 22 percent respectively. Central region is third.
We analyze access and allocation to roads based on the three measures used for county specific roads. As shown
in Figure 1, the Coast region had the highest allocation taking 25 percent of the total regional allocations. Nairobi
follows closely with 22 percent and Central region is third with 15 percent. Regions with the lowest allocations are
Upper Eastern (Isiolo and Marsabit), Lower Eastern (Machakos, Kitui and Makueni) and South Rift (Narok, Kajiado,
Kericho and Bomet).
Lower Eastern accounts for the largest share of unpaved roads at 15 percent, but the region was allocated only
two percent of the total capital budget under this category. On the other hand, Nairobi region had the second
highest allocation at 22 percent but has the lowest share of unpaved roads among the 14 regions. However, there
are seven cases where the shares are close for example, Central region, which has the third highest share of
unpaved roads (12 percent), also had the third highest allocation at 15 percent. This scenario, where the share of
unpaved roads relates closely to the share of allocations, is also seen in South Nyanza, Nyanza and Central Eastern.
FIGURE 1. FIRST MEASURES OF NEED: SHARE OF UNPAVED ROADS PER REGION
15%
12% 12%
10% 10%9%
7% 6%6%
5% 5%4%
1%2%
5%
15%
3%
25%
2%
5%7%
3%1%
5%4%
22%
0%
5%
10%
15%
20%
25%
30%
LowerEastern
NorthRift
Central CentralRift
Coast SouthRift
NorthEastern
CentralEastern
Western UpperEastern
Nyanza SouthNyanza
Nairobi
Regional Share of Unpaved Roads Share of Gross Expenditure by Region

11
On average, as we saw above, the country has a kilometer of paved for every 146km2. Nairobi has the best road
access with a kilometer for 0.5km2 of its land area. The Nairobi region has the best access to paved roads, yet it
was one of the top recipients in the budget, receiving 22 percent of the development budget under this category.
The Upper Eastern region, which is made up of Marsabit and Isiolo, has the lowest access of a kilometer of paved
road for an area of over 59,000km2 but was allocated just one percent of the total budget. The top three
allocations are to Coast, Nairobi, and Central regions whose average access is a kilometer of paved road for every
41km2 of land, far better than the national average; they received 62 percent of the budget. This does not seem
equitable.
TABLE 7. SECOND MEASURE OF NEED: KILOMETERS OF PAVED ROAD PER KM2 OF
LAND AREA
Region Paved Roads (KMs) Area in Square KM.
Share of Gross Expenditure by Region
Land per KM of Paved Roads
Nairobi 1,279 695 22% 1
Central 720 13,164 15% 18
Nyanza 138 7,800 5% 57
South Nyanza 68 4,813 4% 71
Central Eastern 159 12,393 7% 78
Western 80 8,309 3% 104
Central Rift 353 37,979 3% 107
North Rift 483 100,620 5% 208
Coast 357 82,893 25% 232
Lower Eastern 185 44,714 2% 242
South Rift 135 44,784 2% 332
North Eastern 11 126,852 5% 11,389
Upper Eastern 2 96,297 1% 59,146
Total 3,969 581,313 100% 146
TABLE 8. MEASURE OF NEED: KILOMETERS OF PAVED ROAD BY POPULATION
Region Paved Roads (KMs) Population (2015) Population per KM of Road
Share of Gross Expenditure by Region
Nairobi 1,279 4,232,087 3,309 22%
Central 720 4,947,415 6,867 15%
Central Rift 353 2,721,618 7,703 3%
Coast 357 4,054,921 11,369 25%
North Rift 483 5,818,280 12,048 5%
12
Central Eastern 159 2,402,023 15,131 7%
Lower Eastern 185 3,215,112 17,398 2%
Nyanza 138 3,172,663 23,032 5%
South Rift 135 3,692,030 27,375 2%
South Nyanza 68 3,049,988 44,771 4%
Western 80 4,811,630 60,149 3%
North Eastern 11 1,572,238 141,164 5%
Upper Eastern 2 466,573 286,572 1%
Total 3,969 44,156,578 315 100%
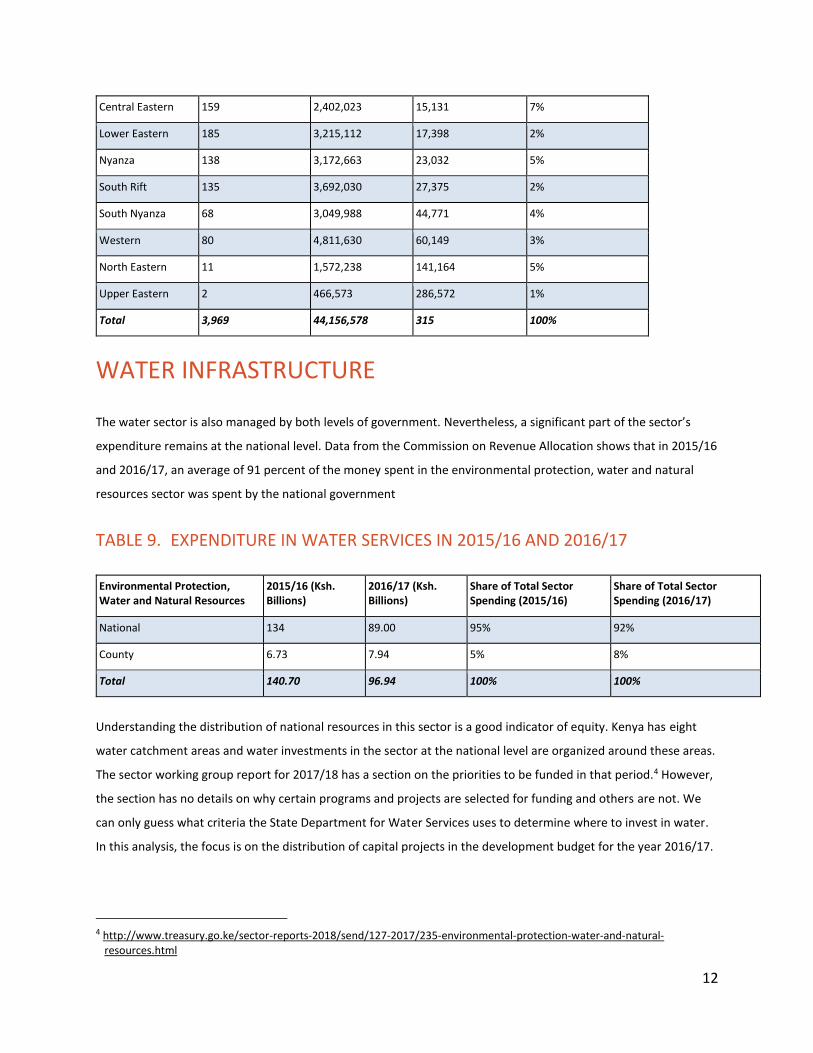
WATER INFRASTRUCTURE
The water sector is also managed by both levels of government. Nevertheless, a significant part of the sector’s
expenditure remains at the national level. Data from the Commission on Revenue Allocation shows that in 2015/16
and 2016/17, an average of 91 percent of the money spent in the environmental protection, water and natural
resources sector was spent by the national government
TABLE 9. EXPENDITURE IN WATER SERVICES IN 2015/16 AND 2016/17
Environmental Protection, Water and Natural Resources
2015/16 (Ksh. Billions)
2016/17 (Ksh. Billions)
Share of Total Sector Spending (2015/16)
Share of Total Sector Spending (2016/17)
National 134 89.00 95% 92%
County 6.73 7.94 5% 8%
Total 140.70 96.94 100% 100%
Understanding the distribution of national resources in this sector is a good indicator of equity. Kenya has eight
water catchment areas and water investments in the sector at the national level are organized around these areas.
The sector working group report for 2017/18 has a section on the priorities to be funded in that period.4 However,
the section has no details on why certain programs and projects are selected for funding and others are not. We
can only guess what criteria the State Department for Water Services uses to determine where to invest in water.
In this analysis, the focus is on the distribution of capital projects in the development budget for the year 2016/17.
4 http://www.treasury.go.ke/sector-reports-2018/send/127-2017/235-environmental-protection-water-and-natural-
resources.html
13
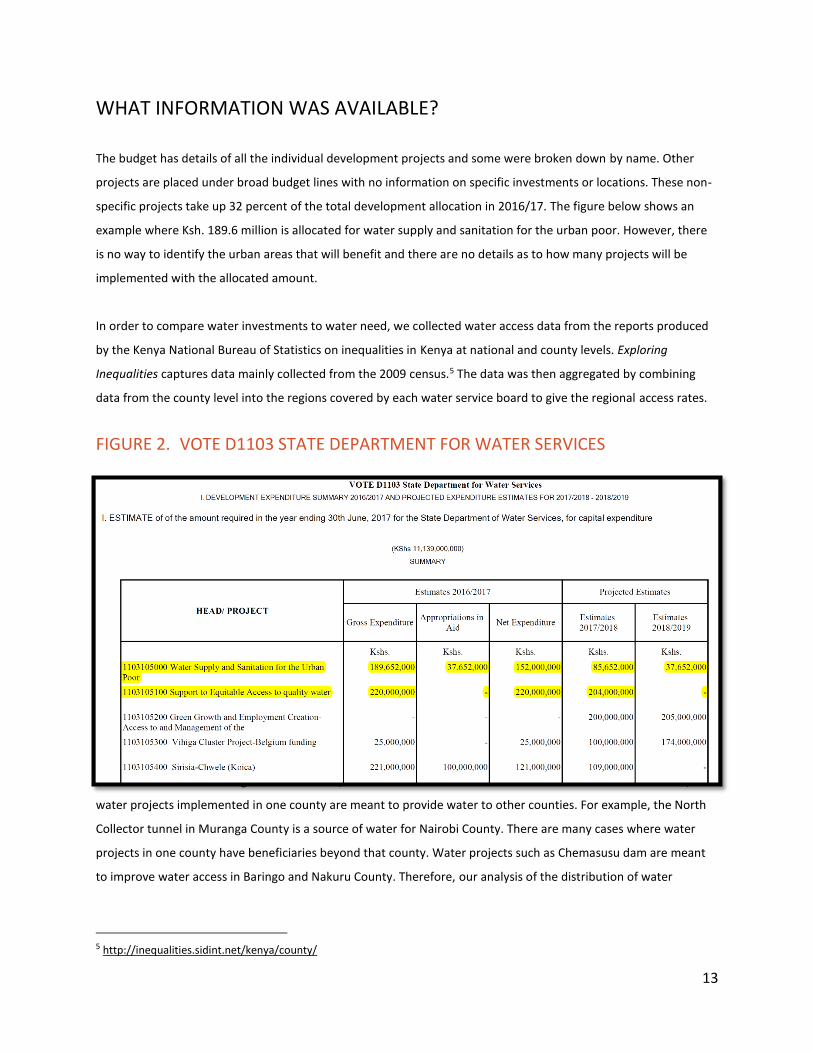
WHAT INFORMATION WAS AVAILABLE?
The budget has details of all the individual development projects and some were broken down by name. Other
projects are placed under broad budget lines with no information on specific investments or locations. These non-
specific projects take up 32 percent of the total development allocation in 2016/17. The figure below shows an
example where Ksh. 189.6 million is allocated for water supply and sanitation for the urban poor. However, there
is no way to identify the urban areas that will benefit and there are no details as to how many projects will be
implemented with the allocated amount.
In order to compare water investments to water need, we collected water access data from the reports produced
by the Kenya National Bureau of Statistics on inequalities in Kenya at national and county levels. Exploring
Inequalities captures data mainly collected from the 2009 census.5 The data was then aggregated by combining
data from the county level into the regions covered by each water service board to give the regional access rates.
FIGURE 2. VOTE D1103 STATE DEPARTMENT FOR WATER SERVICES
DISTRIBUTION OF WATER PROJECTS
While all counties have a right to clean water, not all counties have their own sources of water. In some cases,
water projects implemented in one county are meant to provide water to other counties. For example, the North
Collector tunnel in Muranga County is a source of water for Nairobi County. There are many cases where water
projects in one county have beneficiaries beyond that county. Water projects such as Chemasusu dam are meant
to improve water access in Baringo and Nakuru County. Therefore, our analysis of the distribution of water
5 http://inequalities.sidint.net/kenya/county/

14
projects focuses on the investments made by the national government at the water service board level rather than
those made at the county level.
A sizeable portion of the budget under the State Department of Water is spent through the Water Service Boards
(WSB). The boards are responsible for implementation of water infrastructure between the water source and the
distributors (water companies). Therefore, at the department level, the revenue allocation is to the eight water
boards. The question then becomes: does the distribution of resources in the sector consider the access levels in
the areas under each board? Is it equitable? Because the funds are directly transferred from the department to the
boards, the discussion of equity must focus on the spending of each WSB in the counties they cover.
About 47 percent of Kenyans do not have access to improved sources of water (22.6 million people as of 2015).
The largest share, 24 percent, of those without access are in the eight counties under the Lake Victoria South
Water Service Board region.6 The Rift Valley Water Service Board region follows with 18 percent. Both regions have
smaller proportions of the country’s population at 18 and 15 percent respectively. Athi Water Service Board, which
serves Nairobi and Kiambu counties, has the smallest share of the country’s population without access to good
water at six percent. The region’s share of the country’s population is much higher at 14 percent. The access level
in Athi Water Service Board is three times better than in Lake Victoria South Water Service Board.
FIGURE 3. WATER ACCESS AND REVENUE DISTRIBUTION PER WATER SERVICE
BOARD
6 These counties are Bomet, Homa Bay, Kericho, Kisumu, Nyamira, Migori, Kisii and Siaya.
18%
15%
18%
9%
11%
6%
9%
14%
24%
18%
14%
12%
11%
8%
7%
6%
7%
51%
2%
4%
3%
2%
0%
32%
0% 10% 20% 30% 40% 50% 60%
Lake Victoria South Water Services Board
Rift Valley Water Services Board
Lake Victoria North Water Services Board
TANATHI Water Services Board
Tana Water Services Board
Northern Water Services Board
Coast Water Services Board
Athi Water Service Board
Share of the Total Allocation Per WSB
Share of People without Access to Improved Water Sources
Region Share of the Total Population
15
Based on the allocations in the 2016/17 development budget where the projects can be geo-located, 83 percent of
the budget was allocated to two regions: Rift Valley Water Service Board and Athi Water Service Board. Lake
Victoria South has the highest proportion of people without good access to water (24 percent of the population),
but has only seven percent of the allocation. Itare Dam in Nakuru accounts for 81 percent of the budget allocated
to the Rift Valley Water Service Board.
When the need for water is compared to the share of the investment in infrastructure under the water ministry,
the area with the best access to water, Athi River region, is still getting the second highest allocation. This raises
the question on whether the distribution of funds considers access gaps that already exist among the regions.
Though the high allocation to the Rift Valley board may be equitable, it does not seem fair to allocate 51 percent of
the budget to it while other regions with low access have below 5 percent of the share. This analysis does not
include allocations that were not made to specific geographical areas and thus it is possible that additional
information on these distributions could change the picture illustrated by Table 7.
CONCLUSION
The National Treasury’s presentation of the development budget in 2016/17 is a positive step toward greater
budget transparency. It eases the ability of the public to see how government investment is distributed around the
country and to question that distribution. This opens a new front in discussing equity in the national budget
beyond funds such as the County Development Fund (CDF). Still, there is a need for more information to better
help the public understand the basis for distributions, and to what extent equity has been considered. This
information is also critical for Members of both houses of Parliament who play a role in overseeing allocations and
monitoring implementation. There is insufficient data in the budget for MPs or citizens interested in monitoring
projects to do so. There is no information on the distribution of many projects, nor do we have information on
which projects are ongoing and what the multi-year investment plan for these projects entails. In addition, the
data available on access to water and roads is either outdated (water data is from 2009) or not disaggregated
(roads) and making it more challenging to evaluate whether government spending is equitable.
ANNEX 1. REGIONAL DIVISIONS: ROADS
Coast Central Rift
Mombasa Samburu
Kwale Laikipia
Kilifi Nakuru
Tana River South Rift

16
Lamu Narok
Taita/Taveta Kajiado
North Eastern Kericho
Garissa Bomet
Wajir Western
Mandera Kakamega
Upper Eastern Vihiga
Marsabit Bungoma
Isiolo Busia
Central Eastern Nyanza
Meru Siaya
Tharaka - Nithi Kisumu
Embu Homa Bay
Lower Eastern South Nyanza
Kitui Migori
Makueni Kisii
Machakos Nyamira
Central Nairobi
Nyandarua Nairobi City
Nyeri
Kirinyaga
Murang'a
Kiambu
North Rift
Turkana
West Pokot
Trans Nzoia
Uasin Gishu
Elgeyo/Marakwet
Nandi
Baringo

17
ANNEX 2. REGIONAL DIVISIONS: WATER
Athi Water Service Board Northern Water Services Board
Nairobi Samburu
Kiambu Laikipia
Coast Water Services Board Marsabit
Mombasa Isiolo
Kwale Garissa
Kilifi Wajir
Tana River Mandera
Lamu Lake Victoria South Water Services Board
Taita-Taveta Kericho
Tana Water Services Board Bomet
Nyeri Siaya
Kirinyaga Kisumu
Muranga Homa Bay
Tharaka Nithi Nyamira
Embu Kisii
Meru Migori
Lake Victoria North Water Services Board Rift Valley Water Services Board
Kakamega Narok
Vihiga Elgeyo-Marakwet
Bungoma Baringo
Busia Nakuru
Trans-Nzoia Turkana
Uasin-Gishu West Pokot
Nandi Nyandarua
TANATHI Water Services Board
Kitui
Makueni
Machakos
Kajiado