kenya national aids spending...
TRANSCRIPT

KENYA NATIONAL AIDS SPENDING ASSESSMENT REPORT FOR THE FINANCIAL YEARS
2009/10-2011/12
FINAL REPORT
AUGUST 2014

ii
TABLE OF CONTENTSLIST OF TABLES .......................................................................................... iv
LIST OF FIGURES ................................................................................................................................... vi
ACKNOWLEDGEMENTS ...................................................................................................................... xi
PREFACE.................................................................................................................................................. xii
EXECUTIVE SUMMARY ..................................................................................................................... xiii
CHAPTER ONE: INTRODUCTION AND BACKGROUND ............................................................... 1
1.1 Background ...................................................................................................................... 1
1.2 Country Socio-Economic Indicators ................................................................................ 2
CHAPTER TWO: STUDY DESIGN AND METHODOLOGY .......................................................... 16
2.1 NASA Concepts ............................................................................................................. 16
2.2 The NASA Classifications ............................................................................................. 17
2.3 Scope of the Assessment ................................................................................................ 18
2.4 Sampling......................................................................................................................... 18
2.5 Data Collection ............................................................................................................... 20
2.6.1. Estimation of Indirect Government Expenditure ................................................................ 21
2.6.2. Out-of-Pocket Spending on HIV/AIDS by Households ....................................................... 26
2.6.3. Estimating Private Corporate Sector HIV Spending .......................................................... 28
2.6.4. Disaggregation of USG Expenditure for 2010 and 2011 .................................................... 28
2.6.5. Estimation of Expenditure by County ................................................................................. 29
2.6.6. Data Entry into Excel Processing Files and into Resource Tracking Tool (RTT) .............. 29
2.6.7. Limitations .......................................................................................................................... 30
CHAPTER THREE: RESULTS AND DISCUSSION .......................................................................... 31
3.1 Total Expenditure on HIV/AIDS by Sources of Funding .............................................. 31
3.2 HIV/AIDS Expenditure by AIDS Spending Categories and Financing Sources ........... 34
3.3 HIV and AIDS Expenditure Breakdown by Financing Sources and Financing Agents 39
3.4 Providers of HIV and AIDS Services ............................................................................ 42
3.5 Spending on Prevention Activities ................................................................................. 47
3.6 Spending on Care and Treatment ................................................................................... 49
3.7 Spending on Orphans and Vulnerable Children (OVC)................................................. 50
3.8 Spending on Programme Management and Administration .......................................... 51

iii
3.9 Spending on Other ASC ................................................................................................. 53
3.10 HIV/AIDS Expenditures by Beneficiary Groups ........................................................... 53
3.11 HIV/AIDS Expenditures by Production Factors ............................................................ 56
3.12 Expenditure by County................................................................................................... 57
3.14 Comparison with Kenya NASA 2006/07 and 2007/08 .................................................. 62
3.15 Comparison of NASA Results and KNASP III Cost Estimates .................................... 63
3.16 Institutionalization of NASA ......................................................................................... 65
CHAPTER FOUR ..................................................................................................................................... 67
SUMMARY, CONCLUSIONS AND RECOMMENDATIONS .......................................................... 67
4.1 Summary and Conclusions ............................................................................................. 67
4.2 Key recommendations .................................................................................................... 68
REFERENCES .......................................................................................................................................... 71

iv
LIST OF TABLES
Table 2.1: Sampled counties ..................................................................................................................... 20
Table 2.2: Expenditure per outpatient visit for ART and general OP services .................................. 22
Table 2.3: Estimated indirect Government expenditure on ART and OP services ............................ 23
Table 2.4: Indirect contribution by government on non-ART care ..................................................... 24
Table 2.5: Indirect contribution by government on PMTCT prophylaxis .......................................... 24
Table 2.6: Indirect contribution by government on PMTCT infant/ child follow-up ........................ 25
Table 2.7: Indirect contribution by government on HTC services ....................................................... 25
Table 2.8: Total indirect Government contribution .............................................................................. 26
Table 2.9: Estimated OOPE ..................................................................................................................... 27
Table 3.1: Spending on HIV and AIDS interventions by major source categories ............................ 32
Table 3.2: Actual spending on HIV and AIDS by domestic and external Sources of Funds ............ 32
Table 3.3: Total expenditure by major source categories and ASC, 2009/10-2011/12 ...................... 34
Table 3.4: Total expenditure by major source categories and ASC, 2009/10-2011/12 ...................... 35
Table 3.5: Total expenditure by sources and ASC, 2009/10-2011/12 (Kshs millions) ........................ 35
Table 3.6: Total expenditure by source and ASC, 2009/10-2011/12 (US$ millions) ........................... 36
Table 3.7: Percentage expenditure on ASC by financing sources ........................................................ 36
Table 3.8: Total HIV/AIDS expenditure breakdown by financing agent (Kshs) ................................ 40
Table 3.9: Total expenditure HIV/AIDS expenditure breakdown by financing agent (US$) ............ 41
Table 3.10: Summary expenditure by providers of services ................................................................. 43
Table 3.11: Absolute and percentage expenditure within public sector 2009/10-2011/12 .................. 45
Table 3.12: Absolute and percentage expenditure within private sector 2009/10-2011/12 ................ 46
Table 3.13: Expenditure by service providers and agents 2009/10 – 2011/12 ..................................... 46
Table 3.14: Expenditure on prevention by service providers 2009/10 – 2011/12 ................................ 48
Table 3.15: Care and treatment expenditure by spending category, 2009/10-2011/12 ....................... 49
Table 3.16: OVC expenditure 2009/10-2011/12 ...................................................................................... 50

v
Table 3.17: Expenditure on management and administration ............................................................. 51
Table 3.18: Expenditure on other ASC 2009/10 -2011/12 ..................................................................... 53
Table 3.19: AIDS spending by beneficiary population 2009/10 – 2011/12 ........................................... 55
Table 3.20: Expenditure by factors of production 2009/10 – 2011/12 .................................................. 56
Table 3.21: Distribution of expenditure by county (Kshs million) ....................................................... 58
Table 3.22: Shares on interventions in actual expenditure and cost estimates (2009/10-2011/12) .... 65

vi
LIST OF FIGURES
Figure1.1: HIV prevalence among persons aged 15-64 years by region, KAIS 2007 and 2012 ........... 3
Figure 3.1: Percentage share of total actual HIV and AIDS spending by source of finance (2009/10-
2011/12) ...................................................................................................................................................... 33
Figure 3.2: Percentage share of spending on ASC within financing sources 2009/10-2011/12 ......... 37
Figure 3.3: Percentage share of HIV/AIDS spending on key intervention areas 2009/10-2011/12 ... 39
Figure 3.4: Percentage share of HIV/AIDS spending by main agents categories 2009/10-2011/12 ... 40
Figure 3.5: Percentages of expenditure by service providers................................................................ 44
Figure 3.6: Percent of expenditure by public sector providers according to financing agents .......... 47
Figure 3.7: Percent of expenditure on OVC ........................................................................................... 51
Figure 3.8: Percent of expenditure on programme management and administration ....................... 52
Figure 3.9: Expenditure results by the main beneficiary population ................................................... 54
Figure 3.10: Relatioship between expenditure and number of HIV+ persons in counties ................. 60
Figure 3.11: Trend in KNASP III costs estimates and NASA (Kshs) .................................................. 64
Figure 3.12: Trend in KNASP III costs estimates and NASA (US$) .................................................... 64

vii
LIST OF ACRONYMS AND ABBREVIATIONS
AIDS Acquired Immune Deficiency Syndrome
ANC Antenatal Clinic
ART Antiretroviral Therapy
ARV Antiretroviral
ARVs Antiretroviral Drugs
ASC AIDS Spending Category
BAS Basic Accounting System
BCC Behaviour Change Communication
BP Beneficiary Population
CBO Community-Based Organisation
CDC (US) Centers for Disease Control and Prevention
CSO Civil Society Organisation
DfID Department for International Development (UK)
ENE Estimates of National Expenditure
ES Equitable Share
FA Financing Agent
FBO Faith-Based Organisation
FS Financing Source
GFATM Global Fund for AIDS, Tuberculosis and Malaria

viii
HCT HIV Counselling and Testing
HDI Human Development Index
HDR Human Development Report
HIV Human Immunodeficiency Virus
HTA High Transmission Area
IDU Intravenous Drug User
IEC Information, Education and Communication
IGA Income Generation Activities
LSA Local Service Area
M&E Monitoring and Evaluation
MARP Most-at-Risk Population
MOT Modes of Transmission
MSM Men who have Sex with Men
MTCT Mother-to-Child Transmission
MTEF Medium-Term Expenditure Framework
MTP Medium-Term Plan (of Vision 2030)
NACC (Kenya) National AIDS Control Council
NASA National AIDS Spending Assessment
NDPs National Development Plans
n.e.c. not elsewhere classified
NGO Non-Governmental Organisation

ix
NASP National AIDS Strategic Plan
OECD Organisation for Economic Co-operation and Development
OIs Opportunistic Infections
OOPE Out-of-Pocket Expenditure
OOP Out-of-Pocket
OPEP Occupational Post-Exposure Prophylaxis
OTC Over-The-Counter (medications purchased without a prescription)
OVC Orphans and Vulnerable Children
PEP Post-Exposure Prophylaxis
PEPFAR (US) President’s Emergency Plan for AIDS Relief
PF Production Factor
PITC Provider-Initiated Testing
PLWHA People Living with HIV and AIDS
PMTCT Prevention of Mother-to-Child Transmission
PPP Public-Private Partnerships
RTS Resource Tracking System
SES Socio-Economic Status
STD Sexually Transmitted Disease
STI Sexually Transmitted Infection
SW Sex Worker
TB Tuberculosis

x
UK United Kingdom
UN United Nations
UNAIDS Joint United Nations Programme on AIDS
UNGASS United Nations General Assembly on HIV/AIDS
USA United States of America
USAID United States Agency for International Development
US$ United States Dollars
VCT Voluntary Counselling and Testing
WB World Bank
WHO World Health Organization

xi
ACKNOWLEDGEMENTS
The Kenya National AIDS Spending Assessment (KNASA) was commissioned by the National AIDS
Control Council (NACC), MOH in partnership with UNAIDS (Kenya). The study was funded through the
UNAIDS Technical Assistance Fund, managed by the TSF. I wish to thank the NACC Team led by Ms.
Regina Ombam (Head Strategy & Development) for overall guidance and steering of the the KNASA
survey and, Peter Kinuthia (Economist, Financing Strategy) who worked closely with the local KNASA
Team in organising survey logistics. Special thanks goes to Charles Birungi (UNAIDS, Kenya) for
providing the technical support at each stage of the project. The project would not have been possible
without their contribution.
We also acknowledge the guidance and support given by the members of the Steering Committee (SC) of
the KNASA project, which greatly helped us to expedite this survey.
The NACC would like to thank the various organizations that provided HIV and AIDS financial data,
these organizations comprised public and private sectors, NGOs, Faith Based organizations and the civil
society, bilateral and multilateral agencies and UN agencies. Special thanks go to all the Research
Assistants who collected data from the regions sampled. It is not possible to mention every individual or
organization by name, everybody who assisted in this survey in one way or another is highly appreciated.
Finally, I would like to thank the Consultant namely, Centre for Economic and Social Research (CESR)
for conducting the KNASA survey. The survey report will guide the drafting of the Kenya National AIDS
Strategic Plan (KNASP IV) 2014/15–2017/18. It is my hope that this report will assist in planning and
budgeting for the national response to HIV and AIDS at both national and county governments.
The NACC in partnership with stakeholders will endeavour to institutionalize the NASA process so that
reporting expenditures on HIV and AI|DS becomes routine. This will go a long way in assessing whether
the prioritized HIV and AIDS interventions are being implemented, shed light on beneficiary
population(s) and document costs of interventions being implemented.
Dr. Nduku Kilonzo
DIRECTOR

xii
PREFACE
The Government of Kenya its development partners remain at the forefront in the efforts to move towards
universal access to HIV prevention, treatment, care and support in Kenya. Annual HIV incidence is
estimated at 91,000 new infections in adults and 13,000 paediatric due to vertical transmission.
The high burden of HIV and AIDS in Kenya accounts for an estimated 29% of annual adult
deaths, 20% of maternal mortality and 15% of deaths of children under five years old. The
epidemic has also negatively affected the country’s economy by lowering per capita output by an
estimated 4.1%. Stable and married couples are the most affected as this group accounts for 44%
of the new adult infections.
A prioritized response to the national response is informed by an evidence-based understanding
of where effective services are needed most urgently. Thus, a comprehensive, scaled-up HIV
prevention response is needed to avert more new infections from occurring. The Kenya National AIDS
Spending Assessment (KNASA) is aimed at assisting the National AIDS Control Council in the Ministry
of Health to monitor these scarce resources for HIV and AIDS, taking into account not just the health
components, but also education, social protection services, and others, in order to evaluate and quantify
the multisectoral approach of the national AIDS response.
NASA will help to identify funding gaps and duplication of funding in the national response to HIV
epidemic. Unless new infections can be prevented, future treatment costs will continue to mount.
Similarly, access to treatment is critical in order to avert productivity losses and alleviate the epidemic’s
impact on the economy and human development. Given the many challenges that need to be overcome in
providing HIV services, high levels of funding will be needed to move towards universal access in the
coming years. It is therefore imperative to have a clear knowledge of what is being spent on HIV and
AIDS, in order to ascertain if the expenditures are targeted to the most cost-effective interventions.
Knowledge of the total actual expenditure for the national response promotes greater transparency and
accountability to the public and to donors.
In 2013, the Government of Kenya through the National AIDS Control Council (NACC) in the Ministry
of Health committed itself to undertaking a comprehensive National AIDS Spending Assessment of
public, international and private HIV-related expenditure.. This report provides expenditure estimates of
overall HIV spending in the country for the years 2009/10–2011/12, and will be of much value to the
National AIDS Control Council (NACC) in the Ministry of Health h (MOH), as well as the stakeholders
who are interested in understanding the financial flows of the national AIDS response.

xiii
EXECUTIVE SUMMARY
Purpose
The National AIDS Control Council (NACC) commissioned National AIDS Spending
Assessment (NASA) in September 2013. The purpose of the assessment was to establish the
level of the resources used in the fight against HIV and AIDS epidemic in three fiscal years
2009/10, 2010/11, and 2011/12. The assessment characterized the flow of funds from their origin
down to the end point of service delivery, among the different institutions dedicated in the fight
against the epidemic. The outputs from this exercise informed the costing of the new Kenya
National AIDS Strategic Plan IV (KNASP IV). The results also provided inputs in the
investment case for the country.
Methodology
The NASA focused on tracking actual HIV and AIDS expenditure from public, international
(bilateral and multilateral) and private sources. Specifically, major financing sources supporting
HIV and AIDS were included in the study, consisting of Clinton Foundation; United Kingdom
Agency for International Development (UKAID) formerly Department for International
Development (DfID); Joint United Nations Programme on AIDS, United States Government
(USG- President’s Emergency Plan for AIDS Relief (PEPFAR); GFATM; and Government of
Kenya.
In addition to the financing sources, a representative sample of financing agents was selected
purposively including United Nations Joint Programme on HIV and AIDS consisting of
UNAIDS secretariat, WHO, UNHCR, UNICEF, WFP, (UNFPA), UNODC, ILO, UNESCO,
AMREF, Red Cross, Care International, Population Service International (PSI), National
Treasury (Ministry of Finance) . Main agents of the PEPFAR were not surveyed since the data
on expenditure by USG was provided directly from the source. However, the expenditure by
agents was not provided. NACC was also surveyed.
All the government ministries and NGOs providers (362) were surveyed to provide data on HIV
and AIDS spending.
The initial data collection focused on the sources of funding for HIV and AIDS and financing
agents. This stage was estimated to last for two weeks but lasted for one and half months. Data
collection from UN Agencies took long time, lasting up to January 2014. This notwithstanding,
only four UN agencies provided the data. Data on PEPFAR expenditure was sought directly.
The PEPFAR expenditure analysis for 2012 was provided. However, PEPFAR country budgets
figures for the years 2010 and 2011 were used to estimate the level of expenditure by USG. In
the analysis, the entire budget figures for 2010 and 2011 were used.
Data collection from county level took period of 4 weeks in September 2013, focusing on service
providers. Data collected included expenditure on AIDS spending categories and factors of
production.

xiv
Data analysis consisted of was carried out in a number of steps consisting of estimation of
indirect expenditure by government, estimation of out-of pocket expenditure, disaggregation of
USG expenditure for 2010 and 2011, entry of the all into Excel processing files, and entry into
resource tracking tool (RTT).
Results
The results of the analysis The results show that total expenditure on HIV and AIDS
interventions in Kenya increased from Kshs 64,338 million (US$ 826 million) in 2009/10 to
Kshs 70,388 million (US$ 853 million) in 2010/11, representing an increase of 9% from the
2010/11 expenditure estimates. In 2011/12, the expenditure declined slightly to Kshs 69,750
million (US$ 786 million) due a slight decline in USG and CHAI funding. The total expenditure
over the three-year period amounted to Kshs 204,476 million (US$ 2,466 million). The results
indicated that the bulk of the expenditures on HIV/AIDS in Kenya came from international
sources accounting for about 62% during the period. Government of Kenya is the second largest
source of financing of the HIV response contributing about 16%. Households, through the out-
pocket expenditure, accounted for about 13% of the total expenditure same period. International
not-for-profit organisations and foundations, private sector, GFATM, UN agencies and
accounted for 4%, 1.9%, 1.7% and less than 1% respectively of the total spending over the three
year period. It is therefore evident that the majority of financing for activities and programmes
related to HIV and AIDS is accounted for by external sources.
International purchasing organization as agents accounted for over 56% of funds. The public
sector agents accounted for between 25% and 27% while local private organizations managed
between 16% and 19% of the total funds. Specifically, international not-for-profit organizations
managed the largest share (between 49% and 53%), followed and Ministry of Health (between 16%
and18%) and households (about 13%). The share of funding managed by the National AIDS
Commission accounted for 3% over the three years under consideration.
The public sector remained the largest service provider, accounting for about 50% of the total
expenditure. Private sector providers took the second largest share (about 28%) of the
expenditure. Bilateral and multilateral agencies spent 7% of the total amount in each of the years.
In terms of the priority interventions, the bulk of the expenditure went to care and treatment
(54%), followed by prevention (20%) and programme management and administration (12%)
and OVC (6%).
People Living with HIV/AIDS (PLWHA) accounted for about 54% of the expenditures as a
beneficiary population. Non-target intervention was the second largest (15%) beneficiary
population followed by general population (11%). The percentage to most at risk population was
very low at 0.22%. Recurrent expenditure took about 96% with capital expenditure accounting
for about 4% of the total expenditure. Overall, labour income accounted for the largest
percentage (20%), followed by drugs and pharmaceuticals (15%), and ARVs (13%).

xv
Conclusion
External resources continue to dominate HIV/AIDS financing in Kenya. The fact that
development partners’ account for a lion share should be a major concern to the country as this
raises issues of sustainability. However, government contribution has been increasing over time
though most of it is indirect.
Recommendations
(a) Allocative Decisions for Greatest Investment
The NASA results show that generally the impact interventions consisting of behaviour change
activities, ART, PMTCT, and male circumcision received significant funding in the period under
consideration. However, other high impact interventions such as prevention activities on MARPs
and prevention through treatment for discordant couples received less attention in terms of the
expenditure. Furthermore, low impact intervention such as VCT received significant resources. It
is recommended that the country should target resources towards high impact interventions that
which maximize benefits.
(b) Sustainable, Transparent, Accountable and Aligned Funding
As indicated in analysis, bulk of the spending on HIV response was attributed to external
sources. However, contribution by government has been increasing over the years. It is
recommended that government should continue to increase its contribution of improve
sustainability. Although NACC has undertaken analysis possible sustainable options for
financing the response, there need to actualize some of these options for sustainability purposes.
Although country comparisons were not done, there is a strong need to consider the cost-
effective of funds from different sources. Additionally, the funding from all the sources should
be aligned to priority areas. All these would require transparency and accountability of all those
involved in the flow of funds
(c) Improving Financial Management Capacity and Systems
The results of qualitative analysis revealed that financial management capacities of the
organizations involved in service delivery at the local level were very low. This is constraint in
service delivery which may seriously reduce the impact of the interventions. It also affects
efficiency in service delivery.
(d) Institutionalising Routine Expenditure Tracking
It was recommended in the previous NASA, institutionalization of NASA is critical. This is
because data availability routine would assist the country to assess the performance of the
response on regular basis. This is also a key component in monitoring whether funding is
aligned to the priority interventions and if not aligned corrective measures can be put in place.
xvi
Institutionalization is also needed given the creation of counties in which social services have
been devolved. Each county will need to carry its own NASA and there it will be cost effective
to build their capacities to enable to collect data expenditure routinely for policy decisions.
(e) Additional Research
Expenditure on research was minimal and came from bilateral sources. It is recommended that
more funding be provided for HIV related research.

CHAPTER ONE: INTRODUCTION AND BACKGROUND
1.1 Background
In accordance with the Declaration of Commitment on HIV/AIDS the UN member countries
submit reports on progress achieved in the response to the epidemic. One of the key indicators
included in the reports on the implementation of the Declaration of Commitment at the national
level is the assessment of the amount of national funds allocated by the government to address
HIV/AIDS, indicator No. 1. In Kenya, the motivation of undertaking the National AIDS
Spending Assessment (NASA) is to improve financial monitoring of HIV and AIDS programmes
and activities and to better understand the spending patterns for HIV related activities. In
addition, analysis of the sources, financing agents, providers and overall financial flows of
funding is important in informing policy makers and planners on how to improve allocation of
financial resources for HIV and AIDS. Furthermore, tracking expenditures for the response to
the AIDS epidemic is a prerequisite for an effective and rational allocation of domestic and
international funding towards those interventions that will have an optimal impact. Thus, as the
country devolves service delivery to the counties, accurate data on HIV and AIDS resource flows
and expenditures will be required for to guide the national response both at national and county
levels.
In light of the above context and building on the previous National AIDS Spending Assessment
(NASA) conducted in 2009, the National AIDS Control Council (NACC) with support from
UNAIDS and other stakeholders commissioned this NASA whose findings will go a long way in
informing KNASP IV development.

2
1.2 Country Socio-Economic Indicators
Basic information about the country
Population size (millions) (2010) 40.5
Population density (number of people per square kilometer) (2010) 71
Proportion (%) of people living below the poverty line (2010) 46%
Proportion (%) of total population living in urban areas (2010) 23.6%
Proportion (%) of urban residents living in slum settlements (2007) 55%
Total Fertility Rate (average number of children borne per woman) (2008) 4.7
Annual population growth rate (%) (2011) 4.6
Urban population growth rate (avg. annual %) 2005-2010 4.0
Rural population growth rate (avg. annual %) 2005-2010 2.3
Urban population (%) 2007 21.3
Population aged 0-14 years (%)2009 42.8
Population aged 60+ years (women and men, % of total) 2009 4.4/3.8
Life expectancy at birth (women and men, years) 2005-2010 54.5/53.7
Education: Government expenditure (% of GDP) 2005-2008 7.0
Education: Primary-secondary gross enrolment ratio (w/m per 100) 2005-2008 85.0/88.7
Economic Indicators
GDP growth (2013) 4.6
Per capita Gross National Income (2011) $820
Distribution of poverty
Central province 30.3%
Nyanza 47.9%
Rift Valley 49.7%
Eastern 51.1%
Western 53.2%
Coast 69.7%
North Eastern Province 74.0%
3
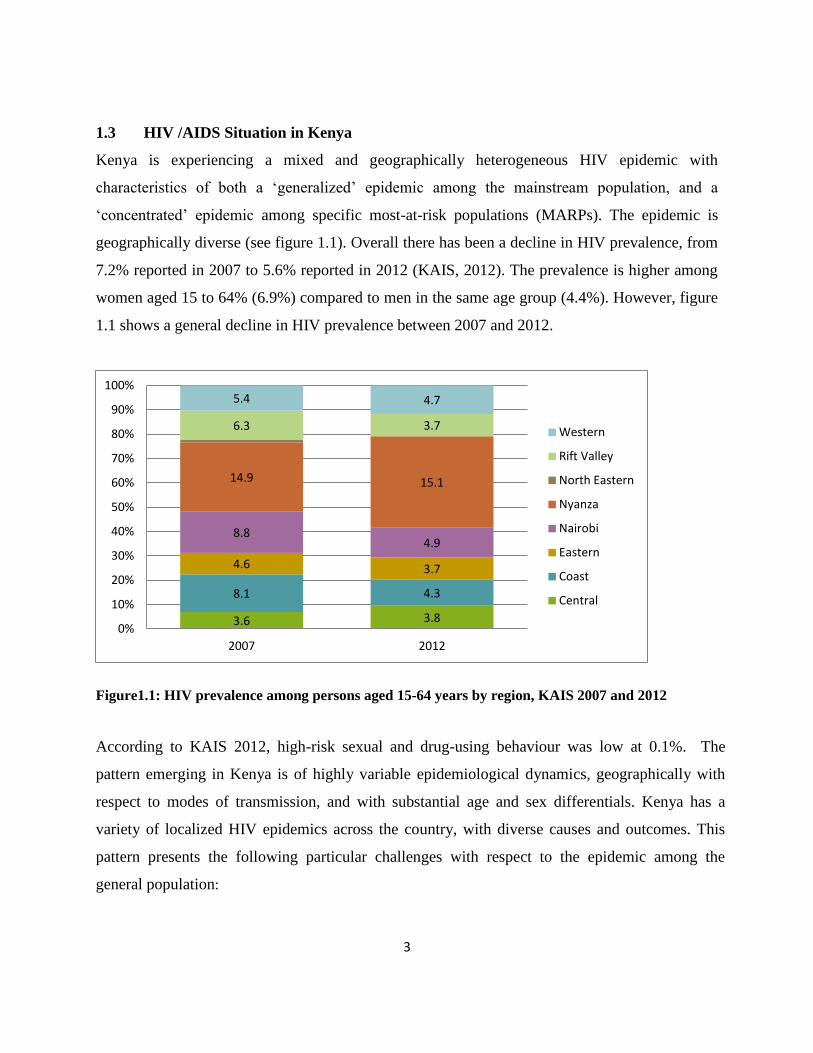
1.3 HIV /AIDS Situation in Kenya
Kenya is experiencing a mixed and geographically heterogeneous HIV epidemic with
characteristics of both a ‘generalized’ epidemic among the mainstream population, and a
‘concentrated’ epidemic among specific most-at-risk populations (MARPs). The epidemic is
geographically diverse (see figure 1.1). Overall there has been a decline in HIV prevalence, from
7.2% reported in 2007 to 5.6% reported in 2012 (KAIS, 2012). The prevalence is higher among
women aged 15 to 64% (6.9%) compared to men in the same age group (4.4%). However, figure
1.1 shows a general decline in HIV prevalence between 2007 and 2012.
Figure1.1: HIV prevalence among persons aged 15-64 years by region, KAIS 2007 and 2012
According to KAIS 2012, high-risk sexual and drug-using behaviour was low at 0.1%. The
pattern emerging in Kenya is of highly variable epidemiological dynamics, geographically with
respect to modes of transmission, and with substantial age and sex differentials. Kenya has a
variety of localized HIV epidemics across the country, with diverse causes and outcomes. This
pattern presents the following particular challenges with respect to the epidemic among the
general population:
3.6 3.8
8.1 4.3
4.6 3.7
8.8 4.9
14.9 15.1
6.3 3.7
5.4 4.7
0%
10%
20%
30%
40%
50%
60%
70%
80%
90%
100%
2007 2012
Western
Rift Valley
North Eastern
Nyanza
Nairobi
Eastern
Coast
Central

4
High levels of HIV within marriage/regular partnerships: the high sero-status discordance
rate suggests that marriage may well be a ‘high risk’ situation with variable patterns of initial
introduction of HIV into the union. Social norms regarding relationships, gender
roles/imbalances, stigma and discrimination, fear and risk-perception, and fertility intentions
present difficult prevention challenges. In addition, apart from testing, ‘discordant couples’
are virtually impossible to identify and target with services.
Paediatric HIV infections due to vertical transmission: a continuing high incidence of
paediatric infection, due mainly to inefficient, inaccessible, or underutilized Prevention of
Mother to Child Transmission (PMTCT) services, also constitute a particular challenge.
Paediatric HIV infection contributes directly to infant and young child mortality, complicates
child malnutrition, and requires lifelong and expensive treatment. Children on HIV treatment
that survive to adolescence and adulthood face the additional challenge of forming
relationships without transmitting their vertically acquired infection horizontally.
Gender dimensions of the epidemic: the ‘feminization’ of the epidemic is apparent with
prevalence among women (8.8%/15-49 and 8.4%/15-64) significantly higher than among
men (5.5%/15-49 and 5.4%/15-64). While prevention programmes among young people have
contributed in delaying sexual debut and increasing risk perception, for young women who
are already sexually active, prevention programmes have generally failed to make a
difference.
Mismatch between service provision and geographical prevalence: approximately 70% of
PLHIV live in rural areas, but services are concentrated in urban/peri-urban areas. Where
optimal prevention is service delivery-mediated, access to such services is a problem.
Low levels of knowledge about HIV status: only 36% of Kenyan adults (15-64) have tested at
least once for HIV and received results. However, an estimated 80% of HIV infected people
do not know their correct status, and testing rates show little difference across provinces,
despite large geographical variation in prevalence. HIV testing rates are higher among

5
women (43%) compared to men (25%).
Improving still low levels of condom use:whilecondom use among higher-risk sex shows
some positive progress for both women (23.9% in 2003 KDHS, and 35% in 2007 KAIS) and
men (46.5% - 51.8%), it remains low.
Treatment, care and nutrition: only 38-45% of those in need of treatment are being reached
at present, with coverage for children much lower, at about 15%. Up to 300,0001 Kenyans
are still at the risk of dying due to lack of access to treatment.
TB-HIV: Despite that fact that 80% of TB patients are being offered HIV testing and 80% of
TB facilities provide HIV testing; only 27% of HIV positive TB patients receive ART.
Challenges among MARPs include:
Overall lack of data about a number of such populations: it is difficult to target services
effectively when so little is known about these populations. Sex workers, with relatively high
HIV prevalence among them, are widespread in urban centres and along major transport
routes, but attempts to accurately quantify the population size have so far been unsuccessful.
KNASP III uses the latest model default estimates to arrive at 80,000 sex workers for
planning purposes. Multiple concurrent partnerships are common, and MSM are not a
negligible population in Nairobi, but real numbers for both are unknown. IDU is increasing
in Kenya, but again, while a United Nations Office of Drug Control (UNODC) study
conducted in 2004 estimated HIV prevalence among injecting drug users in Nairobi, Malindi
and Mombasa to be 68%-88%; real numbers and distribution are unknown.
Criminalization of these groups’ high risk behaviours: sex work, homosexuality and drug use
are all illegal in Kenya, and attempts to de-criminalize them have faced significant religious
1 Latest figures from WHO.

6
and cultural resistance among the population. However, based on new evidence2, KNASP III
will work with all most at risk groups and seek innovative ways to reduce HIV transmission.
Programmes have been working with all these groups for many years, but under constraints,
which KNASP III systematically aims to alleviate.
Marginalization of such populations from standard ‘services’ – especially in the public
sector:as in many societies, many service providers find it difficult to provide non-
stigmatizing services to clients perceived to be practicing illegal behaviours.
Denial and social intolerance of many such populations: this leads to a reluctance to
prioritize interventions and services aimed at MARPs, even among professional planners and
policy-makers.
There is clearly a wide epidemiological diversity for the epidemic to be classified as both general
and concentrated. It affects all sectors of the country and is more of a developmental than
epidemiological challenge, encompassing identification and development of a series of
appropriate sectoral responses, and their application at the local level.
1.4 Key drivers of the epidemic
Full understanding of the drivers of the epidemic in Kenya remains limited. However, the
KNASP III is based on assessments of vulnerabilities at both ‘macro’ and ‘micro’ levels. At the
‘macro’ level, many of the underlying vulnerabilities that contribute to the spread of HIV remain
strong. Kenya remains a deeply unequal nation in terms of disparities of income, gender norms,
roles and relations, and geographic location. While the country has seen marginal declines in
poverty in recent years, large income disparities remain, and are becoming exacerbated. Despite
weak evidence of links between poverty and HIV risk, socio-economic disparities lead to social
exclusion – the denial of population groups (e.g. women) of their full voice and agency within
communities and the society – with stronger apparent correlation.
2 MoT Study 2008; KAIS 2007, 2012

7
In the context of the Kenyan HIV epidemic, indications of specific deprivation among the urban
poor and women are clear: lack of access to social capital; lack of control of human capital,
rights, assets and information; and, the denial of entitlements to inheritance and to equality of
opportunity, e.g. for education and care. The HIV epidemic has also deepened elements of
deprivation in the context of embattled social relations, and it has also challenged social capital
networks3. Social exclusion limits, and sometimes entirely prevents, people’s voice and
participation within their communities in shaping, implementing, monitoring and evaluating
actions that are likely to have considerable impact on their own lives.
Such social exclusion compounds vulnerability to infection. For instance, if widows or orphans
are disinherited and become landless, they may be forced to undertake high risk activities, such
as transactional or commercial sex work. Widows disinheritedby their husband’s kin may see
early marriage to an older man, perhaps as a second or third wife, as the only option to escape
destitution. People’s capabilities and entitlements become compromised in situations of social
exclusion, and they become less able to make considered decisions and choices. Equity and
rights-focused approaches require that interventions promote social inclusion.
Kenya has a significant demographic problem: a large youth population, high population growth
with rapid urbanization and growth of informal settlements. Young people aged 15-35 represent
38% of the population and the current 11 million young people in this age group are expected to
increase to 16 million by 2012. Over 60% of new HIV infections are among this age group, yet
the dynamic of this demographic challenge is in danger of being ignored as new cohorts of
young people are constantly becoming sexually active. Young people will require support to
prevent new HIV infections, and to have effective and equitable access to sexual and
reproductive health services (NCPAD, 2006).
Nationally some 20,000 secondary school students graduate each year and these young people
represent a key cohort for behaviour change communication (BCC) and character formation.
Out-of-school youth (data on numbers is not available), especially young out-of-school women,
3 Cf. Pulling Apart: Facts and Figures on Inequality in Kenya, Society for International Development, Nairobi,
2004.

8
represent an even harder to reach group in terms of BCC, character formation and peer
education. It is estimated that only 12% of public health facilities offer what can be defined as
youth-friendly services. Provision of genuinely youth-friendly (particularly ‘girl-friendly’) and
integrated sexual and reproductive health (SRH), family planning (FP) and HIV services is
perceived by the MoH, NACC and other key actors such as the National Coordination Agency
for Population and Development (NCPAD) as of critical importance with regard to reducing HIV
prevalence rates among young people aged 12-24, and especially girls and young women in that
age range.
Data from the Ministry of Trade (MoT) and KAIS studies make it clear that the HIV epidemic
remains strongly associated with cultural patterns of life in Kenya: the two main determinants of
HIV infection are male circumcision4 and societal acceptance of concurrent multiple
partnerships. The first, lack of male circumcision, is mainly limited geographically to certain
areas, and would appear to present a challenge mainly in terms of massive service delivery
problem. The second is still deeply rooted in a number of widely-held socio-cultural norms.
At the ‘micro’ level, it is evident that many Kenyans have changed their individual behaviour,
the age at sexual debut and of marriage have risen, and condom use has increased significantly.
However, while much has changed, much still remains the same. Many of these challenges
remain, particularly those that relate to the position of women. Gender disparities in Kenya are
high: prevalence among adolescent girls aged 15-19 is six times that of men (3% of all young
women in that age group, as compared to less than 0.5% of young men); among young women
aged 20-24 the prevalence rate is 9% as compared to 2% in young men. Kenyan girls’ and
women’s vulnerability to HIV infection can be gauged by such statistics as 28% of men aged 15-
49 believe that a woman has no right to request that a man use a condom, and only 24% of
women aged 15-49 who reported having sex with a man other than a spouse or
regular/cohabiting partner within the past twelve months had been able to request condom use
(KDHS, 2003). Women’s vulnerability is therefore compounded by a male dominated society,
whose sexual beliefs are not always scientifically correct. A particular concern is for young
4While male circumcision is a common practice in Kenya with 84% of adult men having been circumcised, the
practice is much lower among specific groups, such as the Luo, Turkana and Teso.

9
married women, who may have even less opportunity to negotiate safe sex than young unmarried
women - many are deemed to have minimal room to manoeuvre to discuss their husbands’ (in)
fidelity. Indeed, infection rates are higher among young married women than among unmarried
women of the same age.
Sources of new infections
The prioritized response in KNASP III is informed by an evidence-based understanding of where
effective services are needed most urgently. The MoT study reviewed the epidemiology of HIV
in Kenya, based on the data available, including the latest KAIS data. The MoT modeling
estimated that some 76,000 new infections occurred in 2006, bringing the total number of adults
aged 15-49 infected with HIV to 1.2 million. A subsequent Spectrum model estimated the
number of infected adults in 2009 at 1.5 million. The national epidemic is geographically
diverse, however, with a particularly high prevalence in Nyanza Province5 (14.9% - with 26%
prevalence in Suba District and 19% in Kisumu), and higher than the national average in Nairobi
(8.8%) and Coast Province (8.1%). Overall, the annual HIV incidence is estimated at 162,000
(130,000 new infections in adults and 32,000 paediatric due to vertical transmission). Sources of
new adult infections are:
Nationally most new infections occur in couples who are engaged in heterosexual sex within a
union/regular partnership, and those who practice casual sex, are sex workers or are clients of
sex workers, are among the prison population and MSM. Those who are in a union or regular
partnership contributed 44% of the new infections. Men and women who engage in casual sex
contributed 20% of new infections, sex workers and their clients contributed 14% and MSM and
Prison populations contributed 15% of new infections. This pattern is similar in all provinces
except for Nyanza where the contribution to new infections by those who practice casual sex,
and sex workers and their clients, was much higher. Heterosexual sex in a union/regular
partnership, casual sex, and sex workers and their clients contribute over 70% of new infections
5 A significant contributing factor to high HIV prevalence in Nyanza Province is the low level male circumcision
among Luo, who constitute around 60% of the region’s population. Subsequently, distribution of HIV prevalence in
Nyanza is highly unequal among different population groups and geographical locations.
10
nationally, except in Nyanza where they contribute over 90% of new infections. Injecting drug
use and health facilities contributed 6.3% of the new cases.
Sex work in general, and particularly linked to truck drivers as clients, was the initial source of
infection for the epidemic in Kenya and it still seems to be an important source of incidence. It is
likely that the epidemic in the general population spread from this initial source. While it now
plays a much smaller role, incidence has been maintained in these groups, so they are still
contributing to the epidemic. Similarly, MSM and injecting drug users (IDUs) are populations
that need to be recognized in Kenya as significantly contributing to incidence. The data around
these communities still remains incomplete, and while the national model indicated that MSMs
and IDUs combined account for perhaps 15% of new infections, the model for Nairobi placed
this group’s contribution at 26% and in Mombasa at 31%, almost one-third of new infections.
Although the number of IDUs in the population is relatively low, this is a group with a high
potential to transmit the disease, and this is reflected in the extremely high incidence in the MoT
model.
As already noted, the level of contribution to incidence of these main modes of HIV transmission
varies geographically, reflecting both the diverse causes and outcomes of the epidemic:
transmission among IDUs contributes to 6% of incidence in the Coast Province, but nil in
Nyanza; transmission among MSM contributes less than 6% of incidence in Nyanza, but over
16%, in Nairobi. Similarly, transmission associated with fishing communities is a particular
problem around Lake Victoria, accounting for some 24% of incidence. Finally, both age and sex
differentials are considerable, with HIV prevalence peaking among women (13.3%/30-34) a
decade earlier than among men (10.2%/40-44), reflecting historical transmission patterns. Inter-
generational sex, however, may not be as frequent as generally accepted6.
1.5 National Response to HIV and AIDS in Kenya
6A study in Kisumu found that only 4% of men’s sexual partnerships were “Sugar Daddy”, defined as the man being 10 years older or more and
being above the sample mean in income. cf Confronting the ‘Sugar Daddy’ Stereotype: Age and Economic Asymmetries and Risky Sexual
Behavior in Urban Kenya, Nancy Luke, International Family Planning Perspectives, 2005, 31(1):6–14.

11
In view of the evidence presented above, it is evident that prevention of new infections must be
revitalized nationally through a well-coordinated response. The KNASP III identifies three major
clusters of intervention priorities as follows:
Intensify HIV prevention in the general population, by promoting safe affordable male
circumcision, partner reduction, condom use and deferred sexual inception, particularly
among young girls – to address the estimated 44.1% of HIV infections occurring in casual
and low-risk heterosexual sex in the general population. And improve PMCTC for more
effective prevention of vertical transmission, which remains significant.
Intensify couple-based HIV prevention programmes, particularly by expanding and
enhancing the quality of couple-based voluntary counseling and testing – to tackle the
estimated 20.3% of HIV infections occurring among the sexual partners of those who have
casual and low-risk heterosexual sex.
Revitalize and expand programmes among sex workers, IDUs, MSM and prison
populations – to curtail the 33.1% of infections occurring among these groups.
Based on surveillance, research, and models of new infections intervention priorities must tackle
transmission clusters in the general population, within couples, and among most-at-risk-
populations and their sexual partners.
1.6 Financing Sources and Mechanisms for Health and HIV/AIDS
The various sources of HIV/AIDS funding include the public (Ministry of Finance (MoF),
Parastatals and Local Government), development partners both bilateral and multilateral, private
firms and household sources. Government sources include budget allocation to line ministries
and include general tax revenue which is largely derived from direct taxes. Since 2001/02
financial year, the Government of Kenya (GOK) adopted a Medium Term Expenditure
Framework (MTEF) in an attempt to align the budget and resource allocation with its poverty
reduction efforts, and to address policies in key sectors, namely education, health and
infrastructure. Government funding follows the government budgeting and financial procedures,
with the funds for HIV/AIDS being disbursed from treasury channelled through the Ministry of

12
Public Health and Sanitation through National AIDS and STI Control Programme (NASCOP)
and National AIDS Control Council (NACC).
The funding to Ministry of Health has been as part of its allocations for the provision of health
services, including its activities for prevention and for opportunistic infections that form part of
the normal workload of its health facilities. The allocations to NACC has been to support its
operations to coordinate and mobilize resources for a multi-sectoral response to HIV/AIDS,
including administering intergovernmental transfers under the Constituency Aids Committees
(CACs), and transfers to line ministries for specific HIV/AIDS-related expenditure items and
programmes.
For the implementation of the HIV/AIDS programmes, the government has heavily relied on
donor support. Donor funding to health and HIV/AIDS is channelled through either the
government budgetary system commonly referred to as on-budget or through the extra-budgetary
– off-budget, mainly directly from donors through donor administered project/programmes or
through NGOs without going through the Government budget process. The extra-budgetary
allocation by donors is by far larger than the on-budget support and has been growing over the
years. The donor categories comprise of both multi-lateral and bilateral agencies, and include
funds made available through the World Bank Multi-Country HIV/AIDS Programme (MAP),
and its project KHADREP and lately TOWA, PEPFAR, and the UN agencies core and non-core
resources to support the national response to HIV/AIDS.
The Global Fund to Fight AIDS, Tuberculosis and Malaria (GFATM) is another funding
mechanism that is supporting HIV/AIDS programmes in Kenya, and complements the ongoing
efforts by multi- and bi-lateral agencies, and by the government. Funds under the Global Fund
are currently being channelled through Ministry of Public Health and Sanitation and NACC. A
Country Coordinating Mechanism (CCM) has been constituted to oversee the disbursement
GFTM funds.

13
Figure 1: HIV and AIDS funding flows in Kenya
2. The Rationale for a National HIV/AIDS Spending Assessment
The National AIDS Control Council (NACC) is in the process of strengthening the management
of the national response to HIV /AIDS. One of the strategies to achieve this objective will be an
annual compilation of expenditure/ spending information on the national response. Tracking of
the national expenditure on HIV/AIDS interventions on annual basis would yield strategic
information, and inform resource mobilization, allocation and utilization. In addition, the data
collected will allow for the reporting on the UNGASS Financial indicators, inform MTEF
budgetary process as well as other major national planning instruments. This process would be
institutionalized through a Kenya National AIDS Spending Assessment (KNASA).
SOURCES FINANCIAL AGENTS PROVIDERS
Multilateral
Agencies
International
Not-for-profit
Organizations
Ministry of finance Ministry of Health
Multilateral
Agencies
Private
Not-for-profit
Organizations NGOs
Other Ministries
and Departments
Ministry of Health Facilities
(Public Hospitals, health
centrese.t.c.)
Other Ministries and Department
facilities (Hospitals,
healthcentrese.t.c)
Multilateral Agencies
NGOs
Household’s fund Private Households’
(Out – of – pocket
payments)
Private Facilities
(Pharmacies, ,hospitals, e.t.c.)

14
The NASA is a comprehensive and systematic methodology used to determine the flow of
resources intended to respond to the HIV/AIDS epidemic of a nation. It describes the flow of
funds from their origin down to the end point of service delivery, among the different institutions
dedicated in the fight against the epidemic. By matching the HIV/AIDS budgeted expenditures
and the actual spending on the same, financing gaps can be computed – gap analysis. The gaps
would form a good basis for resources mobilization for the national response to HIV/AIDS.
The KNASA findings will inform the costing of the new Kenya National AIDS Strategic Plan IV
that aims on delivering on universal Access to HIV/AIDS services at all levels of prevention of
new HIV infections, reduction of HIV-related illness and deaths, and mitigation of the effects of
the epidemic on households and communities. This Plan will deliver on Vision 2030, as well as
realize the targets set by United Nations General Assembly for scaling up HIV prevention,
treatment, care and support, and mitigation of the socio-economic impacts. KNASP IV therefore
sets the stage and the framework for enabling Kenya to achieve Millennium Development Goal
(MDG) 6.
The need for timely, reliable and comprehensive information for the management of the national
response to HIV/AIDS is important to the Government of Kenya and key partners, through the
National AIDS Control Council (NACC) to enable them: i) address the resources required to
satisfy the needs of the vulnerable population directly affected by the spread of the disease, ii)
identify programs that comprise the capacity to deal with the consequences of HIV and AIDS i.e.
human/financial resources to strengthen prevention, care and treatment as well as social
mitigation to augment society’s responses to the threat and consequences of HIV and AIDS
2.1 Aim and Objectives of the NASA in Kenya
The overall aim of conducting the KNASA is to contribute to the strengthening of
comprehensive tracking of actual spending (from international/external, public and private
sources) that comprises the National Response to HIV and AIDS in the country, to leverage both
technical and financial support for the development, implementation, management, monitoring

15
and evaluation of the national HIV response. The assessment will provide information that will
guide resource mobilisation, planning, resource allocation for and management of the National
Response. It is envisaged that the ensuing NASA information would ultimately be used to guide
resource mobilization at national and county levels, evaluation of KNASP III and planning for
KNASP IV that will ultimately strengthen the effectiveness and efficiency of resource use.
The specific objectives of the study are:
i. To assess the magnitude and structure of HIV/ AIDS financing and expenditure in Kenya
– at national and county levels - for the financial years 2009/10-2011/12
ii. To strengthen the institutionalization of HIV/AIDS resource tracking in the Kenya’s
national response.
iii. To catalyze and facilitate actions which strengthen capacities to effectively track
expenditures on HIV /AIDS, and synthesize this data into strategic information for
decision-making.
iv. To track the allocation of HIV and AIDS funds, from their origin down to the end point of ser-
vice delivery, among the different sources of financing (public, private or external) and among
the different providers and beneficiaries (target groups).
16
CHAPTER TWO: STUDY DESIGN AND METHODOLOGY
2.1 NASA Concepts
The National HIV/AIDS Spending Assessment (NASA) approach to resource tracking is a
comprehensive and systematic methodology used to determine the flow of resources intended to
combat HIV and AIDS. The tool tracks actual expenditure (public, private and international)
both in health and non-health sectors (social mitigation, education, labour, and justice) that
comprises the National Response to HIV and AIDS. The tool was developed using the national
health accounts framework and principles. It applies standard accounting methods to reconstruct
all transactions in a given country, ‘following the money’ from the funding sources to agents and
providers, and eventually to beneficiary populations. The NASA is expected to provide
information that will contribute to a better understanding of a country’s total HIV and AIDS
spending, spending by priority areas, how equitable the funding is, funding going to county
levels, financial absorptive capacity, as well as on issues about the equity, the efficiency and the
effectiveness of the resource allocation process. In addition to institutionalizing the resource
tracking for HIV and AIDS, NASA facilitates a standardized reporting of indicators for
monitoring progress towards the achievement of the target of the Declaration of Commitment
adopted by the United National General Assembly Special Session on HIV/AIDS (UNGASS).
The NASA follows a system of expenditure tracking that involves the systematic capturing of the
flow of resources by different financial sources to service providers, through diverse mechanisms
of transaction. A transaction comprises of all the elements of the financial flow, the transfer of
resources from a financial source to a financing agent or service provider, which spends the
money in different budgetary items to produce functions (or interventions) in response to
addressing HIV/AIDS to the benefit of specific target groups or to address unspecific
populations (or the general population).
NASA applies either both top-down and bottom-up techniques for obtaining and consolidating
information. The top-down approach tracks sources of funds from donor reports, commitment

17
reports and government budgets. The bottom-up approach, which tracks expenditures from
service providers' expenditure records, facility level records and governmental department
expenditure accounts was used on public sources of funding, and scaled up in the assessment to
include the Ministry of Health, and other ministries and departments.
Given that the service providers, especially the health facilities lack data on actual expenditures
on HIV/AIDS, costing techniques were used to estimate actual expenditure based on
internationally accepted costing methods and standards used to retrogressively measure past
actual expenditure. Ingredient and step-down costing is used for direct and shared expenditure
for HIV/AIDS, whilst shared costs are allocated on the most appropriate utilization factor. As
part of its methodology, the NASA employs double entry tables or matrices to represent the
origin and destination of resources, avoiding double-accounting the expenditures by
reconstructing the resources flows for every transaction from funding source to service provider
and beneficiary population, rather than just adding up the expenditures of every agent that
commits resources to HIV/AIDS activities.
The need to track HIV expenditure stems from the fact that decisions regarding allocations for
HIV and AIDS related activities must be based on the true effect of previous expenditure
patterns on the profile of the epidemic in the various regions in the country. NASA provides
information that contributes to a better understanding of a country's financial absorptive capacity,
as well as on issues about the equity, the efficiency and the effectiveness of the resource
allocation process. In addition to establishing a continuous information system of the financing
of HIV/AIDS, NASA facilitates a standardized reporting of indicators for monitoring progress
towards the achievement of the targets of the Declaration of Commitment adopted by the United
National General Assembly Special Session on HIV and AIDS (UNGASS).
2.2 The NASA Classifications
After experimentation and an evaluation of past response to the drivers of the HIV epidemic,
and the ways to address these drivers, the NASA programme and budget lines have been
structured in eight spending classes or chapters of AIDS Spending Categories namely:

18
Prevention, Care and treatment, Orphans and vulnerable children, Programme management and
administration strengthening, Incentives for human resources, Social protections and social
services, Enablement of environment and community programs and Research. The beneficiary
populations are classified under seven main categories with a number of sub-groups in each
category to enable a further disaggregating of the data collected. Three sets of entities can be
defined as financing sources, financial agents and providers.
i. Financing Sources: Financing sources are defined as entities which ultimately bear the
expenses of financing HIV and AIDS activities.
ii. Financial Agents: Financial agents are defined as entities which pass funds from
financing sources to other financial agents or providers in order to pay for the provision
of HIV and AIDS services. They determine how funds are allocated to finance the
different interventions.
iii. Providers: Providers are defined as institutional entities that produce and provide health
care goods and services, which benefit individuals or population groups.
2.3 Scope of the Assessment
This assessment focused on tracking national and county HIV expenditure for FY 2009/10,
2010/11 and 2011/2012. Expenditure data on HIV/AIDS were collected from domestic, external
and partially private sources. It also encompassed tracking the allocation of HIV/AIDS funds,
from their origin down to the end point of service delivery.
2.4 Sampling
To facilitate the sampling process, a database of all the stakeholders involved in HIV/AIDS as
sources, agents and providers was developed. The sampling frame included the main sources of
funds. Specifically, major financing sources supporting HIV and AIDS were included in the
study, consisting of Clinton Foundation; United Kingdom Agency for International Development
(UKAID) formerly Department for International Development (DfID); Joint United Nations
Programme on AIDS, United States Government (USG- President’s Emergency Fund for AIDS
Relief (PEPFAR); GFATM; and Government of Kenya.

19
In addition to the financing sources, a representative sample of financing agents was selected
purposively based on the volume of funds managed by the agent7. The following list of financing
agents was included in the study: United Nations Joint Programme on HIV and AIDS including
UNAIDS, WHO, UNHCR, UNICEF, WFP, (UNFPA), UNODC, ILO, UNESCO, AMREF, Red
Cross, Population Service International (PSI) and the National Treasury (Ministry of Finance).
Main agents of the PEPFAR were not surveyed since the data on expenditure by USG was
provided directly from the source. However, the financing agents managing PEPFAR funds were
not provided
For the purpose of the NASA estimates, all the government ministries that existed prior to the
new structure of government ministries were included in the study. Each of the Ministries has an
AIDS Control Unit (ACU) which is responsible for HIV and AIDS response in the specific
ministry. The 42 ministries that existed before the current structure of the ministries were aligned
to the current new government structure which has 18ministries.
In addition, a sample of NGOs providers (362) was surveyed to provide data on HIV and AIDS
spending. The sampling frame for the NGOs was provided by NACC. The sampling was
purposive and done with assistance of NACC offices at the counties. Overall, a sample of 17
counties was included for this study (see Table 2.1)
7 Note that some of the financing agents are also sources of funds as well as providers of services.

20
Table 2.1: Sampled counties
Serial number County
1 Bungoma County
2 Garissa County
3 Kakamega County
4 Kericho County
5 Kiambu County
6 Kisii County
7 Kisumu County
8 Machakos County
9 Makueni County
10 Meru County
11 Mombasa County
12 Nairobi County
13 Nakuru County
14 Narok County
15 Nyeri County
16 Taita Taveta County
17 Uasin Ngishu County
2.5 Data Collection
The initial assessment was undertaken through a desk review of key policy documents,
programme documentation and institutional budgetary and expenditure reports for the period
2009/10-2011/12. This review was followed by one month period of data collection, starting in
September 2013. Letters introducing NASA and requesting data from sources of HIV/AIDS
financing, financing agents and service providers were sent out by NACC to the various
development partners, government ministries, NGOs, bilateral and multilateral organizations in
order to formally gain access to the required data.
The data collection stage comprised of the refinement of the methodology for conducting NASA
study for national and county levels, drawing on the internationally approved approaches and
methods used for NASA. The standard NASA Questionnaires were used to collect data from the
financing sources, financing agents, and services providers.

21
The initial data collection focused on the sources of funding for HIV and AIDS and financing
agents. This stage was estimated to last for two weeks but lasted for one and half months. Data
collection from UN Agencies took long time, lasting up to January 2014. This notwithstanding,
only four UN agencies provided the required data. In addition, data on PEPFAR expenditure for
2012 was obtained directly from PEPFAR headquarters. However, PEPFAR country budgets for
the years 2010 and 2011 were used to estimate the level of expenditure by USG. The expenditure
analysis for 2012 showed that about 95% of the 2012 budget was implemented. In the analysis,
the entire budget estimates for 2010 and 2011 were used. Data collection at the county level took
4 weeks in September 2013and focused on service providers. The data collected included
expenditure on AIDS spending categories and factors of production.
2.6 Data Analysis
Data analysis comprised a number of steps consisting of estimation of indirect expenditure by
government, estimation of out-of pocket expenditure, disaggregation of USG expenditure for
2010 and 2011, entry of the all into Excel processing files, and entry into resource tracking tool
(RTT). These steps are explained as follows:
2.6.1. Estimation of Indirect Government Expenditure
Government of Kenya makes significant contribution to the national response through provision
of health personnel and other recurrent inputs. The public health facilities provide health services
to about 70% of the patients on ART, while FBO and NGO facilities and private for profit
facilities account for about 24%and 6% of the ART patients respectively. The FBO and NGO
facilities are supported by partners in the provision of ART, PMTCT, and HTC services, and
thus are reimbursed for the cost incurred including the cost of personnel. The amount they are
reimbursed was already captured in the tracking of expenditure, and hence no estimation was
carried on this component. However, Government pays for the health personnel and other
recurrent inputs especially overhead costs. Additionally Government provides space and
equipment in the provision of HIV related health services.
Indirect contribution by the Government was estimated for the period under the study. In the
estimation, costing analysis was carried out to determine the actual expenditure incurred by

22
public health facilities during the period of expenditure tracking. Only recurrent expenditure was
considered in each of the three years. The services considered included ART, PMTCT, HTC and
general outpatient services. The ‘cost’ or expenditure per person in each of these services was
generated using the Kenya Dynamic Costing Model. The model breaks the unit ‘cost’ or
expenditure into five components consisting of drugs and medical supplies; labour, overhead,
equipment and infrastructure (space). The costs of the first three components were based on
actual expenditure incurred by the health facilities while the last two components were based on
replacement values that were annualized. The model uses a step down method to allocate
expenditure to both inpatient days and outpatient visits. The expenditure estimation and
assumptions used for each of the services is presented below.
ART services
Table 2.2 provides the expenditure per component per visit to a public health facility while Table
2.3 shows that estimated indirect Government expenditure on ART services in public health
facilities. Unit cost of drugs and supplies was excluded as they already been included in the
expenditure estimates.
Table 2.2: Expenditure per outpatient visit for ART and general OP services
2009/2010 2010/2011 2011/2012

23
Direct labour (Kshs) 285.51 299.78 314.77
Overhead per OP visit (Kshs) 324.65 340.88 357.92
equipment per OP visit (Kshs) 23.65 24.83 26.08
infrastructure per OP visit (Kshs) 32.93 34.57 36.30
Table 2.3: Estimated indirect Government expenditure on ART and OP services
2009/2010 2010/2011 2011/2012
Adult Children Adult Children Adult Children
Estimated number of patients on first line 315,558 28,751 396,525 36,096 503,271 45,317
Estimated number of patients on second line 10,271 1,462 12,906 1,835 16,381 2,304
Total number on ART (70% GOK) 228,080 21,149 286,602 26,552 363,756 33,335
Unit cost (excluding ARVs) (Kshs) 4,667.13 4,667.13 4,900.48 4,900.48 5,145.51 5,145.51
Total indirect expenditure` first line (Kshs) 1,064 99 1,404 130 1,872 172
Second line (70% GOK) 7,190 1,023 9,034 1,285 11,467 1,613
Assumptions used in estimating indirect government expenditure on HIV and AIDS
70% of individuals on ART get services from public health facilities. We used the actual
number ART patients in the country.
The numbers of adults and children on ART second line for 2009/10 are the actual
numbers. However, the numbers on second line in 2010/11 and 2011/12 were estimated
using the percentages in 2009/10 ( 3.1% for adults and 5.1% for children)
The unit cost estimated includes labour, overhead, equipment and infrastructure
components. The cost of ARVs and medical supplies were excluded since they do not fall
under indirect support components
Inflation rate of 5% was used to deflate the values of the unit expenditure. The unit
components were based on expenditures for the year 2011/12.
Direct labour consists of a doctor or clinical officer spending on average 25 minutes per
ART patient per visit, and a nurse spending 6 minutes per patient (Dynamic Costing
Model).
Each patient makes an average of 7 visits to health facilities per year (4 ART visits
annually or 1 visit quarterly, and 3 “illness visits”). Note that in Kenya, outpatient visits
per capita are 2.6.
Using the above assumptions, the estimated indirect expenditure on ART was KShs1.06 billion
in 2009/10, Kshs 1.40 billion in 2010/11, and Kshs 1.87 billion in 2011/12.
HIV care services

24
The patients who are not eligible for treatment are put on HIV care where they make quarterly
visits to facilities for medical check-up. The assumptions used were the same as those used in the
ART service provision. The results are shown in Table 2.4.
Table 2.4: Indirect contribution by government on non-ART care
2009/2010 2010/2011 2011/2012
Estimated number of patients on care 470,294 580,724 590,920
Total visits annually ( 7 visits per person) 3,292,060 4,065,070 4,136,438
Direct labour (Kshs) 939,906,138 1,218,636,184 1,302,032,379
Overhead per OP visit (Kshs) 1,068,755,150 1,385,695,491 1,480,524,228
Equipment per OP visit (Kshs) 77,861,446 100,951,331 107,859,838
Infrastructure per OP visit (Kshs) 108,400,861 140,547,238 150,165,453
Total Expenditure (Kshs) 2,198,685,951 2,850,476,038 3,045,309,256
PMTCT services
The estimated PMTCT expenditure covered both ARV prophylaxis and infant follow up (see
Table 2.5 and Table 2.6).
Table 2.5: Indirect contribution by government on PMTCT prophylaxis
2009/2010 2010/2011 2011/2012
No. HIV+ pregnant women 90,000 90,000 90,000
6 visits 6 6 6
Unit cost (Kshs) 666.73 700.07 735.07
Direct labour (Kshs) 107,921,631 113,317,713 118,983,598
Overhead per OP visit (Kshs) 122,716,295 128,852,110 135,294,715
Equipment per OP visit (Kshs) 8,940,184 9,387,194 9,856,553
Infrastructure per OP visit (Kshs) 12,446,772 13,069,111 13,722,567
Total Expenditure (Kshs) 252,024,883 264,626,127 277,857,433
In the analysis, the costs of components in Table 2.2 were multiplied by 6 visits and by 70% of
the estimated HIV positive pregnant women. In addition to the indirect expenditure on ARV
prophylaxis service, indirect expenditure on infant follow-up was also estimated. The results are
displayed in Table 2.6.

25
Table 2.6: Indirect contribution by government on PMTCT infant/ child follow-up
2009/2010 2010/2011 2011/2012
Direct labour (Kshs) 269,804,078 283,294,281 297,458,995
Overhead per OP visit (Kshs) 306,790,738 322,130,274 338,236,788
Equipment per OP visit (Kshs) 22,350,461 23,467,984 24,641,383
Infrastructure per OP visit (Kshs) 31,116,931 32,672,777 34,306,416
Total Expenditure (Kshs) 630,062,207 661,565,318 694,643,584
The assumptions outlined for ART services also applied to PMTCT services. However, an
additional assumption was used in the estimations, that is, each infant was assumed to make an
average of 12 visits to a health facilities in year 1 (1 visit every month) in the first year of the
follow-up. In the second year, the infant visits a facility once a month for 6 months. The national
guidelines recommend a total of 18 months of infant follow-up.
HIV Testing and Counselling services (HTC)
In Kenya, HTC services are provided by both public and private sector. Stand-alone VCT sites
are most popular sources of services. In the public sector, HTC services are provided in public
health facilities. The results of the estimation are presented in Table 2.7.
Table 2.7: Indirect contribution by government on HTC services
2009/2010 2010/2011 2011/2012
Population 15 years and over 21,402,883 22,079,047 22,771,321
Testing coverage (KAIS 2012, 2007 used for
computation)
45% 50% 55%
Number people tested 9,725,862 11,049,940 12,444,896
Public sector coverage (40%) 3,890,345 4,419,976 4,977,959
Unit cost (excluding reagents) )(KSHs) 626.85 658.20 691.11
Total Expenditure (Kshs) 2,438,673,951 2,909,208,671 3,440,293,827

26
Assumptions
Annual coverage of HTC was 34% in 2007 (KAIS, 2007) and 57% in 2012 (KAIS,
2012). These were used to estimated HTC coverage in 2009/10, 2010/11 and 2011/12.
Unit cost includes labour, overhead, and infrastructure components (from Dynamic
Costing Model)
Unit cost covers direct labour (a counsellor) spending on average 45 minutes per client.
Summary estimated expenditure on the services
Table 2.8 summarises the estimated expenditure. Taking into consideration all the above
services, the indirect government expenditure was estimated Kshs 5.75 billion, Kshs 7.10 billion,
and Kshs 8.18 billion respectively for 2009/10, 2010/11, and 2011/12.
Table 2.8: Total indirect Government contribution
2009/2010 2010/2011 2011/2012
HTC (Kshs) 1,506,440,797 1,795,777,973 2,122,109,480
PMTCT (Kshs) 882,087,090 926,191,445 972,501,017
HIV Care (Kshs) 2,194,923,596 2,845,830,243 3,040,581,899
ART (Kshs) 1,163,185,377 1,534,606,146 2,043,236,192
Total (Kshs) 5,746,636,860 7,102,405,807 8,178,428,587
2.6.2. Out-of-Pocket Spending on HIV/AIDS by Households
Out-of-pocket expenditure (OOPE) is an important source of HIV and AIDS financing in Kenya
and therefore essential for creating an effective HIV policy. Despite recent improvements in the
collection and use of strategic information, limited attempts have been made in the past to
estimate OOPE’s magnitude. In the context of increasing attention for optimization of the
national AIDS response based on strategic information and cognisant of the huge cost (in terms
of financial, time and human resources) in conducting household surveys to obtain this
information, an estimation of OOPE was carried out.
In the estimating OOPE the per capita outpatient OOPE and per capita inpatient OOPE from the
Kenya Household Health Expenditure and Utilisation Survey 2007 were used. The per capita

27
annual OOPE reported in the household expenditure survey was Kshs 328 and Kshs 245
respectively for outpatient and inpatient services. Further, an annual inflation rate of 5% was
applied to the per capita outpatient and inpatient estimates. In addition, the number of HIV
positive people was estimated using the results of KAIS 2007 and KAIS 2012. The numbers used
were 1.6 million, 1.5 million and 1.4 million respectively for the years 2009/10, 2010/11, and
2011/12. The estimation results are presented in Table 2.9.
Table 2.9: Estimated OOPE
2009/2010 2010/2011 2011/2012
38,610,097 39,849,453 41,088,810
Population HIV+ 1,600,000 1,500,000 1,400,000
Annual per capital outpatient OOPE (Kshs) 436.568 480.2248 528.24728
Annual per capital inpatient OOPE (Kshs) 299.4145 329.35595 362.291545
Country’s total outpatient OOPE (Kshs) 16,855,932,827 19,136,695,748 21,705,051,925
Country’s total inpatient OOPE (Kshs) 11,560,422,888 13,124,654,553 14,886,128,323
Country’s total OOPE 28,416,355,715 32,261,350,301 36,591,180,248
HIV related total outpatient OOPE (Kshs) 4,889,561,600 5,042,360,400 5,176,823,344
HIV related total inpatient OOPE (Kshs) 3,353,442,400 3,458,237,475 3,550,457,141
HIV related total OP and IP OOPE (Kshs) 8,243,004,000 8,500,597,875 8,727,280,485
Given the paucity of literature that estimates OOPE in similar setting, a person living with
HIV/AIDS spends approximately 7 times more out-of-pocket than the average Kenyan on health
care. Taking this assumption into account, the per capita outpatient OOPE was scaled up by a
factor of 7. The adjusted per capita outpatient OOPE was multiplied by the number of the HIV
positive population to estimate OOPE. As shown in the Table 2.2, total outpatient HIV related
expenditure was Kshs 4.89 billion in 2009/10, Kshs 5.04 billion in 2010/11, and Kshs 5.18
billion in 2011/12.Similarly, total inpatient HIV related OOPE was also estimated taking into
consideration the assumption of scaling up per capita expenditure by a factor of 7. The estimated
OOPE was Kshs 3.35 billion, Kshs 3.46 billion and Kshs 3.55 billion, respectively for 2009/10,
2010/11, and 2011/12.
It is imperative to note that themethods used to estimate OOP spending on HIV/AIDS excludes
spending on nutrition, orphans, psychosocial support, burial costs, etc. Therefore the estimates

28
obtained for OOP spending on HIV may be an underestimation of the actual household
expenditure on HIV/AIDS
2.6.3. Estimating Private Corporate Sector HIV Spending
Primary data were not collected on private corporations on HIV spending. However, estimation
was done using results from Kenya National Health Accounts (NHA) for the period 2009/10. In
the NHA 2009/10, privateemployer funds contributed Kshs 1.24 billion (US$ 15.93 million).
The estimated expenditure for the years 2010/11 and 2011/12 was obtained by inflating the
expenditure for 2009/10 using annual inflation rates. The inflation rates were obtained from
“KENYA FACTS AND FIGURES” published by Kenya National Bureau of Statistics (KNBS)
(KNBS, 2011, 2013). According to NHA 2009/10, the expenditure from the employer funds was
mainly on outpatient and inpatient health care services. Additionally, about 67% of the
expenditure went to drugs and pharmaceutical supplies while 33% went to general health
services fees. These percentages were used to estimate spending on factors of production.
2.6.4. Disaggregation of USG Expenditure for 2010 and 2011
As indicated earlier, USG expenditure analysis (EA) was provided. The analysis used NASA
classifications, encompassing AIDS spending categories and factors of production. The analysis
also provided the percentage of expenditure on each ASC over the total expenditure.
Additionally, expenditure by province was given, taking a total of 84% of the total expenditure.
Since expenditure analysis for 2009/10 (FY 2010) and 2010/11 (FY 2011) were missing, the
percentages of ASC from 2012 EA were used to disaggregate the total expenditure in the specific
categories. Applying the above assumptions, the total expenditure was US$ 548.1 million in
2009/10 and US$ 517.3 in 2010/11. For purposes of estimating expenditures on factors of
production for 2009/10 and 2010/11, the percentages of factors of production in each ASC for
2012 EA figures were used.

29
2.6.5. Estimation of Expenditure by County
The new constitutional dispensation has resulted in creation of regional level governments called
county governments. In the devolution, services such as health care services and social services
have been transferred from Central government to the County governments. In the spirit of
devolution, attempts were made to apportion total expenditure to the County level. The total
expenditure from all sources in each of the years was allocated to counties. Using the PEPFAR
analysis for 2012 where 84% of the expenditure went to the provinces, we allocated 84% of the
total expenditure to the counties. It is imperative to note that USG contributes over 70% of the
total expenditure on HIV services in the country.
The allocation involved two steps. In the first step, the expenditure was allocated to provinces
using the percentage from PEPFAR EA 2012. In the second step, the allocated amount to each
province was then allocated to the counties in the province using the population in each county
as the weight. The county with highest population in the province was allocated the highest
amount of the province’s allocation.
2.6.6. Data Entry into Excel Processing Files and into Resource Tracking Tool (RTT)
Initially, expenditure data collected was entered into NASA Excel processing forms, verified and
balance. All information obtained was verified to ensure the validity of data from the records of
the source, agents and providers, and also to avoid double counting. This ensured that each
transaction was tracked from the source, financing agent, service provider, uses of the funds
(AIDS spending activity), beneficiaries of the funds and factors of production. Where the flow of
the transaction was not complete, the Excel sheets show the missing data which enabled the data
entry team to track the error. This ensured that the each transaction was complete and that only
expenditures related to each source or financing agent are captured. The data from Excel files
were transferred to Resource Tracking Tool (RTT) by a team of statisticians under the
supervision of the team leader. It provides step-by-step guidance along the estimation process
and makes it easier to monitor crosschecking among the different classification axes. The NASA
RTT results data- bases were then exported to Excel to produce summary tables and graphs for
analysis.

30
2.6.7. Limitations
a) The different sources of funds had different financial years. For instance Government of
Kenya using the fiscal year starting 1st of July and ending 30th of June the following year.
USG uses October-September fiscal year while other sources use calendar year. For the
sources using calendar year such UN agencies, that was required for the years 2009, 2010,
2011 and 2012 and the estimated expenditure for the years 2009/10, 2010/11 and 2011/12
was obtained by summing the expenditure for the two relevant years and diving by two.
For the USG funds the actual figures were used as a proxy for expenditures in each of the
years without any adjustment. The USG expenditures were almost constant during the
three years.
b) Expenditure on training on HIV by public health sector and domestic health sector was not
obtained.
c) Expenditure by private corporations was estimated based on NHA 2009/10 and inflated
only for the years 2010/11 and 2011/10. This may represent an understatement of the
expenditure by this sector. However, it should be noted that this aspect was not within the
scope of the study but was requested when results were being presented.
d) In some instances, expenditure data obtained were to aggregative to allow for details
required in the NASA analysis. This especially so with respect to ASC, beneficiary
populations and factors for production.
31
CHAPTER THREE: RESULTS AND DISCUSSION
3.1 Total Expenditure on HIV/AIDS by Sources of Funding
The main sources of funds for HIV/AIDS in Kenya are the entities that provide money to
financing agents to be pooled and disbursed to service providers. In Kenya, there are four main
sources of funding HIV/AIDS national response, namely: public, international (bilateral),
international (Multilateral), GFATM and private. However, based on the expenditure analysis, it
is evident that the country’s national response to HIV/AIDS relies heavily on external sources of
funding mainly from international organizations.
Table 3.1 presents the total HIV and AIDS expenditure for 2009/10-2011/12 by the major
category sources.

32
Table 3.1: Spending on HIV and AIDS interventions by major source categories
2009/10 2010/11 2011/12 Total
Kshs
million
US$
million
Kshs
million
US$
million
Kshs
million
US$
million
Kshs
million
US$
million
Perc
ent
Public
8,874
114
11,427
139
12,130
137
32,431
389
16
%
Interna
tional
45,980
590
49,150
596
47,497
535
142,627
1,722
70
%
Private
9,483
122
9,811
119
10,123
114
29,417
355
14
%
Total
64,338
826
70,388
853
69,750
786
204,476
2,466
100
%
The results in Table 3.1 show that total expenditure on HIV and AIDS interventions in Kenya
increased from Kshs 64,338 million (US$ 826 million) in 2009/10 to Kshs 70,388 million (US$
853 million) in 2010/11, representing an increase of 9% from the 2010/11 expenditure estimates.
In 2011/12, the expenditure declined slightly to Kshs 69,750 million (US$ 786 million) due a
slight decline in USG and CHAI funding. The total expenditure over the three-year period
amounted to Kshs 204,476 million (US$ 2,466 million). Table 3.1 also shows that international
sources accounted for 70% of the resources followed by Government of Kenya (16%) and
domestic private sources (14%).
Table 3.2 provides a more disaggregated sources of national AIDS spending. The relative
contributions of the different sources are presented in Figure 3.1.
Table 3.2: Actual spending on HIV and AIDS by domestic and external Sources of Funds
2009/10 2010/11 2011/12 Total
Kshs
million
US$
million
Kshs
million
US$
million
Kshs
million
US$
million
Kshs
million
US$
million
Public funds 8,874 114 11,427 139 12,130 137 32,431 389 For-profit institutions
and corporations 1,240
16 1,310
16 1,396
16 3,946 48
Households’ funds 8,243 106 8,501 103 8,727 98 25,471 307 Direct bilateral
contributions 41,150
528 42,810
519 43,346
489 127,307 1,536
GFATM 840 11 1,644 20 966 11 3,450 42
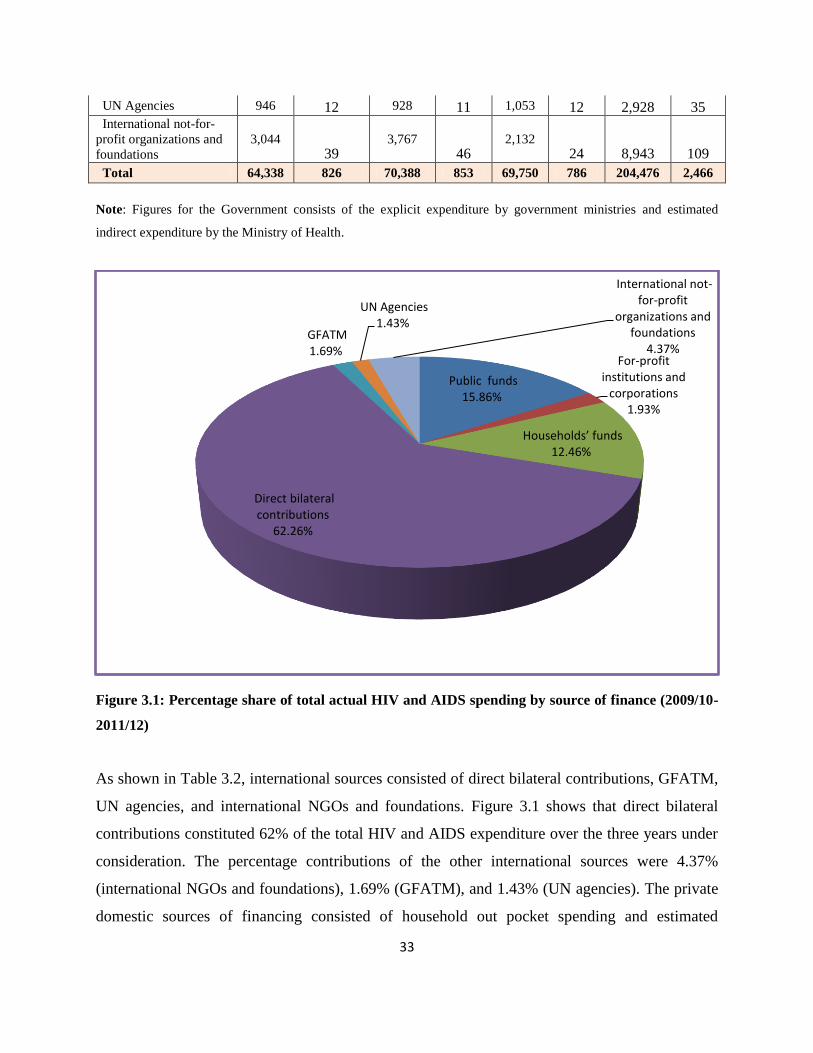
33
UN Agencies 946 12 928 11 1,053 12 2,928 35 International not-for-
profit organizations and
foundations
3,044 39
3,767 46
2,132 24 8,943 109
Total 64,338 826 70,388 853 69,750 786 204,476 2,466
Note: Figures for the Government consists of the explicit expenditure by government ministries and estimated
indirect expenditure by the Ministry of Health.
Figure 3.1: Percentage share of total actual HIV and AIDS spending by source of finance (2009/10-
2011/12)
As shown in Table 3.2, international sources consisted of direct bilateral contributions, GFATM,
UN agencies, and international NGOs and foundations. Figure 3.1 shows that direct bilateral
contributions constituted 62% of the total HIV and AIDS expenditure over the three years under
consideration. The percentage contributions of the other international sources were 4.37%
(international NGOs and foundations), 1.69% (GFATM), and 1.43% (UN agencies). The private
domestic sources of financing consisted of household out pocket spending and estimated
Public funds 15.86%
For-profit institutions and
corporations 1.93%
Households’ funds 12.46%
Direct bilateral contributions
62.26%
GFATM 1.69%
UN Agencies 1.43%
International not-for-profit
organizations and foundations
4.37%

34
expenditure by private institutions and corporations. The households’ sources of funding
accounted for about 13% while private institutions and corporations took 1.93% of the total
spending over the same period.
3.2 HIV/AIDS Expenditure by AIDS Spending Categories and Financing Sources
The AIDS spending categories (ASC) represent a functional classification of all possible
intervention areas of AIDS expenditure incurred by service providers both within and outside the
health sector, as well as out-of-pocket spending. The expenditure by ASC was disaggregated into
eight categories according to the NASA classification (Prevention, Care and Treatment, Orphans
and Vulnerable children (OVCs), Human Resources, Programme Management and
administration, Social Protection and Social Services. Table 3.3, Table 3.4, Table 3.5, and Figure
3.2.
Table 3.3 show expenditure by ASC and by financing major sources for the three years
combined. The percentage expenditure of these sources are presented in Table 3.4.
Table 3.3: Total expenditure by major source categories and ASC, 2009/10-2011/12
Public Private International Total
Kshs
million US$
million Kshs
million US$
million Kshs
million US$
million Kshs
million US$
million
Prevention
11,166
134
200
2
29,935
360
41,437
496
Care and treatment
15,522
186
28,592
345
67,083
811
111,728
1,342
Orphans and
vulnerable children
2,685
32
-
-
8,763
105
11,480
137
Programme
management and
administration
3,058
37
625
8
20,324
246
24,051
290
Human resources - -
-
-
6,998
86
6,998
86
Social protection
and social services - -
-
-
2,554
31
2,554
31
Enabling
environment - -
-
-
5,757
70
5,757
70
HIV and AIDS-
related research - -
-
-
1,212
15
1,212
15
Total
32,431
389
29,417
355
142,626
1,722
205,218
2,466

35
Table 3.4: Total expenditure by major source categories and ASC, 2009/10-2011/12
Public Private International Total
Prevention 27% 0.5% 72% 100%
Care and treatment 13% 26% 61% 100%
Orphans and vulnerable children 24% 0% 77% 100%
Programme management and administration 12% 3% 85% 100%
Human resources 0% 0% 100% 100%
Social protection and social services 0% 0% 100% 100%
Enabling environment 0% 0% 100% 100%
HIV and AIDS-related research 0% 0% 100% 100%
Table 3.3 and Table 3.4 show that international sources accounted for the largest amount and
percentage in all the interventions. However, for treatment and care, the contribution of the
households and private firms took the second position (26%) and government (13%). Table 3.5,
Table 3.6, Table 3.7 and Figure 3,2 provide results of futher disaggregation of the expenditure by
sources.
Table 3.5: Total expenditure by sources and ASC, 2009/10-2011/12 (Kshs millions)
Public
funds
For-profit
institutions
and
corporations
Househol
ds’ funds Bilateral GFATM
UN
Agencies
Internatio
nal not-
for-profit
organizati
ons
Total
2009/10-
2011/12
Prevention 11,166 200 - 28,965 907 30 33 41,301
Care and treatment 15,522 3,121 25,471 60,147 1,819 - 5,117 111,198
Orphans and
vulnerable children 2,685 - - 6,141 - 2,622 - 11,448
Programme
management and
administration 3,058 625 - 19,394 637 253 40 24,007
Human resources - - - 3,342 22 2 3,632 6,998
Social protection and
social services - - - 2,538 - - 16 2,554
Enabling environment - - - 5,567 65 21 104 5,757

36
HIV and AIDS-related
research - - - 1,212 - - - 1,212
Total 32,431 3,946 25,471 127,307 3,450 2,928 8,943 204,476
Table 3.6: Total expenditure by source and ASC, 2009/10-2011/12 (US$ millions)
GOK
For-
profit
instituti
ons and
corpora
tions OOP Bilateral GFATM
UN
Agencies
Internation
al not-for-
profit
organizatio
ns and
foundation
s
Total
2009/10-
2011/12
Prevention 133.92 2.41 - 348.38 10.67 0.36 0.40 496
Care and treatment 186.16 37.61 307.30 727.27 22.20 - 61.24 1,342
Orphans and
vulnerable children 32.49 - - 73.19 - 31.69 - 137
Programme
management and
administration 36.67 7.53 - 234.37 7.73 2.97 0.47 290
Human resources - - - 40.32 0.25 0.02 45.29 86
Social protection
and social services - - - 30.66 - - 0.18 31
Enabling
environment - - - 67.28 0.77 0.24 1.22 70
HIV and AIDS-
related research - - - 14.65 - - - 15
Total 389.25 47.55 307.30 1,536.12 41.61 35.28 108.80 2,466
Table 3.7: Percentage expenditure on ASC by financing sources

37
GOK
For-profit
institutions
and
corporatio
ns
Househol
ds’ funds Bilateral
GFA
TM
UN
Agenc
ies
Internatio
nal not-
for-profit
organizati
ons
Total
2009/1
0-
2011/1
2
Prevention 27% 0.5% 0% 70% 2% 0% 0% 100%
Care and treatment 13% 3% 23% 54% 2% 0% 5% 100%
Orphans and
vulnerable children 23.5% 0% 0% 54% 0% 22.9% 0% 100%
Programme
management and
administration 12% 3% 0% 81% 3% 1% 0% 100%
Human resources 0% 0% 0% 48% 0% 0% 52% 100%
Social protection and
social services 0% 0% 0% 99% 0% 0% 1% 100%
Enabling environment 0% 0% 0% 97% 1% 0% 2% 100%
HIV and AIDS-related
research 0% 0% 0% 100% 0% 0% 0% 100%
Figure 3.2: Percentage share of spending on ASC within financing sources 2009/10-2011/12
0%
10%
20%
30%
40%
50%
60%
70%
80%
90%
100%
HIV and AIDS-related research
Enabling environment
Social protection and social services
Human resources
Programme management and administration Orphans and vulnerable children
Care and treatment
Prevention
38
As shown in Tables 3.5, 3.6, 3.7 and Figure 3.2, the largest share of funding for prevention
activities came from bilateral sources which accounted for 70% or Kshs 28,965 million (US$
348.38 million) followed by the Government of Kenya which contributed 27% or Kshs 11,166
million (US$ 133.92 million). The bulk of funding for care and treatment over the three years
under consideration also came from bilateral sources which accounted for 54% or Kshs 60,147
million (US$ 727 million) followed by households who contributed 23% or Kshs 25,471 million
(US$ 307 million), and Government of Kenya accounting for 14% or Kshs 15,522 million (US$
186 million). The main financing sources for orphans and vulnerable children were from bilateral
sources (54%) followed by UN Agencies (UNICEF) (22.9%) and GOK (22.5%). Expenditure on
human resources came mainly from two sources namely USG (48%) and international not-for-
profit organisations and foundations mainly CHAI (52%).
Overall, treatment and care accounted for the largest share (54%, see Figure 3.3) or Kshs 111.20
billion (US$ 1,342 million) of total expenditure from all the sources. This was followed by
expenditure on prevention activities taking 20% or Kshs 41.31 billion (US$ 496 million).
Programme management and administration accounted for 12% for the combined three years
while orphans and vulnerable children accounted for 6% of the total expenditure.

39
Figure 3.3: Percentage share of HIV/AIDS spending on key intervention areas 2009/10-2011/12
3.3 HIV and AIDS Expenditure Breakdown by Financing Sources and Financing
Agents
This section highlights the key priority areas by the various agents of HIV/AIDS funds in Kenya.
Financing agents refer to entities that manage and use the funds for payment or purchase of
health services, medical supplies and other HIV/AIDS related activities. The financing agents
also decide the type of activity or product to fund or purchase. In Kenya, the main financing
agents include government ministries, parastatals within government ministries, multilateral
agencies managing external resources, country offices of bilateral agencies managing external
resources, international NGOs, and international not-for-profit organizations.
As shown in Figure 3.4, the main financing agents are international purchasing organization,
which accounted for over 56% of the total resources. Public sector agents accounted for between
Prevention 20%
Care and treatment
54%
Orphans and vulnerable
children 6%
Programme management and
administration 12%
Human resources 3%
Social protection and social services
1%
Enabling environment
3%
HIV and AIDS-related research
1%

40
25% and 27%, while local private organizations managed between 16% and 19% of the total
funds.
Figure 3.4: Percentage share of HIV/AIDS spending by main agents categories 2009/10-2011/12
Table 3.8 and Table 3.9 provide detailed breakdown of the expenditure by financing agents.
Table 3.8: Total HIV/AIDS expenditure breakdown by financing agent (Kshs)
2009/10 2010/11 2011/12
24% 27% 25%
16% 16% 19%
60% 58% 56%
0%
10%
20%
30%
40%
50%
60%
70%
80%
90%
100%
2009/10 2010/11 2011/12
FA.01 Public sector FA.02 Private sector FA.03 International purchasing organizations

41
Kshs
millio
n %
Kshs
millio
n %
Kshs
million %
Public sector 15,546
18,850
17,348
Ministry of Health (or equivalent sector
entity) 10,538 16% 12,435 18% 11,875 17%
Ministry of Social Development (or
equivalent sector entity) 1,647 3% 2,087 3% 1,572 2%
Ministry of Finance (or equivalent
sector entity) 4 0.01% 11 0.02% - 0%
Other ministries (or equivalent sector
entities) 173 0.3% 146 0.2% 120 0.2%
National AIDS Commission 1,362 2% 2,155 3% 2,326 3%
Parastatal organizations 1,821 3% 2,015 3% 1,456 2%
Private sector 10,117
11,007
13,516
Private insurance entreprises [other than
social insurance] 1,236 2% 1,305 2% 1,390 2%
Private households’ (out-of-pocket
payments) 8,243 13% 8,501 12% 8,727 13%
Not-for-profit institutions (other than
social insurance) 639 1% 1,187 2% 3,384 5%
Other private financing agents n.e.c. - 0% 14 0.02% 14 0.02%
International purchasing organizations 38,675
40,530
38,886
Country offices of bilateral agencies
managing external resources and
fulfilling financing agent roles 4,510 7% 4,538 6% 4,406 6%
Multilateral agencies managing external
resources 369 1% 405 1% 558 1%
International not-for-profit
organizations and foundations 33,796 53% 35,587 51% 33,922 49%
Total 64,338 100% 70,388 100% 69,750 100%
Table 3.9: Total expenditure HIV/AIDS expenditure breakdown by financing agent (US$)
2009/10 2010/11 2011/12
US$
million
US$
million
US$
million

42
Public sector 200 229 196
Ministry of Health (or equivalent sector entity) 135.33 150.79 133.84
Ministry of Social Development (or equivalent sector entity) 21.16 25.31 17.72
Ministry of Finance (or equivalent sector entity) 0.05 0.14 -
Other ministries (or equivalent sector entities) 2.22 1.77 1.35
National AIDS Commission 17.48 26.14 26.22
Parastatal organizations 23.39 24.43 16.41
Private sector 130 133 152
Private insurance entreprises [other than social insurance] 15.87 15.83 15.67
Private households’ (out-of-pocket payments) 105.86 103.08 98.37
Not-for-profit institutions (other than social insurance) 8.20 14.40 38.15
Other private financing agents n.e.c. - 0.17 0.15
International purchasing organizations 497 491 438
Country offices of bilateral agencies managing external resources
and fulfilling financing agent roles 57.91 55.02 49.66
Multilateral agencies managing external resources 4.74 4.91 6.29
International not-for-profit organizations and foundations 434.01 431.52 382.35
Total 826 853 786
Specifically, international not-for-profit organizations managed the largest share (between 49% and
53%), followed and Ministry of Health (between 16% and18%) and households (about 13%). The share
of funding managed by the National AIDS Commission accounted for 3% over the three years
under consideration. The largest share of funds managed by the public agents came from GOK
budget allocations and direct bilateral contributions. However, the largest source of funds
managed by international not-for-profit organizations and foundations came from direct bilateral
sources.
3.4 Providers of HIV and AIDS Services
This section presents the analysis of providers of HIV/AIDS services. According to the NASA
guidelines, Service Providers are entities or persons that engage directly in the production,
provision and delivery of services against a payment for their contribution. HIV and AIDS

43
services is provided by a number of providers that include the government and other public
entities, private for profit and non-profit organizations, corporate and non-corporate enterprises
and, self-employed persons whose activity falls within the NASA boundaries regardless of a
formal or informal legal status. Table 3.10 and Figure 3.5 provide broad picture of the main
providers of HIV and AIDS related providers of services.
Table 3.10: Summary expenditure by providers of services
2009/10 2010/11 2011/12 Total
Kshs
million
US$
million
Kshs
million
US$
million
Kshs
million
US$
milli
on
Kshs
million
US$
million
PS.01 Public sector
providers
31,046
399
36,820
446
35,622
402
103,489
1,247
PS.02 Private sector
providers
14,126
181
19,680
239
20,999
237
54,805
657
PS.03 Bilateral and
multilateral entities –
in country offices
4,506
58
4,719
57
4,352
49
13,576
164
PS.99 Providers
n.e.c.
14,647
188
9,156
111
8,763
99
32,566
398
PS.5 Rest-of-the
world providers
12
0.16
13
0.16
14
0.16
39
0
Total
64,338
826
70,388
853
69,750
786
204,476
2,466

44
Figure 3.5: Percentages of expenditure by service providers
As shown, public sector remained the largest provider of HIV/AIDS services, accounting for
about 48%, 52% and 51% of the expenditure in 2009/10, 2010/11 and 2011/12 respectively.
Private sector providers took the second largest share of the expenditure accounting for 22%,
28% and 30% of the total HIV/AIDS expenditure. Bilateral and multilateral agencies spend on
average 7% of the total amount in each of the years. It is shown that providers not elsewhere
(n.e.c.) classified also accounted for some significant percentage of the expenditure (23%, 13%
and 13% in 2009/10, 2010/11 and 2011/12 respectively). These providers were mainly
international NGOs providing services directly in the country. The rest of the world providers
took very small percentage (0.02%).
48% 52% 51%
22%
28% 30%
7%
7% 6% 23%
13% 13%
0%
10%
20%
30%
40%
50%
60%
70%
80%
90%
100%
2009/10 2010/11 2011/12
PS.5 Rest-of-the world providers
PS.99 Providers n.e.c.
PS.03 Bilateral and multilateral entities – in country offices PS.02 Private sector providers
PS.01 Public sector providers
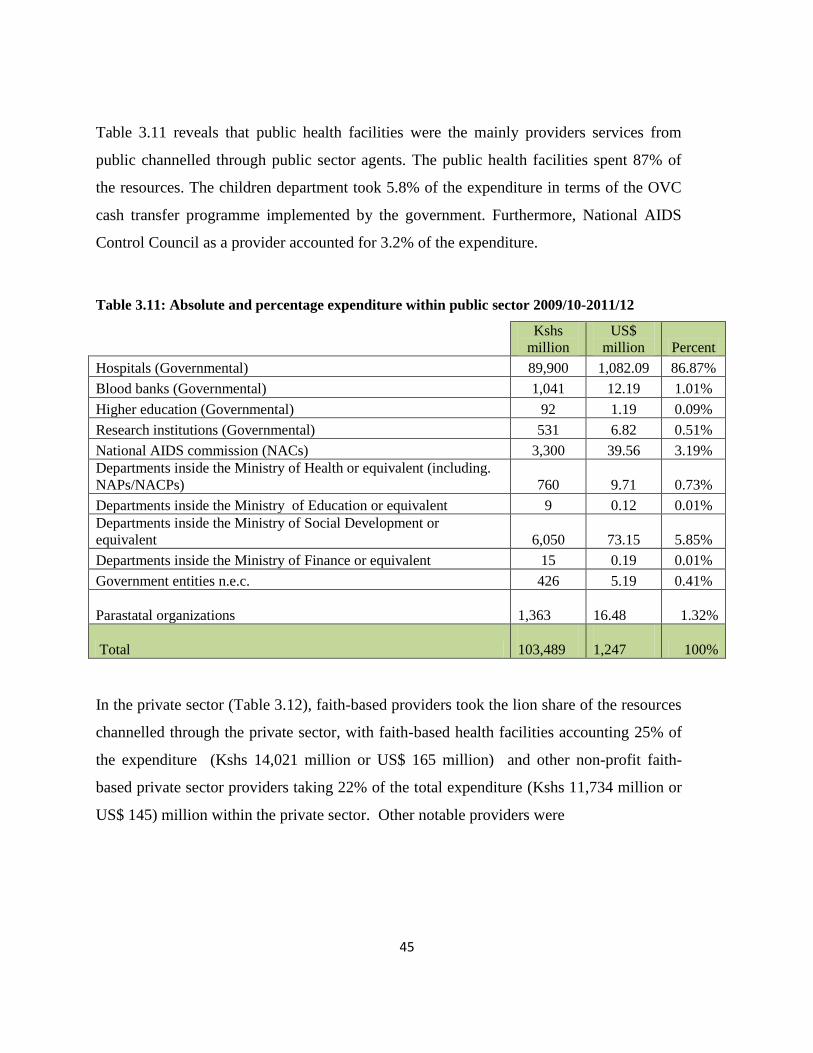
45
Table 3.11 reveals that public health facilities were the mainly providers services from
public channelled through public sector agents. The public health facilities spent 87% of
the resources. The children department took 5.8% of the expenditure in terms of the OVC
cash transfer programme implemented by the government. Furthermore, National AIDS
Control Council as a provider accounted for 3.2% of the expenditure.
Table 3.11: Absolute and percentage expenditure within public sector 2009/10-2011/12
Kshs
million
US$
million Percent
Hospitals (Governmental) 89,900 1,082.09 86.87%
Blood banks (Governmental) 1,041 12.19 1.01%
Higher education (Governmental) 92 1.19 0.09%
Research institutions (Governmental) 531 6.82 0.51%
National AIDS commission (NACs) 3,300 39.56 3.19%
Departments inside the Ministry of Health or equivalent (including.
NAPs/NACPs) 760 9.71 0.73%
Departments inside the Ministry of Education or equivalent 9 0.12 0.01%
Departments inside the Ministry of Social Development or
equivalent 6,050 73.15 5.85%
Departments inside the Ministry of Finance or equivalent 15 0.19 0.01%
Government entities n.e.c. 426 5.19 0.41%
Parastatal organizations
1,363
16.48 1.32%
Total
103,489
1,247 100%
In the private sector (Table 3.12), faith-based providers took the lion share of the resources
channelled through the private sector, with faith-based health facilities accounting 25% of
the expenditure (Kshs 14,021 million or US$ 165 million) and other non-profit faith-
based private sector providers taking 22% of the total expenditure (Kshs 11,734 million or
US$ 145) million within the private sector. Other notable providers were

46
Table 3.12: Absolute and percentage expenditure within private sector 2009/10-2011/12
Kshs
million
US$
million Percent
Hospitals (Non-profit non faith-based) 2,138 24.12 3.67%
Self-help and informal community-based organizations (Non-profit non faith-
based) 7,006 83.97 12.79%
Civil society organizations (Non-profit non faith-based) 634 7.64 1.16%
Other non-profit non-faith-based providers n.e.c. 1,910 23.55 3.59%
Hospitals (Non-profit faith-based) 14,021 165.02 25.13%
Self-help and informal community-based organizations (Non-profit faith-
based) 3,670 41.37 6.30%
Other non-profit faith-based private sector providers n.e.c. 11,734 144.75 22.04%
Other non-profit private sector providers n.e.c. 6,255 75.40 11.48%
Hospitals (For profit) 4,264 51.80 7.89%
Ambulatory care (For profit) 607 7.31 1.11%
Pharmacies and providers of medical goods (For profit) 307 3.70 0.56%
For profit private sector providers n.e.c. 844 10.27 1.56%
Private sector providers n.e.c. 1,417 17.84 2.72%
Total 54,805 657 100%
Further analysis was carried out in terms of financing agents and providers of service.
Table 3.13 and Figure 3.6 show how the agents distributed the funds to different services
providers.
Table 3.13: Expenditure by service providers and agents 2009/10 – 2011/12
FA.01 Public
sector
FA.02 Private
sector
FA.03
International
purchasing
organizations
Total
Kshs
million
US$
million
Kshs
million
US$
millio
n
Kshs
million
US$
million
Kshs
million
US$
million
PS.01 Public sector
providers 46,460 560 17,959 217 39,069 470 103,489 1,247 PS.02 Private sector
providers 5,284 64 16,642 199 32,879 394 54,805 657 PS.03 Bilateral and
multilateral entities – in
country offices - - - - 13,576 164 13,576 164
PS.99 Providers n.e.c. - - - - 32,566 398 32,566 398 PS.5 Rest-of-the world
providers - - 39 0.47 - - 39 0.47
Total 51,744 624 34,641 416 118,091 1,426 204,476 2,466
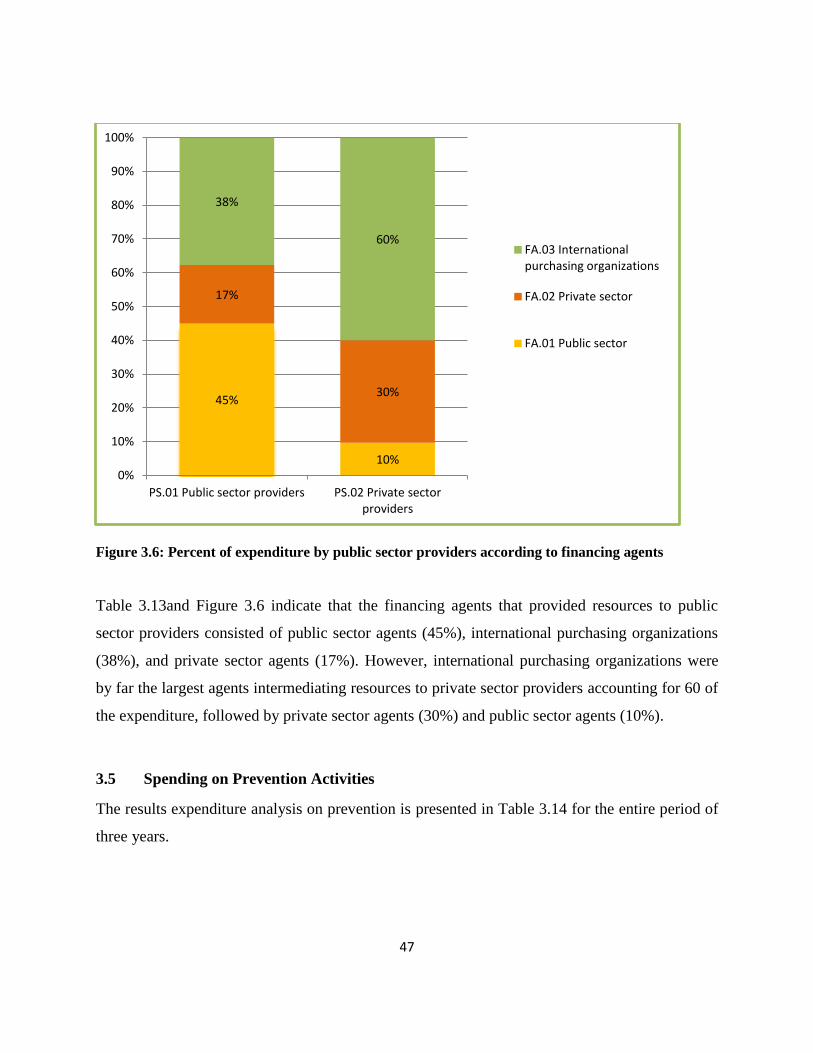
47
Figure 3.6: Percent of expenditure by public sector providers according to financing agents
Table 3.13and Figure 3.6 indicate that the financing agents that provided resources to public
sector providers consisted of public sector agents (45%), international purchasing organizations
(38%), and private sector agents (17%). However, international purchasing organizations were
by far the largest agents intermediating resources to private sector providers accounting for 60 of
the expenditure, followed by private sector agents (30%) and public sector agents (10%).
3.5 Spending on Prevention Activities
The results expenditure analysis on prevention is presented in Table 3.14 for the entire period of
three years.
45%
10%
17%
30%
38%
60%
0%
10%
20%
30%
40%
50%
60%
70%
80%
90%
100%
PS.01 Public sector providers PS.02 Private sector providers
FA.03 International purchasing organizations
FA.02 Private sector
FA.01 Public sector

48
Table 3.14: Expenditure on prevention by service providers 2009/10 – 2011/12
Kshs
million
US$
million Percent
Communication for social and behavioural change 201 2.39 0.5%
Community mobilization 2,935 34.87 7.1%
Voluntary counselling and testing (VCT) 10,304 123.83 24.9%
Risk-reduction for vulnerable and accessible populations 57 0.67 0.1%
Prevention – youth out-of-school 1 0.02 0.004%
Prevention of HIV transmission aimed at people living with HIV
(PLHIV) 65 0.80 0.2%
Prevention programmes for sex workers and their clients 347 4.06 0.8%
Harm-reduction programmes for injecting drug users (IDUs) 6 0.08 0.0%
Programmatic interventions in the workplace not disaggregated by type 424 5.17 1.0%
Condom social marketing 230 2.68 0.6%
Prevention of mother-to-child transmission (PMTCT) 8,280 99.97 20.0%
Male circumcision 4,036 48.78 9.8%
Blood safety 1,567 18.94 3.8%
Post-exposure prophylaxis (PEP) 276 3.35 0.7%
Prevention activities not disaggregated by intervention 12,572 150.54 30.4%
Total 41,301 496 100%
Total expenditure on prevention was Kshs 41.30 billion (US$ 496 million). This total consisted
of about Kshs 12.06 billion (US$ 154.84 nillion) in 2009/10, Kshs 13.67 billion (US$ 165.74
million) in 2010/11 and Kshs 15.57 billion (175.55) in 2011/12.As shown in Table 3.11, testing
and counselling, PMTCT, male circumcision, and community mobilization accounted for the
largest share of the total expenditure. This notwithstanding, prevention activities not
disaggregated by intervention took the largest share. The component was attributed to PEPFAR
EA analysis where this category took the largest share of prevention. This category includes
behaviour change communication, condom distribution among other interventions but the data
was not disaggregated.

49
3.6 Spending on Care and Treatment
Table 3.15 shows that the bulk (46.5%) of spending on care and treatment in the three years went
to ART. Other components that took significant share of the total expenditure were outpatient
health care services (27.5%), inpatient care services (10.6%), specific HIV-related laboratory
monitoring (10.5%), and OI prophylaxis (7.4%).
Table 3.15: Care and treatment expenditure by spending category, 2009/10-2011/12
Kshs
million
US$
millio
n Percent
Provider- initiated testing and counselling (PITC) 2,360 28.53 2.1%
Opportunistic infection (OI) outpatient prophylaxis and treatment 8,212 98.55 7.4%
Second-line ART – adults 1,261 14.87 1.1%
Adult antiretroviral therapy not disaggregated by line of treatment 26,035 314.44 23.4%
Paediatric antiretroviral therapy not disaggregated by line of treatment 7,630 91.97 6.9%
Antiretroviral therapy not disaggregated neither by age nor by line of
treatment 9,051 108.88 8.1%
Nutritional support associated to ARV therapy 657 7.94 0.6%
Specific HIV-related laboratory monitoring 11,344 137.11 10.2%
Psychological treatment and support services 908 11.20 0.8%
Home-based care 1,346 16.57 1.2%
Outpatient care services not disaggregated by intervention 15,508 187.37 13.9%
Outpatient care services n.e.c. 15,109 182.28 13.6%
Inpatient care services not disaggregated by intervention 1,414 17.04 1.3%
Inpatient care services n.e.c. 10,362 125.02 9.3%
TOTAL 111,198 1,342 100%

50
3.7 Spending on Orphans and Vulnerable Children (OVC)
Table 3.16 and Figure 3.7 show the expenditure on different categories of OVC activities.
Table 3.16: OVC expenditure 2009/10-2011/12
2009/10 2010/11 2011/12 Total
Kshs
million
US$
million
Kshs
million
US$
million
Kshs
millio
n
US$
millio
n
Kshs
millio
n
US$
million
OVC Education
266
3.42
669
8.11
650
7.33
1,585
19
OVC Basic health care
236
3.03
592
7.18
575
6.48
1,403
17
OVC Family/home
support
649
8.33
1,267
15.36
1,237
13.95
3,153
38
OVC Social Services and
Administrative costs
1,647
21.16
2,087
25.31
1,572
17.72
5,307
64
TOTAL
2,798
35.93
4,615
55.97
4,034
45.47
11,448
137
OVC Education 14% OVC Basic
health care 12%
OVC Family/home
support 28%
OVC Social services and
administrative costs 46%

51
Figure 3.7: Percent of expenditure on OVC
In 2010, 2011 and 2012 total spending on orphans and vulnerable children amounted to Kshs
2,798 million (US$ 35.93 million), Kshs 4,615 million (US$ 55.97 million) and Kshs 4,034
million (45.47 million), respectively. These shw that expenditure increased between 2009/10 and
2010/11 and declined between 2010/11 and 2011/12. Overall in the three years, the expenditure
was distributed into administrative costs (46%), family/ home support (28%), education (14%),
and health care (12%).
3.8 Spending on Programme Management and Administration
Analysis of expenditure by programme management and administration function is presented in
Table 3.17 and figure 3.8. Table 3.17 shows the trends in expenditure of the variouscategories
while Figure 3.8 presents the percentage of the expenditure by the categories.
Table 3.17: Expenditure on management and administration
2009/10 2010/11 2011/12 Total
Kshs
million
US$
million
Kshs
million
US$
million
Kshs
million
US$
million
Kshs
million
US$
million
Planning, coordination and
programme management 3,211 41 3,693 45 3,663 41 10,567 127
Administration and transaction
costs associated with managing
and disbursing funds 2,317 30 2,325 28 2,258 25 6,899 83
Monitoring and evaluation 526 7 536 6 521 6 1,582 19
Operations research 247 3 245 3 245 3 736 9
Serological-surveillance
(serosurveillance) 112 1 113 1 110 1 335 4
HIV drug-resistance
surveillance 12 0 13 0 12 0 37 0
Drug supply systems 403 5 405 5 394 4 1,202 15
Information technology 659 8 662 8 643 7 1,965 24
Upgrading and construction of
infrastructure 229 3 230 3 224 3 683 8
Total 7,716 99 8,221 100 8,069 91 24,006 290

52
Figure 3.8: Percent of expenditure on programme management and administration
As shown in Table 3.17, total expenditure on management and administration increased between
2009/10 and 2010/11 but declined between 2010/11 and 2011/12. The total expenditure was
Kshs 7,716 million, Kshs 8,221 million, and Kshs 8,069 million in 2009/10, 2010/11, and
2011/12, respectively. The largest share (44%) of the expenditure went planning, coordination
and programme management, followed by administration and transactions costs of managing and
disbursing funds (29%), information technology (8%), monitoring and evaluation (7%), and
drugs supply system (5%).
Planning, coordination and
programme management
44%
Administration and transaction costs associated with managing and
disbursing funds 29%
Monitoring and evaluation
7%
Operations research 3%
Serological-surveillance
(serosurveillance) 1%
HIV drug-resistance surveillance
0.15%
Drug supply systems
5%
Information technology
8% Upgrading and construction of infrastructure
3%

53
3.9 Spending on Other ASC
The expenditure for the three year period by other ASC is shown in Table 3.18.
Table 3.18: Expenditure on other ASC 2009/10 -2011/12
Kshs million US$ million
Human resources 6,998 85.87
Formative education to build-up an HIV workforce 196 2.29
Training 5,038 62.25
Human resources not disaggregated by type 1,764 21.33
Social protection and social services (excluding OVC) 2,554 30.84
Social protection through in-kind benefits 384 4.64
HIV-specific income generation projects 2,170 26.21
Enabling environment 5,757 69.51
Advocacy 180 2.11
AIDS-specific institutional development 3,277 39.60
Programmes to reduce Gender Based Violence 11 0.13
Enabling environment not disaggregated by type 2,290 27.68
HIV and AIDS-related research (excluding operations research ) 1,212 14.65
HIV and AIDS-related research activities not disaggregated by type 1,212 14.65
Total 33,043 402
3.10 HIV/AIDS Expenditures by Beneficiary Groups
The analysis of the Beneficiary Population (BP) aims at estimating resources specifically spent
on a population as part of the service delivery process of a programmatic intervention
(UNAIDS, 2007). Beneficiary population (BP) is a sub-sect of the population that consumes
HIV/AIDS related goods and services.
Figure 3.9 presents expenditure results by the main beneficiary population of the HIV and AIDS
expenditures. The results indicate that people living with HIV accounted for the largest share
(54%) of the expenditure, non-targeted interventions (16%), general population (15%), and other
key population (11%). The percentage share to the most at risk population was very low at
0.22%. However, this was understatement since some of the expenditure on MARPS was not

54
given explicitly. Details of the beneficiary populations and their percentage shares in total
expenditure are given in Table 3.19.
Figure 3.9: Expenditure results by the main beneficiary population
BP.01 People living with HIV (regardless of
having a medical/clinical
diagnosis of AIDS) 54.17%
BP.02 Most at risk populations
0.21%
BP.03 Other key populations
10.35%
BP.04 Specific “accessible” populations
1.85%
BP.05 General population
14.83%
BP.06 Non-targeted interventions
16.20%
BP.99 Specific targeted populations not
elsewhere classified (n.e.c.) 2.40%
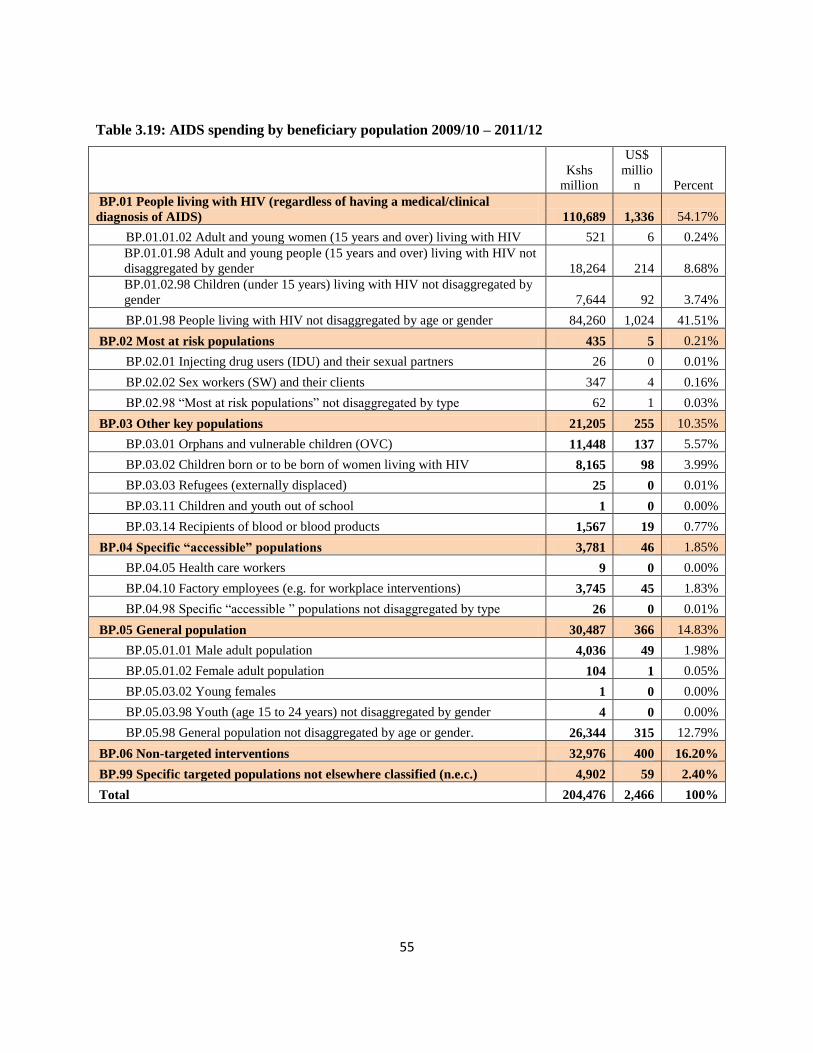
55
Table 3.19: AIDS spending by beneficiary population 2009/10 – 2011/12
Kshs
million
US$
millio
n Percent
BP.01 People living with HIV (regardless of having a medical/clinical
diagnosis of AIDS) 110,689 1,336 54.17%
BP.01.01.02 Adult and young women (15 years and over) living with HIV 521 6 0.24%
BP.01.01.98 Adult and young people (15 years and over) living with HIV not
disaggregated by gender 18,264 214 8.68%
BP.01.02.98 Children (under 15 years) living with HIV not disaggregated by
gender 7,644 92 3.74%
BP.01.98 People living with HIV not disaggregated by age or gender 84,260 1,024 41.51%
BP.02 Most at risk populations 435 5 0.21%
BP.02.01 Injecting drug users (IDU) and their sexual partners 26 0 0.01%
BP.02.02 Sex workers (SW) and their clients 347 4 0.16%
BP.02.98 “Most at risk populations” not disaggregated by type 62 1 0.03%
BP.03 Other key populations 21,205 255 10.35%
BP.03.01 Orphans and vulnerable children (OVC) 11,448 137 5.57%
BP.03.02 Children born or to be born of women living with HIV 8,165 98 3.99%
BP.03.03 Refugees (externally displaced) 25 0 0.01%
BP.03.11 Children and youth out of school 1 0 0.00%
BP.03.14 Recipients of blood or blood products 1,567 19 0.77%
BP.04 Specific “accessible” populations 3,781 46 1.85%
BP.04.05 Health care workers 9 0 0.00%
BP.04.10 Factory employees (e.g. for workplace interventions) 3,745 45 1.83%
BP.04.98 Specific “accessible ” populations not disaggregated by type 26 0 0.01%
BP.05 General population 30,487 366 14.83%
BP.05.01.01 Male adult population 4,036 49 1.98%
BP.05.01.02 Female adult population 104 1 0.05%
BP.05.03.02 Young females 1 0 0.00%
BP.05.03.98 Youth (age 15 to 24 years) not disaggregated by gender 4 0 0.00%
BP.05.98 General population not disaggregated by age or gender. 26,344 315 12.79%
BP.06 Non-targeted interventions 32,976 400 16.20%
BP.99 Specific targeted populations not elsewhere classified (n.e.c.) 4,902 59 2.40%
Total 204,476 2,466 100%

56
3.11 HIV/AIDS Expenditures by Production Factors
According to UNAIDS (2009), NASA the classification of production factors categorizes
expenditures in terms of resources used for the production in terms wages, salaries, materials,
and capital. Expenditure categorised in terms of factors of production is presented in Table 3.20.
Table 3.20: Expenditure by factors of production 2009/10 – 2011/12
Kshs million US$ million Percent
PF.01 Current expenditures 196,779 2,373
PF.01.01 Labour income (compensation of employees and
remuneration of owners) 39,337 474
PF.01.01.01 Wages 7,437 89 4%
PF.01.01.98 Labour income not disaggregated by type 31,814 384 16%
PF.01.01.99 Labour income n.e.c. 85 1 0%
PF.01.02 Supplies and services 113,423 1,369
PF.01.02.01 Material supplies 66,140 798
PF.01.02.01.01 Antiretrovirals 26,805 323 13%
PF.01.02.01.02 Other drugs and pharmaceuticals (excluding
antiretrovirals) 30,865 373 15%
PF.01.02.01.03 Medical and surgical supplies 251 3 0.12%
PF.01.02.01.04 Condoms 85 1 0.04%
PF.01.02.01.05 Reagents and materials 271 3 0.13%
PF.01.02.01.06 Food and nutrients 960 12 0.47%
PF.01.02.01.98 Material supplies not disaggregated by type 6,157 74 3%
PF.01.02.01.99 Other material supplies n.e.c. 745 9 0.36%
PF.01.02.02 Services 46,657 564
PF.01.02.02.01 Administrative services 361 4 0.18%
PF.01.02.02.02 Maintenance and repair services 5 0 0.002%
PF.01.02.02.03 Publisher-, motion picture-, broadcasting and
programming services 675 8 0.33%
PF.01.02.02.04 Consulting services 1,464 18 1%
PF.01.02.02.05 Transportation and travel services 11,064 133 5%
PF.01.02.02.06 Housing services 51 1 0%
PF.01.02.02.07 Logistics of events, including catering services 5,809 70 3%
PF.01.02.02.08 Financial intermediation services 0.25 0 0.0001%
PF.01.02.02.98 Services not disaggregated by type 26,513 319 13%
PF.01.02.02.99 Services n.e.c. 1,341 17 1%
PF.01.98 Current expenditures not disaggregated by type 44,019 530 22%

57
PF.02 Capital expenditures 7,697 93
PF.02.01.98 Buildings not disaggregated by type 2,618 31 1%
PF.02.02.01 Vehicles 874 31 0.43%
PF.02.02.02 Information technology (hardware and software) 2 49 0.001%
PF.02.02.98 Equipment not disaggregated by type 3,217 11 2%
PF.02.02.99 Equipment n.e.c. 0.45 0 0.0002%
PF.02.98 Capital expenditure not disaggregated by type 985 39 0.48%
PF.02.99 Capital expenditure n.e.c. 1.24 0 0.0006%
Total 204,476 2,466 100%
Table 3.20 shows that overall, recurrent expenditure took about 96% and capital expenditure
accounting for about 4% of the total expenditure. Overall, labour income accounted for the
largest percentage (20%), followed by drugs and pharmaceuticals (15%), and ARVs (13%).
There were problems in obtaining much disaggregated data expenditure on items and this
explains the reason for some expenditure given in aggregate categories consisting of current
expenditures not disaggregated by type (22%) and services not disaggregated by type (13%).
3.12 Expenditure by County
An attempt was made to disaggregate expenditure by country. The expenditure disaggregated
excluded the amount spent on the national level (see Table 3.21). The results show that
HIV/AIDS expenditure was Ksh 59 billion (US$ 717 million) in 2010/11 and Kshs 57 billion
(US$ 660 million) in 2011/12.

58
Table 3.21: Distribution of expenditure by county (Kshs million)
2010/11 2011/12
Kshs million US$ million Kshs million US$ million
Baringo County 676 8.20 670 7.55
Bomet County 881 10.68 873 9.84
Bungoma County 1,636 19.83 1,621 18.27
Busia County 489 5.94 485 5.47
Elgeyo - marakwet County 450 5.46 446 5.03
Embu County 403 4.89 399 4.50
Garissa County 449 5.45 445 5.02
Homa Bay County 2,682 32.52 2,658 29.96
Isiolo County 112 1.36 111 1.25
Kajiado County 836 10.14 829 9.34
Kakamega County 1,665 20.19 1,650 18.60
Kericho County 923 11.19 914 10.30
Kiambu County 1,880 22.79 1,863 21.00
Kilifi County 1,509 18.30 1,495 16.85
Kirinyaga County 612 7.41 606 6.83
Kisii County 3,207 38.88 3,178 35.82
Kisumu County 2,696 32.70 2,672 30.12
Kitui County 791 9.59 783 8.83
Kwale County 884 10.72 876 9.87
Laikipia County 486 5.89 481 5.43
Lamu County 138 1.67 137 1.54
Machakos County 858 10.40 850 9.58
Makueni County 690 8.37 684 7.71
Mandera County 739 8.96 733 8.26
Marsabit County 227 2.76 225 2.54
Meru County 1,059 12.84 1,049 11.83
Migori County 2,552 30.95 2,529 28.51
Mombasa County 1,277 15.49 1,266 14.27
Muranga County 1,092 13.24 1,082 12.19
Nairobi County 11,944 144.83 11,836 133.41
Nakuru County 1,951 23.65 1,933 21.79
Nandi County 916 11.11 908 10.23
Narok County 1,035 12.55 1,026 11.56
Nyamira County 1,665 20.19 1,650 18.60
Nyandarua County 691 8.37 684 7.71
Nyeri County 803 9.74 796 8.97
Samburu County 272 3.30 270 3.04
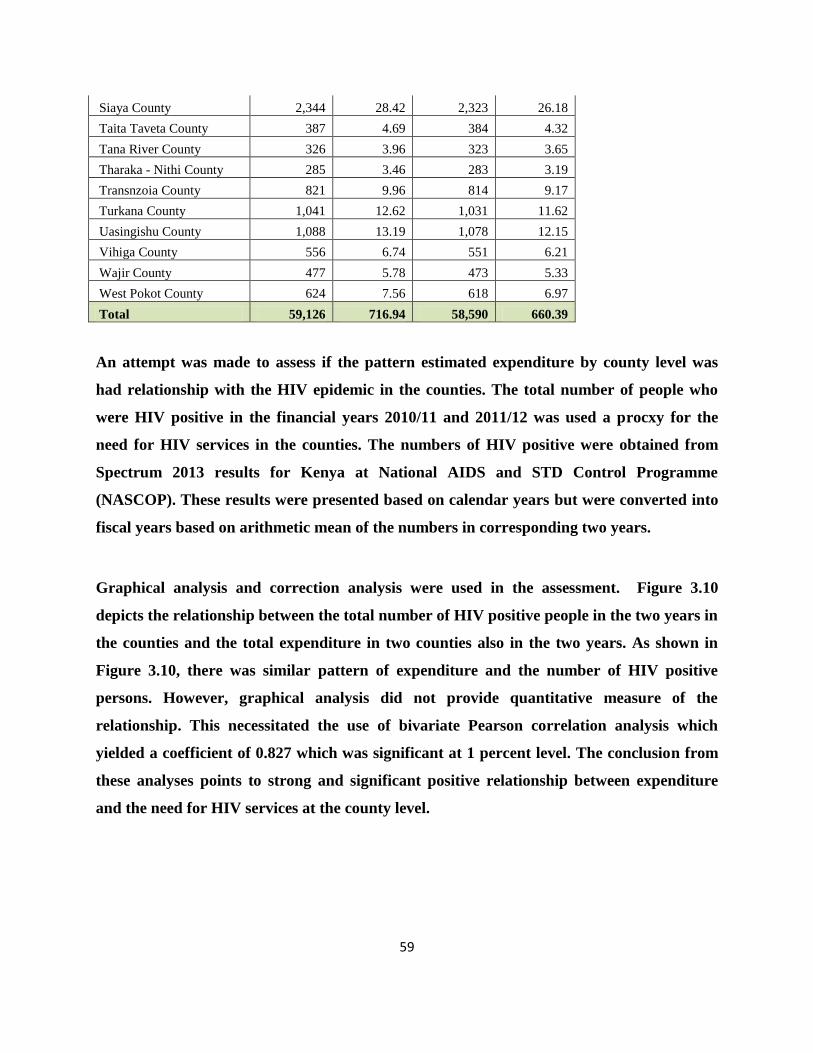
59
Siaya County 2,344 28.42 2,323 26.18
Taita Taveta County 387 4.69 384 4.32
Tana River County 326 3.96 323 3.65
Tharaka - Nithi County 285 3.46 283 3.19
Transnzoia County 821 9.96 814 9.17
Turkana County 1,041 12.62 1,031 11.62
Uasingishu County 1,088 13.19 1,078 12.15
Vihiga County 556 6.74 551 6.21
Wajir County 477 5.78 473 5.33
West Pokot County 624 7.56 618 6.97
Total 59,126 716.94 58,590 660.39
An attempt was made to assess if the pattern estimated expenditure by county level was
had relationship with the HIV epidemic in the counties. The total number of people who
were HIV positive in the financial years 2010/11 and 2011/12 was used a procxy for the
need for HIV services in the counties. The numbers of HIV positive were obtained from
Spectrum 2013 results for Kenya at National AIDS and STD Control Programme
(NASCOP). These results were presented based on calendar years but were converted into
fiscal years based on arithmetic mean of the numbers in corresponding two years.
Graphical analysis and correction analysis were used in the assessment. Figure 3.10
depicts the relationship between the total number of HIV positive people in the two years in
the counties and the total expenditure in two counties also in the two years. As shown in
Figure 3.10, there was similar pattern of expenditure and the number of HIV positive
persons. However, graphical analysis did not provide quantitative measure of the
relationship. This necessitated the use of bivariate Pearson correlation analysis which
yielded a coefficient of 0.827 which was significant at 1 percent level. The conclusion from
these analyses points to strong and significant positive relationship between expenditure
and the need for HIV services at the county level.

60
Figure 3.10: Relatioship between expenditure and number of HIV+ persons in counties
3.13 Qualitative Data Analysis
The quantitative data considered the following issues: Funding process and challenges; adequacy
of funds; bottlenecks in spending; conditions attached to funds; and reporting requirements.
Funding process and challenges
The organizations that provide HIV and AIDS services usually prepare proposals that are
submitted to the financing agents. According to the responses, the main challenge they faced was
the long time it takes between submission of the proposals and the time they actually receive
funding from the agents. It was also noted that the capacity for proposal development is limited
-
50,000
100,000
150,000
200,000
250,000
300,000
350,000
400,000
Bar
ingo
Bu
ngo
ma
Elge
yo M
arak
wet
Gar
issa
Isio
lo
Kak
ameg
a
Kia
mb
u
Kir
inya
ga
Kis
um
u
Kw
ale
Lam
u
Mak
uen
i
Mar
sab
it
Mig
ori
Mu
ran
ga
Nak
uru
Nar
ok
Nya
nd
aru
a
Sam
bu
ru
Tait
a Ta
veta
Thar
aka
Turk
ana
Vih
iga
Wes
t P
oko
t
No. of HIV+ Expenditure (US$ 000s)
61
in many of the organizations that responded to the qualitative questions. Majority of the
respondents were of the opinion that lengthy procedures, failure or delay in submitting the
requisite documents and lack of accountability were the major causes of the bottlenecks faced by
the NGOs since these contribute to delayed disbursement of funds.
Adequacy of funds
Although the quantitative analysis showed that huge financial resources have been mobilized, the
service providers indicated that funds disbursed to them for HIV and AIDS activities were
generally not adequate. As result, most of the funds end up financing staff salaries leaving
limited amounts for actual service delivery. Given this scenario, it would be important to
ascertain the amount the organisations budget for each of the items in the proposal so as to
determine whether the spending is in line with the proposal submitted for funding.
Bottlenecks in spending
The responses indicated that NGOs/CBOs faced capacity challenges in the implementation of the
services. These included limited human resources, unfamiliarity with the procedures and
reporting requirements and lack of and /or poor coordination of their activities leading to
duplication. These contribute to poor planning, procurement procedures and slow
implementation of HIV/AIDS activities. Additionally, sometimes PLWHAs demand for hand-
outs that had not been budgeted for. It was also reported that when the funds are available,
political interference limits the use of the funds because some committee members in some of
the organisations demand allowances.
Conditions attached to funds and reporting requirements
Some of the conditions relate to timely reporting, provision of work plan, spending according to
budget and the strategic plan and audited financial reports. It was revealed that financial reports
are required either on quarterly or annual basis. However, some NGOs and CBOs said they had
capacity gaps in basic record keeping and generally in financial management.

62
Although reporting requirements could enhance effectiveness and efficiency use of the funds is
concerned, there was a feeling that they were demanding given their capacities. Further, there are
different and complicated reporting formats and budget cycles of the different sources.
3.14 Comparison with Kenya NASA 2006/07 and 2007/08
The Kenya NASA report for the financial years 2006/07 and 2007/08 showed total expenditure
for HIV activities was Kshs 21.8 billion (US $ 307.68 million) and in Kshs 23.85 billion (US $
361.86 million) respectively. In the current NASA, total expenditure on HIV and AIDS
interventions was Kshs 64.34 billion (US$ 826 million) in 2009/10, Kshs 70.39 million (US$
853 million) in 2010/11, and Kshs 69,750 million (US$ 786 million) in 2011/12. Although OOP
was not included in the NASA 2006/07 – 2007/08, there is evidence of increasing expenditure
over the years.
In 2006/2007, the percentages by sources were bilateral sources (50%), Government of Kenya
(19%), other international organizations and foundations (13%), multilateral organizations
consisting of Global Fund and UN agencies (12%), and private domestic sources (6%). In
2007/08, the share of bilateral organizations increased to 55% of the total HIV/AIDS spending in
the country while the share of government sources remained constant at 19%) followed by
multilateral sources (11%), other international sources (10%), and private domestic (6%).
In this NASA, direct bilateral contributions constituted 62% of the total HIV and AIDS
expenditure over the three years under consideration. Government source of finance took up 16%
of all HIV expenditure between 2009/10 and 2011/12, while households’ sources of funding
accounted for 13% over the same period. International not-for-profit organisations and
foundations, domestic private sector, GFATM, UN agencies and accounted for 4%, 1.9%, 1.7%
and less than 1% respectively of the total spending over the three year period. It is therefore
evident that over all these years, the majority of financing for activities and programmes related
to HIV and AIDS is accounted for by external sources.

63
Expressed as a percentage of GDP (at current market prices), this level of spending accounted for
1.1% (2007/08) and 1.2% (2006/07) of the total GDP in the country. However, AIDS spending
as percentage of GDP was 2.6% in 2009/10, 2.5% in 2010/11 and 2.1% in 2011/12.
In terms of priorities, there seems that priorities have not changed significantly over the years.
Spending on treatment and care has accounted for the largest share, taking 55% in 2006/07, 63%
in 2007/08, and 54% in 2009/10-2011/12. Prevention accounted for 29% in 2006/07, 24% in
2006/07, and 20% in in 2009/10-2011/12. While programme management and administration
took 8% in 2007/08 and 9% in 2007/08, it increased to 12% in in 2009/10-2011/12
3.15 Comparison of NASA Results and KNASP III Cost Estimates
The comparison of NASA results and cost KNASP III cost estimates, in terms of absolute figures
may not be plausible since KNASP cost estimates were based on certain targets being achieved
while NASA is actual expenditure that do not necessarily relate one on one with KNASP III
target. However, their trends can be compared. Figure 3.11 and Figure 3.12 depict the trends in
terms of Kenya shillings and US dollars respectively.
-
20,000
40,000
60,000
80,000
100,000
2009/10 2010/11 2011/12
Ksh
s m
illio
n
KNASP III NASA

64
Figure 3.11: Trend in KNASP III costs estimates and NASA (Kshs)8
Figure 3.12: Trend in KNASP III costs estimates and NASA (US$)
The figures above present similar trends where actual expenditure was increasing between
2009/10 and 2010/11 and decline slightly between 2011/12. However, KNASP cost estimates
increased in the entire period due to the fact the targets coverage were also increasing in the
period under consideration.
Comparison of the percentages of expenditure and KNASP III cost estimates by broad categories
of interventions is shown in Table 3.22. The table shows actual expenditure was generally
consisted with the expected allocation according to KNASP III. For instance, 20% of total
expenditure was accounted for by prevention while KNASP costing also estimated prevention
would take 20% of the total resource needs. While care and treatment estimated to care and
treatment to take 57% of the resources, NASA revealed actual expenditure was 54% of the total
8 KNASP cost estimates were converted into Kenya shilling using the exchange rates used in NASA analysis of
US$1 = Kshs 77.87 in 2009/10, US$1 = Kshs 82.47 in 2010/11, and US$1 = Kshs 88.72 in 2011/12.
0
200
400
600
800
1000
1200
2009/10 2010/11 2011/12
US
mill
ion
KNASP III
NASA

65
expenditure in the three years. Overall, expenditure was generally aligned to KNASP III cost
estimates in percentage form.
Table 3.22: Shares on interventions in actual expenditure and cost estimates (2009/10-2011/12)
NASA expenditure KNASP III cost estimates
Prevention 20% 20%
Care and treatment 54% 57%
Orphans and vulnerable children 6% 8%
Programme management and administration 12% 15%
Human resources 3% 0.36%
Social protection and social services 1% 0.12%
Enabling environment 3% 0.12%
HIV and AIDS-related research 1% 0.00%
Total 100% 100%
3.16 Institutionalization of NASA
Kenya adopted devolved system of government in which provision of health and social services
are responsibility of the county government. Since HIV and interventions are mainly provided
within the context of health care and other social services, it recommended that NASA analysis
be institutionalized at both national and county level. Under this process, NASA will be carried
out routinely in these two levels of government. In order to achieve this process and have I
implemented, there is need to undertake the following:
1. Governance for HIV resource tracking: The overall responsibility for NASA will be the
Ministry of Health through National AIDS Control Council. This will entail provision,
refining of customized tools and guidelines on HIV resource tracking; design of
mechanism and institutional arrangement for reporting of HIV spending; conducting
regular dialogue with stakeholders including implementers; and developing M&E systems
that endures that HIV spending is captured and be part of the M&E core indicators.

66
2. Strengthening NACC M&E system to capture HIV resource tracking data. Currently
there two tools in the M&E framework that captures various data from implementers.
These are Community Based Program Activity Reporting (COBPAR) Form and sectoral
HIV and AIDS mainstreaming reporting tool on to requires COPBAR and be replicated at
the county level annually. COBPAR requires implementers to indicate sources of funds
they spent on prevention, care and treatment support, social protection, and capacity
building. This tool does require reporting of actual expenditure. It recommended that this
tool be revised to capture actual expenditure in addition to sources of funds. The NASA
tools need to be simplified and incorporated to COPBAR. Additional, mainstreaming
reporting tool data on financial sources as well amount spent on care, treatment and
support for PLHIV and social protection in terms of sources of funds for OVC and IGA.
This tool can also be expended to include NASA components which are customized and
simplified to make friendly to implementers. Furthermore, the NASA tools should be
required to be filled by agents and sources on regular basis.
3. Reporting Frequency. The COPBAR and mainstreaming reporting tools are filled on
quarterly basis by the implementers. Since it was noted that different financial years or
cycles presented some challenges during Kenya NASA, it recommended that HIV tracking
data under different report tools be done on quarterly basis. This will ensure that analysis
can be done easily in terms of government financial year or calendar. The current
arrangement in which CACC Coordinators receive data on quarterly basis from
implementers should be used.
4. Capacity building for HIV/AIDS resource tracking. Institutionalization of NASA will
entail trainings at different levels, starting from NACC M&E staff, county level staff, and
implementers, including financing agents and sources. Currently, PEPFAR is harmonizing
its expenditure analysis with NASA classifications and this analysis is going to be done
routinely. This implies there already existing capacity at PEPFAR, the largest financing
source in the country. The country should tap into this routine analysis to leverage on
routine data collected from the implementers.
5. Financing strategy for HIV/AIDS resources tracking. Since the government and county
government structure will be used, both levels of government should finance the tracking
67
of HIV resources as this is a routine activity. Implementers should factor as part of
administrative cost this component in their budget. In fact, there are already reporting in
the COPBAR and mainstreaming tools.
CHAPTER FOUR
SUMMARY, CONCLUSIONS AND RECOMMENDATIONS
4.1 Summary and Conclusions
The Government of Kenya has initiated a comprehensive prevention, treatment and care so as to
reduce future HIV transmission and meet the growing demand for HIV services. The results have
revealed that substantial amounts of resources have been invested in prevention, treatment and
care. Given the importance attached to “getting better value for money” and the absence of an
institutionalised mechanism to track HIV and AIDS spending, it was important to undertake this
assessment so as to identify what services are being purchased with AIDS-related funding, and
who is benefiting from these resources.
The assessment results shows that total expenditure on HIV and AIDS interventions in Kenya
increased from Kshs 64,338 million (US$ 826 million) in 2009/10 to Kshs 70,388 million (US$
853 million) in 2010/11, representing an increase of 9% from the 2010/11 expenditure estimates.
In 2011/12, the expenditure declined slightly to Kshs 69,750 million (US$ 786 million) due a
slight decline in USG and CHAI funding. The total expenditure over the three-year period
amounted to Kshs 204,476 million (US$ 2,466 million). The results indicated that the bulk of the
expenditures on HIV/AIDS in Kenya came from international sources accounting for about 62%
during the period. Government of Kenya is the second largest source of financing of the HIV
response contributing about 16%. Households, through the out-pocket expenditure, accounted for
about 13% of the total expenditure same period. International not-for-profit organisations and

68
foundations, private sector, GFATM, UN agencies and accounted for 4%, 1.9%, 1.7% and less
than 1% respectively of the total spending over the three year period. It is therefore evident that
the majority of financing for activities and programmes related to HIV and AIDS is accounted
for by external sources.
International purchasing organization as agents accounted for over 56% of funds. The public
sector agents accounted for between 25% and 27% while local private organizations managed
between 16% and 19% of the total funds. Specifically, international not-for-profit organizations
managed the largest share (between 49% and 53%), followed and Ministry of Health (between 16%
and18%) and households (about 13%). The share of funding managed by the National AIDS
Control Council accounted for 3% over the three years under consideration.
The public sector remained the largest service provider, accounting for about 50% of the total
expenditure. Private sector providers took the second largest share (about 28%) of the
expenditure. Bilateral and multilateral agencies spent 7% of the total amount in each of the years.
In terms of the priority interventions, the bulk of the expenditure went to care and treatment
(54%), followed by prevention (20%) and programme management and administration (12%)
and OVC (6%).
People Living with HIV/AIDS (PLWHA) accounted for about 54% of the expenditures as a
beneficiary population. Non-target intervention was the second largest (15%) beneficiary
population followed by general population (11%). The percentage to most at risk population was
very low at 0.22%. Recurrent expenditure took about 96% with capital expenditure accounting
for about 4% of the total expenditure. Overall, labour income accounted for the largest
percentage (20%), followed by drugs and pharmaceuticals (15%), and ARVs (13%).
4.2 Key recommendations

69
(i) Allocative Decisions for Greatest Investment
The NASA results show that generally the high impact interventions consisting of Behaviour
Change Communication (BCC) activities, ART, PMTCT, and male circumcision received
significant funding in the period under consideration. However, other high impact interventions
such as prevention activities on MARPs and prevention through treatment for discordant couples
received less attention in terms of the expenditure. Furthermore, low impact intervention such as
VCT received significant resources. It is recommended that the country should target resources
towards high impact interventions that which maximize benefits.
(ii) Sustainable, Transparent, Accountable and Aligned Funding
As indicated in analysis, bulk of the spending on HIV response was attributed to external
sources. However, contribution by government has been increasing over the years. It is
recommended that government should continue to increase its contribution in order to ensure
sustainability of the national response to HIV and AIDS. Although NACC has continued to
explore domestic and sustainable financing options, there need to actualize some of these options
for sustainability purposes.
Although country comparisons were not done, there is a strong need to undertake a cost-
effectiveness analysis of funds from different sources. Additionally, the funding from all the
sources should be aligned to priority areas. All these would require transparency and
accountability of all those involved in the flow of funds.
(iii) Improving Financial Management Capacity and Systems
The results of qualitative analysis revealed that financial management capacities of the
organizations involved in service delivery at the local level were very low. This is constraining
service delivery and has the potential to seriously reduce the impact of the interventions. It also
affects efficiency in service delivery.
(iv) Institutionalising Routine Expenditure Tracking

70
It was recommended in the previous NASA that institutionalization of NASA is critical. This is
because data availability routine would assist the country to assess the performance of the
response on regular basis. This is also a key component in monitoring whether funding is
aligned to the priority interventions and if not aligned corrective measures can be put in place.
Institutionalization is also needed given the creation of counties in which social services have
been devolved. It is recommended that each county should carry out its own NASA, build their
own capacities and make collect of HIV and AIDS data expenditure a routine.
(v) Additional Research
Expenditure on research was minimal and came from bilateral sources. It is recommended that
more funding be providing for HIV related research.
71
REFERENCES
KNBS (2013). Kenya Facts and Figures 2013. Nairobi: Kenya National Bureau of Statistics.
KNBS (2011). Kenya Facts and Figures 2011. Nairobi: Kenya National Bureau of Statistics.
Mutunga C, E Zula, and R De Souza (2012). Population Dynamics and Climate Compatible
Development in Africa. Washington, DC and Nairobi: Population Action International (PAI)
and African Institute for Development Policy (AFIDEP).
National AIDS and STI Control Programme (2013). Kenya AIDS Indicator Survey
2012: Preliminary Report, Nairobi, Kenya. Nairobi: Ministry of Health, Kenya
National AIDS and STI Control Programme (2010). National Guidelines for HIV Testing and
counselling in Kenya, 2nd Edition, Nairobi, Kenya 2010. http://www.nascop.or.ke
National AIDS and STI Control Programme (2009). Kenya AIDS Indicator Survey
2007: Final Report, Nairobi, Kenya. Nairobi: Ministry of Health, Kenya
National AIDS and STI Control Programme (NASCOP): www.aidskenya.org
National AIDS and STI Control Programme. National Guidelines for Antiretroviral Therapy in
Kenya, 4th Edition, Nairobi, Kenya 2011. http://www.nascop.or.ke.
Republic of Kenya (2011). Economic Survey, 2011. Nairobi: Government of Kenya.
Republic of Kenya (2005). Kenya National AIDS Strategic Plan 2005/06-2009/10. Nairobi:
NACC

72
United Nations Development Programme (2010). “Human Development Indicators: Kenya
Country Profile.” New York: UNDP
Republic of Kenya (2010). “Statistical Abstract.” Nairobi: Government of Kenya
Republic of Kenya (2009). Kenya National AIDS Strategic Plan 2009/10-2012/13. National
AIDS Control Council, Nairobi, Kenya
Republic of Kenya (2009). National Health Accounts 2009/10. Nairobi: Ministry of Medical
Services and Ministry of Public Health and Sanitation.
Republic of Kenya (2009). Kenya National AIDS Strategic Plan III 2009/10 – 2012/13. Nairobi:
NACC
Republic of Kenya (2004). Kenya Demographic Health Survey, 2003 final report.National
Council for Population Development (NCPD) Central Bureau of Statistics (CBS) Ministry of
health
UNAIDS (2007). NASA RTS User’s Guide. Geneva: UNAIDS
UNAIDS (2009). NASA: Classification Taxonomy and Definitions. Geneva: UNAIDS
World Bank (2011). “World Bank Data – Kenya.” Washington, DC: The World Bank.
Government of Kenya.
WHO (2010). PMTCT strategic vision 2010–2015: preventing mother-to-child transmission of
HIV to reach the UNGASS and Millennium Development Goals.