kenya’s climate change action plan: mitigation chapter … 4 sc4_forestry_fin… · kenya’s...
TRANSCRIPT
Kenya’s Climate Change Action Plan: Mitigation
Chapter 4: Forestry Seton Stiebert, Deborah Murphy, Jason Dion and Scott McFatridge (IISD) August 2012
This document is an output from a project funded by the UK Department for International Development (DFID) and the Netherlands Directorate-General for International Cooperation (DGIS) for the benefit of developing countries. However, the views expressed and information contained in it are not necessarily those of or endorsed by DFID, DGIS or the entities managing the delivery of the Climate and Development Knowledge Network*, which can accept no responsibility or liability for such views, completeness or accuracy of the information or for any reliance placed on them. © 2012, All rights reserved * The Climate and Development Knowledge Network (“CDKN”) is a project funded by the UK Department for International Development (DFID) and the Netherlands Directorate-General for International Cooperation (DGIS) and is led and administered by PricewaterhouseCoopers LLP. Management of the delivery of CDKN is undertaken by PricewaterhouseCoopers LLP, and an alliance of organisations including Fundación Futuro Latinoamericano, INTRAC, LEAD International, the Overseas Development Institute, and SouthSouthNorth.
Mitigation Team:
Deborah Murphy, Seton Stiebert, Dave Sawyer, Jason Dion, Scott McFatridge, International Institute for Sustainable Development
Laura Würtenberger, Lachlan Cameron, Raouf Saidi, Xander van Tilburg, Energy Research Centre of the Netherlands
Peter A. Minang, ASB Partnership for the Tropical Forest Margins at the World Agroforestry Centre
Tom Owino, ClimateCare
Peterson Olum
Kenya’s Climate Change Action Plan:
Mitigation Chapter 4: Forestry
The website for Kenya’s Climate Change Action Plan can be accessed at: http://www.kccap.info International Institute for Sustainable Development IISD is a Canadian-based, public policy research institute that specializes in policy research, analysis and information exchange. The institute champions sustainable development through innovation, research and relationships that span the entire world Energy research Centre of the Netherlands ECN develops high-quality knowledge and technology for the transition to sustainable energy management. ECN introduces this knowledge and technology to the market. ECN’s focus is on energy conservation, sustainable energy and an efficient and clean use of fossil fuels. ASB Partnership for the Tropical Forest Margins at the World Agroforestry Centre ASB is the only global partnership devoted entirely to research on the tropical forest margins. ASB aims to raise productivity and income of rural households in the humid tropics without increasing deforestation or undermining essential environmental services. For further information, please contact: Deborah Murphy, IISD Tel: +1-613-238-2296 Email: [email protected] Laura Würtenberger, ECN Tel: +31 88 515 49 48 Email: [email protected]
Table of Contents
4.1 Introduction ..................................................................... 2 4.2 Forestry Sector: Background ............................................ 2 4.3 Development Priorities of the Government of Kenya in the
Forestry Sector ................................................................. 7 4.4 Reference Case .................................................................. 7 4.5 Low-carbon Scenario Analysis ........................................ 12 4.6 Low-carbon Development Options ................................. 14 4.7 Policy Measures and Instruments ................................... 22 4.8 Potential Priority Actions ................................................ 24 Annex 1: Low-carbon Development Option Fact Sheets ......... 25
Reforestation of Degraded Forests ..................................... 25 Restoration of Forests on Degraded Lands ......................... 27 Reducing Deforestation and Forest Degradation ................ 29
Endnotes ............................................................................... 31
Abbreviations
BAU business as usual
CDM Clean Development Mechanism
CGIAR Consultative Group on International Agricultural Research
CO2 carbon dioxide
CO2e carbon dioxide equivalent
FAO Food and Agriculture Organization
FPIC free, prior and informed consent
GDP gross domestic product
GIS geographic information system
IPCC Intergovernmental Panel on Climate Change
ITTO International Tropical Timber Organization
IUCN World Conservation Union
KFS Kenya Forest Service
m3 cubic metre
MEMR Ministry of Environment and Mineral Resources
MRV measurement, reporting and verification
Mt megatonne
NCCRS National Climate Change Response Strategy
NGO non-governmental organization
REDD+ reducing emissions from deforestation and forest degradation and the role of conservation, sustainable management of forests and enhancement of forest carbon stocks
RPP Readiness Preparation Proposal
UNDP United Nations Development Programme
UNEP United Nations Environment Programme
USAID United States Agency for International Development
2
4.1 Introduction
This chapter is part of a larger analysis of low-carbon development options in Kenya, which covers the six mitigation sectors set out in Article 4.1 of the United Nations Framework Convention on Climate Change (UNFCCC): energy, transport, industry, waste, forestry and agriculture. The holistic, sectoral analysis aims to inform Kenya’s National Climate Change Action Plan and provides the evidence base for prioritizing low-carbon development options and developing proposals for Nationally Appropriate Mitigation Actions (NAMAs) and reducing emissions from deforestation and forest degradation and the role of conservation, sustainable management of forests and enhancement of forest carbon stocks (REDD+) actions. The analysis includes a preliminary greenhouse gas (GHG) emissions inventory and reference case projecting GHG emissions to 2030 for the entire Kenyan economy and by sector. The analysis then demonstrates how low-carbon development options can bend down emissions from the proposed reference case in each sector. Recognizing Kenya’s development priorities and plans, the analysis also considers how the various options can contribute to sustainable development. The overall work concludes with the identification of priority actions to enable low-carbon development.
This low-carbon analysis in the forestry and other land use sectors considers natural forestlands, as well as other types of vegetation such as grasslands and bush lands. The forestry and land-use change sector is referred to as the forestry sector in this chapter because transitions in forests, through clearing of forested lands for agriculture, urban development or settlement, as well as wood harvesting, account for most GHG emissions of carbon dioxide (CO2) in the sector.
The analysis considers the impact of human activities that change the way land is used or affect the amount of carbon in existing aboveground biomass, belowground biomass, deadwood/litter and soil carbon pools. The low-carbon options proposed in the forestry sector are closely linked to those in Chapter 3, Agriculture, which looks at emissions and mitigation options through the management of soils on agricultural lands.
4.2 Forestry Sector: Background
4.2.1 Context Forest definition and changes in forest cover
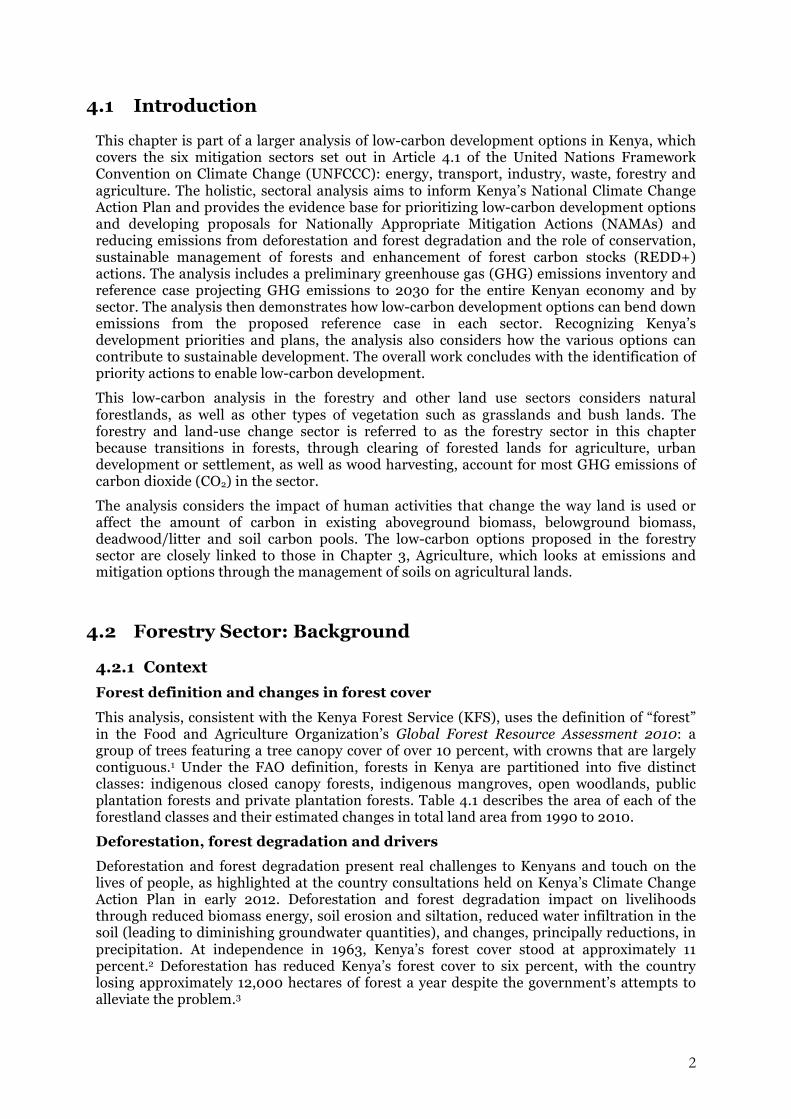
This analysis, consistent with the Kenya Forest Service (KFS), uses the definition of “forest” in the Food and Agriculture Organization’s Global Forest Resource Assessment 2010: a group of trees featuring a tree canopy cover of over 10 percent, with crowns that are largely contiguous.1 Under the FAO definition, forests in Kenya are partitioned into five distinct classes: indigenous closed canopy forests, indigenous mangroves, open woodlands, public plantation forests and private plantation forests. Table 4.1 describes the area of each of the forestland classes and their estimated changes in total land area from 1990 to 2010.
Deforestation, forest degradation and drivers
Deforestation and forest degradation present real challenges to Kenyans and touch on the lives of people, as highlighted at the country consultations held on Kenya’s Climate Change Action Plan in early 2012. Deforestation and forest degradation impact on livelihoods through reduced biomass energy, soil erosion and siltation, reduced water infiltration in the soil (leading to diminishing groundwater quantities), and changes, principally reductions, in precipitation. At independence in 1963, Kenya’s forest cover stood at approximately 11 percent.2 Deforestation has reduced Kenya’s forest cover to six percent, with the country losing approximately 12,000 hectares of forest a year despite the government’s attempts to alleviate the problem.3
3
Table 4.1: Forest cover in Kenya by type, 1990-2010
Name of variable Area (‘000 hectare)
1990 2000 2005 2010
Indigenous closed Canopy 1,240 1,190 1,165 1,140
Indigenous Mangroves 80 80 80 80
Open woodlands 2,150 2,100 2,075 2,050
Public Plantation Forests 170 134 119 107
Private Plantation Forests 68 78 83 90
Sub-total (Forests) 3,708 3,582 3,522 3,467
Source: FAO. 2010. Global Forest Resource Assessment Country Report: Kenya. Rome: FAO. page 9.
The drivers of deforestation in Kenya are diverse, and encompass both direct and indirect pressures. The REDD+ Readiness Preparation Proposal (R-PP) notes that the main drivers of deforestation include conversion to agricultural land in response to demographic pressures, and unsustainable production methods and consumption patterns for charcoal.4 Other drivers include degazetting of forest lands (although steps have been taken to address this, including the 2005 Forest Act), ineffective institutions and enforcement, corruption, illegal logging and, in the case of private local authority forests, unclear land tenure for forest-adjacent peoples.5 Significant degradation has also occurred in gazetted forests because of decades of illegal logging. Similarly, many trustland forests have been degraded due to demand for charcoal, timber and fuelwood.6 The overall demand for wood products is estimated at 37 million cubic metres (m3) a year, while total sustainable supply only stands at 30 million m3 a year, creating an annual demand shortfall of 7 million m3.7
Contribution of forests to Kenya’s economy
Forestry is an important element of Kenya’s economy, contributing approximately one percent to overall GDP, benefiting both the formal and informal economic sectors. The forest sector’s contribution to the national economy is largely unrecorded as most forest products are used for subsistence purposes or are traded in informal markets.8 Officially, the forest sector contributes US$141 million or 1.3 percent to GDP annually. This figure, however, does not include forestry’s contribution in household wood energy and production of non-timber products.9
The forest products manufacturing sector provides some 18,100 direct jobs in Kenya.10 The forestry sector is estimated to have created 300,000 indirect jobs in the mid-1990s in Kenya, with one-tenth of all households living in a five-kilometre radius of forests depending on them to meet their livelihood and subsistence needs.11 Moreover, forest products contribute 7.8 billion Kenyan shillings (KSh) per year, and comprise approximately five percent of the manufacturing sector’s GDP.12 Forests also provide important attractions for the tourism industry because they serve as important wildlife habitats, and as well as provide aesthetic and biodiversity benefits. Moreover, Kenya’s forests provide important ecosystem services such as reduced soil erosion, natural pest control, preservation of water availability, and maintenance of water quality.13
4
Vulnerability to climate change
Kenya’s forestry sector is vulnerable to climate change, which is expected to have important effects on the composition, growth rates and regenerative capacity. The Ministry of Environment and Mineral Resources’ (MEMR) National Climate Change Response Strategy (NCCRS) reports that climatic changes are expected to increase desertification and forest degradation, with adverse impacts on the economic benefits and livelihoods derived from the forestry sector, as well as biodiversity and other environmental services. Such changes in composition will include further spreading of invasive species due to the effects of climate change on forest ecosystems and accelerated growth in selected indigenous tree species Projected increases in average temperatures and protracted droughts will increase the recurrence and magnitude of forest fires, and could increase the ecosystems range of pests and pathogens. In addition, potential temperature increases could also trigger increases in the carbon to nitrogen ratio of many plants, weakening their value as feed and further straining forests and other ecosystems.14
The increase in temperature also may lead to water stress for plants leading to the dominance of drought resistant species. This particularly changes the ecosystem services and functions of moist forests; and those plants not able to cope with the rise in temperature may go extinct, leading to a loss of biodiversity. Animals that depend on such plants will migrate to other countries or die out, which could significantly affect the tourism sector – a major economic sector in Kenya.
Direct climate change impacts on forest biodiversity and ecosystem services are likely to include: changes in phenol – or plant and animal lifecycles - which may lead to loss of synchrony between species; changes in species abundance and distribution (including arrival and loss of species); changes in the composition of plant and animal communities; and changes in ecosystem processes. Climate change will also indirectly impact forest biodiversity and ecosystem services through changes in socio-economic drivers, working practices, cultural values, policies and use of land and other resources. Due to their scale, scope and speed, many could be more damaging than the direct impacts and be difficult for policy to address reactively. The Adaptation chapter of the National Climate Change Action Plan includes a detailed analysis of vulnerabilities and adaptation in the forestry sector.
4.2.2 Structure Governance and administration
The Ministry of Forests and Wildlife is responsible for issues relating to forest policy in Kenya, and also plays a crucial role in education and research. Its forestry-related mandate encompasses:
• Formulating and reviewing forest policy and legislation.
• Working with stakeholders to facilitate sustainable forest management and conservation.
• Promoting conservation education programmes for youth on forestry and environmental issues.
• Devising policies that enable the forestry sector to contribute to Kenya’s socioeconomic development.
• Strengthening and expanding human resource management and infrastructural development for forestry management.
• Facilitating and disseminating forestry-related research.
• Coordinating, overseeing and evaluating subsidiary institutions, including the KFS and Kenya Forestry Research Institute.15
5
The KFS is subordinate to the Ministry of Forests and Wildlife, and oversees all issues relating to forest management in the country, recognizing that policy issues are dealt with at the Ministry level. Divisions within KFS relevant to forest sector management and governance (rather than internal administration) include:
• Enforcement and compliance – Provides security personnel for enforcing the Forest Act 2005 and generally supporting forest sector governance.
• Natural forest conservation and management – Responsible for ecotourism, managing biodiversity and watersheds within Kenya’s natural forests, and issuing licenses for sustainable practices and activities within Kenya’s natural forests.
• Plantation and enterprise – Oversees Kenya’s industrial forest plantations program.
• Forestry Extension Services – Promotes forestry extension within farmlands, agroforestry and farm forestry, and dryland forestry development.
• Legal services – Develops subsidiary legislation and steers their implementation, and formulates policies for mitigating and minimizing legal risks in the forestry sector, among other tasks.
• Kenya Forestry College – Provides training for technical and enforcement personnel, and provides short-term training in natural resource management.16
The Kenya Forestry Research Institute was founded in 1986 as part of the Science and Technology Act (Cap. 250), and is responsible for undertaking and disseminating forestry-related research.17 It also liaises with academic institutions and other organizations for training and capacity-building purposes.18
Tenure systems
The forest sector is comprised of three distinct tenure systems:
• Public Forests – gazetted forests including national parks and national reserves;
• Private Forests – owned by private individuals, businesses or institutions;
• Forests owned by communities – includes lands held in trust by County Authorities on behalf of the local population.19
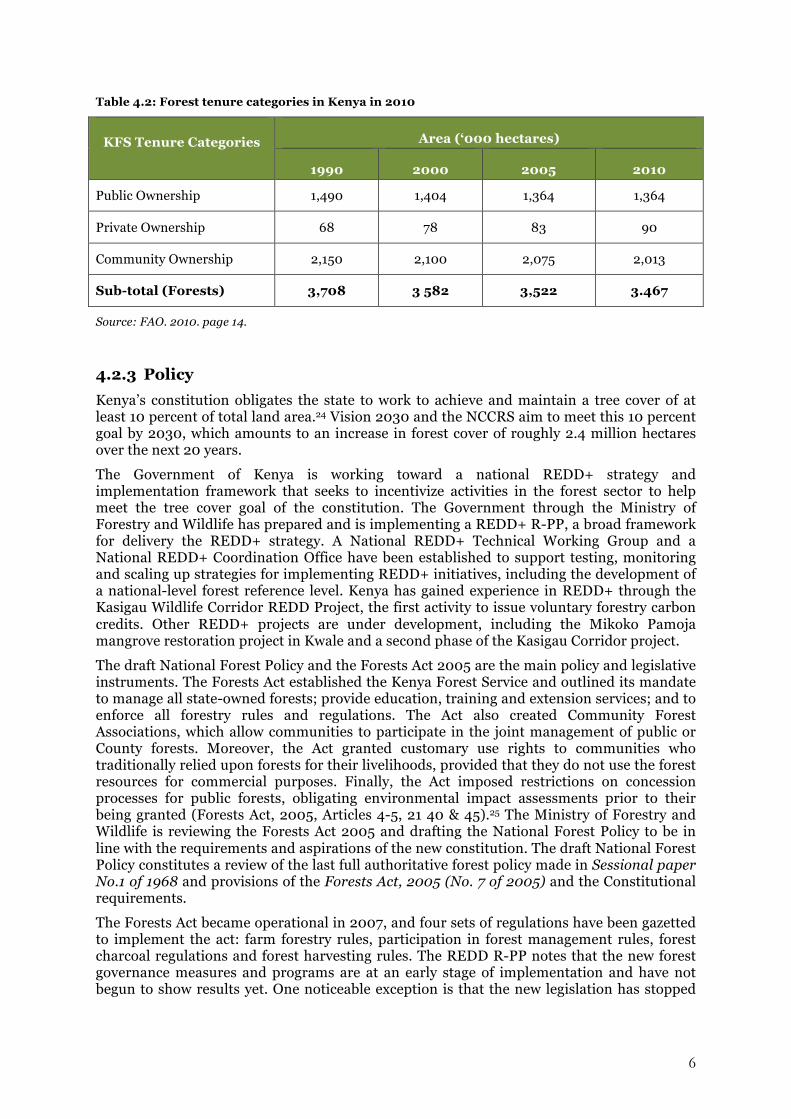
Based on FAO data, community ownership constituted the largest forest tenure system in Kenya in 2010, encompassing approximately 58 percent of the country’s forest area. As detailed in Table 4.2, publicly owned forests were the second largest ownership system at approximately 39 percent, with privately owned forests making up the remaining share at 2.6 percent.
Kenya’s forest industries
Kenya’s forest industries can be categorized on the basis of whether they produce wood or non-wood based products from the forests. The two main wood-based industries are wood and wood products (including charcoal, timber, wood panels, furniture and wood carvings), and pulp and paper products.20 The FAO estimated that, for wood and wood products, Kenya produced approximately 26,400,000 m3 of wood fuel, 17,700 tonnes of wood charcoal, 27,646,000 m3 of roundwood, 1,246,000 m3 of industrial roundwood, 142,000 m3 of sawnwood and 83,000 m3 of wood-based panels. For pulp and paper products, Kenya was estimated to have produced some 450,000 m3 of pulpwood21, and overall pulp and paper production was estimated at 156 tonnes in 2010.22 Kenya’s forests also produce several significant non-wood forest products, including oils, herbal medicine, gums, resins, bamboo and honey, which are important sources of livelihoods and elements of the informal economy. 23
6
Table 4.2: Forest tenure categories in Kenya in 2010
KFS Tenure Categories Area (‘000 hectares)
1990 2000 2005 2010
Public Ownership 1,490 1,404 1,364 1,364
Private Ownership 68 78 83 90
Community Ownership 2,150 2,100 2,075 2,013
Sub-total (Forests) 3,708 3 582 3,522 3.467
Source: FAO. 2010. page 14.
4.2.3 Policy Kenya’s constitution obligates the state to work to achieve and maintain a tree cover of at least 10 percent of total land area.24 Vision 2030 and the NCCRS aim to meet this 10 percent goal by 2030, which amounts to an increase in forest cover of roughly 2.4 million hectares over the next 20 years.
The Government of Kenya is working toward a national REDD+ strategy and implementation framework that seeks to incentivize activities in the forest sector to help meet the tree cover goal of the constitution. The Government through the Ministry of Forestry and Wildlife has prepared and is implementing a REDD+ R-PP, a broad framework for delivery the REDD+ strategy. A National REDD+ Technical Working Group and a National REDD+ Coordination Office have been established to support testing, monitoring and scaling up strategies for implementing REDD+ initiatives, including the development of a national-level forest reference level. Kenya has gained experience in REDD+ through the Kasigau Wildlife Corridor REDD Project, the first activity to issue voluntary forestry carbon credits. Other REDD+ projects are under development, including the Mikoko Pamoja mangrove restoration project in Kwale and a second phase of the Kasigau Corridor project.
The draft National Forest Policy and the Forests Act 2005 are the main policy and legislative instruments. The Forests Act established the Kenya Forest Service and outlined its mandate to manage all state-owned forests; provide education, training and extension services; and to enforce all forestry rules and regulations. The Act also created Community Forest Associations, which allow communities to participate in the joint management of public or County forests. Moreover, the Act granted customary use rights to communities who traditionally relied upon forests for their livelihoods, provided that they do not use the forest resources for commercial purposes. Finally, the Act imposed restrictions on concession processes for public forests, obligating environmental impact assessments prior to their being granted (Forests Act, 2005, Articles 4-5, 21 40 & 45).25 The Ministry of Forestry and Wildlife is reviewing the Forests Act 2005 and drafting the National Forest Policy to be in line with the requirements and aspirations of the new constitution. The draft National Forest Policy constitutes a review of the last full authoritative forest policy made in Sessional paper No.1 of 1968 and provisions of the Forests Act, 2005 (No. 7 of 2005) and the Constitutional requirements.
The Forests Act became operational in 2007, and four sets of regulations have been gazetted to implement the act: farm forestry rules, participation in forest management rules, forest charcoal regulations and forest harvesting rules. The REDD R-PP notes that the new forest governance measures and programs are at an early stage of implementation and have not begun to show results yet. One noticeable exception is that the new legislation has stopped
7
excisions (or a change of change of status from protected to non-protected forest); which was a main cause of public forest destruction.26
The Kenya Forest Service’s medium-term plan for 2009/2010 to 2013/2014 recognizes the importance of sustainable management of forests and the role of forests for improving incomes. The six objectives for KFS are set out below:
• Intensify conservation and sustainable management of forest resources.
• Maintain and enhance the productivity of forest plantations and promote more efficient uses of wood products.
• Advance on-farm and drylands forestry extension.
• Develop and promote technologies for sustainable forest management, tree planting on farms, sustainable use of forest resources and establishment of forest information systems.
• Bolster incomes through sustainable use of forest resources, payments for ecosystem services and ecotourism.
• Enhance institutional capacity and infrastructure.27
4.3 Development Priorities of the Government of Kenya in the Forestry Sector
Enhancing forest cover is a priority of the Government of Kenya. As stated previously, the constitution obliges the government to work and achieve tree cover of ten percent, which amounts to an increase of roughly 2.4 million hectares over the next 20 years. Vision 2030 has five environmental strategies that relate to forestry and this goal:
• Rehabilitating degraded forest areas and promotion of farm forestry;
• Compensating users for environmental services;
• Securing wildlife corridors and migratory routes;
• Improving security of boundaries of protected areas; and
• Upgrading capacity for enhanced geo-information coverage and application.28
Related flagship projects in Vision 2030 are restoration of the five water towers, water catchment management, secure wildlife corridor and migratory routes, and land cover and land use mapping.
Protection and restoration of forests is also an important element of the Government’s medium-term planning. The first Medium Term Plan of Vision 2030 provides for the rehabilitation and protection of forests in Kenya’s five major water catchment forests, and also contains a Trees for Jobs programme that aims to bolster employment for youth.29 Vision 2030 also identifies that forests make important direct and indirect contributions to tourism, which is a crucial pillar for achieving strong economic growth. 30
4.4 Reference Case
This section briefly discusses the methodology, data and assumptions that were used to generate the GHG emissions baseline for the forestry sector between the years 2000 and 2030. This is followed by a discussion of data availability and quality. Finally, emissions are projected out to 2030 to create the reference case against which to measure abatement
8
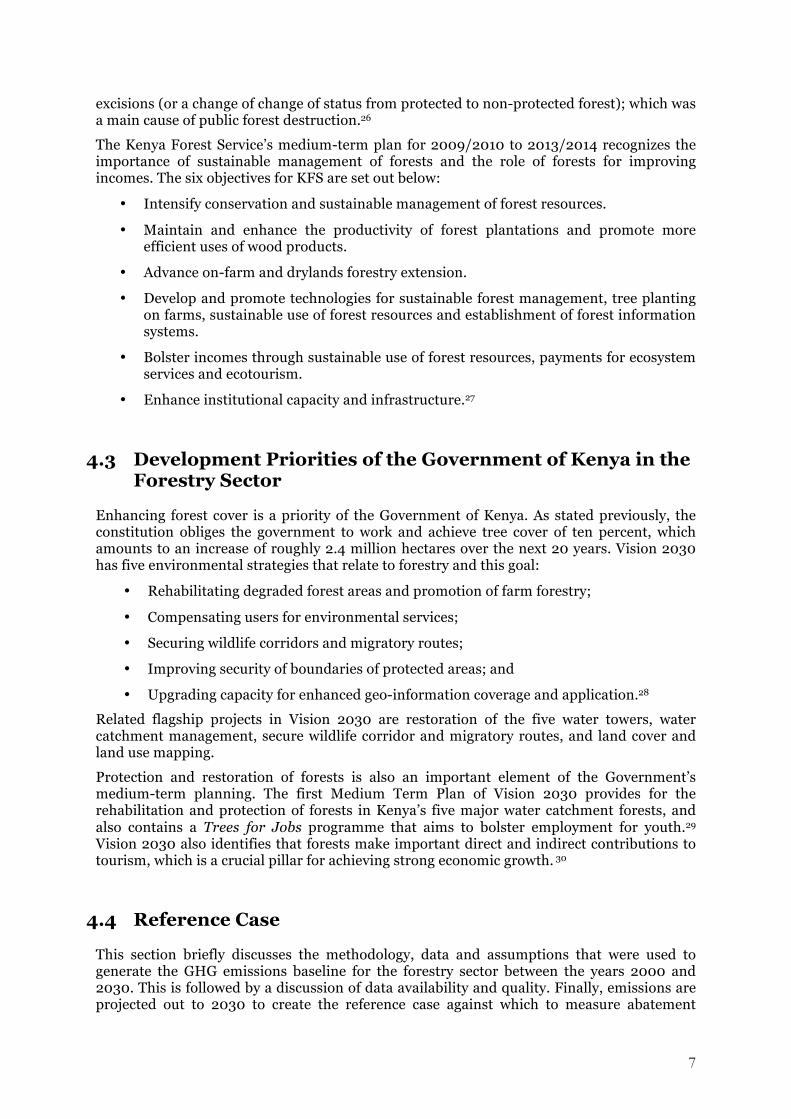
potential. Figure 4.1 illustrates the methodology used to develop the reference case and low-carbon scenario (discussed in Section 4.5).
Figure 4.1: Approach for determining greenhouse gas emissions and mitigation potentials
4.4.1 Emissions reference case methodology This section provides the methodology, data and assumptions that were used to generate a GHG emissions reference case for the forestry sector between the years 2000 and 2030. The reference case uses historical data on land-use changes from 2000 to 2010, which is then projected out to 2030 to provide a business as usual (BAU) reference case of expected emissions to 2030.
The agriculture sector is combined with the forestry and other land use sectors (AFOLU sector) in the IPCC 2006 Guidelines for developing emission inventories.31 This report examines the forestry and other land use sector separately from agriculture to enable an assessment of emissions in the each of the six mitigation sectors set out in Article 4.1(c) of the United Nations Framework Convention on Climate Change. Both sectors involve carbon fluxes as a result of the management of lands to some degree, and efforts have been made to avoid double counting by clearly delineating between the sectors. The forestry sector analysis includes the conversion of non-agricultural land uses to agriculture and the management of plantations. All carbon releases and sinks that are a result of a land conversion from one type to another are included in the forestry sector; however the management of soils on agricultural lands through cultivation and tillage are assessed in the agricultural sector.
The forestry sector does not include energy emissions from fuel combustion related to forest industry activities. These emissions are included in the transportation and household, commercial and industrial energy sectors.
consult government planning documents and literature on Kenya
determine land-‐use and land-‐cover trends and emissions impacts
REFERENCE CASE
Reference emissions
establish most viable low-‐carbon development op@ons for Kenya and their
current status
inves@gate their costs, emissions mi@ga@on poten@al, and scalability
LOW-‐CARBON DEVELOPMENT SCENARIOS
Low-‐carbon development wedges/emissions
9
The emissions baseline presented in this section relies on the FAO projections as well as the underlying data in the “current trends” for deforestation scenario from the Kenya Forestry Master Plan. Using this data as a starting point, a state and transition model – the PATH Kenya model – was developed to consider impacts of wood harvesting, forest fires and land-use changes on an annual basis. The emissions baseline was developed using this model that accounts for land use/land cover (LULC) change. This model and data used are described in the methodology and data and assumptions sections included in Chapter 2, Preliminary Greenhouse Gas Inventory.
Kenya has experienced a long-term trend in the reduction of forest cover, from 11 percent in 1963 to approximately six percent in 2010. The current trend suggests strongly that the Kenya forestry and other land use sectors are a net source of carbon emissions rather than a carbon sink; and this is also the conclusion of the FAO’s Global Forest Resource Assessment Country Report: Kenya (FAO, 2010).32 Actions to meet the goal of the constitution and Vision 2030 are expected to help reverse this trend; however, progress is slow and the reference case does not assume that targets set out in Vision 2030 will be achieved.
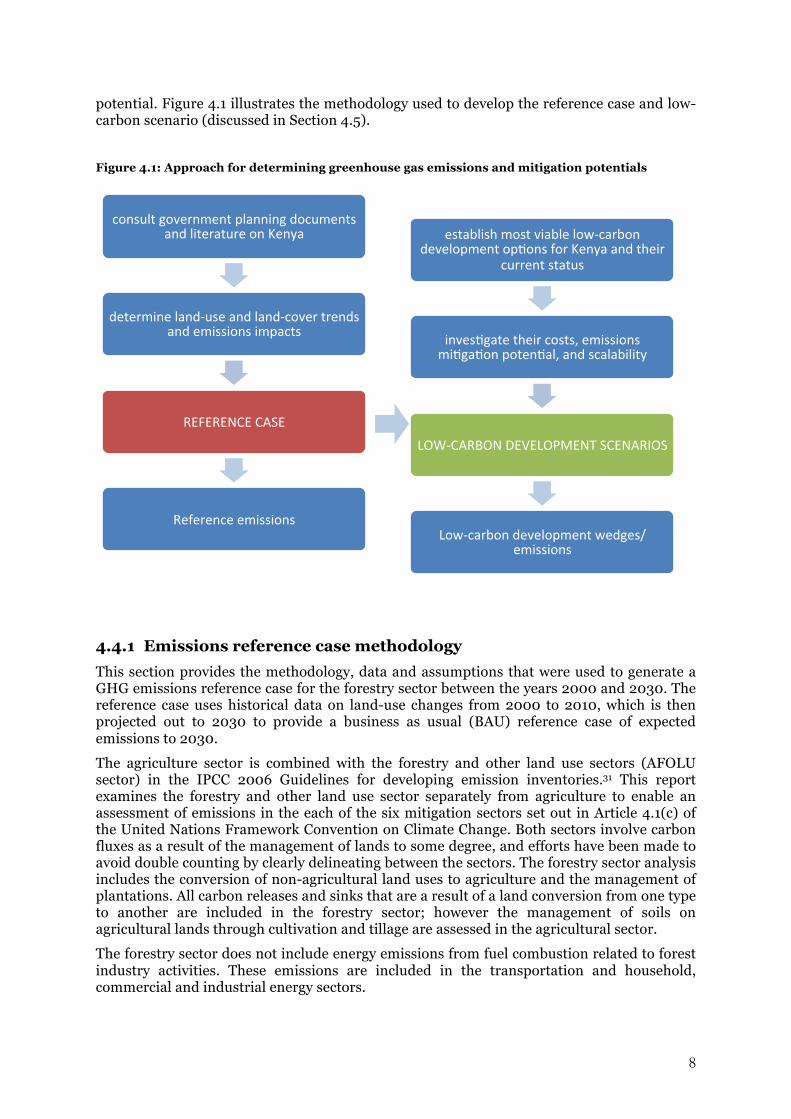
The PATH Kenya modeling results are identified in Figure 4.2, where in 2010 the total carbon in above and below ground biomass is 0.95 gigatonne (Gt) and soil carbon is 3.2 Gt. Given that the models are based on very different methods and data sets this correlation is not unreasonable.
Figure 4.2: PATH model estimates of total carbon in Kenya from 2000 to 2030 (Mt C)
4.4.2 Data availability and quality Greenhouse gas emission trends are hard to determine because of the difficulty in accurately measuring biomass carbon pools for the entire country. Conducting forest and land-use inventories of carbon stocks is complex and the resources required to conduct a detailed forestry inventory is beyond the scope of this project. The Ministry of Forestry and Wildlife is coordinating an multi-sectoral effort to enable more accurate carbon stocks measurements using remote sensing and ground-based inventories; however, this information will not be available until 2013. KFS is engaged in this multi-year forest mapping project with the knowledge that current estimates are not reliable and have a high degree of uncertainty.
The best available data to estimate carbon stocks has been published in the Kenya Forestry Master Plan; however, this information is to a large extent outdated.33 The most recent
0
500
1,000
1,500
2,000
2,500
3,000
3,500
4,000
4,500
2000 2005 2010 2015 2020 2025 2030
MTCO2e
Carbo
n Stock
Soil C
Below-‐ground C
Above-‐ground C
10
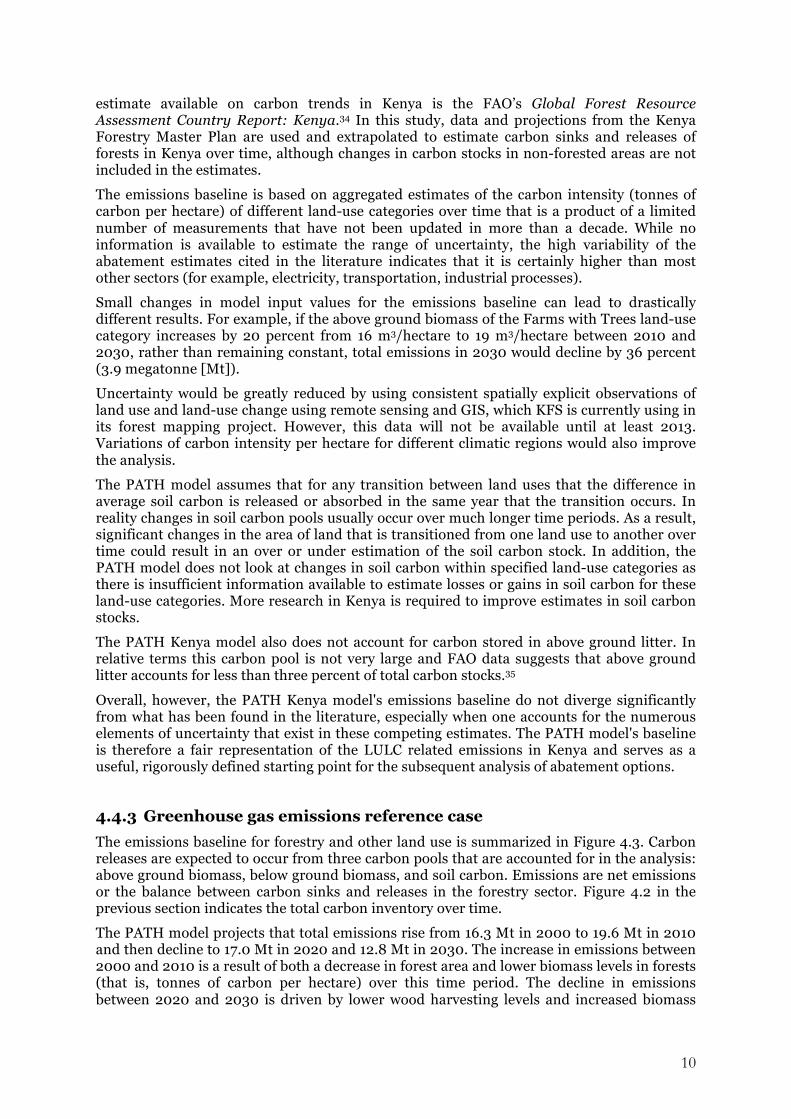
estimate available on carbon trends in Kenya is the FAO’s Global Forest Resource Assessment Country Report: Kenya.34 In this study, data and projections from the Kenya Forestry Master Plan are used and extrapolated to estimate carbon sinks and releases of forests in Kenya over time, although changes in carbon stocks in non-forested areas are not included in the estimates.
The emissions baseline is based on aggregated estimates of the carbon intensity (tonnes of carbon per hectare) of different land-use categories over time that is a product of a limited number of measurements that have not been updated in more than a decade. While no information is available to estimate the range of uncertainty, the high variability of the abatement estimates cited in the literature indicates that it is certainly higher than most other sectors (for example, electricity, transportation, industrial processes).
Small changes in model input values for the emissions baseline can lead to drastically different results. For example, if the above ground biomass of the Farms with Trees land-use category increases by 20 percent from 16 m3/hectare to 19 m3/hectare between 2010 and 2030, rather than remaining constant, total emissions in 2030 would decline by 36 percent (3.9 megatonne [Mt]).
Uncertainty would be greatly reduced by using consistent spatially explicit observations of land use and land-use change using remote sensing and GIS, which KFS is currently using in its forest mapping project. However, this data will not be available until at least 2013. Variations of carbon intensity per hectare for different climatic regions would also improve the analysis.
The PATH model assumes that for any transition between land uses that the difference in average soil carbon is released or absorbed in the same year that the transition occurs. In reality changes in soil carbon pools usually occur over much longer time periods. As a result, significant changes in the area of land that is transitioned from one land use to another over time could result in an over or under estimation of the soil carbon stock. In addition, the PATH model does not look at changes in soil carbon within specified land-use categories as there is insufficient information available to estimate losses or gains in soil carbon for these land-use categories. More research in Kenya is required to improve estimates in soil carbon stocks.
The PATH Kenya model also does not account for carbon stored in above ground litter. In relative terms this carbon pool is not very large and FAO data suggests that above ground litter accounts for less than three percent of total carbon stocks.35
Overall, however, the PATH Kenya model's emissions baseline do not diverge significantly from what has been found in the literature, especially when one accounts for the numerous elements of uncertainty that exist in these competing estimates. The PATH model's baseline is therefore a fair representation of the LULC related emissions in Kenya and serves as a useful, rigorously defined starting point for the subsequent analysis of abatement options.
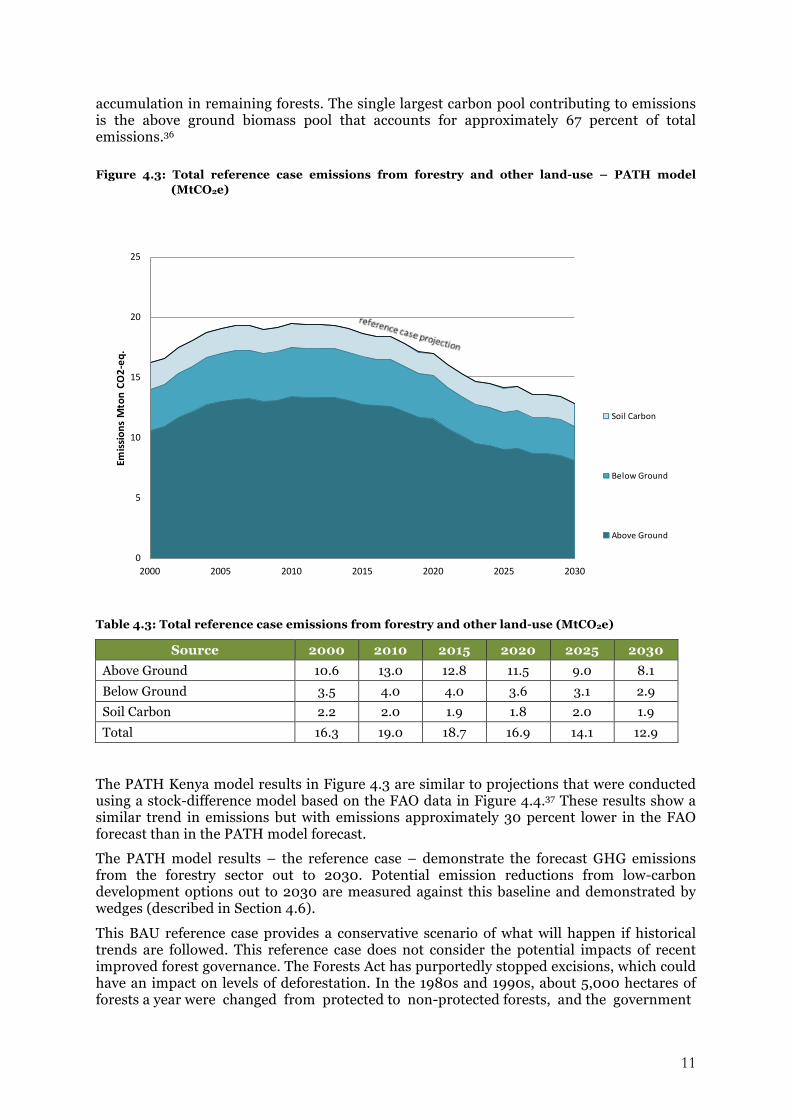
4.4.3 Greenhouse gas emissions reference case The emissions baseline for forestry and other land use is summarized in Figure 4.3. Carbon releases are expected to occur from three carbon pools that are accounted for in the analysis: above ground biomass, below ground biomass, and soil carbon. Emissions are net emissions or the balance between carbon sinks and releases in the forestry sector. Figure 4.2 in the previous section indicates the total carbon inventory over time.
The PATH model projects that total emissions rise from 16.3 Mt in 2000 to 19.6 Mt in 2010 and then decline to 17.0 Mt in 2020 and 12.8 Mt in 2030. The increase in emissions between 2000 and 2010 is a result of both a decrease in forest area and lower biomass levels in forests (that is, tonnes of carbon per hectare) over this time period. The decline in emissions between 2020 and 2030 is driven by lower wood harvesting levels and increased biomass
11
accumulation in remaining forests. The single largest carbon pool contributing to emissions is the above ground biomass pool that accounts for approximately 67 percent of total emissions.36
Figure 4.3: Total reference case emissions from forestry and other land-use – PATH model
(MtCO2e)
Table 4.3: Total reference case emissions from forestry and other land-use (MtCO2e)
Source 2000 2010 2015 2020 2025 2030 Above Ground 10.6 13.0 12.8 11.5 9.0 8.1
Below Ground 3.5 4.0 4.0 3.6 3.1 2.9
Soil Carbon 2.2 2.0 1.9 1.8 2.0 1.9
Total 16.3 19.0 18.7 16.9 14.1 12.9
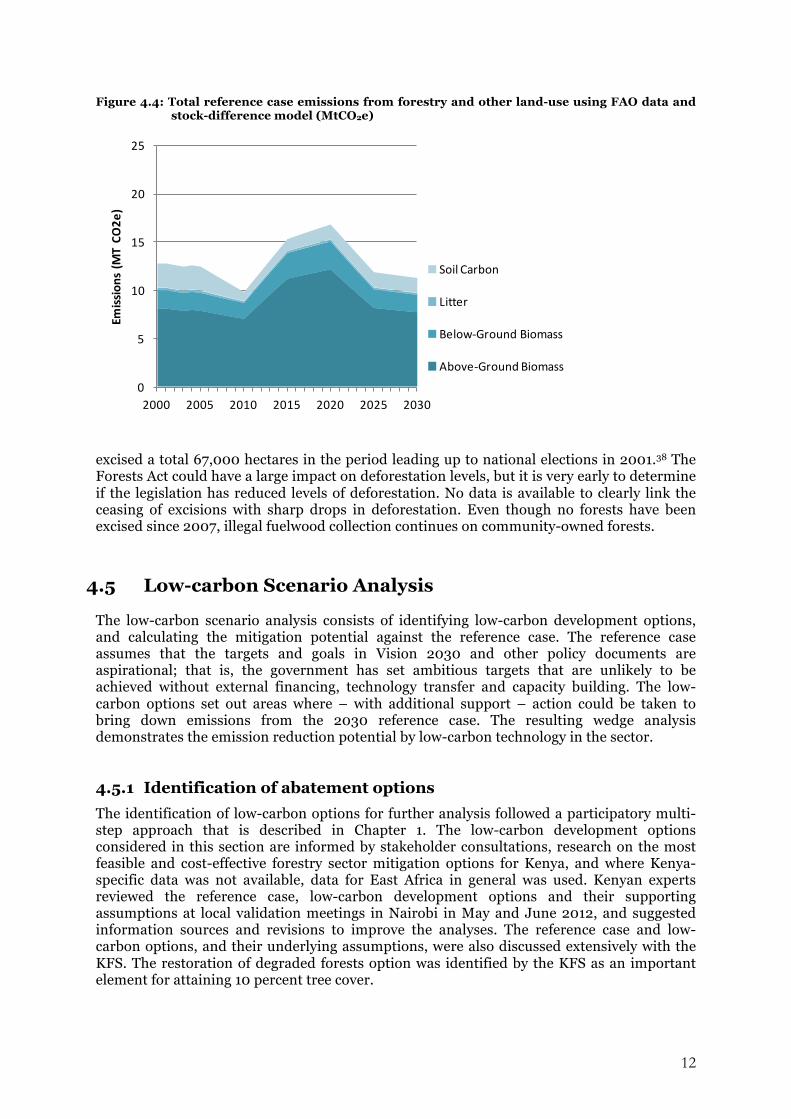
The PATH Kenya model results in Figure 4.3 are similar to projections that were conducted using a stock-difference model based on the FAO data in Figure 4.4.37 These results show a similar trend in emissions but with emissions approximately 30 percent lower in the FAO forecast than in the PATH model forecast.
The PATH model results – the reference case – demonstrate the forecast GHG emissions from the forestry sector out to 2030. Potential emission reductions from low-carbon development options out to 2030 are measured against this baseline and demonstrated by wedges (described in Section 4.6).
This BAU reference case provides a conservative scenario of what will happen if historical trends are followed. This reference case does not consider the potential impacts of recent improved forest governance. The Forests Act has purportedly stopped excisions, which could have an impact on levels of deforestation. In the 1980s and 1990s, about 5,000 hectares of forests a year were changed from protected to non-protected forests, and the government
0
5
10
15
20
25
2000 2005 2010 2015 2020 2025 2030
Emissions M
ton CO
2-‐eq
.
Soil Carbon
Below Ground
Above Ground
12
Figure 4.4: Total reference case emissions from forestry and other land-use using FAO data and stock-difference model (MtCO2e)
excised a total 67,000 hectares in the period leading up to national elections in 2001.38 The Forests Act could have a large impact on deforestation levels, but it is very early to determine if the legislation has reduced levels of deforestation. No data is available to clearly link the ceasing of excisions with sharp drops in deforestation. Even though no forests have been excised since 2007, illegal fuelwood collection continues on community-owned forests.
4.5 Low-carbon Scenario Analysis
The low-carbon scenario analysis consists of identifying low-carbon development options, and calculating the mitigation potential against the reference case. The reference case assumes that the targets and goals in Vision 2030 and other policy documents are aspirational; that is, the government has set ambitious targets that are unlikely to be achieved without external financing, technology transfer and capacity building. The low-carbon options set out areas where – with additional support – action could be taken to bring down emissions from the 2030 reference case. The resulting wedge analysis demonstrates the emission reduction potential by low-carbon technology in the sector.
4.5.1 Identification of abatement options The identification of low-carbon options for further analysis followed a participatory multi-step approach that is described in Chapter 1. The low-carbon development options considered in this section are informed by stakeholder consultations, research on the most feasible and cost-effective forestry sector mitigation options for Kenya, and where Kenya-specific data was not available, data for East Africa in general was used. Kenyan experts reviewed the reference case, low-carbon development options and their supporting assumptions at local validation meetings in Nairobi in May and June 2012, and suggested information sources and revisions to improve the analyses. The reference case and low-carbon options, and their underlying assumptions, were also discussed extensively with the KFS. The restoration of degraded forests option was identified by the KFS as an important element for attaining 10 percent tree cover.
0
5
10
15
20
25
2000 2005 2010 2015 2020 2025 2030
Emissions (M
T CO
2e)
Soil Carbon
Litter
Below-‐Ground Biomass
Above-‐Ground Biomass
13
The low-carbon development options were identified and assessed in term of their:
• Mitigation impact and domestic potential;
• Development impacts and alignment with government priorities;
• Costs and other barriers;
• Feasibility and social acceptability of implementation; and
• Eligibility for climate finance.
Research and consultation resulted in the identification of three low-carbon development options in the forestry sector:
• Restoration of Forests on Degraded Lands;
• Reforestation of Degraded Forests; and
• Reducing Deforestation and Forest Degradation.
In addition to these low-carbon development options, agroforestry is considered in Chapter 3, Agriculture because it occurs only on farmlands and directly impacts the livelihood of farmers. Complementary measures to reduce deforestation and forest degradation, such as improved cookstoves and improved charcoal production systems, were identified at the local validation meeting. These are discussed in Chapter 6, Energy Demand and Chapter 8, Industrial Processes, respectively.
4.5.2 Calculation of abatement potentials and costs The low-carbon scenario examined the abatement potentials and costs of the identified options. Research was undertaken to find information on emissions abatement, costs, and co-benefits for the identified low-carbon options. Studies specific to Kenya and East Africa were often difficult to find; as such, the literature review also considered studies that focused on African countries similar to Kenya or Sub-Saharan Africa as a whole. Additional sources included economic analyses and modeling exercises for forest conservation, as well as academic articles estimating mitigation potentials and costs. Studies on Clean Development Mechanism (CDM) afforestation and reforestation, and REDD+ activities were emphasized because of their rigorous emissions reporting methodologies. Projects and studies with rigorous abatement figures and costs were selected for further analysis.
The first step in estimating the overall scope of each low-carbon development option was assembling the best available information on the existing prevalence of the practice or technology. Based on the research, conservative assumptions were made about the economically, socially and biophysically feasible scale of implementation.
Scenarios were then developed by calculating the mitigation potential of each low-carbon development option. Reasonable average abatement potentials (that is, average tonnes of carbon sequestered per hectare annually) were identified in the literature and the figures for each of the low-carbon development options were averaged to arrive at estimated abatement values. Mitigation potential was calculated by multiplying the aggregated net abatement potential by the project’s expected lifetime, as well as by the size of the project area (expressed in hectares). All mitigation potentials were stated in terms of their starting and ending level of absolute emissions mitigation; and were apportioned equally across the time period of the action (see the fact sheets in Annex 1 for more detail).
This might overestimate the mitigation potential in the early years, for example for reforestation where young trees absorb less carbon, but allowed for a standardized approach across the low-carbon options. The associated mitigation potential is not considered beyond 2030, although further emissions reductions would be realized for some time in the future. The mitigation potential was set out as a wedge against the baseline in the reference case to
14
illustrate how the low-carbon development option would reduce emissions (illustrated in Section 4.6.3).
Mitigation costs in tonnes of CO2e per year were identified in the literature for similar projects and assumptions (explained in Section 4.6.4 and in the fact sheets in Annex 1) were made to identify the most appropriate costs for the low-carbon development options. Since many of the cost estimates were derived from case studies of CDM and REDD+ activities, the measurement, reporting and verification (MRV) costs were assumed to be included within the estimated per tonne CO2e mitigation costs. The aggregate cost to implement the low-carbon option up to 2030 was also calculated, assuming a constant cost over the time period.
4.5.3 Data availability and uncertainties The calculation of abatement potential of the low-carbon development options was impacted by limited data. Abatement potential and costs were informed by the literature on REDD+, forest conservation and reforestation, as well as CDM and REDD+ documentation for activities in in Kenya and Sub-Saharan Africa.
Reasonable average abatement potentials (that is, average tonnes of carbon sequestered per hectare annually) were identified and the figures for each of the low-carbon development options were averaged to arrive at estimated abatement values. However due to variation in cited abatement estimates, actual abatement potentials could vary within ±40 percent of the average used in this low-carbon assessment.
Limited data impacted the estimation of abatement costs, and Kenyan examples were not always available. The costs of reducing deforestation and forest degradation were derived from studies reviewing the economics of REDD+ and land-use change in other countries and regions of Sub-Saharan Africa. For restoration of degraded forests, the costs were based on two Kenyan CDM sub-projects; and the costs of restoration of degraded forests were based on one Kenyan study. Consequently, abatement costs are very uncertain due to the limited set of cost estimates available, the variation in costs encountered in the review, and the heterogeneity of the projects and studies used for these estimates. As such, actual costs could vary by up to ±2o percent.
4.6 Low-carbon Development Options
This section provides some background context for each of low-carbon development options, explaining their current status and potential. The results of the analysis are then described in six sections:
• Scenarios;
• Mitigation potentials;
• Costs;
• Development benefits;
• Climate resilience; and
• Feasibility of implementation.
4.6.1 Context The Government’s goal of attaining 10 percent forest cover by 2030 from approximately six percent in 2012 signals a large scope for possible low-carbon interventions. Halting
15
deforestation, coupled with ambitious forest restoration and reforestation initiatives could increase net forest cover and make Kenya’s forests a net sink of CO2 by 2030, rather than a significant emitter. The previous extent of forest cover in Kenya demonstrates that these measures are biophysically feasible, with the principal barriers being technical, cultural and economic – for which there are potential solutions, discussed in section 5.3. The three low-carbon development options in the forestry sector are described below. These options are complemented by the agroforestry low-carbon development option, discussed in Chapter 3, Agriculture.
Restoration of Forests on Degraded Lands – Degraded lands refer to all types of land uses — including grazing lands, bushlands, woodlands and forests — where previously established tree cover has been reduced and degraded by excessive harvesting of wood and non-wood products, poor management, repeated fires, grazing or other disturbances that damage soil and vegetation to a degree that inhibits or severely delays the re-establishment of forest.39 Restoration will accelerate natural successional processes by removing or reducing barriers to natural forest regeneration such as soil degradation, competition with weedy species and recurring disturbances, such as grazing, wood harvesting and fire. Natural regeneration is unlikely without some form of protection and intervention. In some areas, forests can regenerate naturally on degraded land with sustainable management interventions that allow for regeneration from ground-stored and wind-blown seeds, as well as growth of trees that have been stunted because of excessive grazing. Restoration focuses on restoring the goods, services and ecological processes that forests can provide.40
Forest restoration and the sustainable enhancement of forest carbon stocks through sustainable forestry management or conservation falls within the “plus” scope of REDD+ and could be part of the government’s REDD+ strategy. Data is patchy on the extent of forest on degraded lands, and isolated studies have not been aggregated into meaningful estimates at a national scale.41
Reforestation of Degraded Forests – Reforestation involves planting trees on lands that were once forests, but have been converted to non-forest land by human activities, such as woodfuel harvesting. The tree cover is significantly diminished and natural regeneration inhibited. Several groups are involved in tree-planting efforts in Kenya, and the government supports an annual tree-planting campaign. The Green Belt Movement spearheads three CDM initiatives: Aberdare Range/Mt. Kenya Small Scale Reforestation Initiatives (located in Kirimara-Kithithina, Kamae-Kipipiri, and the Kibaranyeki areas respectively); the Clean Air Action Corporation is implementing five International Small Group and Tree Planting Programs in the Central, Rift Valley, and Eastern Provinces; and Eco2librium is implementing one CDM project, Forest Again Kakamega project. The KFS has instituted a tree planting target of 6,000 hectares per year for plantation development, which does not cover the rehabilitation of degraded sites and farm forestry. The KFS programme has been constrained by lack of resources and not met the target of 6,000 hectares per year. Despite ongoing efforts to encourage tree planting, there is no national data as to the extent of reforestation and tree planting initiatives; that is, the actual area reforested through such initiatives per year.
Reducing Deforestation and Forest Degradation – The reducing deforestation and forest degradation component of REDD+ includes measures to reduce emissions from deforestation and forest degradation, relative to a pre-determined reference case or BAU scenario. Strategies adopted by REDD+ projects include protecting forests, identifying and supporting alternative livelihood opportunities (such as ecotourism and production of high-value export products), establishing incentive schemes which compensate communities for forest conservation, and promoting the sustainable use of timber and non-timber forest products. Strategies have included improved cookstoves, provision of timber and fuelwood through agroforestry, and sustainable charcoal production. These latter three measures are included as low-carbon development options in the agriculture, energy demand and
16
industrial processes sectors, discussed in Chapters 2, 6 and 8, respectively. They are not included in this forestry low-carbon option to avoid double-counting.
4.6.2 Scenarios Scenarios for each low-carbon development option – examining emissions, mitigation costs, appropriate scale, and timeframe – are presented below. The starting point for the assumptions underlying the first two options is the target to increase Kenya’s forest cover from six percent to 10 percent, which would involve reforestation or regenerating forests on 2.4 million hectares of land.
Restoration of Forests on Degraded Lands – Assuming half of the 10 percent tree cover is achieved by 2030 would mean that 1.2 million hectares of forest are established in fifteen years. Consultations with KFS experts determined that 80 percent of this amount, or approximately 960,000 hectares, could be attained through enhanced natural regeneration of degraded lands through conservation and sustainable management, whereas the other 20 percent could be attained through tree planting.
Reforestation of Degraded Forests – Assuming that 20 percent of net increase in forest cover would be achieved through reforestation, 240,000 hectares would need to be replanted over a period of fifteen years, or approximately 16,000 hectares per year between 2015 and 2030.
Reducing Deforestation and Forest Degradation – Increasing Kenya’s forest cover to 10 percent would also entail halting and eventually reversing deforestation and forest degradation, such that net forestation would increase. The historic rate of deforestation as indicated by FAO data between 1990 and 2010 has been approximately 12,000 hectares per year.42 Decreasing the rate of deforestation for extant forest lands by 50 percent would result in 63,000 hectares of reduced deforestation by 2030, or an average of approximately 4,000 hectares per year between 2015 and 2030.
4.6.3 Mitigation potentials The mitigation potential of each low-carbon development option was calculated by taking the reference case for emissions from land use and land cover changes (for example, tree felling for wood fuel and clearing of forests for agriculture), and then determining how much the low-carbon development option could reduce emissions relative to the baseline. All mitigation potentials are stated in terms of their starting and ending level of absolute emissions mitigation.
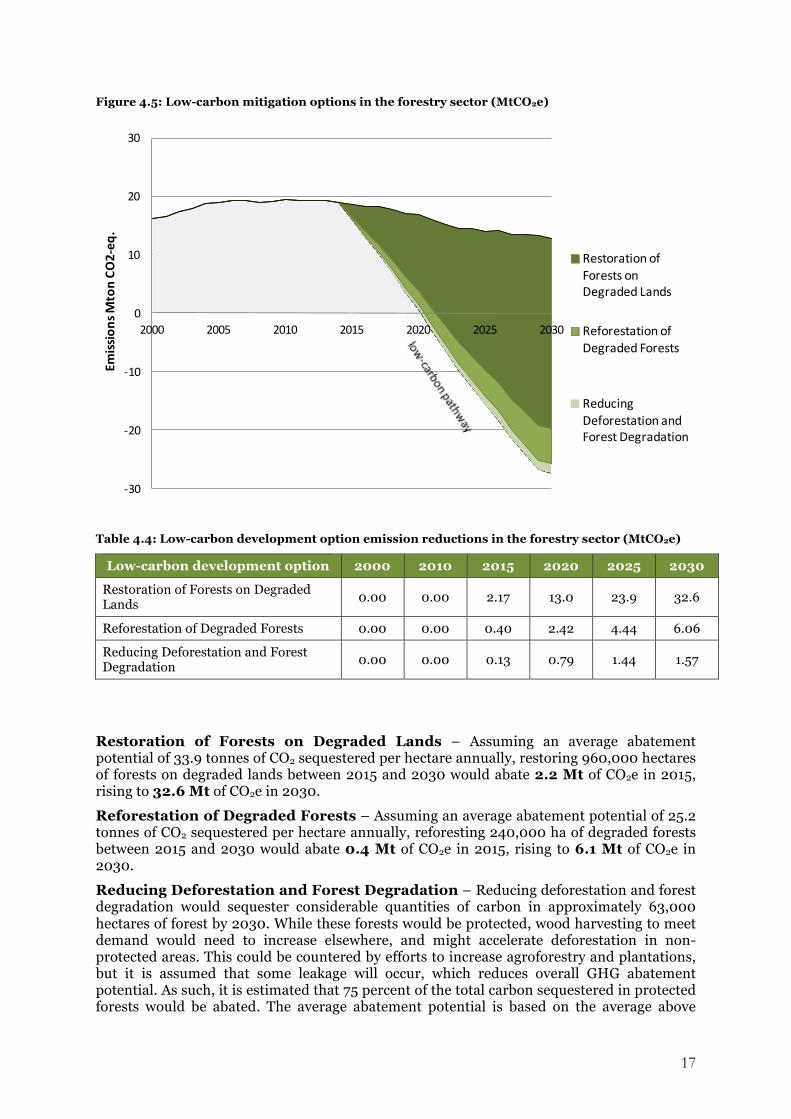
Figure 4.5 shows the low-carbon mitigation wedges in the forestry sector. Restoration of forests on degraded lands has the largest abatement potential with over 32 Mt CO2 per year in 2030. The large potential for restoration of forests on degraded lands is driven by the scale of implementation; almost one million hectares of forests would be restored on degraded lands between 2015 and 2030 in the mitigation scenario. This compares to 240,000 hectares of reforestation of degraded forests and a decrease in deforestation and forest degradation of 63,000 hectares by 2030. The total abatement potential in the forestry sector in 2030 exceeds 41 Mt CO2 per year.
Negative emissions indicate that the sector is a net sink as opposed to a net emitter of greenhouse gases. Emission reduction contributions from the three mitigation options for a given year are indicated by the wedge or space between lines.
The mitigation potential of each low-carbon development option is briefly described below, with more data included in the fact sheets in Annex 1.
17
Figure 4.5: Low-carbon mitigation options in the forestry sector (MtCO2e)
Table 4.4: Low-carbon development option emission reductions in the forestry sector (MtCO2e)
Low-carbon development option 2000 2010 2015 2020 2025 2030
Restoration of Forests on Degraded Lands 0.00 0.00 2.17 13.0 23.9 32.6
Reforestation of Degraded Forests 0.00 0.00 0.40 2.42 4.44 6.06
Reducing Deforestation and Forest Degradation 0.00 0.00 0.13 0.79 1.44 1.57
Restoration of Forests on Degraded Lands – Assuming an average abatement potential of 33.9 tonnes of CO2 sequestered per hectare annually, restoring 960,000 hectares of forests on degraded lands between 2015 and 2030 would abate 2.2 Mt of CO2e in 2015, rising to 32.6 Mt of CO2e in 2030.
Reforestation of Degraded Forests – Assuming an average abatement potential of 25.2 tonnes of CO2 sequestered per hectare annually, reforesting 240,000 ha of degraded forests between 2015 and 2030 would abate 0.4 Mt of CO2e in 2015, rising to 6.1 Mt of CO2e in 2030.
Reducing Deforestation and Forest Degradation – Reducing deforestation and forest degradation would sequester considerable quantities of carbon in approximately 63,000 hectares of forest by 2030. While these forests would be protected, wood harvesting to meet demand would need to increase elsewhere, and might accelerate deforestation in non-protected areas. This could be countered by efforts to increase agroforestry and plantations, but it is assumed that some leakage will occur, which reduces overall GHG abatement potential. As such, it is estimated that 75 percent of the total carbon sequestered in protected forests would be abated. The average abatement potential is based on the average above
-‐30
-‐20
-‐10
0
10
20
30
2000 2005 2010 2015 2020 2025 2030
Emissions M
ton CO
2-‐eq
.
Restoration of Forests on Degraded Lands
Reforestation of Degraded Forests
Reducing Deforestation and Forest Degradation
18
ground carbon density of Kenyan forests of 95.4 tonnes of CO2 converted to other land uses based on FAO data.43 Consequently, about 0.1 Mt of CO2e would be abated in 2015, rising to 1.6 Mt of CO2e in 2030. This scenario suggests that 63,000 hectares would be realized nationally through this effort between 2015 and 2030.
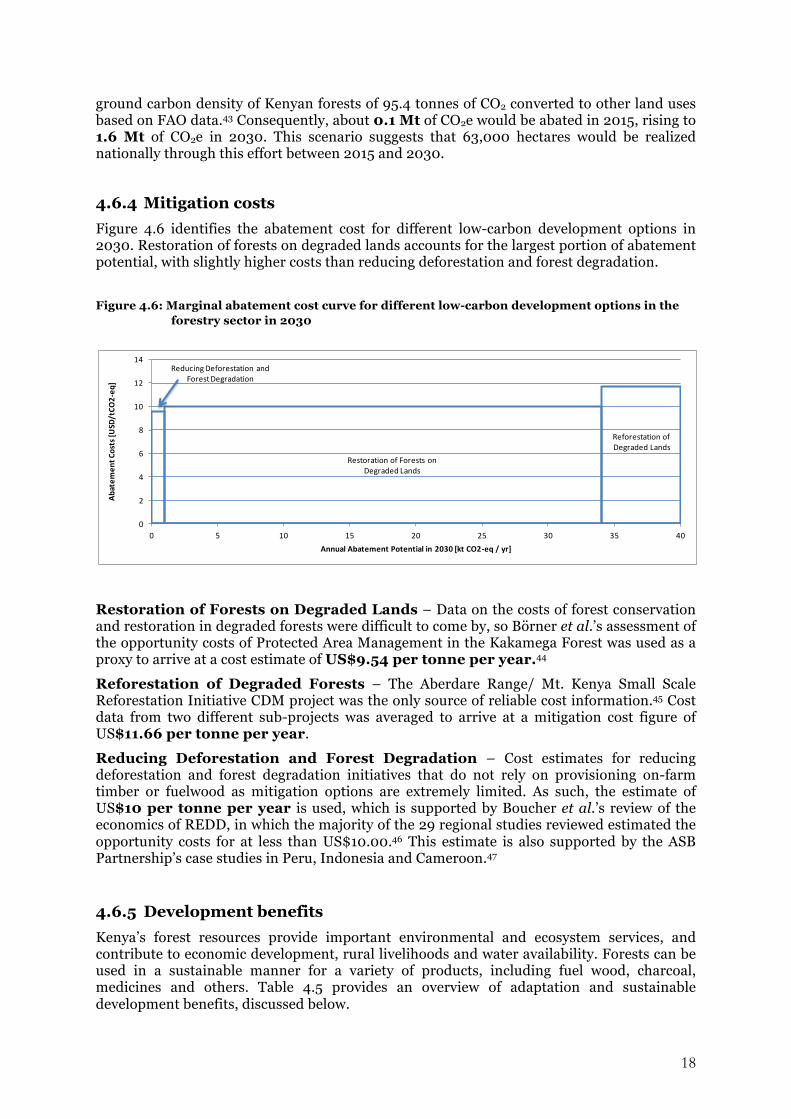
4.6.4 Mitigation costs Figure 4.6 identifies the abatement cost for different low-carbon development options in 2030. Restoration of forests on degraded lands accounts for the largest portion of abatement potential, with slightly higher costs than reducing deforestation and forest degradation.
Figure 4.6: Marginal abatement cost curve for different low-carbon development options in the
forestry sector in 2030
Restoration of Forests on Degraded Lands – Data on the costs of forest conservation and restoration in degraded forests were difficult to come by, so Börner et al.’s assessment of the opportunity costs of Protected Area Management in the Kakamega Forest was used as a proxy to arrive at a cost estimate of US$9.54 per tonne per year.44
Reforestation of Degraded Forests – The Aberdare Range/ Mt. Kenya Small Scale Reforestation Initiative CDM project was the only source of reliable cost information.45 Cost data from two different sub-projects was averaged to arrive at a mitigation cost figure of US$11.66 per tonne per year.
Reducing Deforestation and Forest Degradation – Cost estimates for reducing deforestation and forest degradation initiatives that do not rely on provisioning on-farm timber or fuelwood as mitigation options are extremely limited. As such, the estimate of US$10 per tonne per year is used, which is supported by Boucher et al.’s review of the economics of REDD, in which the majority of the 29 regional studies reviewed estimated the opportunity costs for at less than US$10.00.46 This estimate is also supported by the ASB Partnership’s case studies in Peru, Indonesia and Cameroon.47
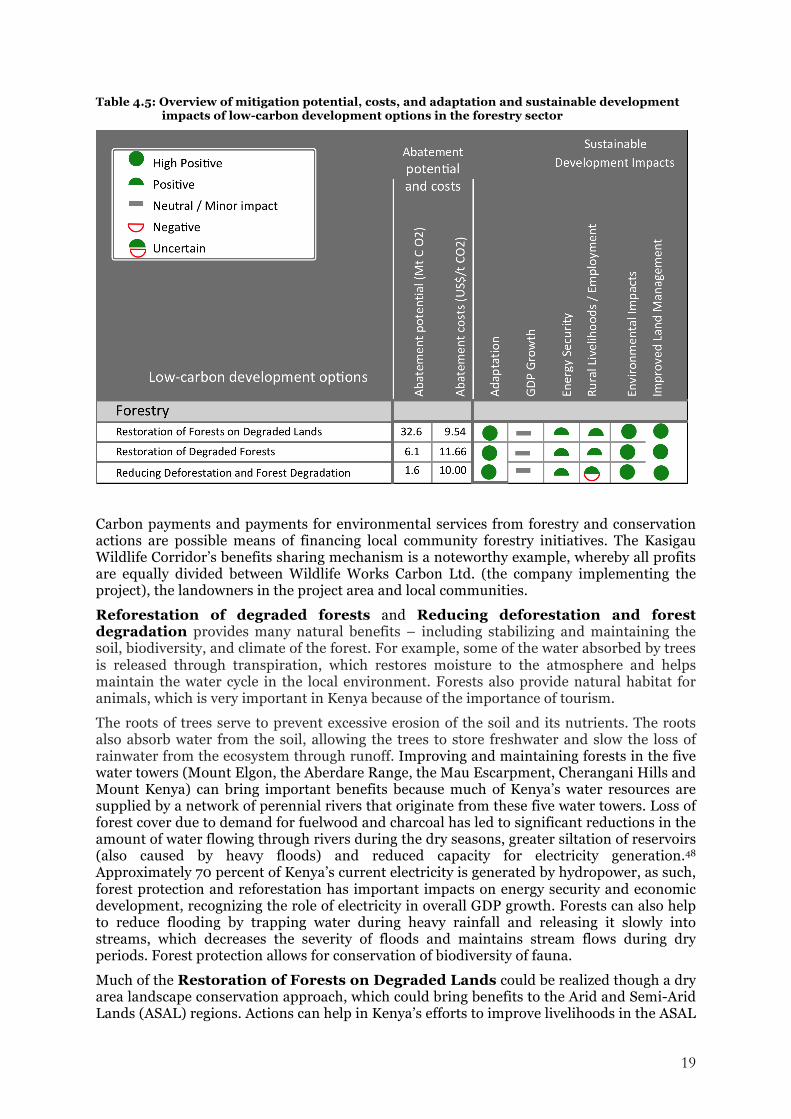
4.6.5 Development benefits Kenya’s forest resources provide important environmental and ecosystem services, and contribute to economic development, rural livelihoods and water availability. Forests can be used in a sustainable manner for a variety of products, including fuel wood, charcoal, medicines and others. Table 4.5 provides an overview of adaptation and sustainable development benefits, discussed below.
Reducing Deforestation and Forest Degradation
Reforestation ofDegraded Lands
Restoration of Forests on Degraded Lands
0
2
4
6
8
10
12
14
0 5 10 15 20 25 30 35 40
Abatem
ent C
osts [U
SD/tCO
2-‐eq
]
Annual Abatement Potential in 2030 [kt CO2-‐eq / yr]
19
Table 4.5: Overview of mitigation potential, costs, and adaptation and sustainable development impacts of low-carbon development options in the forestry sector
Carbon payments and payments for environmental services from forestry and conservation actions are possible means of financing local community forestry initiatives. The Kasigau Wildlife Corridor’s benefits sharing mechanism is a noteworthy example, whereby all profits are equally divided between Wildlife Works Carbon Ltd. (the company implementing the project), the landowners in the project area and local communities.
Reforestation of degraded forests and Reducing deforestation and forest degradation provides many natural benefits – including stabilizing and maintaining the soil, biodiversity, and climate of the forest. For example, some of the water absorbed by trees is released through transpiration, which restores moisture to the atmosphere and helps maintain the water cycle in the local environment. Forests also provide natural habitat for animals, which is very important in Kenya because of the importance of tourism.
The roots of trees serve to prevent excessive erosion of the soil and its nutrients. The roots also absorb water from the soil, allowing the trees to store freshwater and slow the loss of rainwater from the ecosystem through runoff. Improving and maintaining forests in the five water towers (Mount Elgon, the Aberdare Range, the Mau Escarpment, Cherangani Hills and Mount Kenya) can bring important benefits because much of Kenya’s water resources are supplied by a network of perennial rivers that originate from these five water towers. Loss of forest cover due to demand for fuelwood and charcoal has led to significant reductions in the amount of water flowing through rivers during the dry seasons, greater siltation of reservoirs (also caused by heavy floods) and reduced capacity for electricity generation.48 Approximately 70 percent of Kenya’s current electricity is generated by hydropower, as such, forest protection and reforestation has important impacts on energy security and economic development, recognizing the role of electricity in overall GDP growth. Forests can also help to reduce flooding by trapping water during heavy rainfall and releasing it slowly into streams, which decreases the severity of floods and maintains stream flows during dry periods. Forest protection allows for conservation of biodiversity of fauna.
Much of the Restoration of Forests on Degraded Lands could be realized though a dry area landscape conservation approach, which could bring benefits to the Arid and Semi-Arid Lands (ASAL) regions. Actions can help in Kenya’s efforts to improve livelihoods in the ASAL
20
regions, as dryland forests and forest products – including timber, gums and resin, and charcoal – bring important economic benefits. A 2007 study by The World Conservation Union found that restored forests were very important livelihood and economic assets that repay investment. Environmental and natural resource assets provide important livelihood options for many rural people to meet their cash needs (for example for education), for fuel and building timber, medicines and by improved ground water supply.49
4.6.6 Climate resilience The three low-carbon development options have strong adaptation benefits and help to increase climate resilience. Climate change could alter forest growth patterns, shrinking the availability of wood to meet energy needs. Efforts to maintain and increase forest cover could help to offset these anticipated changes by ensuring availability of biomass for energy needs (linked to sustainable charcoal production and improved cookstoves).
Climate change also lowers the amount of water flowing in rivers (particularly during the dry seasons) and promotes reservoir siltation. This reduces water availability for communities and reduces hydroelectric power potential.50 The contribution of forests in water catchments is critical for sustaining water availability and for the generation of hydropower as well as helping to mitigate the impacts of flooding.51
Low-carbon forestry options can help to abate flooding and landslides, two climate-related hazards in Kenya. The UNDP reports that landslides occur mostly during the rainy season and are associated with floods; and the Western, Nyanza and the north Rift Valley provinces are most affected by landslides. The number of landslides in Kenya is reported to be increasing as forested lands are converted to agriculture, resulting in looser soils and fewer trees to slow the flow of water down slopes.52
Restoration of forests on degraded lands has the additional benefits of potentially increasing adaptive capacity in vulnerable areas like mountain slopes, ASALs, and fragile ecosystems like natural forests and wetlands. Moreover, it also had the added benefits of reducing erosion and sediment discharge in rivers, and improving soil health.
4.6.7 Feasibility of implementation Feasibility of implementation of the three low-carbon development options is an important consideration. This section considers elements of and potential barriers to the successful implementation of actions in the three areas.
REDD+ - For all three low-carbon options, lack of financing is a critical barrier. Financing through REDD+ could potentially help to overcome this barrier, and the government is working to lay the groundwork and put institutional structures in place. Effective REDD+ programs require robust data and information. The forest mapping exercise is a first step in collecting required data, with a National Forest Inventory a necessary next step. Effective REDD+ programs will also require capacity building to raise the awareness of local and forest-dependent communities of the benefits of restoring forests and reducing deforestation and forest degradation, and to build capacity to properly manage forests, measure carbon and use benefits that may flow through REDD+.
Benefits that may flow through the carbon market through a REDD+ mechanism are not likely to be realized on a large scale before 2020. In addition, the payments for carbon under current REDD+ activities are considered a “bonus” that complement income from other sources. These REDD+ activities are not, and are not expected to be, financially viable based on the income from the sale of REDD credits alone. In addition, the main compliance market, the European Union Emissions Trading Scheme, does not purchase forestry-based CDM credits and will only purchase CDM credits from least developed countries after 2012 (Kenya is not a least developed country). Currently, all sales of forestry-related credits are
21
through the voluntary market. Kenya would be well placed to focus short-term efforts on securing grant financing for REDD+ and forestry-related mitigation initiatives, while building the capacity to eventually access market-based financing.
Involvement of communities - Unclear land tenure is an important issue in forestry actions. Many individuals from indigenous and forest-adjacent communities depend on forests for their livelihoods, but do not have formal title over the forests.53 Mitigation in the context of REDD+ means protecting the forest, which could limit the use of forests by local communities, or some cases, restrict access. The success of the REDD+ activities will depend on the involvement of communities, meaning that communities must agree with conservation and preservation actions, as well as accrue benefits from the actions. Adherence to the REDD+ safeguards can help by ensuring full and effective participation of relevant stakeholders, and respect for the knowledge and rights of members of local communities, including obtaining free, prior and informed consent (FPIC) of forest-dependent peoples in regard to REDD+ actions.
Community involvement is critical for sustainable forestry management and conservation programmes. The county consultations noted that Community Forest Associations and the closely related Water Resources Users Associations are important for effective management of forest resources. Inadequate management techniques can increase the risks of fire and disease outbreaks, and some communities lack sufficient capacity to manage and monitor forestry initiatives. The county consultations also noted the need for the government to develop a clear definition and plan to attain the goal of 10 percent forest cover, and to increase enforcement to prevent illegal logging and charcoal production.
Fair benefits sharing mechanisms, including compensation for conservation activities and training for alternative livelihoods, are important for communities. Weak access to market infrastructure may render communities unable to fully exploit the economic benefits of non-timber forest products. Even if access to infrastructure is available, the sustainable livelihoods potential of non-timber forest products may be limited in certain cases, and support and compensation may be required.54
Restoration of Forests on Degraded Lands – Many of the areas that will naturally regenerate with improved management are currently used for grazing. As such, actions to encourage the regeneration of woody vegetation, such as conservation or forest management, could have significant impacts on the livelihoods of pastoralists and forest-dependent communities. Five to ten years are needed to allow trees to reach a required height; and during this time period, the land might not available to the community. Obtaining FPIC of pastoralists, and persuading them to forgo access to grazing lands will be difficult. Education and awareness raising are prerequisites to ensure communities understand the long-term benefits of taking grazing land out of circulation for a period of years. Moving forward on this low-carbon option will require mechanisms to compensate local communities and pastoralists for the foregone livestock grazing opportunities. Work is needed on measurement, monitoring and reporting to determine the level of carbon stock increase that could be facilitated through appropriate government programs and the benefits that could derive to communities.
Reforestation of Degraded Forests – Most counties are interested in afforestation or reforestation projects, with the county consultations reporting that Meru, Embu, Nyeri, Kirinyaga, Bomet, Kericho, Nandi, Kisii, Nyamira, Kitale and Kakamega, (counties in agro-ecological Zones I and II) propose to establish plantation forests, perhaps due to the ability of these zones to support such projects. Rural households, particularly counties in the ASAL regions, face challenges in accessing energy with depleting biomass resources. Proposals on reforestation and afforestation from counties in the ASAL regions (such as Mandera, Wajir and Kitui) include fast-growing tree species to meet increasing energy demand.
The county consultations identified that the government needs to develop a clear policy on eucalyptus and other tree species to be used for afforestation. Species selection is important
22
in reforestation activities, since some species require significant quantities of water; and there may be a need to build capacity to reforest using indigenous species. Furthermore, tradeoffs between the benefits of plantations featuring fast-growing exotic tree species for meeting fuelwood demand and the more comprehensive ecosystem services of natural forests may need to be considered.
Reducing Deforestation and Forest Degradation – The 2005 Forestry Act and successful advocacy campaigns have helped to reduce the clearance of gazetted forests for agriculture; but trustland forests under the control of local governments continue to be degraded through overexploitation for timber, charcoal, fuelwood and unregulated grazing. The county consultations noted the need for a clear delineation of duties among various government agencies responsible for forest resource management, namely the KFS and National Environment Management Authority (NEMA). Several counties proposed enhancement of natural resource governance as a key element of effective conservation of forests and REDD+ programs. As noted above, some REDD+ activities can present constraints to forest communities; for example strict enforcement of protected areas can restrict access to livelihood assets. Negative impacts on local communities need to be identified and offset or compensated for.
Cross-sectoral coordination is an important element of avoiding deforestation including actions in the energy sector such as improved charcoal production efficiency and improved cook stoves, and actions in the agricultural sector to increase productivity per hectare.
In general, Kenyans are aware of the problem of deforestation and the importance of restoring degraded areas. The goal of 10 percent tree cover in the constitution and annual tree-planting campaigns have helped to raise awareness. Kenya has several on-going reforestation initiatives, and there is general acknowledgement of the problem of deforestation and the importance of restoring degraded areas among both politicians and the general public. That said, deforestation continues and increased support for research, outreach services and capacity building is required. Work is needed to learn from and scale up pilot projects. Capacity building is needed to develop measurement and monitoring systems, and support is required to build the foundations for effective carbon measurement techniques.
4.7 Potential Policy Measures and Instruments
An increase in forest cover can be encouraged through supportive policies, government initiatives and regulatory frameworks. An important first step in developing effective policies and programmes is the data and information base. Capacity building is also important in Kenya, given the strong role of and the need to improve capacity in community forest associations. Also important are programmes that provide forest communities with alternative forms of income and livelihoods, or build capacity to adopt alternatives. Suitable levels of resources are critical for moving forward on low-carbon development opportunities. A range of policy measures and instruments are available in Kenya to encourage the implementation of the low-carbon development options in the forestry sector, discussed below.
Improved information collection and analysis of information - Effective REDD+ and other forestry programs require robust data and information. The on-going forest mapping exercise is a first step in collecting required data, with a National Forest Inventory a necessary next step. This inventory would build on the forest mapping and greatly enhance the information base. Kenya requires an updated inventory of GHG emissions and sinks, including the development of Kenyan emission factors for forestry and land-based emissions and sinks. Improving the evidence base is a critical step for enhanced policy and programme development and for implementing cost-effective mitigation measures. This improved information will also lay the groundwork for the measurement and monitoring of carbon
23
stocks, which will ensure that REDD+ actions can be measured and monitored, a prerequisite to secure REDD+ results-based funding.
Integrated spatial analysis and strategy development - The biodiversity and ecosystem costs and benefits of forests in regard to wider social and economic impacts are location dependent. Potential action on the scale assumed in this low-carbon analysis requires consideration of proximity to existing forests and people, and the synergies or conflicts with other land uses. Restoring and protecting forests can displace current uses of the land or resources (such as cattle grazing or fuelwood gathering). Moving forward on forestry actions requires integrated spatial analysis and development of an integrated spatial strategy to support informed decision-making.
Development of a REDD+ policy - Developing and implementing a comprehensive national REDD+ policy could enable flows of climate finance for conservation and sustainable forest management in the medium and long term, an important action for implementing two low-carbon options: restoration of forests on degraded lands and reducing deforestation and forest degradation. For a national REDD+ policy to meet the goals of Vision 2030, clearly delineated land tenure and carbon rights, as well as an equitable benefits sharing mechanism are essential. Effective REDD+ activities could help overcome barriers and build the information base needed for effective programmes. The Kenyan government is working to lay the groundwork and establish institutional structures for REDD+.
Improved regulatory frameworks – Continued development of the rules and regulations to implement the Forest Act can assist in forest preservation and conservation. Examples of such improved frameworks could include progressively limiting extraction activities in protected forests, with full implementation by 2030. Robust and consistent enforcement will be critical, as will awareness of and capacity building for alternative forest use and management practices. Compensation may be required for communities where alternative land-use and livelihood opportunities are limited.
Capacity building – Increasing the technical capacity of institutions such as KFS, community forest associations and forestland owners will be critical. Required initiatives include introducing and promulgating woodlands management guidelines to promote and enforce best practices, along the lines of the Government of Kenya’s guidebook for On-Farm Commercial Forestry. The Government might also wish to build capacity for participatory forest monitoring, as it can serve as a complementary and cost-effective form of measurement and monitoring for REDD+ and other forest conservation activities. Capacity building is also needed in forest communities that will be impacted by low-carbon development actions to help overcome cultural barriers. Capacity building for establishing and managing community forest associations can help to increase community involvement and improve understanding of the potential impacts of low-carbon actions.
Dryland forestry conservation and management – A dryland forestry conservation approach to restore forests on degraded lands can include removing or reducing barriers to natural forest regeneration by preventing disturbances. This can include establishing enclosures or protecting areas from interference from humans and animals to accelerate seed dispersal into the site by birds and animals. Access to forests may be limited or prohibited by conservation programs, which could require compensation for loss of grazing land or access to forests, and training for new livelihood approaches. Local community participation is needed in the management and conservation of dryland forests through strategies that help meet food security and income generation objectives.
Supporting alternative income-generating activities for forest-adjacent communities - One potential option is the provision of economic incentives for establishing production and manufacturing facilities for high-value products near forest-adjacent communities. Other potential activities include promoting opportunities for ecotourism and the commercialization of non-timber forest products. For example, the
24
Kasigau Wildlife Corridor Project has initiated a number of activities to promote alternative sources of income for communities in the project area, including clothing and eco-soap factories for export markets.55 However, it should be noted that in many cases these alternative livelihoods are based on the provisioning of niche goods and services, and their potential for scalability is likely to be limited.
Payments for ecosystem services –Market-based mechanisms such as payment for ecosystem services (PES) could provide land users with financial incentives to engage in activities that produce important benefits for “downstream” users. In the forestry sector, payments for sustaining and enhancing the important hydrological functions of Kenya’s five water tower forests are a promising possibility. Several water-based payment for ecosystem services initiatives are underway in Kenya, including the Lake Naivasha Watershed Project implemented by World Wildlife Fund and CARE56, and the Sasumua Watershed initiative spearheaded by Pro-poor Rewards for Environmental Services in Africa, Jomo Kenyatta University of Agriculture and Technology and the Macaulay Land Use Research Institute. 57 Other water-based PES initiatives are also being explored by PRESA, including in the Upper Tana River and the Nyando and Yala basins. There are opportunities for PES and REDD+ instruments and initiatives to complement one another. The Lake Naivasha project is planning to incorporate carbon financing from REDD+ activities as part of its program activities58, and such a combination of PES and REDD+ financing could be scaled up to other projects and jurisdictions, creating a critical mass of finance for conserving water tower forests and forest biodiversity hotspots.
Incentivizing commercial-scale investment in tree planting – KFS offers technical advice on sustainable forest management and conservation to registered owners of private forests, and in select circumstances provides concessional loans.59 Increasing the number of concessional loans or modifying tax incentives to promote commercialization and economies of scale would encourage activities at speed and scale. Subsidizing fast-growing fuelwood plantations could help provide a low-cost, sustainable and reliable source of fuelwood for forest adjacent peoples and smallholders.
4.8 Conclusion
The analysis in this report demonstrates how low-carbon development options in the forestry sector in Kenya can lower GHG emissions out to 2030 compared to the reference case and, at the same time, contribute to Kenya’s sustainable development goals.
The priority low-carbon development option in the forestry sector is Restoration of Forests on Degraded Lands. This action has the largest abatement potential, significant sustainable development benefits and increases climate resilience. All three options could help the Government of Kenya pursue a low-carbon development pathway, because all options have large abatement potential, help to increase climate resilience and create sustainable development benefits. That said, the REDD+ options could have negative impacts on forest and forest-adjacent communities, depending on the selected programmes to reduce emissions; and actions will be needed to educate communities, help them adopt alternative livelihood strategies, and compensate them for lost income. Financing through a REDD+ mechanism could potentially help support such programs.
Some experience has been gained through projects but research is needed to develop Kenya-specific information for baselines and abatement potential, and measuring and monitoring programs, including participatory monitoring. The implementation of successful programs for restoring forests on degraded lands, reforestation, and reducing deforestation and forest degradation require capacity building for the KFS and communities, including improved ability to establish and manage community forest associations.
25
Annex 1: Low-carbon Development Option Fact Sheets
Reforestation of Degraded Forests Reforestation involves foresting lands that were once forests, but have been depleted or converted to non-‐forest land over the last 30 years.
Current situation: Deforestation is a major issue in Kenya, and currently only 6 percent of the country’s land area is forest. The current annual loss of 12,000 hectares of forest results in a loss of approximately 1.6 Mt of carbon dioxide per year. Carbon losses from other woodlands (such as trees in grasslands and bushland) amount to 0.41 Mt of carbon dioxide per year. The Government of Kenya has estimated that the cost to increase forest cover from the current 6 percent of land area to 10 percent is approximately US$385 million per year (for 20 years). The Kenya Forest Service’s annual tree plantation development target is 6,000 hectares, but planting programmes have been constrained by lack of resources. The 6,000 hectares is for plantation development and does not cover the rehabilitation of degraded sites and farm forestry. Several reforestation initiatives are ongoing in Kenya, including in the Kakamega, Mt. Elgon and Mau forests.
Low-‐carbon scenario: Increasing Kenya’s forest cover from 6 percent to 10 percent would involve reforesting or restoring 2.4 million hectares of land. Assuming that half of this is achievable up to 2030, this would mean reforesting 1.2 million hectares over fifteen years. The low-‐carbon analysis assumes that 20 percent of this amount, or approximately 16,000 hectares per year, would be attained through tree planting (with the other 80 percent achieved through regeneration, which is discussed as a separate low-‐carbon option). This would be done in parallel with efforts to increase tree cover on agricultural cropland and to promote agroforestry, and would therefore not be the only programme aiming to increase forest cover.
Development benefits and priorities
Development benefits: • Kenya’s forest resources provide important environmental and ecosystem services. • Forest resources contribute to water availability. • Forests can be used in a sustainable manner for a variety of products, including fuel wood, charcoal,
medicines and others; contributing to economic development. • Carbon payments and payments for other environmental services are possible means for increasing
forestry’s contribution to local community livelihoods • Biodiversity can also benefit from sustainable forest management and conservation of forests.
Alignment with GoK priorities: The Government of Kenya has established a target of minimum 10% tree cover on land area, which is stated in the Constitution. Vision 2030 aims to increase the forest cover by 2.4 million hectares over the next 20 years. The Environmental Management and Coordination Act 1999, Forests Act 2005, NCCRS, TNA, National Communications and REDD+ Readiness Preparation Proposal note the importance of the forestry sector in achieving the country’s climate change and development priorities. The Vision 2030 Medium Term Plan provides for the rehabilitation and protection of forests in five major water catchment forests, and also contains a 'Trees for Jobs' Programme.
Links to adaptation: Reforestation can increase adaptive capacity in vulnerable areas like mountain slopes, Arid and Semi Arid Lands (ASALs) and fragile ecosystems like natural forests and wetlands. For example, re-‐vegetated slopes of degraded catchment forest areas like the Mau complex can reduce the likelihood of landslides, migration to search for water during the dry spells, and reduce conflicts arising from such movements. Additionally, the conservation of water-‐catchment ecosystems (rivers, lakes and wetlands) can safeguard this key source of water for production (agriculture) and domestic use, which the majority of the rural poor depend on.
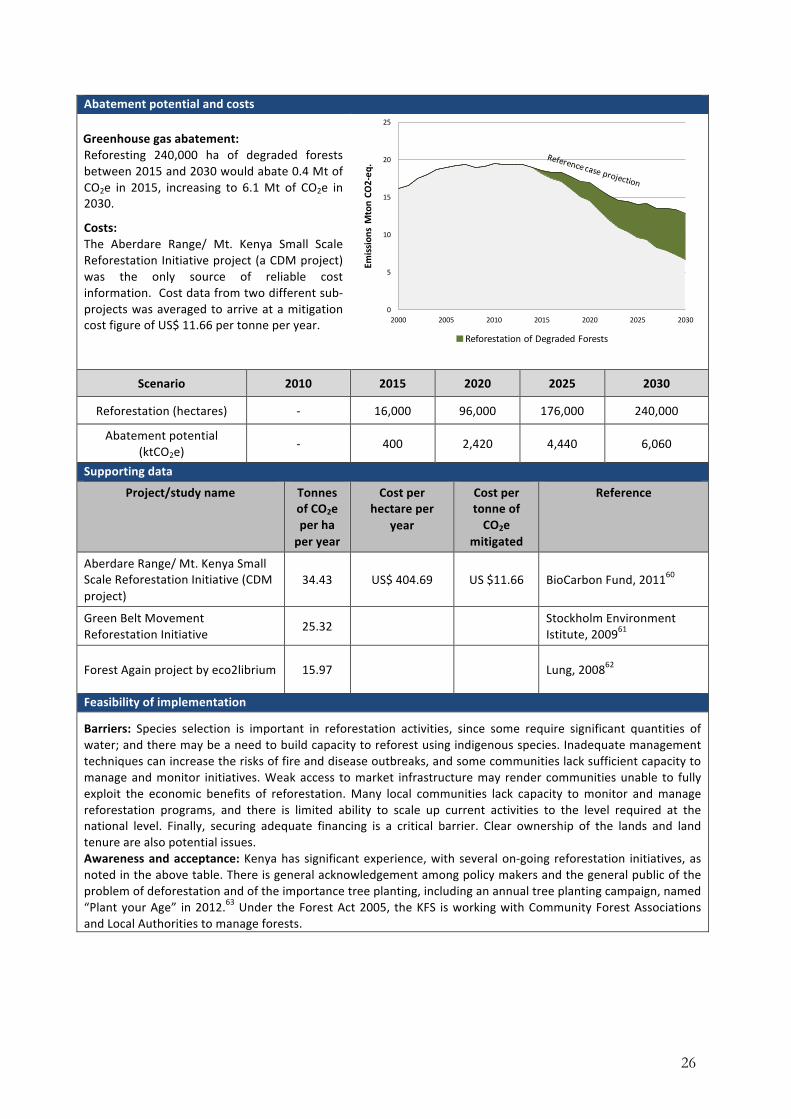
26
Abatement potential and costs Greenhouse gas abatement: Reforesting 240,000 ha of degraded forests between 2015 and 2030 would abate 0.4 Mt of CO2e in 2015, increasing to 6.1 Mt of CO2e in 2030.
Costs: The Aberdare Range/ Mt. Kenya Small Scale Reforestation Initiative project (a CDM project) was the only source of reliable cost information. Cost data from two different sub-‐projects was averaged to arrive at a mitigation cost figure of US$ 11.66 per tonne per year.
Scenario 2010 2015 2020 2025 2030
Reforestation (hectares) -‐ 16,000 96,000 176,000 240,000
Abatement potential (ktCO2e)
-‐ 400 2,420 4,440 6,060
Supporting data
Project/study name Tonnes of CO2e per ha per year
Cost per hectare per
year
Cost per tonne of CO2e
mitigated
Reference
Aberdare Range/ Mt. Kenya Small Scale Reforestation Initiative (CDM project)
34.43 US$ 404.69 US $11.66 BioCarbon Fund, 201160
Green Belt Movement Reforestation Initiative 25.32
Stockholm Environment Istitute, 200961
Forest Again project by eco2librium 15.97 Lung, 200862
Feasibility of implementation
Barriers: Species selection is important in reforestation activities, since some require significant quantities of water; and there may be a need to build capacity to reforest using indigenous species. Inadequate management techniques can increase the risks of fire and disease outbreaks, and some communities lack sufficient capacity to manage and monitor initiatives. Weak access to market infrastructure may render communities unable to fully exploit the economic benefits of reforestation. Many local communities lack capacity to monitor and manage reforestation programs, and there is limited ability to scale up current activities to the level required at the national level. Finally, securing adequate financing is a critical barrier. Clear ownership of the lands and land tenure are also potential issues. Awareness and acceptance: Kenya has significant experience, with several on-‐going reforestation initiatives, as noted in the above table. There is general acknowledgement among policy makers and the general public of the problem of deforestation and of the importance tree planting, including an annual tree planting campaign, named “Plant your Age” in 2012.63 Under the Forest Act 2005, the KFS is working with Community Forest Associations and Local Authorities to manage forests.
0
5
10
15
20
25
2000 2005 2010 2015 2020 2025 2030
Emissions M
ton CO
2-‐eq
.
Reforestation of Degraded Forests
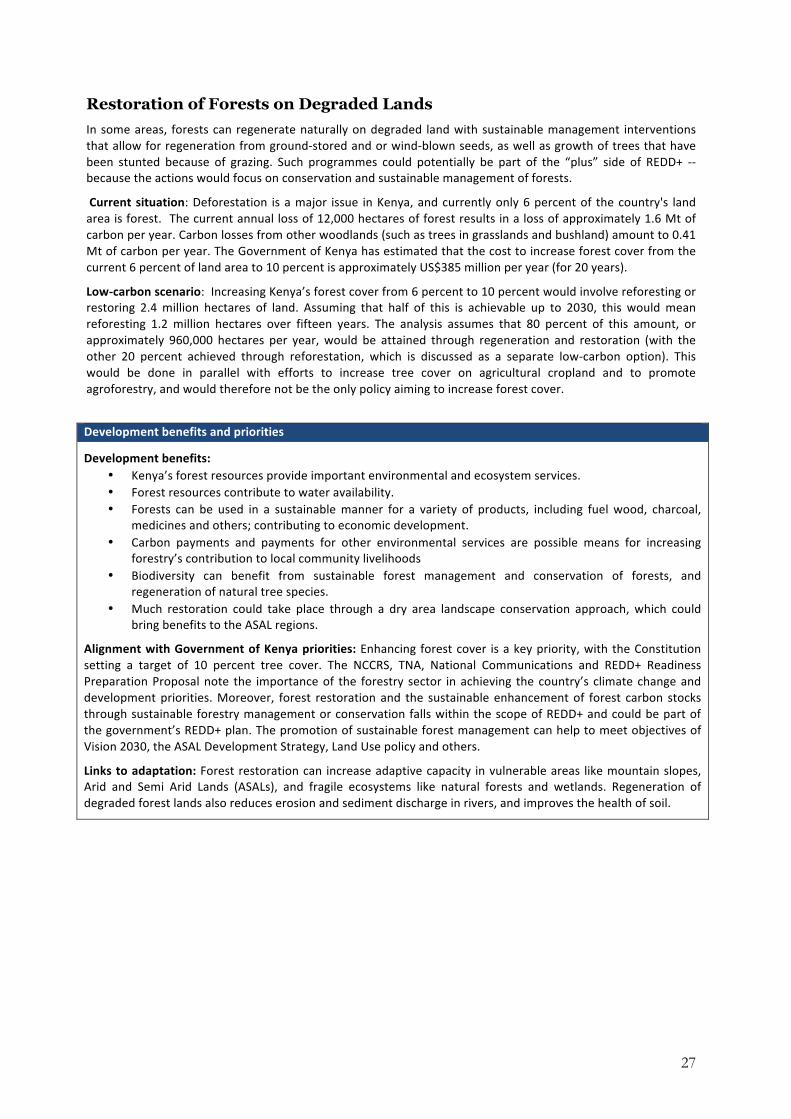
27
Restoration of Forests on Degraded Lands In some areas, forests can regenerate naturally on degraded land with sustainable management interventions that allow for regeneration from ground-‐stored and or wind-‐blown seeds, as well as growth of trees that have been stunted because of grazing. Such programmes could potentially be part of the “plus” side of REDD+ -‐-‐ because the actions would focus on conservation and sustainable management of forests.
Current situation: Deforestation is a major issue in Kenya, and currently only 6 percent of the country's land area is forest. The current annual loss of 12,000 hectares of forest results in a loss of approximately 1.6 Mt of carbon per year. Carbon losses from other woodlands (such as trees in grasslands and bushland) amount to 0.41 Mt of carbon per year. The Government of Kenya has estimated that the cost to increase forest cover from the current 6 percent of land area to 10 percent is approximately US$385 million per year (for 20 years).
Low-‐carbon scenario: Increasing Kenya’s forest cover from 6 percent to 10 percent would involve reforesting or restoring 2.4 million hectares of land. Assuming that half of this is achievable up to 2030, this would mean reforesting 1.2 million hectares over fifteen years. The analysis assumes that 80 percent of this amount, or approximately 960,000 hectares per year, would be attained through regeneration and restoration (with the other 20 percent achieved through reforestation, which is discussed as a separate low-‐carbon option). This would be done in parallel with efforts to increase tree cover on agricultural cropland and to promote agroforestry, and would therefore not be the only policy aiming to increase forest cover.
Development benefits and priorities
Development benefits: • Kenya’s forest resources provide important environmental and ecosystem services. • Forest resources contribute to water availability. • Forests can be used in a sustainable manner for a variety of products, including fuel wood, charcoal,
medicines and others; contributing to economic development. • Carbon payments and payments for other environmental services are possible means for increasing
forestry’s contribution to local community livelihoods • Biodiversity can benefit from sustainable forest management and conservation of forests, and
regeneration of natural tree species. • Much restoration could take place through a dry area landscape conservation approach, which could
bring benefits to the ASAL regions.
Alignment with Government of Kenya priorities: Enhancing forest cover is a key priority, with the Constitution setting a target of 10 percent tree cover. The NCCRS, TNA, National Communications and REDD+ Readiness Preparation Proposal note the importance of the forestry sector in achieving the country’s climate change and development priorities. Moreover, forest restoration and the sustainable enhancement of forest carbon stocks through sustainable forestry management or conservation falls within the scope of REDD+ and could be part of the government’s REDD+ plan. The promotion of sustainable forest management can help to meet objectives of Vision 2030, the ASAL Development Strategy, Land Use policy and others.
Links to adaptation: Forest restoration can increase adaptive capacity in vulnerable areas like mountain slopes, Arid and Semi Arid Lands (ASALs), and fragile ecosystems like natural forests and wetlands. Regeneration of degraded forest lands also reduces erosion and sediment discharge in rivers, and improves the health of soil.
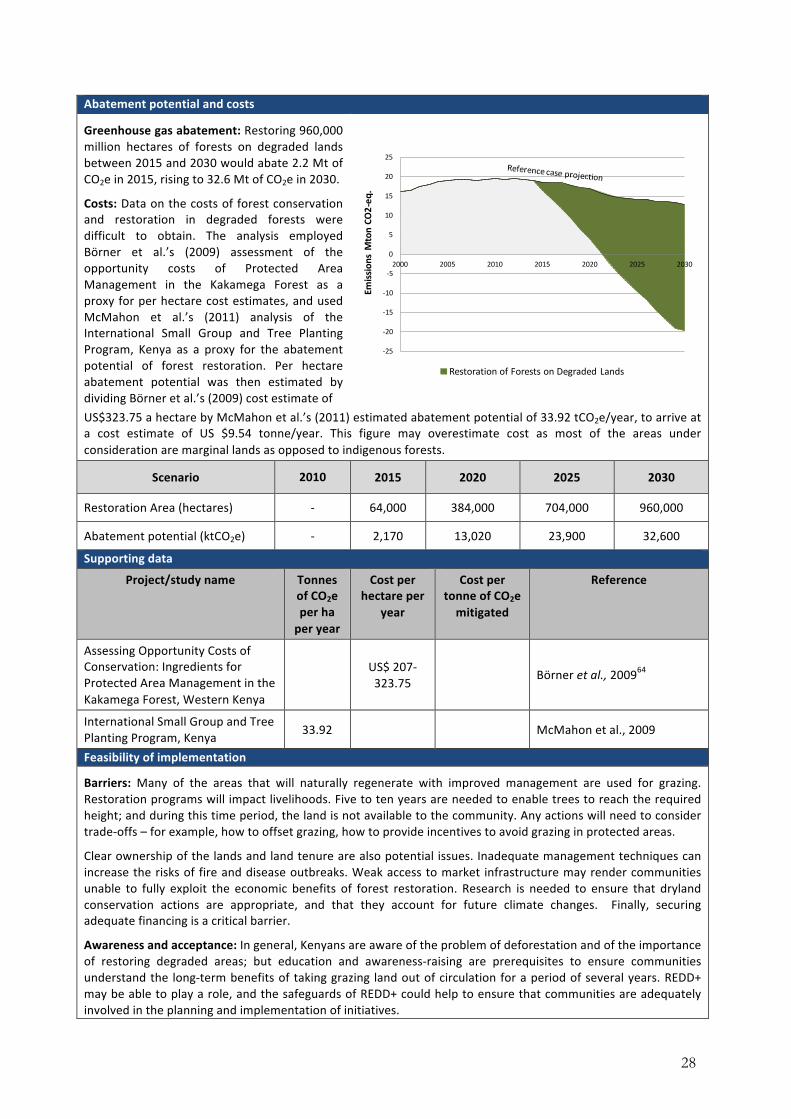
28
Abatement potential and costs
Greenhouse gas abatement: Restoring 960,000 million hectares of forests on degraded lands between 2015 and 2030 would abate 2.2 Mt of CO2e in 2015, rising to 32.6 Mt of CO2e in 2030.
Costs: Data on the costs of forest conservation and restoration in degraded forests were difficult to obtain. The analysis employed Börner et al.’s (2009) assessment of the opportunity costs of Protected Area Management in the Kakamega Forest as a proxy for per hectare cost estimates, and used McMahon et al.’s (2011) analysis of the International Small Group and Tree Planting Program, Kenya as a proxy for the abatement potential of forest restoration. Per hectare abatement potential was then estimated by dividing Börner et al.’s (2009) cost estimate of
US$323.75 a hectare by McMahon et al.’s (2011) estimated abatement potential of 33.92 tCO2e/year, to arrive at a cost estimate of US $9.54 tonne/year. This figure may overestimate cost as most of the areas under consideration are marginal lands as opposed to indigenous forests.
Scenario 2010 2015 2020 2025 2030
Restoration Area (hectares) -‐ 64,000 384,000 704,000 960,000
Abatement potential (ktCO2e) -‐ 2,170 13,020 23,900 32,600
Supporting data
Project/study name Tonnes of CO2e per ha per year
Cost per hectare per
year
Cost per tonne of CO2e mitigated
Reference
Assessing Opportunity Costs of Conservation: Ingredients for Protected Area Management in the Kakamega Forest, Western Kenya
US$ 207-‐323.75
Börner et al., 200964
International Small Group and Tree Planting Program, Kenya 33.92 McMahon et al., 2009
Feasibility of implementation
Barriers: Many of the areas that will naturally regenerate with improved management are used for grazing. Restoration programs will impact livelihoods. Five to ten years are needed to enable trees to reach the required height; and during this time period, the land is not available to the community. Any actions will need to consider trade-‐offs – for example, how to offset grazing, how to provide incentives to avoid grazing in protected areas.
Clear ownership of the lands and land tenure are also potential issues. Inadequate management techniques can increase the risks of fire and disease outbreaks. Weak access to market infrastructure may render communities unable to fully exploit the economic benefits of forest restoration. Research is needed to ensure that dryland conservation actions are appropriate, and that they account for future climate changes. Finally, securing adequate financing is a critical barrier.
Awareness and acceptance: In general, Kenyans are aware of the problem of deforestation and of the importance of restoring degraded areas; but education and awareness-‐raising are prerequisites to ensure communities understand the long-‐term benefits of taking grazing land out of circulation for a period of several years. REDD+ may be able to play a role, and the safeguards of REDD+ could help to ensure that communities are adequately involved in the planning and implementation of initiatives.
-‐25
-‐20
-‐15
-‐10
-‐5
0
5
10
15
20
25
2000 2005 2010 2015 2020 2025 2030
Emissions M
ton CO
2-‐eq
.Restoration of Forests on Degraded Lands
29
Reducing Deforestation and Forest Degradation The reducing deforestation and forest degradation component of REDD+ entails protecting forest areas, as well as strategies for addressing the drivers of deforestation and forest degradation. Specific strategies include promoting agricultural productivity, alternative livelihoods (such as ecotourism, production of high-‐value products), payments from the sale of carbon credits, as well as the sustainable use of non-‐forest timber products.
Current situation: Deforestation is a major issue in Kenya, and currently only 6 percent of the country's land area is forest. The two main historical drivers of deforestation and forest degradation have been demand for energy (biomass constitutes 70 percent of Kenya’s total energy demand and supplies 90 percent of energy needs in rural areas) and clearance for agriculture. The Government of Kenya has developed initial thinking on REDD activities, including the development of the REDD Readiness Preparation Proposal. This proposal identifies the following priorities: 1) reducing pressure to clear forests for agriculture and other land uses; 2) promoting sustainable utilization of forests; 3) improved forest law enforcement and governance; 4) and increasing carbon stocks (the latter being addressed in the fact sheet on forest restoration).
Low-‐carbon scenario: Increasing Kenya’s forest cover from 6 percent to 10 percent would involve the halting and eventual reversal of deforestation. Cutting the rate of deforestation for extant forest lands by 50 percent by 2030 would result in more than 60,000 hectares of avoided deforestation by 2030.
Development benefits and priorities
Development benefits: Kenya’s forest resources provide important environmental and ecosystem services, and contribute to economic development, ecotourism and water availability. Natural forests can be used in a sustainable manner for a variety of non-‐timber forest products, including mushrooms, medicines and others. Carbon payments and payments for ecosystem services are possible means for supplementing the incomes of local communities. The protection of natural forests also protects biodiversity, natural habitats and their wildlife.
Alignment with GoK priorities: Kenya’s Constitution obliges the state to work to achieve and maintain tree cover for at least 10 percent of the total land area; as such, reducing deforestation and forest degradation is a priority for the GoK. Vision 2030 provides for the rehabilitation and protection of forests in five major water catchment forests of Mau Escarpment, Mt. Kenya, Aberdare Ranges, Cherangany Hills and Mt. Elgon. The EMCA 1999. Forest Act 2005, NCCRS and REDD+ Readiness Preparation Proposal note the importance of the forestry sector in achieving the country’s climate change and development priorities.
Links to adaptation: The contribution of forests in water catchments is critical for sustaining water availability for consumption and irrigation, generation of hydropower, and also for assisting in flood prevention. Conserving forests, reducing human pressures on forests, and preserving biodiversity are examples of forest adaptation objectives that REDD activities can contribute to. Properly designed REDD projects can contribute to local adaptive capacity.
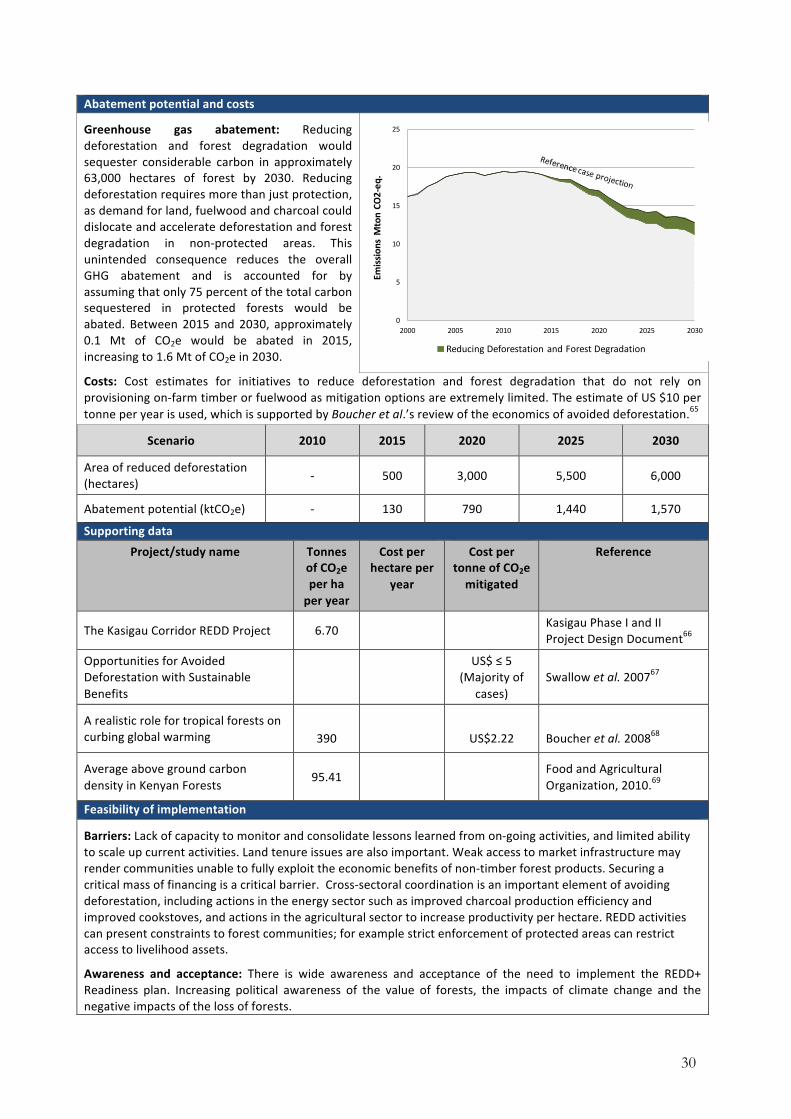
30
Abatement potential and costs
Greenhouse gas abatement: Reducing deforestation and forest degradation would sequester considerable carbon in approximately 63,000 hectares of forest by 2030. Reducing deforestation requires more than just protection, as demand for land, fuelwood and charcoal could dislocate and accelerate deforestation and forest degradation in non-‐protected areas. This unintended consequence reduces the overall GHG abatement and is accounted for by assuming that only 75 percent of the total carbon sequestered in protected forests would be abated. Between 2015 and 2030, approximately 0.1 Mt of CO2e would be abated in 2015, increasing to 1.6 Mt of CO2e in 2030.
Costs: Cost estimates for initiatives to reduce deforestation and forest degradation that do not rely on provisioning on-‐farm timber or fuelwood as mitigation options are extremely limited. The estimate of US $10 per tonne per year is used, which is supported by Boucher et al.’s review of the economics of avoided deforestation.65
Scenario 2010 2015 2020 2025 2030
Area of reduced deforestation (hectares) -‐ 500 3,000 5,500 6,000
Abatement potential (ktCO2e) -‐ 130 790 1,440 1,570
Supporting data
Project/study name
Tonnes of CO2e per ha per year
Cost per hectare per
year
Cost per tonne of CO2e mitigated
Reference
The Kasigau Corridor REDD Project 6.70 Kasigau Phase I and II Project Design Document66
Opportunities for Avoided Deforestation with Sustainable Benefits
US$ ≤ 5
(Majority of cases)
Swallow et al. 200767
A realistic role for tropical forests on curbing global warming
390
US$2.22 Boucher et al. 200868
Average above ground carbon density in Kenyan Forests
95.41 Food and Agricultural Organization, 2010.69
Feasibility of implementation
Barriers: Lack of capacity to monitor and consolidate lessons learned from on-‐going activities, and limited ability to scale up current activities. Land tenure issues are also important. Weak access to market infrastructure may render communities unable to fully exploit the economic benefits of non-‐timber forest products. Securing a critical mass of financing is a critical barrier. Cross-‐sectoral coordination is an important element of avoiding deforestation, including actions in the energy sector such as improved charcoal production efficiency and improved cookstoves, and actions in the agricultural sector to increase productivity per hectare. REDD activities can present constraints to forest communities; for example strict enforcement of protected areas can restrict access to livelihood assets.
Awareness and acceptance: There is wide awareness and acceptance of the need to implement the REDD+ Readiness plan. Increasing political awareness of the value of forests, the impacts of climate change and the negative impacts of the loss of forests.
0
5
10
15
20
25
2000 2005 2010 2015 2020 2025 2030
Emissions M
ton CO
2-‐eq
.
Reducing Deforestation and Forest Degradation
31
Endnotes
1 Food and Agricultural Organization. 2010. Global Forest Resource Assessment Country Report: Kenya. Rome: Food and Agricultural Organization. p. 9. 2 Institute of Economic Affairs 2010. Biodiversity and Development. Trade Notes 24. Nairobi: Institute of Economic Affairs. p.5. 3 Food and Agricultural Organization. 2010. p. 10. 4 Government of Kenya. 2010. Revised REDD Readiness Preparation Proposal. Submitted to the Forest Carbon Partnership Facility. Nairobi: Government of Kenya. p. 26. 5 Government of Kenya. 2010. Revised REDD Readiness Preparation Proposal. Submitted to the Forest Carbon Partnership Facility. Nairobi: Government of Kenya. p. 26. 6 Government of Kenya. 2010. REDD Readiness Preparation Proposal Annex. Nairobi: Government of Kenya. p. 7. 7 Kenya Forest Service. 2009. Strategic Plan (2009/2010 – 2013/2014). Nairobi: Government of Kenya. p. 11. 8 National Environment Management Agency and Ministry of Environment and Natural Resources. 2005. Kenya’s Climate Change Technology Needs and Needs Assessment Report under the United Nations Framework Convention on Climate Change. Draft Report. 9 World Resources Institute, Kenya Ministry of Environment and Natural Resources, Kenya Ministry of Planning and National Development and International Livestock Research Institute. 2007. Nature’s Benefits in Kenya: An Atlas of Ecosystems and Human Well-Being. Washington and Nairobi: World Resources Institute. Accessed at: http://pdf.wri.org/kenya_atlas_fulltext_150.pdf. p. 95. 10 Ministry of State for Planning, National Development and Vision 2030. 2007. Kenya Vision 2030: A Globally Competitive and Prosperous Kenya. Nairobi: Government of Kenya. p.70. 11 Kenya Forest Service. 1994. Kenya Forestry Master Plan. Development Programmes. Nairobi: Ministry of Environment and Natural Resources. p. 10. 12 Ministry of State for Planning, National Development and Vision 2030. 2007. p. 70 . 13 Nasi, R., Wunder, and. Campos J.J.. 2002. Forest Ecosystem Services: Cam They Pay Our Way Out of Deforestestation? Discussion paper prepared for the GEF for the Forestry Roundtable to be held in conjunction with the UNFF II, Costa Rica, March 11. Accessed at: http://www.cifor.org/publications/pdf_files/Books/BNasi0201.pdf. p. 6-9. 14 Minister of Environment and Mineral Resources. 2010. National Climate Change Response Strategy. Nairobi: Government of Kenya. p. 31. 15 Ministry of Forestry and Wildlife. (2012). About Us. Accessed at: http://www.forestryandwildlife.go.ke/?page_id=2. 16 Kenya Forest Service. 2012. About Kenya Forest Service. Accessed 14 June 2012 at: http://www.kenyaforestservice.org/aboutus/. 17 Ministry of Forestry and Wildlife. 2012. Accessed at: http://www.forestryandwildlife.go.ke/?page_id=2. 18 Kenya Forestry Research Institute. 2011. Mandate, Vision and Core Values. Accessed at: http://www.kefri.org/mandate.aspx. 19 Government of Kenya. 2010.. REDD Readiness Preparation Proposal Annex. Nairobi: Government of Kenya, p. 12. 20 Export Processing Zones Authority. 2005. Wood and Wood Products – Kenya, 2005. Nairobi: Export Processing Zones Authority. p. 1. 21 Food and Agricultural Organization. 2012. FAO ForeSTAT: Kenya. Accessed 14 June 2012 at: http://faostat.fao.org/site/626/DesktopDefault.aspx?PageID=626#ancor. 22 Kenya Bureau of Statistics. 2011. Economic Survey 2011. Nairobi: Government of Kenya. p. 207. 23 Kenya Forest Service. 1994. P. 181-182. 24 Parliament of Kenya. 2010. Constitution of Kenya, 2010. Nairobi: National Council for Law Reporting with the Authority of the Attorney General. p. 47. 25 Parliament of Kenya (2005). Kenya Forest Act, 2005. Kenya Gazette Supplement No. 88 (Acts No. 7). Nairobi: Government of Kenya. Art. 4-5, 21 40 and 45. 26 Government of Kenya. 2010. REDD Readiness Preparation Proposal Annex. 27 Kenya Forest Service. 2009. Strategic Plan (2009/2010 – 2013/2014). Nairobi: Government of Kenya. p. 24. 28 Ministry of State for Planning, National Development and Vision 2030. 2007. p. 106 29 Ministry of State for Planning, National Development and Vision 2030. 2008. Kenya Vision 2030: First Medium Term Plan (2008-2012). Nairobi: Government of Kenya. p. 138.
32
30 Ministry of State for Planning, National Development and Vision 2030. 2007. p. 30. 31 Inter-governmental Panel on Climate Change. 2006. 2006 IPCC Guidelines for National Greenhouse Gas Inventories. Volume 4 Agriculture, Forestry and Other Land Use. Geneva: IPCC. 32 Food and Agricultural Organization. 2010. 33 Kenya Forest Service. 1994. 34 Food and Agricultural Organization. 2010. 35 Food and Agricultural Organization. 2010. 36 The PATH model accounts for changes in the carbon pool and measures both emissions and sinks, indicating that the information can contribute to the development of a Reference Level for Kenya, which is required to develop REDD+ activities. 37 Food and Agricultural Organization. 2010. 38 Government of Kenya. 2010. REDD Readiness Preparation Proposal Annex. 39 Adapted from: International Tropical Timber Organization (ITTO). 2002. ITTO guidelines for the restoration, management and rehabilitation of degraded and secondary tropical forests. ITTO Policy Development Series No 13. Yokohama: ITTO. 40 Barrow, E., Timmer, D., White, S. and Maginnis, S. 2002. Forest Landscape Restoration. Building Assets for People and Nature - Experience from East Africa. Gland: IUCN. 41 Barrow, E., and Mogaka, H. 2007. Kenya’s Drylands – Wastelands or Undervalued National Economic Resource. Gland: IUCN. 42 Food and Agricultural Organization. 2010. 43 Food and Agricultural Organization. 2010. 44 Börner, J., Mburu, J., Guthiga P., and Wumbua. S. 2009. “Assessing Opportunity Costs of Conservation: Ingredients for Protected Area Management in the Kakamega Forest, Western Kenya.” Forest Policy and Economics 11 (7): 459-467. 45 Green Belt Movement. 2010. Aberdare Range / Mt. Kenya Small Scale Reforestation Initiative Kirimara-Kithithina Small Scale A/R Project - Project Design Document. Accessed at: http://cdm.unfccc.int/Projects/DB/JACO1260322919.16/view. 46 Boucher, D. 2008. Out of the Woods: A Realistic Role for Tropical Forests in Curbing Global Warming. Union of Concerned Scientists. p. 15-16. 47 Swallow, B., van Noordwijk, M., Dewi, S., Murdiyarso, D., White, D., Gockowski, J., Hyman, G/., Budidarsono, S., Robiglio, V., Meadu, V., Ekadinata, A., Agus, F., Hairiah, K., Mbile, P.,. Sonwa. D.J. and Weise, S. 2007. Opportunities for Avoided Deforestation with Sustainable Benefits. Interim Report. Nairobi: ASB Partnership for the Tropical Forest Margins. 48 Mogaka, H., Gishere, S., Davis, R. and Hirji, R. 2006. Climate Variability and Water Resources Degradation in Kenya: Improving water resources development and management. World Bank Working Paper No. 69. Washington D.C.: World Bank. 49 Barrow, E., and Mogaka, H. 2007. 50 Minister of Environment and Mineral Resources. p. 37. 51 Food and Agricultural Organization of the United Nations and Center for International Forestry Research (2005). “Forests and floods: Drowning in fiction or thriving on facts?” Forest Perspectives 2. Bangkok: FAO and Bogor: CIFOR. 52 United Nations Development Programme (no date). Kenya Natural Disaster Profile. Enhanced Security Unit. Accessed at: http://mirror.undp.org/kenya/KenyaDisasterProfile.pdf. 53 Food and Agricultural Organization. 2010. p. 14 54 Belcher, B., and Schreckenberg, K. 2007. Commercialisation of Non-Timber Forest Products: A Reality Check. Development Policy Review, 25(3): 355–377. 55 Wildlife Works Carbon LLC. (2008). The Kasigau Corridor REDD Project Phase I – Rukinga Sanctuary. Project Design Document (PDD) For Validation Using the Climate, Community and Biodiversity (CCB) Project Design Standards Second Edition – December 2008. Accessed at: http://www.climate-standards.org/projects/files/taita_taveta_kenya/Rukinga_CCB_PDD_Ver_2_0.pdf. p. 33, 43. 56 Chiramba, T., Mogoi, S., Martinez I., and Jones, T. 2011. Payment for Environmental Services pilot project in Lake Naivasha basin, Kenya – a viable mechanism for watershed services that delivers sustainable natural resource management and improved livelihoods. Presentation to UN-Water International Conference ‘Water in the Green Economy in Practice: Towards RIO+20, Zaragoza, Spain, 3-5 October. p.1. 57 Pro-poor Rewards for Environmental Services in Africa (PRESA). 2011. PRESA Investment Brief: 2008-2011. p. 4. 58 PRESA. 2011. p. 5-6.
33
59 Kenya Forest Service. 2011. On-Farm Commercial Forestry in Kenya. Nairobi: Government of Kenya. p.3. 60 Green Belt Movement. 2010. 61 Stockholm Environment Institute. 2009. Opportunities for Low-Carbon Growth in Kenya. 62 Lung, M., 2008. Estimation of Ex ante Forest Carbon Stocks and Projected Net CO2 Change from Forest Again, Kakamega Forest, Kenya. Eco2librium LLC Working Paper. Accessed at: http://www.eco2librium.net/sitebuildercontent/sitebuilderfiles/C_analysis.pdf. 63 Mutua, K. 2012. “Kenya loses 5.6 million trees daily.” Daily Nation. p. 9. 64 Börner, J. et al. 2009. 65 Boucher, D. 2008. p. 15-16 66 Wildlife Works Carbon LLC. 2008. 67 Swallow, B., et al., 2007. 68 Boucher, D. 2008. 69 Food and Agricultural Organization. 2010.
34
References
Akotsi, Eric and Michael Gachanja. 2004. Changes in Forest Cover in Kenya’s 5 “Water Towers”: 2000-2003. Kenya Forests Working Group.
Barrow, E., and Mogaka, H. 2007. Kenya’s Drylands – Wastelands or Undervalued National Economic Resource. Gland: IUCN.
Barrow, E., Timmer, D., White, S. and Maginnis, S. 2002. Forest Landscape Restoration. Building Assets for People and Nature - Experience from East Africa. Gland: IUCN.
Belcher, Brian, and Kathrin Schreckenberg. 2007. Commercialisation of Non-Timber Forest Products: A Reality Check. Development Policy Review, 25.3: 355–377.
Börnera, Jan, John Mburu, Paul Guthiga and Stephen Wumbua. 2009. Assessing Opportunity Costs of Conservation: Ingredients for Protected Area Management in the Kakamega Forest, Western Kenya. Forest Policy and Economics 11.7: 459-467.
Boucher, Doug. 2008. Out of the Woods: A Realistic Role for Tropical Forests in Curbing Global Warming. Union of Concerned Scientists.
Chiramba, Thomas, Silas Mogoi, Isabel Martinez and Tim Jones. 2011. “Payment for Environmental Services pilot project in Lake Naivasha basin, Kenya – a viable mechanism for watershed services that delivers sustainable natural resource management and improved livelihoods.” Presentation to UN-Water International Conference Water in the Green Economy in Practice: Towards RIO+20, Zaragoza, Spain, 3-5 October. Available from: http://www.un.org/waterforlifedecade/green_economy_2011/pdf/session_4_biodiversity_protection_cases_kenya.pdf.
Consultative Group on International Agricultural Research. 2006. Baseline GHG Emissions from the Agricultural Sector and Mitigation Potential in Countries of East and West Africa. Working Paper No. 13. CGIAR Research Program on Climate Change, Agriculture and Food Security (CCAFS).
Export Processing Zones Authority. 2005. Wood and Wood Products – Kenya, 2005. Nairobi: Export Processing Zones Authority.
Food and Agricultural Organization. 2010. Global Forest Resource Assessment Country Report: Kenya. Rome: Food and Agricultural Organization.
Food and Agricultural Organization. 2012. FAOS ForeSTAT: Kenya. Accessed 14 June 2012 at: http://faostat.fao.org/site/626/DesktopDefault.aspx?PageID=626#ancor
Food and Agricultural Organization and Center for International Forestry Research. 2005. “Forests and floods: Drowning in fiction or thriving on facts?” Forest Perspectives 2. Bangkok: FAO and Bogor: CIFOR.
Forest Carbon Partnership Facility. 2011. REDD Readiness Progress Factsheet 2011. Country: Kenya. Washington, D.C.: Forest Carbon Partnership Facility.
Government of Kenya. 2010. REDD Readiness Preparation Proposal Annex. Nairobi: Government of Kenya.
Government of Kenya. 2010. Revised REDD Readiness Preparation Proposal. Submitted to the Forest Carbon Partnership Facility. Nairobi: Government of Kenya.
Green Belt Movement. 2010. Aberdare Range / Mt. Kenya Small Scale Reforestation Initiative Kirimara-Kithithina Small Scale A/R Project - Project Design Document. Accessed at: http://cdm.unfccc.int/Projects/DB/JACO1260322919.16/view.
Institute of Economic Affairs. 2010. Biodiversity and Development. Trade Notes 24. Nairobi: Institute of Economic Affairs.
35
Inter-governmental Panel on Climate Change. 2006. 2006 IPCC Guidelines for National Greenhouse Gas Inventories. Volume 4 Agriculture, Forestry and Other Land Use. Geneva: IPCC.
Kenya Bureau of Statistics. 2011. Economic Survey 2011. Nairobi: Government of Kenya.
Kenya Forest Service. 1994. Kenya Forestry Master Plan. Development Programmes. Nairobi: Ministry of Environment and Natural Resources.
Kenya Forest Service. 2009. Strategic Plan (2009/2010 – 2013/2014). Nairobi: Government of Kenya.
Kenya Forest Service. 2011. On-Farm Commercial Forestry in Kenya. Nairobi: Government of Kenya.
Kenya Forest Service. 2012. About Kenya Forest Service. Accessed 14 June 2012 at: http://www.kenyaforestservice.org/aboutus/.
Kenya Forest Service. 2012. Personal communication on 5th June 2012.
Kenya Forestry Research Institute. 2011. Mandate, Vision and Core Values. Accessed at: http://www.kefri.org/mandate.aspx.
Lung, M., 2008. Estimation of Ex ante Forest Carbon Stocks and Projected Net CO2 Change from Forest Again, Kakamega Forest, Kenya. Eco2librium LLC Working Paper. Accessed at: http://www.eco2librium.net/sitebuildercontent/sitebuilderfiles/C_analysis.pdf.
Ministry of Agriculture. 2012. Personal Communication on May 29th, 2012.
Ministry of Environment and Natural Resources. 2007. Sessional Paper no. 1 of 2007 on Forest Policy. Nairobi: Government of Kenya.
Minister of Environment and Mineral Resources. 2010. National Climate Change Response Strategy. Nairobi: Government of Kenya.
Ministry of Forestry and Wildlife. 2011. National Forest Policy. 2008. Draft Policy document- June 2011.
Ministry of Forestry and Wildlife. 2012. About Us. Accessed at: http://www.forestryandwildlife.go.ke/?page_id=2.
Ministry of State for Planning, National Development and Vision 2030. 2007. Kenya Vision 2030: A Globally Competitive and Prosperous Kenya. Nairobi: Government of Kenya.
Ministry of State for Planning, National Development and Vision 2030 (2008). Kenya Vision 2030: First Medium Term Plan (2008-2012). Nairobi: Government of Kenya.
Mogaka, H., Gishere, S., Davis, R. and Hirji, R. 2006. Climate Variability and Water Resources Degradation in Kenya: Improving water resources development and management. World Bank Working Paper No. 69. Washington D.C.: World Bank.
Mutua, K. 2012. Kenya loses 5.6 million trees daily. Daily Nation. p. 9.
Nasi, R., Wunder, S. , and Campos J.J. 2002. Forest Ecosystem Services: Can They Pay Our Way Out of Deforestation? Discussion paper prepared for the GEF for the Forestry Roundtable to be held in conjunction with the UNFF II, Costa Rica on March 11, 2002. http://www.cifor.org/publications/pdf_files/Books/BNasi0201.pdf.
National Environment Management Agency and Ministry of Environment and Natural Resources. 2005. Kenya’s Climate Change Technology Needs and Needs Assessment Report under the United Nations Framework Convention on Climate Change. Draft Report.
Parliament of Kenya. 2005. Kenya Forest Act, 2005. Kenya Gazette Supplement No. 88 (Acts No. 7). Nairobi: Government of Kenya.
36
Parliament of Kenya. 2010. Constitution of Kenya, 2010. National Council for Law Reporting. Nairobi: Government of Kenya.
Permesan, C. and Yohe, G. 2003. A Globally Coherent Fingerpprint of Climate Change Impacts Across Natural Ecosystems. Nature, 421.
Pro-poor Rewards for Environmental Services in Africa. 2011. PRESA Investment Brief 2008-2011. Accessed at: http://presa.worldagroforestry.org//WP-CONTENT/UPLOADS//2011/04/PRESA_investment_brief_2011.pdf.
Stockholm Environment Institute. 2009. Opportunities for Low-Carbon Growth in Kenya.
Swallow, B., van Noordwijk, M., Dewi, S., Murdiyarso, D., White, D., Gockowski, J., Hyman, G/., Budidarsono, S., Robiglio, V., Meadu, V., Ekadinata, A., Agus, F., Hairiah, K., Mbile, P.,. Sonwa. D.J. and Weise, S. 2007. Opportunities for Avoided Deforestation with Sustainable Benefits. Interim Report. Nairobi: ASB Partnership for the Tropical Forest Margins.
United Nations Development Programme. no date. Kenya Natural Disaster Profile. Enhanced Security Unit. Accessed at: http://mirror.undp.org/kenya/KenyaDisasterProfile.pdf.
United Nations Framework Convention on Climate Change. 2005. Report of the Conference of the Parties serving as the meeting of the Parties to the Kyoto Protocol on its first session, held at Montreal from 28 November to 10 December 2005. Addendum Part Two: Action taken by the Conference of the Parties serving as the meeting of the Parties to the Kyoto Protocol at its first session, Annex. Paragraph 1, p.5.
Wildlife Works Carbon LLC (2008). The Kasigau Corridor Project Phase I - Rukinga Sanctuary. Accessed at: http://www.climate-standards.org/projects/files/taita_taveta_kenya/Rukinga_CCB_PDD_Ver_2_0.pdf.
Wildlife Works Carbon LLC. (2008). The Kasigau Corridor REDD Project Phase I – Rukinga Sanctuary. Project Design Document (PDD) For Validation Using the Climate, Community and Biodiversity (CCB) Project Design Standards Second Edition – December 2008. Available from: http://www.climate-standards.org/projects/files/taita_taveta_kenya/Rukinga_CCB_PDD_Ver_2_0.pdf.
World Resources Institute, Kenya Ministry of Environment and Natural Resources, Kenya Ministry of Planning and National Development and International Livestock Research Institute. 2007. Nature’s Benefits in Kenya: An Atlas of Ecosystems and Human Well-Being. Washington and Nairobi: World Resources Institute. Accessed at: http://pdf.wri.org/kenya_atlas_fulltext_150.pdf.