kenzo fry measuring how equitable your service delivery is
TRANSCRIPT

Kenzo Fry
Measuring how equitable your service delivery is

Learning outcomes
• Background information on poverty and poverty measures
• How wealth quintile calculation works
• What is in the toolkit itself and how to use it
• Interpreting and using the results

Equity
• Level the playing field
• Serve the marginalised
• Reaching the poor
• One of the global goals of franchising

Poverty
• Relative poverty
• Absolute poverty
When do you need to know about relative and when absolute?

Types of poverty measure
• Poverty lines - $1.25 per day
• Multi-Dimensional Poverty Index
• Wealth quintiles (based on wealth index)
Selected as the metric for the equity goal

Why wealth quintiles?
• Relative poverty – relevant to programme decisions anywhere
• Data source - DHS• Standardised and high quality• Easy to access• Regularly updated • Includes useful additional
variables
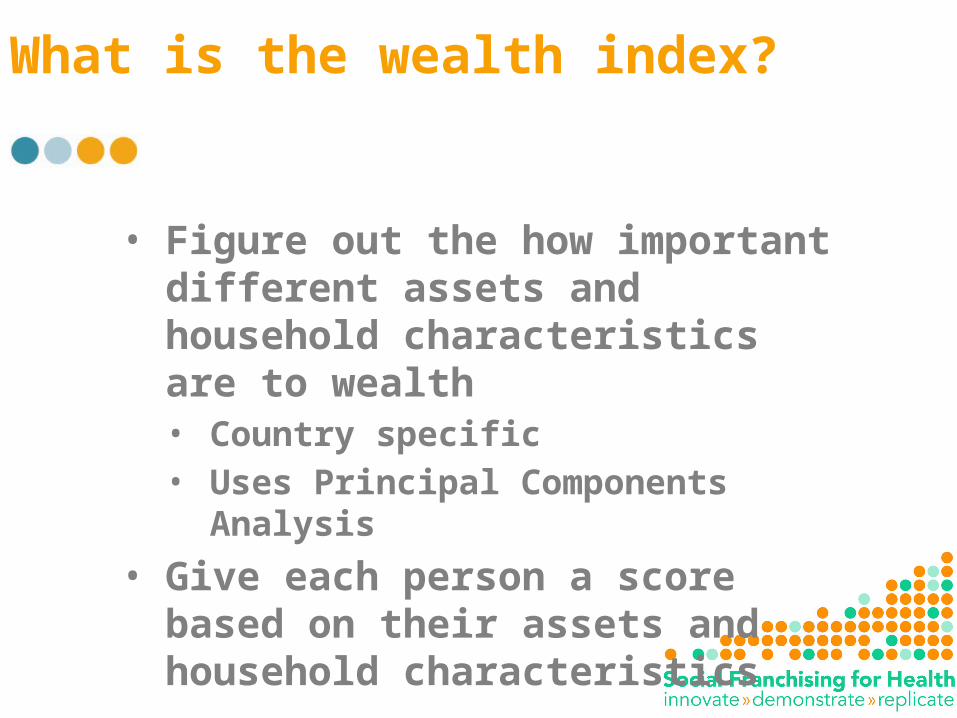
What is the wealth index?
• Figure out the how important different assets and household characteristics are to wealth• Country specific• Uses Principal Components Analysis
• Give each person a score based on their assets and household characteristics

1 million people
Place the population in order of wealth using the wealth index
Lowest wealth index score
Highest wealth index score
Quintile 1(200,000 people)
Quintile 2(200,000 people)
Quintile 3(200,000 people)
Quintile 4(200,000 people)
Quintile 5(200,000 people)
Split into five equal ‘quintiles’
i
ii
iii Use a client survey to put clients into quintiles

Toolkit
• i and ii have been done already for countries with a recent DHS
• You just have to do iii • Conduct a client survey• 10 steps using pre-prepared tools
• Go to presentationofdata.com

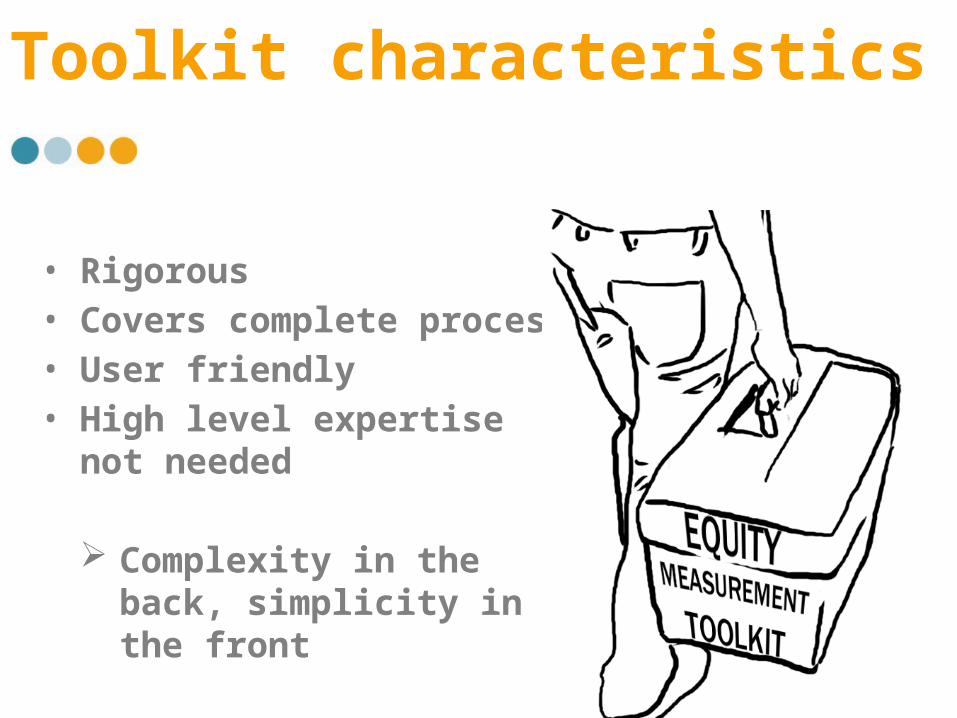
Toolkit characteristics
• Rigorous• Covers complete process• User friendly• High level expertise not
needed
Complexity in the back, simplicity in the front
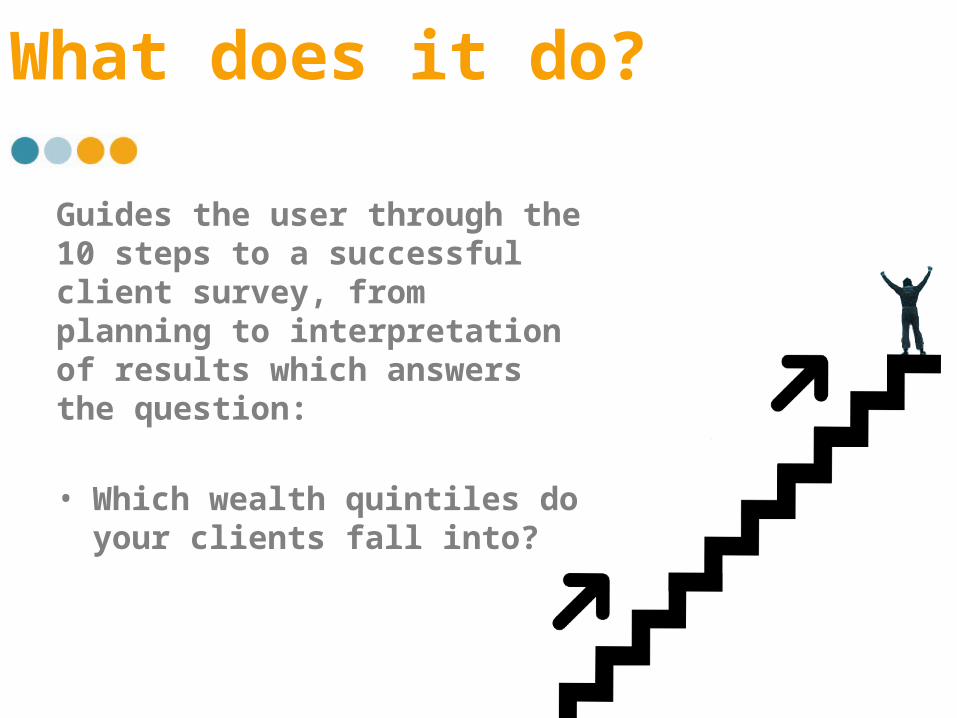
What does it do?
Guides the user through the 10 steps to a successful client survey, from planning to interpretation of results which answers the question:
• Which wealth quintiles do your clients fall into?

What is in the toolkit?
• Step by Step guide to survey process (written and video tutorials)
• Questionnaires• Template workplan• Sampling tool• Data collection team training template• Data entry tool• Data analysis tool

Step 1
Define what you want to measure and why
• Work with decision makers
• How will results be used?• Who do you need to know about?• What do you need to know about them?


Step 2
Recruit the survey team• Characteristics of each role
Step 3Plan the survey • Create a workplan

Step 4
Sampling• Use the Excel tool provided
Series of simple questions • Decide whether to conduct interviews in
homes or at facilities• Additional detail on methods, sub-groups,
what precision means

Step 5Get relevant permissions• Ethics, government etc
Step 6Train data collection team • Modify training curriculum• Interactive sessions• How select respondents• How to conduct interviews• Supervised practice

Step 7
Data collection• Logistics and organisation• Supervision• Observation• Questionnaire checks

• Fill in example questionnaire as if you were one of your franchises clients

Step 8Data entry• Modify preprepared tool• Clean, error free data
Step 9Data analysis• Choose from EpiInfo, SPSS,
STATA• Use preprepared syntax

• Calculate your clients score• Put your client into a wealth quintile

Step 10
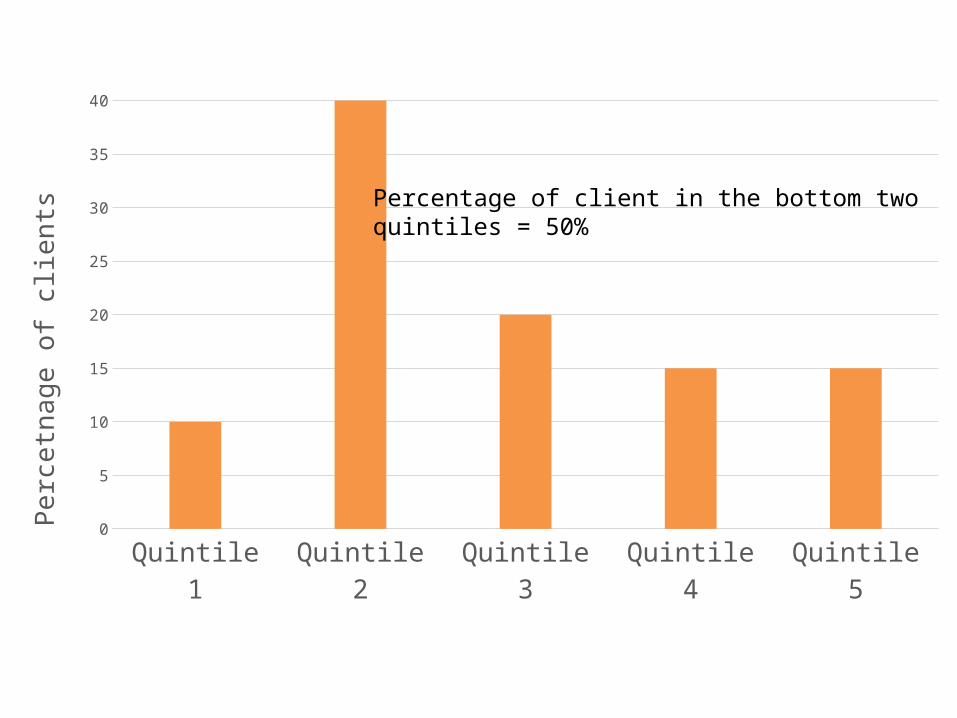
Interpret results• Understanding
quintile graphs• The “bottom two
quintiles” metric

Quintile 1 Quintile 2 Quintile 3 Quintile 4 Quintile 50
5
10
15
20
25
30
35
40
Perc
enta
ge o
f clie
nts
Percentage of client in the bottom two quintiles = 40%

Quintile 1 Quintile 2 Quintile 3 Quintile 4 Quintile 50
5
10
15
20
25
30
35
40
Perc
enta
ge o
f clie
nts
Percentage of client in the bottom two quintiles = 70%

Quintile 1 Quintile 2 Quintile 3 Quintile 4 Quintile 50
5
10
15
20
25
30
35
40
Perc
enta
ge o
f clie
nts
Percentage of client in the bottom two quintiles = 15%
Quintile 1 Quintile 2 Quintile 3 Quintile 4 Quintile 50
5
10
15
20
25
30
35
40
Perc
etna
ge o
f clie
nts
Percentage of client in the bottom two quintiles = 50%

Group discussion
Would this information would be useful to your programme?What decisions would you take if your franchise had a low percentage of clients in the bottom two quintiles?What challenges would arise from trying to implement these 10 steps?

Quiz
• Why are there two surveys involved in the process?
• What would it mean if 21% of clients were in the bottom two quintiles?
• In what circumstances can you change the wealth index questions?

Toolkit version 2
More countries Fewer questions? Same questions everywhere? Even simpler data collection, entry
and analysis using an app?

Inadequate sample
Biased sample

How many facilities are there in total
Include all facilities in
sample
Can you feasibly collect data at all
of them?
Include all facilities in
sample
Select 30 or more of the facilities
using the sample selector tool
30 or less
More
than 30
Yes
No
Determine sample size using
formula (Minimum sample size
=100)
Determine sample size
using formula (Minimum sample size
=200)
Determine number of clients
to interview at each facility
based on number of clients they serve per day