kepler light curve of v344 lyrae: constraining the thermal …
TRANSCRIPT

The Astrophysical Journal, 725:1393–1404, 2010 December 20 doi:10.1088/0004-637X/725/2/1393C© 2010. The American Astronomical Society. All rights reserved. Printed in the U.S.A.
THE KEPLER LIGHT CURVE OF V344 Lyrae: CONSTRAINING THE THERMAL–VISCOUS LIMIT CYCLEINSTABILITY
J. K. Cannizzo1,2
, M. D. Still3,4
, S. B. Howell5, M. A. Wood
6, and A. P. Smale
21 CRESST/Joint Center for Astrophysics, University of Maryland, Baltimore County, Baltimore, MD 21250, USA; [email protected]
2 Astroparticle Physics Laboratory, NASA-Goddard Space Flight Center, Greenbelt, MD 20771, USA3 Bay Area Environmental Research Inst., Inc., 560 Third St. W, Sonoma, CA 95476, USA; [email protected]
4 NASA-Ames Research Center, Moffet Field, CA 94035, USA5 National Optical Astronomy Observatory, Tucson, AZ 85719, USA
6 Department of Physics and Space Sciences, Florida Institute of Technology, 150 W. University Blvd., Melbourne, FL 32901, USAReceived 2010 May 6; accepted 2010 September 26; published 2010 November 29
ABSTRACT
We present time-dependent modeling based on the accretion disk limit cycle model for a 270 d light curve ofthe short-period SU UMa-type dwarf nova V344 Lyr taken by Kepler. The unprecedented precision and cadence(1 minute) far surpass that generally available for long-term light curves. The data encompass two superoutburstsand 17 normal (i.e., short) outbursts. The main decay of the superoutbursts is nearly perfectly exponential,decaying at a rate ∼12 d mag−1, while the much more rapid decays of the normal outbursts exhibit a faster-than-exponential shape. Our modeling using the basic accretion disk limit cycle can produce the main featuresof the V344 Lyr light curve, including the peak outburst brightness. Nevertheless, there are obvious deficienciesin our model light curves. (1) The rise times we calculate, both for the normal and superoutbursts, are too fast.(2) The superoutbursts are too short. (3) The shoulders on the rise to superoutburst have more structure than theshoulders in the observed superoutbursts and are too slow, comprising about a third to half of the total viscousplateau, rather than the ∼10% observed. However, one of the αcold ↔ αhot interpolation schemes we investigate(one that is physically motivated) does yield longer superoutbursts with suitably short, less structured shoulders.
Key words: novae, cataclysmic variables – stars: dwarf novae – stars: individual (V344 Lyr) – white dwarfs
Online-only material: color figures
1. INTRODUCTION
Dwarf novae constitute a subclass of the cataclysmic variables(CVs; Warner 1995b), semi-detached interacting binaries inwhich a Roche-lobe filling secondary transfers matter to a moremassive white dwarf (WD). The transferred material possessesangular momentum, and therefore can only “fall” toward theprimary down to a radius determined by its specific angularmomentum (Lubow & Shu 1975). This angular momentumbarrier is overcome by angular momentum transport within theaccretion disk which carries angular momentum outward andmass inward. Current thinking about the physical mechanismresponsible for accretion centers on the magnetorotationalinstability (MRI; Balbus & Hawley 1998) in which the shearingamplification of a weak seed magnetic field leads to turbulenttransport.
V344 Lyr is a short-period dwarf nova, of subtype SU UMa(Porb = 2.1 hr; Still et al. 2010) exhibiting a supercycle pattern(109.6 d; Kato et al. 2002) consisting of superoutbursts separatedby normal outbursts. Superoutbursts are long outbursts withslow, exponential decays exhibiting superhumps—modulationsin the light curve at a period greater than the orbital period bya few percent. The data presented in Kato et al. reveal only thebrightest portions of the superoutbursts; the fainter portions andall of the normal outbursts lie below the lower limit of detection.
The Kepler data set for V344 Lyrae (Kepler ID7659570)—270 d at 1 minute cadence—provides an extraor-dinary resource for accretion disk modelers. The accretion disklimit cycle mechanism, which is currently employed to accountfor dwarf nova outbursts, is based on the storage of materialduring quiescence in a non-steady-state configuration, followedby a dumping of matter onto the accreting WD when a critical
surface density is attained in the disk, producing an outburst.During outburst the disk is roughly in steady state, except forthe action of a cooling front that begins at the outer disk andmoves inward. The thermal–viscous limit cycle model is nota complete model for the accretion disk, but rather primarilya model for the outbursts; for instance, it fails to account forthe high X-ray luminosities seen in dwarf novae in quiescence(Wheatley et al. 2003; Mukai et al. 2009).
Previous attempts at constraining physical parameters ofthe model have relied on AAVSO (American Association ofVariable Star Observers) and RASNZ (Royal AstronomicalSociety of New Zealand) data for the long-term light curves.These data are typically given as 1 d means, with large attendanterror bars (∼0.3–0.5 mag). The Kepler data provide an entirelynew level of precision, and allow detailed model constraints.The viscosity parameter α (Shakura & Sunyaev 1973) sets thedisk timescales. To first order, αcold controls the recurrence timefor outbursts, and αhot sets the duration of the outbursts. Previousefforts, for instance by Smak (1984, hereafter S84), utilized the“Bailey relation” relating the rate of the fast decay in dwarfnovae with orbital period to infer that αhot � 0.1–0.2. Thisremains the only firm constraint we have in astronomy forα in ionized gas, and has served as a benchmark value formodelers calculating the efficiency of the MRI in accretiondisks (e.g., Hirose et al. 2009). By comparing theoreticalmodeling of the MRI with the observational constraints, Kinget al. (2007) showed that theoretical values tend to be at leastan order of magnitude smaller. Most of the simulations havestudied the growth and subsequent nonlinear saturation of theMRI using idealized “shearing boxes” without realistic verticalstructure, and for such calculations the asymptotic strengthof the magnetic field decreases with increasing resolution
1393

1394 CANNIZZO ET AL. Vol. 725
(Fromang & Papaloizou 2007). Vishniac (2009) argues thatcurrent models are not sophisticated enough in terms of theirdynamic range and modeling of the vertical disk structure toallow a realistic treatment of such important effects as magneticbuoyancy and vertical transport of magnetic helicity by turbulenteddies, and therefore comparisons of theoretical α values withthose inferred from observations are specious at the presenttime.
Our goal in this work is to find model parameters that canaccount for the gross properties of the long-term V344 Lyr lightcurve. There will be additional features in the light curve thatcan be compared to the detailed model light curves in order togain insight into shortcomings of the model. We also investigatesystematic effects such as the number of grid points and timestep size.
In Section 2, we present an overview of the physics ofaccretion disks. In Section 3 we discuss the V344 Lyr lightcurve, in Section 4 we present a review of viscous decays inseveral well-studied dwarf novae, in Section 5 we detail thenumerical model, in Section 6 we present the results, in Section 7we discuss the results in a larger context, and in Section 8 wesum up.
2. ACCRETION DISK PHYSICS
2.1. Axisymmetric Models
In the accretion disk limit cycle model, gas accumulatesin quiescence and accretes onto the central object in outburst(e.g., Cannizzo 1993a; Lasota 2001 for reviews). The phases ofquiescence and outburst are mediated by the action of heatingand cooling fronts that traverse the disk and bring about phasetransitions between low and high states, consisting of neutraland ionized gas, respectively. During quiescence, when thesurface density Σ(r) at some radius within the disk exceedsa critical value Σmax(r), a transition to the high state is initiated;during outburst, when Σ(r) drops below a different criticalvalue Σmin(r), a transition to the low state is initiated. Low-to-high transitions can begin at any radius, whereas high-to-lowtransitions begin at the outer disk edge. This situation comesabout because in the outburst disk Σ(r) ∝ r−3/4 (roughly), andthe critical surface densities both increase with radius. Since thedisk mass accumulated in quiescence is bounded by Σmax(r) andΣmin(r), one can define a maximum disk mass
Mdisk,max =∫
2πrdrΣmax(r) (1)
and a minimum disk mass
Mdisk,min =∫
2πrdrΣmin(r) (2)
which will bound the general, time-dependent disk mass.For normal, “short” outbursts, only a few percent of the stored
gas accretes onto the central object: the thermal timescale ofa thin disk is short compared to the viscous timescale, andthe cooling front that is launched from the outer edge of thedisk almost as soon as the disk enters into outburst traversesthe disk and reverts it back to quiescence. For disks that havebeen “filled” to a higher level with respect to Mdisk,max, thesurface density in the outer disk can significantly exceed thecritical surface density Σmin. In order for the cooling front tobegin, however, the outer surface density Σ(router) must dropbelow Σmin(router). Disks in this state generate much longer
outbursts, with slower “viscous” plateaus, because the entiredisk must remain in its high, completely ionized state untilenough mass has been lost onto the WD for the conditionΣ(router) < Σmin(router) to be satisfied. The slow decay associatedwith a superoutburst is a direct reflection of the viscous timescalein the outer disk, whereas the subsequent faster decay revealsthe thermal timescale. Although the decays of dwarf novae at agiven orbital period are fairly uniform, and form the basis for theBailey relation, the rise times show a greater variety, reflectingthe fact that the outburst can be triggered anywhere in the disk(Cannizzo 1998b). Inside-out bursts tend to produce slow-risetimes, whereas outside-in bursts produce fast rises (Cannizzoet al. 1986). Van Paradijs (1983) undertook a statistical study ofoutburst properties of dwarf novae spanning a range in orbitalperiod, from <2 hr to ∼10 hr. By studying separately thebehavior of long and short outbursts versus orbital period, hefound that the apparent strong contrast between superoutburstsand normal outbursts in the SU UMa systems is due to thefact that the widths of the short (narrow) outbursts scale withorbital period, whereas the widths of the long (wide) outburstsare relatively constant. Van Paradijs’ argument is strengthenedby the more extensive data set examined by Ak et al. (2002) inwhich the linear trend in the narrow width–Porb relation is moreobvious (compare Figure 4 from Ak et al. with Figure 3(b) fromvan Paradijs). In these studies, the widths of the outbursts were“corrected” by subtracting the rise and decay times.
For any dynamical system in which a variety of time scalescontribute to a physical observable, in this case the flux fromthe accretion disk, the controlling timescale will be the slowestone. Since all the disk time scales—dynamical, thermal, andviscous—increase with radius, the timescale associated with theviscous plateau provides direct information about the viscoustimescale tvisc at the outer edge of the disk.
Warner (1995a, 1995b) presents a simple physical modelfor the state of the disk during superoutburst. During thesuperoutburst, the disk is roughly in steady state with Σ(r) ∝r−3/4 out to some rd which represents the radius at whichthe outward moving heating front stalls. The rate of accretionwithin the disk is much greater than the mass transfer rate fromthe secondary star, which can be neglected during this time.Therefore the mass of the hot, accreting disk is
Mdisk ≈ 8π
3r2d Σmin(rd ). (3)
From the standard accretion disk theory relating effectivetemperature with accretion rate in a steady-state disk (Shakura& Sunyaev 1973), one has
Mdisk = − 8πσ
3GM1T 4
eff(rd )r3d , (4)
where Teff(rd ) = Teff(Σmin[rd ]) is the effective temperatureassociated with Σmin(rd ). Combining Equations (3) and (4)(same as Equations (15) and (16) from Warner 1995a, andEquations (3.46) and (3.47) from Warner 1995b) yields
dMdisk
Mdisk≈ − 5rdσT 4
eff(rd )
3GM1Σmin(rd )dt. (5)
Since the right-hand side (excluding dt) is constant, the solutionfor the mass of the hot disk, and also its derivative, is a decreasingexponential function. Using power-law scalings for Teff(rd ) andΣmin(rd ), setting rd equal to the 3:1 resonance radius with the

No. 2, 2010 THE KEPLER LIGHT CURVE OF V344 Lyrae 1395
binary orbital period, and noting that luminosity varies as Mdisk,one can show (cf. Equation (20) of Warner 1995a)
tvisc ≈ 17 d α−4/5−1 P
1/4h m
1/61 , (6)
where α−1 = α/0.1, Ph is the orbital period in hr, and m1 =M1/M�. (The α in this context is the hot state value.) Within theviscous plateau portion of a superoutburst, the instigation andpropagation of a cooling front at the outer edge is thwarted byvirtue of excessive mass in the disk. This phenomenon is not newand has been seen in numerous previous studies (e.g., Cannizzo1993b, C93b; Hameury et al. 1998, H98; Ludwig & Meyer1998; Buat-Menard et al. 2001; Schreiber et al. 2003). Theviscous time does not represent the duration of the outburst itself,but rather the timescale (approximately in d mag−1) associatedwith the viscous plateau; it represents an e-folding time for thedecrease of disk mass.
2.2. Non-axisymmetric Models
Whitehurst (1988) discovered a hydrodynamical instabilitythat can occur in the outer parts of accretion disks when themass ratio q = M2/M1 is less than 1/4. For these extrememass ratio systems, expected in CVs below the period gap ifthe secondary fills its Roche lobe, the outer part of the disk canlie beyond the point of 3:1 resonance with the binary period.The outer disk can then be excited by the inner Lindbladresonance (Lubow 1991a, 1991b), causing the global diskoscillation mode that is observed as common superhumps.Before the onset of the superhump oscillation, there are well-known spiral dissipation waves in the disk that are fixed in theco-rotating frame. Once the superhump oscillation begins, thesespiral arms advance 180◦ every superhump cycle.7 As a givenarm passes between the two stars, it expands outward in theshallower potential, but as fluid in that arm compresses back intothe disk as the disk is maximally distorted, viscous dissipationcauses a peak in the photometric light curve (Simpson & Wood1998). A secondary source of the superhump signal is caused bythe variable distance the mass stream must fall from the L1 pointto the edge of the non-axisymmetric, flexing disk. Because theouter disk is thought to expand during superoutburst, potentiallybeyond the 3:1 radius, the “tidal instability” model provides anatural explanation for superhumps. If the mass ratio is extremeenough, superhumps can also occur outside of superoutburstsbecause the disk can remain extended beyond the 3:1 radius,and therefore continue oscillating even into quiescence. Osaki(1989a, 1989b) combined the accretion disk limit cycle modelwith Whitehurst’s tidal instability model and proposed the“thermal–tidal” instability model (TTIM) for superoutbursts.This model posits that the presence of an oscillating precessingdisk, triggered by the migration of gas beyond the 3:1 resonanceradius, also leads to a greatly enhanced tidal torque acting onthe disk. This ultimately contracts the outer disk and leads to asuperoutburst. Thus, in the TTIM one has the usual hysteresisrelation between surface density and temperature in the disk, andalso a hysteresis relation between the total angular momentum ofthe disk and the tidal torque acting on the outer disk. (The latterhysteresis is somewhat speculative.) This model was examinedin detail and compared to the enhanced mass transfer model(EMTM) for superoutbursts by Ichikawa et al. (1993) and laterworkers, most recently Schreiber et al. (2004).
7 See, for example, www.astro.fit.edu/wood/visualizations.html
Figure 1. Comparison of the Johnson V-band filter (red) with the Kepler filter(blue).
(A color version of this figure is available in the online journal.)
For completeness, we note that Smak has recently challengedthe conventional wisdom that superhumps are due to a precess-ing, eccentric disk (Smak 2009a, 2009b, 2009c, 2009d). Smak(2009a) presents a re-analysis of data taken by earlier workerson Z Cha, WZ Sge, OY Car, and IY UMa and claims that avariety of errors, including miscalculated beat phases and anassumption that observed eclipses are pure disk eclipses, led toerroneously large values of the eccentricity e. Smak’s re-analysisof the disk eccentricity in Z Cha leads to e = 0.05±0.05. Smak(2009b) compares in detail observed values for the amplitudesof superhumps with theoretical values determined from bolo-metric light curves produced by smooth-particle hydrodynamicscalculations. He finds the observed values to be ∼10 times largerthan the theoretical values. Smak (2009c) presents a re-analysisof five eclipses of Z Cha observed by Warner & O’Donoghue(1988). Smak examines two local minima at orbital phasesΦ ≈ −0.05 and 0.04. He argues that the first minimum is notdue to an occultation but rather absorption in the mass overflowstream, and the second minimum coincides with the trajectoryof the mass overflow stream. The upshot of his analysis is thatsuperhumps are due to modulated mass transfer which leads toperiodically enhanced dissipation of the stream kinetic energy.Smak (2009d) presents evidence for periodically variable irra-diation of secondary components and proposes that superhumpsare due to enhanced dissipation of the stream kinetic energy. Heoutlines specific future modeling efforts that might clarify theoverall picture.
3. KEPLER LIGHT CURVE OF V344 Lyr
The bandpass utilized by Kepler is considerably broaderthan the standard Johnson V band. Figure 1 gives a compari-son of the two filters.8 Throughout this paper, we will refer toJohnson V apparent and absolute magnitudes using V and MV ,and Kepler apparent and absolute magnitudes using Kp andMKp. Figure 2 shows the Kepler light curve of V344 Lyr. Theobservation window contains 19 outbursts showing the sequenc-ing SSSLSSSSSSSLSSSSSSS, where S: short outburst and L:
8 The Kepler response is taken fromhttp://keplergo.arc.nasa.gov/CalibrationResponse.shtml

1396 CANNIZZO ET AL. Vol. 725
Figure 2. Kepler light curve of V344 Lyr over 270 d showing outbursts every∼10 d, with two superoutbursts. The flux is measured in e− cadence−1, wherethe cadence (time between integrations) is 1 m. The full time resolution isshown. To obtain visual magnitude, a correspondence of Kp = 12 to 107 e−cadence−1 was adopted. (This conversion assumes an unreddened G2 star.)
long outburst, i.e., a superoutburst. Based on photographic ob-servations made by Hoffmeister (1966), Kato (1993) estimatedthat the cycle length for normal outbursts was 16 ± 3 d. An es-timate of this cycle length prior to Kepler was difficult becausethe normal outbursts of V344 Lyr are short lived and reach onlyto near Kp = 16 (or V � 17). In Table 1, we list the dura-tions (using Kp = 18 as the cut line) and amplitudes (measuredfrom the local mean quiescence level) of the 19 observed out-bursts (17 normal and two superoutbursts). Both the recurrencetimes and amplitudes of the normal outbursts appear to reach amaximum roughly midway between superoutbursts, rather thanincreasing monotonically between consecutive superoutburstsas in the TTIM. We also note that the level of quiescence is∼1 mag higher after the superoutburst, and declines with ane-folding time of ∼50 d. This trend may be associated withthe cooling of the WD after being heated by the mass accretedduring superoutburst (e.g., Sion 1995).
The superoutbursts last ∼17 d and reach a maximum ampli-tude ΔKp = 4.4–4.5 mag. The decline of the superoutburstsis close to linear (plotted as mag versus time, or exponentialas flux versus time) for ∼11 d, after which they fall rapidly(∼2 d) back to quiescence. During the slow decay the declinerate is 0.083 mag d−1, in good agreement with the value of0.094 mag d−1 found by Kato (1993). The amount of time spentat Kp � 16 is ∼14 d, and the duration of the entire plateau is∼12 d. The decay rate is ∼12 d mag−1, therefore the plateauportion of the decay encompasses ∼1 mag—a dynamic rangeof ∼2.5, or slightly less than one e-folding (∼2.7×). There arealso ∼0.5 mag shoulders on the superoutburst rises lasting ∼1 d,which appear to be normal outbursts embedded at the beginningof the superoutbursts.
It is noteworthy that the fast decays of the normal outburstsand superoutburst have a faster-than-exponential shape (i.e.,concave downward when plotted as magnitude versus time).S84 utilized the Bailey relation between the fast rate of decayin dwarf novae and their orbital period to constrain αhot �0.1–0.2. The large errors associated with the AAVSO datawere consistent with exponential decay. Cannizzo (1994) foundthat to account for the supposedly exponential decays, whichcorrespond to the time during which a cooling front traversesthe disk, α must vary weakly with radius (
∼∝ r0.3). The faster-
Table 1Duration and Amplitude of Outbursts
Outburst Duration (day) Amplitude (mag)
1 4.9 4.02 3.9 3.53 4.4 3.64 16.7 (SO) 4.55 2.8 2.56 3.0 2.67 2.6 3.08 3.6 3.59 3.9 3.8
10 3.8 3.711 4.1 3.712 17.1 (SO) 4.413 3.8 2.714 3.5 3.315 3.6 3.516 5.5 3.617 4.1 3.818 4.1 3.519 4.3 3.5
than-exponential decays captured by Kepler in V344 Lyr negatethis result and indicate that a constant α scaling with radius isconsistent with the data.
4. VISCOUS PLATEAUS IN DWARF NOVAE
The Bailey relation between the fast rate of decay of dwarfnova outbursts and orbital period corresponds to the time intervalduring which the cooling front traverses the disk. Some longdwarf nova outbursts have enough dynamic range in V thatone can also use the slow decay portion, the viscous plateau,to infer an α value. These inferred values agree with thosedetermined from the Bailey relation (Warner 1995a, 1995b;Cannizzo 2001b; Cannizzo et al. 2002).
The decay rates associated with several dwarf novae exhibit-ing viscous plateaus have been fairly well established, and en-able one to make a reasonable estimate of the decay rate ex-pected in a system with the orbital period of V344 Lyr. TheKepler observation gives a decay rate within the superoutburst∼12 d mag−1. We associate this with the viscous time, which isbasically an e-folding time for a perturbation to the Σ(r) profileto be damped out. For a disk with a Σ(r) profile approximatingsteady state, i.e., Σ(r) ∝ r−3/4, and for which the mass flowwithin the disk and onto the WD greatly exceeds the rate ofmass addition feeding into the outer disk from the secondarystar, the viscous time represents roughly a time for the mass ofthe disk to decrease by a factor e.
Thus, for a given viscous plateau-type outburst, the ratiotplateau/tvisc represents the number of e-foldings by which themass of the disk decreases due to accretion onto the centralobject. It is instructive to look at examples of viscous decays inseveral well-studied dwarf novae:
SS Cyg.9 Long outbursts in SS Cyg (Porb = 6.6 hr) have aduration of ∼10 d (Cannizzo & Mattei 1992) and the viscous
9 If one accepts the Hubble Space Telescope (HST)/FGS trigonometricparallax for SS Cyg 6.02 ± 0.46 mas (Harrison et al. 1999) which impliesD = 166 ± 13 pc, the accretion disk limit cycle model is not able to reproducedwarf nova outbursts for SS Cyg (Schreiber & Lasota 2007; Smak 2010).Harrison et al. (2004) acquire spectra of Morgan-Keenan standard stars torefine the mean absolute parallax of the reference frame and present are-analysis of the SS Cyg parallax (see their Section 2.3). They obtain arevised value 6.06 ± 0.44 mas—close to their original value.

No. 2, 2010 THE KEPLER LIGHT CURVE OF V344 Lyrae 1397
time in the outer disk tvisc ≈ 40 d. Thus, tplateau tvisc, and onlyabout 20% of the disk mass is accreted onto the WD (C93b).
U Gem. In the 1985 long outburst of U Gem (Porb = 4.25 hr), thedecay rate during the viscous plateau was ∼26 d mag−1 over the∼35 d of the burst (Cannizzo et al. 2002). Since tvisc ≈ tplateau,∼70% of the disk mass accreted onto the WD.
V344 Lyr. In the superoutbursts of V344 Lyr (Porb = 2.1 hr)shown in Figure 2, the locally defined decay rate during theplateau remains constant at ∼12 d mag−1 over most of the∼14 d of the burst, thus as with U Gem ∼70% of the disk massaccreted onto the WD.
WZ Sge. In the 2001 superoutburst of WZ Sge (Porb =81 minutes), the locally defined decay rate during the plateauincreased from ∼4 to ∼12 d mag−1 over the ∼20 d of theburst (Cannizzo 2001b). The fact that tplateau ≈ 3tvisc means thatonly a few percent of the initial disk mass remained at the endof the superoutburst. (An alternative considered in Section 7is that irradiation-induced enhanced mass overflow from thesecondary star prolonged the superoutburst.) Without a verylow αcold � 10−5 there is not enough accumulated mass in thedisk to account for the outburst’s fluence (Smak 1993) and thelong recurrence time.
In summary, one can readily find examples of known systemswith viscous type outbursts in which the duration of the outburstitself is either greater than, less than, or about the same as theviscous timescale evaluated at the outer edge of the accretiondisk. The actual course taken by a given system depends on thedegree of overfilling of the disk in quiescence with respect toMdisk,min.
5. NUMERICAL MODELING
Our numerical model is discussed extensively in C93b andsubsequent papers. The basic strategy is the time-dependent so-lution of two coupled differential equations, one giving the Σ(r)evolution, and the other the evolution of disk midplane temper-ature T (r). Thus, the disk is entirely unconstrained as regardsdeviations from steady state and thermal equilibrium. Manyprevious workers have presented time-dependent calculationsby solving these equations, or similar versions (e.g., S84; Linet al. 1985, L85; Mineshige & Osaki 1983, M83; Mineshige &Osaki 1985, M85; Mineshige 1986, M86; Mineshige 1987,M87; Pringle et al. 1986, P86; Cannizzo et al. 1986, C86;C93b; Cannizzo 1994, 1998a, 2001a; Angelini & Verbunt 1989;Ichikawa & Osaki 1992; Meyer & Meyer-Hofmeister 1984;Ludwig & Meyer 1998; H98; Menou et al. 1999; Buat-Menardet al. 2001; Buat-Menard & Hameury 2002; Schreiber et al.2003, 2004, S04).
Improvements in our code made since the original versioninclude the provision for a variable outer disk radius, self-irradiation, and evaporation with various possible laws (e.g.,Meyer & Meyer-Hofmeister 1994). The diffusion equationgoverning the evolution of surface density is given by (Lightman1974; Pringle 1981)
∂Σ∂t
= 3
r
∂
∂r
[r1/2 ∂
∂r(νΣr1/2)
], (7)
where Σ(r, t) is the surface density and ν is the kinematicviscosity coefficient,
ν = 2
3
α
ΩRT
μ. (8)
We follow the technique of Bath & Pringle (1981) in discretizingthe Σ(r, t) evolution equation.
The thermal energy equation governing the evolution of themidplane disk temperature T(r,t) is given by
∂T
∂t= 2(A − B + C + D)
cpΣ− RT
μcp
1
r
∂
∂r(rvr ) − vr
∂T
∂r, (9)
where the viscous heating
A = 9
8νΩ2Σ, (10)
the radiative coolingB = σT 4
e , (11)
C = 3
2
1
r
∂
∂r
(cpνΣr
∂T
∂r
), (12)
and
D = h
r
∂
∂r
(r
4acT 3
3κRρ
∂T
∂r
). (13)
Of the four terms appearing in the numerator of the first termof thermal energy equation, the first two A and B are fairlystandard. The term C represents the radial heating flux due toturbulent transport, and D is that due to radiative transport.Previous workers have used varying forms of C and D. Someearly studies adopted C = D = 0 (M83), C = 0 (L85), or aform of C not expressible as the divergence of a flux (M83;M86; C93b; see H98 for a critical discussion).
The local flow velocity vr , which can vary enormously frominflow to outflow over the radial extent of the disk, dependingon whether or not transition fronts are present, is given by
vr = − 3
Σr1/2
∂
∂r(νΣr1/2), (14)
where upwind differencing is implemented over the radial gridas follows:
sa = νi−1Σi−1ri−11/2,
sb = νiΣi ri1/2,
sc = νi+1Σi+1ri+11/2, (15)
q− = − 3
Σi ri1/2
sb − sa
ri − ri−1,
q+ = − 3
Σi ri1/2
sc − sb
ri+1 − ri
, (16)
if
(q−q+
> 0 and q− > 0
)(vr )i = max(q−, q+),
if
(q−q+
> 0 and q− < 0
)(vr )i = min(q−, q+), (17)
if
(q−q+
< 0 and|q−||q+| > 1
)(vr )i = q−
if
(q−q+
< 0 and|q−||q+| < 1
)(vr )i = q+. (18)

1398 CANNIZZO ET AL. Vol. 725
The scalings for the local maximum and minimum in the Σ–Trelation (from Meyer & Meyer-Hofmeister 1981, 1982) are
Σmax = 444 g cm−2 r1.110 m−0.37
1 α−0.7c,−2, (19)
where αc,−2 = αcold/0.01, and
Σmin = 44.4 g cm−2 r1.110 m−0.37
1 α−0.7h,−1, (20)
where αh,−1 = αhot/0.1. The disk midplane temperaturesassociated with these extrema are
T (Σmax) = 5275 K α−0.3c,−2, (21)
andT (Σmin) = 35900 K r0.064
10 m−0.021 α−0.16
h,−1 . (22)
The equilibrium temperature scalings for the stable branchesare given in C93b (taken from Cannizzo & Wheeler 1984).During transitions when the local disk temperature lies betweenthe values associated with the local maximum and minimumin surface density, T [Σmax(r)] < T (r) < T [Σmin(r)], we use alogarithmic interpolation to obtain the local α value,
log10α(r) = log10αcold + f, (23)
where
f = T − T (Σmax)
T (Σmin) − T (Σmax)(log10αhot − log10αcold). (24)
In tests we also consider a logarithmic interpolation factor fintroduced by H98,
f =[
1 +
(T0
T
)8]−1
(log10αhot − log10αcold), (25)
as well as a linear interpolation
α(r) = αcold +T − T (Σmax)
T (Σmin) − T (Σmax)(αhot − αcold). (26)
In calculating the effects of the tidal torque from the sec-ondary, we follow Smak (1984) and later workers who used aformalism developed by Papaloizou & Pringle (1977) in whichthe tidal torque varies as the fifth power of radius. This leads toa depletion in disk material
∂Σ∂t
= −c1ωνΣ
2πjs
( r
a
)5, (27)
where ω is the orbital angular frequency 2π/Porb, the orbitalseparation is a, and the specific angular momentum js =(GM1r)1/2.
We do not reset the value of c1 during the course of a runas in the TTIM. Ichikawa & Osaki (1994) presented detailedcalculations of the strength of the tidal torque versus distanceat large radii within the disk and found that the power law(∝ r5) determined by Papaloizou & Pringle is only valid atone radial location in the outer disk; further out the torquerelation steepens considerably, approaching infinite slope at thelast non-intersecting orbit. Therefore, in some sense the morenaive “brick wall” condition for the outer edge used by C93b andother workers might be more descriptive. Regardless of whichprescription is used, if the parameters associated with the outer
edge are not manipulated during the run, the detailed treatmentis not important to the overall model. Using a different end-pointtreatment would result in slightly different optimal parameters.
Given a disk temperature T and surface density Σ, the disksemithickness h and density ρ are determined from verticalhydrostatic equilibrium to yield
h = Pr +√
P 2r + c2c3
c2, (28)
wherec2 = ΣΩ2, (29)
c3 = ΣRT
μ, (30)
the radiation pressure
Pr = 1
3aT 4, (31)
and the density
ρ = Σ2h
. (32)
To determine the computational time step, we take
Δt = ft min
[mini
(∂ ln Σi
∂t
)−1
, mini
(∂ ln Ti
∂t
)−1]
, (33)
where mini refers to the minimum over all grid points i, and ftis a small number between 1/80 and 1/640. The quantities∂ ln Σi/∂t and ∂ ln Ti/∂t are evaluated using the evolutionequations.
6. RESULTS
To calculate the long-term light curves from our numericaltrials, we assume local Planckian flux distributions for eachannulus, and in each time step integrate over the radial profilesof effective temperature. We compute the absolute Keplermagnitude MKp, using the filter shown in Figure 1, assuminga face-on disk. To account for the background contribution,assumed constant, we add the secondary star and hot spot. Forthe secondary, we assume an M5V star with radius 0.221R� =1.54 × 1010 cm and Teff = 2951 K. This contributes MKp =11.31. For the hot spot, assuming a 12,000 K emitting circularregion with radius 109 cm gives MKp = 10.41. As a test of ourmagnitude subroutine, using solar parameters R� = 6.96×10¹⁰
cm and Teff = 5778 K we find MV = 4.85 (the accepted valueis 4.83) and MKp = 3.83. (The MV values for our putativesecondary and hot spot are 12.97 and 11.30, respectively.) Areasonable inclination i � 45◦ would dim the disk by ∼0.4 mag.
After some experimentation, we found a set of parametersthat reproduces approximately the overall pattern of supercycleand short outbursts. We take a central 0.6 M� WD accretor, aninner disk radius rin = 2 × 109 cm, and a maximum outer diskradius rout = 1010 cm, a mass feeding rate into the outer diskMT = 2 × 10⁻¹⁰ M� yr−1, and α values αcold = 0.0025 andαhot = 0.1. The recurrence time for outbursts varies inverselywith MT and αcold, and the duration of outbursts varies inverselywith αhot (Cannizzo et al. 1988, hereafter CSW; C93b). Also,the ratio of the number of short to long outbursts in a longsequence varies in a complicated way on these parameters, and

No. 2, 2010 THE KEPLER LIGHT CURVE OF V344 Lyrae 1399
Figure 3. Effect of using a logarithmic interpolation (Equation (24)) vs. a linearone (Equation (26)) for α. For these runs N = 800 and ft = 1/160. Shownare the light curves for the logarithmic case (top panel) and the linear case(second panel), the accompanying disk masses (third and fourth panels), andthe radius of the hot/cold interface rHC,10 during times when a transition front ispresent (fifth and sixth panels). For comparison the light curves for the disk-onlycontribution (i.e., excluding secondary and hot spot) are shown as dotted curvesin the first and second panels. The disk masses are in units of 1022 g and rHC,10is in units of 1010 cm.
on rin and rout. The strengths of the dependences of the varioustimescales—recurrence, burst duration, rise, and decay—onthe input parameters vary according to location within themultidimensional (MT , αcold, αhot, rin, rout, m1) parameter space(CSW; C93b).
We use the α interpolation given by Equation (24). Asregards the inner disk radius, the value for rinner is larger thanthe WD itself; if we take rinner � rWD, we tend to get farfewer short outbursts between two successive superoutbursts.This hint of a large inner radius may have some observationalsupport in the SU UMa systems (e.g., Howell et al. 1999).The ratio αcold/αhot = 40 is about 10 times greater thancommonly used in dwarf nova calculations. The mass transferrate from the secondary MT is �2 times the nominal value∼0.8 × 10⁻¹⁰ M� yr−1 found from evolutionary calculationsof CVs below the period gap where the evolution is drivenpredominantly by gravitational radiation (e.g., Kolb et al. 1998;Howell et al. 2001). When one takes into account the ∼20%depletion of the disk mass accompanying each of the short(normal) outbursts, however, the effective rate of accumulationof mass in the disk between successive superoutbursts decreasesfrom 2 × 10⁻¹⁰ M� yr−1 to ∼0.3 ×10⁻¹⁰ M� yr−1. In ourmodels, ∼40%–60% of the disk mass is accreted during asuperoutburst.
In using a complicated numerical model, it is important tocarry out testing to gain an understanding of systematic effects.
6.1. Interpolation between αcold and αhot
Figure 3 shows the effect of using a log versus a linearinterpolation for the α value between αcold and αhot. The linearinterpolation leads to smaller amplitude outbursts with little orno quiescent intervals. The decays are also much slower, andconcave upward when plotted as mag versus time (i.e., witha functional form that is slower than exponential). Figure 4
Figure 4. Effect of using the H98 logarithmic factor f (Equation (25)). Forthese runs N = 800 and ft = 1/160. Shown are the light curves forT0 = 25,000 K (top panel), 18,750 K (second panel), and 12,500 K (thirdpanel), the accompanying disk masses (fourth through sixth panels), and theradius of the hot/cold interface rHC,10 during times when a transition front ispresent (seventh through ninth panels). The disk masses are in units of 1022 gand rHC,10 is in units of 1010 cm.
shows the effect of using the H98 interpolation. H98 adoptedthe constant T0 = 25,000 K in their scaling; we also look atsmaller values 18,750 K and 12,500 K. The smaller T0 valuesproduce superoutbursts which have the recognizable plateau andsubsequent fast decay, but for the T0 = 12,500 K run the fastdecays are slower than exponential. Hameury (2002) comparedthe two cases T0 = 24,000 K and T0 = 8000 K and found littledifference between the resultant light curves (see his Figure 3)in his model.
Figure 5 depicts the different interpolations as well asparameterizations of the fractional ionization ξ . The MRI isthought to mediate the strength of α through turbulent transport,and the effect of shearing on the weak magnetic field embeddedin the gas is more efficient as ξ increases. The H98 scalingfor T0 = 12,500 K does a reasonable job in approximating theρ = 10−6 g cm−3 curve for ξ , and may be more physical thanthe other scalings.
6.2. Number of Grid Points N
Early time-dependent accretion disk limit cycle studies wereconcerned mainly with showing the ability of the disk, underthe conditions of an imposed limit cycle in each annulus, toundergo collective, global oscillations in which a major partof the disk participated. The total numbers of grid points Nwere small and the comparison with observational data minimal(e.g., N = 20–25: S84; N = 35: L85; N = 22–44: M85;N = 17: M86; N = 40: P86; N = 44: C86). One can seeobvious irregularities in many of the early light curves whichare characteristic of numerical instability. C93b undertook thefirst detailed investigation regarding the number of grid points,and found that at least several hundred were required to obtain

1400 CANNIZZO ET AL. Vol. 725
Figure 5. Shown are the different αcold − αhot interpolations. The blue linesshow the scalings for T (Σmax) and T (Σmin). The black curves indicate the linear(Equation (26) and logarithmic (Equation (24)) interpolations. The green curvesshow the H98 scaling (Equation (25)), where the three curves (left to right)represent T0 = 12,500 K, 18,750 K, and 25,000 K. The three red curves showa measure of the partial ionization; they are the relative contribution of electronpressure to total pressure as shown in Figure 16 of C93b, for ρ(g cm−3)= 10−8,10−7, and 10−6 (left to right). The values given in C93b have been multiplied by2αhot to take into account the fact that (1) Pe/P → 0.5 in the limit of completeionization, and (2) in the high temperature limit α → αhot = 0.1.
(A color version of this figure is available in the online journal.)
reliable light curves. H98 utilized both uniform and adaptivemesh codes to study the properties of the transition fronts, andfound a requirement of N � 800 for a uniform-equivalent meshto resolve the fronts adequately.
Figure 6 shows a detail of one superoutburst for models with N= 200–1600 grid points. In terms of the long-term light curves,even with N > 1000 the sequencing of long and short outburstsis not perfectly stable using our explicit code. An implicit codesuch as that described in H98 may be more numerically stable. Interms of individual outburst profiles, the rise times we calculatefor both the normal and superoutbursts are too fast. In addition,our outbursts are too bright by ∼0.5 mag. A nominal inclinationi � 45◦ would make our disks dimmer by ∼0.4 mag, bringingthem close to the level observed in outburst. For comparison wealso plot the V344 Lyr data, where d = 620 pc was assumedin converting to absolute magnitude (found by Ak et al. 2008using a period–luminosity relation). There is a slight increasein superoutburst duration from N = 200 to N = 800 due to thefact that more mass accumulates as the supercycle lengthens. Inaddition, the shoulder in the light curve also becomes longer.For the highest N run, the duration of the superoutburst is stillshorter than that seen in V344 Lyr, while the shoulder is toolong. The superoutburst calculated using the H98 scaling withT0 = 12,500 K better reproduces the observed duration of theV344 Lyr superoutburst, and also has a shorter shoulder with lessstructure than the other calculations. However, it suffers froma rise time that is too short, and the fast decay is now slowerthan exponential. Also, the viscous decay rate, which has beenoptimized to the observed value using the Equation (24) scaling,is now too fast.
6.3. Thermal Energy Equation
Considering the many forms of the thermal energy equationused by previous workers, and the potential limitations ofemploying a one-dimensional hydrodynamical formalism, wenow look at the effects of switching off various terms in the
Figure 6. Model light curves showing the detail of a superoutburst for separatecalculations in which N = 200 (short dashed), 400 (long dashed), 800(short dash dotted), and 1600 (long dash dotted). The green curve shows asuperoutburst from the T0 = 12,500 K H98 scaling light curve of Figure 4.For comparison, the averaged Kepler data for the superoutbursts in Figure 2 areshown (first: blue, second: magenta), where the original Δt = 1 minute cadencehas been block-averaged to Δt = 4 hr and a distance of 620 pc was assumed inconverting from Kp to MKp. The two slanted red lines indicate a decay slope of12 d mag−1. The second panel shows the disk mass (in 1022 g).
(A color version of this figure is available in the online journal.)
thermal energy equation in an attempt to ascertain the relativeimportance of each term. Figure 7 shows the effect of settingequal to zero: (1) C, (2) D, (3) C and D, (4) the first advectiveterm in Equation (9), and (5) the second advective term inEquation (9). In the C = 0 run, one sees a rounded superoutburstand only three short outbursts between two superoutbursts. The(radiative) D term is less influential, as the superoutburst profileis relatively unchanged from the first panel. Setting C = D = 0produces a single dip in the rise to superoutburst, and a longerviscous plateau (i.e., exponential decay). The first advective termappears to be of comparably minimal importance as the D term;i.e., the omission of either has a negligible effect. The secondadvective term is the most influential of all terms examined:without it one has much longer superoutbursts—about 70% ofthe accumulated disk mass is accreted, which is about the sameas in V344 Lyr. However, the viscous plateau still comprisesless than half of the superoutburst, rather than the �90% seenin V344 Lyr.
6.4. Detuning of Optimal Parameters
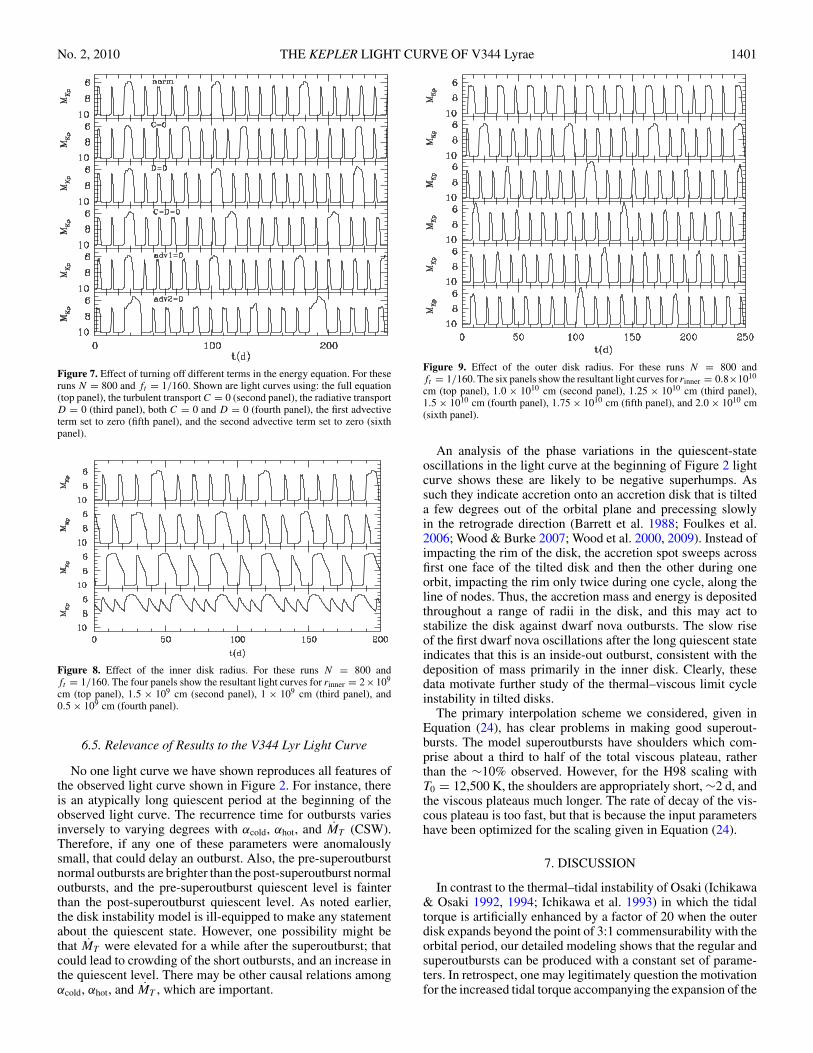
There is a complicated interplay between the different pa-rameters that enter into the overall results. Figure 8 shows theeffect of varying the inner disk radius. For smaller inner diskradii, one has a larger dynamic range in router/rinner and as aresult there tends to be a more complete emptying of the diskduring outbursts, and therefore less of a tendency to have a se-ries of short outbursts leading up to a superoutburst. The netinteraction among all the model parameters is such that theobserved sequencing for V344 Lyr is roughly reproduced withrinner � 2×109 cm. Figure 9 shows the effect of varying the outerdisk radius. For larger router values not only does the number ofshort outbursts increase, but also the shape of the superoutburstdistorts significantly from the viscous plateau shape.
No. 2, 2010 THE KEPLER LIGHT CURVE OF V344 Lyrae 1401
Figure 7. Effect of turning off different terms in the energy equation. For theseruns N = 800 and ft = 1/160. Shown are light curves using: the full equation(top panel), the turbulent transport C = 0 (second panel), the radiative transportD = 0 (third panel), both C = 0 and D = 0 (fourth panel), the first advectiveterm set to zero (fifth panel), and the second advective term set to zero (sixthpanel).
Figure 8. Effect of the inner disk radius. For these runs N = 800 andft = 1/160. The four panels show the resultant light curves for rinner = 2×10⁹
cm (top panel), 1.5 × 109 cm (second panel), 1 × 109 cm (third panel), and0.5 × 109 cm (fourth panel).
6.5. Relevance of Results to the V344 Lyr Light Curve
No one light curve we have shown reproduces all features ofthe observed light curve shown in Figure 2. For instance, thereis an atypically long quiescent period at the beginning of theobserved light curve. The recurrence time for outbursts variesinversely to varying degrees with αcold, αhot, and MT (CSW).Therefore, if any one of these parameters were anomalouslysmall, that could delay an outburst. Also, the pre-superoutburstnormal outbursts are brighter than the post-superoutburst normaloutbursts, and the pre-superoutburst quiescent level is fainterthan the post-superoutburst quiescent level. As noted earlier,the disk instability model is ill-equipped to make any statementabout the quiescent state. However, one possibility might bethat MT were elevated for a while after the superoutburst; thatcould lead to crowding of the short outbursts, and an increase inthe quiescent level. There may be other causal relations amongαcold, αhot, and MT , which are important.
Figure 9. Effect of the outer disk radius. For these runs N = 800 andft = 1/160. The six panels show the resultant light curves for rinner = 0.8×10¹⁰
cm (top panel), 1.0 × 1010 cm (second panel), 1.25 × 1010 cm (third panel),1.5 × 1010 cm (fourth panel), 1.75 × 1010 cm (fifth panel), and 2.0 × 1010 cm(sixth panel).
An analysis of the phase variations in the quiescent-stateoscillations in the light curve at the beginning of Figure 2 lightcurve shows these are likely to be negative superhumps. Assuch they indicate accretion onto an accretion disk that is tilteda few degrees out of the orbital plane and precessing slowlyin the retrograde direction (Barrett et al. 1988; Foulkes et al.2006; Wood & Burke 2007; Wood et al. 2000, 2009). Instead ofimpacting the rim of the disk, the accretion spot sweeps acrossfirst one face of the tilted disk and then the other during oneorbit, impacting the rim only twice during one cycle, along theline of nodes. Thus, the accretion mass and energy is depositedthroughout a range of radii in the disk, and this may act tostabilize the disk against dwarf nova outbursts. The slow riseof the first dwarf nova oscillations after the long quiescent stateindicates that this is an inside-out outburst, consistent with thedeposition of mass primarily in the inner disk. Clearly, thesedata motivate further study of the thermal–viscous limit cycleinstability in tilted disks.
The primary interpolation scheme we considered, given inEquation (24), has clear problems in making good superout-bursts. The model superoutbursts have shoulders which com-prise about a third to half of the total viscous plateau, ratherthan the ∼10% observed. However, for the H98 scaling withT0 = 12,500 K, the shoulders are appropriately short, ∼2 d, andthe viscous plateaus much longer. The rate of decay of the vis-cous plateau is too fast, but that is because the input parametershave been optimized for the scaling given in Equation (24).
7. DISCUSSION
In contrast to the thermal–tidal instability of Osaki (Ichikawa& Osaki 1992, 1994; Ichikawa et al. 1993) in which the tidaltorque is artificially enhanced by a factor of 20 when the outerdisk expands beyond the point of 3:1 commensurability with theorbital period, our detailed modeling shows that the regular andsuperoutbursts can be produced with a constant set of parame-ters. In retrospect, one may legitimately question the motivationfor the increased tidal torque accompanying the expansion of the

1402 CANNIZZO ET AL. Vol. 725
disk, considering that the ultimate driving force behind the tidaltorque is the gravitational field of the secondary, which remainsunchanged. We share a common viewpoint with van Paradijs(1983) in that we regard the superoutbursts in the SU UMa sys-tems as an extension of the long outbursts in dwarf novae abovethe period gap, such as U Gem and SS Cyg (Cannizzo & Mattei1992, 1998; C93b). Continued monitoring of V344 Lyr shouldreveal the stability of the long-term sequencing, i.e., variationsin the number of shorts sandwiched between two longs.
The shoulders on the rise to superoutburst in the models havemore structure than the shoulders in the observed superoutbursts.The shoulders arise because the initial tendency of the triggeringof thermal instability is to produce a short outburst. However,due to the long-term net buildup of mass in the disk at large radiibetween successive short outbursts, there is actually enoughmaterial accumulated to support a superoutburst. It takes alittle longer, however, for the outward moving heating front toprogress to larger radii and to access fully this additional storeof matter, which manifests itself as a ring of enhanced surfacedensity in the outer disk. This explains the fact that the observedsuperoutbursts appear to start as normal (short) outbursts. Thesubsequent rise after the shoulder is due to the full radial extentof the disk out to the outer edge making a transition to the hotstate. In contrast, for the short (normal) outbursts, not enoughdisk mass has accumulated at larger radii by the time of theoutburst to support the heating transition front propagating tolarge radii, therefore the heating front stalls at some r < routerand is reflected as a cooling front, leading to pointy maximarather than viscous plateaus.
Our testing has delineated a range of allowable parameters:(1) The logarithmic interpolation for α produces well-
separated outbursts, with concave downward decays, as ob-served. The linear interpolation produces outbursts with mini-mal quiescence and concave upward decays. Given the physicalunderpinnings of the MRI, the logarithmic interpolation is bettermotivated since the MRI strength should depend on the partialionization fraction, which is a strongly increasing function oftemperature.
In terms of the superoutburst, the H98 scaling with T0 =12,500 K produces the best overall results. The shoulder featureonly persists ∼2 d, as observed, and the viscous plateau is longer.About 70% of the stored mass is accreted. The main deficienciesare that the fast decay (i.e., that following the viscous plateau) isslower than exponential, and the rise times are too fast (as withthe other calculations).
(2) The minimum number of grid points necessary is �103
(in accord with C93b and H98). Even for high N, the sequencingis not perfectly stable.
(3) Of the terms entering into the thermal energy equation, theradial viscous transport term C and the second advective term,vr (∂T /∂r) appear to be the most important. The radial radiativeflux term D and the first advective term, involving ∂(rvr )/∂r ,are of lesser importance.
(4) The values for αcold = 0.0025, αhot = 0.1, and MT =2 × 10⁻¹⁰ M� yr−1 are mandated by the observed spacing andduration of short outbursts and the superoutburst. Increasingtheir values decreases the outburst timescales. The inferredvalues for αcold and αhot are to be viewed merely as best-fitparameters for V344 Lyr; they do not allow us to draw any deepconclusions as regards other systems.
(5) The values rinner and router strongly mediate the numberof short outbursts between two superoutbursts. For N = 800and ft = 1/160, we have ∼5 shorts between two longs
for rinner = 2 × 109 cm, or ∼3RWD for MWD = 0.6 M�.Observations by Howell et al. (1999) seem to favor an evacuatedinner disk. Several possibilities are discussed by these workers,including the possibility of weak intermediate polars in theSU UMa systems. The outbursts in our models are triggeredat intermediate disk radii, therefore the outer disk radius hasminimal effect on the outburst recurrence times and durations.Increasing router from 1 × 1010 cm to 2 × 1010 cm increasesthe number of shorts between two successive longs, and alsodistorts the profile of the superoutburst.
With αhot = 0.1, we match the rate of decay of the viscousportion of the superoutburst, and also find an ∼0.5 mag shoulderon the rise to superoutburst. It is not clear why previous detailedtime-dependent modelers did not find this shoulder (e.g., S04).The main deficiency in the models with the standard logarith-mic αcold ↔ αhot interpolation is their failure to produce a suffi-ciently long viscous plateau on the superoutburst. The observedplateau has a decay rate of ∼12 d mag−1 and lasts for ∼12 d,which corresponds to ∼1 e-folding in the decay of the diskmass, meaning about 60% of the disk mass should be accreted.Our viscous plateau lasts ∼6–8 d, with proportionally less massaccreted. However, the light curve using the H98 scaling withT0 = 12,500 K (which appears to be physically motivated inso-far as it tracks ξ ) has substantially longer superoutbursts, ∼10 d,with appropriately short shoulders as observed. The reason forthe shorter shoulders is that the temperature within the outwardmoving heating front accompanying superoutburst onset is be-tween about 104 and 2 × 10⁴ K. As can be seen in Figure 5by comparing the leftmost green curve (i.e., the H98_12500scaling) with the “log” curve, for the temperature range 104 K< T < 2 × 10⁴ K, α is larger in the H98_12500 scaling andtherefore the heating front travels faster since its speed varieswith α (Menou et al. 1999). The duration of the shoulder fea-ture corresponds to the interval during which the heating frontis moving outward and finding that enough mass is present atlarge radii to support a superoutburst. This causes the dip andsubsequent rise to the plateau of the superoutburst.
The values for αcold, αhot, and MT have already been opti-mized to get the supercycle and normal cycle periods of ∼100 dand ∼10 d, respectively. One suspects that the scalings forΣmax(αcold) and Σmin(αhot) are too simplistic and fail to take intoaccount the actual disk physics, particularly that of the quiescentstate, which is presently unknown. One could envision introduc-ing an ad hoc multiplicative parameter for Σmax, for instance,to enhance it artificially, but then one would have to re-adjustall the other parameters, in particular increasing MT which isalready uncomfortably large. In view of these considerations,we consider our experiment moderately successful in that weare able to reproduce the duration of the viscous plateau withina factor of 2 in an overconstrained system for which αcold andαhot have already been determined by the outburst properties.
What about having enhanced mass transfer from the sec-ondary prolong the duration of the superoutburst? Smak (2004)presented observational evidence for enhanced hot spot bright-ness near superoutburst maxima which he interpreted as beingdue to enhanced mass transfer brought about by the strong ir-radiation of the secondary. Osaki & Meyer (2003) presented atheoretical study of the effects of irradiation on the photosphereof the secondary star in SU UMa systems and concluded thatmass transfer could not be enhanced by a significant amountbecause the Coriolis force prevents the formation of a circu-lation flow transporting heat toward L1. Viallet & Hameury(2007, hereafter V07) and Viallet & Hameury (2008, hereafter

No. 2, 2010 THE KEPLER LIGHT CURVE OF V344 Lyrae 1403
V08) present two-dimensional, time-dependent calculations ofthe surface flow of material of irradiated secondaries and findthe physical situation to be significantly different from that en-visioned by either Osaki & Meyer or Smak. The Coriolis forceleads to the formation of a circulation flow from the high lat-itude regions to the vicinity of the L1 point, but rapid coolingof the gas as it enters the shielded equatorial region preventssignificant heat transport (V07). V07 conclude that any result-ing mass transfer rate enhancement is likely to be moderate andunable to account for the duration of long outbursts in dwarfnovae. V08 look at two effects that could potentially inducesecondary mass transfer rate variations in dwarf novae and softX-ray transients: irradiation of the secondary by the hot outerdisk rim during outburst, and scattered radiation by opticallythin outflowing material. They conclude that for dwarf nova pa-rameters the effects on enhanced mass transfer are negligible.For completeness, we note that some of the assumptions of V07and V08 may not apply if the disk is warped or tilted, in whichcase the L1 point could in principle be directly irradiated.
S04 presented detailed time-dependent calculations of theaccretion disk evolution in both the TTIM and the EMTM, and inthe end concluded that the EMTM was favored. Their argumentsare rather general, however, and they state “...we have not proventhe EMTM to be correct nor the TTIM not to work.” Both modelshave a number of free parameters in addition to those alreadypresent in the standard limit cycle model. For the TTIM onehas the time delay between the attainment of the 3:1 radius bythe outer disk edge and the onset of enhanced tidal torque, inaddition to the functional form and amplitude associated withthe increase. Similarly, the EMTM has as free parameters thedegree of augmentation of MT during superoutburst, as well asits functional form with time.
In addition, there may be a problem with the viscous decayin the EMTM: the V344 Lyr superoutbursts maintained closelyexponential decays over ∼1 mag, whereas our models as wellas others reveal a definite slower-than-exponential trend (i.e.,concave upward when plotted as magnitude versus time) inviscous plateaus covering that much dynamic range. Althoughthe viscous decays can be lengthened in the EMTM, they tendto have noticeable deviations from exponentiality, in contrast tothe V344 superoutbursts. The fact that the short orbital periodsystem WZ Sge did show a deviation from exponentiality inits 2001 outburst, which also spanned a greater dynamic rangethan in the V344 Lyr superoutbursts (∼2 mag versus ∼1 mag),may indicate that irradiation-induced enhanced mass transferis a factor at much shorter orbital periods than for V344 Lyr.In addition, the amplitude of the ∼0.5 mag shoulder on therise to superoutburst is roughly matched in our calculations;with enhanced mass transfer the shoulder amplitude is too great(�1 mag). We consider it fortunate that we have matched thedecay as well as we have since the scalings for the extrema in thelimit cycle model, in particular Σmax(αcold), are most probablygross simplifications to a more complicated situation that iscurrently beyond our understanding.
8. CONCLUSION
We have presented detailed time-dependent calculations ofthe accretion disk limit cycle mechanism with application tothe Kepler light curve of V344 Lyr. We find that the basicdisk instability model is able to account for the mixture ofnormal and superoutbursts with a minimal amount of fine tuning.Given the additional free parameters associated with both thethermal–tidal model and the EMTMs, we do not attempt to
examine their possible ramifications in this work. It may bethat the plain vanilla disk instability acting alone is sufficientto explain most aspects of the long-term V344 Lyr light curve.We also note that the normal outbursts in V344 Lyr do notshow a monotonic increase in recurrence time and amplitudebetween successive superoutbursts as predicted by the TTIM(see Ichikawa et al. 1993, their Figure 1; Osaki 2005, hisFigure 3), but rather a maximum in these quantities near themiddle of a supercycle. The models we present also do notshow the observed variations.
One can in some sense view the alternation of many succes-sive short outbursts with a superoutburst as an extension of thepattern of short and long outbursts seen in the longer orbitalperiod systems such as U Gem and SS Cyg (van Paradijs 1983);for SU UMa parameters one has many more short outbursts be-tween two longs than in a system like SS Cyg, which exhibitsLSLSLS. . . most of the time (Cannizzo & Mattei 1992). Forour best-fit model parameters, we find that �800 grid pointsare required for numerical stability, with a resulting pattern inwhich 5–7 short outbursts occur between two successive super-outbursts (for ft = 1/640). Overall, our outbursts are at aboutthe same brightness as those observed in V344 Lyr for an inter-mediately inclined disk. Having constrained αcold and αhot so asto produce the overall recurrence timescales of short outburstsand superoutbursts, there are several obvious deficiencies: therise times of all outbursts are too fast, the superoutburst dura-tion is too short, and the duration of the shoulder is too long andhas an extra scalloped-out feature prior to the observed shoul-der. However, the more physically motivated H98 scaling withT0 = 12,500 K does a better job on making superoutbursts withminimal shoulders as observed, lasting ∼2 d, and also longerviscous plateaus, ∼10 d versus the observed ∼12 d. The normaloutburst embedded at the start of a superoutburst is due to the ini-tial triggering of the thermal instability and outward movementof the heating front; the subsequent dip and rise to superoutburstmaximum comes about because the heating front continues tomove outward, and subsequently to access the stored materialat large radii in the disk which accumulates where the heatingfront spike stalls at the end of a normal outburst.
Even as we struggle to account for the finer points of thelight curve, such as the shoulder on the superoutburst, we feelcompelled to step back briefly from our myopic scrutiny ofthe details and give some modicum of thanks and appreciationfor the fact that the Kepler data represent such a huge advanceover what was available even as recently as one year ago. Forlong-term dwarf nova light curves, the only data sets that hadbeen available were those amassed by the AAVSO and similarorganizations. While these data have certainly been useful andyielded many interesting results, one could only study in detailthe brightest systems, like SS Cyg and U Gem. In addition, thedata quality was uneven and the time sampling coarse. Whennew data become available that are an order of magnitude betterthan the previous data, it becomes possible to make discoveriesthat are different in “kind,” not just in “degree.” The Keplerdata will provide a physical touchstone for modelers with thepotential to improve substantially our understanding of thephysics of accretion disks; our work represents only the firstsmall step in this regard.
We thank James Bubeck (under the SESDA II contract) atGoddard Space Flight Center for assistance in providing localcomputational resources, and Marcus Hohlmann and PatrickFord from the FIT High Energy Physics group and the Domestic

1404 CANNIZZO ET AL. Vol. 725
Nuclear Detection Office in the Department of HomelandSecurity for making additional resources on a Linux clusteravailable.
We also thank the anonymous referee whose commentshelped improve and clarify the paper. We acknowledge thecontributions of the entire Kepler team.
REFERENCES
Ak, T., Bilir, S., Ak, S., & Ezer, Z. 2008, New Astron., 13, 133Ak, T., Ozkan, M. T., & Mattei, J. A. 2002, A&A, 389, 478Angelini, L., & Verbunt, F. 1989, MNRAS, 238, 697Balbus, S. A., & Hawley, J. F. 1998, Rev. Mod. Phys., 70, 1Barrett, P., O’Donoghue, D., & Warner, B. 1988, MNRAS, 233, 759Bath, G. T., & Pringle, J. E. 1981, MNRAS, 194, 967Buat-Menard, V., & Hameury, J.-M. 2002, A&A, 386, 891Buat-Menard, V., Hameury, J.-M., & Lasota, J.-P. 2001, A&A, 366, 612Cannizzo, J. K. 1993a, in Accretion Disks in Compact Stellar Systems, ed. J. C.
Wheeler (Singapore: World Scientific), 6 (C93a)Cannizzo, J. K. 1993b, ApJ, 419, 318 (C93b)Cannizzo, J. K. 1994, ApJ, 435, 389Cannizzo, J. K. 1998a, ApJ, 493, 426Cannizzo, J. K. 1998b, ApJ, 494, 366Cannizzo, J. K. 2001a, ApJ, 556, 847Cannizzo, J. K. 2001b, ApJ, 561, L175Cannizzo, J. K., Gehrels, N., & Mattei, J. A. 2002, ApJ, 579, 760Cannizzo, J. K., & Mattei, J. A. 1992, ApJ, 401, 642Cannizzo, J. K., & Mattei, J. A. 1998, ApJ, 505, 344Cannizzo, J. K., Shafter, A. W., & Wheeler, J. C. 1988, ApJ, 333, 227 (CSW)Cannizzo, J. K., & Wheeler, J. C. 1984, ApJS, 55, 367Cannizzo, J. K., Wheeler, J. C., & Polidan, R. S. 1986, ApJ, 301, 634 (C86)Foulkes, S. B., Haswell, C. A., & Murray, J. R. 2006, MNRAS, 366, 1399Fromang, S., & Papaloizou, J. 2007, A&A, 476, 1113Hameury, J.-M. 2002, in ASP Conf. Ser. 261, The Physics of Cataclysmic
Variables and Related Objects, ed. B. T. Gansicke, K. Beuermann, & K.Reinsch (San Francisco, CA: ASP), 377
Hameury, J.-M., Menou, K., Dubus, G., Lasota, J.-P., & Hure, J.-M. 1998,MNRAS, 298, 0148 (H98)
Harrison, T. E., Johnson, J. J., McArthur, B. E., Benedict, G. F., Szkody, P.,Howell, S. B., & Gelino, D. M. 2004, AJ, 127, 460
Harrison, T. E., McNamara, B. J., Szkody, P., McArthur, B. E., Benedict, G. F.,Klemola, A. R., & Gilliland, R. L. 1999, ApJ, 515, L93
Hirose, S., Krolik, J. H., & Blaes, O. 2009, ApJ, 691, 16Hoffmeister, C. 1966, Astron. Nachr., 289, 139Howell, S. B., Ciardi, D. R., Szkody, P., van Paradijs, J., Kuulkers, E., Cash, J.,
Sirk, M., & Long, K. S. 1999, PASP, 111, 342Howell, S. B., Nelson, L. A., & Rappaport, S. 2001, ApJ, 550, 897Ichikawa, S., Hirose, M., & Osaki, Y. 1993, PASJ, 45, 243Ichikawa, S., & Osaki, Y. 1992, PASJ, 44, 15Ichikawa, S., & Osaki, Y. 1994, PASJ, 46, 621Kato, T. 1993, PASJ, 45, L67Kato, T., Poyner, G., & Kinnunen, T. 2002, MNRAS, 330, 53King, A. R., Pringle, J. E., & Livio, M. 2007, MNRAS, 376, 1740
Kolb, U., King, A. R., & Ritter, H. 1998, MNRAS, 298, L29Lasota, J.-P. 2001, New Astron. Rev., 45, 449Lightman, A. P. 1974, ApJ, 194, 419Lin, D. N. C., Papaloizou, J., & Faulkner, J. 1985, MNRAS, 212, 105Lubow, S. H. 1991a, ApJ, 381, 259Lubow, S. H. 1991b, ApJ, 381, 268Lubow, S. H., & Shu, F. H. 1975, ApJ, 198, 383Ludwig, K., & Meyer, F. 1998, A&A, 329, 559Menou, K., Hameury, J.-M., & Stehle, R. 1999, MNRAS, 305, 79Meyer, F., & Meyer-Hofmeister, E. 1981, A&A, 104, L10Meyer, F., & Meyer-Hofmeister, E. 1982, A&A, 106, 34Meyer, F., & Meyer-Hofmeister, E. 1984, A&A, 132, 143Meyer, F., & Meyer-Hofmeister, E. 1994, A&A, 288, 175Mineshige, S. 1986, PASJ, 38, 831 (M86)Mineshige, S. 1987, Ap&SS, 130, 331 (M87)Mineshige, S., & Osaki, Y. 1983, PASJ, 35, 377 (M83)Mineshige, S., & Osaki, Y. 1985, PASJ, 37, 1 (M85)Mukai, K., Zietsman, E., & Still, M. 2009, ApJ, 707, 652Osaki, Y. 1989a, in Theory of Accretion Disks, ed. F. Meyer et al. (Kluwer:
Dordrecht), 183Osaki, Y. 1989b, PASJ, 41, 1005Osaki, Y. 2005, Proc. Japan Acad., 81, 291Osaki, Y., & Meyer, F. 2003, A&A, 401, 325Papaloizou, J., & Pringle, J. E. 1977, MNRAS, 181, 441Pringle, J. E. 1981, ARA&A, 19, 137Pringle, J. E., Verbunt, F., & Wade, R. A. 1986, MNRAS, 221, 169 (P86)Schreiber, M. R., Hameury, J.-M., & Lasota, J.-P. 2003, A&A, 410, 239Schreiber, M. R., Hameury, J.-M., & Lasota, J.-P. 2004, A&A, 427, 621 (S04)Schreiber, M. R., & Lasota, J.-P. 2007, A&A, 473, 897Shakura, N. I., & Sunyaev, R. A. 1973, A&A, 24, 337Simpson, J. C., & Wood, M. A. 1998, ApJ, 506, 360Sion, E. M. 1995, ApJ, 438, 876Smak, J. 1984, Acta Astron., 34, 161 (S84)Smak, J. 1993, Acta Astron., 43, 101Smak, J. 2004, Acta Astron., 54, 221Smak, J. 2009a, Acta Astron., 59, 89Smak, J. 2009b, Acta Astron., 59, 103Smak, J. 2009c, Acta Astron., 59, 109Smak, J. 2009d, Acta Astron., 59, 121Smak, J. 2010, Acta Astron., 60, 83Still, M. R., Howell, S. B., Wood, M. A., Cannizzo, J. K., & Smale, A. P.
2010, ApJ, 717, L113van Paradijs, J. 1983, A&A, 125, L16Viallet, M., & Hameury, J.-M. 2007, A&A, 475, 597Viallet, M., & Hameury, J.-M. 2008, A&A, 489, 699Vishniac, E. T. 2009, ApJ, 696, 1021Warner, B. 1995a, Ap&SS, 226, 187Warner, B. 1995b, Cataclysmic Variable Stars (Cambridge: Cambridge Univ.
Press)Warner, B., & O’Donoghue, D. 1988, MNRAS, 233, 705Wheatley, P. J., Mauche, C. W., & Mattei, J. A. 2003, MNRAS, 345, 49Whitehurst, R. 1988, MNRAS, 232, 35Wood, M. A., & Burke, C. J. 2007, ApJ, 661, 1042Wood, M. A., Montgomery, M. M., & Simpson, J. C. 2000, ApJ, 535, L39Wood, M. A., Thomas, D. M., & Simpson, J. C. 2009, MNRAS, 398, 2110