keppel dc reit - phillip...
TRANSCRIPT

Page | 1 | PHILLIP SECURITIES RESEARCH (SINGAPORE) MCI (P) 118/10/2015 Ref. No.: SG2016_0006
Keppel DC REIT Exposure to growth in data requirements SINGAPORE | REAL ESTATE (REIT) | INITIATION
REIT Snapshot Keppel DC REIT (KDCREIT) was listed on the Mainboard of the Singapore Exchange on
12 December 2014, with an offering price of S$0.93 per unit.
Investment strategy of investing in a portfolio of income-producing real estate for data centre use, with an initial focus on Asia-Pacific and Europe.
Sponsor backing from Keppel Telecommunications & Transportation Limited (Keppel T&T) with Rights of First Refusal (ROFR) from both Keppel T&T and iseek Communications.
Managed by Keppel DC REIT Management Pte Ltd, a wholly-owned subsidiary of Keppel T&T and Trustee is The Trust Company (Asia) Limited. The Manager collects a Base Fee pegged to the Deposited Property and a Performance Fee pegged to net property income.
Started with eight properties at listing, subsequently acquired one in Australia. Currently nine properties in the portfolio. The data centre properties are located in Singapore (2), Malaysia (1), Australia (3), United Kingdom (1), Ireland (1) and Netherlands (1).
Entered into a forward sale and purchase agreement to acquire a data centre in Germany, expected to be completed in 2018.
Portfolio has a lettable area of 597,909 sq ft and value of S$1.02bn as at 30 September 2015.
Distributions are made on a half-yearly basis. 100% payout until December 2016, thereafter at least 90%.
Investment Thesis – Explosive growth in data requirements 1. Growth in data creation and data storage needs. Total global data created is
estimated to grow at a CAGR of 47.7% from 2013 to 2018F; Global internet protocol (IP) traffic is estimated to grow at a CAGR of 21.0%.
2. Growth in cloud computing, e-commerce and online shopping. The rise in number of internet users will underpin the growth in cloud computing, e-commerce and online shopping.
3. Increasing compliance and regulatory requirements on data security. Data storage has conflicting requirements of being secure, but accessible and retrievable at the same time. Regulators are also imposing additional requirements on data storage such as range and duration of storage. These factors set up the demand for professionally managed data centres.
4. Continued trend of outsourcing of data centres. The proportion of outsourced data centre space in Asia-Pacific is projected to increase from 12.1% in 2013 to 38.5% in 2018. In Western Europe, this figure is projected to increase from 21.2% in 2013 to 42.2% in 2018.
Investment Actions KDCREIT has a unique exposure to data centre properties, riding on the trend of growth in data centre requirements. We initiate coverage on KDCREIT with "Accumulate" rating and DDM valuation of S$1.13.
Note: KDCREIT will be announcing FY15 financial results on 14 January after market hours.
8 January 2016
Accumulate (Initiating)CLOSING PRICE
FORECAST DIV
TARGET PRICE
TOTAL RETURN
COMPANY DATA
O/S SHARES (M N) : 883
M ARKET CAP (USD mn / SGD mn) : 631 / 905
52 - WK HI/LO (SGD) : 1.1 / 0.96
3M Average Daily T/O (mn) : 1.21
MAJOR SHAREHOLDERS (%)
30.1%
WELLINGTON M ANAGEM ENT GROUP LLP 7.3%
DBS BANK LTD SG PB CLIENTS 5.5%
KEPPEL LAND LTD 4.9%
FORTRESS CAPITAL AM SDN BHD 4.4%
PRICE PERFORMANCE (%)
1M T H 3 M T H 1Y R
COM PANY (0.5) 1.5 10.3
STI RETURN (2.3) (2.8) (11.6)
PRICE VS. STI
Source: B loomberg, PSR
KEY FINANCIALS
Y / E D ec F Y 15e F Y 16 e F Y 17e F Y 18 e
Gross Rev. (SGD mn) 108.2 103.0 103.7 108.7
NPI (SGD mn) 90.3 84.7 85.0 89.0
Dist. Inc. (SGD mn) 60.1 57.5 58.1 60.8
P/NAV (x) 1.16 1.15 1.15 1.12
DPU, adj (Cents) 6.80 6.51 6.57 6.56
Distribution Yield, % 6.74 6.44 6.51 6.50
Source: Company Data, PSR est.
VALUATION METHOD
DDM (Cost o f Equity: 6.7%; Terminal g: 1.0%)
Richard Leow, CFTe, FRM (+65 6212 1848)
SGD 1.130
18.6%
KEPPEL TELECOM & TRANSPORT LTD
SGD 1.010
SGD 0.068
0.70
0.80
0.90
1.00
1.10
1.20
Jan-15 Apr-15 Jul-15 Oct-15 Jan-16KDCREIT SP Equity FSSTI Index

Page | 2 | PHILLIP SECURITIES RESEARCH (SINGAPORE)
KEPPEL DC REIT INITIATION
Investment Thesis for Keppel DC REIT – Explosive growth in data requirements The Manger of Keppel DC REIT (KDCREIT) commissioned BroadGroup Consulting Ltd (BroadGroup) to prepare an independent market research report. The report highlighted the explosive growth in data requirements, driven by the following four factors:-
1. Growth in data creation and data storage needs. Apart from the "proliferation of Internet enabled devices, growth in video streaming and file sharing, increased popularity of e-commerce and social networking", BroadGroup attributes the trend of "Big Data" as another contributing factor to the growth in data creation. "Big Data" involves the collection of a large quantity of data and generating an analysis of the data collected. Consequently, this requires an immense requirement on computing power and data storage.
BroadGroup estimates the amount of data created globally to grow at a CAGR of 47.7% from 2013 to 2018. BroadGroup also expects monthly internet protocol (IP) traffic to grow at a CAGR of 21.0% from 2013 to 2018. By geography, BroadGroup has forecasted that Asia Pacific, North America and Western Europe IP traffic to grow at a CAGR of 21%, 20% and 18% respectively, from 2013 to 2018.
Figure 1. Total Global Data Created Annually (in zettabytes
1)
Notes: 1) A zettabyte is equal to 1021 bytes 2) from 2013 to 2018F Source: KDCREIT prospectus, 5 December 2014
Figure 2. Growth in Global IP Traffic (in petabytes
1 per month)
Notes: 1) A petabyte is equal to 1015 bytes 2) from 2013 to 2018F Source: KDCREIT prospectus, 5 December 2014

Page | 3 | PHILLIP SECURITIES RESEARCH (SINGAPORE)
KEPPEL DC REIT INITIATION
Cisco Systems also forecasts explosive growth in global IP traffic. The Cisco Global Cloud Index (GCI) and Cisco Virtual Networking Index (VNI) corroborates BroadGroup's forecasts. Cisco Systems (Cisco) is forecasting Global data centre traffic to grow at a CAGR of 25% from 2014 to 2019; and Global IP traffic to grow at a CAGR of 23% from 2014 to 2019. By geography, Global IP traffic from Asia Pacific, North America and Western Europe is forecasted to grow at a CAGR of 21%, 20% and 21% respectively, from 2014 to 2019.
Figure 3. Global Data Centre Traffic (ZB/year) Figure 3. Global Data Centre Traffic (ZB/year)
Figure 4. Global IP Traffic (EB/month) Figure 5. Global IP Traffic, by geography (EB/month)
3.4 4.4 5.6 7.0 8.6 10.40%
10%
20%
30%
40%
0
2
4
6
8
10
12
2014 2015F 2016F 2017F 2018F 2019F
Source: Bloomberg, Cisco GCI, PSRCAGR 2014-2019: 25%1 ZB = 1,000 EB
%y-o-y, RHS
60 72 88 112 135 16815%
20%
25%
30%
0
50
100
150
200
2014 2015F 2016F 2017F 2018F 2019F
Source: Cisco VNI, PSRCAGR 2014-2019: 23%
%y-o-y, RHS
0
10
20
30
40
50
60
2014 2015F 2016F 2017F 2018F 2019F
Source: Cisco VNI, PSR1 EB = 1,000 PB
Asia Pacific North America Western Europe
CAGR2014-2019
Asia Pacif ic: 21%North America:
20%Western Europe: 21%
Figure 4. Global IP Traffic (EB/year)
Figure 3. Global Data Centre Traffic (ZB/year)
Figure 4. Global IP Traffic (EB/month) Figure 5. Global IP Traffic, by geography (EB/month)
3.4 4.4 5.6 7.0 8.6 10.40%
10%
20%
30%
40%
0
2
4
6
8
10
12
2014 2015F 2016F 2017F 2018F 2019F
Source: Bloomberg, Cisco GCI, PSRCAGR 2014-2019: 25%1 ZB = 1,000 EB
%y-o-y, RHS
60 72 88 112 135 16815%
20%
25%
30%
0
50
100
150
200
2014 2015F 2016F 2017F 2018F 2019F
Source: Cisco VNI, PSRCAGR 2014-2019: 23%
%y-o-y, RHS
0
10
20
30
40
50
60
2014 2015F 2016F 2017F 2018F 2019F
Source: Cisco VNI, PSR1 EB = 1,000 PB
Asia Pacific North America Western Europe
CAGR2014-2019
Asia Pacif ic: 21%North America:
20%Western Europe: 21%
Figure 5. Global IP Traffic, by Geography (EB/month)
Figure 3. Global Data Centre Traffic (ZB/year)
Figure 4. Global IP Traffic (EB/month) Figure 5. Global IP Traffic, by geography (EB/month)
3.4 4.4 5.6 7.0 8.6 10.40%
10%
20%
30%
40%
0
2
4
6
8
10
12
2014 2015F 2016F 2017F 2018F 2019F
Source: Bloomberg, Cisco GCI, PSRCAGR 2014-2019: 25%1 ZB = 1,000 EB
%y-o-y, RHS
60 72 88 112 135 16815%
20%
25%
30%
0
50
100
150
200
2014 2015F 2016F 2017F 2018F 2019F
Source: Cisco VNI, PSRCAGR 2014-2019: 23%
%y-o-y, RHS
0
10
20
30
40
50
60
2014 2015F 2016F 2017F 2018F 2019F
Source: Cisco VNI, PSR1 EB = 1,000 PB
Asia Pacific North America Western Europe
CAGR2014-2019
Asia Pacif ic: 21%North America:
20%Western Europe: 21%
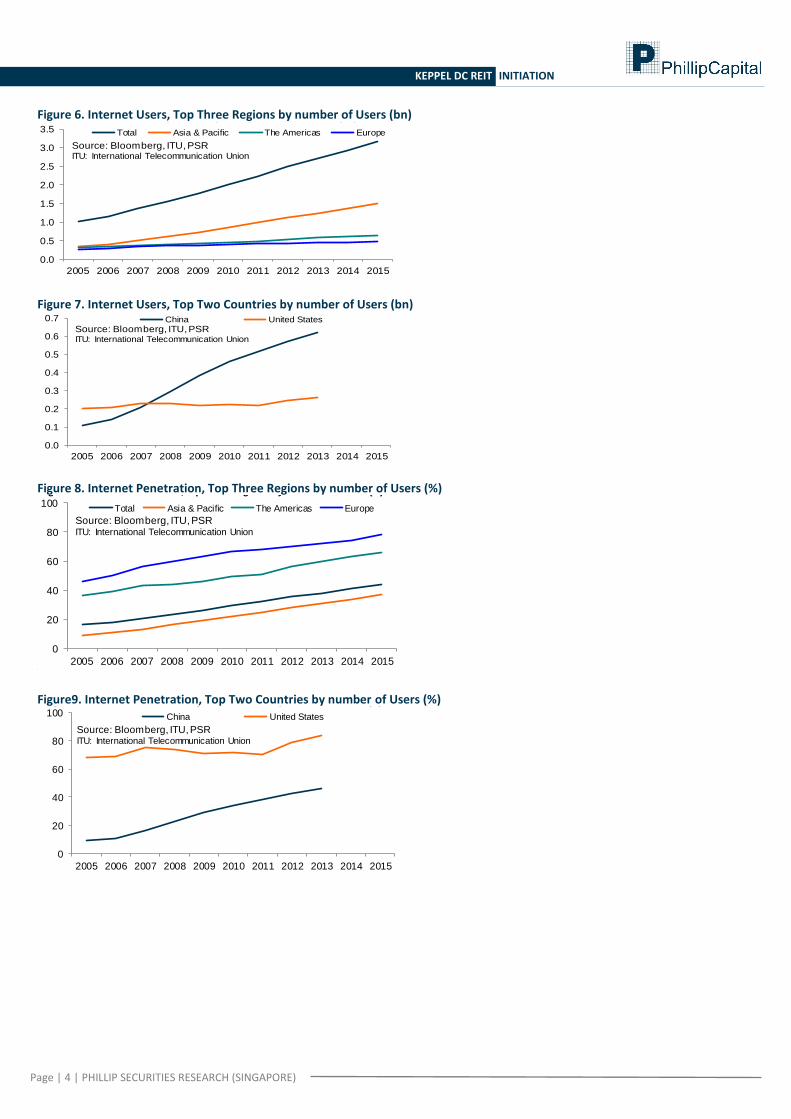
2. Growth in cloud computing, e-commerce and online shopping. As shown in the previous section, BroadGroup estimates data creation and Global IP traffic to grow at a CAGR of 47.7% and 21.0% respectively, from 2013 to 2018. This explosive growth is directly attributable to growth in number of Internet Users and Internet Penetration.
Global Internet Users grew at a 10-year CAGR of 12% from 2005 to 2015. The highest growth came from Asia & Pacific at a CAGR of 16%. We see three notable points of interest from the historical data: Number of Internet Users in China surpassed United States in 2008. Internet Penetration in Asia & Pacific is lower than the Global average, despite its
higher CAGR. Internet Penetration in China is lower than United States, despite its higher CAGR.
Page | 4 | PHILLIP SECURITIES RESEARCH (SINGAPORE)
KEPPEL DC REIT INITIATION
Figure 6. Internet Users, Top Three Regions by number of Users (bn) Figure 6. Internet Users, top three regions by number of users (bn) Figure 7. Internet Users, top two countries by number of users (bn)
Figure 8. Internet Penetration, top three regions by number of users (%) Figure 9. Internet Penetration, top two countries by number of users (%)
0.0
0.5
1.0
1.5
2.0
2.5
3.0
3.5
2005 2006 2007 2008 2009 2010 2011 2012 2013 2014 2015
Source: Bloomberg, ITU, PSRITU: International Telecommunication Union
Total Asia & Pacific The Americas Europe
0.0
0.1
0.2
0.3
0.4
0.5
0.6
0.7
2005 2006 2007 2008 2009 2010 2011 2012 2013 2014 2015
Source: Bloomberg, ITU, PSRITU: International Telecommunication Union
China United States
0
20
40
60
80
100
2005 2006 2007 2008 2009 2010 2011 2012 2013 2014 2015
Source: Bloomberg, ITU, PSRITU: International Telecommunication Union
Total Asia & Pacific The Americas Europe
0
20
40
60
80
100
2005 2006 2007 2008 2009 2010 2011 2012 2013 2014 2015
Source: Bloomberg, ITU, PSRITU: International Telecommunication Union
China United States
Figure 7. Internet Users, Top Two Countries by number of Users (bn) Figure 6. Internet Users, top three regions by number of users (bn) Figure 7. Internet Users, top two countries by number of users (bn)
Figure 8. Internet Penetration, top three regions by number of users (%) Figure 9. Internet Penetration, top two countries by number of users (%)
0.0
0.5
1.0
1.5
2.0
2.5
3.0
3.5
2005 2006 2007 2008 2009 2010 2011 2012 2013 2014 2015
Source: Bloomberg, ITU, PSRITU: International Telecommunication Union
Total Asia & Pacific The Americas Europe
0.0
0.1
0.2
0.3
0.4
0.5
0.6
0.7
2005 2006 2007 2008 2009 2010 2011 2012 2013 2014 2015
Source: Bloomberg, ITU, PSRITU: International Telecommunication Union
China United States
0
20
40
60
80
100
2005 2006 2007 2008 2009 2010 2011 2012 2013 2014 2015
Source: Bloomberg, ITU, PSRITU: International Telecommunication Union
Total Asia & Pacific The Americas Europe
0
20
40
60
80
100
2005 2006 2007 2008 2009 2010 2011 2012 2013 2014 2015
Source: Bloomberg, ITU, PSRITU: International Telecommunication Union
China United States
Figure 8. Internet Penetration, Top Three Regions by number of Users (%)
Figure 6. Internet Users, top three regions by number of users (bn) Figure 7. Internet Users, top two countries by number of users (bn)
Figure 8. Internet Penetration, top three regions by number of users (%) Figure 9. Internet Penetration, top two countries by number of users (%)
0.0
0.5
1.0
1.5
2.0
2.5
3.0
3.5
2005 2006 2007 2008 2009 2010 2011 2012 2013 2014 2015
Source: Bloomberg, ITU, PSRITU: International Telecommunication Union
Total Asia & Pacific The Americas Europe
0.0
0.1
0.2
0.3
0.4
0.5
0.6
0.7
2005 2006 2007 2008 2009 2010 2011 2012 2013 2014 2015
Source: Bloomberg, ITU, PSRITU: International Telecommunication Union
China United States
0
20
40
60
80
100
2005 2006 2007 2008 2009 2010 2011 2012 2013 2014 2015
Source: Bloomberg, ITU, PSRITU: International Telecommunication Union
Total Asia & Pacific The Americas Europe
0
20
40
60
80
100
2005 2006 2007 2008 2009 2010 2011 2012 2013 2014 2015
Source: Bloomberg, ITU, PSRITU: International Telecommunication Union
China United States
Figure9. Internet Penetration, Top Two Countries by number of Users (%)
Figure 6. Internet Users, top three regions by number of users (bn) Figure 7. Internet Users, top two countries by number of users (bn)
Figure 8. Internet Penetration, top three regions by number of users (%) Figure 9. Internet Penetration, top two countries by number of users (%)
0.0
0.5
1.0
1.5
2.0
2.5
3.0
3.5
2005 2006 2007 2008 2009 2010 2011 2012 2013 2014 2015
Source: Bloomberg, ITU, PSRITU: International Telecommunication Union
Total Asia & Pacific The Americas Europe
0.0
0.1
0.2
0.3
0.4
0.5
0.6
0.7
2005 2006 2007 2008 2009 2010 2011 2012 2013 2014 2015
Source: Bloomberg, ITU, PSRITU: International Telecommunication Union
China United States
0
20
40
60
80
100
2005 2006 2007 2008 2009 2010 2011 2012 2013 2014 2015
Source: Bloomberg, ITU, PSRITU: International Telecommunication Union
Total Asia & Pacific The Americas Europe
0
20
40
60
80
100
2005 2006 2007 2008 2009 2010 2011 2012 2013 2014 2015
Source: Bloomberg, ITU, PSRITU: International Telecommunication Union
China United States

Page | 5 | PHILLIP SECURITIES RESEARCH (SINGAPORE)
KEPPEL DC REIT INITIATION
Strong growth in cloud storage and traffic. Referring to Cisco GCI, we see that the number of personal cloud storage consumers is forecasted to grow at a CAGR of 12% from 2014 to 2019, from 1.14 bn users to 2.05 bn users. Correspondingly, consumer cloud storage traffic is forecasted to grow at a CAGR of 23% from 2014 to 2019, from 14 EB/year to 39 EB/year.
Figure 10. Personal Cloud Storage (bn consumers) Figure 10. Personal Cloud Storage (bn consumers) Figure 11. Consumer Cloud Storage Traffic (EB/year)
1.14 1.36 1.57 1.74 1.90 2.050%
5%
10%
15%
20%
25%
30%
0.0
0.5
1.0
1.5
2.0
2.5
2014 2015F 2016F 2017F 2018F 2019F
Source: Cisco GCI, PSRCAGR 2014-2019: 12%
%y-o-y, RHS
14 17 21 26 33 390%
5%
10%
15%
20%
25%
30%
0
10
20
30
40
50
2014 2015F 2016F 2017F 2018F 2019F
Source: Cisco GCI, PSRCAGR 2014-2019: 23%
%y-o-y, RHS
Figure 11. Consumer Cloud Storage Traffic (EB/year) Figure 10. Personal Cloud Storage (bn consumers) Figure 11. Consumer Cloud Storage Traffic (EB/year)
1.14 1.36 1.57 1.74 1.90 2.050%
5%
10%
15%
20%
25%
30%
0.0
0.5
1.0
1.5
2.0
2.5
2014 2015F 2016F 2017F 2018F 2019F
Source: Cisco GCI, PSRCAGR 2014-2019: 12%
%y-o-y, RHS
14 17 21 26 33 390%
5%
10%
15%
20%
25%
30%
0
10
20
30
40
50
2014 2015F 2016F 2017F 2018F 2019F
Source: Cisco GCI, PSRCAGR 2014-2019: 23%
%y-o-y, RHS
Global IP traffic and consumer Internet traffic is set to grow as well. Referring to Cisco VNI, we see that Global IP traffic dominated by the Consumer segment, accounting for about 80% of total Global IP traffic. The Consumer segment of IP traffic is forecasted to grow at a CAGR of 24% from 2014 to 2019.
For the regions when KDCREIT has exposure to, Cisco forecasts by geography, that Asia Pacific, North America and Western Europe Global Consumer IP traffic to grow at a CAGR of 22%, 21% and 19% respectively, from 2014 to 2019.
Within the Global Consumer Internet Traffic segments, Cisco has forecasted a CAGR of 40% for Internet video, from 2014 to 2019.
Figure 12. Global IP Traffic, by segment (EB/month) Figure 12. Global IP Traffic, by segment (EB/month) Figure 13. Global Consumer IP Traffic, by geography (EB/month)
Figure 14. Global Consumer Internet Traffic, by segment (EB/month)
0
50
100
150
200
2014 2015F 2016F 2017F 2018F 2019F
Source: Cisco VNI, PSRConsumer, CAGR 2014-2019: 24%Business, CAGR 2014-2019: 20%
Consumer Business
0
20
40
60
80
100
120
2014 2015F 2016F 2017F 2018F 2019F
Source: Cisco VNI, PSRInternet video, CAGR 2014-2019: 40%
Internet video Web, email and data File sharing Online gaming
0
10
20
30
40
50
2014 2015F 2016F 2017F 2018F 2019F
Source: Cisco VNI, PSR
Asia Pacific North America Western Europe
CAGR2014-2019
Asia Pacif ic: 22%North America:
21%Western Europe: 20%

Page | 6 | PHILLIP SECURITIES RESEARCH (SINGAPORE)
KEPPEL DC REIT INITIATION
Figure 13. Global Consumer IP Traffic, by Geography (EB/month) Figure 12. Global IP Traffic, by segment (EB/month) Figure 13. Global Consumer IP Traffic, by geography (EB/month)
Figure 14. Global Consumer Internet Traffic, by segment (EB/month)
0
50
100
150
200
2014 2015F 2016F 2017F 2018F 2019F
Source: Cisco VNI, PSRConsumer, CAGR 2014-2019: 24%Business, CAGR 2014-2019: 20%
Consumer Business
0
20
40
60
80
100
120
2014 2015F 2016F 2017F 2018F 2019F
Source: Cisco VNI, PSRInternet video, CAGR 2014-2019: 40%
Internet video Web, email and data File sharing Online gaming
0
10
20
30
40
50
2014 2015F 2016F 2017F 2018F 2019F
Source: Cisco VNI, PSR
Asia Pacific North America Western Europe
CAGR2014-2019
Asia Pacif ic: 22%North America:
21%Western Europe: 20%
Figure 14. Global Consumer Internet Traffic, by Segment (EB/month)
Figure 12. Global IP Traffic, by segment (EB/month) Figure 13. Global Consumer IP Traffic, by geography (EB/month)
Figure 14. Global Consumer Internet Traffic, by segment (EB/month)
0
50
100
150
200
2014 2015F 2016F 2017F 2018F 2019F
Source: Cisco VNI, PSRConsumer, CAGR 2014-2019: 24%Business, CAGR 2014-2019: 20%
Consumer Business
0
20
40
60
80
100
120
2014 2015F 2016F 2017F 2018F 2019F
Source: Cisco VNI, PSRInternet video, CAGR 2014-2019: 40%
Internet video Web, email and data File sharing Online gaming
0
10
20
30
40
50
2014 2015F 2016F 2017F 2018F 2019F
Source: Cisco VNI, PSR
Asia Pacific North America Western Europe
CAGR2014-2019
Asia Pacif ic: 22%North America:
21%Western Europe: 20%
Recent market updates from KDCREIT Positive trends in data creation, cloud traffic and e-commerce Cloud traffic in Asia Pacific and Western Europe is expected to grow at a CAGR of 37%
and 26% respectively, from 2013 to 2018. E-commerce sales to grow at a CAGR of 18% from 2013 to 2018 Data creation forecasted to reach 44 ZB/year by 2020. (1 ZB = 10
21 bytes)
Growth in Internet Users and proliferation of mobile devices Internet Users: penetration 43%, y-o-y growth 8% Mobile Users: penetration 51%, y-o-y growth 3% Social Media Users: penetration 30%, y-o-y growth 23% Figure 15. Data creation, cloud traffic and e-commerce trends
Source: KDCREIT 2Q FY2015 results presentation, 15 July 2015

Page | 7 | PHILLIP SECURITIES RESEARCH (SINGAPORE)
KEPPEL DC REIT INITIATION
Figure 16. Growth in Internet Users and proliferation of mobile devices
Source: KDCREIT 3Q FY2015 results presentation, 15 October 2015
3. Increasing compliance and regulatory requirements on data security. The impact of increased requirements has swept across various sectors and industries. They include the banking, financial services and healthcare sectors. Their data have to not only be stored in a secure facility, but must also be accessible and retrievable. Adding on to the burden of higher storage requirements is the broader range of data and longer duration that regulations are imposing onto organisations. As such, these factors should inevitably lead to demand for professionally managed data centres.
Examples of compliance and regulatory requirements
Type Effective year Compliance and regulatory requirements
HIPAA (Health Insurance Portabi l i ty
And Accountabi l i ty Act)
New regulations
planned for 2015
Used in the US health care industry to protect patient data in hospita l
computer networks and data centre s torage, to ensure that patient
privacy i s not compromised
Monetary Authori ty of Singapore 2013 A national regulatory authori ty, which was formed under a
Government Act in 1970 and regulates banking and insurance matters
in Singapore. Recently introduced the Technology Risk Management
guidel ines in June 2013
PCI DSS (Payment Card Industry Data
Securi ty Standard)
2009 An industry consortium standard used by credit card companies to
protect consumer records in the database
Sarbanes Oxley (SOX) 2002 Increase in auditing of the company's financia l system that i s tied to
the IT platform. This leads to more effective auditing with a need to
identi fy and provide a time-based record of when and where the
network was accessed and by whom
Source: BroadGroup, KDCREIT Prospectus , Phi l l ip Securi ties Research (Singapore)

Page | 8 | PHILLIP SECURITIES RESEARCH (SINGAPORE)
KEPPEL DC REIT INITIATION
4. Continued trend of outsourcing of data centres. BroadGroup projects that the proportion of outsourced data centre space in Asia-Pacific to increase from 12.1% in 2013 to 38.5% in 2018. In Western Europe, this figure is projected to increase from 21.2% in 2013 to 42.2% in 2018. The trend of outsourcing data centres to third party providers are due to the following reasons:- Cost effectiveness. This is due to the large upfront costs to construct a well-
specified data centre and better utilisation through co-locating. Increased complexity. The complexity of running of an in-house data centre is
exacerbated by the difficulty in attracting and retaining qualified staff who are competent in managing the data centre.
Users focusing on their core competencies. Owning and operating an in-house date centre requires technical skills that are likely to be outside of the organisation's core competencies.
Changing needs. Third party data centres are able to offer customised solutions, according to an organisation's changing requirements and growing needs for storage space.
Figure 17. Continued trend of data centres being outsourced
Source: KDCREIT prospectus, 5 December 2014

Page | 9 | PHILLIP SECURITIES RESEARCH (SINGAPORE)
KEPPEL DC REIT INITIATION
Company Background KDCREIT is the first data centre REIT listed in Asia and on the Singapore Exchange. It was listed on 12 December 2014 with an offering price of S$0.93. Investment Strategy The REIT has been established to invest in a diversified portfolio of income producing
assets which are used primarily for data centre purposes, with a focus on Asia-Pacific and Europe.
The investment strategy will be adhered to for at least three years. It may only be changed within three years if an Extraordinary Resolution is passed at a meeting of Unitholders.
Trust Structure The following figure illustrates the structure of the trust with the various stakeholders. Trustee. The Trust Company (Asia) Limited. The property portfolio is held in a trust by
the Trustee. The Trustee is responsible for the safe custody of the assets on behalf of Unitholders.
REIT Manager. The REIT is externally managed by Keppel DC REIT Management Pte. Ltd., a wholly-owned subsidiary of the Sponsor.
Sponsor. Keppel Telecommunications & Transportation Limited (Keppel T&T) is listed and headquartered in Singapore with operations in Asia-Pacific and Europe. It offers integrated services and solutions in the two core businesses of logistics and data centres. Keppel T&T has granted Rights of First Refusal (ROFR) to acquire all of its income-producing data centre assets.
Facility Managers. Keppel T&T and third party managers.
Figure 18. KDCREIT Trust Structure
Source: KDCREIT 3Q FY2015 results presentation, 15 October 2015

Page | 10 | PHILLIP SECURITIES RESEARCH (SINGAPORE)
KEPPEL DC REIT INITIATION
Manager's fee-structure Base fee. 0.5% per annum of the value of the Deposited Property Performance fee. 3.5% per annum of Net Property Income Acquisition fee. 1.0% of acquisition price of real estate, equity interests or investment Divestment fee. 0.5% of sale price of real estate, equity interests or investment
Portfolio diversification: by geography KDCREIT currently holds nine data centre properties with an aggregate lettable area of approximately 597,909 sq ft across seven cities in Asia Pacific and Europe. Asia Pacific. The data centre properties include S25 and T25 in Singapore; Basis Bay
Data Centre in Cyberjaya, Malaysia; Intellicentre 2 and Gore Hill Data Centre in Sydney, Australia; and iseek Data Centre in Brisbane, Australia.
Europe. KDCREIT owns GV7 Data Centre in London, United Kingdom; Citadel 100 Data Centre in Dublin, Ireland; and Almere Data Centre in Amsterdam, Netherlands.
Portfolio rental income diversification: by tenant's trade sector Rental income from tenants in the portfolio come from five trade sectors of IT services (39.4%), Internet enterprise (24.7%), Telecoms (18.3%), Financial services (13.2%) and Corporate (4.4%).
Portfolio rental income diversification: by lease-type Rental income is a mix of Co-location (69.2%), fully-fitted (25.1%) and shell & core (5.7%).
Figure 19. Portfolio Overview
Source: KDCREIT 3Q FY2015 results presentation, 15 October 2015

Page | 11 | PHILLIP SECURITIES RESEARCH (SINGAPORE)
KEPPEL DC REIT INITIATION
Figure 20. Diversified across geography and tenant's trade sector
Source: KDCREIT 3Q FY2015 results presentation, 15 October 2015
Figure 21. Diversified across lease type
Source: KDCREIT 3Q FY2015 results presentation, 15 October 2015

Page | 12 | PHILLIP SECURITIES RESEARCH (SINGAPORE)
KEPPEL DC REIT INITIATION
Organic growth through in-built rental escalations and asset enhancement initiative (AEI) potential In-built rental escalations Double-net and triple-net leases have average fixed rental escalation of between 2.0%
and 4.0% per annum. Co-location leases also have an average fixed rental escalation component of between
2.0% and 4.0% per annum.
AEI potential As outlined in the Prospectus, certain properties in KDCREIT's portfolio have potential for further expansion through AEI.
KDCREIT properties with AEI potential
Property Location
Existing space
(sq ft)
Potential space
(sq ft) Organic expansion potential
Citadel 100 Data Centre Dubl in, Ireland 68,118 40,000 Convers ion of unused car park space
T25 Singapore 36,888 20,000 Unuti l i sed GFA
Bas is Bay Data Centre Cyberjaya, Malays ia 48,680 5,000 Convers ion of rooftop space
Source: KDCREIT Prospectus , Phi l l ip Securi ties Research (Singapore)
Inorganic growth through third-party acquisitions and Rights of First Refusal (ROFR) First acquisition: Intellicentre 2 (IC2) IC2 was acquired for approximately A$43.3mn (c.S$45.9mn) and the acquisition was completed on 10 Aug 2015. IC2 is located in Sydney, Australia and has a lettable area of 87,930 sq ft, thus increasing the portfolio's lettable area by about 17%. Payment for the acquisition is payable in two tranches. The first tranche of A$40.3mn (c.S$42.7mn) has been paid, and the remainder will be payable on the first anniversary of the completion of the acquisition. This was a sale and leaseback transaction with Macquarie Telecom for the shell and core building. This is a 20-year triple-net lease, and should provide the portfolio with greater stability and income visibility. IC2 is valued at S$46.6mn as of 30 Sep 2015.
Second acquisition: mainCubes Data Centre (mainCubes DC) The Manager announced on 28 October 2015 that it has entered into a conditional real property purchase agreement with mainCubes One Immobilien GmbH & Co. KG (the Vendor) for a property located at Offenbach am Main data centre hub, Frankfurt, Germany. The aggregate consideration for the acquisition is for EUR 84.0mn (approximately S$130mn). A four-storey fully-fitted data centre will be constructed on the property. Construction is expected to be completed in 2018. The data centre will be subject to a triple-net lease for an initial term of 15 years for the estimated 11,780 sqm lettable area. KDCREIT will receive regular coupon payments from the Vendor until the data centre is completed.
ROFR pipeline Apart from the ROFR granted by the Sponsor (Keppel T&T), iseek Communications has also granted ROFR to KDCREIT on data centre properties which iseek Communications develops in Australia.
T27 expected to be acquired in 1H FY16. We understand from the Manager that the acquisition of T27 would likely be in 1H 2016. While no valuation has been done on the property, the Manager guided that it could be of the order of S$250mn with a yield lower than 8.25%. This would result in a hefty acquisition relative to the existing portfolio carrying value of S$1.02bn. The property will be leased as co-location. Equity fund raising (EFR) will likely be carried out in conjunction with the acquisition.

Page | 13 | PHILLIP SECURITIES RESEARCH (SINGAPORE)
KEPPEL DC REIT INITIATION
ROFR pipeline
Property Location Area (sq ft) Remarks
T27 Singapore 13,400 (GFA),
47,000 (NLA)
Completed in 3Q 2014; expected to be acquired in 1H 2016
Almere Data Centre 2 Amsterdam, Netherlands 53,800 (NLA) Officia l ly opened on 30 October 2015; located next to Almere
Data Centre
T20 Singapore 183,000 (GFA) Property acquired by Keppel T&T on 23 July 2015; core and shel l
expected to be completed by 2016; fi t-out by 2017
Proposed data centre Brisbane, Austra l ia - To be developed by iseek Communications on a plot of vacant
land adjacent to iseek Data Centre
Source: KDCREIT, Keppel T&T, Phi l l ip Securi ties Research (Singapore)
Continued unfavourable foreign currency exposure. KDCREIT is exposed to 4 different foreign currencies, namely EUR, GBP, AUD and MYR. The following charts show that SGD has been appreciating relative to all of them over the past three years, except for GBP. We estimate that about 53% of portfolio rental income in 3Q FY15 was collectively denominated in EUR, AUD and MYR; with about 41% in SGD and 6% in GBP.
Figure 22. Price of 1 SGD in AUD Figure 22. Price of 1 SGD in AUD Figure 23. Price of 1 SGD in MYR
Figure 24. Price of 1 SGD in GBP Figure 25. Price of 1 SGD in EUR
0.6
0.7
0.8
0.9
1.0
1.1
2012 2013 2014 2015 2016
Source: Bloomberg, PSR
SGDAUD Curncy
SGD appreciating
2.0
2.2
2.4
2.6
2.8
3.0
3.2
2012 2013 2014 2015 2016
Source: Bloomberg, PSR
SGDMYR Curncy
SGD appreciating
0.40
0.45
0.50
0.55
0.60
2012 2013 2014 2015 2016
Source: Bloomberg, PSR
SGDGBP Curncy
SGD depreciating
0.40
0.50
0.60
0.70
0.80
2012 2013 2014 2015 2016
Source: Bloomberg, PSR
SGDEUR Curncy
SGD appreciating
Figure 23. Price of 1 SGD in MYR Figure 22. Price of 1 SGD in AUD Figure 23. Price of 1 SGD in MYR
Figure 24. Price of 1 SGD in GBP Figure 25. Price of 1 SGD in EUR
0.6
0.7
0.8
0.9
1.0
1.1
2012 2013 2014 2015 2016
Source: Bloomberg, PSR
SGDAUD Curncy
SGD appreciating
2.0
2.2
2.4
2.6
2.8
3.0
3.2
2012 2013 2014 2015 2016
Source: Bloomberg, PSR
SGDMYR Curncy
SGD appreciating
0.40
0.45
0.50
0.55
0.60
2012 2013 2014 2015 2016
Source: Bloomberg, PSR
SGDGBP Curncy
SGD depreciating
0.40
0.50
0.60
0.70
0.80
2012 2013 2014 2015 2016
Source: Bloomberg, PSR
SGDEUR Curncy
SGD appreciating
Figure 24. Price of 1 SGD in GBP
Figure 22. Price of 1 SGD in AUD Figure 23. Price of 1 SGD in MYR
Figure 24. Price of 1 SGD in GBP Figure 25. Price of 1 SGD in EUR
0.6
0.7
0.8
0.9
1.0
1.1
2012 2013 2014 2015 2016
Source: Bloomberg, PSR
SGDAUD Curncy
SGD appreciating
2.0
2.2
2.4
2.6
2.8
3.0
3.2
2012 2013 2014 2015 2016
Source: Bloomberg, PSR
SGDMYR Curncy
SGD appreciating
0.40
0.45
0.50
0.55
0.60
2012 2013 2014 2015 2016
Source: Bloomberg, PSR
SGDGBP Curncy
SGD depreciating
0.40
0.50
0.60
0.70
0.80
2012 2013 2014 2015 2016
Source: Bloomberg, PSR
SGDEUR Curncy
SGD appreciating

Page | 14 | PHILLIP SECURITIES RESEARCH (SINGAPORE)
KEPPEL DC REIT INITIATION
Figure 2. Price of 1 SGD in EUR
Figure 22. Price of 1 SGD in AUD Figure 23. Price of 1 SGD in MYR
Figure 24. Price of 1 SGD in GBP Figure 25. Price of 1 SGD in EUR
0.6
0.7
0.8
0.9
1.0
1.1
2012 2013 2014 2015 2016
Source: Bloomberg, PSR
SGDAUD Curncy
SGD appreciating
2.0
2.2
2.4
2.6
2.8
3.0
3.2
2012 2013 2014 2015 2016
Source: Bloomberg, PSR
SGDMYR Curncy
SGD appreciating
0.40
0.45
0.50
0.55
0.60
2012 2013 2014 2015 2016
Source: Bloomberg, PSR
SGDGBP Curncy
SGD depreciating
0.40
0.50
0.60
0.70
0.80
2012 2013 2014 2015 2016
Source: Bloomberg, PSR
SGDEUR Curncy
SGD appreciating

Page | 15 | PHILLIP SECURITIES RESEARCH (SINGAPORE)
KEPPEL DC REIT INITIATION
Investment Merits for KDCREIT Unique asset class of data centres; with strong underlying demand driver. Investment
thesis for KDCREIT is the explosive growth in data requirements. Business of data centres has high barriers to entry. Barriers to entry include lack of
suitable sites, high upfront cost and specific site demands. Running a data centre requires skilled labour and a proven track record. In short, the business model is not easy to replicate.
Industry enjoys high level of customer retention. This is due to the mission-critical infrastructure housed in the data centre, substantial relocation costs, growing data centre requirements and significant investments made by (shell & core) customers.
Fragmented market with a few main players and several small players. This results in a lower intensity competition.
Favourable demand and supply dynamics. High projected absorption, resulting in improving occupancy. Incremental demand is projected to exceed incremental demand.
Organic and inorganic growth opportunities. Organic growth through rental escalations and AEI. Inorganic growth through third-party acquisitions and ROFR properties from Sponsor.
Stable and predictable income stream. Portfolio enjoys a long weighted average lease expiry (WALE) of 8.9 years by lettable area with high occupancy of 95.1% as of the end of 3Q FY15 on 30 September 2015.
Attractive distribution yield. KDC offers an attractive FY16 forward dividend yield of about 6.7%.
Figure 26. Improving occupancy due to high absorption
Source: KDCREIT 2Q FY2015 results presentation, 15 July 2015

Page | 16 | PHILLIP SECURITIES RESEARCH (SINGAPORE)
KEPPEL DC REIT INITIATION
Investment Risks for KDCREIT We identify some of the risk factors applicable to KDCREIT, their mitigating factors and summarise them in the following table.
Management of risk factors
Risk Factors Remarks
Interest rate risk Fixed 100% of interest rate exposure for long-term loans
Refinancing risk 9.1% of tota l to be refinanced in 2016, next refinancing in 2018;
Weighted average debt tenor of 3.4 years ;
Debt headroom of about S$100mn based on 40% gearing as of 3Q FY15 (PSR est.)
Financia l ri sk Low gearing at 30.1%, with long-term target of 30%;
FY15F Interest cover ratio of 6.6 times (PSR est.)
Foreign exchange risk Natura l hedging of loans denominated in same currency as properties ;
Two years hedging us ing foreign currency forward contracts ;
100% of forecasted foreign-sourced dis tributions up to 1H 2017 (as of 3Q FY15)
Occupancy risk Divers i fied between co-location, ful ly-fi tted, shel l & core;
Portfol io 95.1% occupancy
Tenant concentration risk Tenants come from various trade sectors , with IT services as the largest sector
accounting for 39.4% of rental income
Operating risk Long portfol io WALE of 8.9 years ;
23.3% by rental income up for renewal in 2016
Source: KDCREIT, Phi l l ip Securi ties Research (Singapore)
Advancement in storage technology, requiring less physical space. Higher data storage capacity requiring less physical space will adversely affect demand for data centre.
Unfavourable foreign currency movements. KDCREIT is exposed to EUR, GBP, AUD and MYR. Apart from the GBP, the other three currencies have been depreciating relative to SGD since the beginning of 2013.
Refinancing risk. Ability to refinance debt is one of the key risks for any REIT. Rental reversion & non-renewal risk. Ability to increase rents, retain existing tenants
and attract new tenants is one of the risks for any REIT. Regulatory risk. Government policy and tightening of supply of suitable sites can
inhibit future growth. Unitholder dilution & value destruction. Due to the nature of a REIT, there will be
more frequent calls (compared to stocks) for capital through placements or rights issue to acquire properties. There is a risk that the acquisition might not be DPU accretive.
Valuation Methodology: Dividend Discount Model (DDM) Absolute valuation. The DDM is an appropriate method to value KDC as most of its cash flow is paid out to Unitholders through dividends. We derive a valuation of S$1.13 from our DDM estimates.
Dividend Discount Model
Y/E Dec FY16e FY17e FY18e FY19e FY20e
Forecasted distributions (S$) 0.065 0.066 0.066 0.067 0.067
PV of forecasted distributions (S$) 0.061 0.058 0.054 0.052 0.048
Terminal value (S$) 1.187
PV of terminal value (S$) 0.858
Price Target (S$) 1.130
Assumptions
Cost of equity 6.7%
Terminal growth rate 1.0%
Source: Phi l l ip Securi ties Research (Singapore) Risks to our valuation Acquisition of T27 in 2016 could be highly DPU-dilutive. While it is an opportunity to expand the portfolio, but EFR may result in a highly DPU-dilutive acquisition. Our back-of-the envelope calculation assuming a 30:70 debt-equity funding, S$250mn acquisition and 8.1% yield will result in a marginal yield accretion of c.30ppt to the portfolio. Moreover,
Page | 17 | PHILLIP SECURITIES RESEARCH (SINGAPORE)
KEPPEL DC REIT INITIATION
assuming EFR for 70% of S$250mn through placement at S$0.98 per share (3% discount to previous closing price) would result in 178.6mn new Units created – a 20% increase over the existing 883mn Units as of 3Q FY15. As such, based on the limited information available and our assumptions, acquisition of T27 appears to be yield-accretive to the portfolio, but not DPU-accretive to Unitholders.
Our current valuation does not factor in the acquisition of T27.
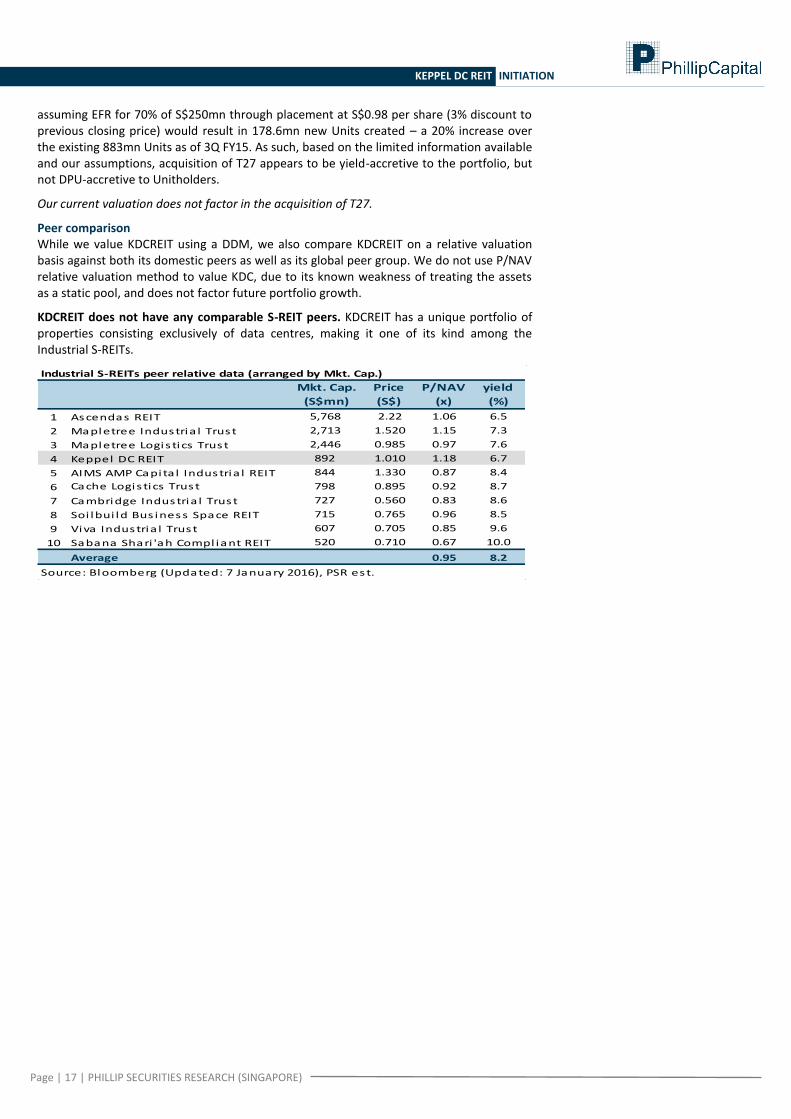
Peer comparison While we value KDCREIT using a DDM, we also compare KDCREIT on a relative valuation basis against both its domestic peers as well as its global peer group. We do not use P/NAV relative valuation method to value KDC, due to its known weakness of treating the assets as a static pool, and does not factor future portfolio growth.
KDCREIT does not have any comparable S-REIT peers. KDCREIT has a unique portfolio of properties consisting exclusively of data centres, making it one of its kind among the Industrial S-REITs.
Industrial S-REITs peer relative data (arranged by Mkt. Cap.)
Mkt. Cap.
(S$mn)
Price
(S$)
P/NAV
(x)
yield
(%)
1 Ascendas REIT 5,768 2.22 1.06 6.5
2 Mapletree Industria l Trust 2,713 1.520 1.15 7.3
3 Mapletree Logis tics Trust 2,446 0.985 0.97 7.6
4 Keppel DC REIT 892 1.010 1.18 6.7
5 AIMS AMP Capita l Industria l REIT 844 1.330 0.87 8.4
6 Cache Logis tics Trust 798 0.895 0.92 8.7
7 Cambridge Industria l Trust 727 0.560 0.83 8.6
8 Soi lbui ld Bus iness Space REIT 715 0.765 0.96 8.5
9 Viva Industria l Trust 607 0.705 0.85 9.6
10 Sabana Shari 'ah Compl iant REIT 520 0.710 0.67 10.0
Average 0.95 8.2
Source: Bloomberg (Updated: 7 January 2016), PSR est.

Page | 18 | PHILLIP SECURITIES RESEARCH (SINGAPORE)
KEPPEL DC REIT INITIATION
US-listed data centre REITs trade at a higher premium to net-asset-value (NAV), and are not directly comparable. KDCREIT was also compared against its global peer group of data centre REITs listed in the US and Australia. The data centre REITs listed in the US trade at a much higher premium to their NAV, compared to KDCREIT. This discrepancy arises from the different accounting models used by the US-listed data centre REITs and KDCREIT to account for their data centre properties. The US-listed peers classify their data centre properties as Property, Plant and Equipment (PPE), and are depreciated annually. In contrast, KDCREIT's properties are classified as Investment Properties, and are revalued annually. As such, the book value of US-listed REITs reflect the historical cost less accumulated depreciation, and not the market value of the data centres in their portfolio. Hence, the US-listed data centre REITs trade at a much higher P/NAV than KDCREIT.
Global peer relative data (arranged by Mkt. Cap.)
Currency
Price
($)
Mkt. Cap.
(S$ mn)
Mkt. Cap.
(US$ mn)
P/NAV
(x)
yield
(%)
Equinix Inc USD 309.13 26,584 18,514 11.9 2.2
Digi ta l Realty Trust Inc USD 77.00 16,180 11,268 3.9 4.4
CyrusOne Inc USD 37.90 3,605 2,511 3.2 3.3
DuPont Fabros Technology Inc USD 31.48 2,973 2,070 2.5 6.0
QTS Realty Trust Inc USD 44.13 2,607 1,816 2.9 2.9
Cores i te Realty Corp USD 58.03 2,553 1,778 6.1 3.7
Keppel DC REIT SGD 1.010 892 621 1.2 6.7
As ia Paci fic Data Centre AUD 1.31 152 106 1.1 7.2
Source: Bloomberg (Updated: 7 January 2016), PSR est.
KDCREIT's closest relative comparable peer is Asia Pacific Data Centre. Asia Pacific Data Centre (ASX ticker: AJD) is Australia's first listed data centre REIT. AJD has been listed on the Australia Stock Exchange (ASX) since 9 January 2013. AJD re-values its investment properties annually – similar to what KDCREIT does.
On a historical valuation basis, we note that KDCREIT does not have a long operating history as it was only recently listed in 12 December 2014; so historical valuation is for reference only. We see that KDCREIT has historically traded above 1.1x P/NAV; and AJD is usually priced higher than 1.0x P/NAV.
We do not benchmark KDCREIT against AJD as one peer does not constitute as a sector comparison.
Figure 27. Historical P/NAV (x) Figure 27. Historical P/NAV (x)
0.90
1.00
1.10
1.20
1.30
2013 2014 2015 2016
Source: Bloomberg, PSR est.
KDCREIT SP Equity
AJD AU Equity
Page | 19 | PHILLIP SECURITIES RESEARCH (SINGAPORE)
KEPPEL DC REIT INITIATION
APPENDIX Porter five forces for the data centre industry Bargaining power of customers: low Customer's mission critical infrastructure are housed in the data centre. Relocation to
another data centre would disrupt business operations. Thus, customer retention is typically high, stemming from disruption to business operations during the transition of relocating.
Bargaining power of suppliers: moderate Supplier refers to the inputs into the data centre. This includes the power supply, data
carrier, skilled labour and government policies to allocate suitable land for data centres.
Threat of new entrants: low High barriers to entry: high upfront cost, limited suitable space for development,
requires technical knowledge, and customers prefer an operator with a proven track record owing to the mission critical nature of the data centre.
Threat of substitutes: low Substitute to third-party data centre is to self-operate, but this is inhibitive due to:
better cost effectiveness in out-sourcing, increasing complexity in self-managing a data centre, managing a data centre is usually outside of the customer's field of expertise and flexible arrangements when out-sourcing.
Intensity of rivalry: low Highly fragmented industry with a few large players and several smaller players. SWOT Analysis for KDCREIT Strengths Portfolio diversification by geography, tenant's trade sector and lease-types Properties are located in key data centre hubs and demand growth areas Weaknesses Portfolio concentration consists exclusively of data centres Opportunities Access to a unique asset class that has explosive underlying demand Inorganic growth from third-party acquisitions and ROFR pipeline from Sponsor Properties are located in regions with strong government support and established
infrastructure Threats Unfavourable foreign currency movement
Technological advancement of greater electronic storage capacity, but requiring less physical space
Economic slowdown, affecting demand from customers

Page | 20 | PHILLIP SECURITIES RESEARCH (SINGAPORE)
KEPPEL DC REIT INITIATION
Financials
Statement of Total Return and Distribution Statement Balance Sheet
Y/E Dec, SGD mn FY15e FY16e FY17e FY18e Y/E Dec, SGD mn FY15e FY16e FY17e FY18e
Gross rental income 105.9 100.0 100.7 105.7 ASSETS
Other income 2.3 3.0 3.1 3.0 Investment properties 1,051 1,057 1,059 1,191
Gross revenue 108.2 103.0 103.7 108.7 Inv. Propty. Under Devmnt. 13 13 13 -
Property expenses (17.9) (18.3) (18.7) (19.8) Others 4.4 4.4 4.4 4.4
Net property income 90.3 84.7 85.0 89.0 Total non-current assets 1,069 1,075 1,077 1,196
Net Finance (Expense)/Inc (12.5) (12.3) (11.9) (12.6) Cash 38.3 3.4 5.0 17.8
Manager's fees (8.8) (8.2) (8.3) (8.7) Trade receivables 57.7 59.7 59.1 66.9
Other i tems (0.1) (0.1) (0.1) (0.1) Others 1.4 1.4 1.4 1.4
Exceptional i tems - - - - Total current assets 97.4 64.4 65.5 86.1
FV change, Invmnt. properties (0.8) - - - Total Assets 1,166 1,139 1,142 1,282
Total Return Before Tax 68.1 64.1 64.7 67.5
Taxation (4.1) (3.4) (3.4) (3.6) LIABILITIES
Total Return After Tax 64.0 60.7 61.3 64.0 Trade payables 14.5 14.7 14.6 16.5
Unitholders 64.0 60.6 61.2 63.9 Borrowings 39.1 9.0 162.0 139.0
Non-control l ing interest 0.04 0.04 0.04 0.04 Others 0.5 0.5 0.5 0.5
Dis tribution adjustments (3.9) (3.2) (3.1) (3.1) Total current liabilities 54.0 24.1 177.1 156.0
Income available for distribution 60.1 57.5 58.1 60.8 Borrowings 334.7 334.7 181.7 244.7
Income distributed 60.1 57.5 58.1 60.8 Others 5.8 5.8 5.8 5.8
Total non-current liabilities 340.5 340.5 187.5 250.5
Total Liabilities 394.5 364.7 364.6 406.5
Per share data
Y/E Dec FY15e FY16e FY17e FY18e Net assets 772 775 778 875
NAV (S$) 0.87 0.88 0.88 0.90 Represented by:
EPU (Cents ) 7.25 6.86 6.93 6.98 Unitholders' funds 771 774 777 875
DPU (Cents) 6.80 6.51 6.57 6.56 Non-control l ing interest 0.42 0.42 0.43 0.43
*Forward EPU does not include change in Fair Value of Investment Properties
Cash Flow
Y/E Dec, SGD mn FY15e FY16e FY17e FY18e
CFO
Total return 64.0 60.7 61.3 64.0
Adjustments 17.4 15.7 15.4 16.2
WC changes (16.5) (1.8) 0.5 (5.9)
Cash generated from ops 64.9 74.6 77.1 74.3
Others (1.1) (3.4) (3.4) (3.6)
Cashflow from ops 63.8 71.2 73.7 70.7 Valuation Ratios
Y/E Dec FY15e FY16e FY17e FY18e
CFI P/NAV (x) 1.16 1.15 1.15 1.12
CAPEX, net (14.6) (2.9) (2.0) (2.0) P/DPU (x) 14.84 15.52 15.36 15.39
Purchase of Inv. Propty. (477) (3) - (117) Dis tribution Yield (%) 6.74 6.44 6.51 6.50
Others (47.6) - - - NPI yield (%) 8.59 8.04 8.03 7.91
Cashflow from investments (539) (6) (2) (119) Growth & Margins (%)
Growth
CFF Revenue -4.8% 0.7% 4.8%
Share i ssuance, net 507 - - 91 Net property income (NPI) -6.2% 0.3% 4.6%
Loans , net of repayments 346 (30) - 40 Dis tributable income -4.3% 1.1% 4.7%
Dividends (57.5) (57.6) (58.1) (57.3) DPU -4.4% 1.0% -0.2%
Others (289) (12) (12) (13) Margins
Cashflow from financing 507 (100) (70) 61 NPI margin 83.4% 82.3% 82.0% 81.8%
Net change in cash 32 (35) 2 13 Key Ratios
Effects of exchange rate (1) - - - Net Debt or (Net Cash) 335.4 340.3 338.6 365.8
Ending cash 38 3 5 18 Gearing (%) 32.1% 30.2% 30.1% 29.9%
Source: Company, Phi l l ip Securi ties Research (Singapore) Estimates
*Forward multiples & yields based on current market price; historical multiples & yields based on historical market price.

Page | 21 | PHILLIP SECURITIES RESEARCH (SINGAPORE)
KEPPEL DC REIT INITIATION
Total Returns Recommendation Rating
> +20% Buy 1
+5% to +20% Accumulate 2
-5% to +5% Neutra l 3
-5% to -20% Reduce 4
< -20% Sel l 5
We do not base our recommendations entirely on the above quanti tative
return bands . We cons ider qual i tative factors l ike (but not l imited to) a s tock's
ri sk reward profi le, market sentiment, recent rate of share price appreciation,
presence or absence of s tock price catalysts , and speculative undertones
surrounding the s tock, before making our fina l recommendation
Ratings History
PSR Rating System
Remarks
1 2 3 4 5
0.90
1.00
1.10
1.20
1.30
Sep-1
4
Dec-14
Mar-15
Jun-15
Sep-1
5
Dec-15
Mar-16
Jun-16
Sep-1
6
Source: Bloomberg, PSRMarket PriceTarget Price

Page | 22 | PHILLIP SECURITIES RESEARCH (SINGAPORE)
KEPPEL DC REIT INITIATION
Contact Information (Singapore Research Team) Management Research Operations Officer Chan Wai Chee (CEO, Research - Special Opportunities) - [email protected]
Jacky Lee Chee Waiy (Head, Research) - [email protected]
Mohamed Ghazali - [email protected]
Consumer | Healthcare Property Developers | Hospitality Macro Soh Lin Sin - [email protected] Peter Ng - [email protected] Pei Sai Teng – [email protected] Transport| REITs ( Industrial ) REITs Technical Analyst Richard Leow, CFTe, FRM - [email protected]
Dehong Tan - [email protected] Jeremy Ng - [email protected]
Contact Information (Regional Member Companies) SINGAPORE
Phillip Securities Pte Ltd Raffles City Tower
250, North Bridge Road #06-00 Singapore 179101 Tel +65 6533 6001 Fax +65 6535 6631
Website: www.poems.com.sg
MALAYSIA Phillip Capital Management Sdn Bhd
B-3-6 Block B Level 3 Megan Avenue II, No. 12, Jalan Yap Kwan Seng, 50450
Kuala Lumpur Tel +603 2162 8841 Fax +603 2166 5099
Website: www.poems.com.my
HONG KONG Phillip Securities (HK) Ltd
11/F United Centre 95 Queensway Hong Kong
Tel +852 2277 6600 Fax +852 2868 5307
Websites: www.phillip.com.hk
JAPAN
Phillip Securities Japan, Ltd. 4-2 Nihonbashi Kabuto-cho Chuo-ku,
Tokyo 103-0026 Tel +81-3 3666 2101 Fax +81-3 3666 6090
Website: www.phillip.co.jp
INDONESIA PT Phillip Securities Indonesia
ANZ Tower Level 23B, Jl Jend Sudirman Kav 33A Jakarta 10220 – Indonesia
Tel +62-21 5790 0800 Fax +62-21 5790 0809
Website: www.phillip.co.id
CHINA Phillip Financial Advisory (Shanghai) Co Ltd
No 550 Yan An East Road, Ocean Tower Unit 2318,
Postal code 200001 Tel +86-21 5169 9200 Fax +86-21 6351 2940
Website: www.phillip.com.cn
THAILAND Phillip Securities (Thailand) Public Co. Ltd
15th Floor, Vorawat Building, 849 Silom Road, Silom, Bangrak,
Bangkok 10500 Thailand Tel +66-2 6351700 / 22680999
Fax +66-2 22680921 Website www.phillip.co.th
FRANCE King & Shaxson Capital Limited
3rd Floor, 35 Rue de la Bienfaisance 75008 Paris France
Tel +33-1 45633100 Fax +33-1 45636017
Website: www.kingandshaxson.com
UNITED KINGDOM King & Shaxson Capital Limited
6th Floor, Candlewick House, 120 Cannon Street, London, EC4N 6AS
Tel +44-20 7426 5950 Fax +44-20 7626 1757
Website: www.kingandshaxson.com
UNITED STATES Phillip Futures Inc
141 W Jackson Blvd Ste 3050 The Chicago Board of Trade Building
Chicago, IL 60604 USA Tel +1-312 356 9000 Fax +1-312 356 9005
Website: www.phillipusa.com
AUSTRALIA Phillip Capital Limited
Level 12, 15 William Street, Melbourne, Victoria 3000, Australia
Tel +61-03 9629 8288 Fax +61-03 9629 8882
Website: www.phillipcapital.com.au
SRI LANKA Asha Phillip Securities Limited 2nd Floor, Lakshmans Building,
No. 321, Galle Road, Colombo 03, Sri Lanka Tel: (94) 11 2429 100 Fax: (94) 11 2429 199
Website: www.ashaphillip.net
INDIA PhillipCapital (India) Private Limited
No.1, 18th Floor, Urmi Estate 95, Ganpatrao Kadam Marg
Lower Parel West, Mumbai 400-013 Maharashtra, India
Tel: +91-22-2300 2999 / Fax: +91-22-2300 2969 Website: www.phillipcapital.in
TURKEY PhillipCapital Menkul Degerler
Dr. Cemil Bengü Cad. Hak Is Merkezi No. 2 Kat. 6A Caglayan 34403 Istanbul, Turkey
Tel: 0212 296 84 84 Fax: 0212 233 69 29
Website: www.phillipcapital.com.tr
DUBAI Phillip Futures DMCC
Member of the Dubai Gold and Commodities Exchange (DGCX)
Unit No 601, Plot No 58, White Crown Bldg, Sheikh Zayed Road, P.O.Box 212291
Dubai-UAE Tel: +971-4-3325052 / Fax: + 971-4-3328895
CAMBODIA
Phillip Bank Plc Ground Floor of B-Office Centre,#61-64, Norodom Blvd Corner Street 306,Sangkat Boeung Keng Kang 1, Khan Chamkamorn,
Phnom Penh, Cambodia Tel: 855 (0) 7796 6151/855 (0) 1620 0769
Website: www.phillipbank.com.kh
Page | 23 | PHILLIP SECURITIES RESEARCH (SINGAPORE)
KEPPEL DC REIT INITIATION
Important Information
This report is prepared and/or distributed by Phillip Securities Research Pte Ltd ("Phillip Securities Research"), which is a holder of a financial adviser’s licence under the Financial Advisers Act, Chapter 110 in Singapore.
By receiving or reading this report, you agree to be bound by the terms and limitations set out below. Any failure to comply with these terms and limitations may constitute a violation of law. This report has been provided to you for personal use only and shall not be reproduced, distributed or published by you in whole or in part, for any purpose. If you have received this report by mistake, please delete or destroy it, and notify the sender immediately.
The information and any analysis, forecasts, projections, expectations and opinions (collectively, the “Research”) contained in this report has been obtained from public sources which Phillip Securities Research believes to be reliable. However, Phillip Securities Research does not make any representation or warranty, express or implied that such information or Research is accurate, complete or appropriate or should be relied upon as such. Any such information or Research contained in this report is subject to change, and Phillip Securities Research shall not have any responsibility to maintain or update the information or Research made available or to supply any corrections, updates or releases in connection therewith.
Any opinions, forecasts, assumptions, estimates, valuations and prices contained in this report are as of the date indicated and are subject to change at any time without prior notice. Past performance of any product referred to in this report is not indicative of future results.
This report does not constitute, and should not be used as a substitute for, tax, legal or investment advice. This report should not be relied upon exclusively or as authoritative, without further being subject to the recipient’s own independent verification and exercise of judgment. The fact that this report has been made available constitutes neither a recommendation to enter into a particular transaction, nor a representation that any product described in this report is suitable or appropriate for the recipient. Recipients should be aware that many of the products, which may be described in this report involve significant risks and may not be suitable for all investors, and that any decision to enter into transactions involving such products should not be made, unless all such risks are understood and an independent determination has been made that such transactions would be appropriate. Any discussion of the risks contained herein with respect to any product should not be considered to be a disclosure of all risks or a complete discussion of such risks.
Nothing in this report shall be construed to be an offer or solicitation for the purchase or sale of any product. Any decision to purchase any product mentioned in this report should take into account existing public information, including any registered prospectus in respect of such product.
Phillip Securities Research, or persons associated with or connected to Phillip Securities Research, including but not limited to its officers, directors, employees or persons involved in the issuance of this report, may provide an array of financial services to a large number of corporations in Singapore and worldwide, including but not limited to commercial / investment banking activities (including sponsorship, financial advisory or underwriting activities), brokerage or securities trading activities. Phillip Securities Research, or persons associated with or connected to Phillip Securities Research, including but not limited to its officers, directors, employees or persons involved in the issuance of this report, may have participated in or invested in transactions with the issuer(s) of the securities mentioned in this report, and may have performed services for or solicited business from such issuers. Additionally, Phillip Securities Research, or persons associated with or connected to Phillip Securities Research, including but not limited to its officers, directors, employees or persons involved in the issuance of this report, may have provided advice or investment services to such companies and investments or related investments, as may be mentioned in this report.
Phillip Securities Research or persons associated with or connected to Phillip Securities Research, including but not limited to its officers, directors, employees or persons involved in the issuance of this report may, from time to time maintain a long or short position in securities referred to herein, or in related futures or options, purchase or sell, make a market in, or engage in any other transaction involving such securities, and earn brokerage or other compensation in respect of the foregoing. Investments will be denominated in various currencies including US dollars and Euro and thus will be subject to any fluctuation in exchange rates between US dollars and Euro or foreign currencies and the currency of your own jurisdiction. Such fluctuations may have an adverse effect on the value, price or income return of the investment.
To the extent permitted by law, Phillip Securities Research, or persons associated with or connected to Phillip Securities Research, including but not limited to its officers, directors, employees or persons involved in the issuance of this report, may at any time engage in any of the above activities as set out above or otherwise hold an interest, whether material or not, in respect of companies and investments or related investments, which may be mentioned in this report. Accordingly, information may be available to Phillip Securities Research, or persons associated with or connected to Phillip Securities Research, including but not limited to its officers, directors, employees or persons involved in the issuance of this report, which is not reflected in this report, and Phillip Securities Research, or persons associated with or connected to Phillip Securities Research, including but not limited to its officers, directors, employees or persons involved in the issuance of this report, may, to the extent permitted by law, have acted upon or used the information prior to or immediately following its publication. Phillip Securities Research, or persons associated with or connected to Phillip Securities Research, including but not limited its officers, directors, employees or persons involved in the issuance of this report, may have issued other material that is inconsistent with, or reach different conclusions from, the contents of this report.
The information, tools and material presented herein are not directed, intended for distribution to or use by, any person or entity in any jurisdiction or country where such distribution, publication, availability or use would be contrary to the applicable law or regulation or which would subject Phillip Securities Research to any registration or licensing or other requirement, or penalty for contravention of such requirements within such jurisdiction.
This report is intended for general circulation only and does not take into account the specific investment objectives, financial situation or particular needs of any particular person. The products mentioned in this report may not be suitable for all investors and a person receiving or reading this report should seek advice from a professional and financial adviser regarding the legal, business, financial, tax and other aspects including the suitability of such products, taking into account the specific investment objectives, financial situation or particular needs of that person, before making a commitment to invest in any of such products.
This report is not intended for distribution, publication to or use by any person in any jurisdiction outside of Singapore or any other jurisdiction as Phillip Securities Research may determine in its absolute discretion. IMPORTANT DISCLOSURES FOR INCLUDED RESEARCH ANALYSES OR REPORTS OF FOREIGN RESEARCH HOUSES Where the report contains research analyses or reports from a foreign research house, please note:
(i) recipients of the analyses or reports are to contact Phillip Securities Research (and not the relevant foreign research house) in Singapore at 250 North Bridge Road, #06-00 Raffles City Tower, Singapore 179101, telephone number +65 6533 6001, in respect of any matters arising from, or in connection with, the analyses or reports; and
(ii) to the extent that the analyses or reports are delivered to and intended to be received by any person in Singapore who is not an accredited investor, expert investor or institutional investor, Phillip Securities Research accepts legal responsibility for the contents of the analyses or reports.