kewaunee nuclear power plant, annual environmental
TRANSCRIPT

Committed oftoear&Kewaunee Nuclear Power PlantOperated by Nuclear Management Company, LLC
April 28, 2004 NRC-04-04610 CFR 50
U.S. Nuclear Regulatory CommissionATTN: Document Control DeskWashington, DC 20555
KEWAUNEE NUCLEAR POWER PLANTDOCKET 50-305LICENSE No. DPR-43ANNUAL ENVIRONMENTAL MONITORING REPORT JANUARY-DECEMBER 2003
Enclosed is the 2003 Annual Environmental Monitoring Report for the KewauneeNuclear Power Plant (KNPP). This report was prepared by Environmental Inc. andsatisfies the requirements of KNPP Technical Specification 6.9.b.1.
The results of the 2003 Land Use Census, submitted in accordance with KNPP's OffsiteDose Calculation Manual, Section 3/4.7.1, are also included in this report.
Thomas CoutuSite Vice-President, Kewaunee Nuclear Power PlantNuclear Management Company, LLC
cc: US NRC, Region IlIlUS NRC Senior Resident Inspector
Enclosure
N490 Highway 42 . Kewaunee, Wisconsin 54216-9511Telephone: 920.388.2560

r . I . .
~~~.,AN,.;:-N..RN...,L
.'-': '.MONIT.ORING REPORT :
I
r .
i,,.
i - -. - . . .'. . :: ..... . ^ . - .. - ..
, . . . .. . .
. . ; . -
. . . .. . . .
* . . .. ..
NUCLEAR:MANAGEMENT COMPANY, LLC.. . . . . . ;
Committed to Nuclear Excellenc
. A __ _ .. . . .

i
i
. - I
ANNUAL REPORT PART IPROGRAMMATIC REVIEW OF--
SAMPLING RESULTS
.I
SA.R,1,)ukv ../.LX AS,,_. _ . . , . . . ._ _ ._ . .7_ _ . _ ................................. t .__ .. ... .. .o .
' - .- - , - :, .; > . , :
* ' ' ' ' ' '' .' '-,, " '',-' V - . . :. -: , . , . - - -: . ;', . ,.'
: Shoto Dam in Winter.:
-- . ........ . . . . ..
: : ,- .- -. ,-. - . . ... ... .. . ..... ....... ;
- ; - * - ;
- . ,; . , . . BE. -. - . .. .. : . . .. :
... .. . . . . ..
. - . .... .... ...... ..... - . ....... ........ .. . - . ... . .. . . . . . . .
: .... ... - . .. : - -; ... - - .... ... . ... . * . . . ..
. . . . . . . . . ...
.. . . . . . . . . . . . .
, . _ _ . , _ . . .. , . .. . . _

- Environmental, Inc.Midwest Laboratoryan Afegheny Technl es CD.
700 Landwehr Road * 11Wrthbwek, IL 60062-2310plu (847) 5640700 * tax (847) 564-4517
REPORT TO
NUCLEAR MANAGEMENT CO, LLC
RADIOLOGICAL MONITORING PROGRAM FORTHE KEWAUNEE NUCLEAR POWER PLANT
KEWAUNEE, WISCONSIN
ANNUAL REPORT - PART ISUMMARY AND INTERPRETATION
January I to December 31, 2003
Prepared and submitted by:
ENVIRONMENTAL Inc.Midwest LaboratoryProject No. 8002
'it A4,Approved:Stanley F. Baker (IRadiation Protection Mgr., KNPP

Lll
PREFACE L
L
The staff of Environmental, Inc., Midwest Laboratory were responsible for the acquisition of datapresented in this report. Assistance in sample collection was provided by Kewaunee NuclearPower Plant personnel. The report was prepared by staff members of Environmental, Inc., LMidwest Laboratory.
L.
L
ii
"1
jj . 1

TABLE OF CONTENTS
Paae
Preface ... .; .
List of Figures ................................... ; iv
List of Tables.iv
1.0 INTRODUCTION .I
2.0 SUMMARY.2
3.0 RADIOLOGICAL SURVEILLANCE PROGRAM.3
3.1 Methodology ........ . . . .... 3
3.1.1 The Air Program .33.1.2 The Terrestrial Program .43.1.3 The Aquatic Program .53.1.4 Program Execution .63.1.5 Program Modifications .6
3.2. Results and Discussion ............... ;.,.;..7
3.2.1 Atmospheric Nuclear Detonations and Nuclear Accidents .73.2.2 The Air Environment ............................ 73.2.3 The Terrestrial Environment .83.2.4 The Aquatic Environment .1
3.3 2003 Land Use Census .. 13
4.0 FIGURES AND TABLES .14
5.0 REFERENCES ......... , 27
APPENDICES -
A Interlaboratory Comparison Program Results .................................. A-1
B Data Reporting Conventions ...................... B-1
C Maximum Permissible Concentrations of Radioactivity In Air and Water aboveNatural Background In Unrestricted Areas......................................................C-1
D Land Use Census, 2003 ................................... D-1
iii

LIST OF FIGURES
No. Caption Page
4-1 Sampling locations, Kewaunee Nuclear Power Plant .................................... 15
LIST OF TABLES
No.
4.1
4.2
4.3
4.4
4.5
4.6
Title Page
Sampling locations, Kewaunee Nuclear Power Plant ......................................... 16
Type and frequency of collection ......................................... 17
Sample codes used in Table 4.2 ......................................... 17
Sampling summary, January- December, 2003 ......................................... 18
Environmental Radiological Monitoring Program Summary ......................................... 19
Land Use Census ......................................... 25
In addition, the following tables are in the Appendices:
Appendix A
A-1
A-2
A-3
A-4
A-5
A-6
A-7
Amrzendix C
C-1
Interlaboratory Comparison Program Results ........................................................ Al-i
Thermoluminescent dosimeters (TLDs) .......................................................... A2-1
In-house Spiked Samples ........................................................ A3-1
In-house "Blank" Samples .A........................................................ 4-1
In-house "Duplicate" Samples .......................................................... A5-1
Department of Energy MAPEP comparison results ..................................................... A6-1
Environmental Measurements Laboratory Quality (EML) AssessmentProgram comparison results ........................................................ A7-1
Attachment A Acceptance criteria for spiked samples .................................................. A-2
Maximum Permissible Concentrations of Radioactivity in. Air and WaterAbove Natural Background in Unrestricted Areas ............................................. C-2 1
iv

1.0 INTRODUCTION
The Kewaunee Nuclear Power Plant is a 598 megawatt pressurized water reactor located onthe Wisconsin shore of Lake Michigan In Kewaunee County. The Plant became critical on March7, 1974. Initial power generation was achieved on April 8, 1974, and the Plant was declaredcommercial on June 16, 1974. This report summarizes the environmental operation datacollected during the period January - December 2003.
Nuclear Management Company, LLC, an operating company for the Kewaunee NuclearPower Plant, assumes the responsibility for the environmental program at the Plant and anyquestions relating to this subject should be directed to Mr. Stanley F. Baker, Radiation ProtectionManager, at (920) 388-8103.
I

I I
2.0 SUMMARY -
Results of sample analyses during the period January - December 2003 are summarized inTable 4.5. Radionuclide concentrations measured at indicator locations are compared with levelsmeasured at control locations and in preoperational studies. The comparisons Indicatebackground-level radioactivities in all samples collected.
2

- - --
3.0 RADIOLOGICAL SURVEILLANCE PROGRAM
Following Is a description of the Radiological Surveillance Program and its execution.
3.1 Methodolong
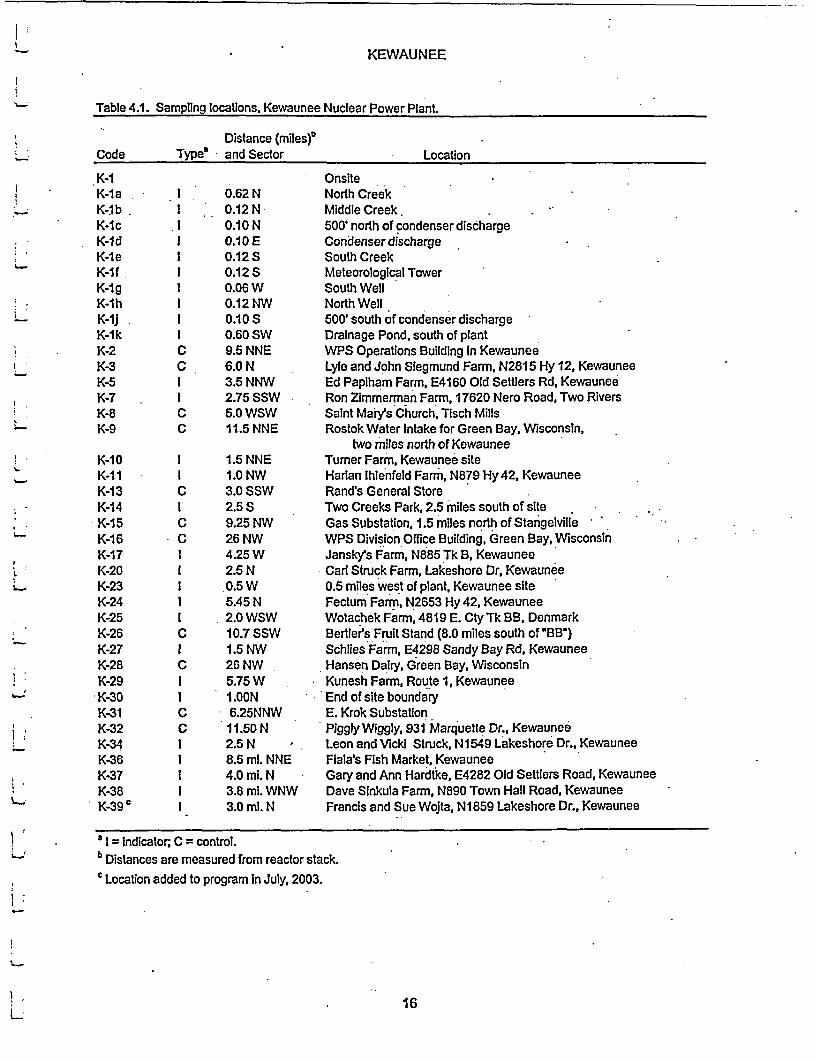
The sampling locations are shown in Figure 4-1. Table 4.1 describes the locations, lists for eachdirection and distance from the reactor, and Indicates which are indicators and which are controllocations.
-The sampling program monitors the air, terrestrial, and aquatic environments. The types ofsamples collected at each location and the frequency of collections are presented in Table 4.2, usingsample codes defined in Table 4.3. The collections and analyses that comprise the program aredescribed below. Finally, the execution of the program in the current reporting year is discussed.
3.1.1 The Air Program
Airborne Particulates
The airborne particulate samples are collected on 47 mm diameter glass fiber filters at a volumetricrate of approximately one cubic foot per minute. The filters are collected weekly from six locations(K-1f, K-2, K-7, K-8, K-16 and K-31), and dispatched by mail to Environmental, Inc. for radiometricanalysis. The material on the filter is counted for gross beta activity approximately 72 hours or laterafter collection to allow for decay of naturally-occurring short-lived radionuclides.
Quarterly composites from each sampling location are analyzed for gamma-emitting isotopes on ahigh-purity germanium (HPGe) detector.
Airborne Iodine
'Charcoal filters are located at locations K-1f, K-2, K-7, K-8, K-16 and K-31. The filters are changedbi-weekly and analyzed for iodine-131 Immediately after arrival at the laboratory.
Ambient Gamma Radiation - TLDs
The Integrated gamma-ray background Is measured at the six air sampling locations (K-If, K-2, K-7,K-8, K-16 and K-31), at four milk sampling locations (K-3, K-5, K-25 and K-39), and four additionalsites ( K-15, located 9.25 miles northwest of the plant; K-17, located 4.25 miles west of the plant; K-27, located 1.5 miles northwest of the plant and K-3D, located 1.0 miles north of the plant ) bythermoluminescent dosimetry (TLDs). Two TLD cards, each having four main readout areascontaining CaSO 4:Dy phosphor, are placed at each location (eight TLDs at each location). One card Isexchanged quarterly, the other card is exchanged annually and read only on an emergency basis.
Precipitation
Monthly composites of precipitation samples collected at K-11 are analyzed for tritium activity andcounted using a liquid scintillation method.
3

I I
3.1.2 The Terrestrial Program
Milk 1Milk is collected semimonthly from May through October, and monthly during the rest of the year
from five herds that graze within four miles of the reactor site (K-5, K-25, K-34, K-38 and K-39), fromone herd grazing between four and ten miles from the reactor site (K-3), and from a dairy in Green .Bay (K-28). The samples are analyzed for iodine-131, strontium-89 and -90, cesium-137, barium-lanthanum-140, potassium40, calcium and stable potassium.
Well Water
One gallon of water is collected quarterly from four off-site wells located atKK-10,K-IK-13 and K-25 and from two on-site wells located at K-lg and K-1h. *
Gamma spectroscopic analyses and gross beta on the total residue are performed for each watersample. The concentration of potassium40 is calculated from total potassium, determined by atomicabsorption, on all samples.
Additionally, samples of water from two on-site wells (K-1g and K-Ah) are analyzed for gross alpha.Water from the on-site well (K-1g) is also analyzed for tritium, strontium-89 and strontium-90.
Domestic Meat
Domestic meat samples are obtained annually (in the third quarter) at locations K-24, K-29, K-32and K-34 (if available). The flesh Is separated from the bones and analyzed for gross alpha, grossbeta and gamma emitting isotopes.. 1
Eggs are collected quarterly from locations K-24, K-27 (if available) and K-32. Samples areanalyzed for gross beta, strontium-89, strontium-90 and gamma-emitting isotopes. £Vegetables
Vegetable samples (6 varieties) are collected at locations K-17 and K-26, and two varieties of grain,if available, at location K-23. The samples are analyzed for gross beta, strontium-89 and -90, andgamma emitting isotopes. l
Grass and Cattle Feed
Grass is collected during the second, third and fourth quarters from two on-site locations (K-lb andK-1f) and from the dairy farm locations. Cattle feed is collected during the first quarter from the same lfarms. The samples are analyzed for gross beta, strontium-89 and -90, and gamma emitting isotopes.
Soil l
Soil samples are collected twice a year on-site at K-if and from the dairy farm locations (K-3, K-5,K-25, K-34, K-37 and K-38). The samples are analyzed for gross alpha, gross beta, strontiurri-89,strontium-90 and gamma emitting isotopes.
4 l

3.1.3 The Aquatic Program
Surface Water
One-gallon water samples are taken monthly from three locations on Lake Michigan: I) at the pointwhere the condenser water Is discharged Into Lake Michigan (K-1d); 2) Two Creeks Park (K-14)located 2.5 miles south of the reactor site; and 3) at the 'Main pumping station located approximatelyequidistant from Kewaunee and Green Bay, which pumps water from the Rostok water intake (K-9)located 11.5 miles north of the reactor site. Both raw and tap water are collected at K-9. One-gallonwater samples are taken monthly from three creeks that pass through the site (K-1a, K-1b, and K-1e).Samples from North and Middle Creeks (K-1a, K-1b) are collected near the mouth of each creek.Samples from the South Creek (K-1e) are collected about ten feet downstream from the point wherethe outflow from the two drain pipes meet. Additionally, the drainage pond (K-1k), locatedapproximately 0.6 miles southwest of the plant, Is included in the sampling program. Water samples atK-14 are collected and analyzed In duplicate.
The water Is analyzed for gamma emitting Isotopes, gross beta activity In total residue, dissolvedsolids and suspended solids, and.potassium-40. The concentration of potassium-40 is calculatedfrom total potassium, which is determined by flame photometry. In addition, quarterly composites ofthe monthly grab samples are analyzed for tritium, strontium-89 and strontium-90.
Fish
Fish samples are collected during the second, third and fourth quarters at location K-1d. The fleshIs separated from the bones, gamma scanned and analyzed for gross beta activity. Ashed bonesamples are analyzed for gross beta, strontium-89 and strontium-90 activities.
Slime
Slime samples are collected during the second and third quarters from three Lake Michiganlocations (K-1d, K-9 and K-14), from three creek locations (K-1a, K-1b and K-1e) and from thedrainage pond (K-1 k), if available. The samples are analyzed for gross beta activity. If the quantity Issufficient, they are also gamma scanned and analyzed for strontium-89 and strontium-90 activities.
Bottom Sediment
Bottom sediments are collected in May and November from five locations (K-1 c, K-Id, K-IJ, K-9 andK-14). The samples are analyzed for gross beta, strontium-89, strontium-90 and gamma emittingIsotopes. It Is known that the measured radioactivity per unit mass of sediment increases withdecreasing particle size, and the sampling procedure Is designed to assure collection of very fineparticles.
5

I I
3.1.4 Program Execution
Program execution is summarized in Table 4.4. The program was executed for the year 2003 asdescribed in the preceding sections, with the following exceptions:
Vegetables were not available at location K-17, Jansky's Farm. The garden wasdiscontinued. One sample of pumpkin was collected at K-29, Kunesh Farm. w
Surface water was not available for the months of January, February and March, 2003at location K-1 k. The pond was frozen.
3.1.5 Program Modifications l
A new indicator location, the Wojta Farm ( K-39, 3.0 miles N ) was added to the lsampling program in July, 2003.
The two TLD cards located at K-37 (Hardtke) were moved to location K-39 (Wojta farm)starting in the second quarter of 2003. I
I.. .. 1
1t
6
3.2 Results and Discussion
The results for the reporting period January to December 2003 are presented in summary form inTable 4.5. For each type of analysis, of each sampled medium, this table shows the annual mean andrange for all Indicator and control locations. The location with the highest annual mean and the resultsfor this location are also given.
The discussion 'of the results has been divided Into three broad categories: the air, terrestrial, andaquatic environments. Within each category, samples will be discussed In the order listed In Table 4A.Any discussion of previous environmental data for the Kewaunee Nuclear Power Plant refers to datacollected by Environmental Inc., Midwest Laboratory.
The tabulated results of all measurements made In 2003 are not Included In this section, althoughreferences to these results will be made in the discussion. A complete tabulation of results Is containedIn Part 1I of the 2003 annual report on the Radiological Monitoring Program for the Kewaunee NuclearPower Plant.
3.2.1 Atmospheric Nuclear Detonations and Nuclear Accidents
There were no atmospheric nuclear tests or accidents reported In 2003. The last reported test wasconducted by the People's Republic of China on October 16, 1980.
3.2.2 The Air Environment
Airborne Particulates
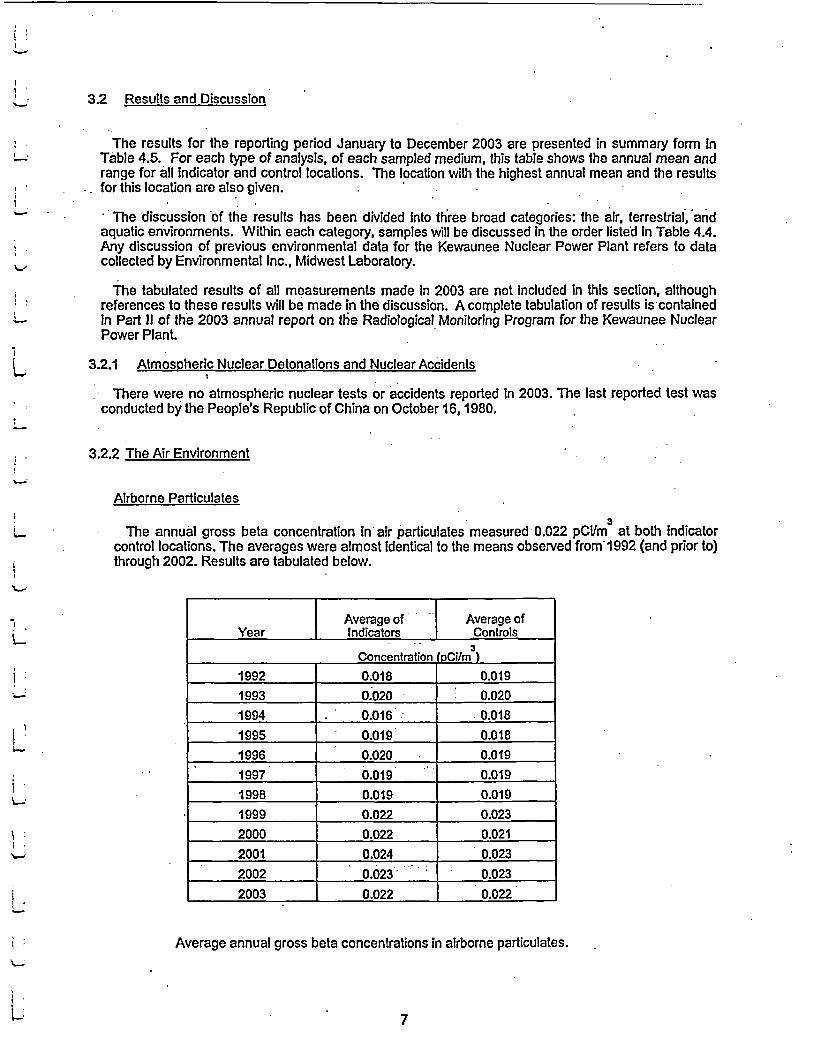
The annual gross beta concentration In air particulates measured 0.022 pCim 3 at both indicatorcontrol locations. The averages were almost Identical to the means observed from'1992 (and prior to)through 2002. Results are tabulated below.
| Average of ' Average ofYear i Indicators } Controls
3Concentration oCi/rn)
1992 0.018 0.019
1993 0.020 0.0201994 0.016 - 0.0181995 0.019 0.018
1996 0.020 0.0191997 0.019 0.0191998 0.019 0.0191999 0.022 0.0232000 0.022 0.0212001 0.024 0.0232002 0.023' 0.0232003 0.022 0.022
Average annual gross beta concentrations in airborne particulates.
7

I I
1Airborne Particulates (continued)
Gamma spectroscopic analysis of quarterly composites of air particulate filters yielded similarresults for indicator and control locations. Beryllium-7, which Is produced continuously in the upperatmosphere by cosmic radiation (Arnold and Ai-Salih, 1955), was detected In all samples. All othergamma-emitting isotopes were below their respective LLD limits.
Airborne Iodine
Bi-monthly levels of airborne iodine-131 were below the lower limit of detection (LLD) of 0.030pCim at all locations. There is no indication of an effect of the plant operation on the local airenvironment.
Ambient Gamma Radiation - TLDs
Ambient gamma radiation was monitored by TLDs at fourteen locations: seven indicator and sevencontrol.
Quarterly TLDs at indicator locations measured a mean dose equivalent of (14.1 mR191 days), inagreement with the mean at the control locations of (13.7 mRI91 days), and were similar to the meansobtained from 1992 (and prior to) through 2002. The results are tabulated below. No plant effect onambient gamma radiation was indicated These values are slightly lower than the United Statesaverage value of 19.5 mR191 days due to natural background radiation (National Council on RadiationProtection and Measurements, 1975). The highest annual mean was 17.0 mR/91 days, measured atthe indicator location K-7.
IL
I1.
IIIiYear |Average (Indicators) Average (Controls)
Dose rate mR191 days)
1992 15.0 13.81993 15.0 13.81994 14.8 13.81995 16.7 15.61996 15.9 14.91997 16.0 15.11998 16.1 15.51999 17.4 16.92000 18.7 18.22001 18.6 18.32002 16.1 15.12003 14.1 13.7
Ambient gamma radiation as measured by thermoluminescent dosimetry.Average quarterly dose rates.
Precipitation
Precipitation was monitored at one indicator location, K-1 1. The tritium concentration was below theLLD level of 330 pCi/L in all samples.
1'I.1III1ii8

32.3 The Terrestrial Environment
Milk
Of the 118 analyses for lodine-131 in milk, all were below the LLD level of 0.5 pCIL.
Strontium-89 concentrations measured below an LLD level of 1.3 pCLiL'In all samples. Low levels ofstrontium-90 were found In seventy-four of the seventy-eight samples tested. Mean values wereIdentical for indicator and control locations (1.3 pCIL) and are similar to or less than averages seenfrom 1989 through 2002.
Barium-lanthanum-140 concentrations were below the LLD of 15 pCiIL and Cesium-137concentrations were below the LLD of 10 pCVL In all samples. Potassium-40 results are similar at boththe Indicator and control locations (I351and 1398 pCVL, respectively), and are essentially Identical tothe levels observed from 1989 through 2002. There -was no Indication of any effect due to theoperation of the KNPP.
Due to the chemical similarities between strontium and calcium, and cesium and potassium,organisms tend to deposit cesium-137 In the soft tissue and muscle and strontium-89 and strontium-90 In the bone. Consequently, ratios of strontium-90 activity to the weight of calcium in milk andcesium-137 activity to the weight of potassium In milk were monitored in order to detect potentialenvironmental accumulation of 'these radionuclides. The measured concentrations of stablepotassium and calcium are in agreement with previously determined values'of 1.50 i 021 gIL and1.16 ± 0.08 gIL, respectively (National Center for Radiological Health, 1968).
Well Water
Gross alpha and gross beta concentrations, measured at the two on-site wells (K-lg and K-1h),averaged 2.8 pCVL and 4.2 pCUL respectively. A beta activity of 3.8 pCVIL was measured In one of foursamples from location K-I0, above the LLD'value of 2.1 pCiL. All other measurements for gross betaconcentration, both indicators and control, were below the LLD, similar to values observed from 1989through 2002.
Levels of tritium and strontium-89, strontium-90 were measured for the on-site well (K-1g). Tritiummeasured below the LLD of 330 pCVL In all samples. Strontium-89 and strontium-90 concentrationsmeasured below the LLD value of 1.1 and 0.6 pCUL, respectively.
All gamma-emitting isotopes measured below their respective LLDs in all samples.
Potassium-40 averages are generally in proportion to gross beta measurements and were inagreement with previously measured values. No plant effect was Indicated.
Domestic Meat
In domestic meat samples, gross alpha concentration measured below the lower limit of detection-for both indicator and control, locations. Gross beta concentration averaged 3.14 pClg wet forIndicator locations and 5.04 pCi/g wet for',the control location. The differences are not significant.Gamma-spectroscopic analyses showed that almost all of the beta activity was due to naturallyoccurring potassium-40. All other gamma-emitting Isotopes were below their respective LLD limits.
9
I I
In egg samples, gross beta concentrations averaged 1.22 pClg wet for the indicator location and1.35 pCi/g wet for the control, almost Identical to concentrations of naturally-occurring potassium-40observed in the samples ( 1.26 and 1.33 pCVg wet respectively). Other gamma-emitting isotopes were Lbelow their respective LLDs. Levels of strontium-89 measured below the LLD of 0.015 pCig wet in allsamples, strontium-90 measured below the LLD level of 0.007 pCig wet. ILVegetables and Grain
In vegetables, gross beta concentrations measured 2.04 pCi/g wet at the control location K-26, dueprimarily to potassium-40 activity. All other gamma emitting isotopes measured below respectiveLLDs. Strontium-89 measured below the LLD level of 0.009 pClg wet. Strontium-89 measured belowthe LLD level of 0.002 pCig wet.
In two grain samples (clover and oats) from location K-23, gross beta concentrations averaged L4.49 pCig wet, due primarily to potassium-40 and beryllium-7 activity (4.41 and 1.27 pClg wet,respectively). Strontium-89 measured below the LLD levels of 0.027 pClg wet, strontium-90measured 0.008 pClg wet in one of the two samples tested. LGrass and Cattle Feed
In grass, mean gross beta concentrations measured 6.76 and 9.30 pClg wet at indicator andcontrol locations, respectively, and in all cases was predominantly due to naturally occurringpotassium-40 and beryllium-7. All other gamma-emitting isotopes were below their respective LLDs.Strontium-89 measured below the LLD levels of 0.029 pClg wet for all samples tested, strontium-90averaged 0.022 pClg wet in six of twenty samples tested from indicator locations and 0.084 pCig wetfrom the control location, K-3.
In cattlefeed, the mean gross beta concentration was lower at the control locations (6.86 pClg wet)'than at indicator locations (13.52 pCVg wet). The highest average gross beta levels were in samplesfrom the indicator location K-38 (17.89 pClg wet), and reflected the high combined beryllium-7 andpotassium-40 levels observed in the samples. This pattern is similar to that observed since 1978. IStrontium-89 levels were below the LLD level of 0.055 pCig wet in all samples. Low levels ofstrontium-90 activity were detected in three of ten samples and averaged 0.025 pCi/g wet, similar orlower than levels observed in 1995 through 2002. The presence of radiostrontium in the environment Ican still be attributed to fallout from the nuclear testing in previous decades.
With the exceptions of naturally-occurring beryllium and potassium, gamma-emitting isotopes werebelow their respective LLD levels. L
Soil 1Gross alpha concentrations In soil samples measured 11.18 pClg dry at the indicator locations
averaged and 7.90 pCig dry at the control locations. Mean gross beta levels measured at theindicator and control locations averaged 32.06 and 27.65 pCig dry, respectively, primarily due to thepotassium-40 activity. Strontium-89 was below the LLD level of 0.11 pCig dry in all samples. Lowlevels of strontium-90 activity were detected in three of the thirteen samples tested and averaged0.067 pCig dry. ILow levels of Cesium-137 were detected in ten of thirteen soil samples, identical at the indicator andcontrol locations ( 0.13 pCig dry). Potassium-40 was detected in all samples and averaged 19.68 and18.61 pCl~g dry at indicator and control locations, respectively. All other gamma-emitting Isotopeswere below their respective LLD's. These levels of detected activities are similar to those observedfrom 1989 through 2002.
10l

-3.2.4 The Aquatic Environment
Surface Water
* In all surface water tested, gross beta activity In suspended solids measured below the LLD'level of1.8 pCiIL. Mean gross beta concentration In dissolved solids was higher at the indicator locations ( 7.3pCiL) as compared to the control locations (2.4 pCIL). The pattern is similar to activity distributionobserved from 1978 through 2002.
Year lAverae (indicators) I Average (Controls)
Dose rate l mRI91 davs)1992 4.5 2.21993 5.0 2.31994 5.0 2.31995 4.3 2.21996 4.3 2.21997 6.3 2.41998 5.9 2.11999 5.6 2.22000 7.0 2.42001 5.9 2.22002 . 5.7 2.22003 7.3 2.4
Average annual gross beta concentrations In surface water (DS).
The difference In levels are due in part to the Indicator location (K-1 k), a pond formed by drainageof surrounding fields to the southwest. The control sample is Lake Michigan water, which varies verylittle in gross beta concentration during the year, while indicator samples Include two creek locations(K-1a and K-1e) which are much higher In gross beta concentration and exhibit large month-to-monthvariations. The K-1a creek draws its water from the'surrounding fields which are heavily fertilized; andthe K-1e creek draws its water mainly from the Sewage Treatment Plant. In general,- gross betaconcentrations were high when potassium-40 levels were high and low when potassium-40 levelswere low, indicating that the fluctuations In beta concentration were due to variations In potassium-40concentrations and not to plant operations. The fact that similar fluctuations at these locations wereobserved In the pre-operational studies conducted prior to 1974 supports this assessment.
No tritium was detected above an LLD of 330 pCVL In any sample.
Strontium 89 concentrations were below the LLD of 1.9 pCVL. Strontium-90 measured 1.0 pCVL inthree of twenty-six Indicator samples and 1.3 pCVL in one of four control samples. All other samplesmeasured below an LLD value of 0.9 pCVL.
Gamma-emitting isotopes were below their respective LLDs in all samples.
11
I I
Fish l
In fish, gross beta concentrations averaged 2.50 pCVg wet in muscles and 1.99 pCVg wet in bonefractions. In muscle, the gross beta concentration was primarily due to potassium-40 activity.
Cesium-137 concentration in muscle was detected in two of seven samples tested at a level of0.048 pClg wet, lower than levels observed between 1979 and 1991 (average of 0.12 pCVg wet), andsimilar to levels seen In 1992 (0.066 pCVg wet), in 1993 (0.068 pCVg wet), in 1994 (0.067 pCVg wet), Lin 1995 (0.056 pCVg wet), in 1996 (0.055 pCVg wet), in 1997 (0.053 pCilg wet), 1998 (0.075 pC/gwet), In 1999 (0.062 pClg wet), in 2000 (0.063 pCVg wet) and 0.040 pCig wet in 2001 and 2002.
The strontium-89 concentration was below the LLD of 0.28 pCVg wet in all samples. Strontium-90 lwas detected above the LLD value of 0.05 pCVg wet and averaged 0.12 pCVg wet.
Perighvton (Slime) or Aquatic Vegetation
In periphyton (slime) and aquatic vegetation samples, mean gross beta concentrations were slightlyhigher at the control location than at the indicators (6.83 and 4.09 pCVg wet, respectively). I
The strontium-89 concentration was below the LLD of 0.33 pCig wet in all samples. Strontium-90was detected above the LLD value of 0.095 pCVg wet in one of the twelve indicator samples,measuring 0.10 pCVg wet.
Traces of Co-58 and Co-60 were detected in one of two periphyton samples collected from locationK-14 at concentrations of 0.063 and 0.035 pCig wet, respectively. l
Cs-137 activity was also detected, above the LLD value of 0.032 pCVg wet, in one of the fourteenindicator and control samples collected, averaging 0.035 pCVg wet, similar or lower than Imeasurements taken from 1989 through 2002. Other gamma-emitting isotopes, with the exception ofnaturally-occurring beryllium-7 and potassium-40, were below their respective LLDs.
Bottom Sediments
In bottom sediment samples, the mean gross beta concentrations measured 9.21 pCig dry at theindicator locations and 27.36 pClg dry at the control, attributable primarily to levels of potassium-40.
Cs-134 was below the LLD level of 0.038 pCVg dry in all samples. Low levels of cesium-137 weredetected in one of eight samples from indicator locations and one of two controls, with concentrationsof 0.046 and 0.092 pCVg dry, respectively. On average, cesium-137 measurements are lower than orsimilar to levels observed from 1979 through 2002.
Levels of strontium-89 measured below the detection limit of 0.074 pCVg dry in all samples.Strontium-90 could not be detected above the LLD level of 0.017 pCVg dry.
I
.1
12 1

3.3 Land Use Census
The Land Use Census satisfies the requirements of the KNPP Radiological Environmental MonitoringManual. Section 2.2.2 states:
WA land use census shall be conducted and shall identify within a distance of 8 km (5mi.) the location, In each of the 10 meteorological sectors, of the nearest mrilk animal,the nearest residence and the nearest garden of greater than 50m (500 ft)producing broad leaf vegetation."
The 2002 Land Use Census was an annual census conducted in the years between the complete fiveyear census. This census Is used to verify that no changes have occurred with the locations of thenearest residence, milk animal or garden. "Drive-bys" were conducted to verify that no changes haveoccurred over the previous census.
The Land Use Census was completed on September 2, 2003. This census Is conducted annuallyduring the growing season per Health Physics Procedure HP 1.14.
Table 4.6.1 lists the results of the 2003 census. There were no significant changes identified from the2002 census.
Table 4.6.2 describes the changes from 2002 to 2003.
13
III
LiI
i
II
4.0 FIGURES AND TABLES I
I
IIIIII
14
KEWAUNEE
Table 4.1. Sampling locations, Kewaunee Nuclear Power Plant.
Distance (miles)>Code Type" and Sector Location
K-1K-1aK-lbK-1cK-1dK-IeK-1fK-IgK-1hK-lJK-1kK-2K-3K-5K-7K-8K-9
K-10K-11K-13K-14K-15K-16K-17K-20K-23K-24K-25K-26K-27K-28K-29K-30K-31K-32K-34K-36K-37K-38K-39'
0.62 N0.12 N0.10 N
1 0.10E0.12S0.12 S0.06 W0.12 NW
1 0.10S0.60 SW
C 9.5 NNEC 6.0N1 3.5 NNW1 2.75 SSWC 5.0 WSWC 11.5 NNE
1 1.5 NNEI 1.0 NWC 3.0 SSW1 2.5SC 9.25 NWC 26 NW1 4.25 W1 2.5NI 0.5W1 5.45 NI 2.0 WSWC 10.7SSWI 1.5 NWC 26NWI 5.75 WI ~1.00NC 6.25NNWC 11.50 N
2.5N8.5 ml. NNE4.0 mi. N3.8 ml. WNW3.0 mi. N
OnsiteNorth CreekMiddle Creek.500' north of condenser dischargeCondenser dischargeSouth CreekMeteorological TowerSouth WellNorth Well500' south of condenser dischargeDrainage Pond, south of plantWPS Operations Building In KewauneeLyle and John Siegmund Farm, N2815 Hy 12, KewauneeEd Paplham Farm, E4160 Old Settlers Rd. KewauneeRon Zimmerman Farm, 17620 Nero Road, Two RiversSaint Mary's Church, Tisch MillsRostok Water Intake for Green Bay, Wisconsin,
two miles north of KewauneeTurner Farm, Kewaunee siteHarlan Ihlenfeld Farm, N879 Hy 42, KewauneeRand's General StoreTwo Creeks Park, 2.5 miles south of siteGas Substation, 1.5 miles north of StangelvilleWPS DivisIon Office Building, Green Bay, WisconsinJansky's Farm, N885 Tk B, KewauneeCarl Struck Farm, Lakeshore Dr. Kewaunee0.5 miles west of plant, Kewaunee siteFectum Farm, N2653 Hy 42, KewauneeWotachek Farm, 4819 E. Cty Tk BB, DenmarkBertlers Fruit Stand (8.0 miles south of "BBS)Schlies Farm, E4298 Sandy Bay Rd. KewauneeHansen DaIry, Green Bay, WisconsinKunesh Farm, Route 1, KewauneeEnd of site boundaryE. Krok SubstationPiggly Wiggly, 931 Marquette Dr., KewauneeLeon and Vicki Struck, N1549 Lakeshore Dr., KewauneeFlala's Fish Market, KewauneeGary and Ann Hardtke, E4282 Old Settlers Road, KewauneeDave Sinkula Farm, N890 Town Hall Road, KewauneeFrancis and Sue Wojta, N1859 Lakeshore Dr., Kewaunee
a I = Indicator; C = control.b Distances are measured from reactor stack.
c Location added to program In July, 2003.
16

I I
IKEWAUNEE
Table 4.2. Type and frequency of collection.
Location Weekly Biweekly Monthly Quarterly Semiannually Annually
K-1a SW SLK-1 b SW GR* SL _
K-1c _BS_
K-1d SW Fl BS". SLK-ie _ SW SLK-if AP Al GRaTLD SO -K-ig WWK-1 h WW_ _
K-Ij BS" ___K-1 k SW SLK-2 AP Al TLDK-3 MiP GRT, TLD. CFO SOK-5 MI G R', TLD. CF0 SOK-7 AP Al TLDK-8 AP Al TLD b
K-9 SW BS, sSLK-10 WWK-1 1 PR WWN-K-13 WWK-14 SW sw SLK-15 TLDK-16 AP Al TLDK-17 TLD VEK-20K-23 . GRNK-24 EG DM
K-25 _MI GRO, TLD, CF,. WW SO VE
K-26 V__ _ _ __ _ _ _ _ _ _ _ _ _ _ _ E
K-27 TLD, EGK-28 MIcK-29 DM. VEK-30 _ TLDK-31 AP Al TLDK-32 EG _DM
K-34 Mc_. GRa CF0 SO DM
K -36 __ _ _ _ _ _.Fl _ _ _ _ _ _ _ _ _ _ _ _
K-37 Ml' GR, TLD, CF0 SOK-38 MiP GR,_ CF4 SOK-39 Mir GR-, CF- SO
'Three times a year, second, third and fourth quarters. bTo be collected in May and November.'Monthly from November through April; semimonthly May through October.
d First quarter (January, February, March) only.
Table 4.3. Sample Codes:
AP Alrbomre particulates Ml MilkAl Airborne Iodine PR PrecipitationBS Bottom (river) sediments SL SlimeCF Cattlefeed so SoilDM Domestic Meat SW Surface waterEG Eggs TLD Thermoluminescent DosimeterFl Fish VE Vegetables
GRN Grain WW Well waterGR Grass
1iIIIII
-1
I
I
I
IIII
II
17I

Table 4.4. Sampling Summary, January - December 2003.
Collection Number of Number ofSample Type and Number of Samples Samples
Type Frequency? Locations Collected Missed
Air Environment
Airborne particulates C1W 6 312 0Airbome Iodine CIBW 6 156 0TLD's CIQ 14 55 1Precipitation C/M 1 12 0
Terrestrial Environment
Milk (May-Oct) GISM 7 80 0(Nov-Apr) GIM 7 38 0
Well water . GIQ 6 24 . 0Domestic meat G/A 3 3 0Eggs GIQ 2 8 0Vegetables - 5 varieties G/A 2 8 0Grain -wheat G/A 1 1 0
- clover G/A 1 . 1 0Grass G/TA 8 23 0Cattle feed GIA 5 10 0Soil G/SA 7 13 0
Aquatic Environment
Surface water G/M 7 105 3Fish GITA 1 .3 0Slime G/SA 7 14 0Bottom sediments GISA 5 10 0
Type of collection Is coded as follows: C =continuous; G =grab.Frequency Is coded as follows: W weekly, BW bi-weekly, SM = semimonthly M =monthly;
Q = quarterly- SA = semiannually; TA = three times per year, A = annually.
18

I L
lTable 4.5 Environmental Radiation Monitoring Program Summary.
Name of FacilityLocation of Facility
Kewaunee Nuclear Power PlantKewaunee County. Wisconsin
(County. State)
Docket No. 50-305Reporting Period January-December, 2003
1Indicator Location with Highest Control Number
Sample Type and Locations Annual Mean Locations Non-Type Number of LLDb Mean (F)' Mean (F)' Mean (F)' Routine(Units) Analyses" Range' Locationd Range' Range' Results'
TLDs(Quarterly) Gamma 55 3.0 14.1 (31/31) K-7, Zimmerman Farm r 17.0 (414) 13.7 (24124) 0(mR191days) (10.3-17.8) 2.75 ml. SSW (16.1-17.8) (10.8-24.4)
Airbome GB 312 0.002 0.022 (1041104) K-8, St. Mary's Church 0.023 (52152) 0.022 (2081208) 0Particulates (0.011-0.041) 5.0 ml. WSW (0.011-0.043) (0.010-0.047)(pCVM 3) GS 24
Be-7 0.020 0.060 (818) K-31, E. Krok Sub- 0.063 (414) 0.061 (16116) 0(0.039-0.071) station, 6.25 ml. NNW (0.040-0.080) (0.040-0.080)
Nb-95 0.0014 < LLD . < LLD 0Zr-Nb-95 0.0019 < LLD . < LLD 0Ru-103 0.0010 < LLD < LLD 0Ru-106 0.0076 < LLD < LLD 0Cs-134 0.0007 < LLD < LLD 0Cs-137 0.0009 < LLD < LLD 0Ce-141 0.0020 < LLD < LLD 0Ce-144 0.0054 < LLD < LLD 0
Airbome Iodine(pCUi 3) 1-131 156 0.03 < LLD < LLD 0
Precipitation(PCi/L) H-3 12 330 < LLD None 0
Milk 1-131 118 0.5 < LLD < LLD 0(pCilL) Sr-89 78 1.3 < LLD < LLD 0
Sr-90 78 0.7 1.3 (50/54) K-5 1.5 (11112) 1.3 (24/24) 0(0.7-3.1) K-5. Paplham Farm (0.8-3.1) (0.7-2.4)
GS 118
K-40 50 1351 (82/82) K-34, Struck Farm 1418 (18118) 1398 (36136) 0(1020-1544) 2.5 mi. N (1020-1544) (1170-1560)
Cs-134 10 < LLD < LLD 0Cs-137 10 < LLD < LLD 0Ba-La-140 15 < LLD - < LLD 0
(g1/) K-stable 78 1.0 1.60 (54154) K-34, Struck Farm 1.65 (12112) 1.60 (24n24) 0(1.33-1.78) 2.5 mi. N (1.45-1.78) (1.41-1.80)
(g/L) Ca 78 0.4 0.86 (54/54) K-25. Wotachek Farm 0.90 (12/12) 0.88 (24/24) 0(0.73-1.11) 2.0 mi. WSW (0.79-1.11) (0.78-1.10)
i
I.I
iI1
IIIII
II
19I
Table 4.5 Environmental Radiation Monitoring Program Summary.
Name of FacilityLocation of Faclity
Kewaunee Nuclear Power PlantKewaunee County, Wisconsin -
(County, State)
Docket No.Reporting Period
50-305January-December, 2003
Indicator' Location with Highest Control NumberSample Type and Locations Annual Mean Locations Non-Type Number of LLDb Mean (F)' Mean (F)' Mean (F)' Routine(Units) Analyses' Range' Locationrd Range' Rangec Results'
Well Water GA 8 1.9 2.8 (418) K-19, South Well 3.1 (214) None -0(pCUL) (2.4-3.8) 0.06 mL W (2.4-3.8)
GB 24 2.1 4.1 (7/20) K-1h. North Well 4.5 (314) <LLD 0(3.6-4.6) 0.12 ml. NW (4.3-4.6)
H-3 4 330 < LLD . . None 0K'40 24 0.87 1.80 (15120) K- g. South Well 2.53 (414) 0.97 (414) 0
(0.87-3.20) 0.06 ml. W (2.08-3.20) (0.87-1.04)Sr-89 4 1.1 < LLD . . None 0Sr-90 4 0.6 < LLD . LLD 0GS 24Mn-54 15 < LLD . < LD 0Fe-59 30 < LD . < LLD 0Co-58 15 < LD - < LLD 0Co-S0 15 < LLD . < LLD 0Zn-65 30 < LLD - < LLD 0Zr-Nb-95 15 < LLD . < LLD 0Cs-134 15 < LLD < LLD 0Cs-137 18 < LLD . < LD 0Ba-La-140 15 < LD . < LD 0
Domestic Meat GA 3 0.14 < LID . < LD 0(pClgwet) GB 3 0.030 3.14 (2/2) K-32. Grocery 5.04 (111) 5.04 (111) 0
(2.90-3.38) 11.5 mi. N -GS 3Be-7 0.24 < LLD - < LLD 0K-40 0.50 2.77 (212) K-29, Kunesh Farm 3.08 (111) 2.57 (1/1) 0
(2A6-3.08) 5.75 mi. WNb-95 0.030 < LLD - < LLD 0Zr-95 0.05 < LLD . < LD 0Ru-103 0.026 < LLD . < LD 0Ru-106 0.13 < LLD < LLD 0Cs-134 0.012 < LLD . < LD 0Cs-137 0.018 < LD < LLD 0Ce-141 0.055 < LD . . < LD 0Ce-144 0.11 < LD L<LD 0
Eggs GB 8 0.010 1.22 (414) K-32. Grocery 1.35 (414) 1.35 (4/4) 0(pCLgweQ (0.69-1.48) 11.5 mi. N (1.31-1.45) (1.31-1.45)
Sr-89 8 0.015 <LLD . < LD 0Sr-90 8 0.007 0.010 (1)4) K-24. Fectum Farm 0.010 (1)4) 0.008 (1/4) 0
5.45 ml. NGS 8Be-7 0.11 < LID < LD 0K-40 0.50 1.26 (414) K-32, Grocery 1.33 (414) 1.33 (414) 0
(1.15-1.41) 11.5 ml. N (1.08-1.58) (1.08-1.58)Nb-95 0.013 < LLD < LD 0Zr-95 0.017 . < LLD. . < LD 0Ru-103 0.012 < LLD < LD 0Ru-106 0.12 < LLD . < LLD 0Cs-134 0.011 < LLD . LLD 0Cs-137 0.010 < LLD < LLD 0Ce-141 0.023 < LLD < LLD 0Ce-1M 0.058 < LD < LLD 0
20

I I
t.tTable 4.5 Environmental Radiation Monitoring Program Summary.
Name of FacilityLocation of Facility
Kewaunee Nuclear Power PlantKewaunee County, Wisconsin
(County. State)
Docket No. 50-305Reporting Period January-December, 2003 I
Indicator Location with Highest Control Number
Sample Type and Locations Annual Mean Locations Non-
Type Number of LLDb Mean (F)' Mean (F)' Mean (F)' Routine
(Units) Analysesa Range' Locationd Range' Range' Results'
Vegetables GB 8 0.010 2.50 (1/1) K-29, Kunesh Farm 2.50 (1/1) 2.04 (717) 0
(pCigywet) 5.75 mi. W (1.04-2.82)
Sr-89 8 0.009 < LLD < LLD 0Sr-90 8 0.002 < LLD < LLD 0
0GS 8Be-7 0.12 < LLD . < LLD 0
K-40 0.50 2.34 (11l) K-29. Kunesh Farm 2.34 (1/1) 1.82 (7n7) 05.75 ml. W (0.72-2.43)
Nb-95 0.011 < LLD . < LLD 0
Zr-95 0.025 < LLD . < LLD 0Ru-103 0.015 < LLD < LLD 0Ru-106 0.11 < LLD < LLD 0
Cs-134 0.012 < LLD < LLD 0Cs-137 0.015 < LLD < LLD 0Ce-141 0.024 < LLD < LLD 0Ce-144 0.084 < LLD < LLD 0
Grain - GB 2 0.010 4.49 (2/2) K-23. Kewaunee 4.49 (22) None 0Oats & Clover (4.19-4.78) Site, 0.5 mi. W (4.19-4.78)
(pClgwet) Sr-89 2 0.027 < LLD . - None 0Sr-90 2 0.008 0.008 (1/2) K-23. Kewaunee 0.008 (112) None 0
Site. 0.5 ml. WGS 2Be-7 0.50 1.27 (2/2) K-23, Kewaunee 1.27 (2/2) None 0
(0.80-1.74) Site, 0.5 ml. W (0.80-1.74)
K-40 0.50 4.41 (2/2) K-23, Kewaunee 4.41 (2/2) None - 0(4.31-4.50) Site, 0.5 ml. W (4.31-4.50)
Nb-95 0.038 < LLD - . None 0
Zr-95 0.080 < LLD . . None 0Ru-103 0.027 < LLD None 0
Ru-106 0.18 < LLD . . None 0Cs-134 0.023 < LLD . . None 0Cs-137 0.022 < LLD . . None 0
Ce-141 0.053 < LLD . . None 0
Ce-144 0.13 < LLD None 0
Cattlefeed GB 10 0.10 13.52 (8/8) K-38, Sinkula Farm 17.89 (2/2) 6.86 (2/2) 0(pCigwet) (2.78-26.38) 3.8 ml. WNW (9.40-26.38) (3.27-10.44)
Sr-89 10 0.055 < LLD . < LLD 0Sr-90 10 0.024 0.025 (318) K-25. Wotachek Farm 0.026 (1/2) <LLD 0
(0.024-0.026) 2.0 ml. WSWGS 10Be-7 0.48 1.17 (2/8) K-34, Struck Farm 1.59 (1/2) < LLD 0
(0.75-1.59) 2.5 ml. NK-40 0.10 13.12 (818) K-38, Sinkula Farm 18.99 (2/2) 6.81 (212) 0
(2.47-27A7) 3.8 ml. WNW (10.51-27.47) (2.94-10.68)
i
III.II
.1
III
III
21 i

Table 4.5 Environmental Radiation Monitoring Program Summary.
Name of FacilityLocation of Facility
Kewaunee Nuclear Power Plant Docket No.Reporting Period
50-305Kewaunee County. Wisconsin January-December, 2003
(County. State)
Indicator Location with Highest Control NumberSample Type and Locations Annual Mean Locations Non-Type Number of LLDb Mean (F)' Mean (F)' Mean (F)' Routine(Units) Analyses' Range' Location d Range' Ranget Results'
Cattlefeed Nb-95 0.060 < LLD < LLD 0(continued) Zr-95 0.094 < LLD < LLD 0
Ru-103 0.046 < LLD < LLD 0Ru-106 0.37 <LLD < LLD 0Cs-134 0.049 <LLD - < LLD 0Cs-137 0.044 < LLD < LLD 0Ce-141 0.090 < LLD < LLD 0Ce-144 0.29 < LLD < LLD 0
Grass GB 23 0.10 6.76 (20/20) K-3, Siegmund Farm 9.30 (313) 9.30 (3/3) 0(pCVgwet) (4.28-9.34) 6.0 ml. N (7.64-11.23) (7.64-11.23)
Sr-89 23 0.029 < LLD - < LLD 0Sr-90 23 0.010 0.022 (6/20) K-3. Siegmund Farm 0.084 (1/3) 0.084 (113) 0
(0.011-0.030) 6.0 ml. NGS 23Be-7 0.30 2.36 (17/20) K-38, Sinkula Farm 3.67 (2/3) 1.31 (3/3) 0
(0.45-4.10) 3.8 ml. WNW (3.23-4.10) (0.94-1.88)K-40 0.50 6.42 (20/20) K-3, Siegmund Farm 9.32 (3/3) 9.32 (3/3) 0
(4.37-8.52) 6.0 mi. N (6.28-12.46) (6.28-12.46)Nb-95 0.050 < LLD c ULD 0Zr-95 0.083 c UD <LID 0Ru-103 0.044 < LLD < LLD 0Ru-106 0.46 < LLD < LLD 0Cs-134 0.040 < LLD < LLD 0Cs-137 0.038 < LLD < LLD 0Ce-141 0.11 < LLD < LLD 0Ce-144 0.31 < LLD < LLD 0
Sol GA 13 1.0 11.18 (11/11) K-5, Paplham Farm 14.09 (2i2) 7.90 (212) 0(pCVgdry) (6.40-15.77) 3.5 mi. NNW (12.40-15.77) (7.05-8.75)
GB 13 2.0 32.06 (11/11) K-34. Struck Farm 35.32 (212) 27.65 (212) 0(26.21-37.62) 2.5 mi. N (33.01-37.62) (26.62-28.68)
Sr-89 13 0.11 <LD - < LLD 0Sr-90 13 0.042 0.06i (3111) K-25. Wotachek Farm 0.079 (112) < LLD 0
(0.048-0.079) 2.0 ml. WSWGS 13Be-7 0.64 < LLD < LLD 0
K-40 1.4 19.68 (11/11) K-38, Sinkula Farm 21.99 (212) 18.61 (2/2) 0(16.57-23.25) 3.8 ml. WNW (20.73-23.25) (17.80-19.41)
Nb-95 0.12 < LLD < LID 0Zr-95 0.12 < LLD - < LD 0Ru-103 0.074 < LLD < LLD 0Ru-106 0.30 < LD < LLD 0Cs-134 0.049 < LLD . < LD 0Cs-137 0.036 0.13 (8/11) K-34. Struck Farm 0.16 (2/2) 0.13 (2/2) 0
(0.089-0.16) 2.5 mi. N (0.16-0.16) (0.12-0.13)Ce-141 0.15 < LD _ < LLD 0Ce-144 0.21 < LLD < LLD 0
22
I I
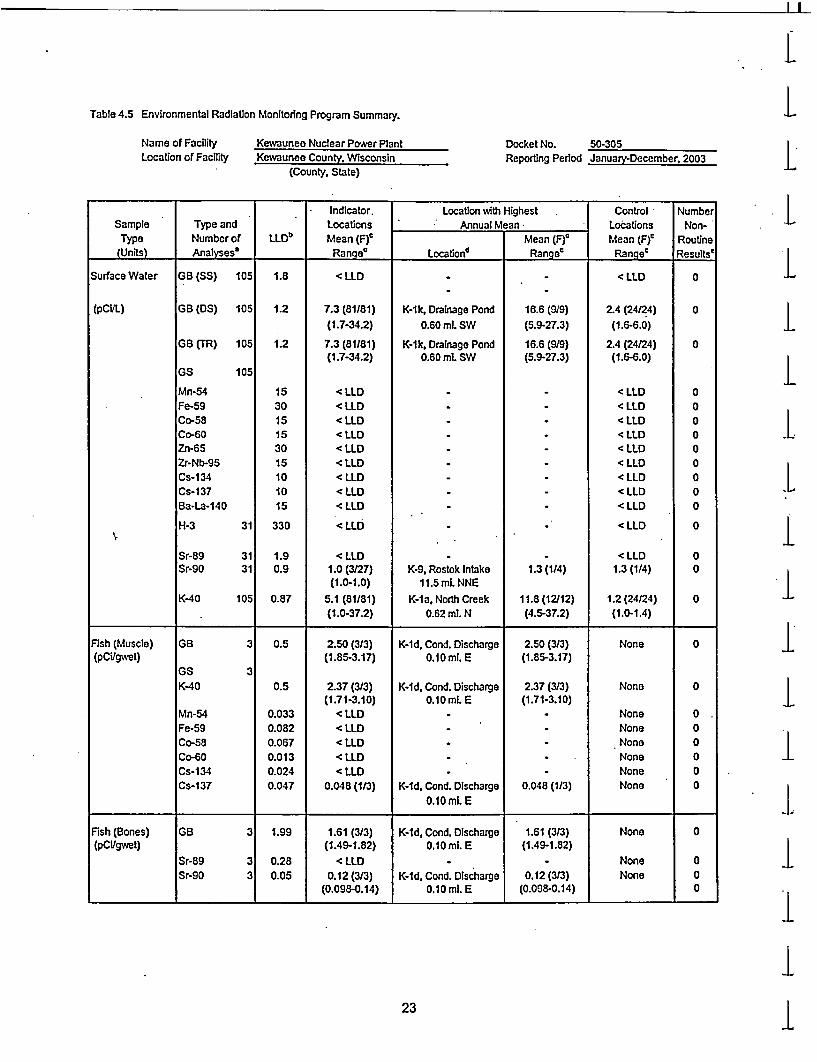
LLTable 4.5 Environmental Radiation Monitoring Program Summary.
Name of FacilityLocation of Facility
Kewaunee Nuclear Power PlantKewaunee County, Wisconsin
(County. State)
Docket No.Reporting Period
50-305January-December, 2003 L
Indicator. Location with Highest Control NumberSample Type and Locations Annual Mean Locations Non-
Type Number of LLDb Mean (F)' Mean (F)' Mean (F)' Routine(Units) Analysesa Range' Locationr Range' Range' Results'
Surface Water GB (SS) 105 1.8 < LLD . < LLD 0
(pCVL) GB (DS) 105 1.2 7.3 (81181) K-1k, Drainage Pond 16.6 (919) 2.4 (24/24) 0(1.7-34.2) 0.60 ml. SW (5.9-27.3) (1.6-6.0)
GB (TR) 105 1.2 7.3 (81/81) K-1k, Drainage Pond 16.6 (9/9) 2.4 (24/24) 0(1.7-34.2) 0.60 ml. SW (5.9-27.3) (1.6-6.0)
GS 105
Mn-54 15 < LLD < LLD 0Fe-59 30 < LLD < LLD 0Co-58 15 < LLD < LLD 0Co-60 15 < LLD < LLD 0Zn-65 30 < LLD . < LLD 0Zr-Nb-95 15 < LLD . < LD 0Cs-134 10 < LLD < LLD 0Cs-137 10 < LLD < LLD 0Ba-La-140 15 < LLD < LLD 0
H-3 31 330 < LLD - < LLD 0
Sr-89 31 1.9 < LLD < LLD 0Sr-90 31 0.9 1.0 (3/27) K-9. Rostok Intake 1.3 (1/4) 1.3 (114) 0
(1.0-1.0) 11.5 mi. NNEK-40 105 0.87 5.1 (81/81) K-1a, North Creek 11.8 (12/12) 1.2 (24/24) 0
(1.0-37.2) 0.62 ml. N (4.5-37.2) (1.0-1.4)
Fish (Muscle) GB 3 0.5 2.50 (3/3) K-1d, Cond. Discharge 2.50 (3/3) None 0(pCVgwet) (1.85-3.17) 0.10 mi. E (1.85-3.17)
GS 3K-40 0.5 2.37 (3/3) K-1d, Cond. Discharge 2.37 (3/3) None 0
(1.71-3.10) 0.10 mi. E (1.71-3.10)Mn-54 0.033 < LLD . . None 0Fe-59 0.082 < LLD . . None 0Co-58 0.067 < LLD . . None 0Co-60 0.013 < LLD . . None 0Cs-134 0.024 < LLD . . None 0Cs-137 0.047 0.048 (1/3) K-1d, Cond. Discharge 0.048 (1/3) None 0
0.10 ml. E
Fish (Bones) GB 3 1.99 1.61 (3/3) K-Id, Cond. Discharge 1.61 (3/3) None 0(pCVgwet) (1.49-1.82) 0.10 mi. E (1.49-1.82)
Sr-89 3 0.28 < LLD . None 0Sr-9o 3 0.05 0.12 (3/3) K-1d, Cond. Discharge 0.12 (3/3) None 0
(0.098-0.14) 0.10 ml. E (0.098-0.14) 0
LLILI.IIIIII
I1I
23 I

Environmental Radiation Monitoring Program Summary.
Name of FacilityLocation of Facility
Kewaunee Nuclear Power PlantKewaunee County, Wisconsin
(County, State)
Docket No.Reporting Period
50-305January-December, 2003
Indicator Locationwith Highest Control NumberSample Type and Locations Annual Mean Locations Non-
Type Number of LLDb Mean (Ff Mean (F) Mean (Ff Routine(Units) Analyses' Range' . Locationd R Ran' Range' Results'
Periphyton GB 14 0.1 4.09 (12112) K-9, Rostok Intake 6.83 (212) 6.83 (2/2) 0(Slime) (2.08-6.90) 11.5 ml. NNE (6.31-7.35) (6.31-7.35)
(pCVgwet) Sr-89 14 0.33 c LLD - < LLD 0Sr-90 14 0.095 0.10 (1112) K-1d. Discharge 0.10 (1/2) < LLD 0
0.l 0rmi. E
GS 14
Be-7 0.51 1.55 (9/12) K-1k, Drainage Pond 2.58 (212) < LLD 0(0.634.53) 0.60 ml. SW (0.63-4.53)
K-40 0.50 3.50 (11/12) K-9, Rostok Intake 4.86 (2/2) 4.86 (2/2) 0(1.23-6.17) 11.5 mL. NNE (3.70-6.01) (3.70-6.01)
Mn-54 0.045 < LLD <LID 0Co-58 0.049 0.063 (1/12) K-14. Two Creeks Park 0.063 (112) < LID 0Co-60 0.034 0.035 (1/12) K-14. Two Creeks Park 0.035 (1/2) < LLD 0
2.5 ml. SNb-95 0.083 < LLD - _ < LD 0Zr-95 0.082 < LD < LID 0Ru-103 0.071 < LD . < LD 0Ru-106 0.34 < LLD . < LD 0Cs-134 0.050 < LLD < LLD 0Cs-137 0.032 0.034 (1/12) K-14, Two Creeks Park 0.034 (1/2) < LLD 0
2.5 ml. SCe-141 0.12 . LLD - < LLD 0Ce-i44 0.24 c LD - < LLD 0
Bottom GB 10 1.0 9.21 (8/8) K-9. Rostok Intake 27.36 (2/2) 27.36 (2/2) 0Sediments (7.61-11.47) 11.5 ml. NNE (27.01-27.70) (27.01-27.70)
(pCVgdry) Sr-89 10 0.074 < LLD < LLD 0Sr-90 10 0.017 < LD < LLD 0
GS 10
K 40 0.5 7.71 (818) K-9, Rostok Intake 9.54 (2/2) 9.54 (2/2) 0(6.61-9.56) 11.5 ml. NNE (8.82-10.25) (8.82-10.25)
Co-58 0.040 < LLD <. <LD 0Co-60 0.022 < LLD < LID 0Cs-134 0.038 < LLD . < LLD 0
Cs-137 0.038 0.046 (1/8) K-9, Rostok Intake. 0.092 (1/2) 0.092 (1/2) 011.5 ml. NNE
'GA = gross alpha. GB = gross beta, GS = gamma spectroscopy. SS = suspended solids. DS = dissolved solids. TR = total residue.b LLD = nominal lower limit of detection based on a 4.66 sigma counting error for background sample.' Mean and range are based on detectable measurements only (i.e., >LLD) Fraction of detectable measurements at specified locations
Is Indicated In parentheses (F).d Locations are specified by station code (Table 4.1) and distance (miles) and direction relative to reactor site.'Non-routine results are those which exceed ten times the control station value. If no control station value Is available, the
result Is considered non-routine if it exceeds ten times the preoperational value for the location.NOne reading was suspect (25.2 ±f 1A mR/hr, K-30, 1.0 ml. N) and not included In the calculation for mean ± standard deviation.
The TLD was found removed from Its plastic holder, may have been collected and then replaced by outside personnel
24
I I
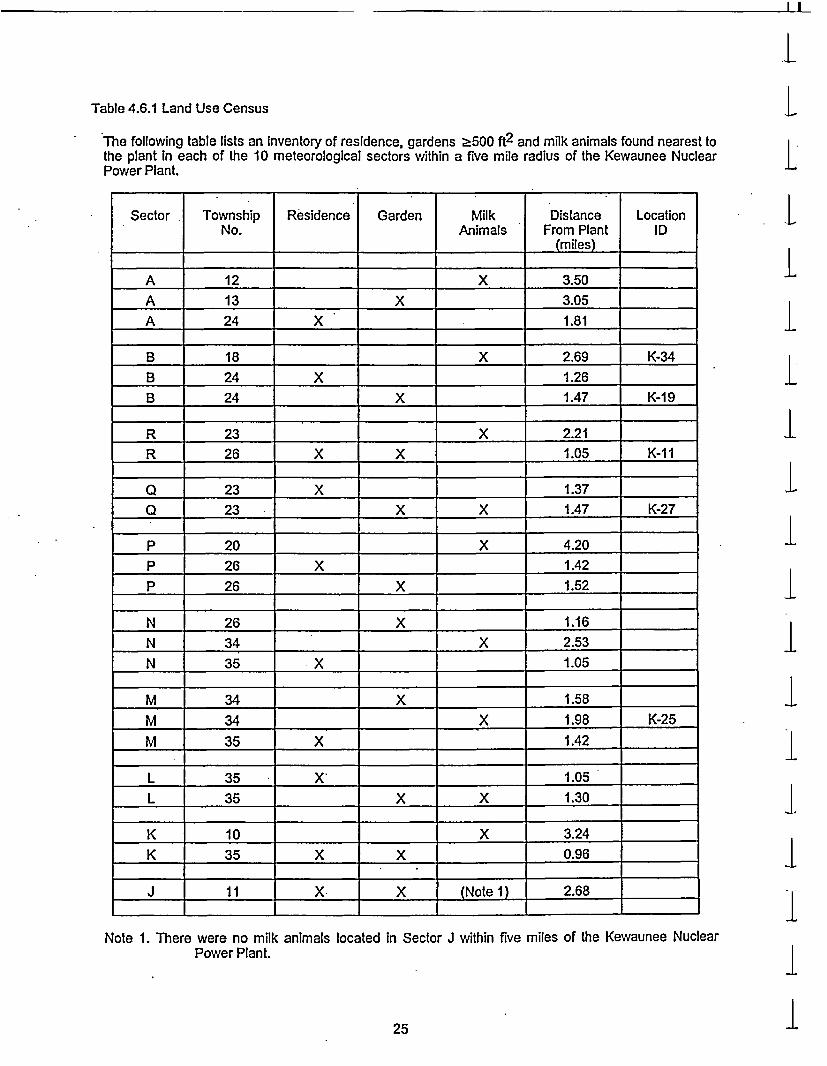
Table 4.6.1 Land Use Census bThe following table lists an inventory of residence, gardens 2500 ft2 and milk animals found nearest tothe plant in each of the 10 meteorological sectors within a five mile radius of the Kewaunee Nuclear lPower Plant.
Sector Township Residence Garden Milk Distance LocationNo. Animals From Plant ID
____ ___ __ ____ ___ ___ (m iles)
A 12 X 3.50A 13 X 3.05A 24 X 1.81
B 18 X 2.69 K-34B 24 X 1.26B 24 X 1.47 K-19
R 23 X 2.21R 26 X X 1.05 K-1I
Q 23 X 1.37Q 23 X X 1.47 K-27
P 20 X 4.20P 26 X 1.42P 26 X 1.52
N 26 X 1.16N 34 X 2.53N 35 X 1.05
M 34 X 1.58M 34 X 1.98 K-25M 35 X 1.42
L 35 X_ 1.05L 35 X X 1.30 _
K 10 X 3.24K 35 X X 0.96
J 11 X X (Note 1) 2.68 =
Note 1. There were no milkPower Plant.
animals located in Sector J within five miles of the Kewaunee Nuclear
25

Table 4.6.2 Land Use Census
The following Is a sector by sector listing of those changes between the 2002 and 2003 census.
Sector A
Sector B
Sector R
Sector Q
Sector P
Sector N
Sector M
The nearest milk animal location was changed. Milk animals were notobserved at the T. Stangel farm.
No changes
Milk animals are no longer present at the G. Hardtke farm.
No changes
No changes.
No changes
No changes
26

II
1~5.0 REFERENCES l
Arnold. J. R. and H. A.AI-Salih. 1955. Beryllium-7 Produced by Cosmic Rays. Science 121: 451-453.
Eisenbud, M. 1963. Environmental Radioactivity, McGraw-Hill, New York, New York, pp. 213, 275, and276.l
Gold, S., H. W. Barkhau, B. Shlein, and B. Kahn, 1964 Measurement of Naturally OccurringRadionuclides in Air, in the Natural Radiation Environment, University of Chicago Press, Chicago,Illinois, 369-382.
Environmental, Inc., Midwest Laboratory. 2004. Annual Report. Radiological Monitoring Program for theKewaunee Nuclear Power Plant, Kewaunee, Wisconsin, Final Report, Part II, Data Tabulationsand Analysis, January - December 2000 - 2003.
2000. Quality Assurance Program Manual, Rev. 1, 01 October 2003.
2000. Quality Control Procedures Manual, Rev. 0, 21 September 2000.
- 2000. Quality Control Program, Rev. 1, 21 August 2003. 1Hazelton Environmental Sciences, 1979 through 1983. Annual Reports. Radiological Monitoring for the
Kewaunee Nuclear Power Plant, Kewaunee, Wisconsin, Final Report - Part II, Data Tabulationsand Analysis, January - December, 1978 through 1982.
Industrial BIO-TEST Laboratories, Inc. 1974. Annual Report. Pre-operational Radiological MonitoringProgram for the Kewaunee Nuclear Power Plant. Kewaunee, Wisconsin. January - December1973.
Industrial BIO-TEST Laboratories, Inc. 1975 Semi-annual Report. Radiological Monitoring Program for theKewaunee Nuclear Power Plant, Kewaunee, Wisconsin. Jan. - June, 1975. L
NALCO Environmental Sciences. 1977. Annual Reports. Radiological Monitoring Program for theKewaunee Nuclear Power Plant, Kewaunee, Wisconsin, January - December 1976. 1
NALCO Environmental Sciences. 1978. Annual Report. Radiological Monitoring Program for theKewaunee Nuclear Power Plant, Kewaunee, Wisconsin, Final Report - Part II, Data Tabulationsand Analysis, January - December 1977. 1
National Center for Radiological Health. 1968. Section 1. Milk Surveillance. Radiological Health DataRep., December 9: 730-746.
National Council on Radiation Protection and Measurements. 1975. Natural Radiation Background in theUnited States. NCRP Report No. 45.
Solon, L. R., W. M. Lowder, A. Shambron, and H. Blatz. 1960. Investigations of Natural Environmental |Radiation. Science. 131: 903-906.
Teledyne Brown Engineering, Environmental Services, Midwest Laboratory. 1984 through 2000. AnnualReports. Radiological Monitoring Program for the Kewaunee Nuclear Power Plant, Kewaunee,Wisconsin, Final Report, Part II, Data Tabulations and Analysis, January - December 1983through January- December 1999. 1
Wilson, D.W., G. M. Ward, and J. E. Johnson, 1969. In Environmental Contamination by RadioactiveMaterials. International Atomic Energy Agency, p. 125
27 1

-- / Environmental,-lc.I Mdw est Laboratoryan Abi~eiy re tmndogbs Co.
7TOL-dwettad *NoathzbmL 6sa2-(84no7oo7 1(847J56.-43.?
APPENDIX A
INTERLABORATORY COMPARISON PROGRAM RESULTS
NOTE: Environmental Inc., Midwest Laboratory participates In Intercomparison studies administered byEnvironmental Resources Associates, and serves as a replacement for studies conducted previouslyby the U.S. EPA Environmental Monitoring Systems Laboratory, Las Vegas, Nevada. Results arereported in Appendix A. TLD Intercomparison results, in-house spikes, blanks, duplicates andmixed analyte performance evaluation program results are also reported. Appendix A Is updatedfour times a year, the complete Appendix Is Included in March, June, September and Decembermonthly progress reports only.
January, 2003 through December, 2003.

- - I I
Appendix A LInterlaboratorv Comparison Program Results
Environmental, Inc;, Midwest Laboratory, formerly Teledyne Brown Engineering Environmental ServicesMidwest Laboratory has participated In interlaboratory comparison (crosscheck) programs since theformulation of it's quality control program in December 1971. These programs are operated by agencieswhich supply environmental type samples containing concentrations of radionuclides known to the issuingagency but not to participant laboratories. The purpose of such a program is to provide an independentcheck on a laboratory's analytical procedures and to alert it of any possible problems.
Participant laboratories measure the concentration of specified radionuclides and report them to the issuingagency. Several months later, the agency reports the known values to the participant laboratories and Lspecifies control limits. Results consistently higher or lower than the known values or outside the controllimits indicate a need to check the instruments or procedures used.
Results in Table A-1 were obtained through participation in the environmental sample crosscheck programadministered by Environmental Resources Associates, serving as a replacement for studies conductedpreviously by the U.S. EPA Environmental Monitoring Systems Laboratory, Las Vegas, Nevada. IThe results in Table A-2 were obtained for Thermoluminescent Dosimeters (TLDs), via InternationalIntercomparison of Environmental Dosimeters under the sponsorships listed in Table A-2. Results ofinternal laboratory testing is also listed.
Table A-3 lists results of the analyses on in-house *spiked' samples for the past twelve months. All samplesare prepared using NIST traceable sources. Data for previous years available upon request.
Table A-4 lists results of the analyses on in-house 'blank samples for the past twelve months. Data forprevious years available upon request. request. ITable A-5 list results of the in-house Oduplicate" program for the past twelve months. Acceptance is basedon the difference of the results being less than the sum of the errors. Data for previous years available upon lrequest.
The results in Table A-6 were obtained through participation in the Mixed Analyte Performance EvaluationProgram.
The results in Table A-7 were obtained through participation in the Environmental Measurement LaboratoryQuality Assessment Program.
Attachment A lists acceptance criteria for 'spiked samples. IOut-of-limit results are explained directly below the result. |
I
Al

I.
L
I,
L.
AnalyE
Gammr
Stronti
Stronti
Potas.
Gross
Attachment A
ACCEPTANCE CRITERlA FOR OSPIKED' SAMPLES
LABORATORY PRECISION: ONE STANDARD DEVIATION VALUES FOR VARIOUS ANALYSES2
One standard deviation;is Level for single determination
1a Emitters 5 to 100 pCi/liter or kg 5.0 pCi/liter> 100 pClliter or kg 5% of known value
urnM-9b 5 to 50 pCiliter or kg 5.0 pCi/liter> 50 pCI/liter or kg 10% of known value
um.90b 2 to 30 pCi/liter or kg 5.0 pCiliter> 30 pCiiliter or kg 10% of known value
3ium-40 > 0.1 gAiter or kg 5% of known value
alpha . 20 pCi/liter 5.0 pCiliter> 20 pCi/liter 25% of known value
beta 100 pCi/liter 5.0 pCi/liter> 100 pCi/liter . 5% of known value
* 4,000 pCi/liter Is (pCi/liter) =169.85 x (known)0r9
> 4,000 pCi/liter 10% of known value
n-226,-228 0.1 pCIlliter 15% of known value
ium 0.1 pCi/liter, gram, or sample 10% of known value
-131, 55 pCiliter 6.0 pCi/litere-129b > 55 pCIliter 10% of known value
m-238, 35 pCI/liter 6.0 pCi/literel-63b > 35 pCiliter 15% of known value
Gross
Tritiurr
4 -
L-
L
L
Radiur
Pluton
Iodine.lodin
UraniuNick,
Techr
Iron-5' jb 50 to 100 pCi/liter> 100 pCi/iter
10 pCioniter10% of known value
20% of known valueOthersb
' From EPA publication, Environmental Radioactivity Laboratory Intercomparison StudiesProgram, Fiscal Year, 1981-1982, EPA-600/4-81-004.
b Laboratory rimil
A2

I I
LTABLE A-1. Interlaboratory Comparison Crosscheck program, Environmental Resource Associates (ERA)". L
Concentration (pCUL)Lab Code Date Analysis Laboratory ERA Control
- Resultb- Resul . Limits
S1W-973 02/17103STW-973 02/17103STW-974 02/17103STW-974 02117/03STW-974 02/17/03S1W-974 02/17103STW-974 02/17/03STW-975 02/17103STW-975 02/17103STW-976 02/17103S1W-976 02117/03S1N-976 02/17/03
Sr-89Sr-90Ba-133Co-60Cs-134Cs-137Zn-65Gr. AlphaGr. BetaRa-226Ra-228Uranium
17.0 :± 0.58.9 ± 0.3
14.5 ± 0.937.5 ± 0.918.2 ±0.642.7 ± 1.056.8 ± 2.218.4 ± 0.311.7 ±0.5
4.1 ± 0.17.6 ± 0.5
52.9 ± 1.9
15.9 ± 5.09.0 ± 5.0
19.5 ±:5.037.4 ±5.017.8 ±5.044.2 ± 5.060.3 ± 6.037.6 ± 9.4
8.6 ± 5.04.7 ± 0.76.5 ± 1.6
53.7 ± 5.4
* 7.2 - 24.60.4 - 17.7
10.8 - 28.228.7 - 46.1
9.1 - 26.535.5 - 52.949.9 - 70.721.3 - 53.9
0.0 -17.23.5 - 6.03.7 - 9.3
44.4 - 63.0
i
..III
S1W-983- 05/19103S1W-984 05/19103STW-985 05/19/03STW-985 05/19/03.STW-985 05/19/03S1W-985 05/19/03STW-986 05119103STW-986 e 05/19/03STW-986 05119/03STW-986 05/19/03STW-986 05/19/03STW-986 05/19/03
H-31-131Gr. AlphaRa-226Ra-228UraniumCo-60Cs-I 34Cs-137Gr. BetaSr-89Sr-90
1290.0 ± 25.019.7 ± 1.354.4 ± 3.014.9 ±0.213.1 ±0.614.5 ± 0.456.9 ± 8.661.6 ± 6.6
143.0 ± 1.2309.0 ± 2.7
33.1 ± 0.228.8 ± 1.3
1250.0 ± 331.020.8 ± 3.070.3 ± 17.616.5 ±2.510.3 ± 2.6 -15.1 ±3.063.8 ± 5.075.7 ± 5.0
150.0 ± 7.5363.0 ± 54.5.31.3 ±5.027.4 ± 5.0
678.0 - 1820.015.6 - 26.039.9 - 101.012.2 - 20.8
5.8 - 14.89.9 - 20.3
55.1 - 72.567.0 - 84.4
137.0 - 163.0269.0 - 457.0
22.6 - 40.018.7 -36.1
II
II
S1W-988 08/18/03STW-988 08118103STW-988 08/18103STW-989 08/18/03STW-989 08/18103STW-989 08/18103STW-989 08/18/03STW-989 08/18103STW-990 08/18/03STW-990' 08118103STW-991 08/18/03STW-991 08/18/03
Ra-226Ra-228UraniumBa-133Co-60Cs-I 34.Cs-137Zn-65Gr. AlphaGr. BetaSr-89Sr-90
13.3 ± 1.111.5 ± 1.012.3 ± 0.418.1 ±1.935.9 ± 1.332.6 ± 1.848.3 ± 0.658.9 ± 2.141.8 ± 3.4w51.3 ± 3.057.2 ± 4.321.2 ± 0.9
13.4 ±2.012.5 ± 3.111.4 ± 3.020.7 ± 5.037.4 ± 5.032.6 ±5.0
* 44.3 ± 5.060.2 ± 6.056.2 ± 16.331.6 ± 5.058.8 ± 5.020.6 ± 5.0
9.9 - 16.97.1 - 17.96.2 - 16.6
12.0 - 29.428.7 - 46.123.9 - 41.335.6 - 53.049.8 - 70.636.9 - 93.322.9 - 40.350.1 - 67.511.9 - 29.3
IIJ
III
Al-I

TABLE A-1. Interlaboratory Comparison Crosscheck program, Environmental Resource Associates (ERA)'.
Concentration (pCiVL)Lab Code Date Analysis -Laboratory ERA Control
Resultb Result'. Limits
STW-997 11/18/03 Gr. Alpha 37.0 ± 2.0 29.5 i 7.4 16.7 - 42.3STW-997 11/18/03 Gr. Beta 26.5 l 0.8 26.3 ± 5.0 17.6 - 35.0SIW-998 11/18/03 1-131 14.8 ±0.3 16.5 i3.0 11.3 -21.7STW-999 11118/03 Ra-226 17.2 * 1.1 17.8 ±t2.7 13.2 -22ASTW-999 11(18/03 Ra-228 6.6 ±L0.3 6.8 ±1.7 3.8 -9.7STW-999 11/18/03 Uranium 11.7 t0.3 11.7 ±3.0 6.5 -16.9STW-1000 11118/03 H-3 15900.0 ± 174.0 14300.0 ±l 1430.0 11800.0 -16800.0S1W-1001 11118103 Gr. Alpha 32.9 ±0.3 542 ±E3.0 30.7 -77.7STW-1001 '11118103 Ra-226 16.5 ±E 0.9 16.1 ±E 2A 11.9 - 20.3STW-1001' 11/18/03 Ra-228 6.2 ±0.5' 5.5:t1.4 3.1 -7.9STW-1001 11118103 Uranium 9.7 ± 1.5 9.3 ± 13.6 4.1 -14.5STW-1002 11118103 Co-60 27.7 ±F 1.9 27.7 ± 5.0 19.0 - 36ASTW-1002 11/18103 Cs-134 21.5 ±1.1 23.4 ±5.0 17.6 -29.2STW-1002 11118/03 Cs-137 66.3 ± 2.8 64.2 ± 5.0 55.5 -72.9STW-1002 11/18/03 Gr. Beta 159.0 ±2.5 168.0 ± 5.0 124.0 -212.0STW-1002 11/18103 Sr-89 48.5 ±0.4 50A. ±5.0 41.7 -59.1STW-1002 11/18/03 Sr-90 10.1 *3.0 10.2 I 25.2 1.5 -18.9
Results obtained by Environmental, Inc.. Midwest Laboratory as a participant In the environmental samplescrosscheck program operated by Environmental Resources Associates (ERA).
b Unless otherwise Indicated, the laboratory result Is given as the mean t standard deviation for three determinations.' Results are presented as the known values, expected laboratory precision (1 sigma. I determination) and control limits
as provided by ERA.d Recount of the original sample stll low. The ERA blank was spiked In the lab;
known value of 20.1 pCi/L. measured 21.5 ± 1.1 pCllL. No explanation for ERA test failure.Lower bias observed for gamma spectroscopic analysis. The undiluted sample was reanalyzed;
Results of reanalysis, Co-60: 62.3 pCUL., Cs-134: 69.2 pCUL, Cs-137: 152.3 pCULReason for deviation unknown. A recount of the original planchets averaged 43.4 pCi/L
Cs-1 37activity by gamma spectroscopy; 28.3 pCUL Result of reanalysis; 29.3 pCVL
AI-2
I L
LLTABLE A-2. Crosscheck program results; Thermoluminescent Dosimetry, (TLDs).
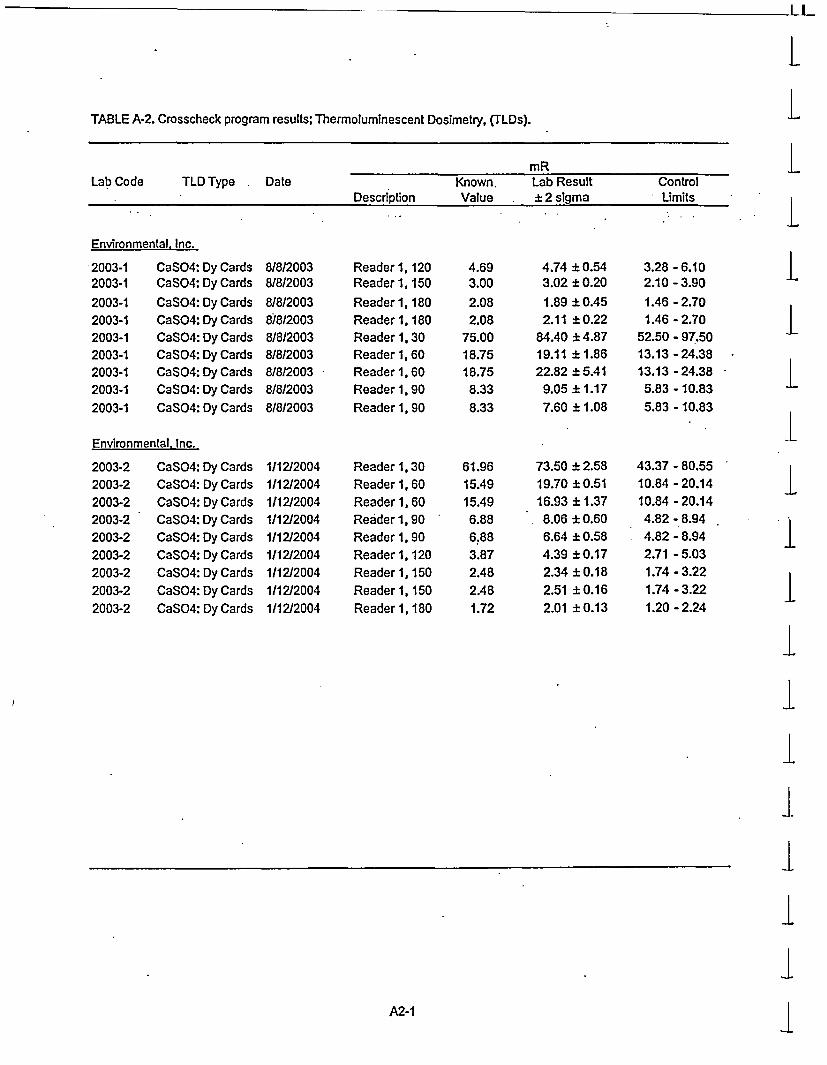
mRLab Code TLD Type Date Known. Lab Result Control
Descriprion Value ± 2 stgma Limits
Environmental. Inc.
2003-12003-12003-12003-12003-12003-12003-12003-12003-1
CaSO4: Dy CardsCaSO4: Dy Cards
CaSO4: Dy CardsCaSO4: Dy CardsCaSO4: Dy CardsCaSO4: Dy CardsCaS04: Dy CardsCaSO4: Dy CardsCaSO4: Dy Cards
8/8/20038/8/2003
8/8/20038/8/20038/8/20038/8/20038/812003818120038/8/2003
Reader 1,120Reader 1,150
Reader1,180Reader1,180Reader 1,30Reader 1,60Reader 1,60Reader 1,90Reader 1,90
4.693.00
2.082.08
75.0018.7518.758.338.33
4.74 ± 0.543.02 i 0.20
1.89 ± 0.452.11 ±0.22
84.40 ± 4.8719.11 ±1.8622.82 ± 5.41
9.05 ± 1.177.60 ± 1.08
3.28 - 6.102.10 - 3.90
1.46 - 2.701.46 - 2.70
52.50 - 97.5013.13 - 24.3813.13 - 24.385.83 - 10.835.83 - 10.83
IEnvironmental. Inc.
2003-22003-22003-22003-22003-22003-22003-22003-22003-2
CaSO4: Dy CardsCaSO4: Dy CardsCaSO4: Dy CardsCaSO4: Dy CardsCaSO4: Dy CardsCaSO4: Dy CardsCaSO4: Dy CardsCaSO4: Dy CardsCaSO4: Dy Cards
1/12/20041/12/20041112/20041/12/20041/12/20041/12/20041/12/20041/12/20041/12/2004
Reader 1,30Reader 1,60Reader 1,60Reader 1,90Reader 1,90Reader 1,120Reader 1,150Reader 1, 150Reader 1,180
61.9615.4915.496.886.883.872.482.481.72
73.50 ± 2.5819.70 i 0.5116.93 ± 1.378.06 ± 0.606.64 ± 0.584.39 i 0.172.34 ± 0.182.51 ± 0.162.01 ± 0.13
43.37 - 80.5510.84 - 20.1410.84 - 20.144.82 - 8.944.82 - 8.942.71 - 5.031.74 - 3.221.74 -3.221.20 - 2.24
I
I
IA2-1
I

TABLE A-3. In-House "Spike Samples
Concentration (pCIL)3
Lab Code Sample Date Analysis Laboratory results Known ControlType 2s, n=lb Activity . Limlitsc
SPW-356W-10303W-11303W-12103SPAP-446SPW-468W-20703SPU-1347DW-30303SPCH-964SPMI-1086SPMI-1086SPMI-1086SPW-1088SPW-1088SPW-1088SPW-1088SPVE-1110SPW-1194SPW-1194SPW-1194W-32103SPCH-1429W-40103SPF-1407SPF-1407SPAP-1409SPU41203SPU-41703SPW-2022SPW-2053SPW-2053SPMI-2055SPMI-2055W-50603W-60303SPW-3960SPMI-4019SPMI-4019SPMI-4019SPW-4023SPW4023SPW-4023SPW-4518
waterwaterwaterwaterAir FilterwaterwaterUrinewaterCharcoalMilkMilkMilkwaterwaterwaterwaterVegetationwaterwaterwaterwaterCharcoalwaterFishFishAir FilterUrineUrinewaterwaterwaterMilkMilkwaterwaterwaterMilkMilkMilkwaterwaterwaterwater
1/2/20031/3/20031/13/20031/21/20031/31/20031/31/20032/7/20033/1/20033/3/20033/8/20033/13/20033/13/20033/13/20033/13120033/13/20033113/20033/13/20033/14/20033/21/20033/21/20033/21/20033/21/20034/11/2003411/20034/2/20034/2/20034/2/20034/12/20034/17/20034125/20034/28/20034/28/20034/28/20034/28/20035/6/20036/3/20037/15/20037/18120037/18/20037/18/20037/18/20037/18/20037/18120038/8/2003
Sr-90Gr. BetaGr. BetaGr. BetaGr. BetaH-3Fe-55H-3Gr. Beta1-131(G)Cs-1371-1311-131(G)Co-60Cs-1371-131 (G)1-1311-131(G)Co-60Cs-1371-131(G)C-141-131(G)Gr. BetaCs-134Cs-i 37Gr. BetaH-3H-3H-3Cs-137Sr-90Cs-137Sr-90Gr. BetaGr. BetaH-3Cs-137Sr-89Sr-90Cs-137Sr-89Sr-90Fe-55
34.04 1.5763.24 ± 1.20.59.75 *1.1061.56 ± 1.591A9 ±0.02
95982.00 ± 865.009095.00 + 114.001724.00 ±412.00
65.44 : 0.5973.37 ± 0.2857.18 ±8.0375.13 ±12.0165.81 :1.0627.16 i4.7951.74 ± 9.1568.14 ± 12.9276.94 ± 1.13
122.80 * 16.8031.09 6.28.55.11 ±0.1366.17 ± 9.15
5201.00 ± 16.608.83 ± 0.11
67.74 ± 0.520.58 ±E 0.031.29 ± 0.061.44 ± 0.02
1798.50 ± 409.301625.10 ± 401.30
89007.00 * 798.0045.70 * 9A447.51 ± 1.8761.65 ± 7.1738.45 ± 1.5970.95 ± 0.5363.00 i 0.51
88700.00 ± 822.0047.17 ±7.2240.95 ± 4.8845.30 ±1.7351.92 ± 6.2442A9 :E 10.2349.69 * 3.04
8176.00 ± 107.00
30.9363.9063.9063.99
1.5289607.0010587.00
1784.3363.9069.4549.5067.6067.5628.2049.5067.60.67.56
124.0028.1549.5067.60
4966.009.18
63.390.591.321.51
1784.331784.33
88463.0049.3544A765.8044.7463.3965.73
87369.0049.1149.4944.2449.1149.4944.24
9330.00
24.74 - 37.1253.90 - 73.9053.90 - 73.9053.99 - 73.99-8.48 - 11.52
71685.60 - 107528.408469.60 - 12704A01101.27 -2467.39
53.90 -73.9059.45 - 79A539.50 -59.5054.08 - 81.1257.56 - 77.5618.20 - 38.2039.50 - 59.5057.60 -77.6054.05 - 81.07
111.60 - 136.4018.15 - 38.1539.50 - 59.5057.60 -77.60
2979.60 - 6952.40-0.82 -19.1853.39 -73.39
0.35 - 0.830.79 - 1.85
-8.49 -11.511101.27 - 2467.391101.27 -2467.39
70770.40 - 106155.6039.35 -59.3535.58 - 53.3655.80 -75.8035.79 - 53.6953.39 -73.3955.73 -75.73
69895.20 - 104842.8039.11 - 59.1139.49 - 59.4935.39 - 53.0939.11 - 59.1139.49 - 59.4935.39 -53.09
7464.00 -11196.00
A3-1
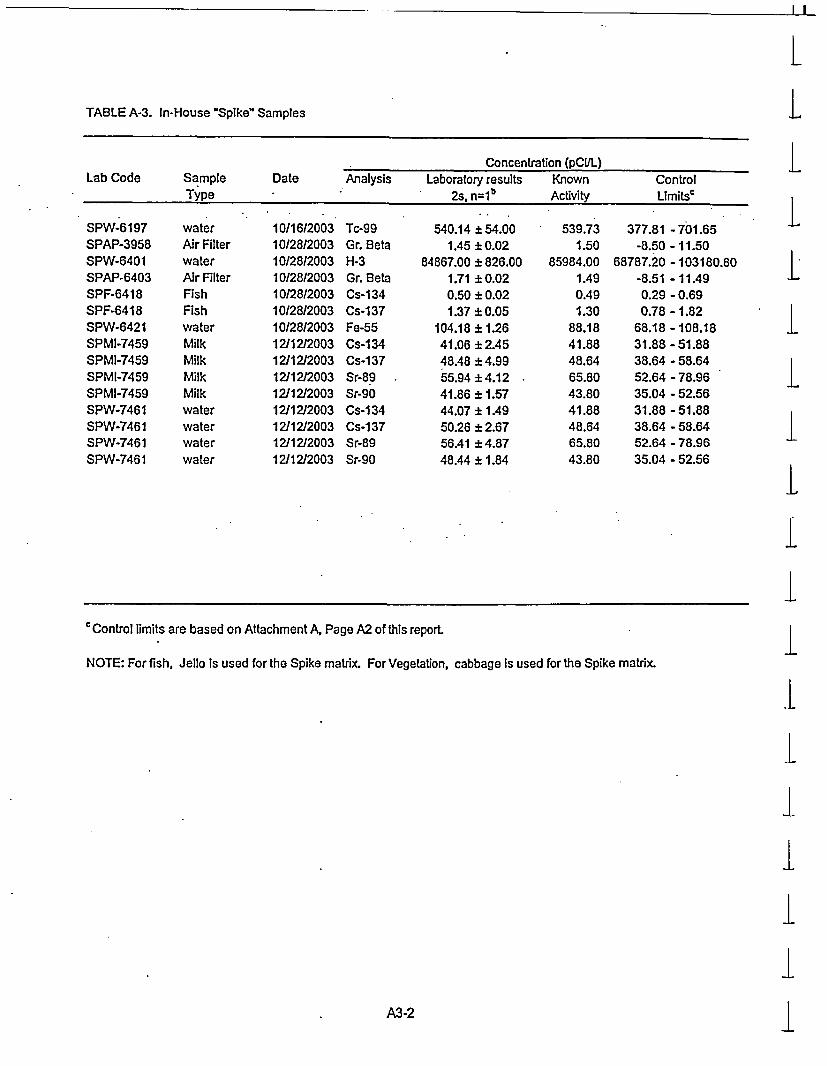
I I
LLTABLE A-3. In-House "Spike" Samples
Concentration (pCVL)Lab Code Sample Date Analysis Laboratory results Known Control
Type 2s, n=1 b Activity LUmitsc
SPW-6197 water 10/16/2003 Tc-99 540.14 ± 54.00 539.73 377.81 -701.65
SPAP-3958 Air Filter 10/2812003 Gr. Beta 1.45 i 0.02 1.50 -8.50 - 11.50SPW-6401 water 10/28/2003 H-3 84867.00 i 826.00 85984.00 68787.20 - 103180.80
SPAP-6403 Air Filter 10/28/2003 Gr. Beta 1.71 i 0.02 1.49 -8.51 - 11.49
SPF-6418 Fish 10/28/2003 Cs-134 0.50 ± 0.02 0.49 0.29 - 0.69
SPF-6418 Fish 10/28/2003 Cs-137 1.37 ± 0.05 1.30 0.78 - 1.82
SPW-6421 water 10/28/2003 Fe-55 104.18 ± 1.26 88.18 68.18 - 108.18
SPMI-7459 Milk 12/12/2003 Cs-134 41.06 ± 2.45 41.88 31.88 -51.88
SPMI-7459 Milk 1211212003 Cs-137 48.48 ± 4.99 48.64 38.64 -58.64
SPMI-7459 Milk 12112/2003 Sr-89 55.94 ± 4.12 65.80 52.64 -78.96
SPMI-7459 Milk 12/12/2003 Sr-90 41.86 ± 1.57 43.80 35.04 - 52.56
SPW-7461 water 12112/2003 Cs-134 44.07 ± 1.49 41.88 31.88 - 51.88
SPW-7461 water 12/12/2003 Cs-137 50.26 ±2.67 48.64 38.64 -58.64
SPW-7461 water 12112/2003 Sr-89 56.41 ±4.87 65.80 52.64 -78.96
SPW-7461 water 12/1212003 Sr-90 48.44 ± 1.84 43.80 35.04 - 52.56
LILL
' Control limits are based on Attachment A, Page A2 of this report.
NOTE: For fish, Jello Is used for the Spike matrix. For Vegetation, cabbage is used for the Spike matrix.
I
IIIIA3-2

TABLE A-4. In-House *BlankZ Samples
Concentration (pCi/L)'
Lab Code Sample Date Analysis Laboratory results (4.66a) Acceptance
Type LLD Activityb . Criteria (4.66 f)
waterSPW-357W-10303W-11303W-12103SPAP-447SPW-469W-20103W-20703DW-30303SPCH-965SPMI-1087SPMI-1087SPMI-1087SPMI-1087SPWY-1089SPW-1089SPW-1089SPW-1089
* SPVE-1111W-32103SPCH-1430W-40103SPF-1408SPF-1408SPAP-1410SPU-41203SPU-41703SPW-2054SPW-2054SPW-2054SPMI-2056 cSPMI-2056SPMI-2056W-50603W-60303SPW-3960SPMI-4018SPMI-4018SPMI-401 'SPW-4024SPW-4024SPW-4519SPW-6401
waterwaterwaterwaterAir Filterwaterwaterwater
11212003 -1/3/20031/13/20031/21/20031/31/20031/31/2003
-2/11200321712003313/2003
. ,
Charcoal Cani: 318/2003Milk 3113/2003Milk 3113/2003Milk 3/13/2003Milk 311312003water 3/13/2003water 3/13/2003water 3/13/2003water 3/13/2003Vegetation 3/14/2003water . 3/21/2003Charcoal Cani: 4/1/2003water 411/2003Fish 4/2/2003Fish 4/2/2003Air Filter 4/212003Urine 4/1V2003Urine 4/17/2003water 4/28/2003water 4/28/2003water 4128/2003Milk 4/28/2003Milk 4/28/2003Milk 4/28/2003water 5/6/2003water 6/3/2003water 7115/2003Milk 7/18/2003Milk 7/18/2003Milk 7/18/2003water 7118/2003water 7/18/2003water 8/8/2003water 10/28/2003
Sr-90Gr. BetaGr. BetaGr. BetaGr. BetaH-3Gr. BetaFe-55Gr. Beta1-131(G)Cs-134Cs-1371-1311-131 (G)Co-60Cs-134Cs-1371-1311-131(G)C-141-131 (G)Gr. BetaCs-134Cs-137Gr. BetaH-3H-3Cs-137Sr-89Sr-90Sr-90Cs-1371-131 (G)Gr. BetaGr. BetaH-3Cs-137Sr-89Sr-90Sr-89Sr-90Fe-55H-3
0.500.120.140.12.0.00
160.200.17
802.000.150.017.497.900.337.764.485.604.320.297.53
17.500.010.140.010.010.00
653.99648.35
3.160.550.550.772.743.540.120.14
156.604.100.730.510.830.62
527.00163.80
0.12 * 0.250.022 ±0.10
0.035 ±0.100.029 ± 0.09
-0.0034 ± 0.0019.3 ± 80.30
0.0 ±0.12149 ±498.00
0.007 ±0.11
-0.013 ±0.18
-0.050 * 0.16
-0.4 ± 9.200
-0.11 ± 0.100
-0.0029 ± 0.002542.28 ± 364.780
100.1 ± 344.800
0.45 ± 0.500.072 ± 0.260
0.66 ± 0.430
0 ±0.090-0.035 ± 0.095
53.4 ± 80.200
0.39 ± 0.8800.93 ±0.3400.21 ±0.7300.09 ± 0.300
87 ±369.000-23.8 ± 85.000
13.2323.23.2
2003.2
10003.29.61010
0.520101010
0.520
2009.63.21001003.2
200200
10
51
* 1.1020
* 3.2
3.2200
105I
5I
.1000200
A4-1

I I
TABLEA-4. In-House "Blank"Samples
Concentration (pCiIL)aLab Code Sample Date Analysis Laboratory results (4.66a) Acceptance
Type LLD AcUvityb Criteria (4.66 c)
SPAP-6404 Air Filter 10/28/2003 Gr. Beta 0.87 -0.99 i 0.440 3.2SPF-6419 Fish 10128/2003 Cs-134 0.01 100SPF-6419 Fish 10/2812003 Cs-137 0.01 100SPMI-7460 Milk 1211212003 Cs-134 4.52 10SPMI-7460 Milk 1211212003 Cs-137 5.77 10SPMl-7460r Milk 12/1212003 Sr-90 0.50 1.26 ±0.370 1
ItI
ILiquid sample results are reported In pCIUIter, air filters( pCIfilter), charcoal (pCVcharcoal canister), and solid samples (pCIkg).
b The activity reported Is the net activity result.c Low levels of Sr-90 are still detected In the environment. A concentration of (1-5 pCi/L) In milk is not unusual.
A4-2
I
I
I
III
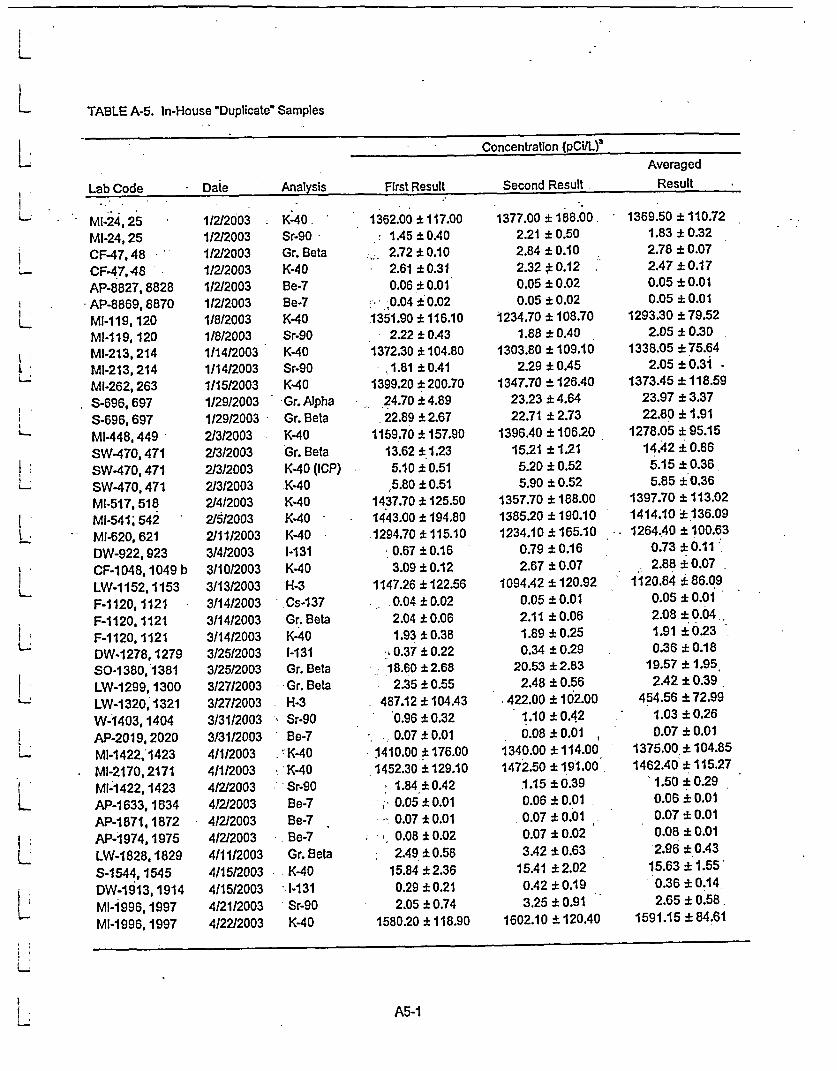
TABLE A-5. In-House "Duplicatew Samples
Concentration (pC!/L)r
AveragedLab Code Date Analysis First Result Second Result Result
MI-24, 25MI-24, 25CF-47,48CF-47,48AP-8827, 8828AP-8869,8870MI-119,120MI-119, 120MI-213, 214MI-213, 214MI-262,263S-696, 697S-696. 697MI-448,449SW-470,471SW-470, 471SW-470,471MI-517, 518MI-541; 542MI-620, 621DW-922, 923CF-i048,1049 bLW-1152,1153F-1120, 1121F-1120.1121F-1120. 1121DW-1278,1279SO-1380,1381LW-1299,1300LW-1320.1321W-1403,1404AP-2019,2020MI-1422, 1423MI-2170.2171MI-1422. 1423AP-1633, 1634AP-1871,1872AP-1974,1975LW-1828,1829S-1544, 1545DW-1913,1914MI-i996,1997MI-1996,1997
112/20031/2/2003112/20031/212003112/2003112/2003118120031/8/20031114120031114120031115120031/29/20031129/2003213t20032/3120032/3/20032/3/2003214t20032/5/20032/11/2003314/20033110/20033/13/20033114/20033/14/20033114/20033/25/20033/25/20033/27/20033127/20033/31/20033/31/20034/11/20034/1120034/2/20034/2120034/2/20034/2/20034/11/20034115/20034/15/20034/21120034/2212003
K-40.Sr-90Gr. BetaK-40Be-7Be-7K-40Sr-90K-40Sr-.oK-40Gr. AlphaGr. BetaK-40Gr. BetaK-40 (ICP)K-40K-40K-40K-401-131K-40H-3Cs-137Gr. BetaK-401-131Gr. BetaGr. BetaH-3Sr-90Be-7K-40K-40Sr-90Be-7Be-7Be-7Gr. BetaK-40
1-131Sr-90K-40
1362.00 ± 117.00* 1.45 4 OAO
2.72 *t 0.102.61 *0.310.06 ± 0.01
,0.04 * 0.021351.90 * 116.10
- 2.22 i 0.431372.30 ± 104.80
1.81 ±0.411399.20 *200.70
24.70 ± 4.8922.89 ± 2.67
1159.70 ± 157.9013.62 + 1.23
5.10 I 0.515.80 ± 0.51
1437.70 ± 125.501443.00 ± 194.801294.70 + 115.10
0.67 + 0.163.09 ± 0.12
1147.26 i 122.560.04 ± 0.022.04 i 0.061.93 *k 0.380.37 i 0.22
18.60 *2.682.35 i 0.55
487.12 * 104.430.96 ± 0.320.07 *F 0.01
1410.00 -t 176.001452.30 ±h 129.10
1.84 ± 0.42
0.05 I0.010.07 i0.010.08 * 0.022.49 i 0.58
15.84 * 2.360.29 *k 0.212.05 i 0.74
1580.20 * 118.90
1377.00 ± 188.002.21 ±0.502.84 * 0.102.32 0.120.05 i 0.020.05 ± 0.02
1234.70 ± 108.701.88 * 0.40
1303.80 ± 109.102.29 ± 0.45
1347.70 + 126.4023.23 ± 4.6422.71 ± 2.73
1396.40 ± 106.2015.21 i 1.215.20 i 0.525.90 i 0.52
1357.70 ± 188.001385.20 ± 190.101234.10 i 165.10
0.79 i0.162.67 i 0.07
1094A2 i 120.920.05 i 0.012.11 i 0.061.89 i 0.250.34 ± 0.29
20.53 ± 2.832.48 * 0.56
422.00 i 102.001.10 i0.4.2
0.08 * 0.011340.00 i 114.001472.50 i 191.00
1.15 i 0.390.06 * 0.010.07 ± 0.010.07 i 0.023.42 i 0.63
15.41 ± 2.02OA2 i 0.193.25 i 0.91
1602.10 i 120.40
1369.50 i110.721.83 ± 0.322.78 i 0.072.47 i 0.170.05 i 0.010.05 i 0.01
1293.30 ± 79.522.05 ± 0.30
1338.05 i75.642.05 i±0.3i
1373.45 i 118.5923.97 ± 3.3722.80 i 1.91
1278.05 i 95.1514.42 ± 0.865.15 ± 0.365.85 ± 0.36
1397.70 ± 113.021414.10 4 136.091264.40 ± 100.63
0.73 ± 0.112.88 ± 0.07
1120.84 ±86.090.05 ± 0.012.08 ± 0.041.91 ±0.230.36 i 0.18
19.57 ± 1.952.42 * 0.39
454.56 i 72.991.03 ± 0.260.07 0.01
1375.00 i 104.851462.40 i 115.27
1.50 ± 0.290.06 ± 0.010.07 ± 0.010.08 i 0.012.96 ± 0.43
15.63 ± 1.55'0.36 ± 0.142.65 ± 0.58.
1591.15 ± 84.61
A5-1
I I I
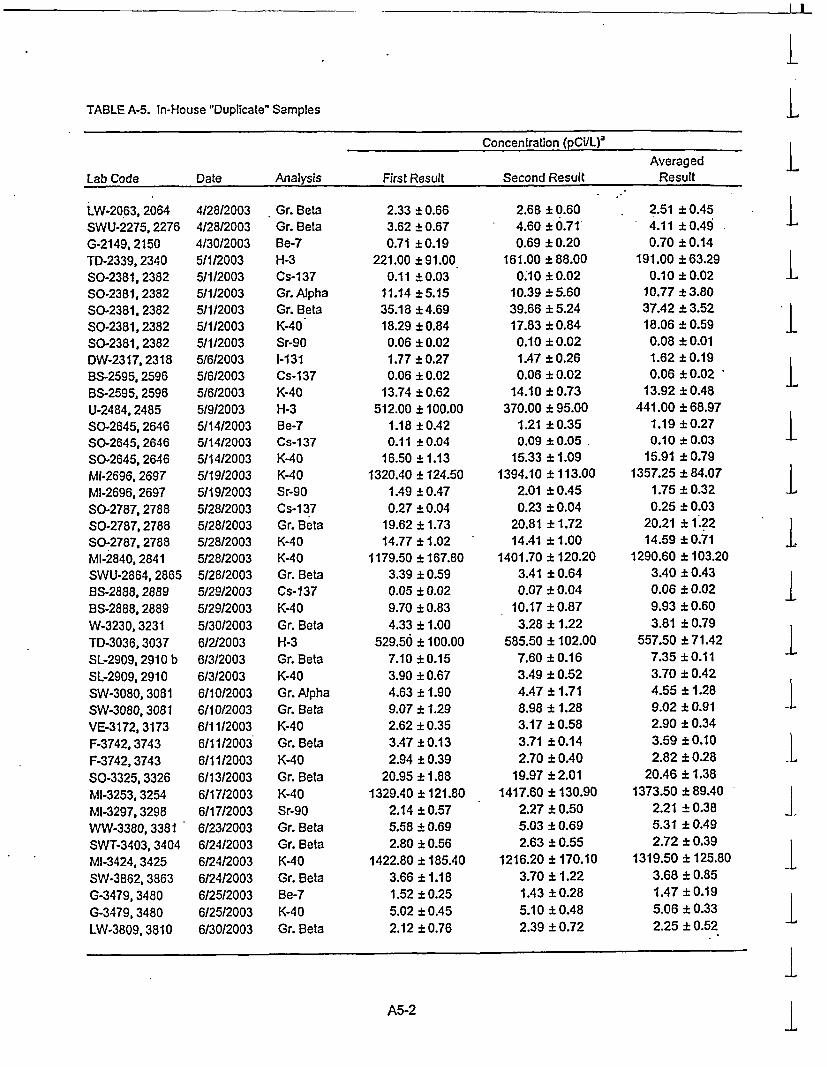
TABLE A-5. In-House "Duplicate' Samples
Concentration (pCVL) 3
AveragedLab Code Date Analysis First Result Second Result Result
LW-2063, 2064SWU-2275, 2276G-2149, 2150TD-2339,2340SO-2381, 2382S0-2381, 2382SO-2381. 2382S0-2381. 2382SO-2381, 2382DW-2317. 23188S-2595, 2596BS-2595, 2596U-2484, 2485SO-2645, 2646S0-2645, 2646SO-2645, 2646Ml-2696, 2697MI-2696, 2697S0-2787, 2788SO-2787, 2788SO-2787, 2788MI-2840,2841SWU-2864, 2865BS-2888, 2889BS-2888, 2889W-3230,3231TD-3036,3037SL-2909, 2910 bSL-2909, 2910SW-3080, 3081SW-3080, 3081VE-3172, 3173F-3742, 3743F-3742, 3743S0-3325,3326MI-3253, 3254MI-3297,3298WW-3380, 3381SWT-3403, 3404MI-3424, 3425SW-3862,3863G-3479,3480G-3479, 3480LW-3809, 3810
4/28/20034/28/20034/30/20035(1/20035/1/20035/1/20035/1/20035/1/20035/1/20035/6/20035/6/2003516/20035/9/20035/14/20035/14/20035/14/20035/19/20035/19/20035/28/20035/28/20035/28120035/28/20035/28/20035/29/20035/29/20035/30/20036/2/2003613/20036/3/20036/10/20036/10/20036/11/20036/11/20036/11/20036/13/20036/17/20036/17/20036/23/20036/24/20036/24/20036/24/20036/25/20036/25/20036/30/2003
Gr. BetaGr. BetaBe-7H-3Cs-1 37Gr. AlphaGr. BetaK-40Sr-901-131Cs-137K-40H-3Be-7Cs-137K-40K-40Sr-90Cs-1 37Gr. BetaK-40K-40Gr. BetaCs-137K-40Gr. BetaH-3Gr. BetaK-40Gr. AlphaGr. BetaK-40Gr. BetaK-40Gr. BetaK-40Sr-90Gr. BetaGr. BetaK-40Gr. BetaBe-7K-40Gr. Beta
2.33 i 0.663.62 i 0.670.71 i0.19
221.00 ±91.000.11 ±0.03
11.14 ±5.1535.18 i4.6918.29 i 0.84
0.06 i 0.021.77 i 0.270.06 i 0.02
13.74 i0.62512.00 ± 100.00
1.18 ± 0.420.11 ± 0.04
16.50 ± 1.131320.40 ± 124.50
1.49 ± 0.470.27 ± 0.04
19.62 ±1.7314.77 ± 1.02
1179.50 i 167.803.39 i 0.590.05 i 0.029.70 i 0.834.33 ± 1.00
529.50 ± 100.007.10 ±0.153.90 ± 0.674.63 i 1.909.07 i 1.292.62 i 0.353.47 i 0.132.94 i 0.39
20.95 ± 1.881329.40 ± 121.80
2.14 ±0.575.58 ± 0.692.80 ± 0.56
1422.80 ± 185.403.66 ±1.181.52 ± 0.255.02 i 0.452.12 0 0.76
2.68 ± 0.604.60 ± 0.710.69 ± 0.20
161.00 ± 88.000.10 ± 0.02
10.39 ±5.6039.66 ± 5.2417.83 ± 0.840.10 i 0.021.47 ± 0.260.06 ± 0.02
14.10 ± 0.73370.00 ± 95.00
1.21 ±0.350.09 ± 0.05
15.33 ±1.091394.10 ±113.00
2.01 ± 0.450.23 ± 0.04
20.81 ±1.7214.41 ±1.00
1401.70 ±120.203.41 ± 0.640.07 ± 0.04
10.17 ± 0.873.28 ± 1.22
585.50 ± 102.007.60 ± 0.163.49 ± 0.524.47 ± 1.718.98 ± 1.283.17 ± 0.583.71 ± 0.142.70 iO.40
19.97 ± 2.011417.60 ±130.90
2.27 ± 0.505.03 ± 0.692.63 ± 0.55
1216.20 ± 170.103.70 ±1.221.43 ± 0.285.10 ± 0.482.39 ± 0.72
2.51 ± 0.454.11 ±O.490.70 ± 0.14
191.00 ± 63.290.10 ± 0.02
10.77 ±3.8037.42 ± 3.5218.06 ± 0.590.08 ± 0.011.62 ± 0.190.06 ± 0.02
13.92 ± 0.48441.00 ± 68.97
1.19 ±0.270.10 ± 0.03
15.91 ± 0.791357.25 ± 84.07
1.75 ± 0.320.25 ± 0.03
20.21 ±1.2214.59 ± 0.71
1290.60 ±103.203.40 ± 0.430.06 ± 0.029.93 ± 0.603.81 ± 0.79
557.50 ±71.427.35 ± 0.113.70 ± 0.424.55 ± 1.289.02 ± 0.912.90 ± 0.343.59 ± 0.102.82 ± 0.28
20.46 ±1.381373.50 ± 89.40
2.21 ± 0.385.31 ± 0.492.72 ± 0.39
1319.50 ± 125.803.68 ± 0.851.47 ± 0.195.06 ± 0.332.25 ± 0.52
A5-2

TABLE A-5. tn-House "DuplicateW Samples
Concentration (pCiVL)/
AveragedLab Code Date Analysis - First Result Second Result Result
LW-3809,3810AP-4105,4106G-3572,3573G-3572,3573G-3572,3573G-3572, 3573MI-3601, 3602MI-3601, 3602AP-3933,3934AP-4061, 4062.AP-4147,4148AP-4084,4085LW-3786,3787WW-4168,4169CF-3975,3976CF-3975,3976MI-4020,4021DW-4272,4273SWU-4461,4462SL-4398,4399SL-4398,4399 bSL-4398,4399G-4419,4420G-4419,4420G-4419,4420TD-4550,4551MI-4482,4483MI-4482,4483G-4526,4527G-4526,4527SWU-4609,461CCW-4694,4695CW-4694,4695LW-4673,4674Ml-4735, 4736MI-4756,4757VE4832,4833Ml-4860,4861SO-5082,5083SO-5082,5083CW-5349,5350CW-5349,5350ME-4968,4969ME-4968,4969
6/30/20036/30/20037/1/20037/11/20037/1/20037/1/2003711120037/1/20037/1/20037/2/20037/2120037/3/20037/9/20037/11/20037/14120037114/20037116/20037/29/20037/30/20038/4/20038/4/20038/4/20038/4/20038/4/20038/4/20038/4/20038/6/20038/6/20038/6120038/6/2003816/2003
* 8/6/20038/6/2003.8113/20038/19/20038/19/20038/20/20038/26/20038/28/20038/28/20038/31/20038/31/2003912/20039/2/2003
H-3Be-7Be-7Gr. BetaK-40Sr-90K-40Sr-90Be-7Be-7Be-7Be-7Gr. BetaGr. BetaBe-7K-40K-40Gr. BetaGr. BetaBe-7Gr. BetaK-40Be-7Gr. BetaK-40H-3K-40Sr-90Be-7K-40Gr. BetaGr. BetaH-3Gr. BetaK-40Sr-90K-40K-40Cs-137Gr. BetaGr. BetaH-3Gr. BetaK-40
2814.09 t 167.990.07 ± 0.010.91 ±0.24
6.35 ±0.155.44 * 0.55
. . 0.01 I 0.00
1318.60 ± 117.400.86 * 0.510.07 i 0.010.07 * 0.010.08 ± 0.010.09 .i 0.022.13 t 0.563.79 * 1.871.64 * 0.816.54 * 0.75
-.1350.90 ± 174.902.35 ± 0.922.28 ± 0.444.556 * 1.053.41 * 0.122.47 * 0.673.98 I 0.635.38 ± 0.144.42 ± 0.66
327.30 * 95.101301.40 ±115.20
0.81 ± 0.301.47 i 0.295.42 ± 0.563.22 ± 0.631.48 i 0.34
22776.41 i428.732.86.± 0.65
1396.30 ± 127.901.66 ± 0.471.96 ± 0.50
1312.10 * 191.800.01 *0.00
20.02 t 1.841.45 * 0.39
24429.50 ± 444A24.90 ± 0.232.46 ± 0.41
2812.17 ±167.940.07 ± 0.010.81 ± 0.286.35 ± 0.155.68 ± 0.280.02 * 0.00
1435.10 * 117.801.74 * 0.600.07 i 0.010.08 * 0.010.07 * 0.010.08 ± 0.022.93 ± 0.624.48 ± 1.981.66 ± 0.576.19 ±0.50
1199.80 ± 153.202.29 + 0.891.93 * 0.434.50 ± 1.103.12 i 0.112.44 ± 0.873.93 * 0.575.35 * 0.164.32 * 0.74
390.20 * 92.101370.30 * 116.80
0.85 * 0.311.42 * 0.285.21 * 0.632.67 * 0.641.09 ± 0.34
21831.75 ±420.103.75 * 0.71
1410.10 ±120.201.53 ± OA441.43 ± 0.47
1307.80 ± 109.300.01 * 0.00
20.92 ± 2.031.55 i 0.45
24744.25 ± 447.185.18 ± 0.242.68 ± 0.37
2813.13 ±118.770.07 * 0.010.86 * 0.186.35 * 0.115.56 * 0.310.01 i 0.00
1376.85 ± 83.161.30 * 0.390.07 ± 0.010.08 ± 0.01.0.07 * 0.010.08 ± 0.012.53 * 0.424.14 * 1.361.65 ± 0.506.36 i OA5
1275.35 ± 116.252.32 * 0.642.10 i 0.31
..4.53 ± 0.763.27 ± 0.082A6 t 0.553.96 ± 0.425.37 iO.114.37 0.50
358.75 ± 66.191,335.85 * 82.03
0.83 * 0.211 A5 ± 0.205.31 iO.422.95 ± OA51.29 ±0.24
22304.08 ± 300.123.30 0.48
1403.20 ± 87.761.60 ± 0.321.70 ± 0.34
1309.95 ± 110.380.01 * 0.00
20A7 ± 1.371.50 i 0.30
24586.88 ± 315.235.04 ±0.172.57 + 0.28
A5-3

-
- - _ IL
TABLE A-5. In-House 'Duplicate" Samples
Concentration (pCaL)3
Averaged
Lab Code Date Analysis First Result Second Result Result
LIDW-4989,4990
MI-5154,5155MI-5154, 5155AP-6177,6178SWU-5773. 5774AP-6102, 6103G-5631, 5632G-5631,5632G-5631,5632SO-5660, 5661S0-5660, 5661S0-5660. 5661SO-5660, 5661s0-5660, 5661AP-6334, 6335AP-6363,6364MI-5794, 5795Ml-5838.5839MI-5838, 5839BS-5938, 5939BS-5938, 5939SS-5959, 5960MI-6011, 6012MI-6034, 6035VE-6055,6056VE-6055,6056MI-6291, 6292MI-6291, 6292SS-6435,6436SS-6435, 6436CF-6313.6314SO-6528, 6529SO.6528, 6529SO-6393, 6394SO-6393, 6394SO-6393,6394SWT-6507,6508DW-6647,6648BS-6603, 6604BS-6603, 6604S0-6670,6671SO-6670,6671S-7067, 7068MI-6818,6819
9/2/20039/8/20039/8/20039/29/20039/30/20039/30/20031011/200310/1/200310/1/200310/1/200310/1/200310/1/200310/1/200310/1/200310/1/200310/2/200310/61200310/8/200310/8/20031018/200310/8/200310/13/200310/13/200310/14/200310115/200310/15/200310/21/200310/21/200310/21/200310/21/200310/22/200310/22/200310/22/200310/25/200310/25/200310/25/200310/28/200310/31/200311/3/200311/3/200311/5/20031115/200311/101200311/1112003
Gr. BetaK-40Sr-90Be-7Gr. BetaBe-7Be-7Gr. BetaK-40Cs-137Gr. AlphaGr. BetaK-40Sr-90Be-7Be-7Sr-90K-40Sr-90Cs-137K-40K-40K-40Sr-90Gr. BetaK-40K-40Sr-90Cs-137K-40K-40Cs-I 37K-40Cs-137Gr. BetaK-40Gr. Beta1-131Cs-137Gr. BetaCs-137K-40Cs-i 37K-40
2.20 ± 1.041365.50 ± 116.70
1.19 ± 0.390.07 ± 0.012.55 ± 0.630.07 ± 0.011.88 ± 0.485.87 ± 0.095.24 ± 0.770.15 ±0.04
12.72 ± 3.7232.42 ± 3.0918.93 ±0.87
0.03 ± 0.010.06 ± 0.010.07 ± 0.021.37 ± 0.37
1364.30 ± 124.100.76 ± 0.300.18 ± 0.03
15.59 ± 0.707.49 ± 0.42
1165.20 ± 118.700.86 ± 0.335.18 ± 0.185.31 ± 0.57
1935.60 ± 147.701.22 ± 0.390.05 ± 0.02
14.08 ± 0.5414.56 i0.45
0.15 i 0.0317.46 ± 0.69
0.09 ± 0.0323.21 ± 1.9813.98 ± 0.80
2.64 ± 0.520.46 ± 0.279.03 ± 0.82
26.83 ± 1.940.15 ±0.04
12.96 ± 0.660.21 ± 0.05
1695.50 ± 129.80
3.19 ± 1.141456.70 ± 119.10
1.39 ± 0.390.06 ± 0.012.83 ± 0.600.05 ± 0.012.21 ± 0.405.85 ± 0.085.26 ± 0.580.16 0.05
14.86 ± 3.8833.60 ± 3.0418.25 ± 1.19
0.03 ± 0.010.06 ± 0.010.07 ± 0.021.02 ±0.37
1414.40 ± 110.401.00 ± 0.340.20 ± 0.05
16.69 ± 0.807.29 ± 0.63
1191.20 ± 99.500.90 ± 0.345.33 ± 0.184.52 ± 0.51
1936.10 ±116.501.41 ±0.370.05 ± 0.03
14.28 ± 0.8014.70 ± 0.950.16 ± 0.05
17.90 ±1.050.10 ± 0.04
21.76 ±1.9114.57 ± 0.862.63 ± 0.530.61 ± 0.318.60 ± 1.13
27.18 ± 1.950.13 ± 0.04
12.95 ± 0.720.19 ± 0.08
1709.40 ± 143.00
2.70 ± 0.771411.10 ± 83.37
1.29 ± 0.280.06 ±0.012.69 ± 0.440.06 i 0.012.05 ± 0.315.86 ± 0.065.25 ± 0.480.16 i 0.03
13.79 ± 2.6933.01 ± 2.1718.59 ± 0.740.03 ± 0.010.06 ± 0.010.07 ± 0.011.19 ± 0.26
1389.35 ± 83.050.88 + 0.230.19 ± 0.03
16.14 ± 0.537.39 0.38
1178.20 77.440.88 0.245.25 0.134.92 0.38
1935.85 94.061.31 0.270.05 0.02
14.18 0.4814.63 0.530.16 0.03
17.68 0.630.10 0.03
22.48 ±1.3814.27 ± 0.592.63 ± 0.370.53 ± 0.218.82 ± 0.70
27.01 ± 1.380.14 ± 0.03
12.96 ± 0.490.20 ± 0.05
1702.45 ± 96.56
II
I
I
IIIIIl
III
A5-4I

TABLE A-5. In-House t Duplicate" Samples
Concentration (pCi/L)Averaged
Lab Code Date Analysis .. First Result Second Result Result
MI-6818,6819WL-6987, 6988SO-7156,7157SO-7156, 7157SO-7156, 7157SO-7156, 7157S-7281,7282SWU-7198, 7199DW-7221, 7222SW-7133, 7134
L SW-7133, 7134W-7519,7520SW-7805, 7806VE-7399, 7400VE-7399, 7400SW-7540,7541SW-7540,7541LW-7736, 7737AP-7868, 7869AP-7952,7953AP-7994,7995
11111/200311117/200311121/200311121/200311/211200311/21/20031112412003111251200311/25/200312/1/200312/11200312/11200312/11200312/91200312/91200312191200312/91200312126/200312/30/200312130120031213112003
Sr-90-Fe-55Cs-I 37Gr. AlphaGr. BetaK-40Cs-1 37Gr. Beta.Gr. BetaGr. BetaK-40Fe-55Sr-90Gr. BetaK-40Gr. AlphaGr. BetaGr. BetaBe-7Be-7Be-7
*2.01 ± 0.41603A9 i 53.32
0.74 * 0.0814.90 I 4.2422.97 * 3.1212.51 ±1.060.82 * 0.152.60 * 0.53
12.32 * 1.402.10 * 0.231.50 + 0.153.03 ± 0.650.59 ± 0.32
.4.99 t 0.155.04 ± 0.462.64 * 1.366.62 * 1.222.62 * 0.540.05 * 0.010.04 ± 0.010.05 ± 0.02
1.59 i 0.39619.65 ± 53.97
0.77 ± 0.0719.25 4.4525.51 ±2.9812.94 ± 1.07
1.16 t 0.202.54 ±0.55
12.38 ± 1.43.2.46 ± 0.231.40 ± 0.143.12 * 0.640.56 * 0.335.24 * 0.155.34 ± 0.742.10 ±1.195.89 * 1.352.83 ± 0.560.04 * 0.010.04 + 0.010.05 * 0.01
1.80 ± 0.28611.57 ± 37.93
0.76 ± 0.0617.07 ± 3.0724.24 ± 2.1612.73 ± 0.75-0.99 ± 0.122.57 ± 0.38
12.35 ± 1.002.28 ± 0.161.45 ± 0.103.08 ± 0.460.58 ± 0.235.11 I0.115.19.± 0.432.37 ± 0.916.25 ± 0.912.73 ± 0.390.04 ± 0.010.04 ± 0.010.05 ± 0.01
Note: Duplicate analyses are performed on every twentieth sample received In-house. Results are not listed for thoseanalyses with activities that measure below the LLD.
a Results are reported In units of pCilL, except for air filters (pC/Filter), food products, vegetation, soil, sediment (pCilg).b 200 minute count time or longer, resulting In lower error.
A5-5

I I
1LTABLE A-6. Department of Energy's Mixed Analyte Performance Evaluation Program (MAPEP)3.
ConcentrationbKnown Control
Lab Code Type Date Analysis Laboratory result Activity Limitsc
STW-972 water 12101/02 Am-241 0.56 + 0.06 0.58 ± 0.09 0.40 -0.75STW-972 water 12/01102 Co-57 57.10 ±1.90 57.00 ± 5.70 39.90 -74.10STW-972 water 12101102 Co-60 38.30 ± 0.60 38.20 ± 3.82 26.74 -49.66STW-972 water 12101102 Cs-134 395.30 ±10.10 421.00 ±42.10 294.70 -547.30STW-972 water 12101/02 Cs-137 316.40 ± 5.30 329.00 ± 32.90 230.30 -427.70STW-972 water 12101/02 Fe-55 94.90 ± 24.50 96.00 ±9.60 67.20 - 124.80STW-972 water 12101102 Mn-54 33.40 ± 0.10 32.90 ± 3.29 23.03 -42.77STW-972 water 12101/02 NI-63 123.80 ± 5.50 136.50 ± 13.70 95.55 -177.45STW-972 water 12101/02 Pu-238 0.66 ± 0.06 0.83 ± 0.08 0.58 - 1.08STW-972 water 12101102 Pu-239/40 0.001 ±0.001 0.000 ± 0.000 0.000 -0.005STW-972 water 12101102 Sr-90 13.80 ±1.00 12.31 ± 1.23 8.62 - 16.00STW-972 water 12101102 Tc-99 128.10 ±3.80 132.00 ± 13.20 92.40 - 171.60STW-972 water 12101102 U-23314 1.60 ± 0.09 1.54 ±0.15 1.08 -2.00STW-972 water 12101/02 U-238 1.64 ± 0.09 1.60 ±0.16 1.12 -2.08STW-972 water 12101102 Zn-65 540.40 ± 9.90 516.00 ± 51.60 361.20 - 670.80
STSO-987 soil 01/01/03 Co-57 534.36 ± 2.61 530.00 ± 53.00 371.00 - 689.00STSO-987 soil 01/01/03 Co-60 442.16± 2.31 420.00 ±42.00 294.00 -546.00STSO-987 soil 01/01/03 Cs-134 211.00 ± 2.30 238.00 i23.80 166.60 -309.40STSO-987 soil 01/01103 Cs-1 37 849.50 ± 3.30 832.00 ± 83.20 582.40 - 1081.60STSO-987 soil 01/01103 K-40 716.50 ±12.80 652.00 ± 65.20 456.40 -847.60STSO-987 soil 01/01/03 Mn-54 148.76 ± 2.84 137.00 ± 13.70 95.90 - 178.10STSO-987 soil 01101/03 Ni-63 597.10 ± 23.50 770.00 ± 77.00 539.00 - 1001.00STSO-987 soil 01/01/03 Pu-238 67.05 ± 3.10 66.90 ± 6.70 46.83 - 86.97STSO-987 soil 01/01103 Pu-239/40 52.80 ± 3.60 52.70 ± 5.30 36.90 - 68.50STSO-987 soil 01/01103 Sr-90 609.50 ± 9.80 714.00 ± 71.40 499.80 - 928.20STSO-987 soil 01/01/03 U-233/4 99.50 ± 7.60 89.00 ± 8.90 62.30 - 115.70STSO-987 soil 01/01/03 U-238 508.60 ± 42.20 421.00 ±42.10 294.70 - 547.30STSO-987 soil 01/01/03 Zn-65 492.70 ± 28.10 490.00 ± 49.00 343.00 - 637.00
a Results obtained by Environmental, Inc. ,Midwest Laboratory as a participant in the Department of Energy'sMixed Analyte Performance Evaluation Program, Idaho Operations office, Idaho Falls, Idaho
b All results are In Bqlkg or BqlL as requested by the Department of Energy.c MAPEP results are presented as the known values and expected laboratory precision (1 sigma,1 determination)
and control limits as defined by the MAPEP.
LII~
I
IIIIIA6-1
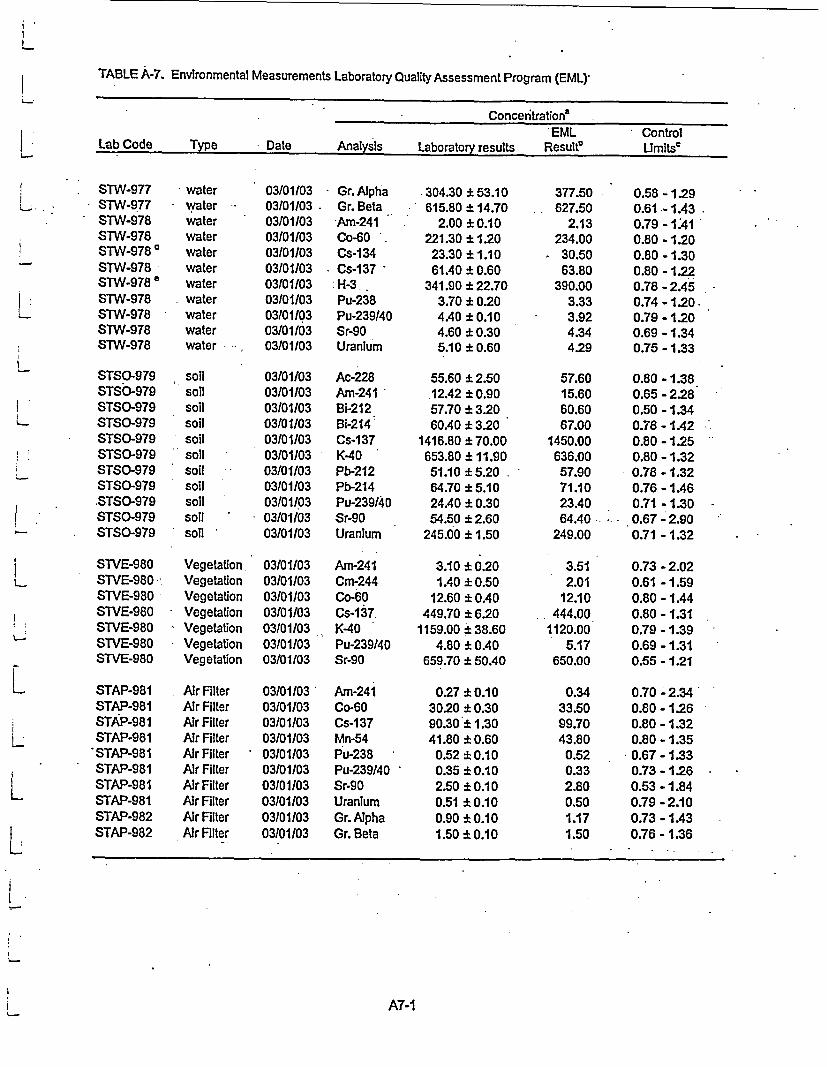
TABLE A-7. Environmental Measurements Laboratory Quality Assessment Program (EML)-
- Concentration'EML Control
Lab Code Type Date Analysis Laboratory results Result0 Ulmits'
STW-977STW-977STW-978STW-978STW-978 a
STW-978STW-978 'STW-978STW-978STW-978STW-978
*water* water
waterwaterwaterwaterwaterwaterwaterwaterwater
03/0110303/011030310110303101103031011030310110303/011030310110303/0110303/0110303/01/03
* Gr. Alpha* Gr. Beta
nAm-241Co-60 -
Cs-134. Cs-137 -I H-3Pu-238Pu-239140Sr-90Uranium
.304.30 * 53.10615.80 t 14.70
2.00 ± 0.10221.30 1.2023.30 i 1.1061A.0 i 0.60
341.90 * 22.703.70 * 0.204.40 * 0.104.60 * 0.305.10 ± 0.60
377.50* . 627.50
2.13234.00
30.5063.80
390.003.333.924.344.29
0.58 -1.290.61 -1.430.79 - 1C410.80 -1.200.80 -1.300.80 - 1.220.78 -2.450.74 -1.20.0.79 -1.200.69 -1.340.75 -1.33
STSO-979STSO-979STSO-979STSO-979STSO-979STSO-979STSO-979STSO-979.STSO-979STSO-979STSO-979
soilsoilsoilsoilsoilsoilsoilsoillsoilsoilsoil
03/0110303101/0303101/0303/01/0303/01/0303101/0303/01/0303/0110303/01/0303/0110303/01103
Ac-228Am-241 -Bi-212Bi-214Cs-137K-40Pb-212Pb-214Pu-239140Sr-90Uranium
Am-241Cm-244Co-60Cs-137.K-40Pu-239/40Sr-90
55.60 I 2.50.12A2 ± o.9057.70 * 3.2060.40 * 3.20
1416.80 * 70.00653.80 1 11.9051.10 ± 5.2064.70 ± 5.1024.40 ± 0.3054.50 ± 2.60
245.00 * 1.50
57.6015.6060.6067.00
1450.00636.0057.9071.1023.4064.40
249.00
0.80 - 1.380.65 - 2.280.50 -1.340.78 - 1.420.80 -1.250.80 -1.320.78 - 1.320.76 - 1.460.71 -1.300.67 -2.900.71 -1.32
STVE-980STVE-980.STVE-980STVE-980STVE-980STVE-980STVE-980
VegetationVegetationVegetationVegetationVegetationVegetationVegetation
03/01/0303/01/0303101/0303/0110303101/0303/0110303101/03
3.10 * 0.201.40 A 0.50
12.60 OAO449.70 * 6.20
1159.00 *38.604.80 ± OAO
659.70 * 50.4
3.512.01
12.10444.00
1120.005.17
650.00
0.73 -2.020.61 -1.590.80 - 1.440.80 - 1.310.79 -1.390.69 - 1.310.55 -1.21
STAP-981STAP-981STAP-981STAP-981
*STAP-981STAP-981STAP-981STAP-981STAP-982STAP-982
Air FilterAir FilterAir FilterAir FilterAir FilterAir FilterAir FilterAir FilterAir FilterAir Filter
03101/0303/0110303/0110303/0110303101/0303101/0303101103031011030310110303101103
Arn-241Co-60Cs-137Mn-54Pu-238Pu-239140Sr-90UraniumGr. AiphaGr. Beta
0.27 *0.1030.20 * 0.3090.30 * 1.3041.80 * 0.600.52 * 0.100.35 * 0.102.50 * 0.100.51 *0.100.90 * 0.101.50 ± 0.10
0.3433.5099.7043.800.520.332.800.501.171.50
0.70 - 2.340.80 -1.260.80 - 1.320.80 - 1.35
* 0.67 - 1.330.73 -1.260.53 -1.840.79 - 2.100.73 -14A30.76 - 1.36
A7-1

I I
I
TABLE A-7. Environmental Measurements Laboratory Quality Assessment Program (EML)
Concentrationa- EML Control
Lab Code Type Date Analysis Laboratory results Resultb Limits'
STW-992 water 09/02103 Am-241 9.78 ± 0.32 8.76 0.79 - 1.41The September, 2003 results are preliminary. Control limits used were taken from the March, 2003 data.Control limits may vary slightly when the final study Is published.STW-992 water 09/02103 Co-60 468.30 : 4.10 513.00 0.80 -1.20STW-992 water 09/02103 Cs-134 53.90 * 0.80 63.00 0.80 - 1.30STW-992 water 09/02103 Cs-137 76.10 i 1.40 80.30 0.80 - 1.22STW-992 water 09102103 H-3 355.20 :: 12.80 446.30 0.78 - 2A5STW-992 water 09/02103 Pu-238 1.71 :1 0.07 2.07 0.74 -1.20STW-992 water 09/02103 Pu-239140 4.24 ±: 0.01 4.99 0.79 - 1.20STW-992 water 09102/03 Sr-90 6.70 ± 0.50 7.04 0.69 - 1.34STW-992 water 09102103 Uranium 6.03 ± 0.14 5.69 0.75 - 1.33STW-993 water 09/02103 Gr. Alpha 688.00 ±t 7.60 622.00 0.58 - 1.29STW-993 water 09/02103 Gr. Beta 1985.00 * 111.00 1948.00 0.61 - 1A3
STSO-994 soil 09/02103 Am-241 19.70 ± 1.50 18.40 0.65 -2.28STSO-994 soil 09/02103 Cs-137 1928.00 ± 19.00 1973.00 0.80 -1.25STSO-994 soil 09/02103 K-40 533.00 ± 79.00 488.00 0.80 - 1.32STSO-994 soil 09/02/03 Pu-238 15.30 ±0.80 14.60 0.59 -2.88STSO-994 soil 09102103 Pu-239/40 32.50 ± 2.30 30.40 0.71 - 1.30STSO-994 soil 09/02103 Sr-90 69.80 ± 2.30 80.30 0.67 - 2.90STSO-994 soil 09/02/03 Uranium 228.30 ±17.10 259.30 0.71 - 1.32
STAP-995 Air Filter 09/02/03 Am-241 0.64 ± 0.05 0.44 0.70 -2.34STAP-995 Air Filter 09/02103 Co-60 48.50 ± 0.40 55.10 0.80 - 1.26STAP-995 Air Filter 09/02/03 Cs-137 51.20 ± 1.10 54.80 0.80 - 1.32STAP-995 Air Filter 09102/03 Mn-54 53.70 ± 1.10 58.00 0.80 -1.35STAP-995 Air Filter 09/02103 Pu-238 0.24 ± 0.05 0.23 0.67 - 1.33STAP-995 Air Filter 09/02/03 Pu-239140 0.41 ± 0.10 0.40 0.73 -1.26STAP-995 Air Filter 09/02103 Sr-90 1.90 ± 0.10 2.06 0.53 - 1.84STAP-995 Air Filter 09/02103 Uranium 0.80 ± 0.06 0.82 0.79 - 2.10STAP-996 Air Filter 09/02103 Gr. Alpha 3.23 ± 0.07 3.11 0.73 - 1.43STAP-996 Air Filter 09/02103 Gr. Beta 4.18 ± 0.03 3.89 0.76 - 1.36
a Results are reported in Bq/L with the following exceptlons: Air Filters (Bq/Filter), Soil and Vegetation (Bqlkg).b The EML result listed is the mean of replicate determinations for each nucilde ± the standard error of the mean.c Control limits are reported by EML as the ratio of Reported Value I EML value.d A low bias for Cs-134 activity has been observed in the past. No errors have been found In the library or efficiency.
Additional spike analyses will be performed and a correction factored into the calculation.Reporting error.
A7-2
I
LiI
.1
IILlIL
L
LILL

APPENDIX B
._ - DATA REPORTING CONVENTIONS
LL
! B-I

Data Reoorting Conventions
1.0. All activities, except gross alpha and gross beta, are decay corrected to collection time or the end of thecollection period. L
2.0. Single Measurements
Each single measurement is reported as follows: x i s
where: x = value of the measurement;
s = 2s counting uncertainty (corresponding to the 95% confidence level).
In cases where the activity is less than the lower limit of detection L, it is reported as: <L,
where L = the lower limit of detection based on 4.66s uncertainty for a background sample.
3.0. Duplicate analyses
3.1 Individual results: For two analysis results; x1 + sl and X2 ± S2
Reported result: x+t s; where x= (1/2) (x1 + x2) and s = (1/2) Si j3.2. Individual results: <L1, <L2 Reported result: <L, where L = lower of Li and L2 L3.3. Individual results: x ±sa, <L Reported result: x s ; if x ZL; < otherwise.
4.0. Computation of Averages and Standard Deviations
4.1 Averages and standard deviations listed in the tables are computed from all of the individual measurementsover the period averaged; for exampLe, an annual standard deviation would not be the average of quarterly Lstandard deviations. The average x and standard deviation s of a set of n numbers xj, x2 .. . xn aredefined as follows: I
\jj1 n-i
4.2 Values below the highest lower limit of detection are not included in the average.
4.3 If all values in the averaging group are less than the highest LLD, the highest LLD Is reported.
4.4 If all but one of the values are less than the highest LLD, the single value x and associated two sigma errorIs reported.
4.5 In rounding off, the following rules are followed:
4.5.1. If the number following those to be retained is less than 5, the number is dropped, and the retainednumber s are kept unchanged. As an example, 11.443 Is rounded off to 11.44. L
4.5.2. If the number following those to be retained is equal to or greater than 5, the number is dropped andthe last retained number is raised by 1. As an example, 11.445 Is rounded off to 11.45. L
B-2

APPENDIX C
Maximum Permissible Concentrations
of Radioactivity in Air and Water
Above Background in Unrestricted Areas
L
L
L
! C-1
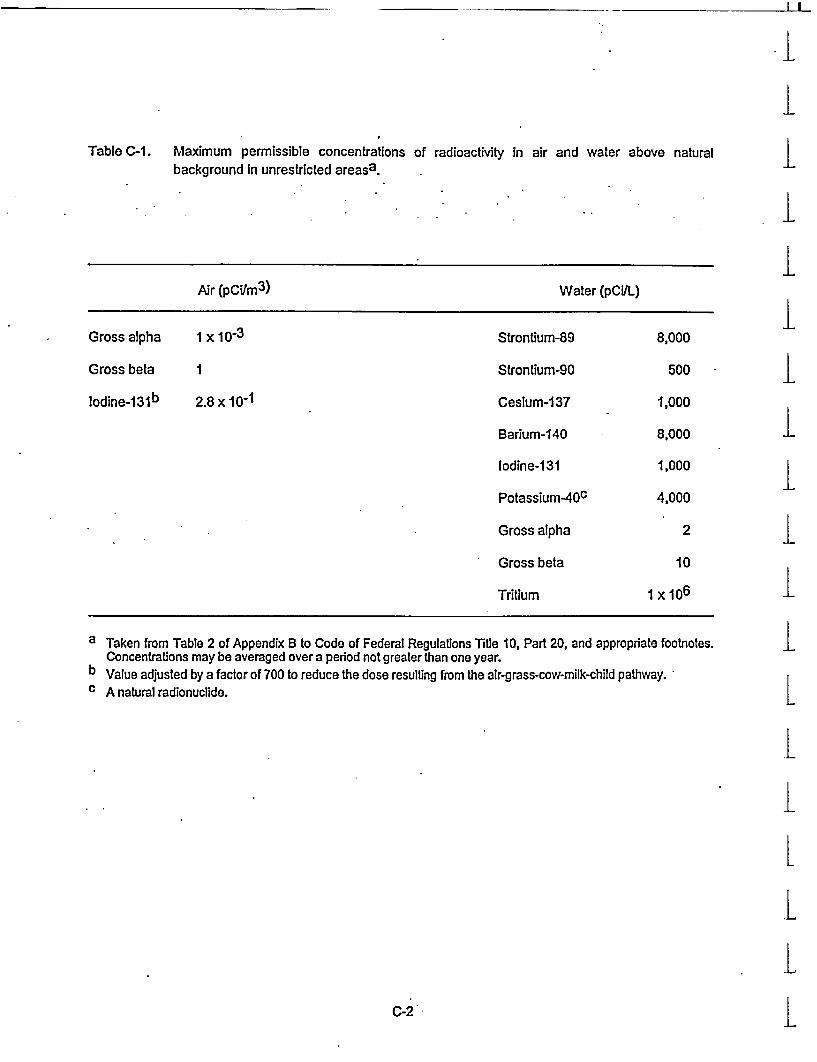
I I
iI
Table C-1. Maximum permissible concentrations of radioactivity In air and water above naturalbackground In unrestricted areasa. I
II
Air (pCIm 3) Water (pCVL)
IGross alpha
Gross beta
Iodine-13 1b
1 x10⁻³ Strontium-89 8,000
I Strontium-90 500
1,000
I2.8 x 10-1 Cesium-137
IBarium-140
Iodine-131
Potassium-40 0
Gross alpha
Gross beta
Tritium
8,000
1,000
I4,000
2
10
I x 106
I
Ia Taken from Table 2 of Appendix B to Code of Federal Regulations Title 10, Part 20, and appropriate footnotes.
Concentrations may be averaged over a period not greater than one year.b Value adjusted by a factor of 700 to reduce the dose resulting from the air-grass-cow-milk-child pathway.c A natural radionuclide.
I
LI-I-LIA-A-C-2

ANNUAL REPORT PART I]DATA TABULATIONS
''GRAPHS AND ANALYSES
I

t Environmental, Inc.Midwest Laboratoryan Aflegheny Tedmuobgles Co.
700 Landweir Road * Ncthhvoo IL 60062-2310ph. (847) 564-0700 fax (847) 564-4517
REPORT TO
NUCLEAR MANAGEMENT CO, LLC
RADIOLOGICAL MONITORING PROGRAM FORTHE KEWAUNEE NUCLEAR POWER PLANT
KEWAUNEE, WISCONSIN
ANNUAL REPORT- PART 11DATA TABULATIONS AND ANALYSES
January 1 to December 31, 2003
Prepared and submitted by
ENVIRONMENTAL, Inc.Midwest LaboratoryProject No. 8002
Approved: X
ra nagerStanley F. BakerRadiation Protection Mgr., KNPP
IL
LPREFACE
The staff members of Environmental, Inc., Midwest Laboratory were responsible for theacquisition of data presented in this report. Samples were collected by the personnel of LEnvironmental, Inc., Midwest Laboratory and the Kewaunee Nuclear Power Plant.
1-
ii 1

TABLE OF CONTENTS
Section PagePrefctio ............................................................................................................. IaaPreface ............................................................................ ii
List of Figures ...................................... iv
List of Tables ............................................................................. v
1.0 INTRODUCTION ............................................................................. 1
2.0 GRAPHS OF DATA TRENDS .............................................................................. 7
3.0 DATA TABULATIONS ............................................................................ 30
Appendices
A Radiochemical Analytical Procedures ............................. A-1
iii

I I
LLIST OF FIGURES l
PaneNo. Caption
1 Sampling locations, Kewaunee Nuclear Power Plant ....................... 3
234567
8910111213
Airborne particulates, weekly averages; gross beta. Location K-1fLocation K-2Location K-7Location K-8LocationK-31Location K-16
....................... 8
....................... 8
....................... 9
....................... 9
....................... 10
....................... 10
....................... 11
.......................
....................... 12....................... 12....................... 13....................... 13
IL
Airborne particulates, gross beta, monthly averages, Location K-1fLocation K-2Location K-7Location K-8LocationK-31Location K-16
11,14
15
161718192021
Well water, gross alpha in total residue, Location K-lgLocation K-Ih
Well water, gross beta in total residue, Location K-1gLocation K-IhLocation K-10Location K-I1Location K-12Location K-13
....................... 14
....................... 14
....................... 15
....................... 15
....................... 16
....................... 16
....................... 17
....................... 17
ji
I
I22232425262727
Milk, strontium-90 activity, Location K-3Location K-4Location K-5Location K-6Location K-12Location K-19Location K-28
....................... 18
....................... 18
....................... 19
....................... 19
....................... 20
....................... 20....................... 21
I
I29313335373941
29313335373941
424344
Surface water, gross beta in suspended and dissolved solids, Location K-I aLocation K-lbLocation K-IdLocation K-IeLocation K-9Location K-14aLocation K-1k
Surface water, gross beta in total residue, Location K-I aLocation K-lbLocation K-IdLocation K-leLocation K-9Location K-14aLocation K-1 k
....................... 22
....................... 23
....................... 24
....................... 25
....................... 26
....................... 27
....................... 28
....................... 22
....................... 23
....................... 24
....................... 25
....................... 26
....................... 27
....................... 28
....................... 29
....................... 29
....................... 29
I
I
I.I.1Surface water, tritium activity, Location K-Id
Location K-14aLocation K-9
Iiv
I

LIST OF TABLES
No. Caption Page
I Sampling locations, Kewaunee Nuclear Power Plant 4
2 Type and frequency of collection 5
3 Sample codes used In Table 2 5
Airbome particulates and Iodine, analysis for gross beta and iodine-1314 Location K-if .315 Location K-2.326 Location K-7 .337 Location K-8 .348 Location K-31 .359 Location K-I6 .36
10 Airborne particulates, gross beta, monthly averages, minima and maxima 37
11 Airbome particulates, quarterly composites of weekly samples, analysis for gamma-emitting 39isotopes
12 Ambient gamma radiation (TLD), quarterly exposure 42
13 Precipitation, collected at Location K-11, analysis for tritium 43
14 Milk, analysis for Iodine-131 and gamma emitting Isotopes 44
15 Milk, analysis for strontium-89, strontium-90, calcium and potassium-40 48
16 Well water, analysis for gross alpha, gross beta, potassium-40, and gamma-emitting Isotopes 52
17 Well water collected at K-1 g, analysis for tritium, strontium-89, and strontium-90 55
18 Domestic meat, analysis of flesh for gross alpha, gross beta, and gamma-emitting Isotopes 56
19 Eggs, analysis for gross beta, strontium-89, strontium-90, and gamma-emitting isotopes 57
20 Vegetables, analysis for gross beta, strontium-89, strontium-90, and gamma-emitting Isotopes 58
21 Cattlefeed, analysis for gross beta, strontium-89, strontium-90, and gamma-emitting Isotopes 60
22 Grass, analysis for gross beta, strontium-89, strontium-90, and gamma-emitting Isotopes 62
23 Soil, analysis for gross alpha, gross beta, strontium-89, strontium-90 and gamma-emitting isotopes 65
24 Surface water, analysis for gross beta, potasslum-40, and gamma-emitting isotopes 68
25 Surface water, analysis for tritium, strontium-89, and strontium-90 84
26 Fish samples, analysis for gross beta, strontium-89, strontium-90, and gamma-emitting Isotopes 86
27 Slime, analysis for gross beta, strontium-89, strontium-90 and gamma emitting isotopes 87
28 Sediments, analysis for gross beta, strontium-89, strontium-90, and gamma-emitting isotopes 89
v

II
LL
1.0 INTRODUCTION
The following constitutes Part II of the final report for the 2003 Radiological Monitoring Programconducted at the Kewaunee Nuclear Power Plant (KNPP), Kewaunee, Wisconsin.
Included are tabulations of data for all samples collected in 2003, graphs of data trends anddescriptions of radiochemical procedures. A summary and interpretation of the data presentedhere are published in Part I of the 2003 Annual Report on the Radiological Monitoring Program forthe Kewaunee Nuclear Power Plant.
NOTE: Page 2 is intentionally left out.
L.
L1'1
IIi'I1I.III1iI
1
I

.M;9
-3flA
�ALm�m
I
I
I
____II.,� a
1��
C
CN
0'
a
a 433
I
1* ,.-\ ..:: x r
-- saWa LOCATSO Ad Sy: ii :'-\;
: . - . . ......... . .. :.: .. ......-'-'-:R Fgure 1. Sampling locations, Ke'w'aunee Nuclear Power Plant'
3

II
KEWAUNEE 11L
Table 1. Sampling locations, Kewaunee Nuclear Power Plant.
Distance (miles)"Code Typea and Sector Location
K-1K-1aK-1bK-1cK-IdK-ieK-ifK-1gK-1 hK-lJK-1 kK-2K-3K-5K-7K-8K-9
K-1 0K-1IK-13K-14K-15K-16K-17K-20K-23K-24K-25K-26K-27K-28K-29K-30K-31K-32K-34K-36K-37K-38K-39 c
I 0.62 N1 0.12N1 0.10N1 0.10E1 0.12 S1 0.12 S1 0.06 W
0.12 NW1 0.10S1 0.60 SWC 9.5 NNEC 6.0N1 3.5 NNW1 2.75 SSWC 5.0 WSWC 11.5 NNE
1 1.5 NNEI 1.0 NWC 3.0 SSW1 2.5SC 9.25 NWC 26 NW1 4.25 W1 2.5N1 0.5W1 5.45 N1 2.0 WSWC 10.7 SSW1 1.5 NWC 26 NW1 5.75 W1 1.00NC 6.25NNWC 11.50 N1 2.5N1 8.5 mi. NNE
4.0 mi. N3.8 mi. WNW3.0 ml. N
OnsiteNorth CreekMiddle Creek500' north of condenser dischargeCondenser dischargeSouth CreekMeteorological TowerSouth WellNorth Well500' south of condenser dischargeDrainage Pond, south of plantWPS Operations Building in KewauneeLyle and John Siegmund Farm, N2815 Hy 12, KewauneeEd Paplham Farm, E4160 Old Settlers Rd, KewauneeRon Zimmerman Farm, 17620 Nero Road, Two RiversSaint Mary's Church, Tisch MillsRostok Water Intake for Green Bay, Wisconsin,
two miles north of KewauneeTurner Farm, Kewaunee siteHarlan Ihlenfeld Farm, N879 Hy 42, KewauneeRand's General StoreTwo Creeks Park, 2.5 miles south of siteGas Substation, 1.5 miles north of StangelvilleWPS Division Office Building, Green Bay, WisconsinJansky's Farm, N885 Tk B, KewauneeCarl Struck Farm, Lakeshore Dr, Kewaunee0.5 miles west of plant, Kewaunee siteFectum Farm, N2653 Hy 42, KewauneeWotachek Farm, 4819 E. CtyTk BB, DenmarkBertler's Fruit Stand (8.0 miles south of 'BB")Schlies Farm, E4298 Sandy Bay Rd, KewauneeHansen Dairy, Green Bay, WisconsinKunesh Farm, Route 1, KewauneeEnd of site boundaryE. Krok SubstationPiggly Wiggly, 931 Marquette Dr., KewauneeLeon and Vicki Struck, N1549 Lakeshore Dr., KewauneeFiala's Fish Market, KewauneeGary and Ann Hardtke, E4282 Old Settlers Road, KewauneeDave Sinkula Farm, N890 Town Hall Road, KewauneeFrancis and Sue Wojta, N1859 Lakeshore Dr., Kewaunee
IL1
a I = indicator, C = control.b Distances are measured from reactor stack.
c Location added to program in July, 2003.
III
4 i

KEWAUNEE
Table 2. Type and frequency of collection.
Location Weekly Biweekly Monthly Quarterly Semiannually. Annually
K-1 a _ SW _ SLt.K-lb _ SW GRa SLtK-i c _ __ __ _ s_ _
K-1d _ SW Fl BSt, SL _ _ iK-I e _ SW SL t.iK-1f AP Al GRaTLD SOK-1 g WWK-1h WWK-1J BS"
K-1 k SW SLK-2 AP Al TLDK-3 Ml, GRa, TLD, CF soK-5 _ _ _ Mi' GRa, TLD, CF- soK-7 AP Al TLDK-8 AP Al TLDK-9 SW __S_,_ _SL
K-10 WWK-1l PR WWK-13 WWK-14 SW BSb. SLK-15 TLDK-16 AP Al TLD _
K-17 TLD _ VEK-20K-23 GRNK-24 EG DMK-25 Mir GR8, TLD. CF,.WW SO . -
K-26 VEK-27 TLD, EGK-28 Ml,K-29 DM,VEK-30 TLDK-31 AP Al TLDK-32 . EG DMK-34 Ml' GRa' CF SO DMK-36 FlK-37 Mr GRa. TLD. CF soK-38 MI GRa, CFl soK-39 Mr GRS, cF_ so
'Three times a year, second, third and fourth quarters. bTo be collected in May and November.' Monthly from November through April; semimonthly May through October.d First quarter (January, February. March) only.
Table 3. Sample Codes:
AP Alrbome particulates Ml MilkAl Airbome Iodine PR PrecipitationBS Bottom (river) sediments SL SlimeCF Cattlefeed SO SoilDM Domestic Meat SW Surface waterEG Eggs TLD Thermoluminescent DosimeterFl Fish VE Vegetables
GRN Grain WW Well waterGR Grass
Note: Page 6 Is Intentionally left out.
5

II
1KEWAUNEE
GRAPHS OF DATA TRENDS
Note: Conventions used in trending data.The following conventions should be used in the interpretation of the graphs of data trends:1. Both solid and open data points may be used in the graphs. A solid point indicates an activity,
an open point, a lower limit of detection (LLD) value.2. Data points are connected by a solid line. A break in the plot indicates missing data.
I.
L.LL
1~*1-1
LI1I
IItI
I7

Kewaunee
Air Particulates - Gross Beta
0.100
MC.)I
0.010
0.001
I I III III I I I .
D>ALCIi
J F M A M J J A S 0 N D
Figure 2. Location K-If (weekly samples, 2003).
0.100
Ce)
0
0.010
0.001
S FI
l l _- lI
I I
_ = N _== =J F M A M J J A S 0 N D
Figure 3. Location K-2 (weekly samples, 2003).
8

I I L
LIKewaunee
Air Particulates - Gross Beta L
L0.100
E
0.
0.010
0.001
_ I I II
I - >Ix I i
0
II1
IJ F M A M J J A S 0 N D
Figure 4. Location K-7 (weekly samples, 2003). I
I0.100
E
0.010
0.001
~I I I I l_== f EL _ : =<I
== I I ; ==== = rS r = =I
1IL.
IJ F M A M J J A S 0 N D
IFigure 5. Location K-8 (weekly samples, 2003).
I
i9

Kewaunee
Air Particulates - Gross Beta
0.100
co
0.010
0.001J F M A M J J A S 0 N D
Figure 6. Location K-31 (weekly samples, 2003).
0.100
c~)
0.
0.010
0.001
_ =-I =====I-=
FIJ F M A M - J :. J A S 0 N D
Figure 7. LocaUon K-16 (weekly samples, 2003).
10
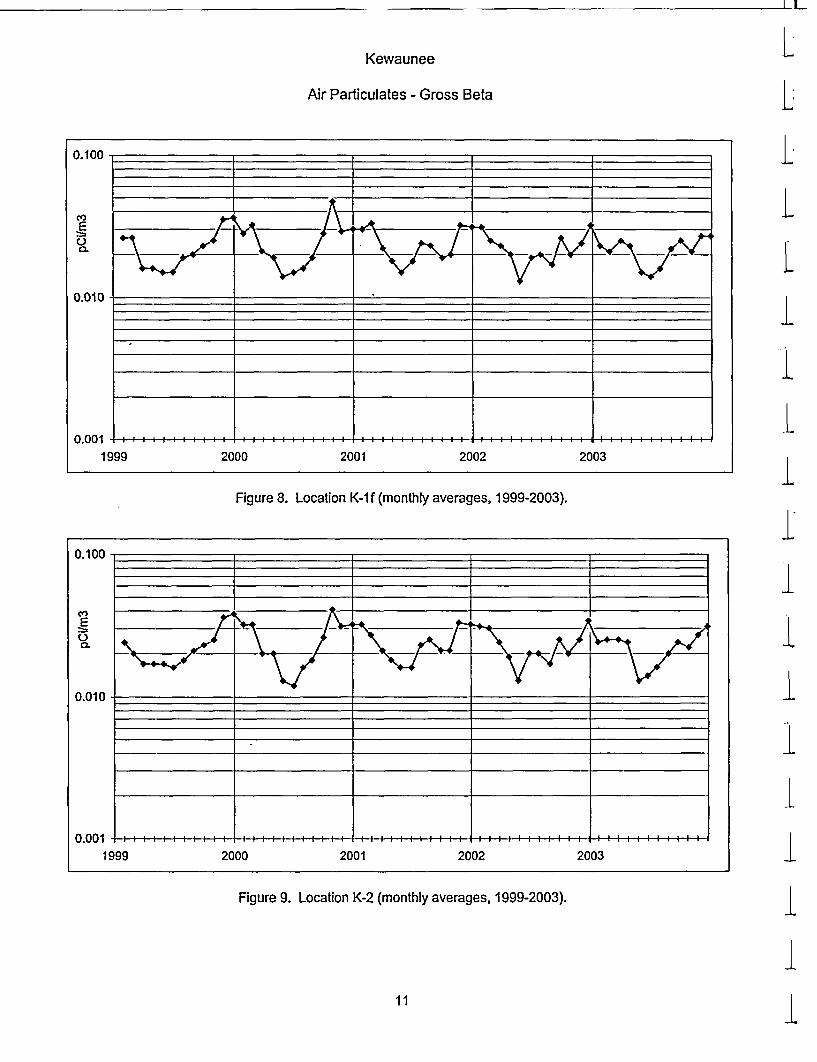
I_- - IL
Kewaunee
Air Particulates - Gross Beta
0.100
Cn,E
CL
0.010
4
LLI.I
.001
19992 0 02000 2001 2002 2003
Figure 8. Location K-If (monthly averages, 1999-2003).
0.100
I . I I I
C-)
0.010
I
i
I0.001 91-
I 9S. . . . . . . . . . . . . . . . . . . . . . . . . . . . . . . . . . . . . . . . . . . . . . . . . . . . . . . . . . .l l l l l l l l l
39 2000 2001 2002 2003
Figure 9. Location K-2 (monthly averages, 1999-2003).
11
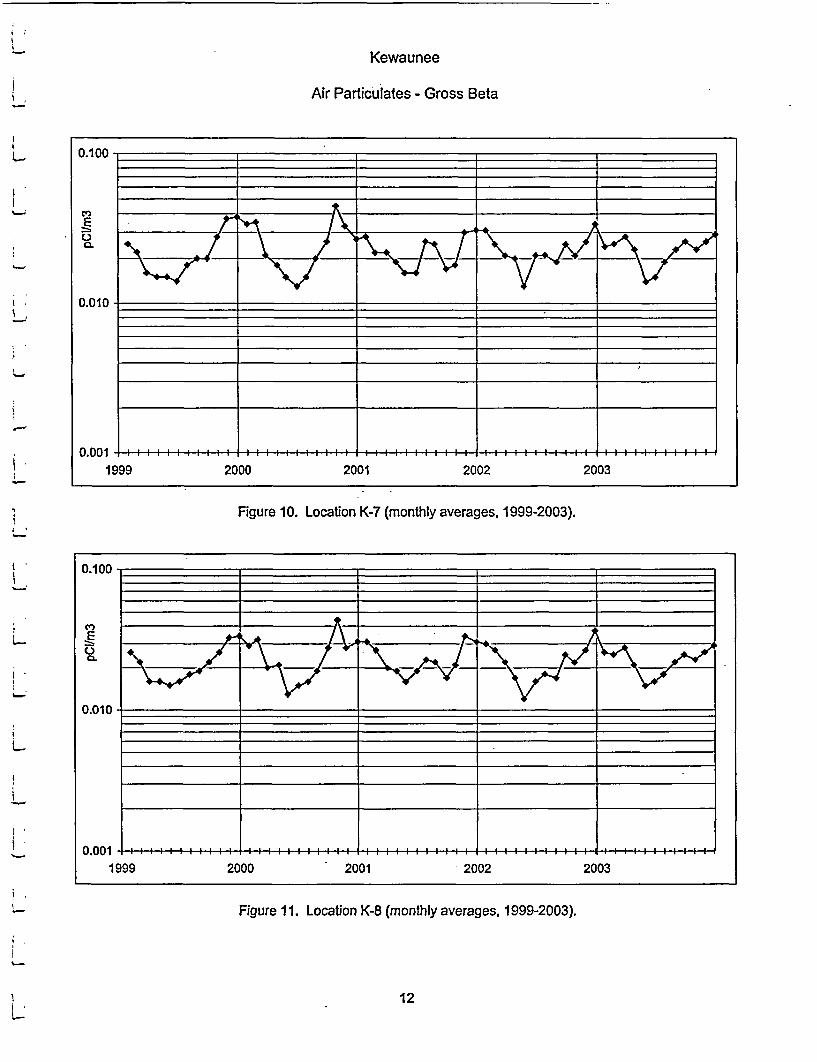
Kewaunee
Air Particulates - Gross Beta
0.100
0C.,
0.010
0.001 14--1999 2000 2001 2002 2003
Figure 10. Location K-7 (monthly averages, 1999-2003).
0.100
0
0.010
0.001 --1999 2000 2001 2002 2003
Figure 11. Location K-8 (monthly averages, 1999-2003).
12

Kewaunee
Air Particulates - Gross Beta
0.100 1
- -t 4
E
0.010
I III III II I 111111111 I I ii 111111 11111111111 Il.lilailliin -nn
1999 20022000 2001 2003
Figure 12. Location K-31 (monthly averages, 1999-2003).
0.100 l
-4- -4- 4 4
E
0.
0.010
iI
f V 1*41\ A fl
-E 0 Of i
0
0 nf01999 2000 2001 2002 2003
Figure 13. Location K-16 (monthly averages, 1999-2003).
13

Kewaunee
WELL WATER-GROSS ALPHA
10.0
8.0
6.0
0
4.0
2.0
0.0 _-1999 2000 2001 2002 2003
Figure 14. Location K-1g. Total Residue. Quarterly collection.
10.0
8.0
6.0
CL
4.0
2.0
46-
V
/A
V
on1999 2000 2001 2002 2003
Figure 15. Location K-1h. Total Residue. Quarterly collection.
Note: An open data point Indicates activity less than the lower limit of detection (LLD).
14

_I__ l
Kewaunee
WELL WATER-GROSS BETA
10
8
6-j
00.
4
2
AALA!-N 7.Y- 17
A1999 2000 2001 2002 2003
Figure 16. Location K-1g. Total Residue. Quarterly collection.
10
8
6-J
0.
2 - 2
01999 2000 2001 2002 2003
Figure 17. Location K-1h. Total Residue. Quarterly collection.
INote: An open data point indicates activity less than the lower limit of detection (LLD).
15

Kewaunee
WELL WATER-GROSS BETA
10 -_
8- _
6-_
0AA3
* I + *1-
4 + +
/ A
2
1
AI
999 2000 2001 2002 2003
Figure 18. Location K-10. Total Residue. Quarterly collection.
10
8
6-j
0.
4
2
t I -I-
n
1999 2000 20032001 2002
Figure 19. Location K-11. Total Residue. Quarterly collection.
Note: An open data point Indicates activity less than the lower limit of detection (LLD).
16

I I
Kewaunee
WELL WATER-GROSS BETA I
10 -
O-60.
4
2-
01999 2000 2001 2002 2003
IIIIII
Figure 20. Location K-25. Total Residue. Quarterly collection.
10
8
6-lJS:L-0
4
2
I
I
IIIII
____ ___ ___ ___ ___ ___ ___ ___ ___ ___ ____ ___ ___ ___ ___ ___ ___ ___ ___ ___ ____ ___ ___ ___ ___ ___ ___ ___ ___ ___ I __ ___ ___ ___ ___ ___ ___ ___ ___ ___ _ __ ___ ___ ___ ___ ___ ___ ___ ___ ___
V
1999 2000 2001 2002 2003
Figure 21. Location K-13. Total Residue. Quarterly collection.
Note: An open data point indicates activity less than the lower limit of detection (LLD).
I
17I

KewauneeMilk - Strontium-90
10.0
Co.
1.0
0.1 4-1999 2000 2001 2002 2003
Figure 22. Milk samples. Location K-3.
I
L
) .
4-
is
10.0
C.0
1.0
0.1 4-1999 2000 2001 2002 2003
Figure 23. Milk samples. Location K-5.
Note: An open data point Indicates activity less than the lower limit of detection (LLD).
18

I I
KewauneeMilk - Strontium-90
10.0
-j
1.0
0.1 4-1999 2000 2001 2002 2003
Figure 24. Milk samples. Location K-25.
10.0
-j0.
1.0
0.1 4-1999 2000 2001 2002 2003
Figure 25. Milk samples. Location K-28.
19

KewauneeMilk -'Stronhtium-90
10.0
a.
1.0
0.1
1999 2000 2001 2002 2003
Figure 26. Milk samples. Location K-34.
10.0
C.0
1.0
0.1 1-1999 2000 2001 2002 2003
Figure 28. Milk samples. Location K-38.New location; first collection, March, 2002
20

_ _ _ _ _ _ _ _ _ _ _I I
KewauneeMilk - Strontium-90
10.0 I _
-j.-.
C.)CL
1.0 __
0.11999 2000 2001 2002 2003
L1
IIIII
Figure 29. Milk samples. Location K-39.New location; first collection, July, 2003
21
I
IIIIIIII1I

Kewaunee
Surface Water - Gross Beta
100.0
10.0
0.
1.0
0.1 1-1999 2000 2001 2002 2003
Figure 29. Surface water. North Creek, Onsite (K-1a).
100.0
10.0
00.
1.0 4-1999 2000 2001 2002 2003
Figure 30. Surface water. - North Creek, Onsite (K-1a).-Total Residue
22

I I
LKewaunee
Surface Water - Gross Beta L
100.0
10.0
0.0
1.0
0.1 I-1999 2000 2001 2002 2003
Figure 31. Surface water. Middle Creek, Onsite (K-1b).
I100.0
4 + 1- t
I
I
I10.0
-Ij
0a. Feat-KX r ' It
1.0 I4 4 4 +
1999 I2000 2001 2002 2003
Figure 32. Surface water . Middle Creek. Onsite (K-1b).Total Residue
23
I
I
I

Kewaunee
Surface Water Gross Beta
100.0
10.0
aCL
1.0 *
0.1_1999 2000 200120200 2002 2003
Figure 33. Surface water. Lake Michigan, condenser discharge, Onsite (K-1d).
100.0
4- I- * *
10.0
Ua. A it
Av I9 - V4
i. -4
1999 2000 2001 2002 2003
Figure 34. Surface water. Lake Michigan, condenser discharge, Onsite (K-1 d).Total Residue
24

I I- -
1Kewaunee
Surface Water - Gross Beta L
100.0
10.0
-j
CL
1.0
O.1 i-1999 2000 2001 2002 2003
Figure 35. Surface water. South Creek, Onsite (K-1e).
I100.0-
10.0 -ki
CL = - \ ff1.0 I
1999 2000 2001 2002 2003
II
I
IIFigure 36. Surface water. South Creek, Onsite (K-1 e).
Total Residue
25
I
I
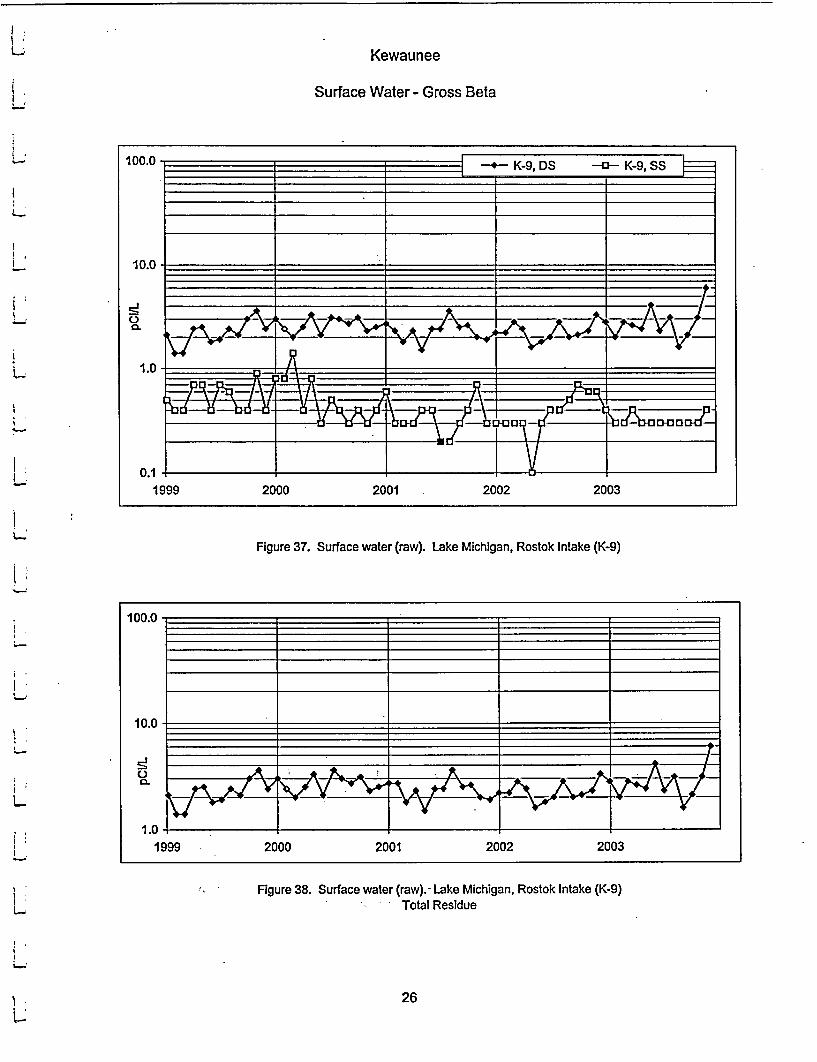
Kewaunee
Surface Water - Gross Beta
Figure 37. Surface water (raw). Lake Michigan, Rostok Intake (K-9)
100.0
10.0
C.
1.0 4-1999 2000 2001 2002 2003
Figure 38. Surface water (raw).- Lake Michigan, Rostok Intake (K-9)- Total Residue
26

_I_ l -
Kewaunee
Surface Water - Gross Beta
100.0
10.0
-J
00.
1.0
0.1 4-1999 2000 2001 2002 2003
Figure 39. Surface water. Lake Michigan, Two Creeks Park (K-14a).
I100.0
10.0
-J0.
1.0 1-
1999 2000 2001 2002 2003
Figure 40. Surface water. Lake Michigan, Two Creeks Park (K-14a).Total Residue
27

Kewaunee
Surface Water Gross Beta
L-
!,:
I'
i
I .
i-
tL
LI
!4-
L-
100.0
10.0
C1.
1.0
0.1 4-1999 2000 2001 2002 2003
Figure 41. Surface water. School Forest Pond (K-1 k).
Figure 42. Surface water. School Forest Pond (K-1k).Total Residue
28

_ _ _ _ _ _ _ _ _ _ _ _ _ _ _ _ _ _ _ _ _I I
Kewaunee
Surface Water - Tritium
10000
-J
1.0C.
1000
. I
- 0 D-- O.- 9 0
1
I
100
1*999 2000 2001 2002 2003
Figure 43. Surface water. Lake Michigan, condenser discharge, K-1d. Quarterly collection.
10000 -=
-J. =.0.
1000 -_
10091999
4 + 4- 4-
.1iI
4 4- 4- -4---
+ +
2000 2001 2002 2003
Figure 44. Surface water. Lake Michigan, Two Creeks Park, K-14a. Quarterly collection.
10000
-j0a.
1000
_
.
__sheer=N I
inn -
1999 2000 2001 2002 2003
Figure 45. Surface water. Lake Michigan, Rostok Intake, K-9. Quarterly collection.
29

KEWAUNEE
6I
6.0 DATA TABULATIONS
30

I I
KEWAUNEE
Table 4. Airbome particulates and charcoal canisters, analyses for gross beta and iodine-131a.Location: K-ifUnits: pCi/m3
Collection: Continuous, weekly exchange.
Date Volume Date Yolume
Collected (m3) Gross Beta Collected (i 3 ) Gross Beta IRequired LLD 0.010 Required LLD 0.010
01-07-0301-14-0301-21-0301-28-03
02-05-0302-11-0302-17-0302-25-03
03-04-0303-11-0303-18-0303-25-0304-01-03
350302305303
376261262352
299303303305305
0.017 O0.0030.021 t 0.0030.030 ± 0.0040.023 ± 0.003
0.024 ± 0.0030.020 ± 0.0040.018 ± 0.0030.021 ± 0.003
0.028 ± 0.0040.030 ± 0.0040.031 ± 0.0040.019 ± 0.0030.018 ± 0.003
07-08-0307-15-0307-22-0307-29-03
08-05-0308-12-0308-19-0308-26-0309-02-03
09-09-0309-16-0309-22-0309-30-03
307298307303
303306307305303
309303258351
0.022 ± 0.0030.011 ± 0.0030.014 ± 0.0030.015 ± 0.003
0.019 ± 0.0030.015 ± 0.0030.027 ± 0.0040.028 ± 0.0030.021 ± 0.003
0.027 ± 0.0030.030 ± 0.0040.027 ± 0.0040.015 ± 0.003
1st Quarter Mean i s.d. 0.023 ± 0.005 3rd Quarter Mean ± s.d. 0.021 ± 0.006
04-08-0304-15-0304-22-0304-29-03
05-06-0305-13-0305-20-0305-27-0306-03-03
06-10-0306-17-0306-24-0307-01-03
301303306307
300308300304303
304310298305
0.022 ± 0.0030.027 ± 0.0030.019 ± 0.0030.022 ± 0.003
0.017 ± 0.0030.012 ± 0.0020.014 ± 0.0030.015 ± 0.0030.015 ± 0.003
0.018 ± 0.0030.012 ± 0.0030.015 ± 0.0030.012 ±0.003
10-07-0310-14-0310-20-0310-28-0311-03-03
11-11-0311-18-0311-25-0312-02-03
12-09-0312-15-0312-23-0312-30-03
305297261351261
346310297303
303261347305
0.011 ± 0.0020.038 ± 0.0040.025 ± 0.0040.021 ± 0.0030.012 ± 0.003
0.023 ± 0.0030.028 ± 0.0040.022 ± 0.0030.033 ± 0.003
0.020 ± 0.0030.024 ± 0.0040.041 ± 0.0040.022 ± 0.003
I
2nd Quarter Mean ± s.d. 0.017 ± 0.005 4th Quarter Mean ± s.d. 0.025 ± 0.009
Cumulative AveragePrevious Annual Average
0.0210.022
a Iodine-131 is sampled biweekly. Concentrations are < 0.03 pCi/m3 unless otherwise noted.
31
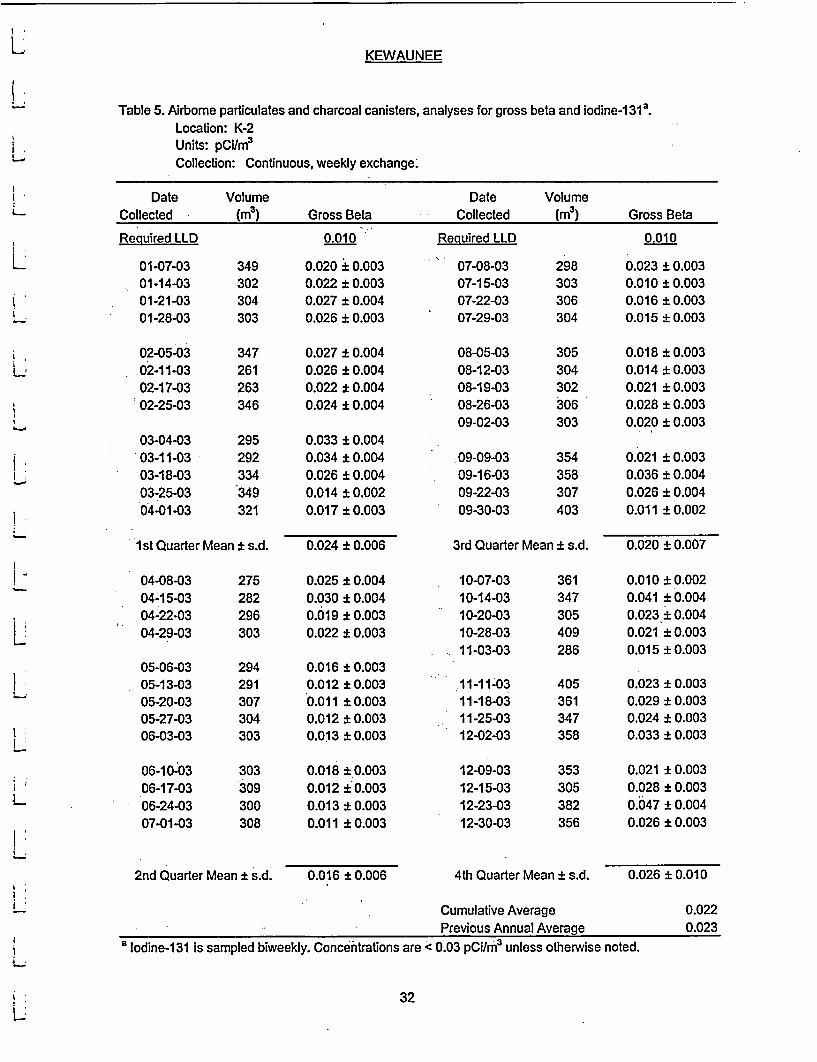
KEWAUNEE
Table 5. Airbome particulates and charcoal canisters, analyses for gross beta and iodine-1 31a*Location: K-2Units: pCi/ 3
Collection: Continuous, weekly exchange;
Date Volume Date VolumeCollected (i 3) Gross Beta Collected (m3) Gross Beta
Required LLD
01-07-0301-14-0301-21-0301-28-03
02-05-0302-11-0302-17-0302-25-03
03-04-0303-11-0303-18-0303-25-0304-01-03
349302304303
347261263346
295292334349321
0.010
0.020 i 0.0030.022 ± 0.0030.027 i 0.0040.026 ± 0.003
0.027 + 0.0040.026 ± 0.0040.022 ± 0.0040.024 ± 0.004
0.033 ± 0.0040.034 ± 0.0040.026 ± 0.0040.014 ± 0.0020.017 ± 0.003
Required LLD
07-08-0307-15-0307-22-0307-29-03
08-05-0308-12-0308-19-0308-26-0309-02-03
09-09-0309-16-0309-22-0309-30-03
298303306304
305304302306303
354358307403
0.010
0.023 ± 0.0030.010 ± 0.0030.016 ± 0.0030.015 ± 0.003
0.018 ± 0.0030.014 ± 0.0030.021 ± 0.0030.028 ± 0.0030.020 ± 0.003
0.021 ± 0.0030.036 ± 0.0040.026 ± 0.0040.011 ± 0.002
1st Quarter Mean ± s.d.
04-08-0304-15-0304-22-0304-29-03
05-06-0305-13-0305-20-0305-27-0306-03-03
275282296303
294291307304303
0.024 ± 0.006
0.025 ± 0.0040.030 ± 0.0040.019 ± 0.0030.022 + 0.003
0.016 ± 0.0030.012 ± 0.0030.011 ± 0.0030.012 ± 0.0030.013 ± 0.003
3rd Quarter Mean ± s.d.
10-07-0310-14-0310-20-0310-28-0311-03-03
.11-11-0311-18-0311-25-0312-02-03
361347305409286
405361347358
0.020 ± 0.007
0.010 ± 0.0020.041 ± 0.0040.023 ± 0.0040.021 ± 0.0030.015 ± 0.003
0.023 ± 0.0030.029 ± 0.0030.024 ± 0.0030.033 ± 0.003
06-10-0306-17-0306-24-0307-01-03
303309300308
0.018 ± 0.0030.012 ± 0.0030.013 ± 0.0030.011 ± 0.003
12-09-0312-15-0312-23-0312-30-03
353305382356
0.021 ± 0.0030.028 ± 0.0030.047 ± 0.0040.026 ± 0.003
2nd Quarter Mean ± s.d. 0.016 ± 0.006 4th Quarter Mean ± s.d. 0.026 ± 0.010
Cumulative AveragePrevious Annual Averaae
0.0220.023
a Iodine-131 is sampled biweekly. Concentrations are < 0.03 pCilr 3 unless otherwise noted.
32
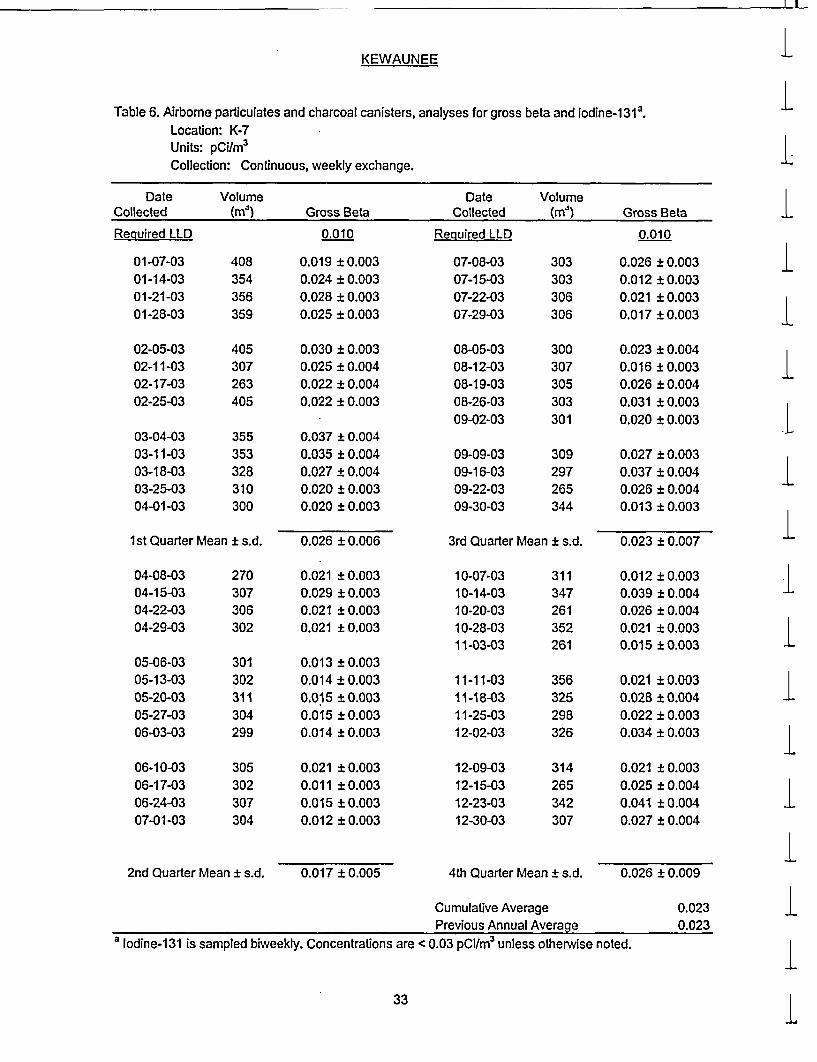
I L-
KEWAUNEE L
_Table 6. Airborne particulates and charcoal canisters, analyses for gross beta and iodine-131a.Location: K-7Units: pCinm3
Collection: Continuous, weekly exchange.
Date Volume Date VolumeCollected (ma) Gross Beta Collected (ma) Gross Beta IRequired LLD 0.010 Required LLD 0.010
01-07-0301 -14-0301-21-0301-28-03
02-05-0302-11-0302-17-0302-25-03
03-04-0303-11-0303-18-0303-25-0304-01-03
408354356359
405307263405
355353328310300
0.019 ± 0.0030.024 ± 0.0030.028 ± 0.0030.025 ± 0.003
I07-080307-15-0307-22-0307-29-03
0.0300.0250.0220.022
± 0.003± 0.004± 0.004± 0.003
08-05-0308-12-0308-19-0308-26-0309-02-03
09-09-0309-16-0309-22-0309-30-03
303303306306
300307305303301
309297265344
0.026 ± 0.0030.012 ± 0.0030.021 ± 0.0030.017 ±0.003
0.023 ± 0.0040.016 ± 0.0030.026 ± 0.0040.031 ± 0.0030.020 ± 0.003
0.027 ± 0.0030.037 ± 0.0040.026 ± 0.0040.013 ± 0.003
II
0.037 ± 0.0040.035 ± 0.0040.027 ± 0.0040.020 ± 0.0030.020 ± 0.003
I
I1st Quarter Mean ± s.d. 0.026 ± 0.006 3rd Quarter Mean ± s.d. 0.023 ± 0.007
04-080304-15-0304-22-0304-29-03
05-06-0305-13-0305-20-0305-27-0306-03-03
06-10-0306-17-0306-24-0307-01-03
270307306302
301302311304299
305302307304
0.021 ± 0.0030.029 ± 0.0030.021 ± 0.0030.021 ± 0.003
0.013 ± 0.0030.014 ± 0.0030.015 ±0.0030.015 ± 0.0030.014 ± 0.003
0.021 ± 0.0030.011 ± 0.0030.015 ±0.0030.012 ± 0.003
10-07-0310-14-0310-20-0310-28-0311-03-03
11-11-0311-18-0311-25-0312-02-03
12-09-0312-15-0312-23-0312-30-03
311347261352261
356325298326
314265342307
0.012 ± 0.0030.039 i 0.0040.026 ± 0.0040.021 ± 0.0030.015 ±0.003
0.021 ± 0.0030.028 ± 0.0040.022 ± 0.0030.034 i 0.003
0.021 ± 0.0030.025 ± 0.0040.041 i0.0040.027 ± 0.004
LI
I
I
I
I2nd Quarter Mean ± s.d. 0.017 ± 0.005 4th Quarter Mean ± s.d. 0.026 ± 0.009
Cumulative AveragePrevious Annual Average
I0.0230.023
a lodine-1 31 is sampled biweekly. Concentrations are < 0.03 pCi/M3 unless otherwise noted.
33
I
I

KEWAUNEE
Table 7. Airborne particulates and charcoal canisters, analyses for gross beta and iodine-1313.Location: K-8Units: pCi/n 3
Collection: Continuous, weekly exchange.
DateCollected
Volume(m3)
DateCollected
Volume(m3)Gross Beta Gross Beta
Required LLD 0.010 Required LLD 0.010
01-07-0301-14-0301-21-0301-28-03
02-05-0302-11-0302-17-0302-25-03
03-04-0303-11-0303-18-0303-25-0304-01-03
354299304303
347276272346
305302303309296
0.022 ± 0.0030.024 ± 0.0030.028 ± 0.0040.031 ± 0.003
0.030 ± 0.0040.025 ± 0.0040.017 ± 0.0030.027 ± 0.004
0.034 ± 0.0040.035 ± 0.0040.032 ± 0.0040.021 ± 0.0030.020 ± 0.003
- 07-08-0307-15-0307-22-0307-29-03
08-05-0308-12-0308-19-0308-26-0309-02-03
09-09-0309-16-0309-22-0309-30-03
303302306320
317306320333318
308297266343
0.024 ± 0.0030.013 ± 0.0030.017 ± 0.0030.018 ± 0.003
0.020 ± 0.0030.014 ± 0.0030.028 ± 0.004-0.029 ± 0.0030.019 ± 0.003
0.028 ± 0.0030.030 ±i0.0040.026 ± 0.0040.015 ± 0.003
I1st Quarter Mean ± s.d. 0.027 ± 0.006 3rd Quarter Mean ± s.d. - 0.022 ± 0.006
04-08-0304-15-0304-22-0304-29-03
05-06-0305-13-0305-20-0305-27-0306-03-03
06-10-0306-17-0306-24-0307-01-03
273317317302
301302311303300
305303306303
0.021 ± 0.0030.024 ± 0.0030.020 ± 0.0030.019 ± 0.003
0.015 ± 0.0030.013 ± 0.0030.014 ± 0.0030.018 ± 0.0030.016 ± 0.003
0.021 ± 0.0030.012 ± 0.0030.016 ± 0.0030.014 ± 0.003
10-07-0310-14-0310-20-03
*10-28-0311-03-03
11-11-0311-18-0311-25-0312-02-03
12-09-0312-15-03
*- 12-23-0312-30-03
312296261352260
345311297325
315286400348
0.011 ±0.0020.043 ± 0.0040.027 :f 0.0040.021 ± 0.0030.014 ± 0.003
0.021 ± 0.0030.028 ± 0.0040.021 ± 0.0030.034 ± 0.003
0.025 ± 0.0030.026 ± 0.0040.040 ± 0.0040.025 ± 0.003
2nd Quarter Mean ± s.d. 0.017 ± 0.004 4th Quarter Mean ± s.d. 0.026 ± 0.009
Cumulative AveragePrevious Annual Average
0.0230.022
a lodine-131 is sampled biweekly. Concentrations are < 0.03 pCi/l 3 unless otherwise noted.
34

_ _ _ _ _ _ _ _ _ _ _ _ _ _ _ _ _ _ _ _ _I I
1KEWAUNEE
Table 8. Airborne particulates and charcoal canisters, analyses for gross beta and iodine-1313.Location: K-31Units: pCiIm3
Collection: Continuous, weekly exchange.
Date Volume Date VolumeCollected (m 3 ) Gross Beta Collected (m 3 ) Gross Beta
1
IRequired LLD 0.010 Required LLD 0.010
I01-07-0301-14-0301-21-0301-28-03
02-05-0302-11-0302-17-0302-25-03
03-04-0303-11-0303-18-0303-25-0304-01-03
349302331354
404304307404
341312304304307
0.024 ± 0.0030.023 ± 0.0030.025 ± 0.0030.024 ± 0.003
0.024 ± 0.0030.020 ± 0.0030.019 ± 0.0020.024 ± 0.003
0.033 ± 0.0040.034 ± 0.0040.028 i 0.0040.019 ± 0.0030.022 ± 0.003
07-08-0307-15-0307-22-0307-29-03
08-05-0308-12-0308-19-0308-26-0309-02-03
09-09-0309-16-0309-22-0309-30-03
298303306303
306303301307304
313293263345
0.030 ± 0.0030.014 ± 0.0030.016 ± 0.0030.021 ± 0.003
0.023 ± 0.0030.017 ± 0.0030.027 ± 0.0040.031 ± 0.0030.024 ± 0.003
0.024 ± 0.0030.031 ± 0.0040.031 ± 0.0040.016 ± 0.003
I
I
1II1 st Quarter Mean ± s.d. 0.025 ± 0.005 3rd Quarter Mean ± s.d. 0.023 ± 0.006
04-08-0304-15-0304-22-0304-29-03
05-06-0305-13-0305-20-0305-27-0306-03-03
06-10-0306-17-0306-24-0307-01-03
300303306305
303302306303304
303308300309
0.023 i 0.0030.029 ± 0.0030.021 ± 0.0030.025 ± 0.004
0.015 ± 0.0030.014 ± 0.0030.012 ± 0.0030.020 + 0.0030.014 i 0.003
0.017 ± 0.0030.013 ± 0.0030.018 ± 0.0030.013 ± 0.003
10-07-0310-14-0310-20-0310-28-0311-03-03
11-11-0311-18-0311-25-0312-02-03
12-09-0312-15-0312-23-0312-30-03
311296261350261
346310297322
319261347305
0.012 ± 0.0030.042 ± 0.0040.024 ± 0.0040.018 ± 0.0030.012 ± 0.003
0.021 ± 0.0030.028 ± 0.0040.023 ± 0.0030.033 ± 0.003
0.020 ± 0.0030.023 ± 0.0040.036 ± 0.0040.027 ± 0.004
IIIIII
2nd Quarter Mean ± s.d. 0.018 ± 0.005 4th Quarter Mean ± s.d. 0.025 ± 0.009
ICumulative AveragePrevious Annual Average
0.0230.022
a Iodine-131 is sampled biweekly. Concentrations are < 0.03 pCi/ 3 unless otherwise noted.I
35I

KEWAUNEE
Table 9. Airborne particulates and charcoal canisters, analyses for gross beta and iodine-1319.Location: K-16Units: pCIm 3
Collection: Continuous, weekly exchange.
Date Volume Date VolumeCollected (i 3) Gross Beta Collected (i 3) Gross Beta
Required LLD
01-07-0301-14-0301-21-0301-28-03
350302305305
0.010
0.020 i 0.0030.023 i 0.0030.028 ± 0.0040.031 i 0.003
Required LLD
07-08-0307-15-0307-22-0307-29-03
0.010
303303306329
0.024 i 0.0030.013 ± 0.0030.017 ± 0.0030.018 ± 0.003
02-05-0302-11-0302-17-0302-25-03
03-04-0303-11-0303-18-0303-25-0304-01-03
345273289381
321302308305307
0.034 ± 0.0040.023 * 0.0040.020 ± 0.0030.023 ± 0.003
0.035 ± 0.0040.033 ± 0.0040.029 ± 0.0040.019 ± 0.0030.019 ± 0.003
08-05-0308-12-0308-19-0308-26-0309-02-03
09-09-0309-16-0309-22-0309-30-03
346322324358327
371472439474
0.020 ± 0.0030.018 i 0.0030.030 i 0.0040.032 i 0.0030.023 ± 0.003
0.030 ± 0.0030.033 ± 0.0030.022 ± 0.0030.016 ± 0.002
1st Quarter Mean ± s.d. 0.026 ± 0.006 3rd Quarter Mean ± s.d. 0.023 i 0.007
04-08-0304-15-0304-22-0304-29-03
05-06-0305-13-0305-20-0305-27-0306-03-03.
06-10-0306-17-0306-24-0307-01-03
324343347326
308301306303304
303304305304
0.018 ± 0.0030.022 i 0.0030.016 i 0.0030.021 ± 0.003
0.015 ± 0.0030.014 ± 0.0030.014 i 0.0030.018 ± 0.0030.017 ± 0.003
0.019 ± 0.0030.014 ±i0.0030.017 ± 0.0030.011 ± 0.003
10-07-0310-14-0310-20-0310-28-0311-03-03
11-11-0311-18-0311-25-03
-12-02-03
12-09-0312-15-0312-23-0312-30-03
300297261351260
345309298307
303261347306
0.011 ± 0.0030.041 ± 0.0040.028 ± 0.0040.021 ± 0.0030.013 ± 0.003
0.023 ± 0.0030.027 ± 0.0040.021 ± 0.0030.033 ± 0.003
0.023 ± 0.0030.024 ± 0.0040.039 ± 0.0040.028 ± 0.004
2nd Quarter Mean ± s.d. 0.017 ± 0.003 4th Quarter Mean ± s.d. 0.026 ± 0.009
Cumulative AveragePrevious Annual Average
0.0230.023
a lodine-131 is sampled biweekly. Concentrations are < 0.03 pCi/rm3 unless otherwise noted.
36

I I- - -
KEWAUNEE
Table 7. Airborne particulate data, gross beta analyses, monthly averages, minima and maxima.
IJanuary
Location Average Minima Maxima
Indicators 0.023 0.017 0.030K-If 0.023 0.017 0.030K-7 0.024 0.019 0.028
Controls 0.025 0.020 0.031K-2 0.024 0.020 0.027K-8 0.026 0.022 0.031K-31 0.024 0.023 0.025K-16 0.026 0.020 0.031
FebruaryLocation Average Minima Maxima
Indicators 0.023 0.018 0.030
K-if 0.021 0.018 0.024K-7 0.025 0.022 0.030
Controls 0.024 0.017 0.034K-2 0.025 0.022 0.027K-8 0.025 0.017 0.030K-31 0.022 0.019 0.024K-16 0.025 0.020 0.034
MarchLocation Average Minima Maxima
Indicators 0.027 0.018 0.037
K-If 0.025 0.018 0.031K-7 0.028 0.020 0.037
Controls 0.027 0.014 0.035K-2 0.025 0.014 0.034K-8 0.028 0.020 0.035K-31 0.027 0.019 0.034K-16 0.027 0.019 0.035
AprilLocation Average Minima Maxima
Indicators 0.023 0.019 0.029K-if 0.023 0.019 0.027K-7 0.023 0.021 0.029
Controls 0.022 0.016 0.030K-2 0.024 0.019 0.030K-8 0.021 0.019 0.024K-31 0.025 0.021 0.029K-16 0.019 0.016 0.022
MayLocation Average Minima Maxima
Indicators 0.014 0.012 0.017
K-1f 0.015 0.012 0.017K-7 0.014 0.013 0.015
Controls 0.015 0.011 0.020K-2 0.013 0.011 0.016K-8 0.015 0.013 0.018K-31 0.015 0.012 0.020K-16 0.016 0.014 0.018
JuneLocation Average Minima Maxima
Indicators
K-if 0.014 0.012 0.018K-7 0.015 0.011 0.021
Controls 0.015 0.011 0.021K-2 0.014 0.011 0.018K-8 0.016 0.012 0.021K-31 0.015 0.013 0.018K-16 0.015 0.011 0.019
I
IIIIII.IIIIIII
Note: unless otherwise specified, samples collected on the first, second or third day of themonth are grouped with data of the previous month.
37
I
I
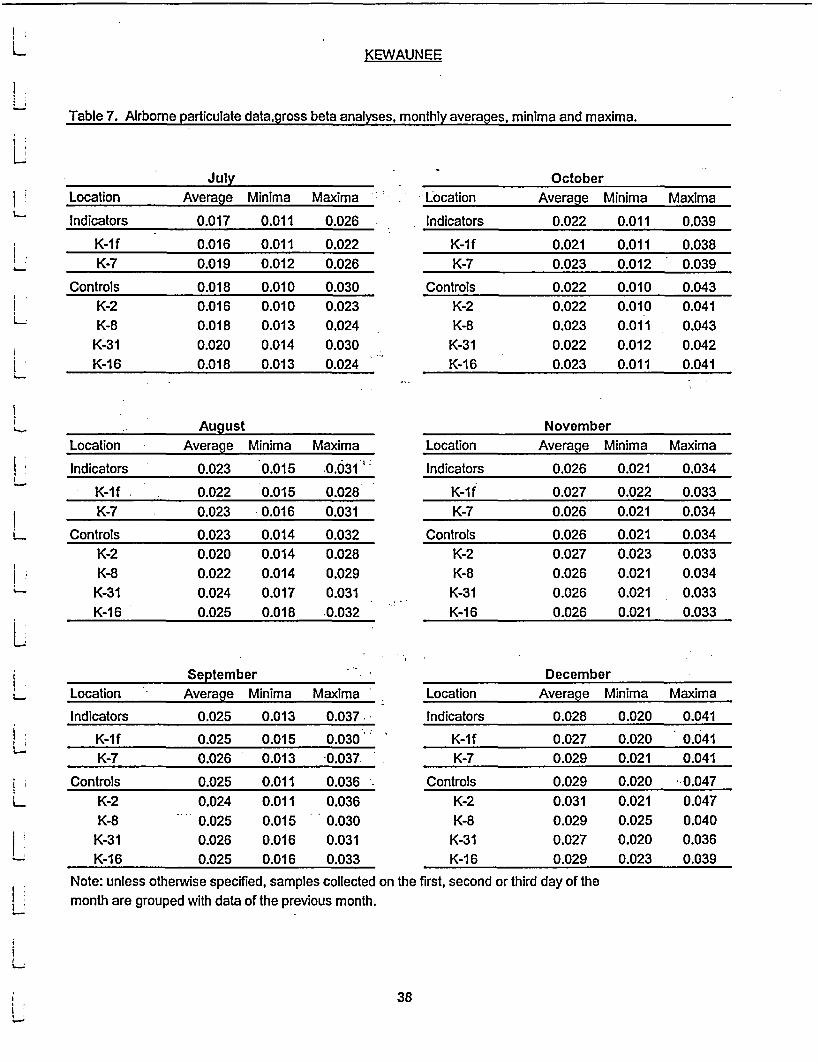
KEWAUNEE
Table 7. Airborne particulate data,gross beta analyses, monthly averages, minima and maxima.
JulyAverage Minima Maxima Location
OctoberAveraae Minima MaximaLocation
Indicators
K-1fK-7
0.017 0.011 0.026
0.016 0.011 0.0220.019 0.012 0.026
Indicators
- K-IfK-7
0.022 0.011 0.039
0.021 0.011 0.0380.023 0.012 0.039
ControlsK-2K-8
K-31K-1 6
0.018 0.010 0.0300.016 0.010 0.0230.018 0.013 0.0240.020 0.014 0.0300.018 0.013 0.024
Location
Indicators
- K-IfI K-7
AugustAverage Minima Maxima
0.023 0.015 .0.031 '
0.022 0.015 0.0280.023 0.016 0.031
ControlsK-2K-8
K-31K-1 6
0.023 0.014 0.0320.020 0.014 0.0280.022 0.014 0.0290.024 0.017 0.0310.025 0.018 .0.032
Controls 0.022 0.010 0.043K-2 0.022 0.010 0.041K-8 0.023 0.011 0.043
K-31 0.022 0.012 0.042K-16 0.023 0.011 0.041
November
Location Average Minima Maxima
Indicators 0.026 0.021 0.034
K-1 f 0.027 0.022 0.033K-7 0.026 0.021 0.034
Controls 0.026 0.021 0.034K-2 0.027 0.023 0.033K-8 0.026 0.021 0.034
K-31 0.026 0.021 0.033K-16 0.026 0.021 0.033
DecemberLocation Average Minima Maxima
Indicators 0.028 0.020 0.041
K-If 0.027 0.020 0.041
K-7 0.029 0.021 0.041
Controls 0.029 0.020 0.047K-2 0.031 0.021 0.047K-8 0.029 0.025 0.040
K-31 0.027 0.020 0.036K-1 6 0.029 0.023 0.039
first, second or third day of the
September ILocation
Indicators
K-IfK-7
Average Minima Maxima
0.025 0.013 0.037
0.025 0.015 0.0300.026 0.013 0.037
Controls 0.025 0.011 0.036L K-2 0.024 0.011 0.036
K-8 0.025 0.015 0.030K-31 0.026 0.016 0.031K-16 0.025 0.016 0.033
Note: unless otherwise specified, samples collected on the Imonth are grouped with data of the previous month.
38

I I
LKEWAUNEE
Table 11. Airborne particulate samples, quarterly composites of weekly samples, analysis forgamma-emitting isotopes.
LI
Sample Description and Concentration (pCVm 3)
1st Quarter 2nd Quarter 3rd Quarter 4th QuarterI
Indicator ItK-if
Lab Code
Volume (m3)
IKAP-1669
4026
KAP-4070
3949
KAP-6101
3960
KAP-7864
3947
Be-7Nb-95Zr-95Ru-I 03Ru-1 06Cs-134Cs-137Ce-141Ce-1M
K-7
0.069 ± 0.015< 0.0006< 0.0009< 0.0004< 0.0051< 0.0007< 0.0005< 0.0013< 0.0030
0.065 ± 0.015< 0.0010< 0.0013< 0.0007< 0.0064< 0.0006< 0.0008< 0.0009< 0.0028
0.059 ± 0.014< 0.0010< 0.0007< 0.0010< 0.0031< 0.0007< 0.0004< 0.0015< 0.0044
0.039 ± 0.011< 0.0003< 0.0013< 0.0005< 0.0037< 0.0007< 0.0004< 0.0011< 0.0040
III1
iLab Code
Volume (mi3)
KAP-1671
4503
KAP-4072
3920
KAP-6104
3949
KAP-7866
4065
Be-7Nb-95Zr-95Ru-103Ru-106Cs-134Cs-137Ce-141Ce-1M
0.059 ± 0.012< 0.0004< 0.0016< 0.0003< 0.0048< 0.0007< 0.0006< 0.0012< 0.0028
0.071 ± 0.014< 0.0014< 0.0019< 0.0003< 0.0058< 0.0004< 0.0004< 0.0016< 0.0041
0.062 ± 0.014< 0.0009< 0.0008< 0.0006< 0.0057< 0.0005< 0.0007< 0.0015< 0.0054
0.052 ± 0.012< 0.0005< 0.0012< 0.0006< 0.0037< 0.0008< 0.0008< 0.0011< 0.0025
III1II
I39 I
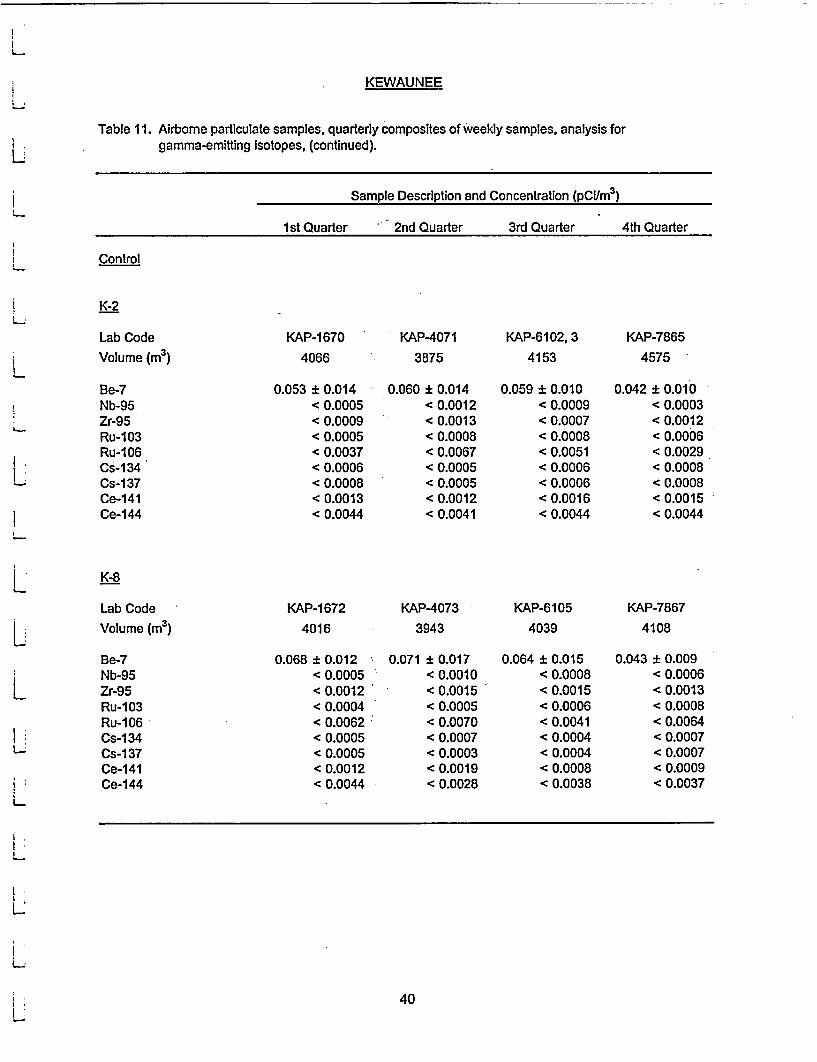
KEWAUNEE
Table 11. Airbome particulate samples, quarterly composites of weekly samples, analysis forgamma-emitting Isotopes, (continued).
Sample Description and Concentration (pCVm3)
1st Quarter ' 2nd Quarter 3rd Quarter 4th Quarter
Control
K-2
Lab Code
Volume (m3 )
KAP-1670
4066
'KAP4071
3875
KAP-6102, 3
4153
KAP-7865
4575
Be-7Nb-95Zr-95Ru-103Ru-1 06Cs-1 34Cs-1 37Ce-141Ce-144
0.053 ± 0.014< 0.0005< 0.0009< 0.0005< 0.0037< 0.0006< 0.0008< 0.0013< 0.0044
0.060 ± 0.014< 0.0012< 0.0013< 0.0008< 0.0067< 0.0005< 0.0005< 0.0012< 0.0041
0.059 + 0.010< 0.0009< 0.0007< 0.0008< 0.0051< 0.0006< 0.0006< 0.0016< 0.0044
0.042 ± 0.010< 0.0003< 0.0012< 0.0006< 0.0029< 0.0008< 0.0008< 0.0015< 0.0044
K-8
Lab Code
Volume (m3 )
KAP-1672
4016
KAP-4073
3943
KAP-6105
4039
KAP-7867
4108
Be-7Nb-95Zr-95Ru-103Ru-106Cs-1 34Cs-137Ce-141Ce-144
0.068 ± 0.012 -< 0.0005< 0.0012< 0.0004< 0.0062*< 0.0005< 0.0005< 0.0012< 0.0044
0.071 ± 0.017< 0.0010< 0.0015< 0.0005< 0.0070< 0.0007< 0.0003< 0.0019< 0.0028
0.064 ± 0.015< 0.0008< 0.0015< 0.0006< 0.0041< 0.0004< 0.0004< 0.0008< 0.0038
0.043 ± 0.009< 0.0006< 0.0013< 0.0008< 0.0064< 0.0007< 0.0007< 0.0009< 0.0037
40
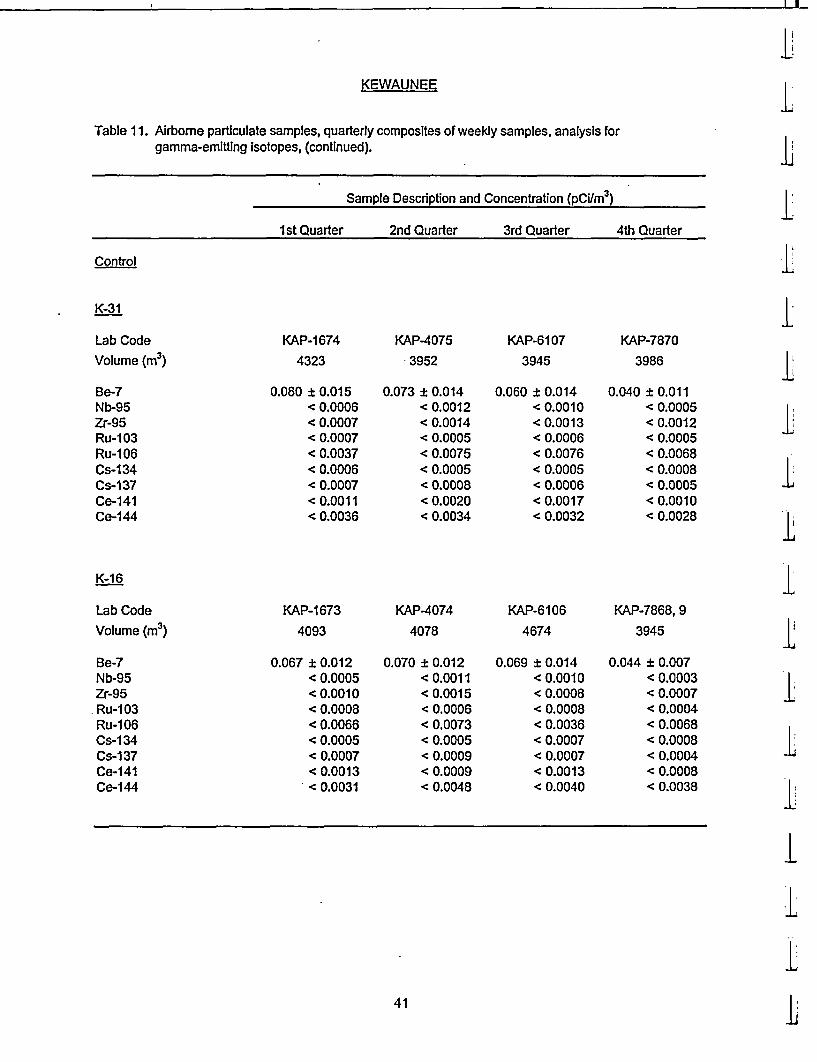
I~I I
1lKEWAUNEE
Table 11. Airborne particulate samples, quarterly composites of weekly samples, analysis forgamma-emitting isotopes, (continued).
LLi
Sample Description and Concentration (pCim 3)
1st Quarter 2nd Quarter 3rd Quarter 4th QuarterI
Control .I
K-31
Lab Code
Volume (m3)
IKAP-1674
4323
KAP-4075
3952
KAP-6107
3945
KAP-7870
3986
Be-7Nb-95Zr-95Ru-103Ru-106Cs-134Cs-137Ce-141Ce-144
K-1 6
0.080 i 0.015< 0.0006< 0.0007< 0.0007< 0.0037< 0.0006< 0.0007< 0.0011< 0.0036
0.073 i 0.014< 0.0012< 0.0014< 0.0005< 0.0075< 0.0005< 0.0008< 0.0020< 0.0034
0.060 ± 0.014< 0.0010< 0.0013< 0.0006< 0.0076< 0.0005< 0.0006< 0.0017< 0.0032
0.040 ± 0.011< 0.0005< 0.0012< 0.0005< 0.0068< 0.0008< 0.0005< 0.0010< 0.0028
Il1diI11I
Lab CodeVolume (m3)
KAP-1673
4093
KAP-4074
4078
KAP-6106
4674
KAP-7868, 9
3945
Be-7Nb-95Zr-95Ru-103Ru-106Cs-134Cs-I 37Ce-141Ce-144
0.067 ± 0.012< 0.0005< 0.0010< 0.0008< 0.0066< 0.0005< 0.0007< 0.0013< 0.0031
0.070 ± 0.012< 0.0011< 0.0015< 0.0006< 0.0073< 0.0005< 0.0009< 0.0009< 0.0048
0.069 ± 0.014< 0.0010< 0.0008< 0.0008< 0.0036< 0.0007< 0.0007< 0.0013< 0.0040
0.044 ± 0.007< 0.0003< 0.0007< 0.0004< 0.0068< 0.0008< 0.0004< 0.0008< 0.0038
I
IIiII.I
41 L

KEWAUNEE
Table 12. Ambient gamma radiation (TLD), quarterly exposure.
1st Qtr. 2nd Qtr. 3rd Qtr. 4th Qtr.
Date Placed 01-02-03 04-01-03 07-01-03 10-01-03
Date Removed 04-01-03 07-01-03 10-01-03 01-05-04
mR/91 days'
Indicator
K-1f
K-5
K-7
K-1 7
K-25
K-27
K-30
K-37b
K-3 9b
Mean ± s.d.
Control
K-2
K-3
K-8
K-1 5
K-1 6
K-31
Mean ± s.d.
12.5 i 0.6
14.3 ± 0.6
17.0 ± 0.3
16.6 ± 0.4
14.4 ± 0.2
12.7 ± 0.3
13.8 ± 0.5
13.2 ± 0.7
14.3 ± 1.7
12.4 ± 0.4
16.3 ± 0.7
14.5 ± 0.6
13.6 ± 0.4
14.0 ± 0.6
11.8 ±0.5
13.8 ± 1.6
10.3 ± 0.5
13.0 ± 0.5
16.1 ±0.6
13.8 ± 0.5
13.8 ±0.6
10.6 ± 0.6
NDC
12.7 ± 1.0
12.9 ± 2.0
10.8 ± 0.4
14.1 ±0.7
13.1 ±0.2
12.1 ±0.3
.16.8 ± 0.5
10.8 ± 0.5
13.0 ±2.3
11.3 ± 0.4
16.6 ± 0.6
17.0 ± 0.9
16.9 ± 0.5
14.2 ± 0.7
11.7 ± 0.4
14.1 ±0.6
14.5 ± 0.8
14.5 ± 2.2
11.8 ± 0.5
16.2 ± 0.7
14.2 ± 0.4
13.4 ± 0.3
24.4 ± 0.8
11.3 ± 0.5
15.2 ±4.8
11.4 ± 0.7
17.2 ± 0.7
17.8 ± 0.7
15.0 ± 0.5
14.7 ± 0.6
11.5 ± 0.6
25.2 ± 1.4
15.4 ± 0.4
14.7 ±4.4
12.1 ±0.5
16.0 ± 0.8
14.0 ± 0.6
13.4 ± 0.3
11.1 ±0.4
11.7 ±0.7
13.1 ± 1.8
Mean±s.d.
11.4 ± 0.9
15.3 ± 2.0
17.0 ± 0.7
15.6 ± 1.4
14.3 ± 0.4
11.6 ± 0.9
14.0 ± 0.2
13.0 ± 0.4
14.1 ± 0.8
11.8 ± 0.7
15.7 ± 1.0
14.0 ± 0.6
13.1 ±0.7
16.6 ± 5.7
11.4 ± 0.5
13.7 ± 1.0
a The uncertainty for each location corresponds to the two-standard deviation error of theaverage dose of eight dosimeters placed at this location.
b Location dropped from program; replaced by K-39 In the third quarter, 2003.CTLDs lost in the field.d Reading suspect, The TLD was found without a plastic holder bag, possibly removed mistakenly by
outside personnel and then replaced again. Could also account for missing 2nd Qtr. TLD. This readingis not included in the calculation of mean and standard deviation.
42

KEWAUNEE
Table 13. Precipitation samples collected at Location K-I1; analysis for tritium.
Date Lab H-3
Collected Code pCUL T.U. (100 T.U. = 320 pCVL)
01107103 KP -176 < 330 < 103
02/05/03 -556 < 330 - < 103
03/04/03 -975 < 330 < 103
04/01/03 -1524 < 330 < 103
05/06/03 -2416 < 330 < 103
06/05/03 -3026 < 330 < 103
07/01/03 -3680 <330 < 103
08/05/03 -4538 < 330 < 103
09/02/03 -5010,11 < 330 < 103
10/07/03 -5845 < 330 < 103
11/03/03 -6644 < 330 < 103
12/02/04 -7240 < 330 < 103
43

KEWAUNEE
Table 14. Milk, analyses for iodine-131 and gamma-emitting isotopes.Collection: Semimonthly during grazing season, monthly at other times.
Collection Lab Concentration (pCi/L)
Date- Code -1-131 Cs-1 34 Cs-137 Ba-La-140 K-40
Indicators
K-5
01-02-03* 02-03-03
03-03-0304-01-0305-01-0305-13-0306-02-0306-17-0307-01-0307-15-0308-04-0308-19-0309-02-0309-16-0310-01-0310-14-0311-03-0312-01-03
KMI - 20- 460- 886- 1421--2167- 2569- 2893-3287- 3578- 3985- 4391- 4737- 4981- 5282- 5614- 6028- 6607- 7142
< 0.5< 0.5< 0.5<0.5<0.5<0.5< 0.5<0.5< 0.5< 0.5< 0.5< 0.5<0.5<0.5<0.5<0.5<0.5<0.5
<10- <10
<10<10<10<10<10<10<10<10<10<10<10<10<10
* <10<10
* <10
<10<10<10<10<10<10<10<10<10<10<10
*< 10<10<10<10<10<10<10
< 15< 15< 15< 15< 15<15< 15< 15< 15< 15< 15< 15< 15< 15< 15< 15< 15< 15
1308 i 1161429 i 1831481 ± 1821152 ± 1661336 ± 1901242 ± 1121254 ± 1751376 ± 1701295 ± 1571177 ± 1681195 ± 1591293 ± 1181305 ± 1761350 ± 1211307 ± 1811190 ± 1601275 ± 1121277 ± 171
K-25
01-03-0302-04-0303-04-0304-01-0305-01-0305-13-0306-02-0306-17-0307-01-0307-15-0308-04-0308-19-0309-02-0309-16-0310-01-0310-14-0311-04-0312-01-03
KMI - 21-461-887-1422,3-2168- 2570- 2894- 3288- 3579- 3986- 4392- 4738- 4982- 5283- 5615- 6029- 6608- 7143
<0.5<0.5<0.5<0.5<0.5<0.5< 0.5< 0.5< 0.5< 0.5< 0.5< 0.5< 0.5< 0.5<0.5<0.5<0.5<0.5
<10<10<10<10<10<10<10<10<10<10<10<10<10<10<10<10<10<10
<10<10<10<10<10<10<10<10<10<10<10<10<10<10<10<10<10<10
< 15< 15< 15< 15< 15< 15< 15< 15< 15< 15< 15< 15< 15< 15< 15< 15< 15< 15
1331 ±1301527 ± 1261239 ± 1611375 ± 1051146 ± 1571198 ± 1691346 ± 1151205 ± 1661400 ± 1761378 ± 1231427 ± 1861356 ± 1221436 ± 2051254 ± 1131347 ± 1911352 ± 1141544 ± 1341419 ± 170
44

I I I
KEWAUNEE LTable 14. Milk, analyses for iodine-131 and gamma-emitting isotopes (continued). I l.
Collection Lab Concentration (pCVL)Date Code 1-131 Cs-134 Cs-137 Ba-La-140 K-40
Indicators
K-34
01-02-03 KMI - 23 < 0.5 <10 <10 < 15 1544 i 18102-03-03 -463 <0.5 <10 <10 < 15 1509 i 13403-03-03 - 889 < 0.5 <10 <10 < 15 1515 i 12704-01-03 - 1425 < 0.5 < 10 <10 < 15 1387 i 19405-01-03 - 2170,1 < 0.5 <10 <10 < 15 1462 ± 11505-13-03 - 2572 < 0.5 <10 <10 < 15 1448 i 18606-02-03 - 2896 < 0.5 <10 <10 < 15 1400 ± 17506-17-03 - 3290 < 0.5 <10 <10 < 15 1508 ± 18807-02-03 - 3581 < 0.5 <10 <10 < 15 1373 ± 16707-15-03 -3988 <0.5 <10 <10 <15 1491 ±18908-5-03 -4394 <0.5 <10 <10 < 15 1469 ± 19808-19-03 -4740 <0.5 <10 <10 < 15 1459 ± 18709-02-03 - 4984 < 0.5 <10 <10 < 15 1357 i 17909-16-03 - 5285 < 0.5 <10 <10 < 15 1388 ± 17110-02-03 - 5617 < 0.5 <10 <10 < 15 1020 ± 17510-14-03 - 6031 < 0.5 <10 <10 < 15 1484 i 12511-03-03 -6610 <0.5 <10 <10 <15 1278±18012-01-03 - 7145 < 0.5 <10 <10 < 15 1440 ± 174
45
L
L."L-
L
l1
L1
III.I
IL

KEWAUNEE
Table 14. Milk, analyses for iodine-131 and gamma-emitting isotopes (continued).
Collection Lab Concentration (pCVL)Date Code 1-131 Cs-134 Cs-137 Ba-La-140 K-40
Indicators
K-38
01-02-03 KMI-24,5 <0.5 <10 <10 <15 1370±11102-03-03 -464 <0.5 <10 <10 <15 1340±11903-03-03 - 890 < 0.5 <10 <10 < 15 1362 ± 16104-02-03 - 1426 < 0.5 <10 <10 < 15 1313 ± 9105-02-03 - 2172 < 0.5 <10 <10 < 15 1418 ± 11905-13-03 - 2573 < 0.5 <10 <10 < 15 1287 ± 12306-03-03 - 2897 < 0.5 <10 <10 < 15 1399 ± 20006-17-03 - 3291 < 0.5 <10 <10 < 15 1434 ± 17307-01-03 - 3582 < 0.5 <10 <10 < 15 1364 ±11407-15-03 -3989 <0.5 <10 <10 <15 1381 ±12608-07-03 - 4531 < 0.5 <10 <10 < 15 1366 ± 16808-19-03 -4741 < 0.5 <10 <10 < 15 1438 ± 18609-03-03 -4985 < 0.5 <10 <10 < 15 1404 ± 11909-16-03 - 5286 < 0.5 <10 <10 < 15 1110 ± 16510-01-03 - 5618 < 0.5 <10 <10 < 15 1186 ± 16110-14-03 - 6032 < 0.5 <10 <10 < 15 1200 ± 10311-04-03 - 6611 < 0.5 <10 <10 < 15 1304 ± 13112-02-03 - 7146 < 0.5 <10 <10 < 15 1326 ± 175
K-39 a
01-03-0302-04-0303-04-0304-01-0305-01-0305-13-0306-02-0306-17-0307-01-03 KMI - 3583 < 0.5 <10 <10 < 15 1400 17607-15-03 - 3990 < 0.5 <10 <10 < 15 1245 ±17708-04-03 - 4395 < 0.5 <10 <10 < 15 1313 ± 18308-19-03 -4742 <0.5 <10 <10 <15 1364 ±13309-03-03 -4986 <0.5 <10 <10 <15 1491 ±12709-16-03 - 5287 < 0.5 <10 <10 < 15 1392 ± 12310-01-03 -5619 <0.5 <10 <10 < 15 1201 ±16510-14-03 - 6033 < 0.5 <10 <10 < 15 1458 ± 12511-04-03 -6612 <0.5 <10 <10 <15 1418±12012-02-03 -7147 <0.5 <10 <10 <15 1351 ±127
a K-39, Wolta Farm, added to program July 1, 2003.
46

I I I
KEWAUNEE
Table 14. Milk, analyses for iodine-131 and gamma-emitting isotopes (continued). I i
Collection Lab Concentration (pCVL)Date Code 1-131 Cs-134 Cs-137 Ba-La-140 K-40
Control
K-3
01-03-03 KMI - 19 < 0.5 <10 <10 < 15 1362 i 18202-04-03 -459 < 0.5 <10 <10 < 15 1560 i 13003-04-03 -885 < 0.5 <10 <10 < 15 1536 i 21204-02-03 - 1420 < 0.5 <10 <10 < 15 1394 ± 11405-02-03 -2166 < 0.5 <10 <10 < 15 1496 ± 12805-13-03 -2568 <0.5 <10 <10 < 15 1411 ±11206-03-03 - 2892 < 0.5 <10 <10 < 15 1170 ± 17306-17-03 -3286 <0.5 <10 <10 <15 1391 ±17307-02-03 - 3577 < 0.5 <10 <10 < 15 1514 ± 19507-15-03 - 3984 < 0.5 <10 <10 < 15 1386 ± 12008-05-03 -4390 < 0.5 <10 <10 < 15 1380± 11208-19-03 -4735,6 <0.5 <10 <10 <15 1403±8809-03-03 -4980 < 0.5 <10 <10 < 15 1457 i 17409-16-03 - 5281 < 0.5 <10 <10 < 15 1404 ± 20610-02-03 - 5613 < 0.5 <10 <10 < 15 1399 ± 15710-14-03 - 6027 < 0.5 <10 <10 < 15 1483 ± 18211-04-03 -6606 <0.5 <10 <10 <15 1299±10912-02-03 - 7141 < 0.5 <10 <10 < 15 1367 ± 162
K-28
01-03-03 KMI - 22 < 0.5 <10 <10 < 15 1482 i 12002-04-03 -462 <0.5 <10 <10 <15 1453±11303-04-03 - 888 < 0.5 <10 <10 < 15 1420 ± 20404-02-03 - 1424 < 0.5 <10 <10 < 15 1466 ± 17005-01-03 -2169 <0.5 <10 <10 <15 1376±11905-13-03 - 2571 < 0.5 <10 <10 < 15 1415 ± 17506-02-03 -2895 <0.5 <10 <10 <15 1332±12306-17-03 -3289 < 0.5 <10 <10 < 15 1398 ± 19007-02-03 -3580 < 0.5 <10 <10 < 15 1482 ± 18507-15-03 - 3987 < 0.5 <10 <10 < 15 1465± 18608-04-03 -4393 < 0.5 <10 <10 < 15 1291 ± 12808-19-03 -4739 < 0.5 <10 <10 < 15 1298 ± 12509-03-03 -4983 < 0.5 <10 <10 < 15 1310 ± 17709-16-03 -5284 <0.5 <10 <10 <15 1381 ±18710-02-03 -5616 <0.5 <10 <10 <15 1401 ±20410-14-03 - 6030 < 0.5 <10 <10 < 15 1325 ± 16711-04-03 - 6609 < 0.5 <10 <10 < 15 1220 ± 16412-02-03 - 7144 < 0.5 <10 <10 < 15 1398 ± 179
47
LI`
I"II"I|II1,
I
I.,I.Ii1

KEWAUNEE
Table 15. Milk, analyses for strontium-89, strontium-90, stable potassium, stable calcium, andratios of strontium-90 per gram of calcium and cesium-1 37 per gram of potassium.Collection: Monthly composites.
Ratios
Sr-90 Cs-137Concentration per per
Collection Lab Sr-89 Sr-90 K Ca gram gramPeriod Code (pCiIL) (pCi/L) (giL) (g/L) Ca K
Indicators
K-5
JanuaryFebruaryMarchAprilMayJuneJulyAugustSeptemberOctoberNovemberDecember
KMI - 20 < 1.2- 460 < 1.0-886 < 0.8-1421 < 1.1
*-2577 < 0.9- 3293 < 1.2- 4129 < 0.9- 4751 < 0.9- 5313 < 1.1- 6036 < 0.9--6607 <0.9- 7142 < 1.0
1.8 + 0.51.1 +0.41.0 ± 0.41.0 i 0.41.7 i 0.42.2 i 0.63.1 ±0.61.4 + 0.41.0 i 0.40.9 ± 0.40.8 ± 0.4
<0.7
1.51 ±0.13 0.84 2.10 <6.611.65 i 0.21 0.89 1.24 < 6.051.71 ±0.21 1.10 0.91 <5.841.33 ±0.19 0.75 1.33 <7.511.49 ± 0.17 0.76 2.24 < 6.711.52 ±0.20 0.85 2.59 <6.581.43 ±0.19 0.93 3.33 <7.001.44 ± 0.16 1.03 1.36 < 6.951.53 ± 0.17 0.76 1.32 < 6.521.44 ± 0.20 .0.78 1.15 < 6.931.47 ± 0.13 0.84 0.95 < 6.781.48 ± 0.20 0.78 < 0.90 < 6.77
K-25
JanuaryFebruaryMarchAprilMayJuneJulyAugustSeptemberOctoberNovemberDecember
KMI - 21 < 0.9-461 < 0.7- 887 < 0.6-1422,3 <0.7- 2578 < 0.7- 3294 < 1.1-4130 < 1.0-4752 < 0.7-5314 <0.9- 6037 < 1.1- 6608 < 0.7-7143 <0.8
1.4 ± 0.41.2 ± 0.41.0 ± 0.41.5 ± 0.30.8 ± 0.42.7 ± 0.61.1 ± 0.51.4 ± 0.40.8 ± 0.30.9 ± 0.40.7 ± 0.30.9 ± 0.4
1.54 ± 0.15 0.86 1.64 < 6.501.77 ± 0.15 0.98 1.22 < 5.661.43 ± 0.19 0.93 1.08 < 6.981.59 ± 0.12 0.89 1.69 < 6.291.35 ± 0.19 0.79 1.01 < 7.381.47 ± 0.16 0.81 3.33 < 6.781.61 ± 0.17 0.95 1.16 <6.231.61 ± 0.18 0.98 1.43 <6.221.55 ± 0.18 0.84 0.95 < 6.431.56 ± 0.18 1.11 0.81 < 6.411.78 ± 0.15 0.81 0.86 < 5.601.64 ± 0.20 0.86 1.05 < 6.10
48

I~I I
1iKEWAUNEE
Table 15. Milk, analyses for strontium-89, strontium-90, stable potassium, stable calcium, and ratiosof strontium-90 per gram of calcium and cesium-1 37 per gram of potassium (continued).
Ratios
Sr-90 Cs-I 37Concentration per per
Collection Lab Sr-89 Sr-90 K Ca gram gramPeriod Code (pCIL) (pCVL) (gIL) (gIL) Ca K
Indicators
K-34
January KMI - 23 < 0.8 1.0 i 0.4 1.78 ± 0.21 0.78 1.28 < 5.60February -463 < 0.9 0.9 ± 0.4 1.74 ± 0.15 0.84 1.07 < 5.73March - 889 < 0.6 0.7 ± 0.3 1.75 ± 0.15 0.89 0.79 < 5.71April - 1425 <0.9 1.1 ± 0.4 1.60 ± 0.22 0.79 1.41 <6.24May - 2580 < 0.8 1.4 ± 0.4 1.68 ± 0.17 0.74 1.89 < 5.95June - 3296 < 0.8 1.7 ± 0.4 1.68 ± 0.21 0.85 2.00 < 5.95July - 4132 < 0.7 1.4 i 0.4 1.66 ± 0.21 0.90 1.56 < 6.04August - 4754 <0.8 1.3 ± 0.5 1.69 ± 0.22 0.73 1.78 <5.91September - 5316 < 1.1 0.8 ± 0.3 1.59 ± 0.20 0.75 1.07 < 6.30October -6039 <0.7 0.9 ± 0.3 1.45 ± 0.17 0.92 0.98 <6.91November - 6610 < 0.7 < 0.6 1.48 ± 0.21 0.85 < 0.71 < 6.77December -7145 < 0.7 < 0.6 1.66 ± 0.20 0.76 < 6.01
LI
L.
I
I"
IIIII1IIII
49 -U

------
KEWAUNEE
Table 15. Milk, analyses for strontium-89, strontium-90, stable potassium, stable calcium, and ratiosof strontium-90 per gram of calcium and cesium-137 per gram of potassium (continued).
Ratios
Sr-90 Cs-137Concentration per per
Collection Lab Sr-89 Sr-90 K Ca gram gramPeriod Code (pCVL) (pCUL) (gIL) (glL) Ca K
Indicators
K-38
January KMI - 24, 5 < 1.1 1.8 0.3 1.58 ± 0.13 0.82 2.20 < 6.31February - 464 < 0.8 0.8 i 0.4 1.55 i 0.14 0.86 0.93 < 6.46March - 890 < 0.7 1.3 ± 0.5 1.57 ± 0.19 0.90 1.44 < 6.35April - 1426 < 0.9 1.6 i 0.4 1.52 ± 0.11 0.83 1.98 < 6.59May - 2581 < 0.8 1.9 i 0.5 1.56 ± 0.14 0.79 2.41 < 6.40June - 3297, 8 < 0.9 2.2 i 0.4 1.64 ± 0.22 0.81 2.72 < 6.11July - 4133 < 0.7. 1.6 ± 0.4 1.59 ± 0.14 1.02 1.57 < 6.30August - 4755 < 0.8 2.0 ± 0.5 1.62 i 0.20 0.78 2.56 < 6.17September -5317 <1.0 1.1 ±0.4 1.45 ±0.16 0.76 1.45 <6.88October - 6040 < 0.7 1.0 ± 0.4 1.38 ± 0.15 0.84 1.19 < 7.25November - 6611 <0.9 1.5 ± 0.4 1.51 ± 0.15 0.77 1.95 <6.63December - 7146 < 0.7 1.1 ± 0.3 1.53 ± 0.20 0.86 1.28 <6.52
K-39
JanuaryFebruaryMarchAprilMayJuneJuly KMI - 4134 < 0.8 0.7 ± 0.4 1.53 ± 0.20 1.01 0.69 < 6.54August -4756,7 < 0.7 1.6 ± 0.3 1.55 ± 0.18 0.89 1.80 < 6.46September - 5318 < 1.3 1.6 ± 0.5 1.67 + 0.14 0.78 2.05 < 6.00October - 6041 < 0.7 1.2 ± 0.3 1.54 ± 0.17 0.97 1.24 < 6.51November - 6612 < 0.9 1.1 ± 0.4 1.64 ± 0.14 0.78 1.41 < 6.10December - 7147 < 0.8 < 0.6 1.56 i 0.15 0.77 < 6.40
50
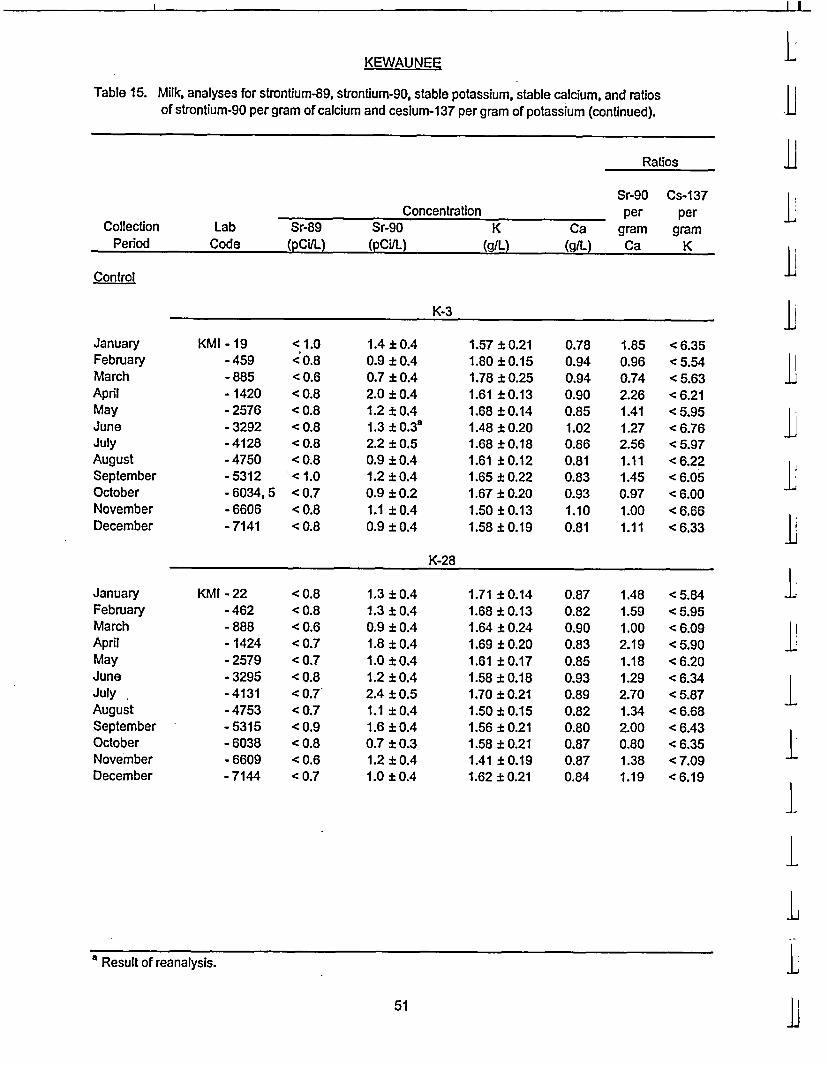
II
KEWAUNEE
Table 15. Milk, analyses for strontium-89, strontium-90, stable potassium, stable calcium, and ratiosof strontium-90 per gram of calcium and cesium-137 per gram of potassium (continued).
Ratios
Sr-90 Cs-137Concentration per per
Collection Lab Sr-89 Sr-90 K Ca gram gramPeriod Code (pCiIL) (pCVL) (g/L) (gIL) Ca K
Control
K-3
JanuaryFebruaryMarchAprilMayJuneJulyAugustSeptemberOctoberNovemberDecember
KMI-19 <1.0-459 c 0.8- 885 < 0.6- 1420 < 0.8- 2576 < 0.8- 3292 < 0.8-4128 < 0.8-4750 < 0.8- 5312 < 1.0- 6034, 5 < 0.7- 6606 < 0.8-7141 < 0.8
1.4 + 0.40.9 ± 0.40.7 ± 0.42.0 + 0.41.2 + 0.41.3 ± 0.3a2.2 ± 0.50.9 ± 0.41.2 ± 0.40.9 ± 0.21.1 ±0.40.9 ± 0.4
1.57 ± 0.211.80 ± 0.151.78 ± 0.251.61 ±0.131.68 ± 0.141.48 ± 0.201.68 ± 0.181.61 ± 0.121.65 ± 0.221.67 ± 0.201.50 ± 0.131.58 ± 0.19
0.78 1.85 < 6.350.94 0.96 < 5.540.94 0.74 < 5.630.90 2.26 < 6.210.85 1.41 < 5.951.02 1.27 < 6.760.86 2.56 < 5.970.81 1.11 < 6.220.83 1.45 < 6.050.93 0.97 < 6.001.10 1.00 < 6.660.81 1.11 < 6.33
K-28
JanuaryFebruaryMarchAprilMayJuneJulyAugustSeptemberOctoberNovemberDecember
KMI-22 <0.8-462 <0.8- 888 < 0.6-1424 < 0.7- 2579 < 0.7- 3295 < 0.8-4131 < 0.7-4753 < 0.7-5315 <0.9- 6038 < 0.8- 6609 < 0.6- 7144 < 0.7
1.3 ± 0.41.3 ± 0.40.9 ± 0.41.8 ± 0.41.0 ±0.41.2 ±0.42.4 ± 0.51.1 ±0.41.6 ± 0.40.7 ± 0.31.2 ± 0.41.0 ± 0.4
1.71 ± 0.141.68 ± 0.131.64 ± 0.241.69 ± 0.201.61 ± 0.171.58 ± 0.181.70 ± 0.211.50 ± 0.151.56 ± 0.211.58 ± 0.211.41 ± 0.191.62 ± 0.21
0.87 1.48 < 5.840.82 1.59 < 5.950.90 1.00 < 6.090.83 2.19 < 5.900.85 1.18 < 6.200.93 1.29 < 6.340.89 2.70 < 5.870.82 1.34 < 6.680.80 2.00 < 6.430.87 0.80 < 6.350.87 1.38 < 7.090.84 1.19 < 6.19
8 Result of reanalysis.
51 Iu
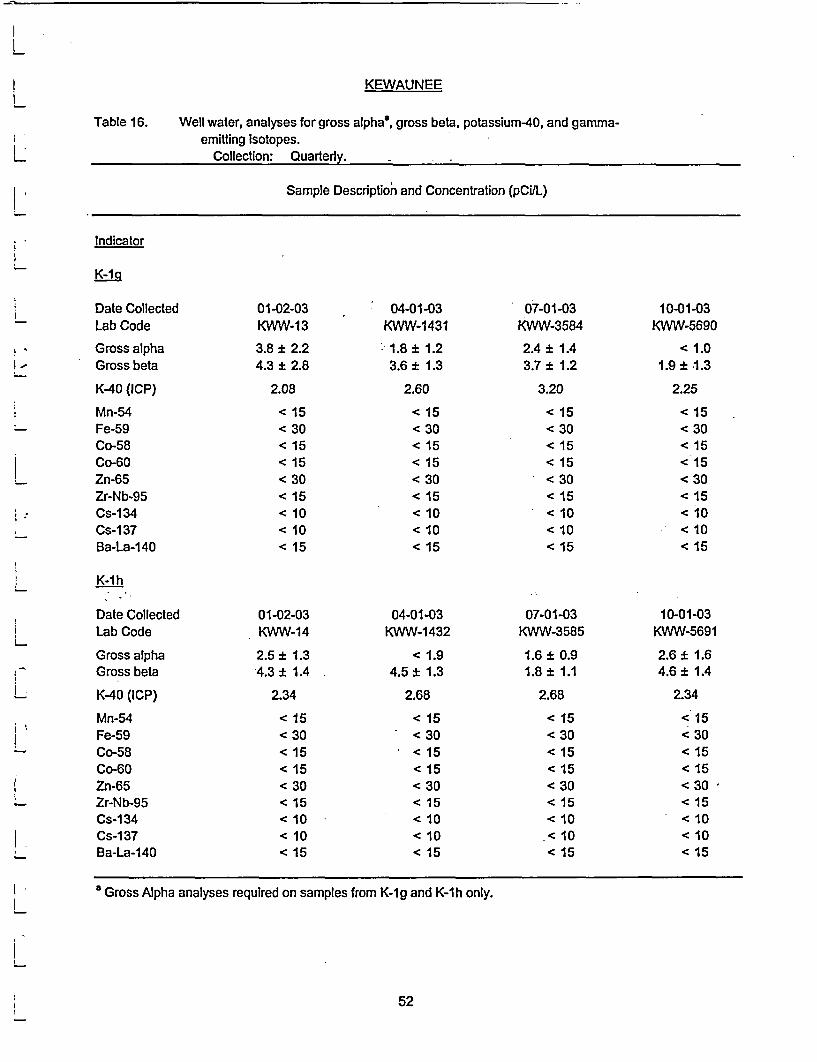
KEWAUNEE
Table 16. Well water, analyses for gross alpha", gross beta, potassium-40, and gamma-emitting Isotopes.
Collection: Quarterly. -
Sample Descriptioh and Concentration (pCilL)
Indicator
K-Ia
Date CollectedLab Code
Gross alphaGross beta
K-40 (ICP)
Mn-54Fe-59Co-58Co-60Zn-65Zr-Nb-95Cs-134Cs-137Ba-La-140
01-02-03KWW-13
3.8 i 2.24.3 ± 2.8
2.08
< 15< 30< 15< 15< 30< 15< 10< 10< 15
04-01-03KWW-1431
- 1.8 ± 1.23.6 ± 1.3
2.60
< 15< 30< 15< 15< 30< 15< 10< 10< 15
07-01-03KWW-3584
2.4 ± 1.43.7 ± 1.2
3.20
< 15< 30< 15< 15< 30< 15< 10< 10< 15
10-01-03KWW-5690
< 1.01.9 ± 1.3
2.25
< 15< 30< 15< 15< 30< 15< 10
- < 10< 15
K-1h
Date CollectedLab Code
01-02-03KWW-14
04-01-03KWW-1432
07-01-03KWW-3585
Gross alphaGross beta
K-40 (ICP)
Mn-54Fe-59Co-58Co-60Zn-65Zr-Nb-95Cs-134Cs-1 37Ba-La-140
2.5 i 1.34.3 ± 1.4
2.34
< 15< 30< 15< 15< 30< 15< 10< 10< 15
< 1.94.5 ± 1.3
2.68
< 15< c30< 15< 15< 30< 15< 10< 10< 15
1.6 ± 0.91.8 ± 1.1
2.68
< 15< 30< 15< 15< 30< 15< 10< 10< 15
10-01-03KWW-5691
2.6 ± 1.64.6 ± 1.4
2.34
< 15< 30< 15< 15< 30< 15< 10< 10< 15
a Gross Alpha analyses required on samples from K-1g and K-1h only.
52

I~I I
LIKEWAUNEE
Well water, analyses for gross alpha, gross beta, potassium-40, and gamma-emitting isotopes (continued).
liTable 16.
hLSample Description and Concentration (pCVL) k
Indicator
L1K-10
Date CollectedLab Code
Gross beta
01-02-03KWW-15
3.8 ± 2.2
K-40 (ICP)
Mn-54Fe-59Co-58Co-60Zn-65Zr-Nb-95Cs-i 34Cs-137Ba-La-140
1.04
< 15< 30< 15< 15< 30< 15< 10< 10< 15
K-1I
04-01-03KWW-1433
< 2.1
0.87
< 15< 30< 15< 15< 30< 15< 10
< 10< 15
04-01-03KWW-1434
< 0.9
0.95
< 15< 30< 15< 15< 30< 15< 10< 10< 15
07-01-03KWW-3586
< 1.7
< 0.87
< 15< 30< 15< 15< 30< 15< 10< 10< 15
07-01-03KWW-3587
0.6 + 0.3
< 0.87
< 15< 30< 15< 15< 30< 15< 10< 10< 15
10-01-03KWW-5692
< 1.9
< 0.87
< 15< 30< 15< 15< 30< 15< 10< 10< 15
1
11
1
I'
iDate CollectedLab Code
Gross beta
K-40 (ICP)
Mn-54Fe-59Co-58Co-60Zn-65Zr-Nb-95Cs-134Cs-137Ba-La-140
01-02-03KWW-16
1.2 ± 0.6
< 0.87
< 15< 30< 15< 15< 30< 15< 10
*< 10< 15
10-01-03KWW-5693
< 0.8
< 0.87
< 15< 30< 15< 15< 30< 15< 10< 10
<15
I
1III-I1I
53 I

KEWAUNEE
Table 16. Well water, analyses for gross alpha, gross beta, potassium-40, and gamma-emitting isotopes (continued).
Sample Description and Concentration (pCUL)
Indicator
K-25
Date CollectedLab Code
-Gross beta
K-40 (ICP)
Mn-54Fe-59Co-58Co-60Zn-65Zr-Nb-95Cs-1 34Cs-1 37Ba-La-140
01-02-03KWW-18
1.5 ± 0.5
0.95
< 15< 30< 15< 15< 30< 15< 10< 10< 15
04-01-03KWW-1436
1.5 ± 0.5
1.12
< 15< 30< 15< 15< 30< 15< 10< 10< 15
07-01-03KWW-3589
1.0 ± 0.2
0.87
< 15< 30< 15< 15< 30< 15< 10< 10< 15
10-01-03KWW-5695
1.6 ± 0.5
1.04
< 15< 30< 15< 15< 30< 15< 10< 10< 15
Control
K-1 3
Date CollectedLab Code
Gross beta
K-40 (ICP)
Mn-54Fe-59Co-58Co-60Zn-65Zr-Nb-95Cs-134Cs-137Ba-La-140
01-02-03KWW-17
1.1 ± 0.5
0.95
< 15< 30< 15< 15< 30< 15< 10< 10< 15
04-01-03KWW-1435
1.4 ± 0.5
1.04
< 15< 30< 15< 15< 30< 15< 10< 10< 15
07-01-03KWW-3588
1.4 ± 0.2
1.04
< 15< 30< 15< 15< 30< 15< 10< 10< 15
10-01-03KWW-5694
1.4 ± 0.5
0.87
< 15< 30< 15< 15< 30< 15< 10< 10< 15
54

I I
LiKEWAUNEE
Table 17. Well waters from K-1g , analyses for tritium, strontium-89, and strontium-90.Collection: Quarterly.
LII
Concentration (pCYL)Date Collected Lab Code H-3 Sr-89 Sr-90
01-02-03 KWW - 13 < 131 < 1.1 < 0.604-01-03 - 1431 < 157 < 0.5 < 0.507-01-03 - 3584 < 158 < 0.5 < 0.510-01-03 - 5690 < 166 < 0,8 < 0.5
I,
I`
11
I
ILI
e..I-1li
155 II,

KEWAUNEE
Table 18. Domestic meat samples (chickens), analyses of flesh for gross alpha, gross beta,and gamma-emitting Isotopes. Annual collection.
Sample Description and Concentration (pClg wet)
Indicator Control
Location K-24 K-29 K-34 K-32
Date CollectedLab Code
09-02-03KME-4966
09-02-03KME-4967
09-02-03KME-4968, 9
Gross AlphaGross Beta
Be-7K-40Nb-95Zr-95Ru-103Ru-1 06Cs-134Cs-1 37-Ce-141Ce-144
< 0.102.90 ± 0.17
< 0.142.46 ± 0.44
< 0.028< 0.052< 0.026< 0.12< 0.012< 0.018< 0.041< 0.11
< 0.103.38 ± 0.18
< 0.145.04 ± 0.17
< 0.243.08 ± 0.45
< 0.030< 0.041< 0.019< 0.093< 0.011< 0.009< 0.055< 0.10
< 0.152.57 ± 0.28
< 0.013< 0.031< 0.019< 0.13< 0.011< 0.013< 0.032< 0.069
56

I I I
LKEWAUNEE
Table 19. Eggs, analyses for gross beta, strontium-89, strontium-90 and gamma emitting isotopes.Collection: Quarterly
Ill
Sample Description and Concentration (pCIfg wet)
LiLocation
Date CollectedLab Code
K-24
01-02-03KE-26
04-01-03KE-1427
07-01-03KE-3575
10-01-03KE-5620 LI
Gross beta
Sr-89Sr-90
Be-7K-40Nb-95Zr-95Ru-i 03Ru-106Cs-134Cs-137Ce-141Ce-144
Location
Date CollectedLab Code
Gross beta
Sr-89Sr-90
Be-7K-40Nb-95Zr-95Ru-103Ru-106Cs-134Cs-137Ce-141Ce-144
1.36 ± 0.09
< 0.0080.003 ± 0.002
< 0.0801.15 i 0.20
< 0.010< 0.012< 0.006< 0.055< 0.009< 0.004< 0.014< 0.030
1.48 ± 0.12
< 0.0140.010 ± 0.004
< 0.0551.41 ± 0.21
< 0.008<0.015< 0.005< 0.073< 0.009< 0.008< 0.012< 0.054
0.69 ± 0.04
< 0.005< 0.003
< 0.0611.24 ± 0.22
< 0.004<0.010< 0.005< 0.053< 0.007< 0.005< 0.014< 0.046
1.36 ± 0.04
< 0.007< 0.002
< 0.0571.24 ± 0.18
<0.013< 0.017< 0.012< 0.057< 0.005< 0.007< 0.013< 0.029
J iI?
I!I
K-32
01-02-03KE-27
1.34 ± 0.08
< 0.014< 0.005
<0.111.58 ± 0.29
< 0.013< 0.012< 0.009<0.12<0.011< 0.004< 0.017< 0.058
04-01-03KE-1428
1.31 ± 0.10
< 0.0150.008 ± 0.004
< 0.0271.19 ± 0.16
< 0.003< 0.009< 0.004< 0.038< 0.004< 0.005< 0.008< 0.036
07-01-03KE-3576
1.45 ± 0.06
< 0.009< 0.007
< 0.0741.08 i 0.24
< 0.006< 0.014<0.010< 0.10< 0.007< 0.010< 0.008< 0.043
10-01-03KE-5621
1.31 ± 0.04
< 0.010< 0.003
< 0.0551.45 ± 0.16
< 0.007< 0.012< 0.008< 0.046< 0.007< 0.005< 0.023< 0.041
iI"II.
i.1
-Ii
57.1

KEWAUNEE
Table 20. Vegetable and grain samples, analyses for gross beta, strontium-89, strontium-90,and gamma-emitting isotopes. Annual collection.
Sample Description and Concentration (pClg wet)
Indicator
Location
Date CollectedLab CodeType
Gross beta
Sr-89Sr-90
Be-7K-40Nb-95Zr-95Ru-1 03Ru-1 06Cs-134Cs-137Ce-141Ce-144
K-17 K-23
Make separate PAGE FOR CALCULATION
K-29
09-03-03KVE-5005Pumpkin
2.50 i 0.05
< 0.009< 0.002
< 0.112.34 i 0.29
< 0.011< 0.016< 0.011< 0.075< 0.009< 0.008< 0.024< 0.058
Location K-26 (control)
Date CollectedLab CodeType
Gross beta
Sr-89Sr-90
09-03-03KVE-4999
Corn
2.69 ± 0.05
< 0.004< 0.002
Be-7K-40Nb-95Zr-95Ru-1 03Ru-1 06Cs-134Cs-137Ce-141Ce-144
< 0.122.43 ± 0.43
< 0.009< 0.018< 0.012< 0.079< 0.012< 0.012< 0.023< 0.058
09-03-03KVE-5000Cucumber
1.08 ± 0.02
< 0.002< 0.001
< 0.0460.72 ± 0.14
< 0.002< 0.005< 0.005< 0.037< 0.005< 0.007< 0.007< 0.039
09-03-03KVE-5001Cabbage
1.71 ± 0.04
< 0.0030.001 ± 0.001
< 0.0401.45 ± 0.18
< 0.008< 0.008< 0.007< 0.045< 0.006< 0.006< 0.009< 0.063
09-03-03KVE-5002Cauliflower
2.62 ± 0.05
< 0.007< 0.002
< 0.0752.37 ± 0.27
< 0.008< 0.021< 0.011< 0.077< 0.011< 0.006< 0.021< 0.081
58

I - I L
LiKEWAUNEE
Table 20. Vegetable and grain samples, analyses for gross beta, strontium-89, strontium-90,and gamma-emitting isotopes (continued).
LI
Sample Description and Concentration (pCig wet)
1Location K-26 (control)
Date CollectedLab CodeType
Gross beta
Sr-89Sr-90
Be-7K-40Nb-95Zr-95Ru-1 03Ru-106Cs-134Cs-137Ce-141Ce-14
09-03-03KVE-5003
Red Cabbage
2.82 ± 0.05
< 0.003< 0.001
< 0.0602.15 + 0.32
< 0.008< 0.018< 0.010< 0.093< 0.011< 0.015< 0.023< 0.079
09-03-03KVE-5004Tomato
2.33 ± 0.05
< 0.004< 0.002
< 0.0582.24 * 0.32
< 0.004< 0.021< 0.008< 0.11< 0.007< 0.011< 0.012< 0.041
10-02-03KVE-5643Pumpkin
1.04 ± 0.02
< 0.003< 0.001
< 0.121.37 i 0.26
< 0.011< 0.025< 0.015< 0.056< 0.008< 0.007< 0.024< 0.084
I
I
1,
1,-I
I:ILIi
-1I
II
59 1
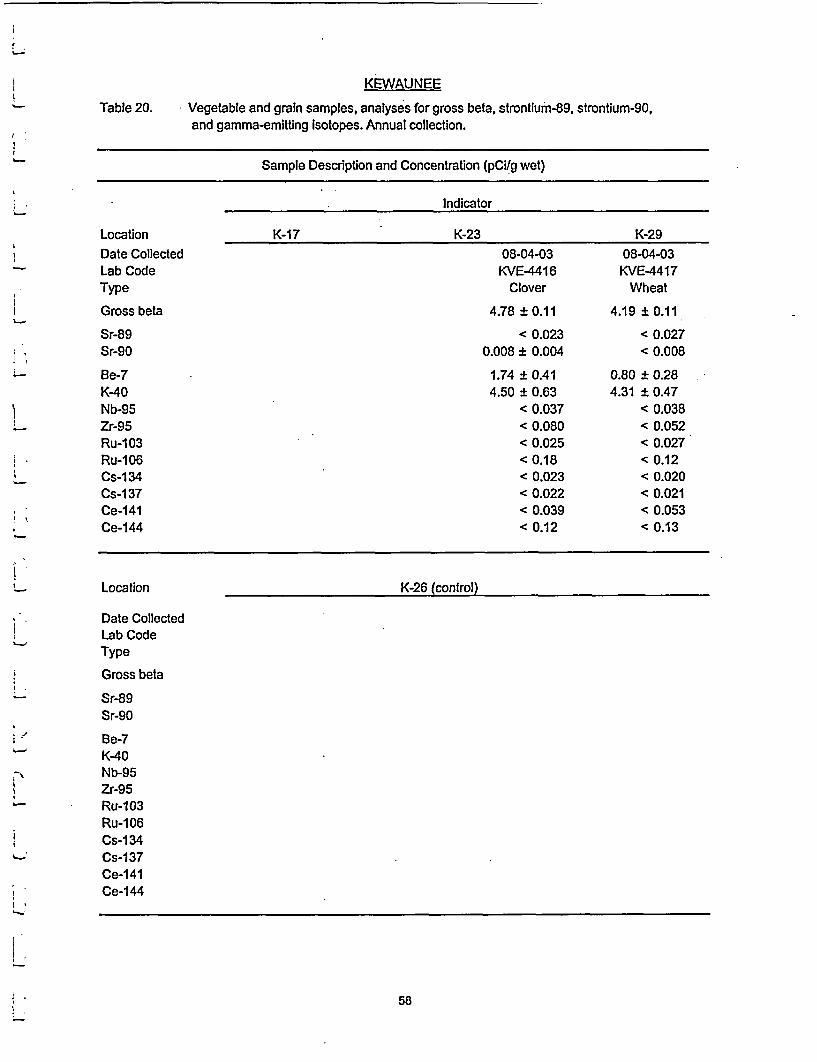
KEWAUNEE
Table 20. Vegetable and grain samples, analyses for gross beta, strontium-89, strontium-90,and gamma-emitting isotopes. Annual collection.
Sample Description and Concentration (pCi/g wet)
Indicator
K-17 K-23 K-29Location
Date CollectedLab CodeType
Gross beta
Sr-89Sr-90
Be-7K-40Nb-95Zr-95Ru-103Ru-1 06Cs-1 34Cs-1 37Ce-141Ce-144
08-04-03KVE-4416
Clover
4.78 ±0.11
< 0.0230.008 + 0.004
1.74 + 0.414.50 + 0.63
< 0.037< 0.080< 0.025< 0.18< 0.023< 0.022< 0.039< 0.12
08-04-03KVE-4417
Wheat
4.19 i 0.11
< 0.027< 0.008
0.80 i 0.284.31 ± 0.47
< 0.038< 0.052< 0.027< 0.12< 0.020< 0.021< 0.053< 0.13
Location K-26 (control)
Date CollectedLab CodeType
Gross beta
Sr-89Sr-90
Be-7K-40Nb-95Zr-95Ru-103Ru-106Cs-134Cs-137Ce-141Ce-1 44
58

I l
KEWAUNEE
Table 20. Vegetable and grain samples, analyses for gross beta, strontium-89, strontium-90, Land gamma-emitting isotopes (continued).
Sample Description and Concentration (pCilg wet)
Location K-26 (control)
Date CollectedLab Code lbType
Gross beta |
Sr-89Sr-90
Be-7 LK40Nb-95Zr-95|Ru-103Ru-1 06Cs-134Cs-1 37Ce-141Ce-144
i
59 ..I

KEWAUNEE
Table 21. Cattlefeed, analyses for gross beta, strontium-89, strontium-90, and gamma-emitting isotopes.
Collection: First Quarter.
Sample Description and Concentration (pCi/g wet)
, I Control
LocationDate CollectedLab CodeType
Gross beta
Sr-89Sr-90
Be-7K-40Nb-95Zr-95Ru-1 03Ru-106Cs-134Cs-137Ce-141Ce-144
K-301-02-03KCF-40
Hay
10.44 + 0.33
< 0.033<0.018
< 0.2010.68 ± 0.79
< 0.013< 0.028< 0.020< 0.16
* < 0.030< 0.014< 0.044< 0.13
K-301-02-03KCF-45Silage
3.27 + 0.11
< 0.0040.004 ± 0.001
< 0.162.94 i 0.38
< 0.019< 0.018< 0.018< 0.062< 0.013< 0.016< 0.027< 0.11
60
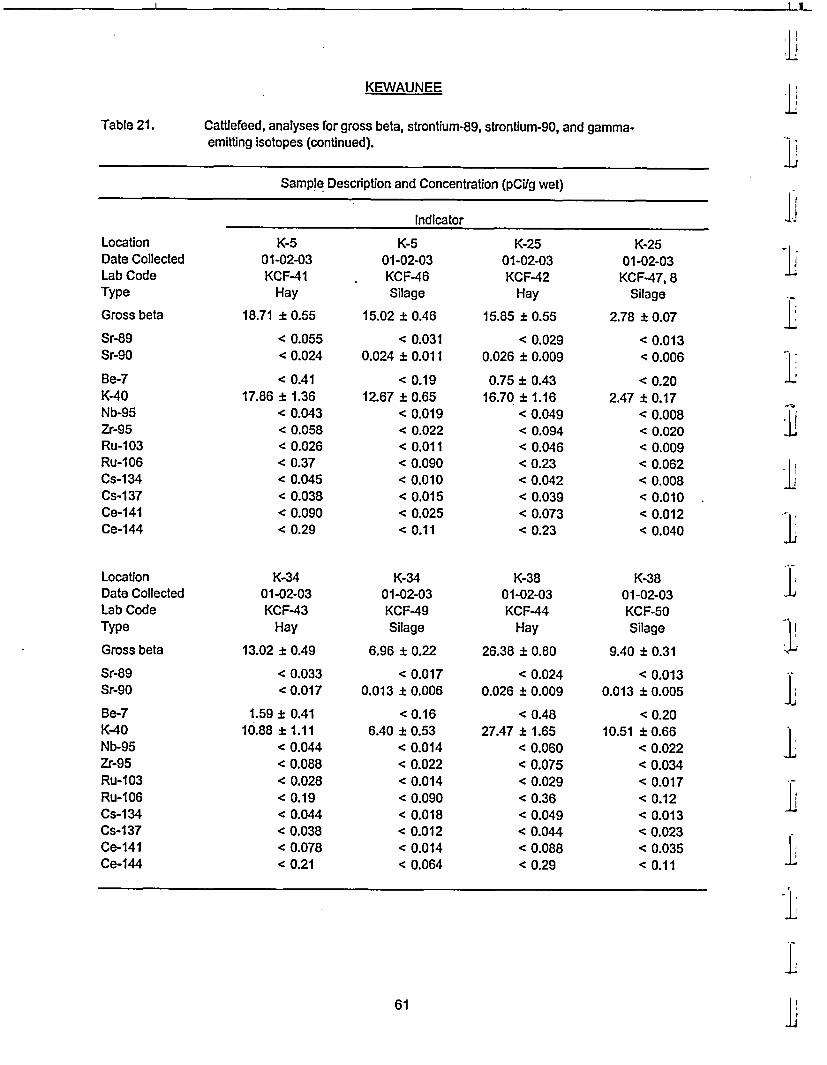
I'I
KEWAUNEE
Cattlefeed, analyses for gross beta, strontium-89, strontium-90, and gamma-emitting isotopes (continued).
Table 21.
Sample Description and Concentration (pCVg wet)
Indicator
LocationDate CollectedLab CodeType
Gross beta
Sr-89Sr-90
K-501-02-03KCF-41
Hay
18.71 * 0.55
< 0.055< 0.024
Be-7K-40Nb-95Zr-95Ru-103Ru-1 06Cs-i 34Cs-1 37Ce-141Ce-144
< 0.4117.86 ± 1.36
< 0.043< 0.058< 0.026< 0.37< 0.045< 0.038< 0.090< 0.29
K-501-02-03KCF-46Silage
15.02 ± 0.46
< 0.0310.024 ± 0.011
< 0.1912.67 ± 0.65
< 0.019< 0.022< 0.011< 0.090< 0.010< 0.015< 0.025< 0.11
K-2501-02-03KCF-42
Hay
15.85 ± 0.55
< 0.0290.026 ± 0.009
0.75 ± 0.4316.70 ± 1.16
< 0.049< 0.094< 0.046< 0.23< 0.042< 0.039< 0.073< 0.23
K-2501-02-03KCF-47, 8
Silage
2.78 i 0.07
< 0.013< 0.006
< 0.202.47 * 0.17
< 0.008< 0.020< 0.009< 0.062< 0.008< 0.010< 0.012< 0.040
LocationDate CollectedLab CodeType
Gross beta
Sr-89Sr-90
Be-7K-40Nb-95Zr-95Ru-i 03Ru-106Cs-134Cs-137Ce-141Ce-1M
K-3401-02-03KCF-43
Hay
13.02 ± 0.49
< 0.033< 0.017
1.59 ± 0.4110.88 ± 1.11
< 0.044< 0.088< 0.028< 0.19< 0.044< 0.038< 0.078< 0.21
K-3401-02-03KCF-49Silage
6.96 ± 0.22
< 0.0170.013 ± 0.006
<0.166.40 ± 0.53
< 0.014< 0.022< 0.014< 0.090< 0.018< 0.012< 0.014< 0.064
K-3801-02-03KCF-44
Hay
26.38 ± 0.80
< 0.0240.026 ± 0.009
< 0.4827.47 ± 1.65
< 0.060< 0.075< 0.029< 0.36< 0.049< 0.044< 0.088< 0.29
K-3801-02-03KCF-50Silage
9.40 i 0.31
< 0.0130.013 * 0.005
< 0.2010.51 * 0.66
< 0.022< 0.034< 0.017< 0.12< 0.013< 0.023< 0.035< 0.11
61

KEWAUNEE
Table 22. Grass, analyses for gross beta, strontium-89, strontium-90, and gamma-emitting Isotopes.Collection: Quarterly, April through DecemberUnits: pClg wet
Sample Description and Concentration
Indicator
LocationDate CollectedLab Code
Gross beta*Sr-89Sr-90Be-7K-40Mn-54Co-58Co-60Nb-95Zr-95Ru-1 03Ru-106Cs-134Cs-137Ce-141Ce-144
K-Ib06-02-03KG-2902
6.57 i 0.13
< 0.0070.005 i 0.003
0.45 ± 0.228.07 ± 0.77
< 0.022< 0.021< 0.024< 0.026< 0.038< 0.029< 0.12< 0.026< 0.021< 0.040<0.17
K-1f06-02-03KG-2903
K-505-01-03KG-2174
K-2505-01-03KG-2175
5.51 ± 0.11
< 0.008< 0.005
2.67 ± 0.486.22 ± 0.90
< 0.024< 0.014< 0.017<0.019< 0.057< 0.027< 0.23< 0.021< 0.028< 0.044<0.13
8.37 ± 0.22
< 0.0050.007 ± 0.002
1.18 ± 0.398.52 ± 0.86
< 0.036< 0.019< 0.024< 0.014< 0.045< 0.036< 0.28< 0.029< 0.021< 0.072< 0.27
6.95 ± 0.18
< 0.005< 0.002
0.28 ± 0.155.55 ± 0.51
<0.015<0.011< 0.012<0.015< 0.022< 0.011<0.13< 0.014<0.010< 0.017< 0.075
Indicator Control
LocationDate CollectedLab Code
Gross betaSr-89Sr-90Be-7K-40Mn-54Co-58Co-60Nb-95Zr-95Ru-103Ru-106Cs-134Cs-137Ce-141Ce-144
K-3406-02-03KG-2904
6.02 ± 0.11
< 0.0050.004 ± 0.002
< 0.306.48 ± 0.79
< 0.024< 0.016< 0.030< 0.026< 0.034< 0.014< 0.27< 0.032< 0.027< 0.033<0.15
K-3806-02-03KG-2905
5.95 ± 0.11< 0.005
0.007 ± 0.002<0.29
5.79 ± 0.74< 0.026< 0.021< 0.022< 0.021< 0.063< 0.027< 0.17< 0.036<0.018< 0.042< 0.14
K-305-01-03KG-2173
7.64 ± 0.21< 0.006< 0.004
0.94 ± 0.286.28 ± 0.74
<0.015<0.011< 0.021< 0.032< 0.034< 0.019< 0.14< 0.020< 0.028< 0.032<0.11
62

III
1 i
KEWAUNEE
Grass samples, analyses for gross beta, strontium-89, strontium-90, andgamma-emitting isotopes (continued).
ITable 22.
-LSample Description and Concentration
I'Indicator
LocationDate CollectedLab Code
Gross beta
Sr-89Sr-90
Be-7K-40Mn-54Co-58Co-60Nb-95Zr-95Ru-103Ru-106Cs-134Cs-137Ce-141Ce-144
K-i b08-04-03KG-4414
4.28 ± 0.11
< 0.020< 0.004
1.60 ± 0.465.09 ± 0.76
< 0.019< 0.033< 0.021< 0.042< 0.074< 0.044< 0.21< 0.033< 0.017<0.11<0.19
K-if09-02-03KG-5006
8.73 ± 0.22
< 0.0280.007 ± 0.004
2.24 ± 0.437.93 ± 0.88
< 0.035< 0.020< 0.023< 0.035< 0.053< 0.023< 0.32< 0.028< 0.026< 0.044<0.19
K-507-01-03KG-3571
7.49 ± 0.16
< 0.0070.025 ± 0.004
0.56 ± 0.246.86 ± 0.57
< 0.020<0.015<0.013< 0.022<0.019< 0.029< 0.16< 0.028<0.018< 0.049<0.18
K-2507-01-03
KG-3572,3
6.35 ± 0.11
< 0.0050.015 i 0.003
0.86 i 0.185.56 i 0.31
< 0.012<0.015<0.015< 0.008< 0.045<0.018<0.16< 0.018<0.018< 0.036< 0.095
Control
K-307-01-03KG-3570
11.23 ± 0.22
il
I
'.1i
I.I..I
Indicator i.
LocationDate CollectedLab Code
Gross beta
K-3408-04-03
KG-4419,20
5.37 ± 0.11
K-3809-15-03KG-5280
K-3907-01-03KG-3574
8.66 ± 0.19I
Sr-89Sr-90
Be-7K-40Mn-54Co-58Co-60Nb-95Zr-95Ru-103Ru-106Cs-134Cs-137Ce-141Ce-144
<0.015< 0.008
3.96 ± 0.424.37 ± 0.50
< 0.022< 0.022< 0.017< 0.039< 0.046< 0.033<0.24< 0.028< 0.026< 0.085<0.16
5.82 ±0.16
< 0.014< 0.006
4.10 ± 0.334.48 ± 0.45
< 0.014< 0.020< 0.006<0.016< 0.030< 0.018<0.10< 0.017<0.011< 0.023<0.11
< 0.0170.030 ± 0.012
0.63 ± 0.337.29 ± 0.81
<0.019< 0.038< 0.026< 0.021< 0.061< 0.033< 0.32< 0.025< 0.023< 0.064<0.24
< 0.0230.084 ± 0.015
1.10 i 0.5012.46 ± 1.57
< 0.037< 0.035< 0.044< 0.026< 0.083< 0.034<0.46< 0.040< 0.035< 0.078<0.31
1
Ii.III.i
63 L
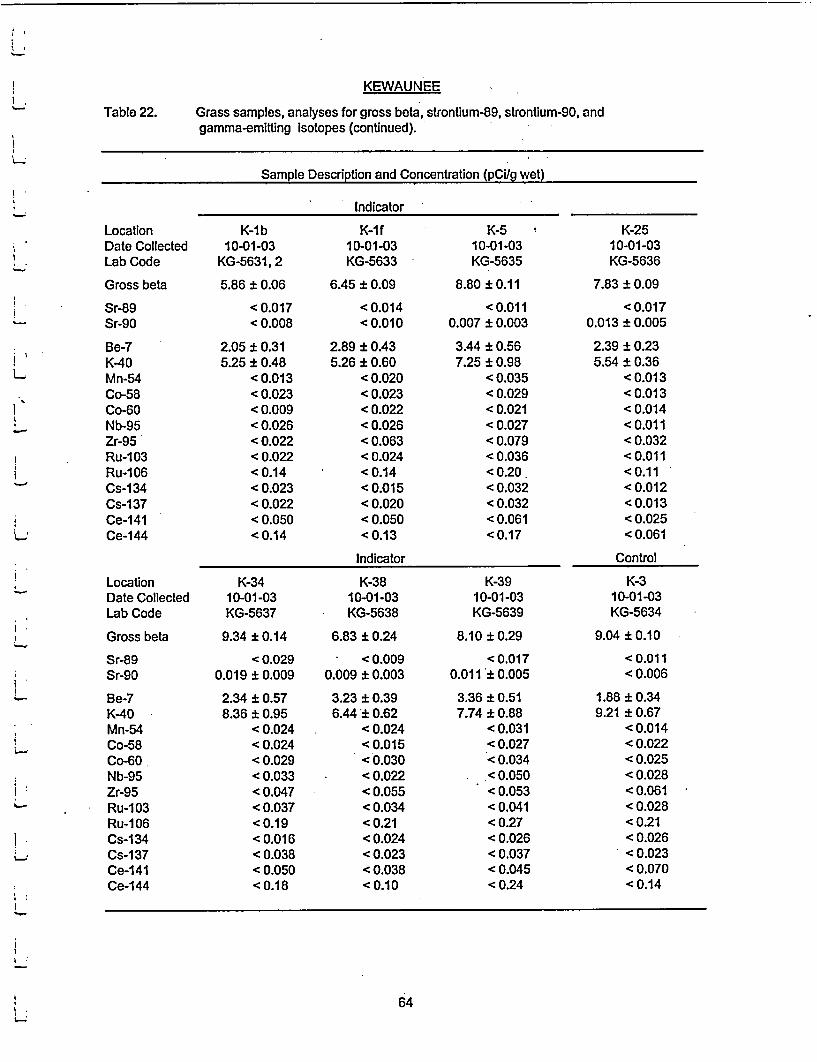
KEWAUNEE
Table 22. Grass samples, analyses for gross beta, strontium-89, strontium-90, andgamma-emitting Isotopes (continued).
Sample Description and Concentration (pClg wet)
Indicator
LocationDate CollectedLab Code
Gross beta
K-1 b10-01-03
KG-5631, 2
5.86 i 0.06
Sr-89Sr-90
Be-7K-40Mn-54Co-58Co-60Nb-95Zr-95Ru-103Ru-1 06Cs-1 34Cs-137Ce-141Ce-144
< 0.017< 0.008
2.05 i 0.315.25 i 0.48
<0.013< 0.023< 0.009< 0.026< 0.022< 0.022<0.14< 0.023< 0.022< 0.050< 0.14
K-If10-01-03KG-5633
6.45 i 0.09
< 0.014<0.010
2.89 ± 0.435.26 ± 0.60
< 0.020< 0.023< 0.022< 0.026< 0.063< 0.024<0.14<0.015< 0.020< 0.050<0.13
K-510-01-03KG-5635
8.80 ± 0.11
<0.0110.007 ± 0.003
3.44 ± 0.567.25 ± 0.98
< 0.035< 0.029< 0.021< 0.027< 0.079< 0.036< 0.20< 0.032< 0.032< 0.061<0.17
Indicator
K-2510-01-03KG-5636
7.83 ± 0.09
<0.0170.013 ± 0.005
2.39 ± 0.235.54 ± 0.36
<0.013<0.013< 0.014<0.011< 0.032<0.011<0.11<0.012<0.013< 0.025< 0.061
Control
K-310-01-03KG-5634
9.04 ± 0.10
<0.011< 0.006
1.88 ± 0.349.21 ± 0.67
< 0.014< 0.022< 0.025< 0.028< 0.061< 0.028<0.21< 0.026< 0.023< 0.070< 0.14
LocationDate CollectedLab Code
Gross beta
Sr-89Sr-90
Be-7K-40Mn-54Co-58Co-60Nb-95Zr-95Ru-103Ru-106Cs-1 34Cs-137Ce-141Ce-144
K-3410-01 -03KG-5637
9.34 i 0.14
< 0.0290.019 ± 0.009
2.34 ± 0.578.36 ± 0.95
< 0.024< 0.024< 0.029< 0.033< 0.047< 0.037<0.19< 0.016< 0.038< 0.050<0.18
K-3810-01-03KG-5638
6.83 ± 0.24
< 0.0090.009 ± 0.003
3.23 ± 0.396.44 i 0.62
< 0.024<0.015< 0.030
* < 0.022< 0.055< 0.034< 0.21< 0.024< 0.023< 0.038<0.10
K-3910-01 -03KG-5639
8.10 ± 0.29
< 0.0170.011 i0.005
3.36 ± 0.517.74 ± 0.88
< 0.031< 0.027< 0.034< 0.050< 0.053< 0.041< 0.27< 0.026< 0.037< 0.045< 0.24
64

I~I I
1.
Table 23.
KEWAUNEE
Soil samples, analyses for gross alpha, gross beta, strontium-89, strontium-90, andgamma-emitting isotopes.
Collection: Semiannually
II
Sample Description and Concentration (pCVg dry) IIndicator 'I
LocationDate CollectedLab Code
Gross alphaGross beta
Sr-89Sr-90
Be-7K-40Nb-95Zr-95Ru-103Ru-106Cs-134Cs-137Ce-141Ce-144
K-If05-01-03
KSO-2379
6.40 ± 4.3528.73 ± 4.64
< 0.11< 0.042
< 0.1717.66 ± 0.81
< 0.015< 0.035< 0.020< 0.15< 0.021< 0.009< 0.040< 0.096
K-505-01-03
KSO-2383
12.40 ± 5.6630.88 ± 4.91
< 0.0980.035 ± 0.015
< 0.1719.52 i 0.77
< 0.014< 0.033< 0.013< 0.14< 0.021< 0.036< 0.032< 0.13
K-2505-01-03
KSO-2381, 2
10.77 ± 3.8037.42 ± 3.52
< 0.0490.079 ± 0.014
< 0.1818.06 ± 0.59
< 0.014< 0.030< 0.023< 0.15< 0.013
0.10 ± 0.019< 0.034< 0.079
I
IIIIi
LocationDate CollectedLab Code
Gross alphaGross beta
K-1f10-01-03
KSO-5656
8.03 ± 3.1826.21 ± 3.10
Sr-89Sr-90
Be-7K-40Nb-95Zr-95Ru-1 03Ru-1 06Cs-1 34Cs-1 37Ce-141Ce-144
< 0.043< 0.014
< 0.5316.57 ± 1.04
< 0.065< 0.12< 0.041< 0.25< 0.044< 0.033< 0.10< 0.18
K-510-01-03
KSO-5658
15.77 ± 4.1637.44 ± 3.38
< 0.0420.025 ± 0.009
< 0.5220.49 ± 1.25
< 0.12< 0.093< 0.074< 0.30< 0.049
0.096 ± 0.033< 0.15< 0.21
K-2510-01-03
KSO-5659
6.40 ± 4.3528.73 ± 4.64
< 0.0620.032 ± 0.012
< 0.3119.44 ± 0.83
< 0.058< 0.058< 0.029< 0.11< 0.039
0.13 ± 0.025< 0.14< 0.16
ILi1
iII11.
65 I,

KEWAUNEE
Table 23. Soil samples, analyses for gross alpha, gross beta, strontium-89, strontium-90, andgamma-emitting isotopes (continued).
Sample Description and Concentration (pCUg dry)
Indicator
LocationDate CollectedLab Code
Gross alphaGross beta
Sr-89Sr-90
Be-7K-40Nb-95Zr-95Ru-1 03Ru-1 06Cs-134Cs-137Ce-141Ce-144
K-3405-01-03 -
KSO-2385
14.04 i 6.3137.62 i 5.20
< 0.0490.075 i 0.017
0.29 ± 0.1320.51 i 0.85
< 0.020< 0.018< 0.019< 0.17< 0.013
0.16 ± 0.028< 0.040< 0.12
K-3805-01-03
KSO-2384
11.38 ± 5.5734.27 ± 4.70
< 0.0790.048 ± 0.023
< 0.2023.25 ± 0.94
< 0.021< 0.031< 0.009< 0.11< 0.031
0.15 ± 0.030< 0.048< 0.15
LocationDate CollectedLab Code
Gross alphaGross beta
Sr-89Sr-9o
Be-7K-40Nb-95Zr-95Ru-103Ru-106Cs-1 34Cs-137Ce-141Ce-144
K-3410-01-03
KSO-5660, 1
13.79 ± 2.6933.01 ± 2.17
< 0.0370.033 ± 0.007
< 0.3218.59 ± 0.74
< 0.069< 0.079< 0.064< 0.17< 0.030
0.16 ± 0.031< 0.13< 0.16
K-3810-01-03
KSO-5662
12.24 ± 3.6930.49 ± 2.92
< 0.0490.036 ± 0.011
< 0.6420.73 ± 1.21
< 0.062< 0.071< 0.056< 0.28< 0.048
0.15 ± 0.036< 0.14< 0.16
K-39810-01-03
KSO-5663
11.74 ± 3.7527.81 ± 3.20
< 0.0580.032 ± 0.012
< 0.3017.61 ± 1.06
< 0.082< 0.093< 0.052< 0.20< 0.041
0.089 ± 0.028< 0.12< 0.15
a K-39, Wojta Farm, added to program July 1,2003.
66

I I I
IKEWAUNEE II
Table 23. Soil samples, analyses for gross alpha, gross beta, strontium-89, strontium-90, andgamma-emitting isotopes (continued).
Sample Description and Concentration (pCifg dry) i...Control
LocationDate CollectedLab Code
I.tK-305-01-03
KSO-2380
Gross alphaGross beta
Sr-89Sr-90
Be-7K-40Nb-95Zr-95Ru-103Ru-i 06Cs-I 34Cs-I 37Ce-141Ce-144
8.75 i 4.6426.62 + 4.20
< 0.0450.038 i 0.012
< 0.1619.41 + 0.77
< 0.015< 0.023< 0.019< 0.15< 0.015
0.13 ± 0.026< 0.040< 0.10
K-310-01-03
KSO-5657
7.05 + 2.8828.68 i 3.05
< 0.0420.035 i 0.011
< 0.4117.80 + 0.88
< 0.068< 0.038< 0.034< 0.11< 0.028
0.12 ± 0.035< 0.13< 0.12
II
i.,
IIIi
I
*'1i..11
67 .i

KEWAUNEE
Table 24. Surface water samples, analyses for gross beta, potassium-40 and gamma-emittingisotopes.Collection: Monthly -
Sample Description and Concentration (pCVL)
Indicator
K-1a
Date CollectedLab Code
Gross betaSuspended SolidsDissolved SolidsTotal Residue
K40 (ICP)
Mn-54Fe-59Co-58Co-60Zn-65Zr-Nb-95Cs-I 34Cs-I 37Ba-La-140
01-02-03KSW-5
< 0.911.3 ± 1.111.3 ± 1.1
10.29
< 15< 30< 15< 15< 30< 15< 10< 10< 15
02-03-03KSW-470, 1
1.0 i 0.214.4 ± 0.915.4 i 0.9
4.45
< 15<30< 15< 15<30< 15<10<10< 15
03-03-03KSW-891
< 1.234.2 * 2.634.2 ± 2.6
37.20
. <15<30< 15< 15<30< 15< 10<10< 15
K-1b
Date CollectedLab Code
01-02-03KSW-6
02-03-03KSW-472
03-03-03KSW-892
Gross betaSuspended SolidsDissolved SolidsTotal Residue
K-40 (ICP)
Mn-54Fe-59Co-58Co-60Zn-65Zr-Nb-95Cs-134Cs-I 37Ba-La-140
< 0.42.8 i 0.62.8 ± 0.6
1.64
< 15< 30< 15< 15< 30< 15
< 10< 10< 15
< 1.311.8 ± 1.111.8 i 1.1
9.17
< 15< 30< 15< 15<30< 15<10< 10< 15
< 0.33.2 ± 0.63.2 ± 0.6
1.21
< 15<30< 15< 15<30< 15< 10< 10< 15
8 Sample counted longer to lower MDA.
68
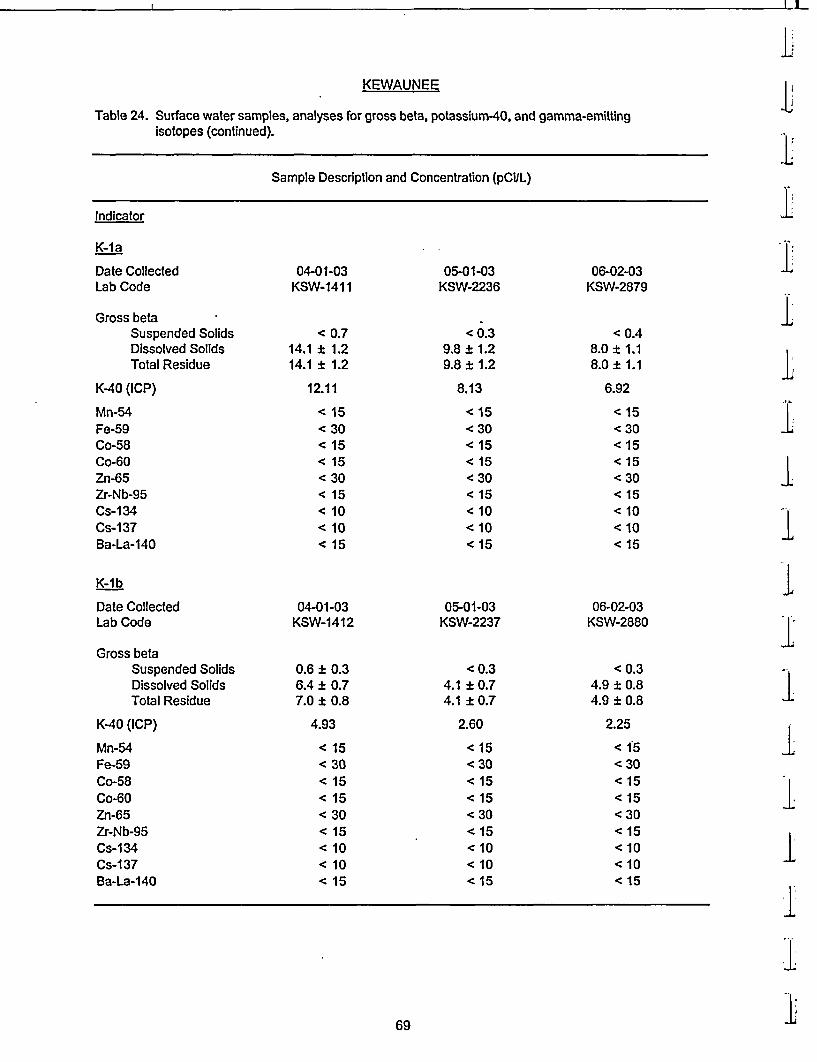
I I I
l
KEWAUNEE
Table 24. Surface water samples, analyses for gross beta, potassium-40, and gamma-emittingisotopes (continued).
IIi
Sample Description and Concentration (pCIL)
Indicator .I"K-1a
Date CollectedLab Code
Gross betaSuspended SolidsDissolved SolidsTotal Residue
K-40 (ICP)
Mn-54Fe-59Co-58Co-60Zn-65Zr-Nb-95Cs-134Cs-137Ba-La-140
K-1 b
Date CollectedLab Code
I.04-01-03
KSW-1411
< 0.714.1 * 1.214.1 ± 1.2
12.11
< 15< 30< 15< 15< 30< 15< 10< 10< 15
04-01-03KSW-1412
05-01-03KSW-2236
<0.39.8 ± 1.29.8 ± 1.2
8.13
< 15<30< 15< 15<30< 15< 10< 10< 15
05-01-03KSW-2237
06-02-03KSW-2879
<0.48.0 ± 1.18.0 ± 1.1
6.92
< 15<30< 15< 15<30< 15< 10< 10< 15
06-02-03KSW-2880
i.
IIi1I,I;
Gross betaSuspended SolidsDissolved SolidsTotal Residue
K-40 (ICP)
Mn-54Fe-59Co-58Co-60Zn-65Zr-Nb-95Cs-134Cs-1 37Ba-La-140
0.6 ± 0.36.4 ± 0.77.0 ± 0.8
4.93
< 15< 30< 15< 15< 30< 15< 10< 10< 15
<0.34.1 ± 0.74.1 ± 0.7
2.60
< 15<30< 15< 15<30< 15< 10< 10< 15
<0.34.9 ± 0.84.9 ± 0.8
2.25
< 15<30< 15< 15<30< 15<10< 10< 15
1
I1II
169

KEWAUNEE
Table 24. Surface water samples, analyses for gross beta, potassium-40, and gamma-emittingIsotopes (continued).
Sample Description and Concentration (pCi/L)
Indicator
K-1 a
Date CollectedLab Code
07-01-03KSW-3561
08-04-03KSW-4405
09-02-03KSW-4971
Gross betaSuspended SolidsDissolved SolidsTotal Residue
K-40 (ICP)
Mn-54Fe-59Co-58Co-60Zn-65Zr-Nb-95Cs-1 34Cs-1 37Ba-La-140
K-1 b
Date CollectedLab Code
Gross betaSuspended SolidsDissolved SolidsTotal Residue
K-40 (ICP)
Mn-54Fe-59Co-58Co-60Zn-65Zr-Nb-95Cs-1 34Cs-1 37Ba-La-140
< 0.46.7 ± 0.86.7 ± 0.8
6.23
< 15< 30< 15< 15< 30< 15< 10< 10< 15
0.4 ± 0.216.2 ± 1.216.6 ± 1.2
14.01
< 15< 30< 15< 15<-30< 15<10<10< 15
<0.412.8 ± 1.112.8 ± 1.1
11.85
< 15< 30< 15< 15<30< 15< 10< 10< 15
07-01-03KSW-3562
0.4 ± 0.23.8 ± 0.64.2 ± 0.7
2.08
< 15< 30< 15< 15< 30< 15< 10< 10< 15
08-04-03KSW-4406
< 0.36.2 ± 0.76.2 ± 0.7
4.67
< 15< 30< 15< 15<30< 15<10<10< 15
09-02-03KSW-4972
< 0.33.7 ± 0.6 -3.7 ± 0.6
2.34
< 15<30< 15< 15<30< 15<10<10< 15
70
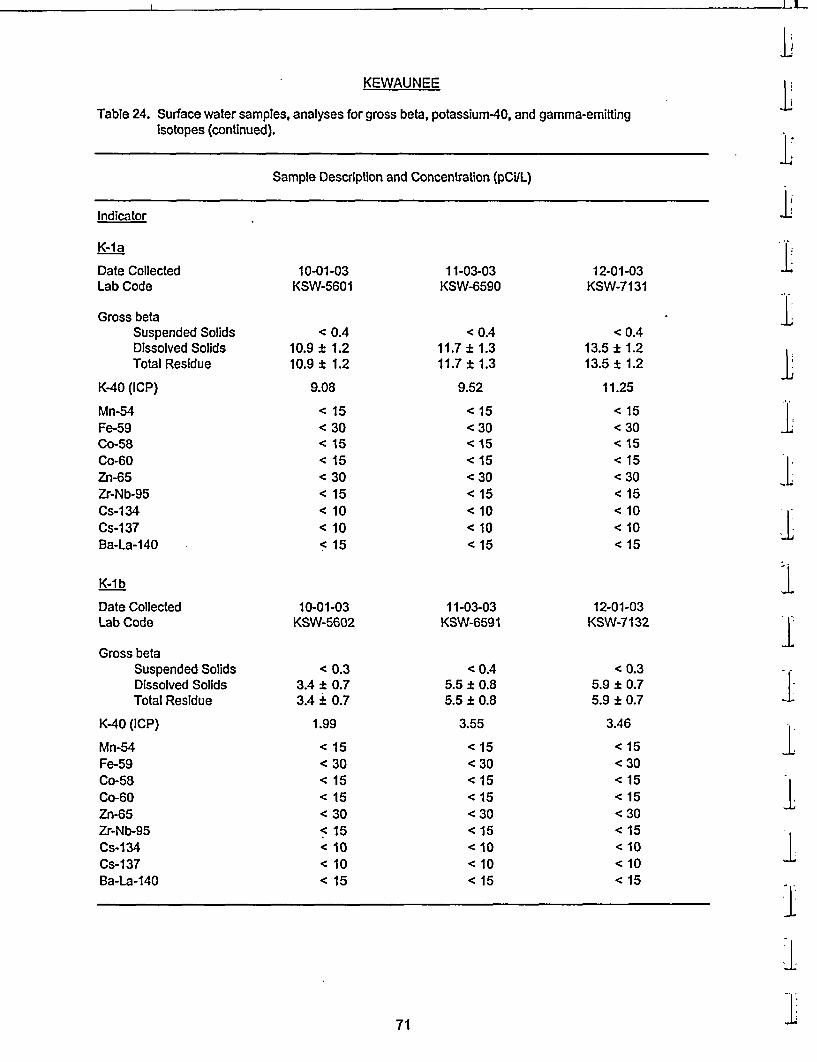
I I X
LKEWAUNEE LTable 24. Surface water samples, analyses for gross beta, potassium-40, and gamma-emitting
isotopes (continued).
LISample Description and Concentration (pCiL)
IIndicator
K-1a
Date CollectedLab Code
Gross betaSuspended SolidsDissolved SolidsTotal Residue
K-40 (ICP)
Mn-54Fe-59Co-58Co-60Zn-65Zr-Nb-95Cs-1 34Cs-1 37Ba-La-140
K-1 b
Date CollectedLab Code
L10-01-03KSW-5601
< 0.410.9 ± 1.210.9 ± 1.2
9.08
< 15< 30< 15< 15< 30< 15< 10< 10< 15
11-03-03KSW-6590
<0.411.7 ± 1.311.7 ± 1.3
9.52
< 15<30< 15< 15<30< 15< 10< 10< 15
12-01-03KSW-7131
i<0.4
13.5 ± 1.213.5 ± 1.2 1,
11.25
< 15<30< 15< 15< 30< 15< 10< 10< 15
I I
ItI
10-01-03KSW-5602
11-03-03KSW-6591
12-01-03KSW-7132
IGross beta
Suspended SolidsDissolved SolidsTotal Residue
K-40 (ICP)
Mn-54Fe-59Co-58Co-60Zn-65Zr-Nb-95Cs-134Cs-137Ba-La-140
< 0.33.4 ± 0.73.4 i 0.7
1.99
< 15< 30< 15< 15< 30< 15< 10< 10< 15
<0.45.5 i 0.85.5 * 0.8
3.55
< 15<30< 15< 15<30< 15< 10< 10< 15
<0.35.9 ± 0.75.9 ± 0.7
3.46
< 15<30< 15< 15<30< 15< 10< 10< 15
I
I1I111,L71

KEWAUNEE
Table 24. Surface water samples, analyses for gross beta, potassium-40 and gamma-emittingisotopes (continued).
Sample Description and Concentration (pCi/L)
Indicator
K-1d
Date CollectedLab Code
Gross betaSuspended SolidsDissolved SolidsTotal Residue
K-40 (ICP)
Mn-54Fe-59Co-58Co-60Zn-65Zr-Nb-95Cs-134Cs-1 37Ba-La-140
01-02-03KSW-7
< 0.33.3 i 0.53.3 i 0.5
1.38
< 15< 30< 15< 15< 30< 15< 10< 10< 15
02-03-03KSW-473
03-03-03KSW-893
<0.42.2 ± 0.52.2 ± 0.5
1.12
< 15<30< 15< 15<30< 15<10< 10< 15
<0.32.0 ± 0.42.0 ± 0.4
1.12
< 15<30< 15< 15<30< 15<10< 10< 15
K-1 e
Date CollectedLab Code
01-02-03KSW-8
02-03-03KSW-474
03-03-03KSW-894
Gross betaSuspended SolidsDissolved SolidsTotal Residue
K-40 (ICP)
Mn-54Fe-59Co-58Co-60Zn-65Zr-Nb-95Cs-1 34Cs-1 37Ba-La-140
< 1.84.1 ± 1.14.1 ± 1.1 -
5.71
< 1.312.5 ± 3.912.5 ± 3.9
13.84
< 1.616.5 ± 2.516.5 ± 2.5
17.30
< 15< 30< 15< 15< 30< 15< 10< 10< 15
< 15<30< 15< 15<30< 15<10<10< 15
< 15<30< 15< 15<30< 15<10<10< 15
72

II
KEWAUNEE
Table 24. Surface water samples, analyses for gross beta, potassium-40, and gamma-emittingisotopes (continued).
Sample Description and Concentration (pCVL)
Indicator
K-Id
Date CollectedLab Code
Gross betaSuspended SolidsDissolved SolidsTotal Residue
K-40 (ICP)
Mn-54Fe-59Co-58Co-60Zn-65Zr-Nb-95Cs-134Cs-137Ba-La-140
04-01-03KSW-1413
< 0.32.5 + 0.42.5 i 0.4
1.38
< 15< 30< 15< 15< 30< 15< 10< 10< 15
05-01-03KSW-2238
<0.32.5 ± 0.42.5 ± 0.4
1.47
< 15<30< 15< 15<30< 15< 10< 10< 15
06-02-03KSW-2881
<0.31.7 ± 0.41.7 ± 0.4
1.38
< 15<30< 15< 15<30< 15<10< 10< 15
K-ie
Date CollectedLab Code
04-01-03KSW-1414
05-01-03KSW-2239
06-02-03KSW-2882
Gross betaSuspended SolidsDissolved SolidsTotal Residue
K-40 (ICP)
Mn-54Fe-59Co-58Co-60Zn-65Zr-Nb-95Cs-134Cs-137Ba-La-140
< 0.56.1 ± 1.16.1 ± 1.1
5..10
< 15< 30< 15< 15< 30< 15< 10< 10< 15
<0.34.1 ± 0.74.1 ± 0.7
3.46
< 15<30< 15< 15<30< 15< 10< 10< 15
<0.49.9 ± 1.69.9 ± 1.6
4.58
< 15<30< 15< 15<30< 15< 10< 10< 15
73

KEWAUNEE
Table 24. Surface water samples, analyses for gross beta, potassium40, and gamma-emittingisotopes (continued).
Sample Description and Concentration (pCUL)
Indicator
K-1d
Date CollectedLab Code
I
Gross betaSuspended SolidsDissolved SolidsTotal Residue
K-40 (ICP)
Mn-54Fe-59Co-58Co-60Zn-65Zr-Nb-95Cs-1 34Cs-137Ba-La-140
07-01-03KSW-3563
< 0.32.3 ± 0.42.3 ± 0.4
1.21
< 15< 30< 15< 15< 30< 15< 10< 10< 15
08-04-03KSW-4407
09-02-03KSW-4973
<0.32.3 ± 0.42.3 ± 0.4
<0.42.5 ± 0.42.5 ± 0.4
1.38
< 15<30< 15< 15<30< 15< 10< 10< 15
1.47
< 15<30< 15< 15<30< 15<10<10< 15
K-Ie
Date CollectedLab Code
07-01-03KSW-3564
08-04-03KSW-4408
09-02-03KSW-4974
Gross betaSuspended SolidsDissolved SolidsTotal Residue
K-40 (ICP)
Mn-54Fe-59Co-58Co-60Zn-65Zr-Nb-95Cs-1 34Cs-137Ba-La-140
< 0.47.0± 1.37.0 ± 1.3
7.35
< 15< 30< 15< 15< 30< 15< 10< 10< 15
< 0.34.7 ± 1.24.7 ± 1.2
2.34
< 15<30< 15< 15<30< 15< 10< 10< 15
< 0.311.0 ± 1.511.0 ± 1.5
10.47
< 15<30< 15< 15<30< 15< 10< 10< 15
74

I I
KEWAUNEE
Table 24. Surface water samples, analyses for gross beta, potassium-40, and gamma-emittingisotopes (continued).
Sample Description and Concentration (pCVL)
Indicator
K-Id
Date CollectedLab Code
10-01-03KSW-5603
Gross betaSuspended SolidsDissolved SolidsTotal Residue
K-40 (ICP)
Mn-54Fe-59Co-58Co-60Zn-65Zr-Nb-95Cs-134Cs-137Ba-La-140
< 0.32.1 + 0.42.1 ± 0.4
1.12
< 15< 30< 15< 15< 30< 15< 10< 10< 15
11-03-03KSW-6592
<0.33.6 ± 0.53.6 ± 0.5
1.21
< 15<30< 15< 15<30< 15< 10< 10< 15
12-01-03KSW-7133, 4
<0.32.3 ± 0.22.3 ± 0.2
1.25
< 15<30< 15< 15<30< 15< 10< 10< 15
K-I e
Date CollectedLab Code
10-01-03KSW-5604
11-03-03KSW-6593
12-01-03KSW-7135
Gross betaSuspended SolidsDissolved SolidsTotal Residue
K-40 (ICP)
Mn-54Fe-59Co-58Co-60Zn-65Zr-Nb-95Cs-1 34Cs-i 37Ba-La-140
< 0.411.5± 1.711.5 ± 1.7
11.33
< 15< 30< 15< 15< 30< 15< 10< 10< 15
<0.410.0 ± 1.610.0 + 1.6
6.57
< 15<30< 15< 15<30<15< 10<10< 15
<0.43.7 ± 0.63.7 ± 0.6
2.77
< 15<30< 15< 15<30< 15< 10< 10< 15
75
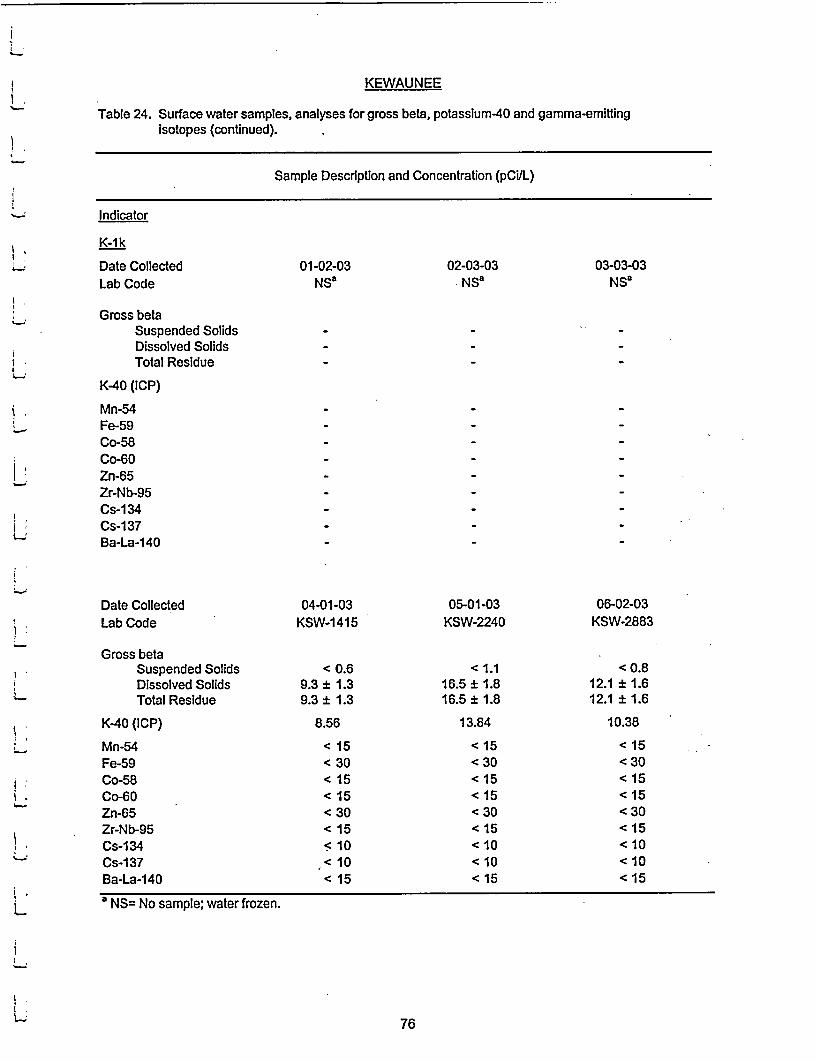
KEWAUNEE
Table 24. Surface water samples, analyses for gross beta, potassium-40 and gamma-emittingisotopes (continued). .-
Sample Description and Concentration (pCiIL)
Indicator
K-1k
Date CollectedLab Code
01-02-03NS"
02-03-03NS"
03-03-03NS"
Gross betaSuspended SolidsDissolved SolidsTotal Residue
K-40 (ICP)
Mn-54Fe-59Co-58Co-60Zn-65Zr-Nb-95Cs-134Cs-137Ba-La-140
Date CollectedLab Code
04-01-03KSW-1415
05-01-03KSW-2240
06-02-03KSW-2883
Gross betaSuspended SolidsDissolved SolidsTotal Residue
K-40 (ICP)
Mn-54Fe-59Co-58Co-60Zn-65Zr-Nb-95Cs-134Cs-137Ba-La-140
< 0.69.3 i 1.39.3 i 1.3
8.56
< 15< 30< 15< 15< 30< 15s 10< 10< 15
< 1.116.5 i 1.816.5 i 1.8
13.84
< 15<30< 15< 15<30< 15<10<10< 15
< 0.812.1 ± 1.612.1 ± 1.6
10.38
< 15<30< 15< 15<30< 15< 10< 10< 15
a NS= No sample; water frozen.
76
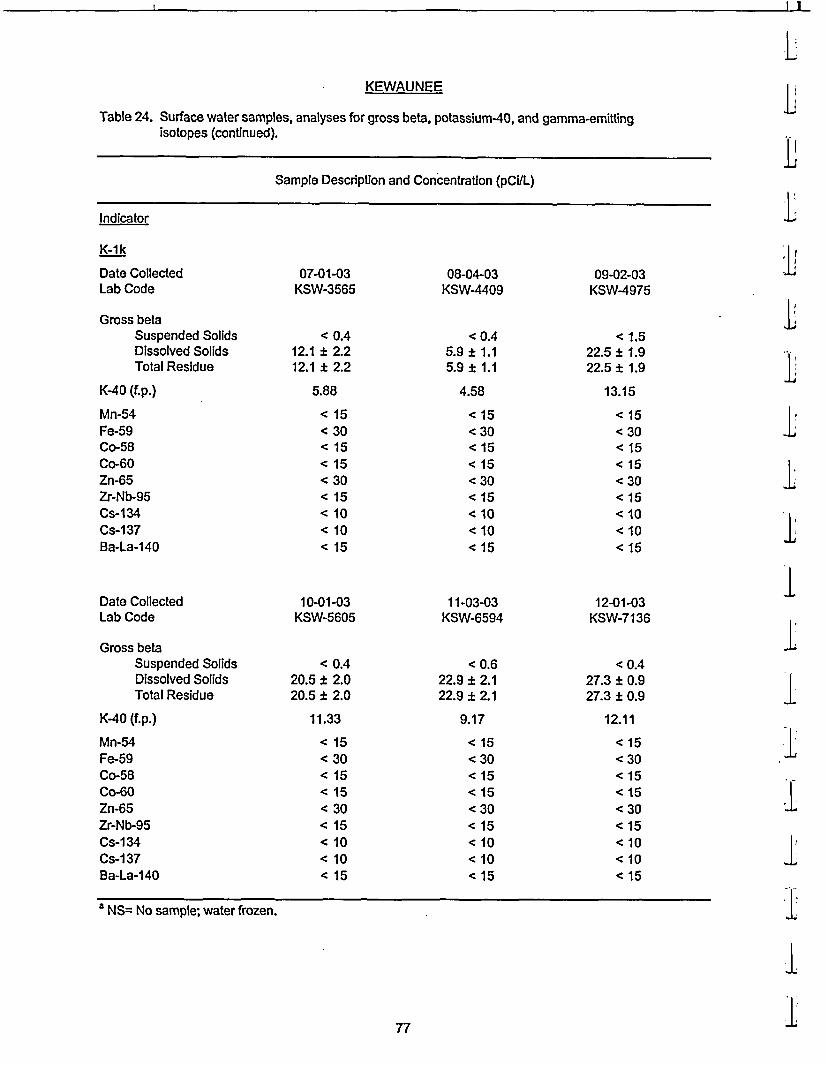
I I
KEWAUNEE
Table 24. Surface water samples, analyses for gross beta, potassium-40, and gamma-emittingisotopes (continued).
Sample Description and Concentration (pCiL)
Indicator
K-1 k
Date CollectedLab Code
Gross betaSuspended SolidsDissolved SolidsTotal Residue
K-40 (f.p.)
Mn-54Fe-59Co-58Co-60Zn-65Zr-Nb-95Cs-134Cs-137Ba-La-140
Date CollectedLab Code
07-01-03KSW-3565
< 0.412.1 ± 2.212.1 ± 2.2
5.88
< 15< 30< 15< 15< 30< 15< 10< 10< 15
10-01-03KSW-5605
08-04-03KSW-4409
<0.45.9 ± 1.15.9 ± 1.1
4.58
< 15<30< 15< 15<30< 15< 10< 10< 15
11-03-03KSW-6594
09-02-03KSW-4975
< 1.522.5 ± 1.922.5 ± 1.9
13.15
< 15< 30< 15< 15<30< 15< 10< 10< 15
12-01-03KSW-7136
Gross betaSuspended SolidsDissolved SolidsTotal Residue
K-40 (f.p.)
Mn-54Fe-59Co-58Co-60Zn-65Zr-Nb-95Cs-I 34Cs-I 37Ba-La-140
< 0.420.5 ± 2.020.5 ± 2.0
11.33
< 15< 30< 15< 15< 30< 15< 10< 10< 15
<0.622.9 ± 2.122.9 ± 2.1
9.17
< 15<30< 15< 15<30< 15< 10< 10< 15
<0.427.3 ± 0.927.3 ± 0.9
12.11
< 15<30< 15< 15<30< 15< 10< 10< 15
a NS= No sample; water frozen.
77

KEWAUNEE
Table 24. Surface water samples, analyses for gross beta, potassium-40 and gamma-emittingisotopes.Collection: Monthly
Sample Description and Concentration (pCiL)
Indicator
K-9 (Raw)
Date Collected 01-02-03 02-03-03 03-03-03Lab Code KSW-9 KSW-475 KSW-895
Gross betaSuspended Solids <0.4 <0.3 <0.3Dissolved Solids 2.8 i 0.7 2.0 i 0.8 2.8 ± 0.7Total Residue 2.8 ± 0.7 2.0 ± 0.8 2.8 ± 0.7
K-40 (ICP) 1.04 1.04 1.12
Mn-54 < 15 <15 <15Fe-59 <30 <30 <30Co-58 < 15 <15 < 15Co-60 < 15 <15 <15Zn-65 < 30 <30 <30Zr-Nb-95 < 15 < 15 < 15Cs-134 < 10 < 10 <10Cs-137 < 10 <10 <10Ba-La-140 < 15 < 15 <15
K-9 (Tap)
Date Collected 01-02-03 02-03-03 03-03-03Lab Code KSW-10 KSW-476 KSW-896
Gross betaSuspended Solids < 0.4 <0.3 <0.3Dissolved Solids 2.5 ± 0.4 1.8 ± 0.4 2.0 ± 0.4Total Residue 2.5 ± 0.4 1.8 ± 0.4 2.0 ± 0.4
K-40 (ICP) 1.12 1.04 1.21
Mn-54 < 15 <15 <15Fe-59 < 30 < 30 <30Co-58 < 15 < 15 <15Co-60 < 15 <15 <15Zn-65 < 30 <30 <30Zr-Nb-95 < 15 <15 <15Cs-134 < 10 < 10 <10Cs-137 < 10 < 10 <10Ba-La-140 < 15 <15 <15
78

II
:LKEWAUNEE
Table 24. Surface water samples, analyses for gross beta, potassium-40, and gamma-emittingisotopes (continued).
i
.lSample Description and Concentration (pCIL)
Indicator LK-9 (Raw)
Date CollectedLab Code
Gross betaSuspended SolidsDissolved SolidsTotal Residue
K-40 (ICP)
Mn-54Fe-59Co-58Co-60Zn-65Zr-Nb-95Cs-134Cs-137Ba-La-140
K-9 (Tan)
Date CollectedLab Code
if04-01-03KSW-1416
< 0.42.6 t 0.72.6 * 0.7
1.30
< 15< 30< 15< 15< 30< 15< 10< 10< 15
04-01-03KSW-1417
05-01-03KSW-2241
<0.32.4 ± 0.82.4 + 0.8
1.30
< 15<30< 15< 15<30< 15< 10< 10< 15
05-01-03KSW-2242
06-02-03KSW-2884
<0.34.1 + 0.94.1 * 0.9
1.30
< 15<30< 15< 15<30< 15<10< 10< 15
06-02-03KSW-2885
II"IIIII
Gross betaSuspended SolidsDissolved SolidsTotal Residue
K-40 (ICP)
Mn-54Fe-59Co-58Co-60Zn-65Zr-Nb-95Cs-1 34Cs-137Ba-La-140
< 0.41.8 ± 0.41.8 ± 0.4
1.30
< 15< 30< 15< 15< 30< 15< 10< 10< 15
<0.32.0 ± 0.42.0 ± 0.4
1.21
< 15<30< 15< 15<30< 15< 10< 10< 15
<0.41.9 ± 0.51.9 ± 0.5
1.30
1I< 15
<30< 15< 15< 30< 15< 10< 10< 15
I
II1
I
I179

KEWAUNEE
Table 24. Surface water samples, analyses for gross beta, potassium4O, and gamma-emittingisotopes (continued).
Sample Description and Concentration (pCVL)
Indicator
K-9 (Raw)
Date CollectedLab Code
07-01-03KSW-3566
08-04-03KSW-4410
09-02-03KSW-4976
Gross betaSuspended SolidsDissolved SolidsTotal Residue
K-40 (ICP)
Mn-54Fe-59Co-58Co-60Zn-65Zr-Nb-95Cs-134Cs-137Ba-La-140
< 0.32.3 ± 1.02.3 ± 1.0
<0.33.1 ± 0.73.1 ± 0.7
<0.31.6 ± 0.61.6 ± 0.6
1.21
< 15< 30< 15< 15< 30< 15< 10< 10< 15
1.12
< 15<30< 15< 15<30< 15<10< 10< 15
1.38
< 15<30< 15< 15<30< 15<10<10< 15
K-9 (Tan)
Date CollectedLab Code
07-01-03KSW-3567
08-04-03KSW-4411
09-02-03KSW-4977
Gross betaSuspended SolidsDissolved SolidsTotal Residue
K-40 (ICP)
Mn-54Fe-59Co-58Co-60Zn-65Zr-Nb-95Cs-134Cs-137Ba-La-140
< 0.41.7 ± 0.61.7 ± 0.6
<0.32.0 ± 0.42.0 ± 0.4
1.121.21
< 15< 30< 15< 15< 30< 15< 10< 10< 15
< 15<30< 15< 15<30< 15< 10< 10< 15
<0.32.3 ± 0.52.3 ± 0.5
1.38
< 15<30< 15< 15<30< 15< 10< 10< 15
80

I~I I
LKEWAUNEE
Table 24. Surface water samples, analyses for gross beta, potassium-40, and gamma-emittingisotopes (continued).
LISample Description and Concentration (pCVL)
Indicator I'K-9 (Raw)
Date CollectedLab Code
Lt110-01-03KSW-5606
11-03-03KSW-6595
12-01-03KSW-7137
L1Gross betaSuspended SolidsDissolved SolidsTotal Residue
K-40 (ICP)
Mn-54Fe-59Co-58Co-60Zn-65Zr-Nb-95Cs-1 34Cs-137Ba-La-140
< 0.32.1 ± 0.72. t 0.7
1.12
< 15< 30< 15< 15< 30< 15< 10< 10< 15
<0.33.1 ± 0.83.1 ± 0.8
1.12
< 15< 30< 15< 15<30< 15< 10< 10< 15
11-03-03KSW-6596
<0.46.0 ± 0.56.0 ± 0.5
1.12
< 15<30< 15< 15<30< 15< 10< 10< 15
12-01-03KSW-7138
LI
.1
IK-9 (Tan)
Date CollectedLab Code
I10-01-03
KSW-5607
IGross beta
Suspended SolidsDissolved SolidsTotal Residue
K-40 (ICP)
Mn-54Fe-59Co-58Co-60Zn-65Zr-Nb-95Cs-134Cs-1 37Ba-La-140
< 0.41.7 ± 0.51.7 ± 0.5
1.21
< 15< 30< 15< 15< 30< 15< 10< 10< 15
<0.41.9 ± 0.51.9 ± 0.5
1.21
<15<30< 15< 15<30< 15< 10< 10< 15
<0.32.1 ± 0.22.1 ± 0.2
1.12
< 15<30< 15< 15<30< 15< 10< 10*< 15
I
1
I
I
Ii
i81

KEWAUNEE
Table 24. Surface water, analyses for gross beta, potassium-40 and gamma-emitting Isotopes (continued).
Sample Description and Concentration (pCUL)
Indicator
K-14a
Date CollectedLab Code
Gross betaSuspended SolidsDissolved SolidsTotal Residue
K-40 (ICP)
Mn-54Fe-59Co-58Co-60Zn-65Zr-Nb-95Cs-1 34Cs-137Ba-La-140
01-02-03KSW-1 I
< 0.42.7 i 0.62.7 ± 0.6
1.21
< 15< 30.< 15< 15< 30< 15< 10< 10< 15
02-03-03KSW-477
< 0.32.3 ± 0.62.3 ± 0.6
1.04
< 15<30< 15< 15<30< 15< 10<10< 15
03-03-03KSW-897
<0.31.7 ± 0.61.7 ± 0.6
1.30
< 15<30< 15< 15<30< 15< 10< 10< 15
K-14b
Date CollectedLab Code
Gross betaSuspended SolidsDissolved SolidsTotal Residue
K-40 (ICP)
Mn-54Fe-59Co-58Co-60Zn-65Zr-Nb-95Cs-1 34Cs-137Ba-La-140
01-02-03KSW-12
-< 0.43.2 ± 0.63.2 ± 0.6
1.21
< 15< 30< 15< 15< 30< 15< 10< 10< 15
02-03-03KSW-478
<0.32.2 ± 0.52.2 ± 0.5
1.12
< 15<30< 15< 15< 30< 15< 10< 10< 15
03-03-03KSW-898
< 0.32.5 ± 0.62.5 ± 0.6
1.30
< 15<30< 15< 15< 30< 15<10< 10< 15
82

II
KEWAUNEE
Table 24. Surface water, analyses for gross beta, potassium-40 and gamma-emitting Isotopes (continued).
Sample Description and Concentration (pCUL)
Indicator
K-14a
Date Collected
Lab Code
04-01-03
KSW-1418
Gross betaSuspended SolidsDissolved SolidsTotal Residue
K-40 (ICP)
Mn-54Fe-59Co-58Co-60Zn-65Zr-Nb-95Cs-1 34Cs-1 37Ba-La-140
< 0.32.3 i 0.52.3 ± 0.5
1.56
< 15< 30< 15< 15< 30< 15< 10< 10< 15
05-01-03
KSW-2243
<0.33.2 ± 0.73.2 ± 0.7
1.90
< 15<30< 15< 15<30< 15< 10<10< 15
06-02-03
KSW-2886
<0.45.0 ± 0.65.0 ± 0.6
1.30
< 15<30< 15< 15<30< 15<10< 10< 15
K-14b
Date Collected
Lab Code
Gross betaSuspended SolidsDissolved SolidsTotal Residue
K-40 (ICP)
Mn-54Fe-59Co-58Co-60Zn-65Zr-Nb-95Cs-134Cs-1 37Ba-La-140
04-01-03
KSW-1419
< 0.42.5 ± 0.52.5 ± 0.5
1.64
< 15< 30< 15< 15< 30< 15< 10< 10< 15
05-01-03
KSW-2244
<0.32.8 ± 0.62.8 ± 0.6
1.82
< 15<30< 15< 15<30< 15< 10<10< 15
06-02-03
KSW-2887
<0.36.7 ± 0.66.7 ± 0.6
1.38
< 15<30< 15< 15<30< 15< 10< 10< 15
83

KEWAUNEE
Table 24. Surface water, analyses for gross beta, potassium-40 and gamma-emitting isotopes (continued).
Sample Description and Concentration (pCiVL)
Indicator
K-14a
Date CollectedLab Code
Gross betaSuspended SolidsDissolved SolidsTotal Residue
K-40 (ICP)
Mn-54Fe-59Co-58Co-60Zn-65Zr-Nb-95Cs-1 34Cs-1 37Ba-La-140
07-01-03KSW-3568
< 0.32.1 + 0.82.1 + 0.8
1.38
< 15< 30< 15< 15< 30< 15< 10< 10< 15
08-04-03KSW-4412
<0.33.7 ± 0.63.7 ± 0.6
1.82
< 15<30< 15< 15< 30< 15< 10<10< 15
09-02-03KSW-4978
<0.33.4 ± 0.63.4 + 0.6
1.47
< 15<30< 15< 15<30< 15< 10<10< 15
K-14b
Date CollectedLab Code
07-01-03KSW-3569
08-04-03KSW-4413
09-02-03KSW-4979
Gross betaSuspended SolidsDissolved SolidsTotal Residue
K-40 (ICP)
Mn-54Fe-59Co-58Co-60Zn-65Zr-Nb-95Cs-1 34Cs-137Ba-La-140
< 0.32.1 ± 0.82.1 ± 0.8
1.38
< 15< 30< 15< 15.< 30< 15< 10< 10< 15
<0.36.0 ± 0.76.0 ± 0.7
2.25
< 15<30< 15< 15<30< 15<10< 10< 15
<0.34.1 ± 0.74.1 ± 0.7
1.47
< 15<30< 15< 15<30< 15< 10< 10< 15
84

I I
KEWAUNEE
Table 24. Surface water, analyses for gross beta, potassium-40 and gamma-emitting Isotopes (continued).
Sample Description and Concentration (pCVL)
Indicator
K-14a
Date CollectedLab Code
10-01-03KSW-5608
Gross betaSuspended SolidsDissolved SolidsTotal Residue
K-40 (ICP)
Mn-54Fe-59Co-58Co-60Zn-65Zr-Nb-95Cs-1 34Cs-137Ba-La-140
< 0.34.3 t 0.64.3 i 0.6
1.21
< 15< 30< 15< 15< 30< 15< 10< 10< 15
11-03-03KSW-6597
<0.34.1 ±0.74.1 + 0.7
1.21
< 15<30< 15< 15<30< 15<10< 10< 15
12-01-03KSW-7139
<0.34.7 ± 0.44.7 + 0.4
2.51
< 15< 30< 15< 15< 30< 15< 10< 10< 15
K-14b
Date CollectedLab Code
10-01-03KSW-5609
11-03-03KSW-6598
12-01-03KSW-7140
Gross betaSuspended SolidsDissolved SolidsTotal Residue
K-40 (ICP)
Mn-54Fe-59Co-58Co-60Zn-65Zr-Nb-95Cs-134Cs-137Ba-La-140
< 0.33.3 ± 0.63.3 i 0.6
2.25
< 15< 30< 15< 15< 30< 15< 10< 10< 15
<0.33.6 ± 0.63.6 + 0.6
1.30
< 15<30< 15< 15<30< 15< 10< 10< 15
<0.34.4 i 0.44.4 ± 0.4
2.51
< 15<30< 15< 15<30< 15< 10< 10< 15
85

KEWAUNEE
Table 25. Surface water, analyses for tritium, strontium-89 and strontium-90.Collection: Quarterly composites of monthly samples.
Location and Concentration pCi/L
Collection Period Lab Code H-3 Sr-89 Sr-90
Indicator
K-1a
1st Quarter KSW -996 < 330 < 0.6 < 0.62nd Quarter -3631 < 330 < 1.0 < 0.63rd Quarter -5680 < 330 < 0.9 < 0.64th Quarter -7798 < 330 < 1.4 < 0.7
K-lb
1st Quarter KSW-997 < 330 < 0.7 < 0.62nd Quarter -3632 < 330 < 1.9 < 0.93rd Quarter -5681 < 330 < 1.0 < 0.84th Quarter -7799 < 330 < 0.9 < 0.6
K-1d
1 st Quarter KSW -998- < 330 < 0.6 1.0 ± 0.32nd Quarter -3633 < 330 < 1.5 < 0.73rd Quarter -5682 < 330 < 0.9 < 0.54th Quarter -7800 < 330 < 0.9 < 0.5
K-I e
1st Quarter KSW-999. < 330 < 0.7 < 0.42nd Quarter -3634 < 330 < 1.2 1.0 ± 0.53rd Quarter -5683 < 330 < 0.7 < 0.54th Quarter -7801 < 330 < 0.8 < 0.5
86

II
LIIKEWAUNEE
Table 25. Surface water, analyses for tritium, strontium-89 and strontium-90 (continued).LLI
Location and Concentration pCi/L
Collection Period H-3 Sr-89 Sr-90
Indicator
K-14a
1st Quarter KSW -1002 < 330 < 0.7 < 0.6
2nd Quarter -3638 - < 330 < 1.3 < 0.5
3rd Quarter -5687, 8 < 330 < 0.8 < 0.6
4th Quarter -7805, 6 < 330 < 0.7 < 0.6
K-14b
1st Quarter KSW -1003 < 330 < 0.6 < 0.6
2nd Quarter -3639 < 330 < 0.8 < 0.7
3rd Quarter -5689 < 330 < 1.0 < 0.8
4th Quarter -7807 < 330 < 0.8 < 0.5
K-1 k
1st Quarter NDa
2nd Quarter KSW -3635 < 330 < 1.3 < 0.7
3rd Quarter -5684 < 330 < 0.8 1.0 ± 0.4
4th Quarter -7802 < 330 < 1.4 < 0.6
Control
K-9
1st Quarter KSW -1000 (Raw) < 330 < 0.6 1.3 ± 0.4-1001 (Tap) < 330 < 0.6 < 0.6
2nd Quarter KSW -3636 (Raw) < 330 < 1.0 < 0.7-3637 (Tap) < 330 < 1.0 < 0.7
3rd Quarter KSW -5685 (Raw) < 330 < 1.0 < 0.7-5686(Tap) < 330 < 1.1 < 0.7
4th Quarter KSW -7803 (Raw) < 330 < 1.3 < 0.6-7804(Tap) < 330 < 0.8 < 0.6
a No data; water frozen.
L
III-,
I
-1
IIII
187
I
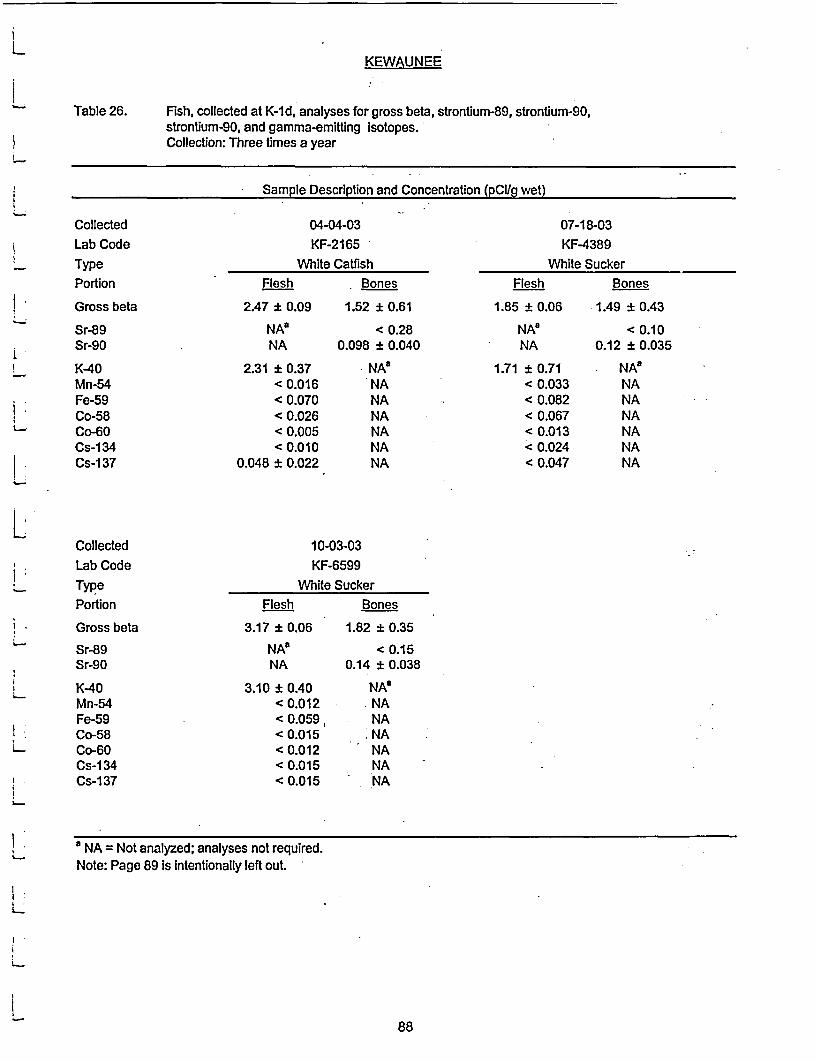
KEWAUNEE
Fish, collected at K-1d, analyses for gross beta, strontium-89, strontium-90,strontium-90, and gamma-emitting Isotopes.Collection: Three times a year
Table 26.
Sample Description and Concentration (pCilg wet)
Collected
Lab Code
TypePortion
Gross beta
Sr-89Sr-90
K-40Mn-54Fe-59Co58Co-60Cs-1 34Cs-137
LCollected
Lab CodeType
Portion
Gross beta
Sr-89Sr-90
L K-40Mn-54Fe-59Co-58Co-60Cs-1 34Cs-137
04-04-03
KF-2165
White CatfishBones
.09 1.52 * 0.61
07-18-03
KF-4389
White SuckerBones
.06 1.49 i 0.43
Flesh
2.47 * 0
Flesh
1.85 * 0
NAaNA
2.31 ± 0.37< 0.016< 0.070< 0.026< 0.005< 0.010
0.048 ± 0.022
< 0.280.098 ± 0.040
NAgNANANANANANA
NANA
1.71 ± 0.71< 0.033< 0.082< 0.067< 0.013< 0.024< 0.047
< 0.100.12 ± 0.035
NA!NANANANANANA
10-03-03KF-6599
White SuckerBonesFlesh
3.17 ± 0.06
NAgNA
3.10 ± 0.40< 0.012< 0.059,<0.015<0.012<0.015< 0.015
1.82 ± 0.35
< 0.150.14 ± 0.038
NAgI NANA
: NANANANA
8 NA = Not analyzed; analyses not required.Note: Page 89 Is Intentionally left out.
88

I I II
L
Table 27.
KEWAUNEE
Slime or aquatic vegetation, analyses for gross beta, strontium-89, strontium-90, andgamma-emitting isotopes.Collection: Semiannually
LiLI-
Sample Description and Concentration IIndicators Control
LocationDate CollectedLab Code
Gross beta
Sr-89Sr-90
Be-7K-40Mn-54Co-58Co-60Nb-95Zr-95Ru-103Ru-106Cs-134Cs-137Ce-141Ce-144
K-1a06-03-03KSL-2906
4.01 ±0.07< 0.020<0.012< 0.23
5.53 ± 0.69< 0.026< 0.020< 0.021< 0.025< 0.049< 0.023< 0.18< 0.025< 0.020< 0.044< 0.19
K-1 b06-03-03KSL-2907
5.85 ± 0.16
< 0.030 a0.025 ± 0.008 a
< 0.336.17 ± 0.90
< 0.029< 0.030< 0.017< 0.020< 0.053< 0.026<0.27< 0.034< 0.022<0.041<0.15
K-Id05-01-03KSL-2389
4.44 ± 0.70
<0.120.10 ± 0.031
0.66 ± 0.201.90 ± 0.42
<0.0190.027 ± 0.015
< 0.017< 0.019< 0.036< 0.013<0.19<0.012<0.018< 0.026< 0.082
K-906-03-03
KSL-2909, 10
7.35 ± 0.11
< 0.007< 0.004
< 0.183.70 ± 0.42
< 0.013< 0.009<0.011< 0.015< 0.029<0.017<0.11<0.019<0.013< 0.028<0.071
LII1II
II
K-1405-01-03 1KSL-2391 L
LocationDate CollectedLab Code
K-Ie05-01-03KSL-2390
K-ik06-03-03KSL-2908
Gross betaSr-89Sr-9oBe-7K-40Mn-54Co-58Co-60Nb-95Zr-95Ru-103Ru-1 06Cs-134Cs-137Ce-141Ce-144
2.65 ± 0.36
< 0.0490.025 ± 0.012
1.16 ± 0.22< 0.58< 0.013< 0.024< 0.016< 0.011< 0.042< 0.018<0.12< 0.020< 0.023< 0.029< 0.094
5.27 ± 0.11< 0.011< 0.006
0.63 ± 0.255.19 ± 0.76
< 0.021<0.018<0.018< 0.026< 0.031< 0.024< 0.19< 0.024< 0.032< 0.044< 0.13
3.90 ± 0.45
< 0.0370.032 ± 0.016
1.30 ± 0.221.34 ± 0.25
< 0.0140.063 ± 0.0150.035 ± 0.010
<0.015< 0.022<0.013< 0.097< 0.012
0.034 ± 0.012< 0.018< 0.046
1
1
I
I
Ia Result of reanalysis I
901

KEWAUNEE
Slime or aquatic vegetation, analyses for gross beta, strontium-89, strontium-90, andgamma-emitting isotopes.
Collection: Semiannually
Table 27.
Sample Description and Concentration
Indicators
Location
Date CollectedLab Code
Gross beta
Sr-89Sr-90
Be-7K-40Mn-54Co-58Co-60Nb-95Zr-95Ru-1 03Ru-1 06Cs-134Cs-137Ce-141Ce-144
K-1a08-04-03KSL-4396
6.90 + 0.53
K-Ib
08-04-03KSL-4397
2.08 + 0.06<0.33 < 0.026 a
<0.095 0.009 + 0.004 a
Location
Date CollectedLab Code
Gross betaSr-89Sr-90Be-7K-40Mn-54
-Co-58Co-60Nb-95Zr-95Ru-103Ru-106Cs-134Cs-1 37Ce-141Ce-144
1.43 + 0.603.11 i 0.66
< 0.045< 0.049< 0.031< 0.068< 0.064<0.071< 0.22< 0.050< 0.022<0.12<0.15
K-le
07-01-03KSL-3559
4.05 ± 0.23
< 0.0400.023 ± 0.012
1.12 ± 0.252.43 i 0.46
< 0.014<0.019<0.010< 0.025< 0.046< 0.019<0.15< 0.027< 0.028< 0.027< 0.097
* <0.191.23 ± 0.24
<0.013< 0.005< 0.010<0.016<0.018<0.012< 0.084<0.016< 0.009< 0.024< 0.063
K-1 k
08-04-03KSL-4398, 9
3.27 ± 0.08
*< 0.0230.017 ± 0.0084.53 ± 1.102.46 ± 0.55
< 0.036< 0.020< 0.034< 0.083< 0.082< 0.056< 0.34< 0.045< 0.029< 0.083< 0.24
K-1d
07-01-03KSL-3558
5.35 ± 0.31
< 0.0590.048 ± 0.022-2.23 ± 0.293.13 ± 0.54
*< 0.019< 0.021< 0.016< 0.022< 0.042< 0.016<0.17< 0.017< 0.019< 0.021< 0.070
Control
K-908-04-03KSL-4415
6.31 ± 0.13
< 0.0100.009 ± 0.003
< 0.516.01 ± 0.83
< 0.029< 0.037< 0.022< 0.041< 0.061< 0.049< 0.28< 0.032< 0.026<0.10<0.24
K-14
07-01-03KSL-3560
4.06 ± 0.22< 0.037<0.018
0.85 ± 0.293.31 ± 0.56
< 0.019< 0.016< 0.025< 0.028< 0.049< 0.020<0.16<0.016< 0.020< 0.021< 0.071
a Result of reanalysis
91
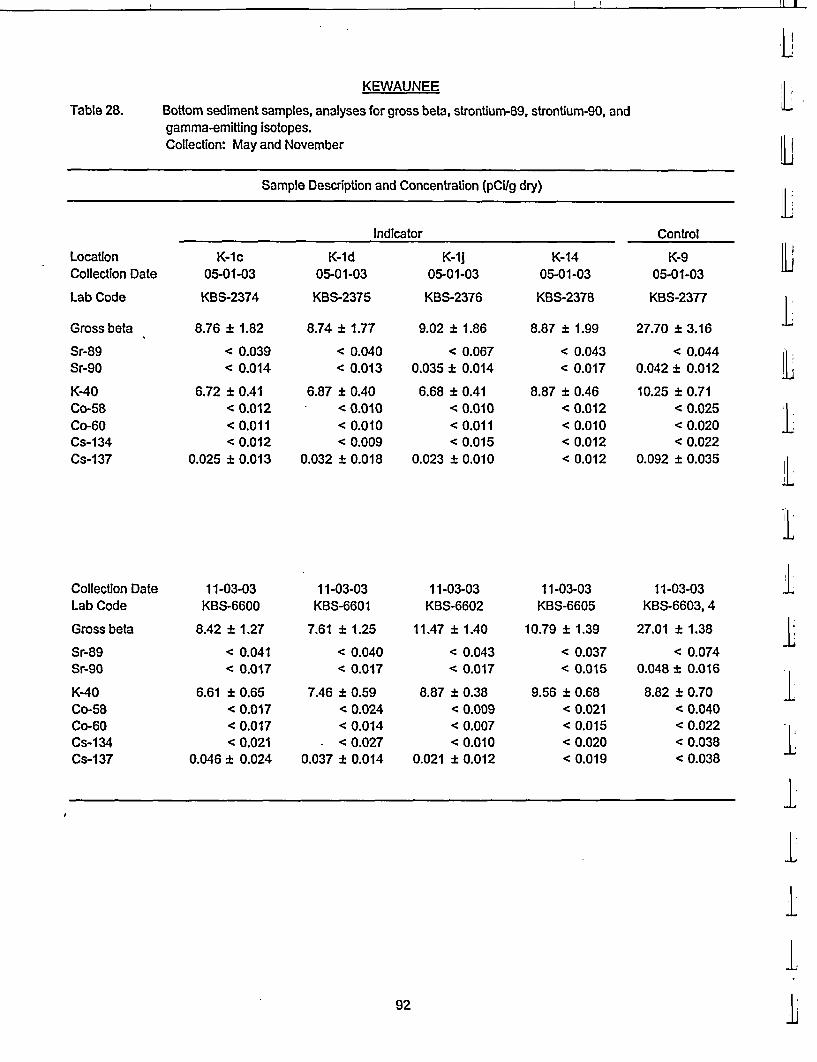
! 'I! 11 I
L'KEWAUNEE
Table 28. Bottom sediment samples, analyses for gross beta, strontium-89, strontium-90, andgamma-emitting isotopes.Collection: May and November
ILLI
Sample Description and Concentration (pClg dry)
Indicator
LocationCollection Date
Lab Code
K-Ic05-01-03
KBS-2374
K-Id05-01-03
KBS-2375
K-1j05-01-03
KBS-2376
K-1405-01-03
KBS-2378
Control
K-905-01-03
KBS-2377
Li
iGross beta
Sr-89Sr-90
K-40Co-58Co-60Cs-134Cs-137
8.76 ± 1.82
< 0.039< 0.014
6.72 ± 0.41< 0.012< 0.011< 0.012
0.025 ± 0.013
11-03-03KBS-6600
8.42 ± 1.27
< 0.041< 0.017
6.61 ± 0.65< 0.017< 0.017< 0.021
0.046 ± 0.024
8.74 ± 1.77
< 0.040< 0.013
6.87 ± 0.40< 0.010< 0.010< 0.009
0.032 ± 0.018
11-03-03KBS-6601
7.61 ± 1.25
< 0.040< 0.017
7.46 i 0.59< 0.024< 0.014
* < 0.0270.037 ± 0.014
9.02 ± 1.86
< 0.0670.035 ± 0.014
6.68 ± 0.41< 0.010< 0.011< 0.015
0.023 ± 0.010
11-03-03KBS-6602
11.47 ± 1.40
< 0.043< 0.017
8.87 ± 0.38< 0.009< 0.007< 0.010
0.021 ± 0.012
8.87 ± 1.99
< 0.043< 0.017
8.87 ± 0.46<0.012< 0.010< 0.012< 0.012
11-03-03KBS-6605
10.79 ± 1.39
< 0.037< 0.015
9.56 ± 0.68< 0.021< 0.015< 0.020< 0.019
27.70 ± 3.16
< 0.0440.042 ± 0.012
10.25 ± 0.71< 0.025< 0.020< 0.022
0.092 ± 0.035
11-03-03KBS-6603,4
27.01 ± 1.38
< 0.0740.048 ± 0.016
8.82 ± 0.70< 0.040< 0.022< 0.038< 0.038
I
I'1
ICollection DateLab Code
Gross beta
Sr-89Sr-90
K-40Co-58Co-60Cs-134Cs-137
III1'1II
92

APPENDIX A
RADIOCHEMICAL ANALYTICAL PROCEDURES
A-1

I I'I I
LI
- Environmental, Inc.Midwest Laboratoryan Aklgheny Teftol Co.
LI
1iI
ANALYTICAL PROCEDURES MANUALIIIENVIRONMENTAL, Inc.
MIDWEST LABORATORY
prepared for
NUCLEAR MANAGEMENT Co, LLC
KEWAUNEE NUCLEAR POWER PLANT
Revised 02-03-04
(This information, or any portion thereof, shall not be reproduced in any manner or distributed toany third party without the written permission of Environmental, Inc, Midwest Laboratory.)
IIII1-
I
II
I
1
I
I..

I
L
L
L
I,
L
L
Revised 05-07-02Page I of 1
KNPP
List of Procedures
ProcedureNumber
SP-01
TLD-01
AP-02
AP-03
W(DSY01
W(SSY02
AB-01
GS-01
Sample Preparation
Preparation and Readout of Teledyne Isotopes TLD Cards
Determination of Gross Alpha and/or Gross Beta in AirParticulate Filters
Procedure for Compositing Air Particulate Filters forGamma Spectroscopic Analysis
Determination of Gross Alpha and/or Gross Beta in Water(Dissolved Solids or Total Residue)
Determination of Gross Alpha and/or Gross Beta in Water(Suspended Solids)
Determination of Gross Alpha and/or Gross Beta in SolidSamples
Determination of Gamma Emitters by. GammaSpectroscopy
Determination of Tritium In Water
Determination of 1-131 In Milk by Anion Exchange (BatchMethod)
Determination of 1-131 in Charcoal Cartridges by GammaSpectroscopy
Determination of Sr-89 and Sr-90 in Water (Clear orDrinking Water
Determination of Sr-89 and Sr-90 in Ashed Samples
Determination of Sr-89 and Sr-90 in Soil and BottomSediments
Determination of Sr-89 and Sr-90 In Milk (Ion ExchangeBatch Method)
Procedure for Compositing Water and Milk Samples
Determination of Stable Calcium In Milk
Revision Revision DateNumber
6 01-26-04
7 06-07-01
1 07-15-91
2 07-21-98
4 07-21-98
2 07-21-98
2 06-11-01
3 02-03-04
5 01-29-02
5 09-24-92
1 08-01-92
0 03-21-86
0 07-23-86
0 07-23-86
4 08-18-94
0 11-07-88
0 07-08-88
T-02
1-131-01
1-131-02
SR-02
SR-05
SR-06
SR-07
COMP-01
CA-01

-~ -. Environmental, Inc..- Midwest Laboratory
anAgeghenyTedmologles Co.
700 Landwehr Road * UoabIook. L 60062-2310ph. (847) 564-C7C0 * ax (847 5644517
SAMPLE PREPARATION
EIML-SP-01
Prepared by
Environmental, Inc.Midwest Laboratory
Copy No.
Revision #
56
Date
05-07-0201-26-04
Paaes
149
Prepared by
S. A. CoorlimS. A. Coorlim
Anproved by
\r \1 ---
(This procedure, or any portion thereof, shall not be reproduced In any manner or distributed to any third party without the writtenpermission of Environmental. Inc., Midwest Laboratory.)

EIML-SP-01 Revf. 6, 01-26-04 J
TABLE OF CONTENTS
Pa-qe <
Principle of Method .............................. P e ; 3
Reagents ..... ......... .. ; ;; _. ;.. .3
Apparatus..3
Procedure for Packing Counting Containers ... 4 LA. Vegetation (Fruits, Vegetables, Grass) and Cattle Feed (Hay, Silage) ............................................... 5
B. Slime and Aquatic Vegetation .................................................. 5
C. Drying and Ashing, Vegetation Samples ................................................. 5.
D. Fish .,6 f
E. Waterfowl, Meat, and Wildlife ........................ 6
F. Drying and Ashing, Fish and Meat ....................... 6 ;1.6
G. Eggs ............ 7
H. Bottom Sediments and Soil .................. ;.;.,.7
1. *Milk.; ;., ;.8.
J. Dry Foods (Powdered Milk, Infant Formula, Animal Feed) ...................................................... 8
K. Feces..........................................................................................................................
L. Bottom Sediments and Soil, Analysis for Ra-226 by Gamma Spectroscopy ....................................... 9
2

'EIML-SP-01 Rev. 6.,01-26-04
SAMPLE PREPARATION
Principle of Method
Different classes of samples require different preparations. In general, food products are prepared as forhome use, while others are dried and ashed as received.
Reagents
Formaldehyde
Apparatus
BalanceCeramic DishesCounting ContainersCutting BoardDrying OvenDrying PansGrinderHigh Temperature Marking PenKnivesLabelsMuffle FurnacePlastic BagsPulverizerScissorsSpatulas
3
I 1I
EIML-SP-01 Rev. 6, 01-26-04 U
PROCEDURE FOR PACKING STANDARD CALIBRATED COUNTING CONTAINERS
A. 1.0, 2.0, 3.5 L: Pour 1.0, 2.0, or 3.5 liters of water into corresponding container. Mark the leveland empty the container. Fill with the sample to the mark, except for grass. Pack as much as will EJfit into the container.
B. ; 250 mL, and 500 mL: Fill to the rim on the inside wall, which is 114" from the top. LC. 4 oz Fill to the 100 mL mark.
Notes to Procedures: L
1. Pack sample containers tightly. For soil, sediments or other dried samples, make sure samples areleveled. I
2. A few mL. of formaldehyde may be added to wet samples to prevent spoilage.
3. For tritium analysis, transfer approximately 100 g of wet sample to a 4 oz. container. Label with Lthe sample number and seal.
4. If a gamma scan is the only required analysis, the drying and ashing steps are skipped.Transfer the samples to a plastic bag, seal, label, and stdre in a cooler or freezer until disposal.
5. If there is sufficient quantity, use surplus sample for drying and ashing instead of waiting for gamma*scanning to be completed. L
6. US Ecology Inc. samples: record total weight received.
7.. US Ecology Inc. and Maxey Flats samples are DRIED before gamma spectroscopic analysis.
8. If 1-131 analysis is required, the sample must be prepared and submitted to the counting roomimmediately. Mark "1-131" on the tape.
II
EIML-SP-01 Rev. 6, 01-26-04
A. Vegetables, Fruits. Grass, Green LeafvVegetation and Cattle Feed
Note: Do not wash the samples.
1. Cut vegetables and hard fruits Into small pieces (about.114" cubes). Mash soft fruits. Cut grass andgreen leafy vegetation into approximately 1-2" long stems. Pack cattle feed and silage. as Is. Uselarger containers if sufficient amount of sample is available.
2. Transfer sample to a standard calibrated container. Use the largest size possible for the amiiount ofsample available. Pack tightly but DO NOT FILL ABOVE THE MARK. Record the wet weight.
3. Seal with cover. Attach label to the cover recording the sample number, weight, and collection date.
4. Submit to the counting room for gamma spectroscopic analysis without delay or store in a cooler,(for short period), until counting..
5. Proceed to Drying and Ashing, Vegetation Samples
B. Slime and Aquatic Vegetation
1. Remove any foreign material. Place the sample in a sieve pan and wash until all sand 'and dirt Isremoved (turn the sample over several times). Squeeze out the water by hand.
2. Place the sample in a standard calibrated container. Use the largest size possible for the amount ofsample available. Weigh and record wet weight. DO NOT FILL ABOVE THE RIM.
6. Seal with cover. Attach label to the cover recording the sample number, weight, and collection date.
4. Submit to the counting room without delay. Slime decomposes quickly, even with formaldehyde. Ifgamma scanning must be delayed, freeze.
5. Proceed to Drying and Ashing, Vegetation Samples
C. Drying and Ashing, Vegetation Sampies
1. After gamma scan is complete, transfer the sample to a drying pan and dry at 11 0C.
2. Cool, weigh, and record dry weight.
3. Transfer to a tared ceramic dish, and record dry weight for ashing. Ash in a muffle furnace bygradually Increasing the temperature to 600C.
NOTE: If ashing Is incomplete (black carbon remains), cool the dish, crush the ash with spatula, andcontinue ashing overnight at 6000C. It Is not necessary to Increase the temperature gradually.
4. Cool and weigh the ashed sample and record ash weight. Grind and sieve through a 30 meshscreen. Transfer to a 4 oz. container, seal, and label with sample number, weight, analysesrequired, and date of collection. The sample Is now ready for analysis.
5
I 'I I
EIML-SP-01 Rev. 6, 01-26-04 l
D. Fish L
1. Wash the fish.
2. Fillet and pack the fish immediately (to prevent. moisture loss) in a 250 mL, 500 mL, or' 4 oz.standard calibrated'container. Use 500 mL size if'enough sample' is available. '-DO NOT FILLABOVETHERIM. Recordthewetweight'
3. Proceed to Step 2, Waterfowl, Meat and Wildlife Samples below.
E. Waterfowl. Meat, and Wildlife
1. Skin and clean the animal. Remove a sufficient amount of flesh to fill an appropriate standardcalibrated container (500 mL, 250 mL, or 4 oz). Weigh without delay (to prevent moisture loss). DO:'NOT FILL ABOVE THE RIM. Record the wet weight.
2. If bones are to be analyzed, boil remaining flesh and bones In water for about 1 hour. Clean thebones. Air dry, weigh, and record as wet weight. Dry at 1100C. Record dry weight. Ash at 8000C,cool, weigh, and record the ash weight. Grind to a homogeneous sample. The sample is ready for Lanalysis.
3. Seal with cover. Attach label to the cover recording the sample number, weight, and collection date. I4. Submit to -the counting room for gamma spectroscopic analysis without delay or store in a
refrigerator, (for short period), until counting. I5. Proceed to Drying and Ashing, Fish and Game Samples
F. Drying and AshinQ, Fish and Meat Samples
1. After gamma scan Is complete, transfer the sample to a drying pan and dry at 11 0C. i2. Cool, weigh, and record dry weight.
3. Transfer to a tared ceramic dish. Record dry weight for ashing.
4. Ash in a muffle furnace by gradually increasing the temperature to 450C. If considerable amountof carbon remains after overnight ashing, the ash should be crushed with a spatula and placed backIn the muffle furnace until ashing is completed.
5. Cool and weigh the ashed sample and record the ash weight. Grind and sieve through a 30 mesh |screen. Transfer to a 4 oz. container, seal, and record sample number, weight, analyses required,and date of collection; The sample is now ready for analysis. I
I
6
I

EIML-SP-01 Rev. 6, 01-26-04
G. * Eggs
1. Remove the egg shells and mix the eggs with a spatula.
2. Transfer the mixed eggs to a standard calibrated 500 mL container. Record the wet weight. DONOT FILLABOVE THE RIM.
3. Seal with cover. Attach label to the cover recording the sample number, weight, and collection date.
4. Submit to the counting room for gamma spectroscopic analysis without delay or store In arefrigerator, (for short period), until counting.
5. After the gamma scan is complete, transfer the sample to a drying pan and dry at ii0 0C. :
6. Cool, weigh, and record dry weight.
7. Transfer to tared ceramic dish. Record dry weight for ashing.
8. Cool and weigh the ashed sample and record the weight. Grind and sieve through a 30 meshscreen. Transfer to a 4 oz. container, seal, and record sample number, weight, analyses required,and date of collection. The sample Is now ready for analysis.
9. Store the remaining dry sample In a plastic bag.
H. Bottom Sediments and Soil
1. Remove rocks, roots, and any other foreign materials.
2. Place approximately 1 kg of sample on the drying pan and dry at 110C.
3. Seal, label, and save remaining sample.
4. Grind or pulverize the dried sample and sieve through a No. 20 mesh screen.
5. For gamma spectroscopic analysis, transfer sieved sample to a standard calibrated 500 mL, 250mL, or4 oz. container. DO NOT FILLABOVETHE RIM. Record dryweight.
6. Seal with cover. Attach label to the top of the cover and record the sample number, weight, anddate of collection..
7. Submit to the counting room for gamma spectroscopic analysis without delay.
8. For gross alpha and beta analysis transfer 1-2 g of sample to a 4 oz. container, seal and label withthe sample number. For other analysis (I.e., radiostrontium, transuranics etc.,) transfer to aceramic dish and ash In a muffler fumance at 6000C. Cool and transfer to a 4 oz. container, sealand label with the sample number.
9. Store the remaining sieved sample in a plastic bag.
10. After the gamma scan is complete, transfer the sample to a plastic bag, seal, label, and store untildisposal.
7

EIML-SP-01 Rev. 6,01-26-04 U
LI. Milk Ij
1. Transfer 25 mL of milk for gross alpha and beta analysis or 100-1 000 mL for other analysis into aglass beaker.
2. Dry at lIO0°C.
3. Ash in the muffler fumance by gradually increasing the temperature to 6000C. If a considerableamount of carbon remains (black), cool the beaker, crush the ash with a spatula and continueashing until completed (white or light gray in color).
4. Cool and weigh the ashed sample and record the ash weight. Grind and transfer to a 4oz.container, seal and record the sample number. The sample is now ready for analysis. lj
J. Drv Foods (Powdered Milk, Infant Formula. Animal Feed)
For gamma isotopic analysis of powdered samples, no preparation is necessary. The samples aretransferred to a M arinelli beaker as received.
1. Tare a 250 or 500 ml. Marinelli beaker (with lid), depending on sample size available. Record thetare weight.
2. Transfer sample to the beaker. (Refer to pg. 4, 'PROCEDURE FOR PACKING STANDARDCALIBRATED COUNTING CONTAINERS-)
3. Attach a label to the top of the cover and record the sample number, weight and collection date. I4. Submit to the counting room without delay.
5. Submit to the counting room for gamma spectroscopic analysis without delay.
6. For gross alpha and beta analysis transfer 1-2 g of sample to a 4 oz. container, seal and label withthe sample number. For other analysis (i.e., radiostrontium, transuranics etc.) transfer to a ceramicdish and ash in a muffle furnance at 6000C. Cool and transfer to a 4 oz. container, seal and label Iwith the sample number.
II
I8

EIML-SP-01 Rev. 6. 01-26-04
K. Feces
NOTE: Perform Transfer operation In the hood. Wear new plastic gloves and face mask.
1. Take a 600 mL beaker, clean acid etched area and write sample # using HI-Temp marker.
2. Cover the beaker with parafilm and weigh. Record the weight.
3. Transfer the whole sample to the beaker using a new plastic spoon.
4. Cover the beaker with the same parafilm and weigh. Record total weight.
5. Transfer the beaker to the drying oven, remove parafilm and dry the sample overnight at 1100 C.
6. In the morning, turn oven off. Let the exhaust fan run until sample cools to room temperature.
7. Transfer beaker to the muffle furnace. Set temperature to 1750C. Gradually increase thetemperature to 4500C and ash the sample overnight.
NOTE: In the morning, carefully open the door and visually Inspect the sample. Do not touch or removethe beaker from the fumace. If ashing Is incomplete, (black carbon remains),.continue ashingfor another 24 hours or until the ash is grey-white.
L 8. Once ashing Is complete, turn the temperature off. Let the exhaust fan run until beaker Is cool.
9. Remove the beaker from the furnace and cover with parafilm. The sample is ready for analysis.
NOTE: Digest the whole ash sample In the same beaker before taking aliquot for analysis. Do notweigh the beaker.
L. Bottom Sediments and Soil, Analysis for Ra-226 by Gamma SpectroscopV
1. Remove rocks, roots and any other foreign materials.
L 2. Place approximately 1 kg of sample in a drying pan and dry at 1100C. Save any remaining sample.
3. Grind or pulverize the dried sample and sieve through a No. 20 mesh screen.
4. Transfer sieved sample to a standard calibrated 500 mL or 250 mL container.DO NOT FILL ABOVE THE RIM. Record dryweight.
L 5. Seal with cover and electrical tape. Attach label to the top of the cover and record the samplenumber, weight, and date of collection and date and time the container was sealed..
6. Deliver to counting room for gamma spectroscopic analysis. (The sample is stored for a minimum of20 days to allow Pb-214 to come to equilibrium with Ra-226. The Pb-214 peak is then used tocalculate the Ra-226 concentration.)
7. Store the remaining sieved sample In a plastic bag for possible future reanalysis.
8. After the gamma scan is completed, transfer sample to a plastic bag, label and store until disposal.
9

- % Environmental, Inc.Midwest Laboratoryan leighe Tedmdogles CGo
700 Landwel Road * Norebrook IL 60062-2310ph (847) S64-700 fax (847) 564-4517r L
i7 -I
MEASUREMENT of AMBIENT GAMMA RADIATION byTHERMOLUMINESCENT DOSIMETRY (CaSO4:Dy)
PROCEDURE NO. EIML-TLD-01
Prepared by
Environmental, Inc.Midwest Laboratory
Copy No.
Revision #
5 u6
7.Reissue
01-08-9004-24-9506-07-01
-PaP s , . Prepared by
6 -- B Grob6 BGrob3 SA Coorlim
Approved by
.LQ HuebnerLG H~uebnerLUnw kk
(This procedure, or any portion thereof, shall not be reproduced In any manner or distributed to any thirdparty without the written permission of Environmental, Inc., Midwest Laboratory.)

I IIL
EIML-TLD-01 Revision 7, 06-07-01
MEASUREMENT of AMBIENT GAMMA RADIATION byTHERMOLUMINESCENT DOSIMETRY (CaSO4 :Dy) L
Principle of Method *
The cards are spread out in a single layer on a perforated metal tray and annealed for two hours at250-260 OC. After annealing, the cards are packaged and sent to the field.
Once the cards are returned from the field they are read as soon as possible. After reading, several; cards are chosen, annealed and irradiated with a known dose using a Ra-226 source encapsulated in an: iridium needle to calculate efficiency. The net exposure is calculated after in-transit exposure is
subtracted.
1. Equipment & Materials:
TLD Reader (Teledyne Isotopes Model 8300) Annealing ovenTLD Cards (CaSO4:Dy phosphor) ForcepsTLD Card Holder with copper shielding Black Plastic bags (pouches)Transparent plastic bags (6oz and 8oz puncture proof Whirt-Pak)Heat-sealer Scotch tapeLabels Recording sheetRa-226 Needle: ("American Radiume No. 37852) Turntable
II. Preparation
1. - Enter location l.D, dosimeter (card) number, and date annealed on the readout recording sheet.As per project requirements, include cards for in-transits and spares.
2. Spread the cards in a single layer on the perforated tray.
3. Preheat the annealing oven to 250-260 °C
4. Set the alarm and anneal for two hours. Remove tray from the oven and let cool.
5. Place each card in a black plastic bag (pouch), seal the flap with scotch tape, and place in thecard holder. I
6 Attach a label identifying the station, location, and exposure period, on each holder. Place theholders into a transparent plastic bag and heat seal.
7. Ship without delay. Place a "Do Not X-Ray" sticker on the mailing container.
Ill. Reader Calibration
1. Adjust the nitrogen flow control to 6 SCF per hour. I2. Open the card drawer.
3. Turn "FUNCTION" switch to "CALIBRATE". The "WAIF sign will be illuminated and the readingwill change every three seconds. The reading should be 1000 ±10. If not, adjust using the"CALIBRATE" dial.
2
1

EIML-TLD-01 Revision 7, 06-07-01
Ill. Reader Calibration (continued)
4. Tum "FUNCTION" switch to UOPERATE. Press "START". When the "READ" signal appears,-thereading should be as posted. If not, adjust with 'Sensitivity' dial. (Turn clockwise if reading islow, counterclockwise if reading Is high).
5. Wait for "START button to light before continuing. Press "START". Continue adjusting'"SENSITIVITY" until the reading Is as posted. Make and record 5 readings.
6. When the "START button lights, push In the card drawer to position No. 3. Press "START". Waitfor the "READ" signal and record the reading. (dark current / background)
7. Repeat this step four more times (total of five readings) and record the results.NOTE: The reading should be as posted on the reader. If not, notify the Lab supervisor.
IV. Readout of TLD Cards
1. After the "START button lights, pull out card drawer. Take the card out of the holder andinsert in the drawer with printed card number facing down and to the back (away from you).
2. Push drawer Into position No. 1. Push "START" button.3. When "READ" sign appears, record the reading.
4. When "START" button lights up, push the drawer to position No. 2. Push "START" button.Repeat steps 2.3 and 2.4 until all positions are read out.
5. Read out and record the reading for the rest of the cards in the same manner.
V. Efficiency Determination
NOTE: Perform an efficiency calibration after each field cycle. (i.e. random TLDs from each projectare calibrated after every readout of that project.).
1. After readout of a project is completed, select two to three cards at random.2. Anneal and package as described In Part 11, Steps 2 thru 8.
3. Clip the holders (with the freshly annealed cards) on the Irradiation turntable. Start rotation.4. Attach the Ra-226 needle to center of the turntable. Record the time. Irradiate overnight.
5. Remove the needle, record the time, and read out the cards as In Part 111.
6. Average all the readings, and subtract average dark current reading (Part Ill, Step 6-7).
7. Calculate efficiency (light response) as follows:
Efficiency i Net Average Reading (from step 6.)Hours of exposure x 2.097
8. Submit the field data and efficiency data sheets to data clerk for calculations.
NOTE:The calculation program will automatically subtract the In-transit exposure and prorate exposure to aselected number of days (usually 30 or 91). Occasionally, some TLDs are placed and/or removed atdifferent times resulting In a different number of exposure days in the field. Exposure will be proratedfor the selected number of days.
.3

- ETELEDYNEISOTOPES
MIDWEST LABORATORY
700 LANDWEHR ROAD
NORTHBROOK, ILLINOIS 60062.2310
(708l 564-0700 FAX (708)5 5.4517
IW
_ DETERMINATION OF GROSS ALPHA AND/OR GROSS BETA
IN AIR PARTICULATE FILTERS
PROCEDURE NO. TIML-AP-02
Prepared by
Teledyne Isotopes Midwest Laboratory
1p
Copy No.
Revised RevisionPages No. Date Pages Prepared by Approved by
0 07-11-86 3 - -e
2 1. 07-15-91 3
(Ti prcdr .o n oto(This procedure, or any portion thereof, shall not be reproduced in any manneror distributed to any third party without the written permission of TeledyneIsotopes Midwest Laboratory.)
TIML-AP-02-01

IIL
TIML-AP-02 Revision 1, 07-15-91 L
UDETERMINATION OF GROSS ALPHA AND/OR GROS& BETA
IN AIR PARTICULATE FILTERS '
Principle of Method
Air particulate filters are stored for at *least 72 hours to allow for the 1 1decay of short-lived radon and thoron daughters and then counted in theproportional counter.
Apparatus
ForcepsLoading SheetProportional CounterStainless Steel Planchets (standard 2" x 1/8")
Procedure I1. Store the filters for at least 72 hours from the day of collection. J 1
2. Place filters on a stainless steel planchet.
3. Fill out a sample loading sheet. Fill in the date, counter number,counting time, sample identification number, sample collection date, andinitials.
NOTES: When loading samples in the holder, load blanks (unexposed filterpaper) in positions 1, 12, 23, 34, 45, etc. -
If filters from more than one project are loaded, make sure thatthe appropriate blanks are loaded with each batch. Load thecounter blank planchet as a last sample.
4. Count in a proporational counter long enough to obtain the requiredLLDs.
5. After counting is completed, return the filters to the original envelopes. |
6. Submit the counter printout, field collection sheet, and the loading sheetto the data clerk for calculations.
TIML-AP-02-02

TIML-AP-02 Revision 0, 07-04-86
Calculations
Gross alpha (beta) concentration:
(pCi/liter) =A
B x C x 2.22
2 VEs2b + Eb2
B x C x 2.22
Where:
A
B
C
Esb
Eb
= Net alpha (beta) count (cpm)
= Efficiency for counting alpha (beta) activity (cpm/dpm)
= Volume of sample
= Counting error of sample plus background
= Counting error of background
TIML-AP-02-03

Environmental, Inc.Midwest Laboratoryan Aleghery Tedndogies Co.
PROCEDURE for COMPOSITING AIR PARTICULATE FILTERS
for GAMMA SPECTROSCOPIC ANALYSIS
PROCEDURE NO. AP-03
Prepared by
Environmental Inc.Midwest Laboratory
Copy No.
Revised* Pages Revision # .~Q , -, '.'Esso -
012
12-15-8903-21-9507-21-98
333
B. GrobB. Grob
A Favrmn
L.G. HuebnerL.G, Huebner
B. Grob
(This procedure, or any portion thereof, shall not be reproduced in any manner or distributed to anythird party without the written permission of Environmental Inc., Midwest Laboratory.)
l -
AP-03 - Rev. 2, 07-21-98 LPROCEDURE FOR COMPOSITING AIR PARTICULATE FILTERS
FOR GAMMA SPECTROSCOPIC ANALYSIS LPrinciple of Method
AP filters are placed in a Petri dish in chronological order, labeled and submitted to the counting 1room for analysis.
Materials
Tweezers (long)Blank filter paperSmall Petri Dish (50 x 9 mm) IScotch Tape
Procedure L1. In the Recording Book enter
* Sample ID (project)* Sample No. L* Location* Collection Period* Date Composited
2. Obtain sample numbers from Receiving Clerk.
3. Stack the envelopes with APs from each location in chronological order, starting with theearliest date on the bottom. After you are done, flip the stack over.
4. Place blank filter paper, 'fluffy' side down, in deep half of Petri dish. L5. Beginning from the top of the stack, remove each AP from its envelope and place in the Petri
Dish with the deposit facing down. -
6. Continue transferring AP's from envelopes into the Petri Dish. 2
7. Place blank filter, "fluffy" side down, on top of APs.
8. Cap the Petri Dish using the shallow half (you may use Scotch tape to hold cap in place, (ifneeded). Turn the Petri dish over. l
9. On the Petri dish and each stack of glassine envelopes (each location kept together byeither paperclips or rubber bands) using a black marker write:
* Sample ID* Sample No.* Last date of collection* Collection Period I
10. Submit the samples to the counting room.
11. After counting, samples are stored in the warehouse, according to client's requirements.
2
'I

AP-03 Rev. 2, 07-21-98
PROCEDURE for COMPOSITING AIR PARTICULATE FILTERSFOR GAMMA SPECTROSCOPIC ANALYSIS
Example
* Sample ID (project)* Sample No.* Location* Last Collection Date* Collection Period
BAP2167503-31-981st Qtr. 1998
12Blank APs
f }First weektolast week in quarter
_7
Side View
2
Top View
3

TELEDYNE BROWN ENGINEERINGENVIRONMENTAL SERVICES
- \MIDWEST LABORATORY
DEIERMINATION OF GROSS ALPHA AND/OR GROSS BETA IN WATER
(DISSOLVED SOLIDS OR TOTAL RESIDUE)
PROCEDURE NO. TIML-W(DS)-01
Prepared by
Teledyne Brown Engineering Environmental ServicesMidwest Laboratory
Copy No.
Revision #
0 ,-1 -23.4
Date
K 11-25-8502-28-9105-03-9108-14-9207-21-98
Pages Prepared by Approved by
4:.4
4,4
-. 4
B. GrobB. Grob
- B.Grob -
B. Grob- AJi de- <
: L.G. HuebnerL.G. HuebnerL.G. Huebnerluzufbner
11/2\laoy
(This procedure, or any portion thereof, shall not be reproduced in any manrY distributed toany third party without the written permission of Teledyne Brown Engineering EnvirorunmentalServices, Midwest Laboratory.)

I L
TIML-W(DS)-01 Revision 4,07-21-98DETERMINATION OF GROSS ALPHA AND/OR GROSS BETA IN WATER ,
(Dissolved Solids or Total Residue)'
Principle of Method .
Water samples containing suspended matter are filtered through a membrane filter and thefiltrate is analyzed. The filtered water sample is evaporated and the residue is transferred to atared planchet for counting gross alpha and gross beta activity.
Reagents LAll chemicals should be of "reagent-grade" or equivalent whenever they are commerciallyavailable.
Lucite 0.5 mg/ml in acetoneNitric acid, HNO3: 16 N (concentrated), 1 N (62 ml of N HNO3 diluted to 1 liter)
Apparatus
Filter, membrane Type AA, 0.08Filtration equipment |Planchets (Standard 2"cl/8" stainless steel, ringed planchet)Electric hotplateHeat lampDrying ovenMuffle furnaceAnalytical BalanceDessicator l
-Proportional counter
Procedure l
1. Filter a volume of sample containing not more than 100 mg of dissolved solids for alphaassay, or not more than 200 mg of dissolved solids for beta assay.a iNOTE: For gross alpha and gross beta assay in the same sample, limit the amount ofsolids to 100 mg. j
2. Filter sample through a membrane filter. Wash the sides of the funnel with deionized(D. I.) water. Discard the filter, unless determining suspended solids also. See procedureT1ML-W(SS-)02.
3. Evaporate the filtrate to NEAR dryness on a hot plate. i4. Add 20 ml of concentrated HNO3 and evaporate to NEAR dryness again.
NOTE: If water samples are known or suspected to contain chloride salts, these Lchloride salts should be converted to nitrate salts before the sample residue istransferred to a stainless steel planchet. (Chlorides will attack stainless steel andincrease the sample solids. No correction can be made for these added solids.) Chloridesalts can be converted to nitrate salts by adding concentrated HNO3 and evaporating tonear dryness.
:

TIML-W(DS)-01-02
TIML-W(DS)-01 Revision 4,07-16-98
5. Transfer quantitatively the residue to a TARED PLANCHET, using an unused plasticdisposable pipette for each sample, (not more than 1 or 2 ml at a time) evaporating eachportion to dryness under the lamp. Spread residue uniformly on the planchet.
NOTE: Non-uniformity of the sample residue in the counting planchet interferes withthe accuracy and precision of the method.
6. Wash the beaker with DI water several times and combine the washings and the residuein the planchet, using the rubber policeman to wash the walls. Evaporate to dryness.
NOTE: Rinse the rubber policeman with DI water between samples.
7.. Bake in muffle furnace at 400 0 C for 45 minutes, cool and weigh.
NOTE: If the sample is very powdery, add a few drops (6-7) of the Lucite solution anddry under the infrared lamp for 10-20 minutes.
8. Store the sample in a dessicator until ready to count since vapors from-the moist residuecan damage the detector and the window and can cause erratic measurements.
9. Count the gross alpha and/or the gross beta activity in a low background proportionalcounter.
NOTE: If the gas-flow internal proportional counter does not discriminate for the higherenergy alpha pulses at the beta plateau, the activity must be subtracted fromthe beta plus alpha activity. This is particularly important for samples withhigh alpha activity.
Samples may be counted for beta activity immediately after baking; alpha countingshould be delayed at least 72 hours (until equilibrium has occurred).
a For analysis of total residue (for clear water), proceed as described above but do not filterthe water. Measure out the appropriate amount and proceed to Step 3.
TIML-W(DS)-01-03
I ,
TIML-W(DS)-01
Calculations.
Gross alpha-(beta) activity:
A .
pCi/L= .BxCxDx2.22 ± BxCxDx2.22
Where:
Revision 4, 07-16-98
El
A.
B
C
D
Es b
Eb
= Net alpha (beta) count (cpm)
= Efficiency for counting alpha (beta) activity (cpm/dpm)
=Volume of sample (liters)
Correction factor for self-absorption-(See Proc. TIML-AB-02)
=Counting error of sample plus background
= Counting error of background
References: Radio assay Procedures for Environmental Samples, US. Department of Health,Education and Welfare. Environmental Health Series, Jan. 1967.
EPA Prescribed Procedures for Measurement of Radioactivity in Drinking Water.August 1980
I
.1,
II.
TIML-W(DS)-01-04

L .'*"K4. . '. 7. A. ' I' . 'i
I '. ", ,, - ;,;. -" I
i '
1 1
I
TELEDYNE BROWN ENGINEERINGENVIRONMENTAL SERVICES
MIDWEST LABORATORY
700 Landwehr Road * Northbrook IL 60062-2310Phone (847) 564-0700 * Fax (847 5644517
DETERMINATION OF GROSS ALPHA AND/OR GROSS BETA IN WATER
(SUSPENDED SOLIDS)
PROCEDURE NO. TIML-W(SS)-02
Prepared by
Teledyne Brown Engineering Environmental ServicesMidwest Laboratory
Copy No.
Revision #
0I2
Date
10-21-8608-14-9207-21-98
Pages Prepared by
443
Approved by
L.G. HuebnerB. Grob
.L.G. Huebner
L.G k~ibe_ \j
(This procedure, or any portion thereof, shall not be reproduced in any manner ordistributed to any third party without the written permission of Teledyne BrownEngineering Environmental Services, Midwest Laboratory.)

TIML-W(SS)-02 Revision 2, 07-21-98
DETERMINATION OF GROSS ALPHA AND/OR GROSS BETA IN WATER
(SUSPENDED SOLIDS) -
Principle of Method
The sample is filtered through a tared membrane filter. The filter containing the solids is placedon a ringless, stainless steel planchet and air dried, then placed in a dessicator until ready forweighing. The gross alpha and gross beta activities are measured in a low background internal.proportional counter.
Reagent
Acetone
Apparatus
Filter,-membrane Type AA 0.08Filtration equipmentPlanchets (Standard 2"xl/8" stainless steel, ringless planchet)Heat lampAnalytical BalanceDessicator.Proportional counter
Procedure
1. Filter one liter of sample through a TARED membrane filter. Wash the sides of thefunnel with deionized water.
NOTE: If the sample contains sand, place it in the separatory funnel, allow the sand tosettle for 30 minutes, then drain off the sand at the bottom. Shake the funneland repeat as above two (2) more times.
2. Place the filter on a ringless planchet and air dry for 24 hours.
3. Dry under the infrared lamp for 20-30 minutes. Desiccate to constant weight and weigh.
4. Count for gross alpha and gross beta activity using a proportional counter.
5. Calculate the activity in pCi/L, using the computer program designed for this analysis.
- TIML-W(SS)-02-02

TRNfUW(SS)-02 Revision 2, 07-21-98
Calculations
Gross alpha (beta) activity:
A 24Ef22rxxE2bp~iL=BxCxDx2.22± BxCxDx2.22
Where:
A
B
C
D
Es b
Eb
= Net alpha (beta) count (cpm)
= Efficiency for counting alpha (beta) activity (cpm/dpm)
=Volume of sample (liters)
= Correction factor for self-absorption (See Proc. TIML-AB-02)
=Counting error of sample plus background
- Counting error of background
References: Radio assay Procedures for Environmental Samples, U.S. Department of Health,Education and Welfare. Environmental Health Series, January 1967.
TIMIL-W(SS)-02-03

'Environmental, Inc.Midwest Laboratory
700 Landwear Road * Ncrtirodc, IL 66-2310(4) 5607 - W (87564-517
v"'N -'.'-"
DETERMINATION OF GROSS ALPHA AND/OR GROSS BETA
IN SOLID SAMPLES
PROCEDURE NO. EIML-AB-01
Prepared by
Environmental, Inc.Midwest Laboratory
Ccpy%,
Revision # Date Pag . Prepared by
0 08-04-86 4 B Grob LG Huebner1 08-14-92 5 B Grob LGuebner2 06-11-01 3 SA Coorlim
(This procedure, or any portion thereof, shall not be reproduced In any manner or distributed to any thirdparty without the written permission of Environmental, Inc., Midwest Laboratory.)

I~I I
£EIML-AB-01 Revision 2, 06-11-01 I1
DETERMINATION OF GROSS ALPHA AND/OR GROSS BETAIN SOLID SAMPLES
Principle of Method
.. 100 mg to 200 mg of sample Is distributed evenly on a 2" ringed planchet, counted in a proportionalcounter, and concentrations of gross alpha and /or gross beta are calculated.
A. Vegetation. Meat. Fish. and Wildlife
-Procedure
1. Weigh out accurately in a planchet no more than 100 mg of ashed or dried and ground sample forgross alpha assay and no more than 200 mg for gross beta assay.
NOTE: If both gross alpha and gross beta analyses are required, do not use more than 100mg.
2. Add a few drops of water and spread uniformly over area of the planchet. Dry under a heat lamp.
NOTE: If necessary, a few drops (6-7) of a lucite solution ( 0.5 mg/ml in acetone) may be added to keepresidue in place. Dry under an Infrared lamp for 10-20 minutes. 12
4. Store the planchets in a dessicator until counting.
5. Count the gross alpha and gross beta activity in a low background proportional counter.
Calculations
Gross alpha / gross beta activity:
IIL.1III
I1'
I
II
2 'ES 2A(pCVg wet) = ' -'
BxCxDxFx2.22 BxCxDxFx2.22
Where: L.'ABCDEsbEb.F
= Net alpha / beta counts (cpm)= Efficiency for counting alpha / beta activity (cpmldpm)= Weight of sample (grams), ash or dry= Correction factor for self absorption (See Proc. TIML-AB-02)= Counting error of sample plus background= Counting error of background= Ratio of wet weight to ashed or dry weight
ii12I.REFERENCES: Radloassay Procedures for Environmental Samples, U.S. Department of Health,
Education and Welfare. Environmental Health Series, January 1967.
2
i
L'

EIML-AB-01 Revision 2, 06-11-01
B. Gross AIlha and/or Gross beta In Soil and Bottom Sediments
Procedure
1. Weigh out accurately in a planchet no more than 100 mg of a pulverized sample for a gross alphaassay and no more than 200 mg for a gross beta assay.
NOTE: If both gross alpha and gross beta analyses are required, do not use more than 100mg;
2. Add a few drops of water and spread uniformly over area of the planchet. Dry under a heat lamp.
NOTE: If necessary, a few drops (6-7) of a lucite solution ( 0.5 mg1ml in acetone) may be added to keepresidue In place. Dry under an Infrared lamp for 10-20 minutes. 12
3. Store the planchets In a dessicator until counting.
4. Count the gross alpha and gross beta activity In a low background proportional counter.
CalculatIons
Gross alpha / gross beta activity:
24E& + EbA(pCVg dry) = -- I go
BxCxDxFx2.22 BxCxDxFx2.22
Where:
ABCD
-EsbEbF
= Net alpha I beta counts (cpm)= Efficiency for counting alpha / beta activity (cpm'dpm)= Weight of sample (grams)= Correction factor for self absorption (See Proc. EIML-AB-02)= Counting error of sample plus background= Counting error of background= Ratio of wet weight to ashed or dry weight
REFERENCES: Radioassay Procedures for Environmental Samples, U.S. Department of Health,Education and Welfare. Environmental Health Series, January 1967,
3

I
a - . Environmental, Inc.Midwest Laboratoryan Aefgheny Tecndoogles Co. zr700LandwehgRoad ;Nvlbookrh IL60062-2310 .l'.(847) S40700 fax (847)5 W45l7 .tiA
p. (87 U 41
DETERMINATION OF GAMMA EMifTERSBY GAMMA SPECTROSCOPY
(GERMANIUM DETECTORS)
GS-01
Prepared by
Environmental Inc.Midwest Laboratory
Copy No.
RevisedPages. Revision # Date - Pages Prepared by -Approved by
Reprint 2 07-01-98 3 F. G. Shaw SAnoorim3 02-03.04 4 S. A. Coorlim
(This procedure, or any portion thereof. shall not be reproduced In any manner or distributed to any third party without the writtenpermission of Environmental Inc., Midwest Laboratory.)

LGS-01 Rev. 3, 02-03-041
DETERMINATION OF GAMMA EMITTERS IBY GAMMA SPECTROSCOPY
(GERMANIUM DETECTORS) ,
Principle of Method
Samples are weighed or measured Into calibrated containers and set directly on an HPGe (high-puritygermanium) detector. The sample Is counted for a sufficient length of time necessary to reach therequired MDA (Minimum Detectable Activity). Results are decay corrected to the date of collection, whereappropriate, using a dedicated computer and software.
Apparatus
Counting ContainersCounting EquipmentCylindersMarking PensRecording Books {
A. Milk, Water, and other Liquid Samples
1. Measure with a graduated cylinder, 500 mL, 1.0 L, 2.0 L or 3.5 L of sample Into a calibrated 1sample container (Marinelli beaker). Use the largest volume possible, based on availablesample quantity.
2. Affix a label to the container cover with the sample number, volume, date and time ofcollection. Mark 1-131" if analysis for 1-131 by gamma spectroscopy is required.
3. Count for estimated time required to meet the client's specifications. Record file number, Isample identification number, date and time counting started, detector number, geometry,sample size, and date and time of collection.
4. Stop the counting; transfer the spectrum to the disk, and print out the results.
5. Check the results for required MDAs. If the client's specifications are not met, continue thecounting. I
6. Once the required MDAs have been met, record the counting time.
7. Return the sample to the original container and mark with a red marker. INOTE: Refer to procedure OP-10, Operating Procedure for the EG&G ORTEC OMNIGAM Gam ma
Spectroscopy System.
2

GS-01 G0Rev. 3, 02-03-04
B. Airborne Particulates
1. Place the air filters in a small Petrie dish following Procedure AP-03.
2. Place Petrie dish (with marked side up) on the detector and count long enough to meet theclient specifications. Record the file number, sample Identification number, date and timecounting started, detector number, geometry, sample size, and date and time collected.
' NOTE: When counting Individual filters, place In a labeled Petrie dish with active (deposit) side up.
3. Stop counting and transfer spectrum to the disk. Print out and check the results beforeremoving the'sample. if client specifications are not met, continue counting.
4. When the required MDAs have been met, record the counting time.
5. Replace air filters In the original envelopes for storage or further analyses.
NOTE: Refer to procedure OP-10, Operating Procedure for the EG&G ORTEC OMNIGAM GammaSpectroscopy System.
C. Other Samples
NOTE: Samples, e.g. soil, vegetation, fish, powdered samples, etc., are prepared in the prep laband delivered to the counting room
1. Place the sample on the detector and count long enough to meet client's technicalrequirements. Record the file number, sample Identification number, date and time countingstarted, detector number, geometry, sample size, and date (and time, If applicable) ofcollection.
2. Stop the counting and transfer the spectrum to the disk. Print out and check the resultsbefore removing the sample. If client specifications are not met, continue counting.
3. When the required MDAs have been met, record the counting time. Mark the container withred marker and return to the prep lab for transfer to storage or further analyses.
NOTE: Refer to procedure OP-10, Operating Procedure for the EG&G ORTEC OMNIGAM GammaSpectroscopy System.
D. Charcoal Cartridges
For counting charcoal cartridges, follow Procedure 1-131-02, 1-131-04 or 1-131-05.
3

I I
GS-01 Rev. 3,02-03-04 LIi
CALCULATIONS:
IIActivity (pCiIL) t the two sigma error for a'select gamma peak, region of interest (ROI) -
A 2jEb +Eb2.22xCxDxGxY 2.22xCxDxGxY
IEwhere:
A = Net cpm, (ROI)
C = Volume of sample liter)
G = Efficiency (cpmndpm)
Y = Abundance (% of gamma disintegrations)
Esb = Counting error of sample plus background
Eb = Counting error for background.
D - Correction for decay to the time of collection = e 2 t or-0.693 x t
e tY
where:
t = elapsed time from the time of collection to the counting Utme (in days)
tY2 = half-life
MDA (Minimum Detectable Activity) is calculated using the RISO method.
MDA 4.65X 222xCxDxGxY
where:
B = Background (cpm)
LT - Lite ime (min)
4
N Ut, I .-i -;
I ~ -
- Environmental, Inc.vMidwest Laboratoryan Aflegheny Technologies Co.
700 Landwehr Road * Northbrook. IL 6X62-2310ph. (847) 564-0700 * fax (847) 564-4517
DETERMINATION OF TRITIUM IN WATER
(DIRECT METHOD)
PROCEDURE NO. EIML-T-02
Prepared by
Environmental Inc., Midwest Laboratory
Copy No..
Revision #
.012345
Date
11-22-8509-27-9104-24-9507-07-9806-06-0001-29-02
Pages
_ 54444.4
PreDared by
.BGrobB GrobBGrob.B GrobD. Rieter.R. Amrrn/ ae
Approved by
L. G. Hiut-hnnrG. HuebnerG. Huebner
_B fbGtreb 1
VbA° i
, v M-Il I W I(This procedure, or any portion thereof, shall not be reproduced in any manner or distributed to any third partywithout the written permission of Environmental Inc., Midwest Laboratory.)

I I I
EIML-T-02 Revision 5, 01-29-02
LDETERMINATION OF TRITIUM IN WATER (DIRECT METHOD)
IiPrinciple of Method
The water sample is purified by distillation, a portion of the distillate is transferred to a counting vial and Lthe scintillation fluid added. The contents of the vial are thoroughly mixed and counted in aliquotscintillation counter.
Reaqents
Scintillation medium, Ultima-Gold LLT, Packard Instruments Co.Tritium. standard solutionDead waterEthyl alcoholSodium Hydroxide (pellets)Potassium permanganate (crystals)
Apparatus *1CondenserDistillation flask, 250-mL capacityLiquid scintillation counterPipette and disposable tips (0.1ml., 5-10 ml.)Kirnwipes
Procedure
NOTE: All glassware must be dry. Set drying oven for 100-1250C.
1. Place 60-70 mL of the sample in a 250-mL distillation flask. Add a boiling chip to the flask. Addone NaOH pellet and about 0.02g KMnO4. Connect a side arm adapter and a condenser to theoutlet of the flask. Place a receptacle at the outlet of the condenser. Set variac at 70 mark. Heatto boiling to distill. Discard the first 5-10mL of distillate. Collect next 20-25mL of distillate foranalysis. Do not distill to dryness.
2. Mark the vial caps with the sample number and date.
NOTE: Use the same type of vial for the whole batch (samples, background and standard.)
3. Mark three vial caps "BKG-1", " BKG-2", " BKG-3", and date. I4. Mark three vial caps "ST-1", " ST-2", " ST-3"; standard number, and date.
5. Dispense 13 mL of sample into marked vials and "dead" water into vials marked BKG-1, BKG-2,BKG-3.
NOTE 1: The Pipette is set (and calibrated) to deliver 6.5 mL, so pipette twice into each vial.Use new tip for each sample and new tip (one) for three background samples. 1NOTE 2: Make sure the pipette has not been reset. If it has been reset, or if you are not sure,.do not use it; check with your supervisor. l
NOTE 3: Make sure the plastic tip is pushed all the way on the pipette and is tight. If it is not,the air will be draw in and the volume withdrawn will not be correct (it will be smaller).
2 1

EIML-T-02 Revision 5, 01-29-02
6. Dispense 13 mL (see Notes 1, 2, and 3, above) of "dead" water into each vial marked "ST-1","ST-2" and "ST-3."
7. Using a 0.1 mL pipette, withdraw water from each of the three standard vials. Discard this 0.1 mLof water.
8. Take a new 0.1 mL tip. Dispense 0.1 mL of standard into each of the three vials marked "ST-I,""ST-2," and "ST-3."
9. Take all vials containing samples, background, and standard to the counting room.
NOTE: To avoid spurious counts, scintillation fluid should not be added under fluorescent light.
10. Dispense 10 mL of scintillation fluid Into each vial (one at a time), cap tightly, and shakeVIGOROUSLY for at least 30 seconds. Recheck the cap for tightness.
11. Wet a Kimwipe with alcohol and wipe off each vial in the following order:BackgroundSamplesStandard
12. Load the vials in the following order:BKG-1ST-ISamplesBKG -2* *BKG-2 and ST-2 should be approximatelyST -2* in the middle of the batchSamplesBKG-3ST -3
13. Let the vials dark- and temperature-adapt for about one hour.
NOTE 1: To check if vials have reached counter temperature, inspect one vial (Bkg). The liquidshould be transparent. If the temperature is too high (or too low), the liquid will be white and very viscous.
NOTE 2: The temperature Inside the counter should be between 10° and 14"C (checkthermometer). In this temperature range, the liquid Is transparent.
14. Set the counter for 100-minute counting time and infinite cycles. (Follow manufacturer'sprocedure for setting the counter.)
3

I I
EIML-T-02 Revision 5, 01-29-02
15. Fill out the loading sheet, being sure to indicate the date and time counting started, andyour initials.;
NOTE 1: Do not count prepared background and standard sets with another batchof samples if plastic vials are used. Prepare new backgrounds and standards for each batch.
NOTE 2: If glass vials are used, the prepared background and standard sets canbe counted with other batches up to one month after preparation, provided they are not takenout of the counter (not warmed up) and the same vial type from the same manufacturing batch(the same carton) is used. After one month prepare new sets of backgrounds and standards.
Calculations IA B 2 B
pCi/L = 22EVe-' + 2 22EVe'l
Where:
A = Total counts, sampleB = Total counts, backgroundE = Efficiency, (cpm/dpm)V = Volume (liter)e = Base of the natural logarithm =2.71828
0.693X = 12.26 = 0.5652 l
t = Counting time, samplet2 = Counting time, backgroundt3 = Elapsed time from the time of collection to the time of counting (in years)
4

-Environmental, Inc.Midwest Laboratoryan AIeghely Technologies Co.
700 Landwehr Road . Northbrook. IL 60062-2310Lph (847) 564-0700 fax (647) 564.4517
DETERMINATION OF 1-131 IN MILK
BYANION EXCHANGE(BATCH METHOD)
PROCEDURE NO. 1-131-01
Prepared by
Environmental Inc., Midwest Laboratory
Copy No.
RevisedPages Revision # Date Pages Prepared by Approved by
Reprint 5 09-24-92 5 B. Grob L. G. Huebner
(This procedure, or any portion thereof, shall not be reproduced In any manner or distributed to any third partywithout the written permission of Environmental Inc., Midwest Laboratory.)

I I
1-131-01-02 Rev. 5, 09-24-92 jDetermination of 1-131 in milk by [on Exchange
(Batch Method)
Principle of Method jjIodine, as the iodideis concentrated by adsorption on an anion resin. Following a NaCI wash, the iodine iseluted with sodium hypochlorite. Iodine in the iodate form is reduced to 12 and the elemental iodine'extracted into CHCI3, back-extracted into water, then finally precipitated as palladium iodide.
Chemical recovery of the added carrier is determined gravimetrically from the Pdl2 precipitate. 1-131 isdetermined by beta counting the Pdl2.
Reagents .
Anion Exchange Resin. Dowex 1-X8 (20-50 mesh ) chloride formChloroform, CHCI3 - reagent gradeHydrochloric Acid, HCI, 1 NHydrochloric Acid, HCI, 3NWash Solution: H20 - HNO3 - NH2OH HCL, 50 mL H20; 10 mL 1M - NH2OH-HCI;
10 mL conc. HNO3Hydroxvlamine Hydrochloride. NH2OH HCI - 1 MNitric Acid, HNO3 - concentrated
Palladium Chloride. PdCI2, 7.2 mg Pd++/mL (1.2 g PdCI2/100 mL of 6N HCI)Sodium Bisulfite. NaHS03 - 1 MSodium Chloride. NaCI - 2 MSodium Hypochlorite. NaOCI - 5% (Clorox)Potassium Iodide. KI, ca 29 mg KI/mL (See Proc. CAR-01 for preparation)
ISpecial Apparatus
Chromatographic Column, 20 mm x 150 mm (Reliance Glass Cat. #R2725T) LVacuum Filter Holder, 2.5 cm 2 filter areaFilter Paper, Whatman #42, 21 mmMylar IPolyester Gummed Tape, 1 1/2", Scotch #853Heat Lamp
I
I

1-131-01-03 Rev. 5, 09-24-92
Determination of 1-131 in milk bV Ion Exchange
(Batch Method)
Part A
Ion Exchange Procedure
1. Transfer 2 liters (if available) of sample to the beaker. Add 1.00 mL of standardized iodide carrierto each sample.
2. Add a clean magnetic stirring bar to each sample beaker. Stir each sample for 5 minutes or longeron a magnetic stirrer. Allow sample to equilibrate at least 1/2 hour. If a milk sample is curdled orlumpy, vacuum filter the sample through a Buchner funnel using a cheesecloth filter. Wash thecurd thoroughly with deionized water, collecting the washings with the filtrate. Pour the filtrate backinto the original washed and labeled 4 liter beaker and discard the curd.
3. Add approximately 45 grams of Dowex 1X8 (20-50 mesh) anion resin to each sample beaker andstir on a magnetic stirrer for at least 1 hour. Turn off the stirrer and allow the resin to settle for 10minutes.
4. Gently decant and discard the milk or water sample taking care to retain as much resin as possiblein the beaker. Add approximately 1 liter of deionized water to rinse the resin, allow to settle 2minutes, and pour off the rinse. Repeat rinsing in the case of milk-samples until all traces of milkare removed from the resin.
5. Using a deionized water wash bottle, transfer the resin to the column, marked with the samplenumber. Allow resin to settle 2 minutes and drain the standing water. Wash the resin with 100 mLof 2 M NaCI.
6. Measure 50 mL 5% sodium hypochlorite in a graduated cylinder. Add sodium hypochlorite tocolumn in 10-20 mL increments, stirring resin as needed.to eliminate gas bubbles and maintain aflow rate of 2 mL/min. Collect eluate in 250 mL beaker and discard the resin.
Part B
Iodine Extraction Procedure
CAUTION: Perform the following steps In the fume hood.
1. Acidify the eluate from Step 6 by adding ca. 15 mL of concentrated HNO3 to make the sample 2-3N in HNO3 and transfer to a 250 mL separatory funnel. (Add the acid slowly with stirring until thevigorous reaction subsides).
2. Add 50 mL of CHC13 and 10 mL of I M hydroxylamine hydrochloride (freshly prepared). Extractiodine Into organic phase (about 2 minutes equilibration). Draw off the organic phase (lower phase)into another separatory funnel.
3. Add 25 mL of CHCI3 and 5 mL of I M hydroxylamine hydrochloride to the first separatory funneland again equilibrate for 2 minutes. Combine the organic phases. Discard the aqueous phase(upper phase).
4. Add 20 mL H20-HNO3-NH2OH HCI wash solution to the separatory funnel containing the CHCI3.Equilibrate 2 minutes. Allow phases to separate and transfer CHCI3 (lower phase) to clean'separatory funnel. Discard the wash solution.
5. Add 25 mL H20 and 10 drops of I M sodium bisulfite (freshly prepared) to the separatory funnelcontaining the CHC13. Equilibrate for 2 minutes. Discard the organic phase (lower phase). Drainaqueous phase (upper phase) into a 100 mL beaker. Proceed to the Precipitation of Pdl2.

I I
1-131-01-04 Rev. 5, 09-24-92
Determination of 1-131 in milk by Ion Exchanae L(Batch Method)
PartC LPrecipitation of Palladium Iodide
CAUTION: AMMONIUM HYDROXIDE INTERFERES WITH THIS PROCEDURE L1. Add 10 mL of 3 N HCI to the aqueous phase from the iodine extraction procedure in Step 5.
2. Place the beaker on a stirrer-hot plate. Using the magnetic stirrer, boil and stir the sample until it Ievaporates to 30 mL or begins to turn yellow.
3. Turn the heat off. Remove the magnetic stirrer, rinse with deionized water.
4.. Add, dropwise, to the solution, 2.0 mL of palladium chloride.
5. Cool the sample to room temperature. Place the beaker with sample on the stainless steel tray iand put in the refrigerator overnight.
6. Weigh a clean 21 mm Whatman #42 filter which has been dried under a heat lamp.
7. Place the weighed filter in the filter holder. Filter the sample and wash the residue with water andthen with absolute alcohol. l
8. Remove filter from filter holder and place it in the labeled petri dish.
9. Dry under the lamp for 5-10 minutes. L10. Weigh the filter with the precipitate and calculate the carrier recovery.
11. Cut a 1-1/2" strip of polyester tape and lay it on a clean surface, gummed side up. Place the filter,precipitate side up, in the center of the tape.
12. Cut a 1-1/2" wide piece of mylar. Using a spatula to press it in place, put it directly over theprecipitate and seal the edges to the polyester tape. Trim to about 5 mm from the-edge of the filter Iwith scissors.
13. Mount the sample on a plastic disc and write the sample number on the back side of the disc.
14. Count the sample on a proportional beta counter. 1
I

1-131-01-05 Rev. 5, 09-24-92
Determination of 1-131 In milk by Ion Exchange
(Batch Method)
Calculations
Calculate the sample activity using computer program 1131.
1-131 concentration:
(pCiIL) = A _ _ __ _ _ _
2.2xBxCxDxR 2.22xBxCxDxR
where:
A - Net cpm, sample
B = Efficiency for counting beta 1-131 (cpm/dpm)
C = Volume of sample (liters)
D = Correction for decay to the time of collection = e- A =
( 0.693 x t 0.0862t8.04
where t = elapsed time from the time of collection to the counting time (in days)
Esb = Counting error of sample plus background
Eb = Counting error of background
R = Carrier recovery
2.22 = dpm/pCi
Reference: ODetermination of 1-131 by Beta-Gamma coincidence Counting of Pdl2". RadiologicalScience Laboratory. Division of Laboratories and Research, New York State Departmentof Health, March 1975, Revised February 1977.
" - TELEDYNEISOTOPES
NWDWE LUfORAMRY
7W LANDWU ROAD
NORTHBROOY, NLL S 6=-2310
CMS6);W FAX U)A4-M7
'DETERMNATION OF AIRBORNE I-131 IN 'CHARCOAL CARTRIDGES
BY GAMMA SPECTROSCOPY(BATCH METHOD)
PROCEDURE NO. TIML-I-131-02
Prepared by
Teledyne Isotopes Midwest Laboratory
Copy No.
RevisedPages Revision # Date . Pages Prepared by
I - A
. Approved byan ', iA
0 07-04-86 3 &t? A ? ta1.23A 1 08-01-92 4
(This .procedures,' or any portion thereof, shall not be reproduced in any, manneror distributed to any third party without the written permission- of TeledyneIsotopes Midwest Laboratory.)
I
TIML-I-131-02-01
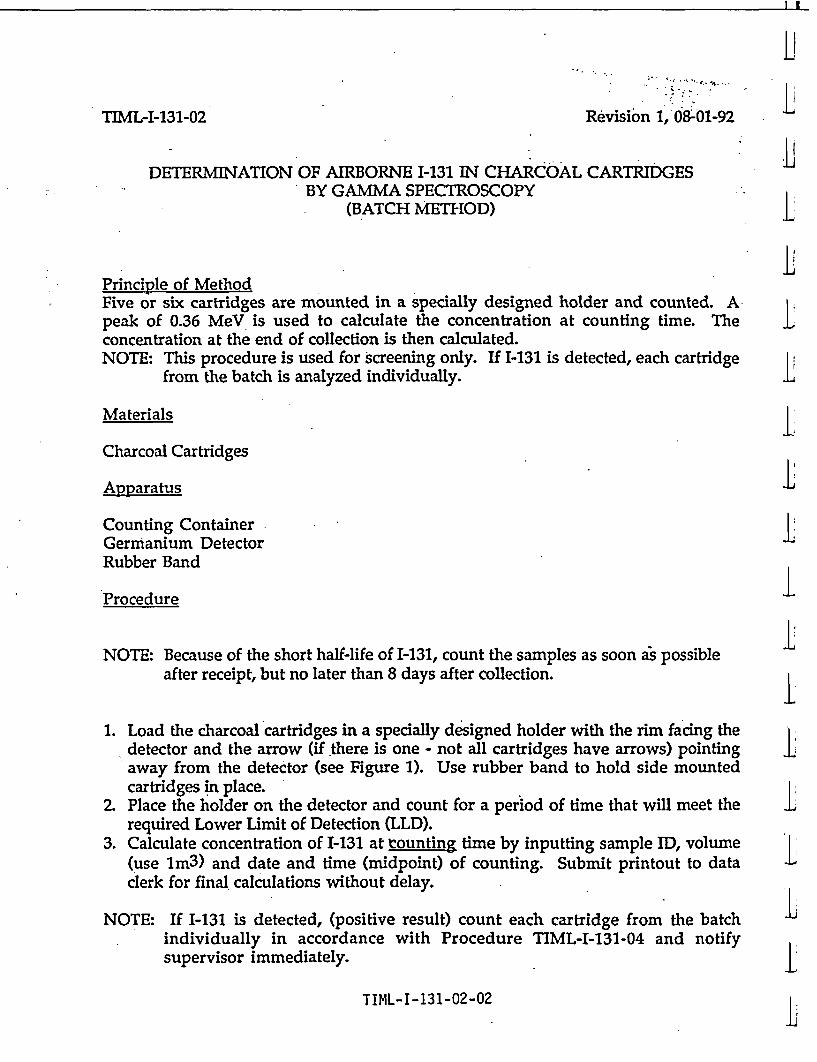
I I
L!
TIML-I-131-02 Revision 1, 08-01-92
DETERMJNATION OF AIRBORNE I-131 IN CHARCOAL CARTRIDGES -BY GAMMA SPECTROSCOPY
(BATCH METHOD)
Principle of MethodFive or six cartridges are mounted in a specially designed holder and counted. AIpeak of 0.36 MeV is used to calculate the concentration at counting time. The Lconcentration at the end of collection is then calculated.NOTE: This procedure is used for screening only. If I-131 is detected, each cartridge
from the batch is analyzed individually.
Materials LCharcoal Cartridges
Apparatus LCounting ContainerGermanium DetectorRubber Band
Procedure I
NOTE: Because of the short half-life of I-131, count the samples as soon as possibleafter receipt, but no later than 8 days after collection.
1. Load the charcoal cartridges in a specially designed holder with the rim facing thedetector and the arrow (if there is one - not all cartridges have arrows) pointingaway from the detector (see Figure 1). Use rubber band to hold side mountedcartridges in place.
2. Place the holder on the detector and count for a period of time that will meet the Irequired Lower Limit of Detection (LLD).
3. Calculate concentration of I-131 at counting time by inputting sample ID, volume(use 1m3) and date and time (midpoint) of counting. Submit printout to dataclerk for final calculations without delay.
NOTE: If I-131 is detected, (positive result) count each cartridge from the batchindividually in accordance with Procedure TIML-I-131-04 and notifysupervisor immediately.
TIML-I-131-02-02 L

1TVIL-I-131-02 Revision 1, 08-01-92
Calculations:
AL I= -131 concentration (pCi/sample) = 2.22 E (at counting time)
Where:
A = Net count rate of I-131 in the 0.36 MeV peak (cpm)
B = Efficiency for the I-131 in 0.36 MeV peak (cpm/dpm)
222 = dpm/pCi
- 1-131 concentration at the time of collection:
(pCi/m 3) C ECCxD
where:
C = Volume of sample (m3)D = Correction for decay to the time of collection = e-t =
~(0.693xt1) =
where t = elapsed time from the time of collection to the counting time (indays)
Esb Counting error of sample plus backgroundL
Eb Counting error of background
L
L
TJML-I-131-02-03

I I
IiTIML-I-131-02 Revision 1, 08-01-92
L,Figure 1.
D
iiE.
. CC
r
I
-1
LICC
1Itl -
I
Side View (5 CC's) LlI
CC-2 CC-2 I
I
CC-6 CC-3
CC-5 CC-3
I
1
ICC-46 CC's
5 CC's
Top View ICharcoal Cartridge: CCGermanium Detector: D I
TIML-I-131-02-04
1

-W-TELEDYNEISOTOPESMIDWEST LABORATORY
700 LANDWEHR ROAD
NORTHBROOK, ILLINOIS 00-2310
(312) 54-0700 FAX (312) 5844517
DETERMINATION OF SR-89:AND SR-90 IN WATER
(CLEAR OR DRINKING WATER)
PROCEDURE NO. TIML-SR-02
Prepared by
Teledyne Isotopes Midwest Laboratory
Copy No.
Revision No.
L O
I'I _ _ _ _ _ _ _ _ _ _
L
Date
03-21-86
Pages
7
Prepared by
J. Kattner
Approved by
V4 ZL
-
(This procedure, or any portion thereof, shall not be reproduced in any manneror distributed to any third party without the written permission of TeledyneIsotopes Midwest Laboratory.)
TIML-SR-02-01

I I
TIML-SR-02 Revision 0, 03-21-86 i
Determination of Sr-89 and Sr-90 in Water bPrinciple of Method !The acidified sample of clear water with stable strontium, barium, and calciumcarriers is treated with oxalic acid at a pH of 3.0 to precipitate insolubleoxalates. The oxalates are dissolved in nitric acid, and strontium nitrate isseparated from calcium as a precipitate in 70% nitric acid. The residue is ipurified by adding iron and rare earth carriers and precipitating them ashydroxides. After a second strontium nitrate precipitation from 70% nitricacid, the nitrates are dissolved in acid with added yttrium carrier and are Lstored for ingrowth of yttrium-90. The ittrium is again precipitated ashydroxide and separated from strontium with the strontium being in the super-nate. Each fraction is precipitated separately as an oxalate (yttrium) andcarbonate (strontium) and collected on No. 42 (2.4 cm) Whatman filter for -1Lcounting.
Reagents IAmmonium acetate buffer: pH 5.0Ammonium hydroxide, NH40H: concentrated (15N), 6 NAmmonium oxalate, (NH4)2C204.H20: 0.5% w/v ICarrier solutions:
Ba+2 as barium nitrate, Ba(N03)2: 20 mgBa+2 per mlCa+2 as calcium nitrate, Ca(N03)24H20: 40 mg Ca+2 per mlSr+2 as strontium nitrate, Sr(N03)2: 20 mg Sr+2 per ml Iy+3 as yttrium nitrate, Y(N03): 10 mg +3 per ml
Hydrochloric acid, HCl: concentrated (3 N)Nitric' acid, HN03: Fuming (90%), concentrated (16 N), 6 NOxalic acid, H2C202. 2H20: Saturated at room tempeFatureSicavenger solutions: 20 mg Fe+3 per ml, 10 mg each Ce+3 and Zr+4 per ml
Fe- as ferric chloride, FeCl3.hH20Ce+3 as cerous nitrate, Ce(N 3 ) 3.6H 20Zr4 as zirconyl chloride, ZrOCl2.8H20
Sodium carbonate, Na2CO3:3N, 0.1NSodium chromate, Na2CrO4:3N
Apparatus
Analytical balanceLow background beta counterpH meter
TIML-SR-02-02 L
TIML-SR-02 Revision 0, 03-21-86
Procedure
1. Measure 1 liter of acidified water into a 2 liter beaker.
NOTE: If the sample contains foreign mater, such as sand, dirt, etc.,filter through a 47 mm glass fiber filter using suction flask.
2. To acidified clear water in a 2 liter beaker, add 1 ml of strontiumcarrier solution, 1 ml barium carrier solution, and if necessary, 1 ml ofcalcium carrier solution. (Improved precipitation may be obtained byadditng calcium to soft waters.) Stir thoroughly, and while stirring add125 ml of saturated oxalic acid solution.
3. Using a pH meter, adjust the pH to 3.0 with 15N NH40H and allow theprecipitate to settle for 5 - 6 hours or overnight.
4. Decant to waste most of the supernate (liquid) and transfer the precipi-tate to a 250 ml centrifuge bottle using D.I. water. Discard the super-nate to waste.
5. Dissolve the precipitate with 10 ml of 6N HN03.and transfer to a 250 mlbeaker. Then use 20 ml of 16N HNO3 to rinse the centrifuge tube andcombine it to the solution in the 250 ml beaker.
6. Evaporate the solution to dryness.. Cool; then add 50 ml 16N HNO3 andrepeat the acid addition and evaporation until the residue is colorless.
7. Transfer the residue to a 40 ml centrifuge tube, rinsing with a minimumvolume of 16N HNO3. Cover with parafilm and cool in an ice bath.Centrifuge at 1500 - 1800 rpm for 10 minutes, and discard the supernateto waste.
8. Dissolve the precipitate in. 5 ml of 6N HN03 and then add 30 ml offuming nitric acid. Cover with parafilm, cool in. the ice bath, centri-fuge, and discard the supernate to waste.
9. Dissolve the nitrate precipitate in about 10 ml of D.I. water (performunder the hood). Add 1 ml of scavenger solution. Adjust the pH of themixture to 7 with 6N HN40H. Heat in hot water bath for 10 minutes,stir, and filter through a Whatman No. 541 filter into another 40 mlcentrifuge tube. Discard the mixed hydroxide precipitate (filter paper).
10. To the filtrate, add 5 ml of ammonium acetate buffer. Adjust the pH with3N HN03 or NH40H to pH 5.5.
NOTE: The pH of the solution at this point is critical.
Add dropwise with stirring 1 ml of 3N Na2CrO4 solution, stir, and heatin a water bath.
11. Cool and centrifuge. Decant the supernate into another 40 ml centrifugetube. (Save the precipitate for Ba analysis if needed.)
TIML-SR-02-03

I I
TIML-SR-02 Revision 0, 03-21-86 LL
Procedure J12. Heat the supernate in a water bath. Adjust the pH to 8 - 8.5 with
NH4 0H. With continuous stirring, cautiously add 5 ml of 3N Na2CO3solution. Heat gently for 10 minutes. Cool, centrifuge, and decant thesupernate to waste. Wash the precipitate' with 0.1N' Na2CO3. Centri-fuge again and decant the supernate to waste.
13. Dissolve the precipitate in no more than 4 ml of 3N HNO 3. Then add L20 - 30 ml of fuming HNO3, cover with parafilm, cool in a water bath,and centrifuge. Decant and discard the supernate. L
14. .rRepeat Step 13. Then RECORD THE TIME AND DATE AS THE BEGINNING OFYTTRIUM-90 INTROWTH.
15. Dissolve precipitate in 4 ml of 6N HN0 3 and add 1 ml of yttrium carrier Isolution.
16. .Cover with parafilm and store for 7 - 14 days.
NOTE: At this point, the sample can be transferred to a glass scintilla-tion vial for the ingrowth storage. Use :several portions of 6N I;HNO3 (a total of not more than 4 ml); then add 1 ml of yttriumLcarrier to the vial.)
LSeparation I
NOTE: If the sample was stored in the scintillation vial, transfer backinto 40 ml centrifuge tube using a few drops of 6N HN0 3 as arinse.
1. After storage (ingrowth period), heat the 40 ml centrifuge tube contain-ing the samle in the hot water bath (approximately 90-C) for 10 minutes.
2. Adjust pH to 8 with NH4 0H, stirring continuously.
3. Cool in a cold water bath and centrifuge for 5 minutes. L4. Decant the supernate into a 40 ml centrifuge tube marked with the sample
number and "SR-89."' RECORD THE DATE AND TIME OF DECANTATION AS THE ENDOF Y-90 ingrowth in SR fraction and the beginning of its decay in Y-90fraction.
5. Redissolve the precipitate by adding 3 - 4 drops of 6N HCl and add 5 - 10 1ml of D.I. water with stirring.
6. Repeat Steps 1, 2, and 3.
7. Combine supernate with the one in Step 4. LTIML-SR-02-04 1

TIML-SR-02 Revision 0, 03-21-86
Determination
A. Strontium-90 (Yttrium-90)
1. Add 3 drops of 6N HCI to dissolve the'precipitate; then add 5 - 10 mlof water. Heat In a water bath at approximately 90C. Add .1 ml ofsaturated oxalic acid' solution dropwise with vigorous stirring.Adjust to a pH of 2 - 3 with NH40H. Allow the precipitate to digestfor about an hour.
NOTE: Do Part "B" while precipitate is digesting.
2. Cool to room temperature in a cold wate bath. Centrifuge *for 10minutes and decant most of the supernate. filter by suction on aweighed 2.5 cm filter paper. Wash the precipitate with water andalcohol.
3. Dry the precipitate under the lamp for 30 minutes. Cool and weigh.Mount and count without delay in a proportional counter. (See Part Cfor mounting.)
B. Strontium-89 (Total Strontium)
1. Heat the solution from Step 7 in water bath.
2. Adjust the pH to 8 - 8.5 using NH40H.
3. With continuous stirring, add 5 ml of 3N Na2CO3 solution. Stiruntil precipitate appears. Heat gently for IO minutes.
4. Cool and filter on a weighed No. 42 (2.4 cm) Whatman filter paper.
5. Wash thoroughly with water and alcohol.
6. Mount and count without delay its beta activity as "total radio-strontium" in a proportional counter.
C. Filtering and Mounting
1. Place filters under heat lamps for 30 minutes before weighing.
2. Use Mettler balance (Serial No. 343112) for weighing.
3. Label a clean petri dish with the weight of the filter paper. (Aftersamples are filtered, the filter paper will again be dried and weighedto determine weight of precipitate before mounting.)
TIML-SR-02-05

I I
iTIML-SR-02 Revision 0, 03-21-86
iiC. Filtering and Mounting (continued)
4. Mount weighed filter paper anid precipitate on nylon disk using 1"transparent tape to hold filter paper and 2" mylar foil placed overprecipitate and held in place with slip-ring. Trim off excess mylarfoil and place the mounted sample in a labeled petri dish. LI
5. Fill out corresponding loading sheets and place samplesroom.
in counting LI1ICalculations
Part A LlStrontium-90 Concentration (pCi/liter) = A
B x C x D x E x F IWhere:
A = Net beta count rate of yttrium 90 (cpm)
B= Recovery of yttrium carrier
C = Counter efficiency for counting yttrium-90 or yttrium oxalatemounted on a 2.4 cm diameter filter paper (cpm/pCi)
D = Sample volume (liters)
E = Correction factor e-At for yttrium-90 decay, where t is the timefrom the time of cdecantation (Step 4, Separation) to the timeof counting
F. Correction factor 1-e-At for the degree of equilibrium attainedduring the yttrium-90 ingrowth period, where t is the timefrom collection of the water sample to the time of decantation(Step 4, Separation)
TIML-SR-02-06
I.IIIILIIII1I1
TIML-SR-02 Revision 0, 03-21-86
Part B
Strontium-89 Concentration (pCi/liter) = B 1 AC . IronE - F (G x H + I X J)
Where:
A = Net beta count rate of "total radiostrontium" (cpm)
B Counter efficiency for counting strontium-89 as strontium carbon-ate mounted on a 2.4 cm diameter filter paper (cpm/pCi)
C = Correction factor e-Xt for strontium-89 decay, .where t.is thetime from sample collection to the time of counting
D = Recovery of strontium carrier
E = Volume of water sample (liters)
F = Strontium-90 concentration (pCi/liter) from Part A
G = Self-absorption factor for strontium-90 as strontiummounted on a 2.4 cm diameter filter, obtained fromabsorption curve prepared by plotting the fractionactivity absorbed against density thickness of the(mg/cm2)
carbonatea self-of a standardsample
H = Counter efficiency for counting strontium-90 as strontium carbon-ate mounted on a 2.4 cm diameter filter paper (cpm/pCi)
I = Counter efficiency for counting yttrium-90 as yttrium oxalatemounted on a a2.4 cm diameter filter paper (cpm/pCi)
J = Correction factor 1-e-^t for yttrium-90 ingrowth, where it isthe time from the last decantation of the nitric acid (Step 4, -Separation)
REFERENCE: Radioassay Procedures for Environmental Samples, U. S. Departmentof Health, Education, and Welfare. Environmental Health Series,January 1967.
TIML-SR-02-07

-W01TELEDYNEISOTOPESMIDWEST LABORATORY
700 LANDWEHR ROAD
NORTHBROOK, ILUNOIS 02-2310
(312) 5640700 FAX (312)564-4517
DETERMINATION OF SR-89 AND SR-90 IN
ASHED SAMPLES (VEGETATION, FISH, ETC.)
PROCEDURE NO. TIML-SR-05
Prepared by
Teledyne Isotopes Midwest Laboratory
Copy No.
Revision No.
L 0I'I
Date
07-23-86
Pages
7
Prepared by
I/ U
Approved by
- I/
(This procedure, or any portion thereof, shall not be reproduced in any manneror distributed to any third party without the written permission of TeledyneIsotopes Midwest Laboratory.)
TIML-SR-05-O1

I I
TIML-SR-05 Revision 0, 07-23-86 1
DETERMINATION OF SR-89 AND SR-90 IN -
ASHED SAMPLES (VEGETATION, FISH, ETC.)
Principle of Method
The sample with stable strontium and barium carriers added is leached in Initric acid and filtered. After filtration, filtrate is reduced in volume byevaporation. The residue is purified by adding iron and rare earth carriersand precipitating them as hydroxides. After a second strontium nitrate iprecipitation from 70% nitric acid, the nitrates are dissolved in acid againwith added yttrium carrier and are stored for ingrowth of yttrium-90. Theyttrium-is precipitated as hydroxide and separated from strontium with thestrontium being in the supernate. Each fraction is precipitated separatelyas an oxalate (yttrium) and carbonate (strontium) and collected on No. 42(2.4 cm) Whatman filter for counting.
Reagents
Ammonium acetate buffer: pH 5.0Ammonium hydroxide, NH4OH: concentrated (15N), 6 N 2Carrier solutions: Ba+2 as barium nitrate, Ba(N03)2: 20 mgBa+2 per ml
Sr+2 as strontium nitrate, Sr(N03)2: 20 mg Sr+2 per mlY+3 as yttrium nitrate, Y(N03): 10 mg +3 per ml
Hydrochloric acid, HCl: 6 NNitric acid, HN03: Fuming (90%), concentrated (16 N), 6 NOxalic acid, H2C202. 2H20: Saturated at room temperatureScavenger solutions: 20 mg Fe+3 per ml, 10 mg each Ce+3 and Zr+4 per ml
Fe+ as ferric chloride, FeCl3.6H20Ce+3 as cerous nitrate, Ce(N03)3.6H20Zr4 as zirconyl chloride, ZrOCl2.8H20
Sodium carbonate, Na2C03:3N, 0.1NSodium chromate, Na2CrO4:3N
Apparatus -
Analytical balanceLow background beta counterpH meter -
TIML-SR-05-02

TIML-SR-05 Revision 0, 07-23-86
Procedure
1. Weigh 3 g of ash and transfer to the 250 ml beaker.
2. Add 50 ml concentrated nitric acid.
3. Add 1 ml strontium and 1 ml barium carrier solutions.
4. Place the sample on the moderate hot plate under the hood and cover withthe watch glass.
5. Allow to leach for 2 hours or longer.
6. Remove sample beaker from the hot plate and allow to cool to room tem-perature.
7. Add deionized water, filling to 100 ml; mark on the beaker.
8. Filter the sample through Whatman No. 541 filter paper.
9. Place the filtrate on the moderate hot plate under the hood and 'gentlyevaporate to 5 ml.
10. Transfer the sample into 40 ml centrifuge tube. Rinse the beaker with16N HNO3. Add rinsing to the tube.
11. Centrifuge for 10 minutes and discard the supernate to waste.
12. Carefully add 30 ml of concentrated HN03 to the precipitate. Heat in ahot water bath for about 30 minutes, stirring occassionally. Cool thesample in an ice water bath for about 5 minutes. Centrifuge and discardthe supernate.
13. Repeat Step 12.
14. Dissolve the nitrate precipitate in'about 10 ml of D.I. water (performunder the hood). Add 1 ml of scavenger solution. Adjust the pH of themixture to 7 with '6N NH40H. Heat in hot water bath for 10 minutes,stir, and filter through a Whatman No. 541 filter into another 40 mlcentrifuge tube. Discard the mixed hydroxide precipitate (filter paper).
15. To the filtrate, add 5 ml of ammonium acetate buffer. Adjust the pH with6N HN03 or NH40H to pH 5.5.
NOTE: The pH of the solution at this point is critical.
Add dropwise with stirring 1 ml of 3N Na2CrO4 solution, stir, and heatin a water bath.
16. Cool and centrifuge. Decant the supernate into another 40 ml centrifugetube. (Save the precipitate for Ba analysis if.needed.)
TIML-SR-05-03

I I
ITIML-SR-05 Revision 0, 07-23-86
I..Procedure (continued)
17. Heat the supernate in a water bath. Adjust the pH to.8 - 8.5 withNH40H. With continuous stirring, add 5 ml of 3N Na2CO3 solution. Heatgently for 10 minutes. Cool, centrifuge, and decant the supernate towaste. Wash the precipitate with O.1N Na2CO3. Centrifuge again anddecant the supernate to waste.
18. Dissolve the precipitate in no more than 4 ml of 3N HNO 3 . Then add20 - 30 ml of fuming HN0 3, cover with parafilm, cool in a water bath,and centrifuge. Decant and discard the supernate.
II±'L19. Repeat Step 13.
YTTRIUM-90 INTROWTH.Then RECORD THE TIME AND DATE AS THE BEGINNING OF
1I20. Dissolve precipitate in 4 ml of 6N HN0 3 and add 1 ml of yttrium carriersolution.
21. Cover with parafilm and store for 7 - 14 days. II9
NOTE: At this point,tion vial forHN0 3 (a totalcarrier to the
the sample can be transferred to a glass scintilla-the ingrowth storage. Use several portions of 6Nof not more than 4 ml ); then add 1 ml of yttriumvial.)
'ISeparation
NOTE: If the sample was stored in the scintillation vial, transfer backinto 40 ml centrifuge tube using a few drops of 6N HN0 3 as arinse.
1. After storage (ingrowth period), heat the 40 ml centrifuge tube -contain-ing the sample in the hot water bath (approximately 90*C) for 10 minutes.
2. Adjust pH to 8 with NH40H, stirring continuously.
3. Cool in a cold water bath and centrifuge for 5 minutes.
i
II14. Decant the supernate
number and "SR-89."OF Y-90 INGROWTH infraction.
into a 40 ml centrifuge tube marked with the sampleRECORD THE DATE AND TIME OF DECANTATION AS THE ENDSR fraction and the beginning of its decay in Y-90 I
5. Redissolve the precipitate by adding 3 - 4 drops of 6N HClml of D.I. water with stirring.
and add 5 - 10I
6. Repeat Steps 1, 2, and 3.
7. Combine supernate with the one in Step 4.
TIML-SR-05-04
-1I
I
I
TIML-SR-05 Revision 0, 07-23-86
Determination
A. Strontium-90 (Yttrium-90)
1. Add 3 drops of 6N HCl to dissolve the precipitate; then-add'5- 10 mlof water. Heat in 'a water'bath at approximately 90°C. Add 1 ml of'saturated oxalic acid solution dropwise with vigorous stirring.Adjust to a pH of 2 - 3 with NH40H. Allow the precipitate to digestfor about an hour.
-NOTE: Do Part "B" while precipitate is digesting.
2. Cool to room temperature in a cold water bath. Centrifuge- for 10minutes and decant most of the supernate. Filter by suction on aWeighed 2.5 cm filter paper. Wash the precipitate with water andalcohol.
3. Dry the precipitate under the lamp for 30 minutes. Cool and weigh.Mount and count without delay in a proportional counter. (See-Part Cfor mounting.)'
B Strontium-89 (Total Strontium)
1. Heat the solution from Step 7 in water bath.
2. Adjust the pH to 8 - 8.5 using NH40H.
3. With continuous stirring,' add 5 ml of 3N Na2C03 solution. Stiruntil precipitate appears. Heat gently forl10 minutes.
4. Cool and filter on a weighed No. 42 (2.4 cm) Whatman filter paper.
5. Wash thoroughly with water and alcohol.
6. Mount and count without delay its beta activity as "total radio-strontium" in a proportional counter.
C. Filtering and Mounting
1. Place filters under heat lamps for 30 minutes before weighing.
2. Use Mettler balance (Serial No. 343112) for weighing.
3. Label a clean petri dish with the weight of the filter paper. (Aftersamples are filtered, the filter paper will again be dried and weighedto determine weight of precipitate before mounting.)
TIML-SR-05-05

TIML-SR-05 Revision 0, 07-23-86
C. Filtering and Mounting (continued)
4. Mount weighed filter paper and precipitate on nylon disk using 1"transparent tape to hold filter paper and 2" mylar foil placed overprecipitate and held in place with.slip-ring. Trim off excess mylarfoil and place the mounted sample in a labeled petri dish.
5.-. Fill out corresponding loading sheets and place samples in countingroom.
* Calcul-ations LPartA A
Strontium-90 Concentration (pCi/g wet) =
2E2 2A 2 ESb+Eb
2.22 x B x C x D x E x F x G 2.22 x B x C x D x E x F x G
Where:
*A = Net beta count rate of yttrium 90 (cpm)
B = Recovery of yttrium carrier
C = Counter efficiency for counting yttrium-90 or yttrium oxalatemounted on a 2.4 cm diameter filter paper (cpm/dpm)
D = Sample size (grams), ash
E = Correction factor eXt for yttrium-90 decay, where t is the timefrom the time of decantation (Step 4, Separation) to the timeof counting
F = Correction factor I-e-t for the degree of equilibrium attainedduring the yttrium-90 ingrowth period, where t is the time Ifrom collection of the water sample to the time of decantation(Step 4, Separation) i
G = Ratio of wet weight to ashed weight
Esb = Counting error of sample plus background IEb = Counting error of background
TIML-SR-05-06
TIML-SR-05 Revision 0, 07-23-86
Part B
Strontium-89 Concentration (pCi/g wet) =
I A2.22 x B x LDxEx - F (G x H + I X x2.22 x B x C -Dx E x K 2.22 x
2 V E2 + E2sb b
B x Cx D xExF xK
Where:
A = Net beta count rate of "total radiostrontium" (cpm)
B = Counter efficiency for counting strontium-89 as strontium carbon-ate mounted on a 2.4 cm diameter filter paper (cpm/dpni)
C = Correction factor e-At for strontium-89 decay, where t is thetime from sample collection to the time of counting
D.= Recovery of strontium carrier
E = Sample size (grams), ash
F = Strontium-90 concentration (pCi/g wet) from Part A
G = Self-absorption factor for strontium-90 as strontium carbonatemounted on a 2.4 cm diameter filter, obtained from a self-absorption curve prepared by plotting the fraction of a standardactivity absorbed against density thickness of the sample(mg/cm2 )
H = Counter efficiency for counting strontium-90 as strontium carbon-ate mounted on a 2.4 cm diameter filter paper (cpm/ dpr)
I = Counter efficiency for counting yttrium-90 as yttrium oxalatemounted on a 2.4 cm diameter filter paper (cpm/ dpnj
J = Correction factor 1-e.-t for yttrium-90 ingrowth, where it is.the time from the last decantation of the nitric acid (Step 4,Separation)
K = Ratio of wet weight to ashed weight
REFERENCE: Radioassay Procedures for Environmental Samples, U.of Health, Education, and Welfare. EnvironmentalJanuary 1967.
S. DepartmentHealth Series,
TIML-SR-05-07

-WTELEDYNEISOTOPESMIDWEST LABORATORY X
* 700 LANDWEHR ROAD
NORTHBROOK. ILUNOIS 60062-2310
(312)54-0700 FAX (312)54.4517
DETERMINATION OF SR-89 AND SR-90 IN .
SOIL AND BOTTOM SEDIMENTS
PROCEDURE NO. TIML-SR-06
Prepared by -
Teledyne Isotopes Midwest Laboratory
Copy No.
Revision No.
i.
Date
07-23-86
Pages
9
Prepared by
:''± zza&Approved by
- A_
_ .
(This procedure, or any portion thereof, shall not be reproduced in any manneror distributed to any third party without the written permission of TeledyneIsotopes Midwest Laboratory.)
TIML-SR-06-01
I I
TIML'-SR-06. Revision 0, 07-23-86 1
IDETERMINATION OF SR-89 AND SR-90 IN
SOIL AND BOTTOM SEDIMENTS
±J.Principle of Method
The sample with stable strontium and barium carriers added is. leached inhydrochloric acid. After separation from calcium., the residue is purified byadding- iron and rare earth carriers and precipitating them as hydroxides.After a second strontium nitrate precipitation from 70% nitric acid, the'nitrates are dissolved in acid 'again with added yttrium carrier and are storedfor ingrowth of yttrium-90. The yttrium, is precipitated as hydroxide andseparated from.strontium with the strontium being in the supernate. Eachfraction is precipitated separately as an oxalate (yttrium) and carbonate(strontium) and collected on No. 42 (2.4 cm) Whatman filter for counting.
Reagents
L.1
IAmmonium acetate buffer: pH 5.0Ammonium hydroxide, NH4OH: concentrated (15N), 6N
Carrier solutions: Ba+2 as barium nitrate, Ba(N03)2:Sr+2 as strontium nitrate, Sr(N03)2: 20 mg Sr+2
y+3 as yttrium nitrate, Y(N03): 10 mg +3 per ml
I20 mgBa+2 per ml
per ml IHydrochloric acid, HCl: 6 NNitric acid, HN0 3: Fuming (90%), concentrated (16N), 6N, 1:1
Oxalic acid, H2C202. 2H20: Saturated at room temperatureScavenger solutions: 20 mg Fe+3 per ml, 10 mg each Ce+3 and Zr+4 per ml
Fe+ as ferric chloride, FeCl3.6H20
Ce+3 as cerous nitrate, Ce(N03)3.6H20Zr4 as zirconyl chloride, ZrOCl2.8H20
Sodium carbonate, Na2CO3:3N, 0.1NSodium chromate, Na2CrO4:3N
Apparatus.
Analytical balanceCentrifugeHot plateLow background beta counterpH meterPlastic disc and ringStirrer
I
II.II
III
TIML-SR-06-02
1

TIML-SR-06 Revision 0, 07-23-86
Procedure.
1. Weigh out a 100 g sample into'a 1 liter beaker. Add 1 ml'of strontiumcarrier and 1 ml of Ba carrier.'
2. Stir mechanically while slowly adding 200 ml of 6N HCl. (It may be.necessary to.add a few drops of octyl alcohol to prevent excessivefrothing.) Continue stirring for about 30 minutes. Allow a minimum oftwo hours for the insoluble'material to settle.
3. Stir the mixture and filter with suction through a 24 cm Whatman No. 42filter paper using a Buchner funnel. Wash the residue with hot water.Wash with 6N HCl and again' with hot water until the yellow color offerric chlorlde is removed.' Discard the residue.
4. "Transfer the filtrate to a I-liter beaker and evaporate to approximately200 ml. Cool and slowly add 200 ml of concentrated HNO3. (If there isexcessive frothing, add a few drops of octyl alcohol.) Evaporate to100-200 ml.
5. Add 500 ml of water and stir.
6. Add 25 grams of oxalic acid with magnetic stirring until it is completelydissolved.
7. Adjust the pH to 5.5 - 6.0 with concentrated NH40H. (If the brown colorof ferric hydroxide persists, 'add more oxalic acid and readjust the pH.).The optimum condition is an excess of oxalic acid in solution without.causing crystallization of ammonium oxalate upon cooling.
8. Allow, precipitate to settle for 5 - 6 hours or overnight.
9. Decant most of the supernate (liquid) and transfer the precipitate to. a250 ml centrifuge tube using deionized water for rinsing. Add rinsing tothe tube. Centrifuge and decant supernate.
10. Wash the precipitate with 50 - 100 ml portion of water and centrifugeagain.
11. Repeat washing as needed. until all the yellow color of the solution hasbeen removed.'
12. Cool the precipitate and dissolve it with 6N HN03 and transfer it in a250 ml beaker. Rinse the tube with 6N HNt3, making the total volumeto 50 - 100 ml. Add about 6'drops of H202 (30%) to facilitatedissolution.
13. 'Cool to room temperature. If insoluble material is present at thispoint, filter by suction thro'ugh a glass fiber filter. Discard thefilter and residue.
TIML-SR-06-03

IX
TIML-SR-06 Revision 0, 07-23-86
Procedure (continued)
14. Transfer the solution to an appropriate size beaker and -evaporate-todryness. The evaporation must be done slowly to avoid spattering..
15. Dissolve the salt, in water and perform successive fuming nitric acidseparations (the first two separations at concentration slightly greaterthan 75%) until the strontium has been separated from the bulk-of thecalcium. Samples with a high calcium content will require five or more iseparations.
16. The volumes of 75% HN03 vary (fuming solutions may be changed as required Lby the mass of calcium present, keeping.in mind that minimum volumes arealways best).
17. If calcium content. is still thick, evaporate the solution to dryness and ibake.
18. Dissolve the residue with 50 ml boiling water and filter. Discardresidue.
19. Evaporate the solution to dryness again.
20. Cool and dissolve the residue in a minimum amount of water and add 50 mlof-fuming HNO3.
21. Continue the fuming nitric acid separations until the strontium has beenseparated from the bulk of calcium.
22. Transfer the solution to a 40 ml conical, heavy-duty centrifuge tube,using a minimum of concentrated HN03 to effect the transfer. Cool thecentrifuge tube in an ice bath for about 10 minutes. Centrifuge anddiscard the supernatant.
NOTE: The precipitate consists of calcium, strontium, and barium-radiumnitrate.
The supernatant contains part of the sample's calcium and phas-phate content. i
23. Add 30 ml of concentrated HN03 to the precipitate. Heat in a hot waterbath with stirring for about 10 minutes. Cool the solution in an ice Ibath, stirring for about 5 minutes. Centrifuge and discard the super-natant.
NOTE: Additional calcium is removed from the sample.
Nitrate precipitations with 70% HN03 will afford a partialdecontamination from soluble calcium, while strontium, barium, and Lradium are completely precipitated..
TIML-SR-06-04
I

TIML-SR-06 Revision 0, 07-23-86
Procedure (continued)
23. NOTE: (continued).
The separation of calcium is best at 60% HNN03; however, at :60%the precipitation of strontium is not complete. Therefore, it iscommon practice to precipitate Sr(No3)2 with 70% HNO3, which is the-concentration of commercially available .16N HN03.
Most of the other fission products, induced acitivities, andactinides are soluble in concentrated HN03, affording a good"gross" decontamination step from a wide spectrum of radio-nuclides. The precipitation is usually repeated several times.
24. Repeat Step 23 two (2) more times;
*25. Dissolve the nitrate precipitate'in about 20 ml distilled water. Add1 ml of scavenger solution. 'Adjust the pH of the mixture to 7 with6N NH40H. Heat, stir, and filter through a Whatman No. 541 filter.D0scard the mixed hydroxide precipitate.
26. To the filtrate, add 5 ml of'ammonium acetate buffer. Adjust the pH with6 N HN03 or NH40H to pH 5.5.
.NOTE: The pH of the solution at this point is critical.
Add dropwise with stirring 1 ml of 3N Na2CrO4 solution, stir, andheat in a water bath.
27. Cool and centrifuge. Decant the supernate into 'another 40 ml centrifugetube. (Save the precipitate for barium analysis if needed.)
28. Heat the supernate in a water bath. Adjust the pH to 8 -. 85 withNH40H. With continuous stirring,'-add 5 ml of 3N Na2CO3 solution. Heatgently for 10 minutes. Cool, centrifuge, and-decant the supernate towaste. Wash the precipitate with 0.1N Na2CO3. Centrifuge again anddecant the supernate to waste..
29. Dissolve the precipitate in no more than 4 ml of 3N HNO3. Then add-'20 - 30 ml of fuming HNO3, cover with parafilm, cool-in a-water bath,and centrifuge. Decant and discard the supernate.
30. Repeat Step 13. Then RECORD THE TIME AND DATE AS THE BEGINNING-OFYTTRIUM-90 INTROWTH.
31. Dissolve precipitate in 4 ml of 6N HN03 and add 1 ml of yttrium carriersolution.
TIML-SR-06-05
II
ITIML-SR-06 Revision 0, 07-23-86
1Procedure (continued)
32. Cover with parafilm and store for 7 - 14 days.
NOTE: At this point, the sample can be transferred to a glass scintilla-tion vial for the ingrowth storage. Use several portions of 6NHN03 (a total of not more than 4 ml); then add 1 ml of yttriuimcarrier tothe vial.)'
Separation
NOTE: If the sample was stored in the scintillation, vial, transfer backinto 40 ml centrifuge tube using a few drops of 6N HNO.3 as arinse.
IL1I1!
1. After storage (ingrowth period)ing the sample in the hot water
, heat the 40 ml centrifuge tube contain-bath (approximately 90'C) for 10 minutes. I
2. Adjust pH to 8 with concentrated NH40H, stirring continuously.
3. Cool in a cold water bath and centrifuge for- 5 minutes.
4. Decant the supernatenumber and "SR-89."OF Y-90 INGROWTH infraction.
into a 40 ml centrifuge tube marked with the sampleRECORD THE. DATE AND TIME OF DECANTATION. AS THE ENDSR.fraction and the beginning of its decay in Y-90
I1
5. Redissolve the precipitate by adding 3 - 4 drops of 6N HClml of D.I. water with stirring.
6. Repeat Steps 1, 2, and 3.
7. Combine supernate with the one in Step 4.
and add 5 - 10 ' I
I11I
Determination'
A. Strontium-90 (Yttrium-90)
1. Add 3 drops, of 6N HCl to dissolve the precipitate; then add .5 - 10 mlof water. Heat In a water bath at approximately 90"C. Add 1 ml of.saturated oxalic acid solution dropwise with vigorous stirring.Adjust to a pH of 2 - 3 with concentrated NH40H. Allow the precipi-tate to digest for about an hour.
NOTE: Do Part "B" while precipitate is digesting.
I1I'II
TIML-SR-06-06
I

TIML-SR-06 Revision 0, 07-23-86
Determination (continued)
A. Strontium-90 (Yttrium-90) (continued).
.2. Cool to room temperature in a'cold water bath. Centrifuge for 10minutes and decant most of the. supernate. Filter by suction on a.-weighed 2.5 cm filter paper. Wash the precipitate with water and:alcohi6l.
3. Dry the precipitate under the lamp'for 30 minutes. Cool and weigh-,Mount and count without delay in a proportional counter. (See Part Cfor mounting.)
B. Strontium-89 (Total Strontium)
1. Heat the solution from Step]7 in water bath.
2. Adjust the pH.to 8 - 8.5 using concentrated NH40H.
3. With continuous stirring, add 5 ml of 3N Na2C03 solution. Stiruntil precipitate appears. Heat gently for 10 minutes.-
4. Cool and filter on a weighed No. 42 (2.4 cm) Whatman filter paper.
5. Wash thoroughly with water and alcohol.
6. Mount and count without delay its beta activity as "total radio-strontium" in a proportional counter.
C. Filtering and Mounting
1. Place filters'under heat lamps for 30 minutes before weighing.
2. Use Mettler balance (Serial No. 343112) for weighing.
3. Label a clean petri dish with the weight of .the filter paper. (After.,samples are filtered, the filter paper will again be dried .and weighed.to determine weight of precipitate before mounting.')
4. Mount weighed filter paper and precipitate on nylon disk using 1"transparent tape to hold filter paper and 2" mylar foil placed. overprecipitate and held in place with slip-ring. Trim off excess mylarfoil and place the mounted sample in a labeled petri dish.'
5. Fill out corresponding loading sheets and place samples in countingroom.
TIML-SR-06-07 '

I I
LTIML-SR-06 -
Calculations
Part A
Strontium-90 Concentration (pCi/g dry) =
Revision 0, 07-23-86
*i
II
.A
2.22 x B x C x D x E x F
±
22-2 V Esb + Eb
2.22 x-B xxC x D x E x-F iLWhere:
A = Net beta count rate of yttrium 90 (cpm)I1
B = Recovery of yttrium carrier
C = Counter efficiency for counting yttrium-90 or yttrium oxalatemounted on a 2.4 cm diameter filter paper (cpm/dom)
D = Sample weight (grams), dry
E = Correction factor e-Xt for yttrium-90 decay, where t is the timefrom the time of decantation (Step 4, Separation). to the timeof counting
F = Correction factor 1-e-t for the degree of equilibrium attainedduring the yttrium-90 ingrowth period, where t is the timefrom collection of the water sample to the time of decantation(Step 4, Separation)
Esb = Counting error of sample plus background
Eb = Counting error of background
TIML-SR-04-08
I.i
II1111II
II

.TIML-SR'06. Revision 0, 07-23-86`'..
Part*.B -
Strontium-89 Concentration (pCi/g dry)-=-
I
2.22 x B x Cx A 2+L -F (G.x H +1D EI
2 VfESb + Ed '
2.22 x B'x'C x D x'E x.F
Where:
A = Net beta count rate of "total radiostrontium" (cpR')
B = Counter efficiency for counting strontium-89 as strontium carbon-ate mounted on a 2.4 cm diameter filter-paper (cpm/dpr.).
C = Correction factor e-it' for strontium-89 decay, where t is thetime from sample collection to the time of counting
D = Recovery of strontium carrier
E = Sample weight (grams), dry
F-= Strontium-90 concentration (pCi/g dry) from Part A
G = Self-absorption factor for strontium-90 as strontium carbonatemounted on a 2.4 cm diameter filter, obtained from a self-absorption curve prepared by plotting the fraction of a standardactivity absorbed against density thickness of the. sample(mg/cm 2 )
H = Counter efficiency for counting strontium-90 as strontium carbon-ate mounted on a 2.4 cm diameter filter paper (cpm/dpm)
I = Counter efficiency for counting yttrium-90 as yttrium oxalatemounted on a 2.4 cm diameter filter paper (cpm/dpm)
J = Correction factor 1-e-t for yttrium-90 ingrowth, .where: it 'is'the time from the last decantation of the nitric acid (Step .4, :Separation).
REFERENCE: Radioassay Procedures for Environmental Samples, U. S. Departmentof Health, Education, and Welfare. Environmental Health Series,January 1967.
TIML-SR-04-09

-Em TELEDYNEBROWN D4GCEERINCENVIRON'MENTALSERVICES
. C j MIDWST ABORATORY
7'"LANDWE.R2AD
NORTBROOKWNYS 60062-2310
W) S64-C *VA FAX 7) S644S57
DETERMINATION OF SR-89 AND SR-90 IN MILK
(ION EXCHANGE BATCH METHOD)
PROCEDURE NO. TIML-SR-07
Prepared byTeledyne Isotopes Midwest Laboratory
Copy No.
Revision #
01234
Date Pages repared by
06-15-8811-20-9006-12-9212-07-9308-18-94
910101010
-I
AMA
Approved by
s1e R o8z'?,, .A~~c~f
W, Z-e a t
(This procedure, or any portion thereof, shall not be rep. dcud in any manner or distributed toany third party without the written permission of Teledyne Isotopes Midwest Laboratory.)
TIML-SR-07-01

I I
TIML-SR-07 Revision 3,12-07-93 LDETERMINATION OF SR-89 AND SR-90 IN MILK (ION EXCHANGE BATCH METHOD) I
Principle of Method
A citrate complex of strontium carrier at the pH of milk is added to the milk sample. Strontium,barium, and calcium are absorbed on the cation-exchange resin.
Strontium, barium, and calcium are eluted from the cation-exchange resin with sodium chloridesolution. Following dilution of the eluate, the alkaline earths are precipitated as carbonates.The carbonates are then converted to nitrates. Strontium is purified by Argonne method I(modified at Teledyne Isotopes Laboratory in Westwood, NJ, and TIML) using three grams ofextraction material in a chromatographic column. Yttrium carrier is added and a sample isstored for ingrowth of yttrium-90. The yttrium is again precipitated as hydroxide and separated 3from: strontium with the strontium being in the supernate. Each fraction is precipitated .separately as an oxalate (yttrium) and carbonate (strontium) and collected on No. 42 (2.4 cm)Whatman filter for counting. LThe concentration of Sr-89 is calculated as the difference between the activity for "totalradiostrontium" and the activity due to Sr-90.
Reagents
Ammonium hydroxide NH40H: concentrated (151) 1Carrier solutions:
Sr+2 as strontium nitrate, Sr(NO3)2: 20mg Sr+2 per mLas yttrium nitrate, Y(NO3)3: 10 mg Y+3 per mL i
Cation-exchange resin: Dowex 5OW-X8 (Na+ form, 50-100 mesh)Citrate solution: pH 6.5DI waterEthyl alcohol, C2H5OH: 95%Hydrochloric acid HCI: 6NNitric acid HNO3: 3N - IOxalic acid H2C202-2H20: 2NSodium carbonate Na2CO3: 3NSodium chloride, NaCI: 4NSilvernitrateAgNO3: 1NStrontium Spec Resin -1
I
TIML-SR-07-2 .

TIML-SR-07. Revision 3,12-07-93
Apparatus
Ion-exchange system: The apparatus for this system is illustrated in Figure Sr-07-1. At the topis a 1-liter glass separatory funnel which serves as the reservoir. Below it is connected a 250 mLglass column, 5 cm in diameter and 25 cm long, which services as the cation column. Columnhas extra coarse, fritted glass disc at the bottom.
Millipore filtering apparatus (Pyrex Hydrosol Microanalysis Filter Holder)
Chromatographic Column l3
Preparation and regeneration of cation resin:
1. Wash 170 mL of Dowex 50W resin to fill the cation column.
2. Pass 500 mL of 1N NaOH through the column at a flow rate of 10 mL/minute.
3. Rinse with 500-1000 mL of H20.
4. Test effluent with AgNO3. If effluent is clear, the resin is ready for milk.
TIML-SR-07-3

I I
LTIML-SR-07 Revision 3,12-07-93
I
II.
RESERVOIR
I, .9 tt AA I l'O $tCY nMLAILI1 I
11,1
CATION RESIN LI/2t5o-Ia LAS COLVWI\JTH natTE #LA"ISK
1
II
II
Figure SR-07-01
I
I
I
TIML-SR-07-4 i

TIML-SR-07 Revision 3,12-07-93
Part A
Total Radiostrontium (Sr-89. -90 Separation)
Procedure
1. Place 1 liter of milk in 4 liter beaker.
2. Pipette 1.0 mL of strontium carrier solution into 10 mL of citrate solution. Swirl to mix. 13
3. Transfer the mixture quantitatively to the milk with 5 mL of DI water.
4. Add a clean magnetic stirring bar to each sample beaker. Stir each sample for 5 minutes or-longer on a magnetic stirrer. Allow sample to equilibrate at least 1/2 hour. If a milksample Is curdled or lumpy, vacuum filter the sample through a Buchner.funnel using acheesecloth filter. 'Wash the curd-thoroughly with deionized.water, collecting thewashings with the filtrate. Pour the filtrate back into the original washed and labeled 4-liter beaker and discard the curd.
5. Add approximately 170 mL of Dowex 50Wx8 (50-100 mesh) cation resin to each samplebeaker and stir on a magnetic stirrer for 2 hours. Turn off the stirrer and allow the resin tosettle for 10 minutes. "3
6. Gently decant and discard the milk sample, taking care-to retain as-much resin as possiblein the beaker. Add approximately 1 liter of deionized water to rinse the resin, allow tosettle 2 minutes, and pour-off the rinse.' Repeat rinsing until all traces of milk are removedfrom the resin.
7. Using a DI water wash bottle, transfer the resin to the column:marked with the samplenumber. Allow resin to settle 2 minutes and drain the standing water.
8. Connect l-liter separatory funnel containing l liter of 4N NaCl to the cation column.Allow the solution to flow at 10 mL/minute to elute the alkali metal and alkaline earthions and to recharge the column. Collect 1 liter of eluate into a 2-liter beaker, but leave theresin covered with 2-3 mL of solution.
9. Wash the column with 500 mL of H20 or more to remove excess NaCl. Discard the wash.
10. Remove 20 mL of the NaCl eluate into a small bottle for the determination of stablecalcium, if required (see procedure on calcium determination).
11. Dilute the eluate to 1500 mL with DI water. 13
12. Heat the solution to 85-901C (near boilin g'on a hot plate) and add, with constant stirring,100 mL of 3N Na2CO3. Cover with watch glass. Let stand overnight.
13. Decant most of the supernate to waste. Transfer the'precipitate to a 250 mL centrifugebottle with DI water.
14. Centrifuge. Pour off the supernate to waste. Dry the precipitate in an oven at 1001C for 1-2 hours. 3Cool.
15. Dissolve the precipitate in 30 mL 3M HNO3.
TIML-SR-07-5
TIML-SR-07 Revision 3,12-07-93
16. Place each sample centrifuge tube in front of a SR extraction column. Write sample'numbers on gummed labels and attach to the corresponding columns. i
17. Condition columns by passing 30 mL 3M HNO3 through them with the stopcocks fullyopen. Catch effluent in a waste beaker.
18. Add sample from the beaker into the correspondingly numbered column. L
NOTE: Use no water to make this transfer. Use only 3M HNO3 to rinse out the beaker. 11Allow the sample to pass through the column. Catch effluent in a waste beaker.
19. When the column reservoir is drained, measure 70 mL 3M HNO3 in a graduated cylinder Land pass through the column to rinse. Catch effluent in a waste beaker. When the columnis drained, RECORD THE DATE AND TIME ON THE WORK SHEET AS THEBEGINNING OF Y-90 INGROWTH. l
20. Write the sample number on a clean 150 mL beaker. Place it under the column after therinse solution has drained. Discard the contents of the waste beaker. I
21. Elute strontium by adding 70 mL DI water to the column. Catch effluent in the 150 mLbeaker.
322. When the elution is complete, add 1.00 mL standardized yttrium carrier to the numbered
sample beaker using an Eppendorf pipet.
23. Place sample beaker on a moderate hotplate and evaporate gently to approximately 10 m'Lvolume. Remove beaker from hotplate and allow to cool.
NOTE: If the sample accidentally evaporates to dryness, allow it to cool, then add a fewdrops HNO3 and approximately 10 mL DI water. Warm gently and swirl todissolve residue.
24. Mark the sample number on a 40 mL centrifuge tube. Transfer the sample-using theminimum amount of DI water.
25. Seal the sample tube with parafilm and place in a rack to stand for a minimum 5-dayperiod for Y-90 ingrowth.
26. Rinse the SR extraction columns with an additional 70 mL DI water. Catch effluent in a lwaste beaker. Leave the columns wet with DI water, with the stopcocks closed.
27. Enter column number, date, and sample number in the SR Column Log. I
TIML-SR-07-6

TIML-SR-07 Revision 4,08-18-94
Separation
1. After storage (ingrowth period), heat the 4OmL centrifuge tube containing the sample inthe hot waterbath (approximately 900C) for 10 minutes.
2. Adjust pH to 8.0-8.5 with NH40H, stirring continuously.
3. Cool in a cold water bath and centrifuge for 5 minutes.
4. Decant the supernate into a 4OmL centrifuge tube marked with the sample number and"SR-89." RECORD THE DATE AND TIME OF DECANTATION AS THE END OF Y-90INGROWTH IN SR FRACTION AND THE BEGINNING OF ITS DECAY IN Y-90FRACTION.
5. Redissolve the precipitate by adding 3-4 drops of 6N HCO and add 5-10 mL of DI waterwith stirring.
6. Repeat Steps 1, 2, and 3.
7. Combine supernate with the one in Step 4.
8. Wash the precipitate twice with 2OmL portions of DI-Water. Centrifuge each time anddiscard supernate. 4
9. Proceed with determination.
TIML-SR-07-7

I I
TIML-SR-07 Revision 3,12-07-93 I
Determination
A. Strontiumz9O (Yttrium-90) i1. Add 3 drops of 6N HCl to dissolve the precipitate from Step 4, Separation; then add 5-10
mL of DI water. Heat in a water bath at approximately 90'C for about 10 minutes. Add I1 ml of saturated oxalic acid solution dropwise with vigorous stirring. Adjust to a pH. of.2-3 with NH40H. Allow the precipitate to digest for approximately one hour. 3
NOTE: Do Part "B" while precipitate is digesting.'
2. Cool to room temperature inma cold water bath. Centrifuge for 10 minutes and decantmost of the supemate to waste. Filter by suction on a weighed 2.5 cm filter paper. Wash Lthe precipitate with water and alcohol. 3
3. Dry the precipitate under the lamp for 30 minutes. Cool and weigh. Mount and count in aproportional counter. (See Part C for mounting.) l
B. Strontium-89 (Total Strontium) l
1. Heat the solution from Step 7, Separation, in water bath.
2. Adjust the pH to 8-8.5 using NH40H. I3. With continuous stirring, add 5 mL of 3N Na2CO3 solution. Stir until precipitate appears.
Heat gently for 10 minutes.
4. Cool and filter on a weighed No. 42 (2.4 cm) Whatman filter paper. L5. Wash precipitate with water and alcohol. l3
6. Dry the precipitate under the lamp for 30 minutes. Cool and weigh. Mount and count in aproportional counter. (See Part C for mounting.)
C. Filtering and Mounting I1. Place filters under heat lamps for 30 minutes before weighing.
2. Use Mettler balance (Serial No. 343112) for weighing.
3. Label a clean petri dish with the weight of the filter paper. (After samples are filtered, thefilter paper will again be dried and weighed to determine weight of precipitate beforemounting.)
4. Mount weighed filter paper and precipitate on nylon disc using 1" transparent tape to Lhold filter paper and 2" mylar foil placed over precipitate and held in place with slip-ring.Trim off excess mylar foil and place the mounted sample in a labeled petri dish.
5. Fill out corresponding loading sheets and place samples in counting room.
TIML-SR-07-8 1

TIML-SR-07 Revision 4, 08-18-94
Calculations
Part A
Strontium-90 Concentration (pCi/L) = A2.22xBxCxDxExFxG
Where:
2.22 = dpm/pCi
A = Net beta count rate of yttrium-90 (cpm)
B = Recovery of yttrium carrier
C = Recovery of strontium carrier
D = Counter efficiency for counting yttrium-90 as yttrium oxalate mounted on a2.4 cm diameter filter paper (cpm/dpm) . 4
E = Sample volume (iters)
F = Correction factor edt for yttrium-90 decay,.where t is the time from the timeof decantation (Step 4, Separation) to the time of counting
G = .Correction factor l-e-t for the degree of equilibrium attained during theyttrium-90 ingrowth period, where t is the time-from the beginning ofingrowth (Step 19, Total Radiostrontium Separation) to the time of l 4decantation (Step 4, Separation)
Lower Limit of Detection (LLD). at 4.66 sigma
LLD for Sr-90: 1 pCi/L. LLD is based on the following typical parameters:Sample Size: 1 LRecovery (Sr and Y): 0.6Decay Factor (Y-90): 0.8Ingrowth Factor (Y-90): 0.6Counter Efficiency: 0.4Counter Background: 03cpT 14Counting Time: 100 minutes-
(Changes in any of the above parameters will change LLD correspondingly.).
TIML-SR-07-9
I I
LTIML-SR-07 Revision 4,08-18-94
LPart B
Strontium-89 Concentration (pCi/L)Q = 1 [ _A 22 x FG+HxI ]
Where: I2.22 = dpm/pCi
A = Net beta count rate of "total radiostrontium" (cpm) IIB = Counter efficiency for counting strontium-89 as strontium
mounted on a 2.4 cm diameter filter paper (cpm/dprm)
C = Correction factor elt for strontium-89 decay, where t is thesample collection to the time of counting
carbonate
time from
14 LI
D = Recovery of strontium carrier
E = Sample volume (liters)
F = Strontium-90 concentration (pCi/liter) from Part A
1
G = Counter efficiency for counting strontium-90 as strontium carbonatemounted on a 2.4 cm diameter filter paper (cpm/dpm)
H = Counter efficiency for counting yttrium-90 as yttrium oxalate mounted on a2.4 cm diameter filter paper (cpm/dpm)
I 14
I
14
II = Correction factor 1-e-t for yttrium-90 ingrowth, where t is the time from thelast decantation of the nitric acid (Step 4, Separation) to the time of counting
ILower Limit of Detection (LLD). at 4.66 sigma
LLD for Sr-89: 2.0 pCi/L. LLD is based on the following typical parameters:Sample Size:. 1 LRecovery: 0.7Decay Factor 0.5Counter Efficiency: 0.3Counter Background: 0.3 cpmCounting Time: 100 minutesLLD for Sr-90: 1 pCi/L
(Changes in any of the above parameters will change LLD correspondingly.)
I
14 II
REFERENCES: Radioassay Procedures for Environmental Samples U. S. Department ofHealth, Education, and Welfare. Environmental Health Series, January 1967. I,Horwitz, Dietz, Fisher, Analytical Chemistry. 63 (5), March 1991.
TIML-SR-07-10
II

-R"TELEDYNEISOTOPESMIDWEST LABORATORY
700 LANDWEHR ROAD
NORTHBROOK, ILLINOIS 60062.2310
(312) 5840700 FAX (312) 564.4517
PROCEDURE FOR COMPOSITING
WATER AND MILK SAMPLES
PROCEDURE NO. TIML-COMP-01
Prepared by
Teledyne Isotopes *lidwest Laboratory
Copy No._
RevisedPages
i
i
L_
RevisionNo.
0 0
Date
11-07-88
Pages
2
* Prepared by
LV.FApproved by
P& 4a et-
(This procedure, or any portion.thereof, shall not be reproduced in any manner* or distributed to any *third party without the written permission of Teledyne
Isotopes Midwest Laboratory.)
TIML-COMP-01

I a
l'
L*TIML-COMP-01
Procedure for Compositing Water and Milk Samples
1. At the beginning of each composite period, (month, quarter, semi-annual),prepare a one-gallon cubitainer for a-specific location and time-period.
2. Remove an equal aliquot of original sample (for example, one liter) andtransfer to prepared cubitainer. Do this for each week, month, etc.Mark date of original sample on prepared cubitainer.
3. When prepared container is complete, give the sample to the recordingclerk for assigning a number.
4. Analyze according to the client requirement.
TIML-COMP-02
,. tLL
.II1IL'I'IIIIIIIII

Icopy000T0 jtt
-Id-TELEDYNE.ISOTOPES
MIDWEST LABORATORY
700 LANDWEHR ROAD
NORTHBROOK. ILLINOIS 60062-2310
(312) 68-0700 FAX (312) 584-4517
DETERMINATION OF STABLE CALCIUM I1 MILK
PROCEDURE NO. TIML-CA-O1
Prepared by
Teledyne Isotopes Midwest Laboratory
Copy No. -
- Revision No.
,. 0L
Date
-07-08-88
Pages Pr
4
le~pared by Approved by
� A
(This procedure, or any portion thereof, shall not be reproduced in any manneror distributed to any third party without the written permission of TeledyneIsotopes Midwest Laboratory.)
TIIL-CA-O1-01

I I
flRevision o, 07-08-88
TItIL-CA-01
Determination of Stable Calcium in Milk IiPrinciple of Method
Strontium, barium, and calcium are absorbed on the cation-exchange resin, theneluted with sodium chloride solution. An aliquot of the eluate is diluted toreduce the high sodium ion concentration. From this diluted aliquot, calciumoxalate is precipitated, dissolved in dilute hydrochloric acid, and the.oxalate is titrated with standardized potassium permaganate. blReagents
Ammonium hydroxide, NH40H: 611Ammonium oxalate, (iIH4)2C204.H20: 0.03NCarrier solutions:
Ba+2 as barium nitrate, Ba(N03)2: 20Sr+2 as strontium nitrate, Sr NO3)2:
Cation-exchange resin: Dowex 50W-X8 (Na+Citrate solution: 3N (pH 6.5)Hydrochloric acid, HCl: 6NOxalic acid, H2C204.2H2:. INPotassium permanganate, KtInO4: 0.05N staiSodium chloride, NaCI: 4NSodium oxalate, Ua2C204:
LimgBa+2 per ml20 mg Sr+2 per mlform, 50-100 mesh)
II1
idardized LIApparatus
Burette IProcedure
1. Follow the TIMIL-SR-01 or SR-07 procedures, Steps 1-10.
2. Into a 40 ml glass centrifuge tube, pipette 10 ml aliquot of the initialeluate collected in Step 10.
3. Dilute the 10 ml aliquot to approximately 20 ml with D.I. water.
4. Heat in a hot water bath. Add 5 ml of 1N oxalic acid, and stir. Whilehot, adjust to pH 3 with 6N N1H40H (use a pH meter) to precipitatecalcium oxalate. Cool slowly to room temperature, centrifuge, and dis-card the supernate.
TI ML-CA-01-02
IIIIIII

Revision 0, 07-08-88
TIML-CA-01
Procedure (continued)
5. Thoroughly wash the precipitate and the wall of the centrifuge tube,using not more than 5 ml of 0.03N ammonium oxalate. 'Centrifuge, anddiscard the supernatant.
6. Wash the precipitate with 10 ml of hot D.I. water. Cool 'to room temper-ature, centrifuge, and discard the supernate. (A stirring rod may beused to agitate the precipitate'while it is being washed. It is im-portant to remove all excess oxalic acid from .the precipitate.)
7. Dissolve the precipitate in approximately 2.5 ml of 6N HCl. Heat in hotwater bath for 5 minutes.
8. Dilute the acid solution to approximately 10 ml with D.I. water.Quantitatively transfer it to a 125 ml Erlenmeyer flask, rinsing thecentrifuge tube with D.I. water.
9. Add an additional 1 ml of 6N HCl, and adjust the volume of solution toapproximately 25 ml with D.I. water. Heat to near boiling.
10. While hot, titrate with standardized 0.05N KMnO4 to the first' faintpink endpoint which persists for at least 30 seconds.
Cal cul ations
Calcium (g/liter) = A x B x C
D
Where:
A = Volume of KMnO4 solution used for titration (ml)B-= Normality of standardized KMn4 solution (mg/ml)C = Milli-equivalent weight of calcium (mg/meg)D = Sample volume (ml)
Since the sample size is 10 ml and the milli-equivalent weight of calciumis 20 mg, the equation reduces to:
Calcium (g/liter) - A x B x 2
TIML-CA-01-03

II
LIRevision 0, 07-08-88T IML-CA-01
UEvaluation of Data
The standard deviation of replicate analyses has been determined to be±0.02 g/liter.
d-fl
Reference: Radioassay Procedures for Environmental Samples, U.S.Department of Health, Education and Welfare. Environ-mental Health Series, January 1967. B
LILL
LLI,
L
IIIEl
TIMIL-CA-01-04
1

MFENUCL EAPEANNUAL REPORT PART III :
PROGRAM SELF-ASSESSMENT
PROGRAM CHANGES
i
. s _ . ..
. . .. ' .. . . . . . . .. .
.. . . .. -, ... . . . , 1 ; - ..
.. . . . . .......... . ..
: - --- ;- - f Blossoms in the Spring. . . .. . .
: - -, ;- , -
. - . .. . - . - ..... . .
. ..... ....... ... . .. . .... ... .
. . - . . , - . . .. .. . .. . . . . . .. ..
* . ... - ;-
.. . . . .. ...
.. . . .. .. , . . ... , . - ... .
. . ... .. .... . A_ _
.
------

Kewaunee NuclearPower Plant
Radiological EnvironmentalMonitoring Manual
(REMM)
Revision 809-30-2003
Reviewed by:
Approved by:
Approved by:
Approved by:
Date:P1t 1atia s Review Committ e.
Regulatory Affairs Manager-
Radiatiotecfion Manager
Chemistry anager
3IT (2r./O 3Date:
Date:_ 2_____-__
Date: ..??/Z J
I I
I
ITable of Contents
1.0 Introduction ....... 1-1
1.11.21.3
Purpose ......... 1-1Scope .1-1Implementation ......... 1-1
I
2.0 REMP Requirements .............. 2-1
2.1 Technical Specification Requirements ........................... ; 2-12.2 REMM Requirements ........................... 2-1
REMM 2.2.1/2.3.1 Monitoring Program .2-3REMM 2.2.2/2.3.2 Land Use Census .2-6REMM 2.2.3/2.3.3 Interlaboratory Comparison Program .2-8REMM 2.4.1 Reporting Requirements .2-9
3.0 REMvLP Implementation ................ 3-1
I1I1I
II.
3.13.23.33.43.53.6
Sampling Requirements .................................................... 3-1Analysis Methodology ................................................... 3-1Detection capability (LLD) Requirements ................................................... 3-1Environmental Inc. Midwest Laboratory (EIvL) Reporting Requirements ....... 3-2Quality Control Program ................................................... 3-2Sample Descriptions .................................................... 3-3
Tables & Figures 1Table 2.2.1-ATable 2.2.1-BTable 2.2.1-CTable 2.2.1-D
Table 2.3.1-A
Radiological Environmental Monitoring ProgramType and Frequency of CollectionSampling Locations, Kewaunee Nuclear Power PlantReporting Levels for Radioactivity Concentrations in EnvironmentalSamplesDetection Capabilities for Environmental Sample Analysis Lower Limit ofDetection (LID)
1,
I11I
Figure 1 Environmental Sampling Location
I
'IRev. 8
09-30-2003 Ii
I

1.0 Introduction
1.1 Purpose
The purpose of this document is to define the Radiological Environmental Monitoring Program(REMP) for the Kewaunee Nuclear Power Plant (KNPP). The REMP is required by KNPPTechnical Specification (TS) 6.16.b.2, "Radiological Environmental Monitoring Program."
This document'is known as the Radiological Environmental Monitoring Manual (REMM) and isintended to serve as a tool for program administration and as a guidance document for contractors
L_ which implement the monitoring program.
1.2 Scope.
This program defines the sampling and analysis schedule which was developed to providerepresentative measurements of radiation and of radioactive materials' in those exposure pathwaysand for those radionuclides that lead to the high potential radiation exposures of MEMBERS OFTHE PUBLIC resulting from plant operation. This monitoring program implements Section IV.B.2of Appendix I to 10CFR Part 50 and thereby verifies that the measurable concentrations ofradioactivity and levels of radiation are not higher than expected on the basis of the effluentmeasurements and the modeling of the environmental exposure pathways. Guidance for the
I development of this monitoring program is provided by the Radiological Assessment BranchTechnical Position on Environmental Monitoring. This program has been developed in accordancewith NUREG 0472.
- The program will provide field and analytical data on the air, aquatic, and terrestrial radioecology of- the area near the Kewaunee Nuclear Power Plant so as to:
} 1. Determine the effects of the operation of the Kewaunee Nuclear Power Plant on the environment;
2. Serve as a gauge of the operating effectiveness of in-plant control of waste discharges; and
] ' 3. Provide data on the radiation dose to the public by direct or indirect pathways of exposure.
* 1.3 Implementation
This document is considered, by reference, to be part of the Offsite Dose Calculation Manual. Thisis as required by KNPP TS 6.16.b.2. The REMM is controlled as a separate document for ease ofrevision, use in the field and use by contractors. This format was approved by the NRC as part of TSAmendment No. 64, which provided Radiological Effluent Technical Specifications (RETS) forKNPP.
The REMP is setup to be implemented by a vendor and controlled by the Kewaunee Nuclear PowerPlant (KNPP) in accordance with Nuclear Administrative Directive NAD-1.20, "RadiologicalEnvironmental Monitoring Program." Monthly reviews of the vendor's progress report are checkedand approved by KNPP in accordance with Surveillance Procedure SP-63-276. Annual reviews andsubmittals of the vendor's report and raw data are checked and approved by KNPP in accordancewith Surveillance Procedure SP-63-280. All sample collection, preparation, and analysis areperformed by the vendor except where noted. Surveillance Procedure SP-63-164 outlines the
Rev. 81-1 09-30-2003

I L
environmental sample collection performed by KNPP. Current vendor Quality Control Program jManuals and implementing procedures shall be kept on file at KNPP.
Periodic reviews of monitoring data and an annual land use census will be used to develop Imodifications to the existing monitoring program. Upon approval, these modifications will beincorporated into this document so that it will accurately reflect the current radiologicalenvironmental monitoring program in effect for the Kewaunee Nuclear Power Plant.
The remainder of this document is divided into two sections. The first section, 2.0 REMPRequirements, describes the different TS and REMM requirements associated with the REMP. Thesecond section, 3.0 REMP Implementati6n. describes the specific requirements used to implementthe REMP.
" 'ev. 1
12 L
.IiI
': 1
Rev8 L1-2 0-30-003I

2.0 REMP Requirements
KNPP TS Amendment No. 104 implemented the guidance provided in Generic Letter 89-01,"Implementation of Programmatic Controls for Radiological Effluent Technical Specifications.(RETS)." These changes included:
1. Incorporation of programmatic controls in the Administrative' Controls section of the TS to' satisfy existing regulatory requirements for RETS, and
2. Relocation of the procedural details on radioactive effluents monitoring, radiologicalL_ environmental monitoring, reporting details, and other related specifications from the TS to the
ODCM.
Relocating the procedural details to the ODCM allows for revising these requirements using the1OCFR50.59 process instead of requiring prior NRC approval using the TS Amendment process.
The RETS requirements were incorporated verbatim into the ODCM, Revision 6. Several of theserequirements pertain only to the environmental monitoring program and therefore have beenrelocated into this document (REMM, Revision 3 and 4) and are identified as REMM requirements.
2.1 Technical Specification Requirements
L. Technical Specification 6.16.b.2 provides the programmatic control, which requires a program tomonitor the radiation and radionuclides in the environs of the plant. This is the reason for theexistence of the REMP. TS 6.16.b.2 also provides the programmatic control which requires:
a. The program to perform the monitoring, sampling, analysis, and reporting in accordancewith th'e methodology and parameters in the ODCM,
b; A land use census to be performed, and
c. Participation in an Interlaboratory Comparison Program.
The details of each requirement are described in the REMM requirements stated below.
Technical Specification 6.9.b. 1 requires an "Annual Radiological Environmental Monitoring Report"be submitted to the NRC each year. The specific contents of this report are detailed inREMM 2.4.1. Additional specific reporting requirements are listed in the other REMMrequirements.
7 2.2 REMM Requirements
The following REMM requirements include the procedural details that were originally located in theKNPP RETS section and then relocated into Revision 6 of the ODCM, as discussed above. Theserequirements are specific to the radiological environmental monitoring program and have beenrelocated into this document for ease of use and completeness.
i_ The REMM requirements for the Monitoring Program, Land Use Census, and the InterlaboratoryComparison Program include a detailed specification (numbered 2.2.1, 2.2.2, and 2.2.3 respectively)
Rev. 82-1 09-30-2003

and an associated surveillance requirement (numbered 2.3.1, 2.3.2, and 2.3.3 respectively), along Iwith the basis for the requirement. Reporting requirements are listed in specification REMM 2.4.1.
General requirements also apply to all ODCM and REMM requirements (specifications 3.01, 3.02,3.03, 4.01, 4.02, and 4.03). The requirements are located in the ODCM and are repeated here forconvenience. iGENERAL SPECIFICATIONS
3.0.1 Compliance with the specifications contained in the succeeding text is requiredduring. the conditions specified therein; except that upon failure to meet thespecifications, the associated ACTION requirements shall be met.
3.0.2 Noncompliance with a Specification shall exist when its requirements and associatedACTION requirements are not met within the specified time intervals. If theSpecification is restored prior to expiration of the specified time intervals,completion of the Action requirements is not required.
3.0.3 When a Specification is not met, except as provided in the associated ACTION Irequirements, reporting pursuant to TS 6.9.b and REMM 2.4.1 will be initiated.
SURVEILLANCE REQUIREMENTS L
4.0.1 Surveillance Requirements shall be met during the conditions specified for individualSpecifications unless otherwise stated in an individual Surveillance Requirement.
4.0.2 Each Surveillance Requirement shall be perf6rmed within the specified time intervalwith a maximum allowable extension not to exceed 25% of the surveillance interval.
4.0.3 Failure to perform a Surveillance Requirement within the specified time interval shallconstitute a failure to meet the OPERABILITY requirements for a Specification.Exceptions to these requirements are stated in the individual Specification.Surveillance Requirements do not have to be performed on inoperable equipment. L
Rev. 8
2-2 09-30-2003f

REMM2.2.1/2.3.1 Monitorizg Program
SPECIFICATION
2.2:1 The radiological environmental monitoring program shall be conducted as specifiedin Table 2.2.1-A.
APPLICABILITY '
At all times.
ACTION
a. With the radiological environmental monitoring program not being conducted asspecified in Table 2.2.1-A, in lieu of a Licensee Event Report, prepare and submit tothe Commission, in the Annual Radiological Environmental Monitoring Reportrequired by TS 6.9.b.1 and REMM 2.4.1, a description of the reasons for notconducting the program as required and the plans for preventing a recurrence.
b. With the level of radioactivity as:the result of plant effluents in an environmentalsampling medium at a specified location exceeding the reporting levels ofTable 2.2.1-D when averaged over any calendar quarter in lieu of a Licensee EventReport, prepare and submit to the Commission within 30 days, pursuant toTS 6.9.b.3, a Special Report that identifies the cause(s) for exceeding the limit(s) anddefines the corrective actions to be taken to reduce radioactive effluents so that thepotential annual dose1 to A MEMBER OF THE PUBLIC is less than the calendar
* year limits of specifications ODCM 3.3.2, 3.4.2, and 3.4.3. When more than one ofthe radionuclides in Table 2.2.1-D are detected in the sampling medium, this reportshall be submitted if:
concentration (1) concentration (2)reporting level (1) reporting level (2)
When radionuclides other than those in Table 2.2.1-D are detected and are the resultof plant effluents, this report shall be submitted if the potential annual dose1 to aMEMBER OF THE PUBLIC is equal to or greater than the calendar year limits ofspecifications ODCM 3.3.2, 3.4.2, and 3.4.3. This report is not required if themeasured level of radioactivity was not the result of plant effluents; however, in suchan event the condition shall be reported and described in the Annual RadiologicalEnvironmental Monitoring Report.
'The methodology and parameters used to estimate the.potential annual dose to a member of the public shall beindicated in this report.
Rev. 82-3 09-30-2003

I I
Ic. With milk or. fresh leafy vegetable samples unavailable from one or more of the
sample locations required by Table 2.2.1-A, a sample from an alternative locationwill. be substituted, noting the reason for the unavailability in the AnnualRadiological Environmental Monitoring Report. When changes in sampling Ilocations are permanent, the sampling schedule in the RADIOLOGICALENVIRONMENTAL MONITORING MANUAL (REMIM) will be updated to reflectthe new routine and alternative sampling locations and this revision will be described Iin the Annual Radiological Environmental Monitoring Report.
Rev. _
2' i
: ; 1
Rev. 8 L2-4 09-30-2003
SURVEILLANCE REQUIREMENTS
2.3.1 The radiological environmental monitoring samples shall be collected pursuant toTable 2.2.1-A from the .specific, locations given in the table and figure(s) in theREMMv, and shall be analyzed pursu'ant to the requirements of Table 2.2.1-A and thedetection capabilities required by' Table 2.3. 1-A.
BASIS
The radiological environmental monitoring program required by this specification providesrepresentative measurements of radiation and of radioactive materials in those exposurepathways and for those radionuclides that lead to the highest potential radiation exposurLs ofMEMBERS OF T.HE PUBL-IC resulting from the station operation. This monitoringprogram implements Section IV.B.2 -of Appendix I to l0CFR Part .50 and therebysupplements the radiological effluent monitoring program by verifying that the measurableconcentrations of radioactive materials and levels of radiation are not higher than expectedon the basis of the effluent measurements and the modeling of the environmental exposurepathways. Guidance for this, monitoring program is provided by the RadiologicalAssesiinent Branch Technical Position on Environimental Monitoring. Program changes maybe initiated based on operational experience.
The required detection capabilities for environmental sample analyses are tabulated in termsof the lower limits of detection (LLDs)'. -The LLDs required by Table 2.3. 1-A are consideredoptimum for routine environmental measurements in industrial laboratories. It should berecognized that the LLD is defined as' a priori (before the fact) limit representing- thecapability of a. measurement systemnand not as an a posteiiori (after the fact) limit for aparticular measurement.
Detailed discussion of the LLD,.and othe'rdetection limits, can be found in HASL ProceduresManual,- HASL-300 (revised aninually)', Currie, L.A., "Limits for Qualitative Detection andQuantitative Determination - Application to Radiochemistry," Anal. Chem. 40, 586-93(1968), and Hartwell, J.K., "Detection Limits for Radioanalytical Counting Techniques,"Atlantic Richfield Hanford Company Report ARH-SA-215 (June 1975).
Discussion
KNPP TS 6.1 6.b.2(a) requires that the monitoring, sampling, analysis, and reporting of radiation andradionuclides in the environment be done in alccordance' with the methodology and parameters in. theODCM.
Rev. 82-5 09-30-2003

REMAl 2.2.2/2.3.2 Land Use Census
SPECIFICATIONS I2.2.2 A land use census shall be conducted and shall identify within a distance of 8 km
(5 miles) the location in each of the 10 meteorological sectors of the nearest milkanimal, the nearest residence and the nearest garden2 of greater than 50 m2 (500 ft2)producing broad leaf vegetation.
APPLICABiLITY IAt all times. I
ACTION
a. With a land use census identifying a location(s) that yields a calculated dose or dose Icommitment greater than the values currently being calculated in specification
- ODCM 4.4.3, in lieu of a Licensee Event Report, identify the new location(s) in thenext Annual Radiological Environmental Monitoring Report pursuant to TS 6.9.b.1and REMM 2.4. 1.;
b. With a land use census identifying a location(s) that yields a calculated dose or dose Icommitment (via the same exposure pathway) 20% greater than at a location fromwhich samples are currently being obtained in. accordance with specificationREMM 2.2.1, add the new location(s) to the radiological environmental monitoring
. program within 30 days. The sampling location(s), excluding the control station: location, having a lower calculated dose or dose commitment(s), via the same
exposure pathway, may be deleted from this monitoring program. In lieu of aLicensee Event Report, identify the new location(s) in the next Annual Radiological.Environmental Monitoring Report pursuant to TS 6.9.6.1 and REMM 2.4.1 and alsoinclude in the report a revised figure(s) and table for the REMM reflecting the newlocation(s). L
SURVEILLANCE REQUIREMENT
2.3.2 The land use census shall be conducted during the growing season once per L12 months using reasonable survey methods, such as by a door-to-door survey, aerialsurvey, or by consulting local agriculture authorities. The results of the land usecensus shall be included in the Annual Radiological Environmental MonitoringReport pursuant to TS 6.9.b. 1 and REMM 2.4. 1.
2Sampling of leaf vegetation may be performed at the site boundary in each of two different direction sectors with thehighest predicted D/Qs in lieu of the garden census. Specifications for broad leaf vegetation sampling in LTable 2.2.1-A item 4c shall be followed, including analysis of control samples.
Rev. 82-6 09-30-2003

BASIS
This specification is provided to ensure that changes in the use of areas at and beyond theSITE BOUNDARY are identified and that modifications to the radiological environmentalmonitoring program are made if required by the door-to-door survey, from aerial survey orfrom consulting With local agricultural authorities. This census satisfies the requirements ofSection IV.B.3 of Appendix I to 10CFR Part 50. Restricting the census to gardens of greaterthan 50 m2 provides assurance that significant exposure pathways via leafy vegetables will beidentified and monitored since a garden of this size is the minimum required to produce thequantity (26 kg/yr) of leafy vegetables assumed in Regulatory Guide 1.109 forconsumptionby a child. To determine this minimum garden size, the following assumptions were made:
1. 20% of the garden was used for growing leafy vegetation (i.e., similar to lettuce andcabbage), and
2. A vegetation yield of 2 kg/M2.
Discussion
KNPP TS 6.16..b.2(b) requires that a land use census be performed to ensure that changes in the useof areas at and beyond site boundary are identified and that modifications to the radiologicalenvironmental monitoring program are made if required by the results of this census.
_Rev. 8
2-7 09-30-2003

I I
1
REMM 2.2.3/2.3.3 Interlaboratory Comparison Program
: SPECIFICATIONS
2.2.3 Analyses shall be performed on radioactive materials supplied as part of anInterlaboratory Comparison Program that has been approved by the Commission.
APPLICABILITY
1
1
IAt all times.
ACTION
14-
Ia. With analyses not being performed as required above, report corrective actions taken
to prevent a recurrence to the Commission in the Annual Radiological EnvironmentalMonitoring Report pursuant to TS 6.9.b.1 and REMM 2.4.1.
SURVEILLANCE REQUIREMENTS
2.3.3 The Interlaboratory Comparison Program shall be described in the REMM. Asummary of the results obtained as part of the above required InterlaboratoryComparison Program shall be included in the Annual Radiological EnvironmentalMonitoring Report pursuant to TS 6.9.b. 1 and REMM 2.4.1.
*1
III
BASIS
The requirement for participation in an approved Interlaboratory Comparison Program isprovided to ensure that independent checks on the precision and accuracy of measurementsof radioactive material in environmental-sample matrices are performed as part of the qualityassurance program for environmental monitoring in order to demonstrate that the results arevalid for the purposes of Section IV.B.2 of Appendix I to 10CFR Part 50.
Discussion
KNPP TS 6.16.b.2(c) requires participation in an approved Interlaboratory Comparison Program toensure that an independent check is performed of the precision and accuracy of radioactive materialsmeasurements. This will demonstrate that the results are valid for the purposes of Section IV.B.2 ofAppendix I to 10CFR Part 50.
Rev. 82-8 09-30-2003
i
I
lII1II

REMM 2.4.1 Reporting Requirements
2.4.1 The Annual Radiological Environmental Monitoring Report shall include:
a. Summaries, interpretations, and an analysis of trends of the results of theradiological environmental surveillance activities for the report period,including a comparison with pre-operational- studies, with operationalcontrols as appropriate, and with previous environmental surveillance reports,and an assessment of the observed impacts of the plant operation on theenvironment. The reports shall also include the results of land use censusesrequired by specification REMM 2.2.2. -
b. The results of analyses of radiological environmental samples and ofenvironmental radiation measurements taken during the period pursuant tothe locations specified in the table and figures in the RadiologicalEnvironmental Monitoring Manual (REMM), as well as summarized andtabulated results of these analyses and measurements in the format of the
l .table in the Radiological Assessment Branch Technical Position, Revision 1,November 1979. In the event that some individual results are not availablefor inclusion with the report,'the report shall be submitted noting andexplaining the reasons for the missing results. The missing data shall be
- submitted as soon as possible in a supplementary report when applicable.
C. A summary description of the radiological environmental monitoringprogram; legible maps covering all sampling locaitions keyed to a table givingdistances and directions from the centerline of-one reactor; the results oflicensee participation in the Interlaboratory Comparison Program, required byspecification REMM 2.2.3; discussion of all deviations from the samplingschedule of Table 2.2.1-A; and discussion of all analyses in which theLrequired by Table 2.3.1-A was not achievable.
Discussion
KNPP TS 6.9.b.1 provides the programmatic control, which requires that an Annual RadiologicalEnvironmental Monitoring Report be submitted to the NRC. It also states that this report shallinclude summaries, interpretations, and analysis of trends of the results of the REMP for thereporting period.
The procedural details of this report are included in this specification. Specifications REMM 2.2.1,2.2.2/2.3.2, and 2.2.3/2.3.3 also include specific reporting requirements. These specificationsreference this REMM specification, along with TS 6.9.b.1, as the method for reporting deviations
l_ from the current program during the reporting period, and require that this information be included inthe Annual Radiological Environmental Monitoring Report.
-~ Rev. 82-9 09-30-2003

3.0 REMP Implementation
The Radiological Environmental Monitoring Program for KNPP is currently under the direction ofEnvironmental, Inc. Midwest Laboratory (EIML). This section describes this program, as required Lby REMM 2.2.1 and the process EIML uses to perform it.
3.1 Sampling Requirements l -
Table 2.2.1-A identifies the various samples required by the REMP. Identified in the "availablesample locations" column in Table 2.2.1-A are the sample locations selected, in conjunction with thevendor, to meet or exceed the REMP requirements. Table 2.2.1-B includes the same requirements asin Table 2.2.1-A but presents the information in a different format by identifying the type of samples lrequired at each location and the collection frequency. Table 2.2.1-C identifies the location and -Ldescription of each sample location. Figure 1 shows the physical location of each sample point on anarea map. . I3.2 Analysis Methodology
Analytical procedures and counting methods employed by ELML will follow those recommended bythe U.S. Public Health Service publication, Radioassay Procedures for Environmental Samples,January 1967; and the U.S. Atomic Energy Commission Health and Safety Laboratory, HASL iProcedures Manual (HASL-300), 1972. The manual is also available on-line atwww.eml.doe.gov/publications/procman.
Updated copies will be maintained in KNPP's vault.
3.3 Detection Capability (LLD) Requirements
The required detection capabilities for environmental sample and analysis are tabulated in termiis oflower limits of detection (LLDs) in Table 2.3.1-A. The LLDs required by Table 2.3.1-A areconsidered optimum for routine environmental measurements in industrial laboratories. It should berecognized that the LLD is defined as a priori (before the fact) limit representing the capability of ameasurement system and not as an a posteriori (after the fact) limit for a particular measurement.
Detailed discussion of the LLD, and other detection limits, can be found in HASL ProceduresManual, HASL-300 (revised annually), Currie, L.A., "Limits for Qualitative Detection and LQuantitative Determination - Application to Radiochemistry," Anal. Chem. 40, 586-93 (1968),-andHartwell, J.K., "Detection Limits for Radioanalytical Counting Techniques," Atlantic RichfieldHanford Company Report ARH-SA-215 (June 1975).
Rev. 83-1 09-30-2003

3.4 Environmental, Inc. Midwest Laboratory (EIML) Reporting Requirements
Monthly Progress Reports
Monthly progress reports will include a tabulation of completed analytical data on samples obtainedduring the previous 30 day period together with graphic representations where trends are evident, andthie status of field collections. One copy of the reports will be submitted within 30 days of thereporting month.-
Annual Reports
Annual reports will be submitted in two parts. Part I, to be submitted to the NRC, will be prepared; in accordance with NRC Regulatory Guide 4.8. It will contain'an introductory statement, a summary
of results, description of the program, discussion of the results, and summary table. Part II of theannual report will include tables of analytical data for all samples collected during the reportingperiod, together with graphic presentation where trends are evident and statistical evaluation of theresults. Gamma scan data will be complemented by figures of representative spectra. Draft copies
l of each annual report will be due 60 days after completion of the annual period. After final review ofthe draft document, one photoready copy of the revised annual report will be sent to KNPP forprinting.
_ Non-Routine Reports
If analyses of any samples collected show abnormally high levels of radioactivity, KNPP will benotified by telephone immediately after data becomes available.
Action Limits
. EIML should report any radioactive concentrations found in the environmental samples whichexceed the reporting levels shown in-Table 2.2.1-D, EIML to KNPP column. These levels are setbelow the NRC required reporting levels (KNPP to NRC column) so actions can be initiated toprevent exceeding the NRC concentration limits.
3.5 Quality Control Program
To insure the validity of the data, EIML maintains a quality control (QC) program, which employs.L quality control checks, with documentation, of the analytical phase of its environmental monitoring
studies. The program is defined in the EIML QC Program Manual, and procedures are presented inL the EIML QC Procedures Manual. The program shall be reviewed and meet the requirements of
10CFR50 Appendix B and 10CFR21. All data relatedto qualitycontrol will be available for reviewby WPS upon reasonable'prior notification. Pr6prietary information will be identified so that it maybe treated accordingly.
Updated copies of the Quality Control Program Manual and the Quality Assurance Program Manualwill be maintained in KNPP's vault.
Rev. 83-2 09-30-2003

3.6 Sample Descriptions IA description of each of the samples required by this program follows:
Airborne Particulates
Airborne particulates are, collected at six locations (K-if, K-2, K-7, K-8, K-16, K-31) on acontinuous basis on a 47 mm diameter membrane filter of 0.8 micron porosity at a volumetric rateof approximately onie cubic foot per minute (CFM). The filters are changed weekly, placed inglassine protective envelopes, and dispatched by U.S. Mail to EIML for Gamma Isotopic Analysis i(ref. SP-63-164). Filter samples are analyzed weekly for gross beta activity after sufficient time(usually 3 to 5 days) has elapsed to allow decay of Radon and Thoron daughters. If gross betaconcentration in air particulate samples are greater than ten (10) times the yearly mean of the control Lsamples, gamma isotopic analysis shall be performed on the individual samples. Quarterlycomposites from each location receive Gamma Isotopic Analysis using a Germanium detector. Allidentifiable gamma-emitters are quantified. Reporting units are pCi/mi3. IAirborne Iodine IAll air samplers are equipped with charcoal traps installed behind the particulate filters for collectionof airborneI-131. The traps are changedonce every two weeks. Iodine-131 is measurec byGammaIsotopic Analysis.
Periphvton (Slime) orApuatic Vegetation -
Periphyton (slime) or aquatic plant samples are collected at or near locations used for surface watersampling. They are collected twice during the year (2nd and 3id quarter), if available. The.samplesare analyzed for gross beta activity and, if available in sufficient quantity, for Sr-89, Sr-90, and byGamma Isotopic Analysis. Reporting units are pCi/g wet weight.
Fish
Fish is collected three times per year (second, third, and fourth quarters) near the discharge area(K-ld) (ref. RC-C-207). Flesh is separated from the bones and analyzed for gross beta activity andby Gamma Isotopic- Analysis. The bones are analyzed for gross beta activity and Sr-89 andSr-90. Reporting units are pCi/g wet weight. l
Domestic Meat
Domestic meat (chickens) is collected once a year during the 3rd quarter, at five locations in the Lvicinity of the plant (K-20, K-24, K-27, K-29, and K-32). Samples may not be available every yearat every location due to farmer preference. At least one control and one indicator should becollected. The flesh is analyzed for gross alpha, gross beta, and by Gamma Isotopic Analysis toidentify and quantify gamma-emitting radionuclides. Reporting units are pCi/g wet weight.
IRev. 8
3-3 09-30-2003

Ambient Radiation
Two packets of theirnoluminescent dosimeters (CaSO 4: Dy cards) are placed at fifteen locations, sixof which are air sampling locations (K-if, K-2, K-7, K-8, K-16, and K-31) and five of which aremilk sampling locations (K-3, K-5, K-25, K-38, and K-39); the remaining four locations are K -15,K-17, K-27, and K-30. One packet is changed quarterly and one annually. Annual TLDs will serveas an emergency set to be read when needed. They will be exchanged annually (without reading) ifnot read during the year. To insure the precision of the measurement, each packet will contain twocards with four dosimeters each (four sensitive areas each for a total of eight). Forprotection againstmoisture each set of cards is sealed in a plastic bag and placed in a plastic container.
Each card is individually calibrated for self-irradiation and light response. Fading is guaranteed bythe manufacturer (Teledyne Isotopes) not lo exceed 20% in one year. Minimum sensitivity for themulti-area dosimeter is 0.5 mR defined as 3 times the standard deviation of thebackground. Maximum Error (1 standard'deviation) - 6Co Gamma +/-0.2 mR or +/.-3%, whicheveris greater. The maximum spread between areas on the same dosimeter is 3.5% at 1 standarddeviation.
Reporting'units for TIDs are mR/91 days for quarterly TLDs and mR/exposure period for annualTIDs.
Tests for uniformity and reproducibility of TLDs as specified in ANSI N545-1981 and NRCRegulatory Guide 4.13, are performed annually.
Well Water
One gallon water samples are taken once every three months from four off-site wells, (K-10, K-i1,K-13, and K-25) and two on-site wells (K-lh and K-lg). All samples are analyzed for gross beta inthie total residue, K-40 and by Gamma Isotopic Analysis. Samples from one on-site well areanalyzed for Sr-89, Sr-90, and for tritium. Samples from K-lh and K-lg are also analyzed for grossalpha. Reporting units are pCi/l.
Precipitation
A monthly cumulative sample of precipitation is taken at Location K-11. This sample is analyzed fortritium. Reporting units are pCiA.
Milk
Milk samples are collected from two herds that graze within three miles of the reactor site (K-25 andK-34); from four herds that graze between 3-7 miles of the reactor site (K-3, K-5, K-38, and K-39);and one from a dairy in Green Bay (K-28), 26 miles from the reactor site.
The samples are collected twice per month during the grazing period (May through October) andmonthly for the rest of the year. To prevent spoilage the samples are treated with preservative. Allsamples are analyzed by Gamma Isotopic Analysis and for iodine -131 immediately after they arereceived at the laboratory. To achieve required minimum sensitivity of 0.5 pCi/l, iodine is separated
Rev. 83-4 09-30-2003

1on an ion exchange column, precipitated as palladium iodide and beta counted. Monthly samples Land monthly composites of semimonthly samples are then analyzed for Sr-89 and Sr-90. Potassiumand calcium are determined and the 137Cs/gK and 90Sr/gCa ratios are calculated. Reporting units arepCi/l except for stable potassium and calcium, which are reported in g/l.
If milk samples are not available, green leafy vegetables will be collected on a monthly basis (whenavailable) from Locations K-10, K-I1, and K-26.
Grass
Grass is collected three times per year (2nd, 3rd, and 4th quarters) from the six dairy farms (K-3, K-5, K-25, K-34, K-38, and K-39) and from two on-site locations'(K-lb and K-If). The samples areanalyzed for gross beta activity, for Sr-89 and Sr-90, and Gamma Isotopic Analysis to identify and Lquantify gamma-emitting radionuclides. Reporting units are pCi/g wet weight.
Cattlefeed *
Once per year, during the first quarter when grass is not available, cattlefeed (such as hay or silage) iscollected from the six dairy farms. The analyses performed are the same as for grass. Reportingunits are-pCi/g wet weight.
Vegetabies and Grain IAnnually, during the 3rd quarter, samples of five varieties of vegetables grown and marketed forhuman consumption are collected from K-17 and/or K-26, depending upon the availability ofsamples.. Ini addition, two varieties of grain, if available, are collected annually from the farmlandowned by WPS (K-23) and rented to a private individual for growing crops. The analyses performedare the same as for grass. Reporting units are pCi/g wet weight.
Egg -s
Quarterly samples of eggs can be taken from K-24, K-27, and K-32. At least one control and oneindicator should be collected. The samples are analyzed for gross beta activity, for Sr-89 and Sr-90,and Gamma Isotopic Analysis to identify and quantify gamma-emitting radionuclides. Reporting Iunits are pCi/g wet weight.
Soil iTwice during the growing season samples of the top two inches of soil are collected from the sixdairy farms and from an on-site location (K-If). The soil is analyzed for gross alpha and grossbeta activities, for Sr-89 and Sr-90, and Gamma Isotopic Analysis to identify and quantifygamma-emitting manmade radionuclides. Reporting units are pCi/g dry weight. LSurface Water
Surface water is sampled monthly from Lake Michigan at the KNPP discharge (K-Id), and atTwo LCreeks Park, 2.5 miles south of the reactor site (K-14). Samples are collected monthly at the Green
Rev. 8 L3-5 09-30-2003
__ ----
Bay Municipal Pumping station between Kewaunee and Green Bay (K-9). Raw and treated water*is collected. Monthly samples are also taken, when available, from each of the three creeks (K-la,K-lb, K-le) that pass through the:reactor site and from the drainage pond (K-lk) south of theplant. The samples are taken at a point near the mouth of each creek and at the shore of thedrainage pond. The water is analyzed for gross beta activity in:
a. The total residue,b. The dissolved solids, andc. The suspended solids.
I The samples are also analyzed for K40 and by Gamma Isotopic Analysis. Quarterly compositesfrom all locations are analyzed for tritium, Sr-89 and Sr-90. Reporting units are pCi/l.
Bottom Sediments
Five samples of Lake Michigan bottom sediments, one at the discharge (K-id), one from 500 feetnorth of the discharge (K-1c), one from 500 feet south of the discharge (K-lj), and one at the TwoCreeks Park (K-14), one at the Green Bay Municipal Pumping Station (K-9) are collectedsemi-annually (May and November). The samples are collected at the beach in about 2-3 feet ofwater. All samples are analyzed for gross beta activity, for Sr-89 and Sr-90 and by Gamma isotopicAnalysis. Since it is known that the specific activity of the sediments (i.e., the amount ofradioactivity per unit mass of sediment) increases with decreasing particle size, the sampling
l~ procedure will assure collection of very fine particles. Reporting units are pCi/g dry weight.
Rev. 8
3-6 09-30-2003
II
Table 2.2.1-A
|_ Radiological Environmental Monitoring Program
Exposure Pathway Minimum Available Sample Sampling,And/Or Sample Required Samples ' Locations b Analysis Frequency
1. Direct Radiationc 5 Inner Ring locations K-5, K-25, K-27, See Table 2.2.1-B Gamma dose
._ K-7, K-1F, K-30
l 6 Outer Ring locations K-2, K-3, K-15, *
._ _ _ K-17, K-8, K-31, K-39
1 Control location K-16
1 Population center K-7
I Special interest location K-8
I Nearby resident K-27
2. Airborne Radioiodine 3 samples close to the site K-if, K-2, K-7, K-8, See Table 2.2.1.B Iodine (1-131) byand Particulates boundary in highest K-31 Continuous Gamma Isotopic|
average XIQ sampler operation
l____ . Iodine; charcoal
1 sample from the closest K-7: Particulates Particulates; grosscommunity having the ; See Table 2.2.1-B beta analysis'highest XIQ Gamma isotopic
1 sample from a control K-16d See Table 2.2.1-B of composite (bylocation location) f
3. Waterbome
a. Surfaces 1 Upstream sample K-la, K-9, K-id . Grab sample Gross Beta,
. Downstream sample K-le, K-14, K4ik, K-l See Table 2.2.1-B Sr f9I9OGamraisotopicComposite of grabsamples fortritium
b. Ground 1-2 location likely to be K-ig, K-1lhh Grab sample Gamma isotopicaffected d See Table 2.2.1-B tritium analysis
Gross Beta,Sr 89/90
c. Drinking 1-3 samples of nearest K-10, K-11, K-12, K-13 Grab sample Gross beta andwater supply See Table 2.2.1-B gamma isotopic |
analysis. Tritiumanalysis of thecomposite ofmonthly grabsamples.
d. Sediment from I sample from K-14, K-1c, K-id, Grab sample Gamma isotopic t
shoreline downstream area with K-1;, K-9 See Table 2.2.1-B analysispotential for recreational Gross Beta,value Sr 89/90
1,.
-u1i
II'
. i
t
1I.i
1"
IIIL
IRev. 8
Page 1 of 3 09-30-2003
I

Table 2.2.1-ARadiological Environmental Moniioring Program
Exposure Pathway Minimum Available Sample 1 Sampling,I Collection and Type of Analysis
And/Or Sample Required Samples' Locations b - Analysis Frequency
4. Ingestion
a. Milk Sarfiples from milking K-5, K-25, K-34 See Table 2.2.1-B I-131animals in 3 locations Gamma Isotopic f
within 5 km having thehighest dose potential. SR 89/90
1 alternate location. K-38, K-39
1 control location K-3, K-28
b. Fish ' 3 random samplings of 'K-1d See Table 2.2.1-B Gamma isotopiccommercially and and edible portionsrecreationally important Gross Betaspecies in the vicinity ofthe discharge. Sr 89190 on bones
c. Food Products Samples of leaf 2 samples nearest See Table 2.2.1-B Gamma isotopicvegetables grown nearest highest predicted . and 1-131each of two different . annual average ground . Analysis.offsite locations within 5 level D/Q. K-10, K-11miles of the plant if milksampling is notperformed. 1 sample 15-30 kmI
distant if milk sampling. __ is not performed. K-26
5. Miscellaneous samplesnot identified inNUREG-0472
a. Aquatic Slime None required K-ik See Table 2.2.1-B Gross BetaK-ia, K-bKlb. activity and ifbK-ie available Sr-89,
K-14, K-id Sr-90 and GammaIsotopicf
_K-9 (control)
b. Soil None required , K-if, K-5, K-25, K-39 Gross Alpha/Beta
K-34 See Table 2.2.1-B Sr-89 and Sr-90
K-3, (control) Gamma Isotopicf
c. Cattlefeed None required K-5, K-25, K-39 Gross Beta
K-34 See Table 2.2.1 -B Sr-89 and Sr-90
K-3,(control) Gamma Isotopicf
d. Grass None required K-lb, K-if, K-25, K-39 Gross Beta
K-5, K-12, K-34 See Table 2.2.1-B Sr-89 and Sr-90
K-3,(control) Gamma Isotopicr
e. Domestic Meat . None required K-20, K-24, K-27, K-29 See Table 2.2.1-B Gross 'Alpha/Beta
K-32 (control) Gamma Isotopicf
Rev. 809-30-2003Page 2 of 3

iTable 2.2.1-A
Radiological Environmental Monitoring Program V 1Exposure Pathway ' Minimum Available Sample Sampling,
ab ICollection and Type of AnalysisAnd/Or Sample Required Samples' Locations b Analysis Frequency
f. Eggs None required K-27,K-33 See Table 2.2.1-B Gross Beta
K-32 Sr-89/90
K-24 - Gamma Isotopict
g. Precipitation None required K-11 See Table 2.2.1-B Tritium
h. Vegetables/Grain None required K-17, K-23 See Table 2.2.1-B Gross Beta
Sr-89/90
: K-26 (control) Gamma Isotopicf
Table Notations
a. The samples listed in this column describe the minimum sampling required to meet REMP requirements.
b. Additional details of sample locations are provided in Table 2.2.1-C and Figure 1. The REMP requires that samples to betaken from each of the "available sample locations" listed (see section 3.1). Deviations from the required samplingschedule will occur if specimens are unobtainable due to hazardous conditions, seasonal unavailability, malfunction ofautomatic sampling equipment and other legitimate reasons. If specimens are unobtainable due to'sampling equipmentmalfunction, reasonable efforts shall be made to complete corrective actions prior to the end of the next sampling period.All deviations from the sampling schedule shall be documented, as required by REMM 2.4.1.c, in the Annual RadiologicalEnvironmental Monitoring Report. It is recognized that, at times, it may not be possible or practicable to continue to obtainsamples of the media of choice at the most desired location or time. In these instances suitable alternative media andlocations may be chosen for the particular pathway in question and appropriate substitutions made within 30 days in theREMM. The cause of the unavailability of samples for that pathway and the new location(s) for obtaining replacementsamples will be identified in the Annual Radiological Environmental Monitoring Report. -
c. For the purposes of this table, each location will h'ave 2 packets of thermoluminescent dosimeters (TLDs). The TLDs areCaSO4: Dy cards with 2 cards/packet and 4 dosimeters/card (four sensitive areas each for a total of eightdosimeters/packet). The NRC guidance of 40 stations is not an absolute number. The number of direct radiationmonitoring stations has been reduced according to geographical limitations; e.g., Lake Michigan. the frequency ofanalysis or readout for TLD systems depends upon the characteristics of the specific system used and selection is made toobtain optimum dose information with minimal fading.
d. The purpose of this sample is to obtain background information. If it is not practical to establish control locations inaccordance with the distance and wind direction criteria, other sites that provide valid background data may be substituted.
e. Airborne particulate sample filters shall be analyzed for gross beta radioactivity 24 hours or more after sampling to allowfor radon and thoron daughter decay. If gross beta activity in air particulate samples is greater than ten times the yearlymean of control samples, gamma isotopic analysis shall be performed on the individual samples.
f. Gamma isotopic analysis means the identification and quantification of gamma-emitting radionuclides that may beattributable to the effluents from the facility.
g. The "upstream sample" shall be taken at a distance beyond significant influence of the discharge. The "downstream"sample shall be taken in an area near the mixing zone.
h. Ground water samples shall be taken when this source is tapped for drinking or irrigation purposes in areas where thehydraulic gradient or recharge properties are suitable for contamination.
Rev. 8Page 3 of 3 09-30-2003
it
.1
.1
m. 1'I1
11
L.
El,
Table 2.2.1-B
Type and Frequency of Collection
Location Weekly [Biweekly [Monthly Quarterly | Semi-Annually | Annually
K-la SW SL
K-lb SW GR' SL
K-ic BSb __ _ _ _ _ _ _
K-ld SW F BS' SL
K-le SW __:_ SL
K-If AP AI GR' TLD so S
K-lg WW
K-lh WW
K-lj . BSbK-lk SW SL
K-2 AP AI TLD !
K-3 MF GR' TLD CFd SO
K -4 _ _ __ _ __ _ _
K-5 MlC GRa TLD CFd SO
K-6 ._.
K-7 AP Al TLD
K-8 AP AI TLD .
K-9 . SW BSb SL
K-10 GLVf WW
K-ll PR, WWGLV f
K-12 _ _ __ _
K-13 = = _= WW * __ =
K-14 SW BSb SL
K-15 . TLD
K-16 AP AI LD
K-17 TLD VE
K-19 :
K-20 DM
K-23 GRN
K-24 EG DM
K-25e _ MIC GR` TLD CFd SO
K-26 GLV f_. VE
K-27 EG TLD DM
K-28 MI' .
K-29 DM
Rev. 809-30-2003Page 1 of 2
I I
LTable 2.2.1-B
Type and Frequency of Collection
Location Weekly Biweekly Monthly Quarterly Semi-Annually Annually
K-30 TLD
K-31 AP Al TLD
K-32 EG DM
K-33 _ _ _ _ _ _
K-34 Mr GR' CFd so
K-35 __ ___ _
K -36 _ _ _ _ _ _ _ _ _ _ _ _ _ _ _ _ _
K-38 MI! TLD GR! CFd soIr M TLD GOR CFd So
a Three times a year, second (April, May, June), third (July, August, September), andfourth (October, November, December) quarters
b To be collected in May and Novemberc Monthly from November through April; semimonthly from May through Octoberd First (January, February, March) quarter onlye Replaced by K-29 in summer of 1990f Alternate if milk is not available
Code Description Code Description Code DescriptionAl Airborne Iodine Fl Fish SO SoilAP Airborne Particulate GR Grass SW Surface.WaterBS Bottom Sediment GRN Grain TLD Thermoluminescent
DosimeterCF Cattlefeed MI Milk VE VegetablesDM Domestic Meat PR Precipitation WW Well WaterEG Eggs SL Slime GLV Green Leafy
Vegetables
LdiI-11
-1III1i
III
1II
Rev. 8Page 2 of 2 09-30-2003
I

Table 2.2.1-C_ _ _ Sampling Locations, Kewaunee Nuclear Power Plant
DistanceCode Type' (Miles)" and Location
Sector L
K-1 Onsite
K-la I 0.62 N North Creek
K-lb I 0.12 N Middle Creek
K-ic I 0.10 N 500' North of Condenser Discharge
K-ld I 0.10 E Condenser Discharge
K-le I 0.12 S South Creek
K-if I 0.12 S Meteorological Tower
K-Ig 1 0.06 W South Well
K-1h I 0.12 NW North Well
K-lj I 0.10 S 500' south of Condenser Discharge
K-lk I 0.60 SW Drainage Pond, south of plant
K-2 C 9.5 NNE WPS Operations Building in Kewaunee
K-3 C 6.0 N Lyle and John Siegmund Farm, N28 15 Hy 42, Kewaunee
K-4(h) I 3.0 N Tom Stangel Farm, E4804 Old Settlers Rd, Kewaunee
K-5 I 3.5 NNW Ed Paplham Farm;E4160 Old Settlers Rd, Kewaunee
K-6(e) C 6.7 WSW Novitsky Farm, El 970 Cty Tk BB, Denmark
K-7 I 2.75 SSW Ron Zimmerman Farm,. 17620 Nero Rd, Two Rivers
K-8 C 5.0 WSW Saint Mary's Church, 18424 Tisch Mills Rd, Tisch Mills
Green Bay Municipal Pumping Station, six miles east of GreenK-9 C 11.5 NNE Bay (sample source is Lake Michigan from Rostok Intake 2 miles
north of Kewaunee)
K-10 I 1.5 NNE Turner Farm, Kewaunee Site
K-l1 I 1.0 NW Harlan Ihlenfeld Farm, N879 Hy 42, Kewaunee
K-12(i) I 1.5 WSW LeCaptain Farm, N491 Woodside Rd, Kewaunee
K-13 C 3.0 SSW Rand's General Store, Two Creeks
K-14 I 2.5 S Two Creeks Park, 2.5 miles south of site
K-15 C 9.25 NW Gas Substation, 1.5 miles north of Stangelville
K-16 C .26 NW WPS Division Office Building, Green Bay, Wisconsin
K-17 I 4.25 W Jansky's Farm, N885 Cty Tk B, Kewaunee
K-19(f) I 1.75 NNE Wayne Paral Farm, N1048 Lakeview Dr., Kewaunee
K-20 I 2.5 N Carl Struck Farm, N1596 Lakeshore Dr., Kewaunee
K-23 I 0.5 W 0.5 miles west of plant, Kewaunee site
Rev. 809-30-2003Page I of 2

I I
LITable 2.2.1-C
Sampling Locations, Kewaunee Nuclear Power Plant
DistanceCode Typea (Miles)b and Location
Sector
K-24. I 5.45 N Fectum Farm, N2653 Hy 42, Kewaunee
K-25 I 2.75 SW Wotachek Farm, E3968 Cty Tk BB, Two Rivers
K-26(d) C 10.7 SSW Bertler's Fruit Stand (8.0 miles south of "BB")
K-27 I 1.5 NW Schlies Farm, E4298 Sandy Bay Rd
K-28 C 26 NW Hansen Dairy, 1742 University Ave., Green Bay, Wisconsin
K-29 I 5.75 W Kunesh Farm, E3873 Cty Tk G. Kewaunee
K-30 I 1.00 N End of site boundary
K-31 I 6.25 NNW E. Krok Substation, Krok Road
K-32 C 11.50 N Piggly Wiggly, 931 Marquette Dr., Kewaunee
K-33(g) I 4.25 W Gary and Lynn Holly Farm, E2885 Holly Lane, Tisch Mills
K-34 I 2.5 N Leon and Vicky Struck Farm, N1549 Lakeshore Drive, Kewaunee
K-350) C 6.75 WNW Jean Ducat Farm, N1215 Sleepy Hollow, Kewaunee
K-36(j) I Fiala's Fish Market, 216 Milwaukee, Kewaunee
K-37 (k) . 4.00 N Gary and Ann Hardtke Farm, E4282 Old Settlers Road,K-37(k) I 4.0 NKewaunee
K-38 I 3.8 WNW Dave Sinkula Farm, N890 Town Hall Road, Kewaunee
K-39 I 4.00 N Francis Wotja FarmrN1859 Lakeshore Road, Kewaunee
LI
1I
II'l111I
1a I = indicator; .C = control.b Distances are measured from reactor stack.c Deletedd Location K-18 was changed because Schmidt's Food Stand went out of business. It was
replaced by Bertler's Fruit Stand (K-26)..e Replaced by K-33 in summer of 2000. Retired from farming.f Replaced by K-34 in summer of 2000. Retired from farming.g. Replaced by K-35 in fall of 2000.h. Sold farm in summer of 2000, replaced by K-25i. Retired from farming in summer of 2000j. Removed from the program in Fall of 2001k. Removed from the program in Fall of 2002
Rev. 8Page 2 of 2 09-30-2003
II
IIIII

Table 2.2.1-D
Reporting Levels for Radioactivity Concentrations in Environmental Samples
l Reporting LevelsMedium 1 Radionuclide . I ReporN g Levels
________________ J EIML to KNPPa| KNPP to NRCbAirborne Particulate or Gases (pCitm3) Gross Beta 1 :
1-131 (Charcoal) 0.1 0.9
Cs-134 1 10
Cs-137 1 20
Precipitation (pCi/l) H-3 : 1,000
Water (pCi/A) Gross Alpha 10
Gross Beta 30
H-3 10,000 20,000'
Mn-54 100 1,000
Fe-59 40 400
Co-58 100 1,000
Co-60 30 - 300
Zr-Nb-95 40 400
Cs-134 10 30
Cs-137. 20 50
Ba-La-140 100 200
. Sr-89 10
Sr-90 10Zn-65 30 300
Milk (pCitl) .I-131 1.0 3
Cs-134 20 60
.Cs-137 20 70
Ba-La-140 100 300
Sr-89 10 - 1
Grass, Cattle Feed, and Vegetables (pCi/g Gross Beta 30
wet) I-131 0.1 0.1
*Cs-134 0.2 1
Cs-137 0.2 2
Sr-89 ISr-90. 1-
Rev. 8Page 1of 2 09-30-2003
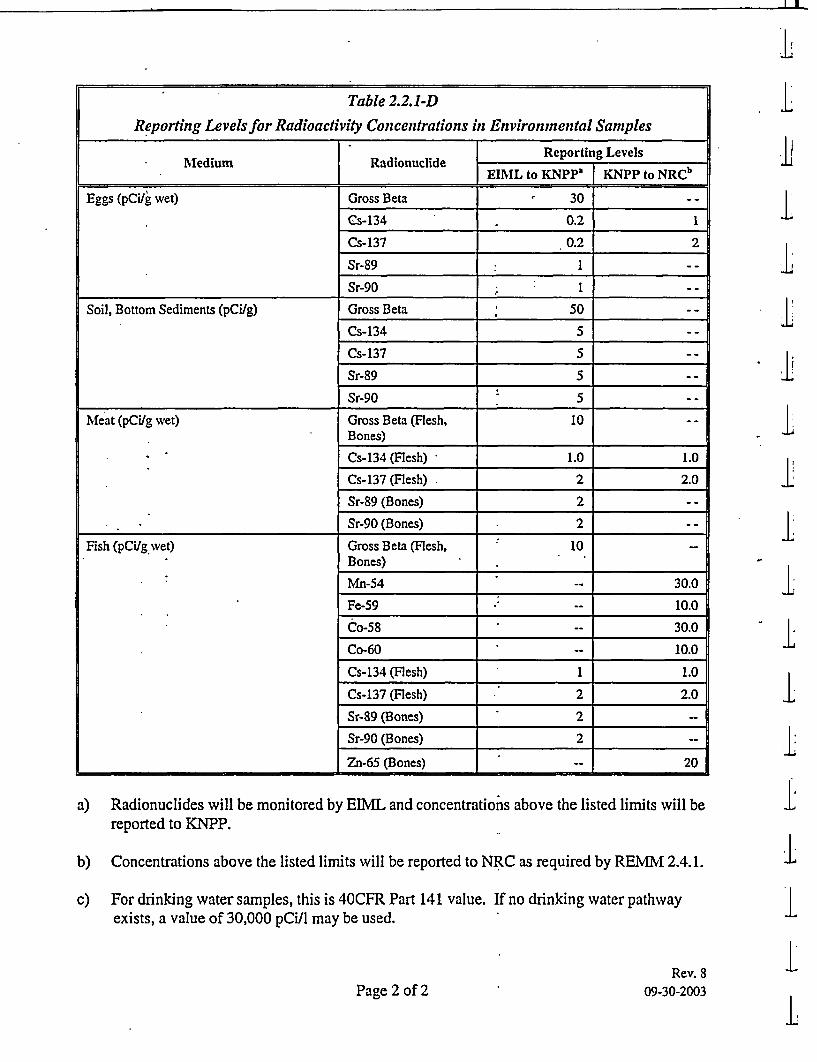
I I
.ITable 2.2.1-D
Reporting Levels for Radioactivity Concentrations in Environmental Samples
Reporting LevelsMedium Radionuclide EINIL to K K to NRe
Eggs (pCi/g wet) Gross Beta 30 |
Cs-134 . 0.2 1
Cs-137 0.2 2
Sr-89 1 1
Sr-90 1 1
Soil, Bottom Sediments (pCi/g) Gross Beta 50
Cs-134 5
Cs-137 5
Sr-89 5
Sr-90 5
Meat (pCi/g wet) Gross Beta (Flesh, 10Bones)
Cs-134 (Flesh) 1.0 1.0
Cs-137 (Flesh) 2 2.0
Sr-89 (Bones) 2
Sr-90 (Bones) 2
Fish (pCilg wet) Gross Beta (Flesh, 10Bones) .
Mn-54 30.0
Fe-59 . 10.0
Co-58 - 30.0
Co-60 * 10.0
Cs-134 (Flesh) 1 1.0
Cs-137 (Flesh) 2 2.0
Sr-89 (Bones) 2 --
Sr-90 (Bones) 2 --
Zn-65 (Bones) -- 20
.1I
I
II
I
I.-II
L
a) Radionuclides will be monitored by EIIAL and concentrations above the listed limits will bereported to KNPP.
b) Concentrations above the listed limits will be reported to NRC as required by REMv 2.4.1.
c) For drinking water samples, this is 40CFR Part 141 value. If no drinking water pathwayexists, a value of 30,000 pCi/l may be used.
Rev. 8Page 2 of 2 09-30-2003
±1I
Ii
IIL

(-,-. I-- F,--, r-- F-, I r --- I As - 7- 1t [--- 1- I I r-i rr[
Table 2.3.1-ADetection Capabilities for Environmental Sample Anulysisa
Lower Limit of Detection (LLD) b6c
I Water Airborne Fish . Food Products SedimentAnalysis } ( Particulate or Milk (pCi/1) (pCi/kg, wet) (pCi/kg, dry)(Pi/) Gases (pCi/rn3) (PCi/kg, Wet)
Gross Beta 4 0.01H -3 000d . _._.._._.._._
Mn-54 15 130 lFe-59 30 260Co-58, 60 15 130Zr-Nb-95 15
1-131 IC 0.07 1 60Cs-134 15 0.05 130 15 60 150Cs-137 18 0.06 150 18 80 180Ba-La-140 15 15Zn-65 30 260
Rev. 8Page 1 of 3 09-30-2003

II -
Table Notations for Table 2.3.1-A
a. This list does not mean that only these nuclides are to be considered. Other peaks that areidentifiable, together with those of the above nuclides, shall also be analyzed and reported in theAnnual Radiological Environment Monitoring Report.
b. Required detection capabilities for thermoluminescent dosimeters used for environmentalmeasurements are given in Regulatory Guide 4.13.
c. The LID is defined, for purposes of these specifications, as the smallest concentration ofradioactive material in a sample that will yield a net count, above system background, that willbe detected with 95% probability with only 5% probability of falsely concluding that a blankobservation represents a "real" signal.
For a particular measurement system, which may include radiochemical separation:
LLD4.66sbE x V x 2.22 x Y x exp(--yAt)
Where:
LLD is the a priori lower limit of detection as defined above, as picocuries per unit mass orvolume,
*Sb is the standard deviation of the background counting rate or of the counting rate of blanksample as appropriate, as counts per minute,
*E is the counting efficiency, as counts per disintegration,
V is the sample size in units of mass or volume,
2.22 is the number of disintegrations per minute per picocurie,
Y is the fractional radiochemical yield, when applicable,
y is the radioactive decay constant for the particular radionuclide, and
At for environmental samples is the elapsed time between sample collection, or end of the samplecollection period, and time of counting,
Typical values of E, V, Y, and At should be used in calculation.
Rev. 8Page 2 of 3 09-30-2003

Table Notations for Table 2.3.1-A (con 't)
It should be recognized that the LLD is defined as a priori (before the fact) limit representing thecapability of a measurement system and not as an a posteriori (after the fact) limit for a particularmeasurement. Analyses shall be performed in such a manner that the stated LIDs will beachieved under routine conditions. Occasionally background fluctuations, unavoidable smallsample sizes, the presence of interfering nuclides, or other uncontrollable circumstances mayrender these LLDs unachievable. In such cases, the contributing factors shall be identified anddescribed in the Annual Radiological Environmental Monitoring Report.
d. If no drinking water pathway exists, a value of 3,000 pCi/I may be used.
e.L LID for drinking water samples. If no drinking water pathway exists, the LLD of gammaisotopic analysis may be used.
Rev. 8Page 3 of 3 09-30-2003

FIGURE 1
Is\d
KIT~~N OK3 tK
i- m I1I A T ? * __ __ __ __ ___ __ ___ _1
-; U -i? I_? ~ ~~~~- 1- * FLU 14 Y
§ _t~t " -25
ai tmwt co " d
z1K-6
NMmI

I TRACKING AND PROCESSING RECORDI
I AnL
LEIL
LI
i -
I
I I
Initiated By: Rick Adams Date: 8/8/03 Dept: RP Ext.: 8360
Document No.: REMM Current Rev. No.: 7 New Rev. No.: 8
Title: REMM
Requested Due /Required Date _
Describe Change(s) . Describe Reason(s)(New Document or Revision- attach commitments. Action Request.l
markup. etc.) .__
REmoved reference to sample location K-37 and I Sample location K-37 was discontinued and replaced withwith K-39 in the following locations: Pg 3-4,it sample location K-39.Radiation and Milk, pg. 3-5 Grass, Table 2.2.1-A, Table AI. wt-2.2.1-B, and Table 2.2.1-C
Page 3-5 Cattelfeed ad soil - changed number of dairy Correct the number of dairy farms we take samples at.farms to the correct value of six.
Page I or 2 Continued on Next Page 3
Expiration Requirement (if applicable) Expiration Date(IPTE, Vendor, Other) -
Activity: E] New 0 Revision E Admin Hoid [l Vendor El NMC El Deletion
Priority: Z Immnediate Action E] Non-Urgent - Perform Later [ Rejected - See Comments
Safety E Yes PORC El Yes SRO Approval - E Yes A NARelated E] No Review El No Temp Changes El No
Level of Use: E Continuous Use E Reference Use El Information Use E NA
Formal Training Affected: El Yes (Send Copy to Training) 3 No
Comments: (add pages as necessary)
Reviewers Requird -Si atur a es: Date - Date
Technical / T-Io El Cross Discipline /
El Minor / _ Oversight (QC) /
I Editorial El Other /
El Validation /
50.59 Applicability Form Attached? 0 Yes 50.59 Screen Form Attached? E5 Yes E No50.59 Pre-Screen Form Attached? E Yes | No .50.59 Evaluation Attached? [: Yes [E No
1) El => Process Owner Review Recommendation 2) 0: M5 A.I6RC Review Recommendation
@ Approval El Disapproval [5Approval E DisapprovalNVYive alidaSpbeview g Yes [: No* NO. 0ce/ts
Proce /owner Signature Date IPa pldnter Signature Data I
Effective Date:
Responsible Manager Review - Directives
. 1
Form GNP-03.01.01-1 Rev. J Date: APR 3 2003 Page 25 of 42
INFORMATION USE

I j
TRACKING AND PROCESSING RECORD
CONTINUATION SHEET
Document No.: REMM Current Rev. No.: 7 New Rev. No.: 8Page 2 of 2
Describe Change (New Document or Revision) Describe Reason
Updated the sample location map Due to new sample arid removal of another, i.e., K-39and K-37 respectively.
Rwvic 4s E Amp
L
hi
LL
L
L1I1I
III.II'II
Form GNP-03.01.01-1 Rev. J Date: APR 3 2003
INFORMATION USE
Page 26 of 42

I.
2.
3.
50.59 APPLICABILITY REVIEW(Is the activity excluded from 50.59 review?)
Document/Activity number 6sxn o 4 e PR M 4\ tABrief description of proposed activity (what is being changed and why):
Does the proposed activity involve or change any of the following documents or processes? Check YES or NO for EACH applicability reviewitem. Explain in comments if necessary. (Ref. NMC 50.59 Resource Manual. Section 41
NOTE If you are unsure if a document or process may be affected. contact the process owner.
iI
Yes No Document or ApplicCbleI Process Rezulat!oo Contact/Aotion.
a t Tcchni'l Specificions or Optrating Ucense IOCFR50.92 Process change per NAD-05.14.Techica Speifiatins o Opratig Lcene IOFRS.92 Contact Licensing.b j Activity/change previously approved by NRC in IOCFRSO.90 Identify NRC letter in comments below. Process change.license amendment or NRC SER Contact licensing for assistance.c O E Activity/change covered by an existing approved IOCFR5O Appendix B Identify screening or evaluation in comrnents below.I OCFRSOS9 review. screenine. or evaluation. Process change.d O Quality Assurance Program (OQAPD/OQAP) IOCFRSO.54{a) Contact QA.
____ ____ ____ ___ Refer to NAD-01 .07.QEmergncy Pbn IOCFR50.54(q) Contact EP.
Emergencuiy Plan lRefer to NAD-05.17.0 ( Security Plan 1 OCFR50.54(p) Contact Securnty.
______________Refer to NAD-05.17.g I STPan 1C15.5l) Contact 1ST process owner.
- - . ~F1~OSa(O Refer to NAD-01.24.h 0 ISIPlan OCFR505a() ontact process owner.a~J Refer to NADs 01.03. 01.05. and 05.1 1.
0 G ECCS Acceptance Criteria IOCFRSO.46 Contact Licensing.- ~USAR or any document incorporated by reference.- Process UISAR change per NEP-05.02.
O | - Check YES only if change is editorial (see I OCFR50.7.1 Conta USAR process owner for asSiStanCe.Attachment A).
, Commitment - Commitment changes associatedk n 1 with a response to Generic Letters and Bulletins, or IOCFRSO Appendix B Contact licensing.
* fdescribed inthe UJSAR reauire a vre-screening. Refer to NAD-05.25.Maintenance activity or new/revised maintenance
I procedure . Check YES only if clearly naintenance I OCF5065 Evaluate under Maintenance Rule.and equipment will be restored to its as-designed Refer to NAD-08.20 and NAD-08.21.condition within 90 da (see Attchment C1. .
. Degraded/Non-conforming plant condition - Check Initiate an Action Request (AR) and evaluate under. o J YES if retumed to as-designed condition in a timely IOCFR5O Appendix B GL 91-18. Revision 1.manner consistent with safety. Contact licensing for assistance. Refer to GNP 11.08.03.New/revised administrative or managerialdirective/procedure (e.g.. NAD. GNP, Fleet
n i Procedure) or a change to any procedure or other IOCFRSO Appendix B Process'proceduretdocument revision.controlled document (e.g.. plant drawing) which isclearly editorialladministrative. See Attachments Aand B.
III
.4. Conclusion. Check one of the following:
O All documents/processes listed above are checked NO. IOCFRS0.59 applies to the proposed acivity. A 50.59 pre-screening shall be performed.6/ One or more of the documents/processes listed above are checked YES. AN controls all aspects of the proposed activity. IOCFR50.59 does NOTapply. Process the change under the applicable program/proccss/procedure.
O One or more of the documents/processes listed above are checked YES, however. some portion of the proposed activity is not controlled by any ofthe above processes. I OCFR50.59 applies to that portion. A 50.59 pre-screening shall be perfonted.
Comments:5.
6. Print name followed by signature. Attach completed form to d ot/activity/chatge pachge.
__ Prepared by:(print/sign) _ .... 1.IL
Reviewed by: ljt.JCH 1 DL / , .(print/sign)
ckiA1 o502Date:
Date: q ) &o-03
Form LafNP-04.0q.01-1 8ev. C Date: JUL 22 2003
INFORMATION USE
Page 13 of 14

Nuclear Management Company Page 1 of 2
Nuclear Management Company Page I of 2
L ,STATE CHANGE HISTORY
Initiate A 11 Submit to Screening Team A 12AR Pre-Screen AR Screening Que
10/13/2003 11:36:44 AM 10/13/2003 1:49:52 PMOwner (None) Owner KNPP CAP Admin
by ADAMS, RICHARD s I by TREPTOW, ETHAN 'q i
SECTION 1
ILLI
Activity Request Id:
Activity Type:
0 One Line Description:
O Detailed Description:
CAP01 8430
CAP Submit Date: 10/13/2003 11:36:44 AM LlAnnual Environmental Monitoring Report Sample Location Maps Not Updated
10/13/2003 11:36:44 AM - ADAMS, RICHARD:The 2002 Annual Environmental Monitoring Report Sample Location Map, page 15 of thereport, did not contain one sample location that had been added to the program. The site wasadded to the program in March of 2002. The site was noted in Revision 7 of the REMM, whichwas also submitted as part of the annual report. This report is submitted to the NRC eachyear. The rest of the report appropriately lists the sample location and shows the results of thesampling during 2002.
In addition, four inactive sample points were still shown on the map on page 15 of the report.These are still valid sample locations, but are no longer being used due to the location owner ILnot participating In the program.
Initiator: ADAMS, RICHARD l Initiator Department: KK Radiation ProtectionI KE a l
Date/irme of Dlscovery: 10/13/2003 10:13:20 AM Date/Time of Occurrence:
Identified By:
Equipment # (1st):
Equipment # (2nd):
Equipment # (3rd):
Site/Unit:
Why did this occur?:
Site-identified
(None)
(None)
(None)
System:
Equipment Type (1st):
Equipment Type (2nd):
Equipment Type (3rd):
10/13/2003 10:13:20 AM
(None)
(None)
(None)
(None)
L
Immediate Action Taken:
Recommendations:
Kewaunee
10/13/2003 11:36:44 AM - ADAMS, RICHARD:The vendor was not provided with an updated copy of the sample location map and their yearend report, with the errant map, was included in the annual report. The monthly review of thevendor results did not identify the need for the vendor to have the updated map. During thistime, the responsible person in the RP organization had changed twice.
10113/2003 11:36:44 AM - ADAMS, RICHARD:The RP Supervisor-ALARA forwarded a copy of the updated map to the vendor withinstructions to incorporate the map into their reports.
10/13/2003 11:36:44AM - ADAMS, RICHARD:The initiator contacted Licensing personnel regarding reportability of this issue. It wasdiscussed that this Is not reportable due to the fact that the consequences of the Inaccurateinformation does not have a significant implication for public health and safety or commondefense and security (10 CFR 50.9).
LL
LL
An action will be needed to note the erred map from the 2002 report during the submission ofthe 203 report. L
0 Notify Me During Eval?: N 0 SRO Review Required?: N
USECTION 2
Operability Status: NA 0 Compensatory Actions: N U
Uhttp://enwsO2/tmtrackltmtrack.dll?IssuePage&Tableld=1000&Recordld=538378&Templ... 1 1/21/2003

Nuclear Management Company Page 2 of 2
Basis for Operability: 10/13/2003 1:49:52 PM -TREPTOW, ETHAN:Administrative Issue with errors on the sample location maps. No affect on plant equipment oroperation. No operability concerns. Not immediately reportable to the NRC.
0 Unplanned TSAC Entry: N 0 External Notification: N
SECTION 3
L Screened?: Y 0 Significance Level: C
INPO OE Reqd?: N Potential MRFF?: N
L 0 OA/Nuclear Oversight?: N 0 Licensing Review?: N
Good Catch/Well Doc'd?: NA
I.
L SECTION 4
Inappropriate Action:
Process: (None) Activity: (None)
Human Error Type: (None) Human Perf Fail Mode: (None)
Equip Failure Mode: (None) Process Fall Mode: (None)
Org/Mgt Failure Mode: (None) 0 Group Causing Prob: (None)
Hot Buttons: (None)
ATTACHMENTS AND PARENT/CHILD LINKS
; Principal to CA01 3923: Annual Environmental Monitoring Report Sample Location Maps Not Updated
CHANGE HISTORY
- 10/13/2003 4:17:26 PM by VANVALKENBURG, TERRYLast Modifier Changed From TREPTOW, ETHAN To VANVALKENBURG, TERRYPrescreen Comments Changed From "To (Appended:] CA to RP'
10/1 4/2003 9:18:19 AM by WALESH, DEBRALast Modified Date Changed From 10/13/2003 4:17:26 PM To 10/14/2003 9:18:19 AMLast Modifier Changed From VANVALKENBURG, TERRY To WALESH, DEBRAoriginaLproject-ld Changed From 0 To 51origina~lssueld Changed From " To 01 8430'
10/14/2003 9:18:50 AM by WALESH,'DEBRALast Modified Date Changed From 10/14/2003 9:18:19 AM To 10/14/2003 9:18:50 AM
L Attachment Added: Principal to CA01 3923: Annual Environmental Monitoring Report Sample Location Maps Not Updated10/14/2003 10:42:00 AM by WALESH, DEBRA
Screened? Changed From N To YL Last Modified Date Changed From 10/14/2003 9:18:50 AM To 10/14/2003 10:42:00 AM
http://enwsO2/tmtrackltmtrack.dllIssuePage&TableId=1000&Recordld=538378&Templ ... 11/21/2003

II
Nuclear Management Company Page 1 of 2
STATE CHANGE HISTORY
initiate A -. Assign XAssign Work Conduct Work
10/14/2003 9:18:50 AM IS 10/14/2003 9:25:47 AMOwner SCHMIDLI, THOMAS Owner ADAMS, RICHARD
by WALESH, DEBRA q P by SCHMIDLI, THOMAS 'q P
SECTION 1
Activity Request Id: CA013923
Activity Type: Corrective Action Submit Date: 10/14/2003 9:18:50 AM
Site/Unit: Kewaunee
O One Line Description: Annual Environmental Monitoring Report Sample Location Maps Not Updated
Activity Requested: Take corrective actions as required to resolve condition identified in CAP 18430.
0 CATPR: N 0 Mode Change Restraint: (None)
Initiator: ADAMS, RICHARD 6i1 Initiator Department: KK Radiation ProtectionKE 2
Responsible Group Code: KKO Rad Protection Field Responsible Department: PlantOps KE Z
Activity Supervisor: SCHMIDLI, THOMAS 1i1 Activity Performer: ADAMS, RICHARD
SECTION 2
Priority: 4 Due Date: 8/9/2004
Management Exception From PI?: N 0 OA/Nuclear Oversight?: N
0 Licensing Review?: N NRC Commitment?: N
0 NRC Commitment Date: 0 Significance Level: C
SECTION 3
Activity Completed:
Hot Buttons: (None)
SECTION 4
GA Supervisor: (None) Licensing Supervisor: (None)
ATTACHMENTS AND PARENT/CHILD LINKS
'D Subtask from CAP01 8430: Annual Environmental Monitoring Report Sample Location Maps Not Updated
CHANGE HISTORY
10/14/2003 9:25:47 AM by SCHMIDLI, THOMASActivity Performer Changed From (None) To ADAMS, RICHARD
L
LI1IiI
III
IIII1LL
http://enwsO2/tmtrack/tmtrack.dll?IssuePage&TableId=1000&Recordld=538835&Templ ... 11/21/2003

Nuclear Management Company Page 2 of 2
Priority Changed From (None) To 4L Due Date Changed From Unassigned To 8/912004State Changed From Assign Work To Conduct Work Via Transhion: AssignOwner Changed From SCHMIDLI, THOMAS To ADAMS, RICHARDAssigned Date Changed From Unassigned To 10114/2003
L *Last Modified Date Changed From 10/14/2003 9:18:51 AM To 10114/2003 9:25:47 AMLast Modifier Changed From WALESH, DEBRA To SCHMIDLI, THOMAS
I Last State Change Date Changed From 10/14/2003 9:18:50 AM To 10/14/2003 9:25:47 AML Last State Changer Changed From WALESH, DEBRA To SCHMIDLI, THOMAS
http://enwsO2/ltmtrackltmtrack.dllIssuePage&Tableld=1OOO&RecordId=538835&Templ ... 11/21/2003