key elements of sectoral recovery and resilience after … · key elements of sectoral recovery and...
TRANSCRIPT
KEY ELEMENTS OF SECTORAL RECOVERY AND RESILIENCE
AFTER THE CANTERBURY EARTHQUAKES: A SYSTEM
DYNAMICS APPROACH
A thesis submitted in partial fulfilment of the requirements for the Degree
of Doctor of Philosophy
in the Civil and Natural Resources Engineering Department
by Hlekiwe Kachali
University of Canterbury
2013

Key elements of sectoral recovery and resilience after the Canterbury earthquakes: A system dynamics approach
Hlekiwe Kachali
iii
Preface
This work has come about through the contribution of many individuals and many events.
I came to Christchurch, a few days before the 4 September 2010 earthquake, with a general idea
of what my research would be. That changed on 4th September 2010 at 4:35am when greater
Christchurch had the first in a series of earthquakes of MW 7.1. From a research perspective, the
earthquakes brought about an invaluable research environment. However, for greater
Christchurch, it was a sad moment.
In Christchurch I have seen the power that nature holds and that nature can wield. As I write
this, it feels good to know that whatever the setbacks, Christchurch is on the way to recovering.
Cantabrians, whatever the circumstances they have lived through and because of that experience,
are determined to define for themselves who they are and who they should be.

iv Preface

Key elements of sectoral recovery and resilience after the Canterbury earthquakes: A system dynamics approach
Hlekiwe Kachali
v
Acknowledgements
There are so many others who have contributed in so many ways to the completion of this
thesis. Thank you.
To my supervisors: Dr. Erica Seville, Associate Professor John Vargo and Professor David
Elms. This thesis has involved the combination of many facets and each of you has provided a
significant and unique contribution which I am greatly indebted for. As well as your guidance in
the technical aspects of this research, you also have had a positive impact in my personal
development for which I am further grateful to you all.
Thank you to the other of the 3 PhDs, what a journey.
Thanks to Drs. Tom Wilson, Barry Newell, Margaret Rossiter and Derek Roger for their
invaluable comments on some of my thoughts.
To all my friends scattered across the globe; thank you for putting up with my ramblings and for
keeping me sane.
Many thanks to all the people who allowed me to interview them while they were in the midst of
sorting through the chaos after the earthquakes. Thanks also to all the organisations and
interviewees without whom it would not have been possible to come to these conclusions.
Without their cooperation and help this research would not have been.
To my family for putting up with my being in places that made you lose sleep at night: naonga.
To mum who made me believe that I could scale any heights and whose advice is even more
useful today, I know you would have been so proud of me.

vi Acknowledgements
Key elements of sectoral recovery and resilience after the Canterbury earthquakes: A system dynamics approach
Hlekiwe Kachali
vii
Abstract
The Canterbury region of New Zealand experienced four earthquakes greater than MW 6.0
between September 2010 and December 2011. This study employs system dynamics as well as
hazard, recovery and organisational literature and brings together data collected via surveys, case
studies and interviews with organisations affected by the earthquakes. This is to show how
systemic interactions and interdependencies within and between industry and geographic sectors
affect their recovery post-disaster. The industry sectors in the study are: construction for its role in
the rebuild, information and communication technology which is a regional high-growth industry,
trucking for logistics, critical infrastructure, fast moving consumer goods (e.g. supermarkets) and hospitality
to track recovery through non-discretionary and discretionary spend respectively. Also in the
study are three urban centres including the region’s largest Central Business District, which has
been inaccessible since the earthquake of 22 February 2011 to the time of writing in February
2013.
This work also highlights how earthquake effects propagated between sectors and how sectors
collaborated to mitigate difficulties such as product demand instability. Other interacting factors
are identified that influence the recovery trajectories of the different industry sectors. These are
resource availability, insurance payments, aid from central government, and timely and quality
recovery information.
This work demonstrates that in recovering from disaster it is crucial for organisations to identify
what interacting factors could affect their operations. Also of importance are efforts to reduce
the organisation’s vulnerability and increase their resilience to future crises and in day-to-day
operations.
Lastly, the multi-disciplinary approach to understanding the recovery and resilience of
organisations and industry sectors after disaster, leads to a better understanding of effects as well
as more effective recovery policy.

viii Abbreviations
Abbreviations
BRT (BRT-53) – Benchmark Resilience Tool (complete version)
BRT-13 - Benchmark Resilience Tool (short version)
CAS – Complex Adaptive Systems
CBD – Central Business District
CCC – Christchurch City Council
CCDU – Central City Development Unit
CERA – Canterbury Earthquake Recovery Authority
CDEM – Civil Defence and Emergency Management
CLD – Causal Loop Diagram
CREDS – Canterbury Regional Economic Development Strategy
ECan – Environment Canterbury
EQC – Earthquake Commission
FMCG – Fast Moving Consumer Goods
ICT – Information and Communication Technology
MCDEM – Ministry of Civil Defence and Emergency Management
MMI – Modified Mercalli Intensity (depicting severity of shaking in an earthquake)
MW – Moment Magnitude (measuring the amount of energy released by an earthquake)
REAG – Resilience Expert Advisory Group
RRC – Recovery Rate Coefficient
SD – System Dynamics
TISN – Trusted Information Sharing Network

Key elements of sectoral recovery and resilience after the Canterbury earthquakes: A system dynamics approach
Hlekiwe Kachali
ix
Definitions used in this thesis
Business-as-usual – organisational and sectoral conditions pre-earthquakes
Contextual interviews – interviews with industry and business leaders, recovery agency
representatives to establish the background and context in which organisational and sectoral
recovery was taking place after the Canterbury earthquakes of 2010 – 2011
Effective - the intended and actual outcomes are the same
Failure - when a system component does not fulfil its intended purpose in a certain timeframe
(Leveson, 1986, p. 128)
Industry sector (sector) - a group of organisations that operate in the same segment of the
economy or share a similar business type are characterised as making up an industry sector
Organisation - collections of people joining together in some formal association in order to
achieve group or individual objectives (Dawson, 1992, p. xviii). Organisations in this study
include for-profits, not-for-profits and government departments. Organisation and business will
be used interchangeably in this thesis
Organisational crisis - threat to the organization's reputation and viability (Pearson & Mitroff,
1993, p. 49)
Organisational crisis management - the efforts by an organisation and external parties to
prevent crises or to manage effectively crises that arise
Organisational or sectoral recovery - when an organisation or sector can function and sustain
itself (continually) in its new post-disaster environment
Organisational resilience - the ability to survive crisis and thrive in a world of uncertainty
Seville et al (2008, p. 18)
Risk - the effect of uncertainty on objectives - positive and/or negative (AS/NZS ISO
31000:2009, p. 1)
x Abbreviations
Societal crisis - a serious disruption of the functioning of a community or a society involving
widespread human, material, economic or environmental losses and impacts, which exceeds the
ability of the affected community or society to cope using its own resources (UNISDR, 2009a,
p. n. pag)
Supply web – a supply chain implies a linear relationship between a focal organisation,
suppliers, customers and infrastructure used to manufacture/produce and deliver goods and
services. From a system dynamics point of view, the interactions between these system actors is
non-linear, hence the idea of the supply web.
System - an assemblage or combination of things or parts forming a complex or unitary whole
(R. A. Johnson, Kast, & Rosenzweig, 1964, p. 367)
System delays and environmental time delays - a system delay is caused by a lag in the effect
of one system element on another. In the time horizon for this thesis, the system delays are not
yet evident. Environmental time delays are those in the system’s environment that have an effect
on the system.
Key elements of sectoral recovery and resilience after the Canterbury earthquakes: A system dynamics approach
Hlekiwe Kachali
xi
Table of contents
Preface .................................................................................................................................................................. iii
Acknowledgements ................................................................................................................................................. v
Abstract ............................................................................................................................................................... vii
Abbreviations ..................................................................................................................................................... viii
Definitions used in this thesis ...............................................................................................................................ix
Table of contents ....................................................................................................................................................xi
Table of tables ...................................................................................................................................................... xxi
Table of figures ...................................................................................................................................................... ii
1 Introduction ................................................................................................................................................... 1
1.1 Canterbury and Christchurch ............................................................................................................... 1
1.2 Brief history of seismic risk and activity in New Zealand .................................................................... 2
1.3 The Canterbury series of earthquakes ................................................................................................... 3
1.3.1 4 September 2010 earthquake ........................................................................................................... 3
1.3.2 22 February 2011 earthquake ........................................................................................................... 3
1.3.3 13 June 2011 earthquakes ................................................................................................................. 4
1.4 The disaster management cycle ............................................................................................................. 4
1.5 Sectoral and organisational disaster resilience and recovery ................................................................ 5
1.6 The Resilient Organisations research programme ................................................................................ 6
1.7 Thesis arrangement ............................................................................................................................... 7
1.8 Chapter summary ................................................................................................................................. 9
2 A review of the literature ............................................................................................................................. 11
2.1 Crisis, disaster and catastrophe .......................................................................................................... 11
2.1.1 Different degrees of reach and consequences .................................................................................. 12
2.2 Systems theory, systems thinking and systems practise ..................................................................... 13
2.2.1 Complex Adaptive Systems (CASs) ............................................................................................... 17
xii Table of Contents
2.2.2 System dynamics frameworks and modelling .................................................................................20
2.3 Organisational crisis management .....................................................................................................22
2.3.1 Organisations and risk ...................................................................................................................23
2.3.2 The inevitability of crises? ..............................................................................................................24
2.3.3 The build-up and progression of crises in organisations ................................................................27
2.4 Adaptation and learning .....................................................................................................................30
2.4.1 Organisational adaptability ............................................................................................................30
2.4.2 Learning ..........................................................................................................................................31
2.4.3 Possible impediments to preparation for crises ...............................................................................33
2.4.4 Inter-organisational and inter-sectoral dependencies .....................................................................34
2.5 Recovery ..............................................................................................................................................35
2.5.1 Sectoral and organisational recovery ..............................................................................................37
2.5.2 Organisational recovery after disaster ............................................................................................37
2.6 Framework for recovery after disaster .................................................................................................44
2.7 Organisational resilience ....................................................................................................................46
2.8 Organisational disaster resilience .......................................................................................................50
2.8.1 The need for organisations to be disaster resilient ..........................................................................51
2.8.2 Organisational resilience – from theory to application ...................................................................52
2.8.3 Measuring organisational resilience ...............................................................................................54
2.8.4 The case for investment in organisational disaster resilience .........................................................59
2.9 The frame of reference for this research ...............................................................................................60
2.10 Research Aims .....................................................................................................................................62
2.11 Research Questions .............................................................................................................................62
2.12 Chapter summary ...............................................................................................................................63
3 Research methods and design.......................................................................................................................65
3.1 Sample group ......................................................................................................................................66
3.2 Industry sectors ..................................................................................................................................68
3.2.1 Building suppliers ..........................................................................................................................68
3.2.2 Critical infrastructure ....................................................................................................................69
3.2.3 Fast Moving Consumer Goods (FMCG) ........................................................................................69
Key elements of sectoral recovery and resilience after the Canterbury earthquakes: A system dynamics approach
Hlekiwe Kachali
xiii
3.2.4 Hospitality (bars, cafes, restaurants) .............................................................................................. 69
3.2.5 Information and Communication Technology (ICT) ...................................................................... 70
3.2.6 Trucking ......................................................................................................................................... 70
3.3 Geographic locales ............................................................................................................................... 70
3.3.1 Christchurch Central Business District (CBD) ............................................................................. 71
3.3.2 Kaiapoi Town Centre ...................................................................................................................... 71
3.3.3 Lyttelton Town Centre ................................................................................................................... 71
3.4 Data collection .................................................................................................................................... 72
3.4.1 Research instruments and methods ................................................................................................ 72
3.4.2 Research timeline ............................................................................................................................ 74
3.4.3 Surveys ........................................................................................................................................... 76
3.4.4 Semi-structured interviews ............................................................................................................ 79
3.5 Data processing and analysis .............................................................................................................. 83
3.5.1 Grand theory................................................................................................................................... 83
3.5.2 Grounded theory ............................................................................................................................. 83
3.5.3 System dynamics modelling ........................................................................................................... 85
3.5.4 Data preparation ............................................................................................................................. 89
3.6 Chapter summary ............................................................................................................................... 90
4 Contextual interviews ................................................................................................................................. 92
4.1 Contextual interview overview ........................................................................................................... 93
4.2 Industry sectors .................................................................................................................................. 95
4.2.1 Building suppliers .......................................................................................................................... 95
4.2.2 Critical infrastructure .................................................................................................................... 96
4.2.3 Fast Moving Consumer Goods (FMCG) ........................................................................................ 97
4.2.4 Hospitality ...................................................................................................................................... 98
4.2.5 Information and Communication Technology (ICT) ...................................................................... 99
4.2.6 Trucking ....................................................................................................................................... 100
4.3 Geographic locales ............................................................................................................................. 101
4.3.1 Christchurch Central Business District (CBD) ........................................................................... 101

xiv Table of Contents
4.3.2 Kaiapoi Town Centre ....................................................................................................................102
4.3.3 Lyttelton Town Centre .................................................................................................................103
4.4 Emergent themes from contextual interviews ...................................................................................103
4.4.1 Pre-existing sectoral conditions and attributes ............................................................................104
4.4.2 Factors that aided recovery ...........................................................................................................105
4.4.3 Factors that hindered recovery ......................................................................................................106
4.4.4 Lessons ..........................................................................................................................................107
4.4.5 Challenges and opportunities .......................................................................................................107
4.4.6 Industry representation after the earthquakes ..............................................................................108
4.4.7 Recovery goals and recovery of the Christchurch central business district (CBD) ......................109
4.5 Chapter summary .............................................................................................................................110
5 Surveys ......................................................................................................................................................114
5.1 Survey 1 (deployed 17 November 2010 to 18 February 2011) ..........................................................116
5.2 Survey 2 (deployed 31 May 2011 to 18 September 2011) .................................................................128
5.3 Survey 3 (deployed 12 March 2012 to 19 May 2012).......................................................................141
5.4 Sectoral challenges ............................................................................................................................152
5.4.1 Synopsis of results - temporal trends across sectors .....................................................................155
5.5 Organisational resilience using the Benchmark Resilience Tool (BRT) ...........................................159
5.6 Chapter summary .............................................................................................................................165
6 Case studies ...............................................................................................................................................169
6.1 Case study organisations ..................................................................................................................170
6.2 Synopsis of the case studies ...............................................................................................................188
6.3 Main dimensions and sub-themes emergent after analysis of case study data..................................192
6.4 Organisational actions in the response phase ...................................................................................194
6.5 Differing interpretations of pre-disaster preparedness: active versus passive measures ...................196
6.5.1 Plans as fantasy documents ..........................................................................................................197
6.5.2 Prior crisis or disaster experience .................................................................................................198
6.5.3 Post-disaster key ‘learnings’ .........................................................................................................199
6.5.4 Organisational resilience ..............................................................................................................200

Key elements of sectoral recovery and resilience after the Canterbury earthquakes: A system dynamics approach
Hlekiwe Kachali
xv
6.6 Wellbeing .......................................................................................................................................... 201
6.6.1 Staff wellbeing .............................................................................................................................. 201
6.6.2 Family wellbeing .......................................................................................................................... 202
6.6.3 Community wellbeing .................................................................................................................. 203
6.7 Location ............................................................................................................................................. 203
6.7.1 Neighbour effects .......................................................................................................................... 204
6.7.2 Damage to organisation's assets................................................................................................... 204
6.7.3 Size of the (regional) economy ...................................................................................................... 205
6.7.4 Localisation of damage .................................................................................................................. 205
6.7.5 Duration of closure ....................................................................................................................... 206
6.7.6 Rent or ownership of premises ...................................................................................................... 206
6.8 Access to resources ............................................................................................................................ 207
6.8.1 Insurance ...................................................................................................................................... 208
6.8.2 Financial resources ....................................................................................................................... 208
6.8.3 Manpower ..................................................................................................................................... 209
6.8.4 Physical resources ......................................................................................................................... 210
6.8.5 Replacement supplies and raw materials ...................................................................................... 210
6.8.6 Efficient and effective use of resources .......................................................................................... 211
6.9 Leadership ......................................................................................................................................... 211
6.9.1 Organisation ownership structure ............................................................................................... 212
6.9.2 Communication ............................................................................................................................ 213
6.9.3 Recognising and grasping opportunity ........................................................................................ 214
6.9.4 Sectoral leadership ........................................................................................................................ 214
6.9.5 Leadership of the overall recovery effort ....................................................................................... 215
6.10 Industry sector attributes ................................................................................................................. 215
6.10.1 Type of goods and services provided......................................................................................... 216
6.10.2 Make-up for lost production ..................................................................................................... 217
6.11 Variety and diversity ........................................................................................................................ 217
6.11.1 Sources of revenue .................................................................................................................... 218

xvi Table of Contents
6.11.2 Geographic or locational ...........................................................................................................218
6.11.3 Delivery of goods and services ..................................................................................................218
6.12 Information .......................................................................................................................................219
6.12.1 Official sources of information .................................................................................................219
6.12.2 Sources of economic information ..............................................................................................220
6.12.3 Engineering and technical sources ...........................................................................................220
6.13 Sectoral comparisons .........................................................................................................................220
6.14 Chapter summary .............................................................................................................................224
7 Significant contributors to sectoral and organisational short-term recovery ............................................226
7.1.1 Disaster management cycle – response and short-term recovery .................................................227
7.2 Determinants of short-term recovery and their relative magnitudes ................................................229
7.3 Short-term recovery rate coefficient (Short-term RRC) ....................................................................230
7.4 Contributors to sectoral and organisational short-term recovery .....................................................234
7.4.1 Regression and correlation............................................................................................................237
7.4.2 Overview ......................................................................................................................................239
7.4.3 Pre-earthquake characteristics as a contributor ............................................................................239
7.4.4 The Benchmark Resilience Tool (BRT-53) organisational resilience score as a contributor to short-
term recovery .............................................................................................................................................244
7.4.5 Direct and indirect earthquake effects...........................................................................................247
7.4.6 Combined influence of components of short-term recovery ..........................................................254
7.5 Change in customer base as a significant contributor to organisational short-term recovery (from R2
values) 259
7.6 Influence of geographic location on organisational short-term recovery...........................................261
7.7 Signifiers of sectoral and organisational short-term recovery after the 2010-2011 Canterbury
earthquakes .....................................................................................................................................................262
7.7.1 Time, recovery rate and short-term recovery trajectory ...............................................................264
7.7.2 An important note for crisis managers, emergency managers and recovery leaders ....................266
7.8 Chapter summary .............................................................................................................................266
8 System dynamics of sectoral and organisational recovery .........................................................................270
8.1 Sectoral response phase .....................................................................................................................276
Key elements of sectoral recovery and resilience after the Canterbury earthquakes: A system dynamics approach
Hlekiwe Kachali
xvii
8.1.1 Overview of inter-sectoral effects in the response phase ............................................................... 276
8.1.2 Trucking, critical infrastructure, FMCG and Christchurch CBD ............................................... 282
8.1.3 Christchurch CBD, Kaiapoi Town Centre, Lyttelton Town Centre, hospitality, building suppliers
and ICT ...................................................................................................................................................... 288
8.2 Sectoral short-term recovery phase ................................................................................................... 292
8.2.1 Overview of inter-sectoral effects ................................................................................................. 292
8.2.2 Trucking, critical infrastructure, Christchurch CBD and FMCG ............................................... 294
8.2.3 Christchurch CBD, Kaiapoi Town Centre, Lyttelton Town Centre, hospitality, building suppliers
and ICT ...................................................................................................................................................... 296
8.3 Modelling organisational recovery ................................................................................................... 299
8.4 System behaviour influencing recovery ............................................................................................ 304
8.4.1 Interactions between system elements .......................................................................................... 305
8.4.2 Environmental time delays ........................................................................................................... 305
8.4.3 Mismatches ................................................................................................................................... 307
8.4.4 Uncertainty .................................................................................................................................. 308
8.4.5 Hierarchy and self-organisation ................................................................................................... 309
8.4.6 Resilience ...................................................................................................................................... 310
8.5 Chapter summary ............................................................................................................................. 312
9 Aids, hindrances and points of intervention in recovery ........................................................................... 314
9.1 Aids to recovery ................................................................................................................................ 316
9.1.1 Buffering ....................................................................................................................................... 316
9.1.2 The scale and reach of the earthquake damage .............................................................................. 317
9.1.3 Creation of the Canterbury Earthquake Recovery Authority (CERA) ......................................... 317
9.1.4 Other Government actions ........................................................................................................... 317
9.1.5 Organisation’s knowledge of supply web ..................................................................................... 318
9.1.6 Organisational networking .......................................................................................................... 319
9.2 Hindrances to recovery ..................................................................................................................... 319
9.2.1 Delays ........................................................................................................................................... 319
9.2.2 Uncertainty .................................................................................................................................. 319

xviii Table of Contents
9.2.3 Lack of information (and communication) ....................................................................................320
9.2.4 Official cordon around Christchurch CBD Red Zone ..................................................................321
9.2.5 Flow of financial resources ............................................................................................................322
9.2.6 Organisational supply web vulnerabilities ...................................................................................323
9.2.7 Limiting factors (resources) ..........................................................................................................324
9.3 Points of intervention in recovery: From research to practise ..........................................................324
9.4 Actions by organisations and sectors ................................................................................................325
9.4.1 Investment in staff ........................................................................................................................325
9.4.2 Organisational or sectoral leadership in crisis and leadership wellbeing .....................................325
9.4.3 Investigation, analysis and application of lessons ........................................................................326
9.4.4 Preparedness for all hazards .........................................................................................................327
9.4.5 Involvement of organisations and sectors as part of the core recovery strategy ...........................329
9.5 Infrastructure used by organisations ................................................................................................330
9.5.1 Physical infrastructure .................................................................................................................330
9.5.2 Supply web ...................................................................................................................................330
9.6 Environmental factors .......................................................................................................................331
9.6.1 Role of recovery leaders and agencies ...........................................................................................331
9.6.2 Regional and national economies ..................................................................................................332
9.6.3 Information ...................................................................................................................................332
9.6.4 Communication ............................................................................................................................332
9.6.5 Policy ............................................................................................................................................333
9.6.6 Subsidies and incentives ...............................................................................................................334
9.7 Critical success factors for organisational and sectoral recovery after the 2010-2011 Canterbury
earthquakes .....................................................................................................................................................334
9.8 Chapter summary .............................................................................................................................336
10 Sectoral and organisational disaster resilience ..........................................................................................338
10.1 Sectoral disaster resilience indicators - using the Benchmark Resilience Tool (BRT-53 and BRT-13)
340
10.1.1 Sectoral indicator score differences - overview .........................................................................343
10.1.2 Building suppliers ....................................................................................................................344

Key elements of sectoral recovery and resilience after the Canterbury earthquakes: A system dynamics approach
Hlekiwe Kachali
xix
10.1.3 Critical infrastructure .............................................................................................................. 345
10.1.4 FMCG ...................................................................................................................................... 345
10.1.5 Hospitality................................................................................................................................ 346
10.1.6 ICT ........................................................................................................................................... 346
10.1.7 Trucking ................................................................................................................................... 347
10.1.8 Christchurch CBD ................................................................................................................... 347
10.1.9 Kaiapoi Town Centre ............................................................................................................... 347
10.1.10 Lyttelton Town Centre ............................................................................................................. 348
10.2 Sectoral disaster resilience indicators - using information from impact data, contextual interviews
and case studies .............................................................................................................................................. 349
10.3 Contrast of similar indicators of disaster resilience from quantitative data (using the Benchmark
Resilience Tool - BRT) and from qualitative data (using interview responses) ............................................. 351
10.4 Evolution of the Benchmark Resilience Tool (BRT-53) .................................................................... 353
10.4.1 Proposed supplementary organisational disaster resilience module for the Benchmark Resilience
Tool (BRT) ................................................................................................................................................. 356
10.4.2 Benchmark Resilience Tool-53 (BRT-53) and Benchmark Resilience Tool-13 (BRT-13) ........ 357
10.4.3 REAG and Resilient Organisations: BRT model comparison.................................................. 359
10.5 Organisational disaster resilience and organisational recovery ........................................................ 360
10.5.1 Linking disaster resilience and recovery .................................................................................. 362
10.5.2 Leading versus lagging indicators of organisational disaster resilience .................................. 363
10.6 Sectoral disaster resilience ................................................................................................................ 364
10.7 Chapter summary ............................................................................................................................. 366
11 Summary and conclusions ......................................................................................................................... 368
11.1 Research findings .............................................................................................................................. 368
11.2 Research recommendations ............................................................................................................... 371
11.3 Future work ...................................................................................................................................... 374
11.3.1 Continual improvement of the Benchmark Resilience Tool BRT-53 ........................................ 374
11.3.2 Survivor bias ............................................................................................................................ 374
11.3.3 Comparison of recovery processes for different disasters.......................................................... 375
11.3.4 Investigate the interaction of employee, community and organisational disaster resilience .... 375
xx Table of Contents
11.3.5 Quantification of the system dynamics models ........................................................................375
12 References ..................................................................................................................................................376
13 Appendices .................................................................................................................................................395
13.1.1 Appendix A – Informed interview consent form ......................................................................395
13.1.2 Appendix B - Contextual interview guide ...............................................................................395
13.1.3 Appendix C - Survey 1 results extra tables ..............................................................................395
13.1.4 Appendix D – Survey 2 results extra tables.............................................................................395
13.1.5 Appendix E – Survey 3 results extra tables .............................................................................395
13.1.6 Appendix F – Organisational resilience sectoral indicator scores ............................................395
13.1.7 Appendix G – Questions for level of impact and Closure Impact Factor .................................395
13.1.8 Appendix H – Case Study Interview Guide .............................................................................395
13.1.9 Appendix I – Additional analysis by organisational size - using full-time equivalent (FTE) staff
count 395
13.1.10 Appendix J – Additional Analysis - System Dynamics Quantified Stock and Flow of
Organisational Recovery ...........................................................................................................................395
13.1.11 Appendix K – Survey 1 Questionnaire ....................................................................................395
13.1.12 Appendix L – Survey 2 Questionnaire .....................................................................................395
13.1.13 Appendix M - Survey 3 Questionnaire ....................................................................................395
13.1.14 Appendix N – Alternative techniques for arriving at the significant contributors to recovery
395
13.1.15 Appendix O - List of additional publications produced during the course of this research......395
Key elements of sectoral recovery and resilience after the Canterbury earthquakes: A system dynamics approach
Hlekiwe Kachali
xxi
Table of tables
Table 2-1: The sequence of events associated with a failure of foresight ............................................................... 28
Table 2-2: Definitions of recovery from different research areas and disciplines .................................................. 36
Table 2-3: Definitions of resilience from different disciplines and research areas ................................................ 49
Table 2-4 - Pillars and indicators of organisational resilience .............................................................................. 55
Table 2-5: Newer model of organisational resilience ............................................................................................. 56
Table 3-1: Final list of industry sectors selected for the study .............................................................................. 67
Table 3-2: Research aims, research questions and research methods matrix ........................................................ 73
Table 3-3: Industry sector and endorsing organisation ........................................................................................ 79
Table 3-4: Comparison of the grounded theory paradigm, the case study interview guide used in this thesis and
systems thinking concepts. ................................................................................................................................... 90
Table 4-1: List of contextual interview organisations and brief descriptions ....................................................... 93
Table 5-1: Survey deployment timeline and response rates ................................................................................ 115
Table 5-2: Sectoral response rates for Surveys 1, 2 and 3 ................................................................................... 115
Table 5-3: Affected organisations after the 4 September 2010 earthquake including organisations that reported
closure* ............................................................................................................................................................... 117
Table 5-4: Organisational revenue change and use of new suppliers after the 4 September 2010 earthquake* .. 118
Table 5-5: Change in customer base after the 4 September 2010 earthquake* .................................................... 120
Table 5-6: Type of insurance* ............................................................................................................................. 121
Table 5-7: Organisational recovery finance options after 4 September 2010* .................................................... 123
Table 5-8: Staff redundancy and hire after 4 September 2010 earthquake* ........................................................ 124
Table 5-9: Sectoral degree of effect (for organisations that reported being affected) after the 4 September 2010
earthquake* ......................................................................................................................................................... 126
Table 5-10: Sectoral mitigation factor effect (for organisations that reported using these measures) after 4
September 2010* ................................................................................................................................................. 127
Table 5-11: Per cent of organisations reporting being affected or not affected* .................................................. 129
Table 5-12: Closure period following 4 September 2010 and 22 February 2011 earthquakes* ........................... 130
Table 5-13: Percentage of organisations in each sector and reported revenue changes* ..................................... 131
Table 5-14: Per cent of organisations in each sector and means of recovery finance* ......................................... 132
Table 5-15: Staff redundancy and hire after 22 February 2011* ........................................................................ 133
Table 5-16: Closure* factors after 22 February 2012 earthquake – per cent of organisations by sector** .......... 134
Table 5-17: Per cent of organisations, by sector, reporting disruption from non-utilities* ................................ 136
Table 5-18: Degree of effect to sector (for organisations that reported being disrupted) after disruption of non-
utilities* .............................................................................................................................................................. 138
Table 5-19: Disruption (by per cent of sector) and degree of effect (for organisations that reported being
disrupted) - utilities ............................................................................................................................................ 140
Table 5-20: Organisations intending to re-open, open/trading or permanently closed* .................................... 142
Table 5-21: Organisations relocated or not after any of the earthquakes** ......................................................... 144
Table 5-22: Organisations reporting the need to use new suppliers** ................................................................ 145
xxii Table of Tables
Table 5-23: Insurance type** ..............................................................................................................................146
Table 5-24: Organisational cash flow** ..............................................................................................................148
Table 5-25: Organisational revenue change* ......................................................................................................149
Table 5-26: Full-time staff voluntarily leaving** ................................................................................................150
Table 5-27: Staff redundancy and hire** .............................................................................................................151
Table 5-28: Self-report performance of organisations pre- and post-earthquake** ..............................................152
Table 5-29: Sectoral biggest challenges after Surveys 1, 2 and 3 ........................................................................154
Table 5-30: Comparison of sectoral revenue changes after 4 September 2010 earthquake (data from Survey 1)
and 22 February 2011 earthquake (data from after Survey 2) ............................................................................157
Table 5-31: Survey 1 sectoral resilience scores using the Benchmark Resilience Tool (BRT)* ...........................162
Table 5-32: Survey 2 sectoral resilience scores using the Benchmark Resilience Tool (BRT) ............................163
Table 5-33: Survey 3 average sectoral resilience score using the Benchmark Resilience Tool (BRT) .................164
Table 6-1: Relevant survey data to complement synopsis of case study organisations* .....................................190
Table 6-2: Headings of the emergent main dimensions and sub-themes from the case studies of organisational
and sectoral recovery after the 2010 and 2011 Canterbury earthquakes, arrived at using the grounded theory
method after analysis of the case study data .......................................................................................................193
Table 7-1: Short-term recovery rate coefficient (short-term RRC) by per cent of organisations in each sector after
Survey 2 ..............................................................................................................................................................233
Table 7-2: Short-term recovery rate coefficient (RRC) by per cent of organisations in each sector after Survey 3
............................................................................................................................................................................234
Table 7-3: Guidelines on interpretation of Pearson's r values ............................................................................238
Table 7-4: R2 values for pre-earthquake contributors and short-term recovery rate coefficient (short-term RRC)
............................................................................................................................................................................243
Table 7-5: Correlation (r) values for pre-earthquake components and short-term recovery rate coefficient (short-
term RRC) ..........................................................................................................................................................243
Table 7-6: R2 values for resilience contributors and short-term recovery rate coefficient (short-term RRC) .....246
Table 7-7: Correlation (r) values for resilience components and short-term recovery rate coefficient (short-term
RRC) ...................................................................................................................................................................246
Table 7-8: R2 values for direct and indirect earthquake effects and short-term recovery rate coefficient (short-
term RRC) ..........................................................................................................................................................253
Table 7-9: Correlation (r) values for direct and indirect earthquake effects components and short-term recovery
rate coefficient (short-term RRC) .......................................................................................................................254
Table 7-10: All R2 values for the components of short-term recovery .................................................................255
Table 7-11: R2 value for composite pre-earthquake contributor against short-term recovery rate coefficient
(short-term RRC) ...............................................................................................................................................256
Table 7-12: R2 value for composite resilience contributor against short-term recovery rate coefficient (short-term
RRC) ...................................................................................................................................................................257
Table 7-13: R2 value for direct and indirect earthquake effects contributor plotted against short-term recovery
rate coefficient (RRC) .........................................................................................................................................258
Table 7-14: Signifiers of post-disaster short-term recovery for organisations and sectors after the 2010-2011
earthquakes in Canterbury .................................................................................................................................263
Table 8-1: Summary of major system delays affecting recovery after the 2010-2011 Canterbury earthquakes ..305
Key elements of sectoral recovery and resilience after the Canterbury earthquakes: A system dynamics approach
Hlekiwe Kachali
xxiii
Table 8-2: Summary of system behaviour mismatches, for needs and requirements, after the Canterbury
earthquakes ......................................................................................................................................................... 307
Table 8-3: Aspects contributing positively to system resilience after the 2010 - 2011 Canterbury earthquakes 312
Table 9-1 Sectoral critical success factors that contributed positively to recovery: ............................................ 335
Table 10-1: Percentage differences in Benchmark Resilience Tool (BRT) sectoral resilience indicator percentage
scores between Surveys 1 and 2* ........................................................................................................................ 342
Table 10-2: Comparison of organisational resilience scores using REAG and Resilient Organisations models
after Survey 1 ..................................................................................................................................................... 360

Key elements of sectoral recovery and resilience after the Canterbury earthquakes: A system dynamics approach
Hlekiwe Kachali
ii
Table of figures
Figure 2-1: Different but compatible formal systems approaches .........................................................................15
Figure 2-2: Illustration of a system dynamics causal loop diagram of organisational or sectoral recovery .........21
Figure 2-3: Illustration of a simplified system dynamics stock and flow diagram with inflow, outflow and
information links ..................................................................................................................................................21
Figure 2-4 - Elements of a supply web (adapted from (Sheffi & Rice, 2005)) ......................................................42
Figure 2-5 - Four phases of recovery (adapted from (Haas et al., 1977)) .............................................................45
Figure 2-6: The different interconnected facets of resilience as used in this thesis ...............................................48
Figure 3-1: Research timeline for this thesis.........................................................................................................75
Figure 3-2: Steps involved in the iterative steps of system dynamics modelling ..................................................86
Figure 3-3: Illustration of a system dynamics causal loop diagram of organisational or sectoral recovery .........88
Figure 3-4: Illustration of a simplified system dynamics stock and flow diagram with inflow, outflow and
information links ..................................................................................................................................................88
Figure 5-1: Indicators of organisational resilience contained in the Benchmark Resilience Tool (BRT-53) ......160
Figure 5-2: Average sectoral organisational resilience scores for Survey 1, Survey 2 and Survey 3 .................165
Figure 7-1: Contributors to organisational and sectoral recovery after the 2010 – 2011 Canterbury earthquakes
............................................................................................................................................................................229
Figure 7-2: Organisational post-earthquake levels of recovery (using revenue changes) as defined by
organisations and sectors after the Canterbury earthquakes ..............................................................................232
Figure 7-3: Organisational rate of recovery and contributors to organisational and sectoral recovery .............236
Figure 7-4: Full-time equivalent staff (FTE) plotted against short-term recovery rate coefficient (short-term
RRC) ...................................................................................................................................................................240
Figure 7-5: Existence of organisational crisis or emergency plan plotted against short-term recovery rate
coefficient (short-term RRC) ..............................................................................................................................241
Figure 7-6: Practise of organisational crisis/emergency plan plotted against short-term recovery rate coefficient
(short-term RRC) ...............................................................................................................................................241
Figure 7-7: Organisational cash flow levels plotted against short-term recovery rate coefficient (short-term
RRC) ...................................................................................................................................................................242
Figure 7-8: Organisational average annual sales growth or organisation's income budget plotted against short-
term recovery rate coefficient (short-term RRC) ................................................................................................242
Figure 7-9: Organisational resilience planning factor plotted against short-term recovery rate coefficient (short-
term RRC) ..........................................................................................................................................................245
Figure 7-10: Organisational resilience adaptive capacity factor plotted against short-term recovery rate
coefficient (short-term RRC) ..............................................................................................................................245
Figure 7-11: Organisational average resilience scores plotted against short-term recovery rate coefficient (short-
term RRC) ..........................................................................................................................................................246
Figure 7-12: Level of effect after 22 February 2011 earthquake plotted against short-term recovery rate
coefficient (short-term RRC) ..............................................................................................................................249
iii Table of figures
Figure 7-13: Regular suppliers' capability after 4 September 2010 earthquake plotted against short-term
recovery rate coefficient (short-term RRC) (Lyttelton not included) ................................................................. 250
Figure 7-14: Change in customer base after 4 September 2010 earthquake plotted against short-term recovery
rate coefficient (short-term RRC) ....................................................................................................................... 250
Figure 7-15: Organisational operating hours after 4 September 2010 earthquake plotted against short-term
recovery rate coefficient (short-term RRC) ......................................................................................................... 251
Figure 7-16: Organisational operating hours after 22 February 2011 earthquake plotted against short-term
recovery rate coefficient (short-term RRC) ......................................................................................................... 251
Figure 7-17: Organisational closure impact factor plotted against short-term recovery rate coefficient (short-
term RRC) .......................................................................................................................................................... 252
Figure 7-18: Organisational FTE redundancies after 22 February 2011 earthquake plotted against short-term
recovery rate coefficient (short-term RRC) ......................................................................................................... 252
Figure 7-19: Organisational FTE hires (as per cent of FTE) after 22 February 2011 earthquake plotted against
short-term recovery rate coefficient (short-term RRC) ....................................................................................... 253
Figure 7-20: P-P plot for the pre-earthquake contributor................................................................................... 257
Figure 7-21: P-P plot of resilience contributor ................................................................................................... 258
Figure 7-22: P-P plot of direct and indirect earthquake effects contributor ....................................................... 259
Figure 7-23: Organisational re-opening and short-term recovery trajectory after the 2010 and 2011 Canterbury
earthquakes, for different organisations depending on when they resumed operations ...................................... 265
Figure 8-1: Simplified causal loop diagram (CLD) for sectoral and organisational recovery after the Canterbury
earthquakes ......................................................................................................................................................... 275
Figure 8-2: Overview of intersectoral effects in the response phase after the Canterbury earthquakes ............. 279
Figure 8-3: Causal loop diagram of the response phase for trucking, critical infrastructure, Christchurch CBD
and fast moving consumer goods ....................................................................................................................... 284
Figure 8-4: Causal loop diagram with feedback loops for the response phase for trucking, critical infrastructure,
Christchurch CBD and fast moving consumer goods ........................................................................................ 288
Figure 8-5: Causal loop diagram for the response phase for Christchurch CBD, Kaiapoi Town Centre, Lyttelton
Town Centre, hospitality, building suppliers and information and communication technology ....................... 291
Figure 8-6: Overview of intersectoral effects in the short-term recovery phase after the Canterbury earthquakes
............................................................................................................................................................................ 294
Figure 8-7: Causal loop diagram (CLD) of the short-term recovery phase for trucking, critical infrastructure,
Christchurch CBD and fast moving consumer goods ........................................................................................ 296
Figure 8-8: Causal loop diagram (CLD) for short-term recovery phase for Christchurch CBD, Kaiapoi Town
Centre, Lyttelton Town Centre, hospitality, building suppliers and information and communication technology
............................................................................................................................................................................ 298
Figure 8-9: Stock and flow diagram of organisational recovery in the response phase after the Canterbury
earthquakes ......................................................................................................................................................... 301
Figure 8-10: Stock and flow diagram of organisational recovery in the short-term recovery phase after the
Canterbury earthquakes ..................................................................................................................................... 303
Figure 9-1: Aids, hindrances and point of intervention in recovery after the 2010-2011 Canterbury earthquakes
............................................................................................................................................................................ 315

Key elements of sectoral recovery and resilience after the Canterbury earthquakes: A system dynamics approach
Hlekiwe Kachali
iv
Figure 10-1: Self-report organisational description of measures of disaster resilience after the 2010-2011
earthquakes in Canterbury .................................................................................................................................350
Figure 10-2: Proposed leading indicators of organisational disaster resilience identified from the organisational
self-report lagging disaster resilience indicators ................................................................................................364
Key elements of sectoral recovery and resilience after the Canterbury earthquakes: A system dynamics approach
Hlekiwe Kachali
1
1 Introduction
This study, using a system dynamics point of view, aims to close a gap in the disaster literature
by investigating the recovery of industry and geographic sectors after the Canterbury series of
earthquakes. A system is defined as an assemblage or combination of things or parts forming a complex or
unitary whole (R. A. Johnson et al., 1964). This means that industry sectors are systems within larger
systems. Additionally, every system is defined for a purpose and is influenced by and influences
its environment. The system dynamics approach makes use of qualitative and quantitative
information in the generation of frameworks or models for the analysis of complex situations
involving multiple agents. In this thesis, the use of system dynamics is advantageous because of
the myriad interactions between the sectors and their environments and employs a holistic rather
than reductionist approach.
In the last few years, not only has the trend of disasters increased, but the costs of these disasters
have also been substantial. Natural disasters occur because of the interaction between humans
and the environment (Dynes, 1974; Godschalk, 2003). New Zealand serves as an example of this
interaction as a large majority of the population and the organisations based in the country are
exposed to numerous natural hazards. On 4 September 2010, Canterbury in New Zealand
experienced a MW 7.1 earthquake. This was followed by three earthquakes greater than MW 6.0.
One of these was the 22 February 2011 earthquake which was more destructive in the
widespread damage it caused, including the loss of 185 lives. Eighteen months after the 22
February 2011 earthquake, large parts of the Central Business District (CBD) of Christchurch,
New Zealand’s second largest city, remained cordoned off1. Organisations and industry sectors
in the region are therefore faced with a complex, ever changing recovery scenario.
1.1 Canterbury and Christchurch
Christchurch is officially the oldest city in New Zealand. It is located on the east coast of New
Zealand’s South Island in the region of Canterbury. The essence of Christchurch is that it is the
hub of the South Island of New Zealand (Korsching & Allen, 2004). At the time of the 4
1 Progress for the gradual reduction of the cordon can be found at http://cera.govt.nz/maps/cordon-reduction, accessed 15 June
2012.
2 Introduction
September 2010 earthquake, greater Christchurch’s 2 population was approximately 400,000
people.
The Canterbury region is a significant part of the New Zealand economy (Canterbury Economic
Development Co. Ltd., 2009). Half of all South Island businesses, accounting for 53 per cent of
South Island employees, are located in Canterbury (Statistics New Zealand, 2011a). The
geography of New Zealand’s two main islands makes it prudent for many organisations to have
a main base on each island. One of the major reasons for this is the cost of transporting goods
between the two islands. Consequently, Christchurch’s geographic position and its port facilities
(air and sea) make it attractive to organisations. Its setting close to natural attractions such as
mountains and the sea also makes it ideal for settlement.
1.2 Brief history of seismic risk and activity in New Zealand
New Zealand is located on the Pacific Ring of Fire; this is an extensive belt of volcanic and
earthquake activity. This causes approximately 2500 earthquakes a year in and around New
Zealand, most of which are too small to be felt.
“New Zealand is on the boundary between two [tectonic] plates; the Australian Plate and the Pacific
Plate. These plates are constantly grinding into each other, which causes stresses to build up in the brittle,
upper layers of the plates. When the brittle rock finally breaks, it generates an earthquake” (Geonet,
2010).
Aside from ground motion, earthquakes can also cause the generation of tsunamis as well as
liquefaction3. Since the European settlement of New Zealand, the largest earthquake on record
was of MW 8.2 on 23 January 1855 near the Wairarapa plains of the North Island. However, on 1
2 Greater Christchurch has been defined by ‘drawing a line around Christchurch City that takes in the communities within the
'commuter belt' (approximately half an hour drive from the Central City) in Selwyn and Waimakariri Districts. Greater
Christchurch therefore includes the urban area of Christchurch City and Lyttelton harbour, the area of Selwyn District north of
the Selwyn River and east of Kirwee (including the towns of Prebbleton, Lincoln, Rolleston and West Melton), and Waimakariri
District south of the Ashley River and east of Swannanoa (including the towns of Rangiora, Waikuku, Woodend/Pegasus and
Kaiapoi)’ (The Greater Christchurch Urban Development Strategy, 2012)
3 Liquefaction is defined as the transformation of a granular material from a solid to a liquefied state as a consequence of
increased pore-water pressure and reduced effective stress (Laplante, 2007). The loss of effective confining stress within the soil
results in an associated loss of strength and stiffness that contributes to deformations of the soil deposit (Goldratt & Cox, 1989).
Cubrinovski et al (2002)note that it can occur during earthquakes.

Key elements of sectoral recovery and resilience after the Canterbury earthquakes: A system dynamics approach
Hlekiwe Kachali
3
September 1888, an earthquake with an estimated MW 7.0–7.3 struck the Amuri district of North
Canterbury, approximately 100 kilometres north-west of Christchurch. This earthquake caused
damage to buildings over a wide area, including in Christchurch. Another destructive earthquake,
MW 7.8, struck on New Zealand’s North Island near Hawke's Bay on 3 February 1931 and
affected the towns of Napier and Hastings. The Hawke’s Bay earthquake was New Zealand’s
deadliest with the loss of at least 256 lives (Khatri & D'Netto, 1995). It should be noted that
New Zealand has experienced many large earthquakes, only some are mentioned here.
1.3 The Canterbury series of earthquakes
Historically Christchurch was thought to have a moderate seismic risk and the faults that caused
the 4 September 2010 and 22 February 2011 earthquakes were previously unknown (Beavan,
Fielding, Motagh, Samsonov, & Donnelly, 2011). However, that the 2010 – 2011 earthquakes
occurred and caused such damage and disruption shows that organisations should have plans
that encompass an extensive range of hazards.
1.3.1 4 September 2010 earthquake
The 4 September 2010 Darfield earthquake was a MW 7.1 which struck the South Island of New
Zealand at 4:35 am on 4 September 2010 local time. The earthquake caused widespread damage
and several power outages. Mass fatalities were avoided partly due to the earthquake occurring
during the night when most people were asleep. The earthquake's epicentre was 40 kilometres
west of Christchurch, near the town of Darfield. The initial shaking lasted approximately
40 seconds, and was felt widely across the South Island. Initial claims after the earthquake, for
damage to residential land, buildings and contents, were estimated to be between NZD 2.75 and
3.5 billion (Earthquake Commission, 2011).
1.3.2 22 February 2011 earthquake
The 22 February 2011 Christchurch earthquake, nearly six months after the MW 7.1 earthquake
of 4 September 2010, severely damaged Christchurch and caused the deaths of 185 people. The
MW 6.3 earthquake struck the Canterbury region at 12:51 pm on Tuesday 22 February 2011. The
earthquake was centred approximately 5 kilometres west of the town of Lyttelton and 10

4 Introduction
kilometres south-east of the centre of Christchurch. The February earthquake had some of the
largest vertical peak ground acceleration (PGA) values ever recorded (Bradley, 2012).
The damage caused by the 22 February earthquake was especially pronounced in the
Christchurch Central Business District (CBD) and the city’s eastern suburbs. Some of the
damage was exacerbated by buildings and infrastructure already being weakened by the 4
September 2010 earthquake and aftershocks. The total cost to insurers of rebuilding was
estimated at NZD 20–30 billion, making it by far New Zealand's costliest natural disaster, and
one of the costliest worldwide in 2011 (Swiss Re, 2011). A representative from the Canterbury
Employers’ Chamber of Commerce (CECC) pointed out that these estimated figures will likely
rise as the scale of the earthquakes and effects become clearer (P. Townsend, personal
communication, October 19 2011).
1.3.3 13 June 2011 earthquakes
On 13 June 2011 two more earthquakes, measuring MW 5.6 and MW 6.3, occurred in the greater
Christchurch area. The earthquakes were centred approximately 10 kilometres from
Christchurch. They produced severe shaking in and around the city of Christchurch, destroying
buildings and causing additional damage to some of the structures affected by previous
earthquakes. Rebuilding costs in Christchurch increased by NZD 6 billion owing to the
additional damage from the 13 June earthquakes (Earthquake Commission, 2011). As at October
2012, the earthquakes in Canterbury are ongoing.
1.4 The disaster management cycle
The disaster management cycle comprises four main phases: reduction, readiness, response and
recovery (O'Brien, O'Keefe, Gadema, & Swords, 2010). According to the United Nations Office
for Disaster Risk Reduction, UNISDR, (2009b), there are two main phases after disaster: (1)
response and (2) recovery. Response is immediate, involves rescue and also the restoration of
essential services. Recovery is the phase in which the immediate needs of the affected
community have been met and is the stage where the affected community seeks to return to
what is normal. Consequently, recovery involves compressing decades of development into a few years while
reducing future risks (Levers & Bhatia, 2011, p. 5). However, as Smith and Wenger (2007) also
write, it is difficult to pinpoint when response ends and recovery begins as some activities
Key elements of sectoral recovery and resilience after the Canterbury earthquakes: A system dynamics approach
Hlekiwe Kachali
5
overlap in the two phases. The New Zealand Ministry of Civil Defence and Emergency
Management (MCDEM) (2000) defines three aspects in the timeline for recovery after disaster:
short-term (1-2 years), medium-term (2-4 years) and long-term (5 or more years). For the
purposes of this thesis, the primary periods of scrutiny have been defined as:
response; and
short-term recovery.
There are two principal reasons for this. The first is that data were collected within the two year
post-disaster window defined by MCDEM as short-term recovery. The second reason is that
with each aftershock in Canterbury the response clock was reset and transition to recovery was
made difficult.
1.5 Sectoral and organisational disaster resilience and recovery
In the disaster literature, there have been some studies done on the resilience and recovery of
individual organisations4 post-disaster. Other studies had documented the effects of disaster at
the aggregated level of regions or nations. In addition, the effects of disaster are usually reported
as damage or loss to the built environment. However, assessment of losses should also
encompass those brought about by indirect means such as business interruption or loss of
custom. Words such as rebuild, restore and repair have all been used in the discussion on recovery
from disaster. However, the use of these words serves to simplify this often difficult, complex
and drawn out task. Also, these words may disguise the realisation that after disaster, there may
be irrevocable change (tangible and intangible) and that there is no return to what was.
Industry and geographic sectors5 are the building blocks of any economy and are themselves
made up of organisations. Furthermore, most national and regional economic plans are reported
at the sectoral level and investment decisions are arrived at after analysis of sectoral trends.
However, few disaster studies have focused specifically on the recovery of multiple industry and
4 Organisations in this study include for-profits, not-for-profits and government departments. Organisation and business will be
used interchangeably in this thesis.
5 In this thesis, a group of organisations that operate in the same segment of the economy or share a similar business type are
characterised as making up an industry sector. Sector and industry sector will be used interchangeably.
6 Introduction
geographic sectors post-disaster: how they are affected and how they recover. The consequences
of a disaster event to organisations are often complex, the causes difficult to unravel and effects
can be long-lasting. As a result of the myriad interacting components, the effects of disaster are
different for different industry sectors.
In relation to the Canterbury earthquakes, some of the questions that will be addressed in this
thesis include: how are sectors affected by disaster?; how do sectors interact with each other in
disaster?; what elements determine the degree of impact?; how long before organisations and
sectors return to pre-disaster levels of performance?; and what are some measures that mitigated
the effects of the earthquakes?
1.6 The Resilient Organisations research programme
The Resilient Organisations research programme aims to improve the resilience of New Zealand
organisations to major hazard events. According to Resilient Organisations (2011), some of its
strategic objectives include:
To better understand the nature of resilience within individual organisations and across
sectors, and to communicate solutions for improving resilience
To develop tools and techniques that are easy to use for organisations to actively engage
with the concept of resilience and to identify ways that they can improve their resilience
To build up a suite of case study examples of different resilience strategies that
demonstrates how they can be employed at organisational, sectoral and community
levels.
To continue undertaking longitudinal studies of the organisational aspects of post-
disaster reconstruction and recovery to develop a significant body of knowledge in this
area.
To continue to develop the business case for greater resilience by undertaking
longitudinal studies exploring the linkages between resilience for crises with
organisational performance.
Key elements of sectoral recovery and resilience after the Canterbury earthquakes: A system dynamics approach
Hlekiwe Kachali
7
The contributions resulting from this PhD will be to all of the strategic objectives listed and in
particular: will investigate how and what disaster resilience strategies can be used at the
organisation and the sector level; will chart recovery and reconstruction efforts after disaster and
will enhance the already existing Benchmark Resilience Tool (BRT) (Resilient Organisations,
2010a).
1.7 Thesis arrangement
The emphasis in this work is on the system dynamics of organisational and sectoral recovery
after the earthquakes in Canterbury. This thesis has 11 chapters that can be loosely broken down
into three segments. The first segment (chapters 1 – 3) lays the foundation for this work,
analyses the existing literature on organisations, crisis management and disasters and details the
methods used for data capture and analysis. Segment 2 (chapters 4 - 6) presents the results from
the data collection. These qualitative and quantitative results are then used in segment three
(chapters 7 - 11) of the thesis where some statistical and system dynamics analysis is employed to
investigate the key elements that affected the recovery of organisations and sectors in
Canterbury after the 2010 - 2011 earthquakes. The contents of each chapter are detailed below.
Chapter 1 – Introduction
This chapter puts forward the reasons for the necessity of this body of work. It also outlines the
context of the thesis.
Chapter 2 – Literature review
This section contains an exploration of the relevant literature that forms part of the discussion
on organisational and sectoral recovery and resilience after disaster. This includes the literature
on organisational crisis management and recovery, disaster recovery, system dynamics and
disaster resilience.
Chapter 3 – Research methods and design
In chapter 3, the structure of the study is outlined. The plan for data collection and analysis is
also presented. The justification for the methods employed in this study, how they are used
8 Introduction
together and the sampling technique are explained. As well, the sample used in the study is
introduced.
Chapter 4 – Contextual interviews
This chapter contains information from contextual interviews with industry representatives,
business leaders and experts from recovery agencies. It contextualises and gives more detail of
the sectors in the study as well as forming part of the background for the work that is presented
in the later analysis chapters.
Chapter 5 – Surveys
Here results from the surveys deployed in the course of the research are outlined along with an
interpretation for each set of results. The survey results are presented in two parts; the first part
has the impact data and the second part has organisational resilience data. A comparison of the
results from all three surveys is also done in this chapter.
Chapter 6 – Case studies
Chapter 6 has material from case study organisations that are a subset of the larger sample
group. The case studies allow for a first-hand account from earthquake affected organisations
and provide in-depth knowledge that adds to and complements the survey results in Chapter 5
and the contextual interviews in chapter 4.
Chapter 7 – Significant contributors to organisational and sectoral short-term recovery
In this chapter are discussed the major contributors to the recovery of organisations and sectors
after the Canterbury earthquakes; considering the timeframe of data collection specifically the
short-term recovery of organisations and sectors. The qualitative data from chapters 4 and 6 as
well as the quantitative data from chapter 5 are first brought together in this chapter and used to
determine the main contributors and signifiers to organisational and sectoral short-term disaster
recovery. Statistical analysis methods are used in chapter 7.
Chapter 8 – System dynamics of organisational and sectoral resilience
In this section, information from chapters 4 to 7 is used in a system dynamics framework to
show the interactions between sectors and other system agents. The system dynamics structure
is used to explain the interlinked nature of recovery for the sectors and organisations in this

Key elements of sectoral recovery and resilience after the Canterbury earthquakes: A system dynamics approach
Hlekiwe Kachali
9
study and how this influences their recovery. Investigation of the system leads to the description
of particular system behaviours and characteristics that have a bearing on organisational and
sectoral recovery.
Chapter 9 – Points of leverage
Chapter 9 is an amalgamation of analysis of the system in chapter 8 and the data from chapters 4
to 7 to demonstrate the aids, hindrances and possible points of intervention in the system in
order to effect recovery. This is an examination of the primary aids, hindrances and points of
intervention to organisational and sectoral recovery in the context of the 2010 - 2011 Canterbury
earthquakes.
Chapter 10 – Organisational disaster resilience
This chapter explains the need for both business-as-usual organisational resilience and
organisational disaster resilience. The findings in this chapter are arrived at by analysis of the
results from the Benchmark Resilience Tool (BRT-53) presented in chapter 5 (surveys) as well as
the contextual interview (chapter 4) and case study (chapter 6) data. This is supported by the
findings from the analysis chapters 7 – 9. Chapter 10 also has information on the self-report
organisational disaster resilience indicators from organisations in the study, how the Benchmark
Resilience Tool (BRT-53) can be improved and how organisations and by extension sectors can
be more disaster resilient.
Chapter 11 – Summary and conclusions
This is the research summary and a brief discussion on the possible avenues of continuing the
research in future.
1.8 Chapter summary
This chapter establishes the context of the thesis by giving an overview of the gap in the disaster
recovery literature in analysis of industry sector recovery. This chapter also contains the rationale
for the use of the system dynamics approach in investigating sectoral recovery after disaster. The
myriad industry sectors and agents in the system necessitate the use of methods of analysis for
complex situations.

10 Introduction
As well, the chapter has information on the arrangement of the thesis with a brief description of
the contents of each chapter.
The next chapter contains information on the state of the art in the organisational and sectoral
disaster recovery field.

Key elements of sectoral recovery and resilience after the Canterbury earthquakes: A system dynamics approach
Hlekiwe Kachali
11
2 A review of the literature
The study of recovery after disaster is both inter- and multi-disciplinary. The topic brings
together the subjects of risk, crisis, disaster, business, management, leadership, sociology,
psychology, systems theory, complexity theory and engineering. This review provides an
analytical, systematic review of the existing literature by breaking down and discussing the
building blocks that make up part of the discussion on organisational recovery and that pertain
to this thesis.
The review starts with an overview of what makes a disaster. This is followed by a section on
the use of systems theory, complex adaptive systems (CASs) and how organisations fit in with
these concepts. The next section has a definition of organisational recovery and organisational
disaster resilience, which is followed by an analysis of organisations and risk as well as how crises
develop and are managed in organisations. The discussion on crisis management includes
organisational adaptability, innovation, learning and some possible barriers to preparation for
crises.
The review then has a section on information currently available to do with organisational
disaster recovery and the growing scholarship on the need for organisations to be disaster
resilient. There is also a discussion on the general concept of organisational resilience. In the last
part of the review, the context for this research is explained, along with the main aims and
objectives.
It should be noted that the unit of analysis for this thesis is the industry or geographic sector.
However, the data were collected through the sampling of the organisations within these sectors.
As such, there is reference to both organisations and sectors because of this relationship.
2.1 Crisis, disaster and catastrophe
Disasters that can affect organisations can be of any description; natural (e.g. tsunami,
earthquake, floods) or man-made (data loss, arson, oil spill). In the history of humanity disasters
are not rare occurrences, neither is recovery from disaster. However, an important question that
12 A review of the literature
should be posed when looking at risk, hazards, disasters and recovery is when does a situation become
a crisis or a disaster? In answering the question, one view to take is that the definition depends on
the point of view of the affected party (Dyson, 1983). Pearson and Mitroff define organisational
crisis (or disaster) as an event that poses a
threat to the organization's reputation and viability (Pearson & Mitroff, 1993, p. 49).
The United Nations International Strategy for Disaster Reduction, UNISDR, defines [societal]
disaster as
a serious disruption of the functioning of a community or a society involving widespread human,
material, economic or environmental losses and impacts, which exceeds the ability of the affected
community or society to cope using its own resources (UNISDR, 2009a, p. n. pag).
This thesis is investigating sectoral recovery and resilience after the earthquakes in Canterbury.
Consequently, both concepts of organisational and societal crisis are important. Furthermore,
from the above definitions of crisis, it is clear that extreme events in and of themselves do not
constitute a disaster; this comes about when a hazard event has destructive and damaging
outcomes for organisations or for people. For instance, Bolin and Stanford (1998) in their
analysis of an earthquake at Northridge in 1994 contend that disasters result when extreme
events and human habitation come together. Others, such as Hewitt (1997) and Blaikie et al
(1994) agree. Therefore, organisations and industry sectors, existing within larger systems, are
affected by the interaction with other system agents and events such as earthquakes.
2.1.1 Different degrees of reach and consequences
The reported magnitude of hurricanes or earthquakes for instance does not in itself really
communicate the scale of possible devastation. The aftereffects, to organisations, industry
sectors and people, also vary according to the scale of the disaster event. Different kinds of
disasters (for example caused by hurricanes, floods, earthquakes or tornadoes), bring different
sets of problems and might require varied responses. Hurricanes for instance have some lead
time before they make landfall. This is in contrast to earthquakes which give little, if any
warning.

Key elements of sectoral recovery and resilience after the Canterbury earthquakes: A system dynamics approach
Hlekiwe Kachali
13
Quarantelli (2006) puts forward the argument that there are different levels of crisis and that it is
important to differentiate them as this helps when it comes to the level or degree of response.
Depending on the scale and societal impact of an accident or crisis, there can be an emergency, a
disaster or a catastrophe.
2.2 Systems theory, systems thinking and systems practise
This thesis, in investigating how organisations can recover after disaster as well as how they can
become more resilient to disaster, will be written from a systems perspective, i.e. by employing
systems thinking. A reason for using systems thinking (sometimes called the systems approach) is to
reflect more productively on how a system functions within a larger context (Gharajedaghi,
1999) and use that knowledge to improve the working of the system (Richmond, 1994). Systems
theory and systems thinking are derived from General Systems Theory (GST) which was
proposed by Ludwig von Bertalanffy in the 1930s (von Bertalanffy, 1972). Systems theory has
made possible the growth of new ways of working on complicated problems that involve
different disciplines and it gives a broader view of the workings of complex systems.
Churchman (1979) writes that the true application of the systems approach calls for the working
together of multiple disciplines.
A system is an assemblage or combination of things or parts forming a complex or unitary whole (R. A.
Johnson et al., 1964, p. 367) and is how organisations and society are organised or structured
(Ackoff, 1981; Haviland, Walrath, & El Prins, 2007). Organised indicates that these parts interact
with each other by way of special relationships and that the system displays an overall behaviour
unique to itself. The system is coherently organised in a way that achieves something; it has a
function or a purpose (D. H. Meadows & Wright, 2008). The bi-directional information
exchanges between the actors in a system leads to a process called emergence, where the system
becomes a whole exhibiting properties not exhibited by its constituent parts acting alone.
A system is encircled by its environment and the (sometimes imperceptible but vital) separation
between the two is the boundary. Any elements not in the system are in its environment
(Sterman, 2000). It can be concluded that the system is defined based on its purpose and on the
extent of analysis. The definition of what is included in a system is therefore subjective.
However, because of each system having a purpose, it is important to add that a system’s
14 A review of the literature
environment is not and cannot be all elements not included in the system. The system’s
environment is specifically those elements that affect the system and are affected by it. This is
vital in analysis of a system and is the view taken in this thesis. The system and its environment
have a symbiotic relationship; they exchange input and output, both tangible and intangible. An
example of a system is a community within the larger environment of a town. The purpose of
the community is to serve the needs of its residents. The community is formed of many
interconnected parts and the community’s actions can influence the town and vice-versa.
Ackoff (1990) states that systemic thinking is holistic not reductionist and is synthetic not
analytic. Reductionist and analytic thinking attempts to deduce the attributes of a whole by
looking at that of its individual parts, i.e. not scrutinising the interconnectedness of the parts.
Holistic and synthetic thinking deduces the attributes of components based on the whole that
encapsulates them (Ackoff, 2004). This can be taken to mean that holistic thinking takes in the
interactions between system agents and the emergent behaviour of the system. Embedded in the
umbrella concept of systems thinking are different but compatible formal systems approaches.
Some of the more well-known ones are shown in Figure 2-1.

Key elements of sectoral recovery and resilience after the Canterbury earthquakes: A system dynamics approach
Hlekiwe Kachali
15
Figure 2-1: Different but compatible formal systems approaches
In this work, the approach used is that of system dynamics; which can be used to show how
concerns that at first glance appear localised can have causes as well as outcomes that have a
much broader impact. System dynamics is also used where there are multiple interdependent and
interrelated components and helps to show that the solutions to complex problems are not
simple and direct. System dynamics is built on three main concepts: the system, the structure of
the system and the behaviour of the system. The structure of the system arises from the system
components and the nature of the interactions among them. Consequently, behaviour of the
system emerges from the structure of the system. Bateson (1972) emphasises that a fundamental
point is recognition of the pattern of interactions between the elements in a system that gives
rise to particular emergent behaviour. This perspective is useful for analysis of a complex
disaster scenario such as that in Canterbury.
General Systems Theory
(GST) (von Bertalanffy,
1950)
Systems Thinking
Viable Systems Model (VSM) developed by
Stafford Beer (Beer, 1989)
System Dynamics (SD) by Jay Forrester
(Sterman, 2000)
Strategic Options Development and Analysis (SODA) developed
by Colin Eden (Eden & Ackermann, 2001)
Critical Systems Heuristics (CSH) developed by
Werner Ulrich (Flood & Romm, 1996)
Soft Systems Methodology (SSM) developed by Peter Checkland (1994)

16 A review of the literature
As observed, apart from being useful for looking at complex situations, system dynamics is
useful for when they are dynamic. System dynamicists think in terms of two main classes of
complexity. The first is combinatorial or detail complexity which is mainly in reference to the
number of components there are in a system. The second is dynamic complexity which is a
result of the exchanges between the components in the system over time and is possible even in
what would be thought of as simple systems (Senge, 2006; Sterman, 2000). The types of
complex problems examined through the lens of system dynamics are referred to as messes by
Ackoff (1981). He further adds that the management of messes calls for planning and not
[traditional] problem-solving which often looks for a linear cause and effect. Others such as
Reynolds and Holwell agree with this perspective and add that messes for the most part have
more serious ramifications, involve more people and may appear in different guises (Reynolds &
Holwell, 2010, pp. 4 - 5).
However, systems theory and systems thinking should not be viewed as the mere simplification
of complex problems. Manson (2001) asserts the same and argues that there is a possibility that
interactions between actors can be erroneously viewed as having a one-to-one cause and effect
relationship when this is not so as systems are non-linear. From Manson’s description, this can
be taken to mean that input and output do not always have a one-to-one relationship. For
instance, a small amount of input could lead to a large amount of output and vice-versa. Dooley
(1997) also takes this position. Sterman (2000) further describes the supply chain beergame which
shows that a decision made at one point in the supply chain could lead to magnified effects in
other nodes along the chain. The work of Johannessen (1998, p. 359) summarises the primary
components to systems thinking:
the sub-systems and the system must be viewed in context, i.e. the part/whole
relationship;
the system in the environment, not the system separated by a border is emphasised;
the type of connection between elements as this shows changes in the system; and
the reorganisation of the connection between elements as this provides guidance for
processes of creation as well as innovation in the system.
The above points expressed alternatively can be thought of in terms of the five checks for a
healthy system: balance, cohesion, clarity, completeness and consistency (Elms, 1998).
Key elements of sectoral recovery and resilience after the Canterbury earthquakes: A system dynamics approach
Hlekiwe Kachali
17
System dynamics can also be utilised to show the ways in which a system such as an organisation
can protect itself and even benefit from internal and external disturbances which disrupt the
workings of the system (Coyle, 1977). When the system can survive and thrive despite these
disturbances, then the performance of the system is enhanced and can be said to be resilient.
2.2.1 Complex Adaptive Systems (CASs)
Holland (1992) notes that among systems of various types, there are those that when faced with
disturbances in their environment have the capability to change and rearrange their component
parts. He assigns to such systems the designation Complex Adaptive Systems (CASs). Apart
from the ability to adapt, Holland states that CASs are also able, through the collective behaviour
of their parts, to differentiate themselves from other systems. For example, an organisation, with
its many interactions and ability to adapt is different from a static system such as a building.
CASs can also anticipate changes in their surroundings. Lansing (2003) further notes that even
what are considered the simplest systems can exhibit complexity, where complexity is seen as
individual actors linked in a system and together exhibiting complex behaviour.
As pointed out earlier, organisations belong to larger, more complex systems such as industry
sectors, communities and nations. Furthermore, in the literature organisations are considered
social systems. Bunge (1985) writes that the study of social systems should comprise the study
of four branches: biological, cultural, economic and political. However, it appears that physical
systems are missing from Bunge’s list. Interactions between physical systems and those defined
by Bunge are vital in investigating recovery after earthquakes.
Additionally, Malotaux (2008, p. 1) writes that the study of systems should include
understanding both the interface and the behaviour of humans so that people can work well within the
system. Kelly (1995, p. 164) states clearly why organisations should be analysed as CASs:
The challenge is simply stated: Extend the company’s internal network outward to include all those with
whom the company interacts in the marketplace. Spin a grand web to include employees, suppliers,
regulators, and customers; they all become part of your company’s collective being.
In CASs, the extent to which one part has an effect on another is known as the degree of
coupling (Perrow, 1999). The extent of coupling can range from tight to loose. Another property
18 A review of the literature
of a CAS relevant to this work is that it has memory; the system stores information from past
events and can use that knowledge to inform its strategy in the present (Pentland & Reuter,
1994; Senge, 2006).
Authors such as Comfort (1999) and Shrivastava (1994) have shown that systems thinking is
widely and successfully used in disaster research; while Senge and Sterman (1992) and Mitleton-
Kelly (2003) show that it can be used to explain how organisations function. These two aspects
will be used in this thesis to determine the key elements of organisational and sectoral recovery
after disaster.
System feedback, hierarchy, self-organisation and resilience
The interactions between the actors or elements in a system are called feedback (Sterman, 2000).
There are two types of feedback: positive (reinforcing) and negative (balancing). Positive
feedback is where an action produces a result which leads to more of the same action whose
outcome is growth or decline. Negative feedback is aimed at moving the system, through some
action, to a current or desired state (the goal or the objective) (Sterman, 2000). As a result of
positive and negative feedback, systems thinking includes a cyclical rather than linear pattern of
cause and effect. Systems can also experience oscillation which is caused by negative feedback
with time delays within the system. Also, one of the key features of positive feedback is that
small distortions in the system can be amplified as they move through the system. Positive
feedback is self-reinforcing and will continue until it reaches its limits or is counteracted by a
negative feedback loop. For example amplification can be seen in a supply web when there is a
variation in orders along the supply chain which can then lead to excess inventory in one part of
the supply chain. Forrester called this the beer game (Sterman, 1989) (see section 2.5.2 for
details).
Meadows and Wright (2008) and Sterman (2000) point out that there are three fundamental
system characteristics that enable systems to function well: hierarchy, self-organisation and
resilience. For this thesis, function well will be taken to mean that the system achieves its purpose.
What can also be implied from these characteristics is that for hierarchy, self-organisation or
resilience to occur, there must be an exchange of information or feedback among the system
actors.

Key elements of sectoral recovery and resilience after the Canterbury earthquakes: A system dynamics approach
Hlekiwe Kachali
19
Organisations are systems within the larger system of an industry sector within a still larger
system of an economy, a region or a nation. The nesting of systems within systems is known as
the hierarchy of systems (Daellenbach, 1994) and makes the management of the system easier.
Hierarchies (or subsystems) develop so that not all the system’s information is contained in one
subsystem; which might lead to an information overload. This is not to say that the right and
relevant information should not be passed on to different subsystems. Importantly, the aim(s) of
the subsystems should not be at cross-purposes to that of the overall system. However, there is
the ideal system versus the real system. Therefore, it is possible that a subsystem is at odds with
the larger system’s purpose. This can lead to system sub-optimisation. In the system dynamics
literature, it has been shown how in the functioning of a city, optimisation in one part without
consideration of other parts can be detrimental (Helmreich, Klinect, & Wilhelm, 1999).
However, another advantage of system hierarchy is that failure in one part of the system may
not affect other parts. This is provided the failure is not so great as to cause system collapse and
does not adversely affect other parts. This is the basis for Reason’s Swiss Cheese Model of
accidents (Reason, Hollnagel, & Paries, 2006).
System self-organisation is important because after a perturbation, the system can assume a
temporary or permanent modified structure that enables the system to keep functioning. Self-
organisation is also important for the continued existence of a system in a changing
environment. Some of the organisational crisis literature points to the ability of a system, such
as an organisation, to self-organise as a means of survival (Mitroff, Alpaslan, & Green, 2004;
Senge, 1998).
Resilience, an emergent property of the system, is another term that is subjective (see section 2.7
for more detail). As has been demonstrated, resilience is not easy to measure (Manyena, 2006).
Resilience contributes to the stability of a system through the feedback loops present in the
system. There are various feedback loops in any system and these are dominant at different
times. The existence of negative feedback loops leads to system balance or equilibrium. The
resilience of a system is to ensure not just continued functioning of the system but also survival.
This is achieved through the use of system feedback and the other system characteristics of
hierarchy and self-organisation (see chapter 8.4).

20 A review of the literature
System delays and environmental time delays
A system delay is caused by a lag in the effect of one element on another. In the time horizon
for this thesis, the system delays are not yet evident. However, as is shown in chapters 6, 7 and 8,
there are time delays in the system’s environment and they affect the system. In Canterbury, some
of these environmental time delays were to do with insurance settlement, availability of
machinery, availability of skilled labour and decisions on building demolition. All these
environmental time delays affected organisations and sectors.
2.2.2 System dynamics frameworks and modelling
The system dynamics approach makes use of system models for the analysis of situations and
includes the use of quantitative and qualitative procedures. Modelling can be described as the
construction of abstract models and includes the development of mental models, influence
diagrams, causal-loop diagrams, stock-and-flow maps as well as stock-and-flow models (Adjunct
Associate Professor Barry Newell, personal correspondence, 2012). Consequently, if the
modelling (qualitative or quantitative) has to do with investigating the behaviour of a system
over time, then this constitutes system dynamics modelling (Furlong & Scheberle, 1998; Hammer,
Champy, Daniels, James, & Hughes, 1994; Handmer & Dovers, 1996; Markides & Williamson,
1994). Richardson and Pugh (1981, pp. 312-313) state that the use of a model as well as its
effectiveness are dependent on the degree to which the model communicates, helps to generate
insights, enhances understanding, and in general reaches and influences its audience.
Causal loop diagrams (CLDs) (see Figure 2-2) are mainly qualitative and help to show how
interrelated variables (or nodes) affect one another. The relationships between these variables are
represented by arrows and can have positive or negative polarity. For quantitative analysis of a
system, stock and flow diagrams can be used. A stock is anything that accumulates or depletes
over time while a flow is the rate of change of a stock. Figure 2-3 has a depiction of a simplified
stock and flow diagram. Inflow adds to the stock while outflow depletes the stock. The arrows
from Stock to inflow and outflow show that there is an exchange of information between the stock
and the flows which can contribute to the rate of the flows. Notably, a stock is only ever
changed through its flows. The clouds on the ends of the flow arrows depict the environment
of the system.

Key elements of sectoral recovery and resilience after the Canterbury earthquakes: A system dynamics approach
Hlekiwe Kachali
21
Figure 2-2: Illustration of a system dynamics causal loop diagram of organisational or sectoral recovery
Figure 2-3: Illustration of a simplified system dynamics stock and flow diagram with inflow, outflow and
information links
In system dynamics modelling, the time horizon in the model is crucial to analysis. The model
must reach far enough into the past to show how a problem may have started as well as the
symptoms and it should also go far enough into the future that it can show the delayed, indirect,
unforeseen effects. This is very relevant to the discussion of recovery after crisis or disaster later
in this work that posits that the pre-existing crisis or disaster conditions in an organisation may
contribute to its recovery post-disaster. This is also relevant to the timing of data collection after
a disaster, as will be seen in chapter 7.
Organisational or
sectoral throughput
Organisational or sectoralrecovery measures and
programmes
Intended organisational
or sectoral throughput
Deficit in organisational
or sectoral throughput
-
+
+
+
B
Seismic activity
-
StockOutflowInflow +
22 A review of the literature
The validation of system dynamics models is an important yet contentious subject. Even though
system dynamics modelling uses both quantitative and qualitative information, some authors
(Nordhaus, 1973; Zellner, 1980) have criticised the technique as relying too much on qualitative
aspects. However, other authors such as Barlas (2006), Sterman (1984), Coyle (1977) and
Forrester (1994) write that it is possible to validate system dynamics models. An alternative
perspective on modelling in general is captured in the words of Box and Draper (1987, p. 74):
essentially, all models are wrong, but some models are useful. In this thesis, the validity of the model has
to do with how well it depicts the system being analysed, considering the system’s purpose, as
well as how useful the model is in analysing the system. Of utmost importance and with
reference to any type of modelling; the usefulness of the model is dependent in the first place
on the quality of the input information.
2.3 Organisational crisis management
Some authors (Tierney, 2007b; Turner, 1976) have noted that there are immense benefits to
analysing the recovery of organisations after disaster from the point of view of the larger body
of organisational research. This is to do with how organisations manage risk, cope in turbulent
environments and in general handle run-of-the-mill crises. In this thesis, the study of
organisational crisis management has been extended to how organisations deal with and recover
from disaster. After all, a large proportion of the literature on crisis management is built on the
evaluation of industrial or organisational disasters. Crisis management is defined as the efforts
by an organisation and external parties to prevent crises or to manage effectively crises that arise
(Pearson & Clair, 1998). The primary difference between a disaster situation and the day-to-day
operations of an organisation is that the disaster environment compresses in time what would
have occurred over a longer, more expansive timeframe (Olshansky, Johnson, & Topping, 2006).
In disaster, decisions often have to be made under time pressure and tremendous uncertainty.
For instance, when infrastructure is damaged after a disaster event, decisions have to be made
quickly on the restoration, repair or replacement of this infrastructure and associated services.
This is done in a shorter amount of time than a city would take to plan for and build
infrastructure.
In this thesis, some of the concepts from the organisational (crisis) literature will be drawn on to
investigate how organisations can recover from disaster. Some of these concepts include risk,
Key elements of sectoral recovery and resilience after the Canterbury earthquakes: A system dynamics approach
Hlekiwe Kachali
23
organisational decision making in crisis (Pearson & Mitroff, 1993), organisational processes
(Clarke, 1991), organisational change (Dervitsiotis, 2003), leadership, organisational culture
(Perrow, 1999; Senge, 2006), crisis management (Turner, 1976) and organisational resilience
(Hamel & Välikangas, 2003; McManus, 2008; Stephenson, 2010). All of these works have looked
at the organisation as composed of elements as well as the organisation in its environment. This
is compatible with the systems approach adopted for this thesis.
2.3.1 Organisations and risk
The life-cycle and operation of any organisation involve risk. The Joint Australia New Zealand
International Standard (AS/NZS), based on the International Standard Organisations ISO
31000:2009 document, defines risk as the effect of uncertainty on objectives - positive and/or negative
(AS/NZS ISO 31000:2009, p. 1). From the literature on crisis and disaster management,
Comfort (2005, p. 338) says risk represents the possible occurrence of a harmful event that has some known
likelihood of happening over time.
A group of experts (Jolly, 2003) in the field of corporate risk write that effective risk
management can be used as a tool for corporate survival. In the guide, the authors argue that for
reasons such as population shift and technological advances, the risks faced by organisations are
ever changing and that the management of risk should be a part of an organisation’s everyday
operation. The authors point out that the main areas of corporate risk can be broken down into
financial (e.g. affecting capital), strategic (e.g. affecting the wider business environment) and
operational (e.g. affecting organisational processes). The authors advise organisations to identify
risks that may affect them, specifically how the organisation would be affected and lastly to
prioritise these risks according to severity for the organisation.
Risk is therefore unavoidable. As well, other authors state that the organisation does, however,
have the power to choose between risks and how to effectively identify, analyse and manage
those risks (Couto, 1989; Kaplan & Garrick, 1981; Wildavsky, 1988). As with recovery and
resilience, the definition of risk is subjective. For different organisations, different risks pose
different threats. Thinking of ways in which the organisation would react given a certain risk also
plays a part in how that risk is perceived and planned for. The analysis of risk should also
include consideration of context: of the system as well as the scale. For instance, for risk
24 A review of the literature
reduction, Comfort (2005; 2001) calls for the involvement of multiple actors such as
government agencies, for-profit organisations, not-for-profits organisations and the community
as they all form a part of a system.
2.3.2 The inevitability of crises?
In this thesis, failure is defined as when a system component does not fulfil its intended purpose
in a certain timeframe (Leveson, 1986, p. 128). This can be the organisation or in one part of the
organisation. There has been a need in both industry and academia to define failure; how and
why accidents and crises develop; how they can be prevented, mitigated and managed; as well as
what consequences could result.
There are a few noted schools of thought which at first seem incompatible but do have some
similarities; these are High Reliability Theory (HRT) (La Porte & Consolini, 1991) and Normal
Accident Theory (NAT) (Perrow, 1984). LaPorte and Consolini (1991), Roberts (1990) and
Weick (1987), proponents of HRT, state that the design and working of the organisation itself
contributes greatly to safety and to preventing accidents, in part by being proficient in reacting
quickly to failure. On the other hand, the underlying premise of NAT is that regardless what
measures organisations take, accidents will happen and chances increase with the level of system
complexity (Perrow, 1994). There is general consensus that in complex systems, accidents
happen when various factors coincide (Cook, 1998; Reason, 2000; Turner, 1976). For example,
when failsafe mechanisms like emergency buttons, personnel training and procedures are in use at
any one time, one of these failing might not lead to a catastrophe, but their combined failures
and interactions could. This means that failure is dependent on the state of the system and on
factors present and interacting at any given time. Leveson (2010) confims this notion.
Much has been said and written by the advocates of the two differing outlooks of NAT and
HRT on organisational safety, the inevitability of accidents in organisations, how organisations
can deal with cascading failure as well as how such analyses can be used to give insight into how
organisations might be vulnerable to disaster. However, a point of view adopted in this thesis is
expressed in the work of Leveson et al (2009) who write that although NAT and HRT have
been discussed at length, they can still benefit from being integrated with the systems approach
to problem analysis for organisations. NAT and HRT have limitations such as confined or
Key elements of sectoral recovery and resilience after the Canterbury earthquakes: A system dynamics approach
Hlekiwe Kachali
25
restricted definitions and the unclear difference between reliability and safety and would
therefore be enhanced by the inclusion of systems thinking in the two theories.
Apart from NAT and HRT, there is what Mitroff terms abnormal accidents (Mitroff, 2004, p. 43)
of the deliberate, intentional kind. In this category, one of the biggest events in recent living
memory, and whose effects are still being felt, is the flying of planes into New York’s twin
towers in September 2001.
Additionally, Heinrich (1950) put forward his Domino Theory in which he asserts that
metaphorically, an accident is like a line of dominoes falling over: the culmination of a chain of
sequential events. When one of the dominoes falls, it knocks down the next one and so on (the
domino effect).
Heinrich’s (1950) five symbolic dominoes which may cause accidents:
social environment and ancestry;
fault of person;
unsafe act, mechanical or physical hazard (unsafe condition);
accident; and
injury (Heinrich et al., 1950).
However, removing a key factor such as an unsafe condition or an unsafe act prevents the start
or the perpetuation of this chain reaction. Unsafe acts are those which are caused by persons
not paying enough attention, and unsafe conditions might be a result of inadequately designed
or improperly maintained equipment and work areas. Alternatively, the system could have built-
in buffers to dampen the reaction.
What can be added to Heinrich’s Domino Theory and relevant to this thesis is that either
method should be designed with the entire system in mind. Another point of interest is that
Heinrich points specifically to fault of person. Organisations are social systems; therefore it is of
little value to design processes as if they were solely for use by machines without taking into
account the human element. Reason (1998) has written on this. In other work, Malotaux (2008,
p. 1) contends that in practice we see however that many systems fail because engineers ignored, forgot to

26 A review of the literature
include, or incorrectly assumed how people interface and behave. Therefore, regarding accidents and failure
prevention which can lead to crisis, it can be argued that systems fail, not people (Cook, 1998;
Reason, 2000; Turner, 1976). In other words, failure is a property of the entire system and not
of the individual components. Accordingly, Pugsley (1973) , from the discipline of structural
engineering, developed an indicator model that can be used by organisations in the assessment
of risk and the potential occurrence of crisis or disaster. The indicators are:
new or unusual materials;
new or unusual methods of construction;
new or unusual types of structure;
experience and organisation of design and construction team;
research and development background;
industrial climate;
financial climate; and
political climate.
Both the Heinrich and Pugsley models can be extended and used in dealing with organisational
crisis. First, they can both be taken as very general in how they define their indicators. Heinrich’s
model does not include specific environmental factors such as finance or politics that could
trigger some of his dominoes. Pugsley’s model, on the other hand, includes some environmental
factors but he does not explicitly discuss the interaction of the indicators. This is where the use
of system dynamics is essential in looking at the different elements in the system and how they
are related to each other and could affect recovery. Using both Heinrich’s and Pugsley’s models,
organisations could adapt them to different situations and add missing elements relevant to the
organisation’s situation. Lastly, both models are qualitative which would make it difficult to
observe any changes as well as the degree of those changes, in the system. Therefore, metrics are
required to measure the indicators.
From the theories discussed in the above paragraphs, it is clear that trying to detail all the
possible failure permutations is impossible; the world is filled with unknowns and a disaster in
some form is bound to happen at some time. That such complex systems are built in the first
place, leads to what Charles Perrow (1986, p. n. pag) calls the habit of courting disaster.

Key elements of sectoral recovery and resilience after the Canterbury earthquakes: A system dynamics approach
Hlekiwe Kachali
27
Consequently, as complex systems have more parts to them and differing degrees of interaction
between those parts, component interaction accidents where the system designers did not plan
for all the possible interactions are more common (Leveson, 2010). In the New Zealand context,
Isaac (1997) shows how pre-existing organisational conditions in the Department of
Conservation and local conditions in the creation of a viewing platform led to disaster. Pre-
existing organisational conditions included understaffing leading to overworked staff while local
conditions were a poorly designed and constructed structure.
For organisations, it is therefore prudent to take the all-hazards approach which requires the
development of organisational plans and responses capable of dealing with a wide range of
disruptive activities as opposed to a few targeted ones. This idea of the all hazards approach has
been documented in the disaster and emergency management literature (Berkes, 2007;
Godschalk & Brower, 1985; New Zealand Ministry of Civil Defence and Emergency
Management, 2012b; Reason, 2000; S. D. Smith, 2004). There is also a need for organisations to
become more resilient in the face of numerous crises (Hamel & Välikangas, 2003).
Lastly, it has been shown in the organisational crisis literature that failure to identify risks or the
mismanagement of risk and crises could have negative consequences for the organisation. For
instance, Pretty and Knight (2002) show how an organisation’s misidentification of risks and
mismanagement of crises can result in the loss of value of the organisation’s stock price.
2.3.3 The build-up and progression of crises in organisations
Various models for how organisational crises develop have been suggested. One model,
proposed by Turner, refers to the failure of foresight (Turner, 1976, p. 378) and is shown in Table
2-1. This is where facts to pre-warn of a crisis were available but there was failure to act on this
information to prevent or mitigate the crisis. One of the most crucial of the stages in Table 2-1
is the second stage, which from a systems viewpoint outlines an emergent property of the
system: from the pre-conditions as separate parts to the emergent state of disaster (or accident).
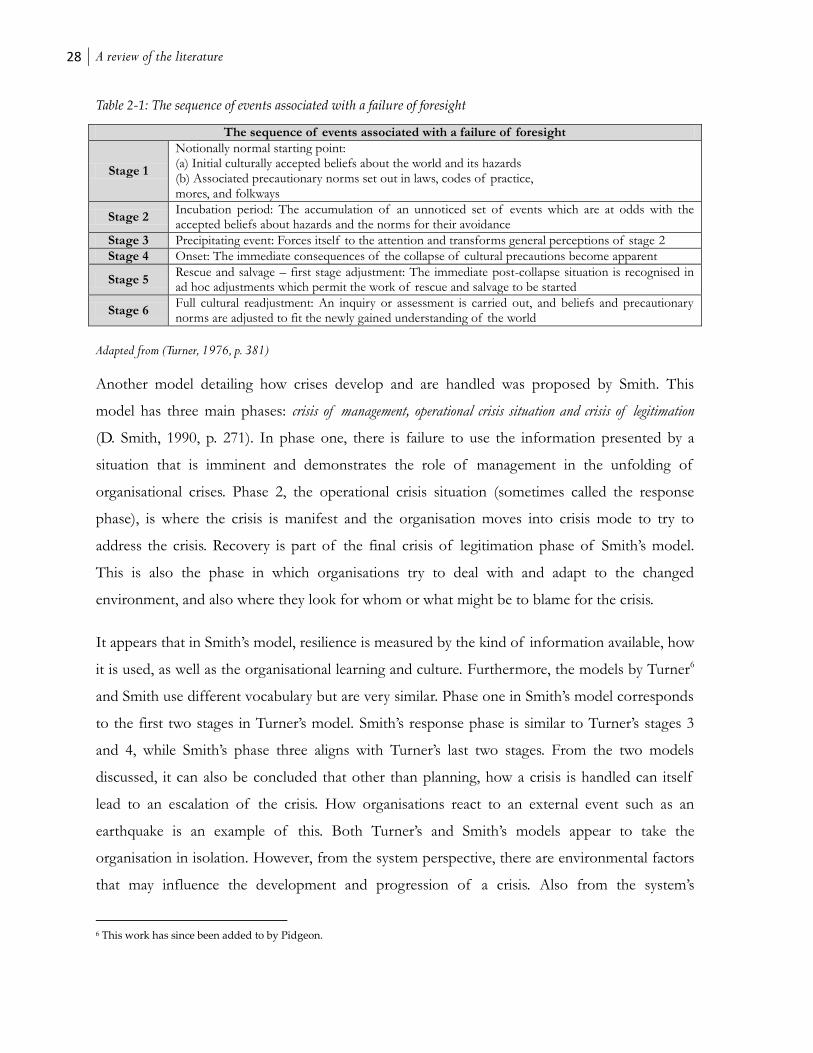
28 A review of the literature
Table 2-1: The sequence of events associated with a failure of foresight
The sequence of events associated with a failure of foresight
Stage 1
Notionally normal starting point: (a) Initial culturally accepted beliefs about the world and its hazards (b) Associated precautionary norms set out in laws, codes of practice, mores, and folkways
Stage 2 Incubation period: The accumulation of an unnoticed set of events which are at odds with the accepted beliefs about hazards and the norms for their avoidance
Stage 3 Precipitating event: Forces itself to the attention and transforms general perceptions of stage 2
Stage 4 Onset: The immediate consequences of the collapse of cultural precautions become apparent
Stage 5 Rescue and salvage – first stage adjustment: The immediate post-collapse situation is recognised in ad hoc adjustments which permit the work of rescue and salvage to be started
Stage 6 Full cultural readjustment: An inquiry or assessment is carried out, and beliefs and precautionary norms are adjusted to fit the newly gained understanding of the world
Adapted from (Turner, 1976, p. 381)
Another model detailing how crises develop and are handled was proposed by Smith. This
model has three main phases: crisis of management, operational crisis situation and crisis of legitimation
(D. Smith, 1990, p. 271). In phase one, there is failure to use the information presented by a
situation that is imminent and demonstrates the role of management in the unfolding of
organisational crises. Phase 2, the operational crisis situation (sometimes called the response
phase), is where the crisis is manifest and the organisation moves into crisis mode to try to
address the crisis. Recovery is part of the final crisis of legitimation phase of Smith’s model.
This is also the phase in which organisations try to deal with and adapt to the changed
environment, and also where they look for whom or what might be to blame for the crisis.
It appears that in Smith’s model, resilience is measured by the kind of information available, how
it is used, as well as the organisational learning and culture. Furthermore, the models by Turner6
and Smith use different vocabulary but are very similar. Phase one in Smith’s model corresponds
to the first two stages in Turner’s model. Smith’s response phase is similar to Turner’s stages 3
and 4, while Smith’s phase three aligns with Turner’s last two stages. From the two models
discussed, it can also be concluded that other than planning, how a crisis is handled can itself
lead to an escalation of the crisis. How organisations react to an external event such as an
earthquake is an example of this. Both Turner’s and Smith’s models appear to take the
organisation in isolation. However, from the system perspective, there are environmental factors
that may influence the development and progression of a crisis. Also from the system’s
6 This work has since been added to by Pidgeon.
Key elements of sectoral recovery and resilience after the Canterbury earthquakes: A system dynamics approach
Hlekiwe Kachali
29
perspective, the time horizon prior to the crisis and during the crisis should be considered. This
has not been included in the models.
As well, the models put forward by Turner and Smith are to do with man-made disasters while
this thesis deals with organisations affected by a disaster caused by earthquakes. However, some
of the lessons from how organisations handle man-made disasters can be used to investigate
how they deal with natural disasters. To start, organisations consist of people, who would be the
ones dealing with a disaster regardless of the cause. Also, as organisations are part of larger
systems, they are likely to be affected through their assets, staff, processes, customers or supply
chain for example, by a regional disaster. Lastly, it is possible that a natural disaster could
exacerbate existing or potential problems in an organisation. This is equivalent to the second,
incubation, stage in Turner’s model.
In addition, dealing with crises requires some prior, effective planning (Quarantelli, 1988). The
assumption is often made that if disaster preparation has taken place then the management of
crisis will be an automatic success. Instead of waiting for an event to occur to gain experience,
organisations could instead use simulated exercises where all the major actors are present as a
way of checking for gaps, testing the system and fine-tuning it. For instance, Clarke (2001)
cautions organisations against thinking that written plans alone are sufficient. As well, apart from
the documents written by organisations for their own use, there are numerous standards that
detail how an organisation should behave in a certain situation. Again, the compliance with such
standards does not always translate into how well the organisation will do in a crisis.
Lastly, MacManus (2008) writes that in planning to manage crises, organisations should
understand what hazards they face and how they might be affected by them. Depending on
scope and extent, hazards with the potential to affect an organisation can be categorised as:
regional (such as the 2010 and 2011 Canterbury earthquakes to organisations based in
the region);
societal (such as the SARS outbreak in 2003 affecting organisational staffing and
manpower);
localised (organisation specific such as the BP Deepwater Horizon oil spill of 2010); or
30 A review of the literature
distal (consequences as a result of actions on the supply chain for instance) (McManus,
2008).
In this thesis the primary focus is on disasters of a regional nature and to a small extent those
that are distal.
2.4 Adaptation and learning
It has been argued that for a social system, such as an organisation, to recover from disaster a
certain level or amount of adaptation and learning are necessary. Furthermore, in order for there
to be adaptation and innovation, there needs to be learning (Hall, 1962). Consequently, learning
and adaptation in a system are a result of the information exchanges within the system: of
feedback.
2.4.1 Organisational adaptability
Pasmore (1994) argues that for organisations, two things are certain: the speed of meaningful
change will increase and complexity will grow. Therefore, it can be concluded that organisations
need to respond with more thought, better utilisation of resources and better organisational
preparation. From a systems perspective, organisations should adapt and also evolve. This will
enable organisations to handle successive change without resorting to firefighting where each crisis
is handled singly with no planning for the future or experience from the last crisis. Managing
one-off crises on a continually ad hoc basis is insufficient, inefficient and time-wasting (Pasmore,
1994; Senge & Sterman, 1992). Organisations should also be able to adapt to changing
environmental factors and achieve their goals not only during business-as-usual but also through
tumultuous times (Boisot & Child, 1999; Dervitsiotis, 2004; Hamel & Välikangas, 2003). Fink et
al (1971) and Mitroff (2005) allude to the fact that crises can be a positive learning experience
provided they do not cause the organisation permanent collapse. In fact, organisational resilience
itself becomes a competitive advantage.
Also, for a lot of complex systems, Edmunds et al. argue that problem formulation poses a difficult
challenge and a highly flexible process is required to cope with the necessarily evolving configuration (Edmunds,
Feldman, Hicks, & Mullineux, 2010, p. 1). For organisations, problem formulation can be taken as
the direction of organisational evolution and is made even more challenging in a crisis or
Key elements of sectoral recovery and resilience after the Canterbury earthquakes: A system dynamics approach
Hlekiwe Kachali
31
disaster situation. Edmunds et al further state that; the objectives and constraints are not independent, so
they have to be dealt with concurrently; additionally, they may evolve as the design process continues and
understanding of the system develops, meaning that some objectives must be added, strengthened, weakened or
removed completely (Edmunds et al., 2010, p. 2). However, the organisation gains from going
through this process by better understanding their operating environment and thereby ensuring
that they can learn and adapt.
2.4.2 Learning
From the literature, organisations need to innovate, be diverse, adapt and keep learning in order
to carry on being successful as well as handle crises effectively (Ferrier, Smith, & Grimm, 1999;
Hamel & Välikangas, 2003; Lengnick-Hall & Beck, 2005; Pascale & Athos, 1981; Peters &
Waterman, 1982; Senge, 2006; Stacey, 1995). Using the analogy of the organisation as a complex
adaptive system (CAS); a CAS is resilient to disruptions from the environment that would cause
the breakdown of less adaptive systems, and it does not need perfect conditions in which to
exist (Holland, 1992; Levin, 1998). It can alter its own state to make up for variations in the
environment, thereby increasing its ability to survive and even thrive. Furthermore, because it
has memory, a complex adaptive system can learn to make the best of its situation and
circumvent or deflect many hazards that may exist in its environment (Pascale & Athos, 1981;
Senge, 2006). As a result of CASs being dynamic and non-linear, there are a number of factors
which could combine to give a different outcome every time and at no two points in time are the
states of the system identical (Dooley, 1997; Holland, 1992). Using the conditional probabilities
view of the Markov process7, a system’s ability to withstand crisis or disaster in one state is a
measure of the likelihood (probability) of its transition to a different state (Belegundu &
Chandrupatla, 1999). The ability to withstand should not be taken to mean that the system does
not change as that may mean that the system is not adaptable. The inability to adapt could itself
lead to failure.
Pascale and Athos (1981) as well as Senge (2006) describe how finding an organisation’s best fit,
given the environment, and deciding what direction to take are a part of organisational learning.
This is because factors like customers, competitor behaviour and other events over which
7 The Markov Process is sometimes used in the optimisation of systems in systems engineering

32 A review of the literature
organisations do not have complete control, all have the ability to affect an organisation.
However, using information from the environment, organisations can adapt and create an
environment in which the organisation can continuously learn and operate. For example,
Thomke et al (1998) found that two-thirds of equipment innovations in the semi-conductor
industry were developed by the end-user feeding information back to organisations.
The environmental feedback affecting the organisation’s strategy formulation also necessitates
that organisations plan ahead while at the same time being ready for change. However,
organisations find that they have to make decisions with only the information at hand, what
Herbert Simon (1991, p. 132) refers to as bounded rationality. According to Dovers and Handmer
(1992, p. 270), for organisations recognition that additional knowledge will not by itself provide all, or even
the main, answers, means that in effect we have to learn how to manage in ignorance.
Additionally, limited and intangible resources such as money, time, competence and market share
act as constraints on the decisions an organisation can make, which in turn has a bearing on
organisational strategy. Resources can be even scarcer in a disaster environment; a situation
which can be amplified when multiple actors are competing for the same resources. As a result
of operating under changing multiple constraints especially in crisis times, occasionally, any CAS
moves towards a critical state (Bak, Tang, & Wiesenfeld, 1988, p. 364) where the system is at the
edge of transition between two states. It is in this critical state, what Dervitsiotis (2003, p. 252)
calls the edge of chaos, that conditions are ideal (for the system’s purpose) and organisations have
the best opportunity to make dramatic change. Even as an organisation has to deal with finding
its best fit under multiple constraints, the major developmental changes, the critical states, occur
intermittently (Sneppen, Bak, Flyvbjerg, & Jensen, 1995).
Lastly, organisations need to remember that long periods of success [can] breed complacency (Hopkins,
2007, p. 7). In certain instances, organisations should forget what made their enterprise
successful previously as this might lead to failure of a new venture (Hamel & Välikangas, 2003).
The process of innovation and creation should be treated as an opportunity to learn as failure in
itself is not a bad thing; it is what is learnt in the process that is important (Cannon &
Edmondson, 2005; Senge, Scharmer, & Flowers, 2005).
Key elements of sectoral recovery and resilience after the Canterbury earthquakes: A system dynamics approach
Hlekiwe Kachali
33
Individual learning
One aspect of better crisis management is the ability of the organisation to learn. In thinking of
organisations as systems, one of the most important components of that system is the people
who make up the organisation (Kaplan & Norton, 2004b). A discussion on organisational
learning would be incomplete without mention of individual learning. It can be deduced that
when an individual learns, the organisation also learns. Kim (1996) writes that even though there
does not exist a universal definition of organisational learning, the important thing is how
individual learning is transferred to or incorporated in the organisation. Organisational crisis
learning can be divided into 3 stages, all of which involve the human aspect:
pre- (prior personal experience, history);
intra- (lessons learnt during a crisis); and
post-crisis learning (feedback, debrief, commissions of enquiry) (Newlove, Stern, &
Svedin, 2003; Stern, 1997).
Fundamentally, individuals should learn what is relevant for the purpose of the organisation and
they should learn well. In a crisis situation, this is even more important, especially given the
heightened uncertainty of the environment. It is argued that people are more motivated to bring
about positive change when they feel they have a stake in the life of the organisation (Collins,
2001).
2.4.3 Possible impediments to preparation for crises
In the disaster literature, Mileti and Sorensen (1987) posit that the degree of damage wrought by
disasters like earthquakes can be lessened if appropriate preparatory measures are taken prior to
the disaster. For instance, Spittal et al (2005, 2008) in their findings from work on preparedness
for earthquakes, report that optimistic bias may affect the preparation for hazard events.
Optimistic bias (originally unrealistic optimism by Weinstein (1980)) is the inclination people
have that negative actions are less likely to happen to them. This mindset could lead to
inadequate planning and preparation for hazard events leading to catastrophic losses.
Additionally, Senge (2006) states that organisations maintain long-term memory and
organisational culture through the processes and procedures they establish and practice in their
34 A review of the literature
day-to-day operations. These ingrained organisational routines may have a bearing on how
organisations manage disasters. For instance, when faced with a disaster event organisations
might carry on with normal routines in trying to deal with the crisis when a response
commensurate with the situation is called for (T. C. Powell, 1991). This is supported by Staw et
al (1981, p. 507) who write that for some organisations, dealing with an extraordinary crisis
situation such as that brought on by an earthquake may lead to a maladaptive reaction that
threatens the organisation’s survival, even when the same organisation is perfectly capable of
handling other problems with which they are more familiar.
Even while organisations employ the all-hazards view in crisis preparation and mitigation, no
two crises are identical and each crisis should be thought of as a learning experience (D Smith &
Sipika, 1993). This is related to organisations learning continuously. Leveson (2010) suggests that
organisations should take up new, more sophisticated, systemic methods for the analysis of
failure as systems have become more complex. Depending on the scale of analysis, methods of
problem solving which are built around cause and effect having a linear relationship, which is not
the case with complex systems, (Leveson, 2010) should be avoided. Additionally, there are some
hazards that are truly unique but should still be considered in planning. As the 2010 and 2011
Canterbury earthquakes and Hurricane Katrina in 2004 show, although it is known that a major
event might happen, the effects caused by the event are difficult to predict in their entirety. Taleb
(2007) writes about such events and calls them Black Swans; where humans are blind to and in
denial of the fact that extreme events they have not thought of could occur. To cope with Black
Swan events, Taleb advises that people and organisations should be built robustly to protect
them against the negative type of Black Swan event while allowing them to take advantage of
the positive type. Another impediment might involve the thinking that after surviving one
disaster, organisations may think that they can survive the next one (Mitroff et al., 2004).
While there are some impediments to preparing for crisis and that it is not possible to be
prepared for every scenario, some amount of preparation can ensure that the organisation has a
starting point after a disaster occurs. For instance, in how to contact staff.
2.4.4 Inter-organisational and inter-sectoral dependencies
The environment of an organisation is made up of many entities. Nystrom and Starbuck (1981)
advise that distinguishing organisations from their environments is not an easy task and may
Key elements of sectoral recovery and resilience after the Canterbury earthquakes: A system dynamics approach
Hlekiwe Kachali
35
distort the reality of the interactions among them. Evan (1965) typified a focal organisation and
all actors that interact with it as an organisation set. In the organisation set, these interactions
vary in their formality and frequency and can be co-operative, neutral or conflicting. For
instance, an organisation may have frequent contact with its customers, co-operative interactions
with suppliers and conflict with any elements that might disturb the organisation achieving its
goals. Evan adds that some of these interactions are specific in extent and can be because of
factors such as the organisation’s location or industry sector.
Dawson (1992) explains that the interactions an organisation has can be put into three broad
categories; interactions to do with the supply of inputs, interactions to do with distribution of
output goods and services, and regulatory interactions of the organisation’s operations and
transactions.
Furthermore, in this thesis, a group of organisations that operate in the same segment of the
economy or share a similar business type are characterised as making up a sector. Sector and
industry sector will be used interchangeably in this thesis. As there are interactions and
dependencies between organisations in the same or different sectors, it follows that there are
interactions and dependencies between sectors also.
2.5 Recovery
Before investigating factors that contribute to recovery, there is a need to define the concept.
Just as with the concepts of crisis, disaster or risk, recovery also has myriad definitions,
dependent on the context of recovery under examination and to a lesser extent on academic
discipline. The definition of recovery is important because the description of what recovery
looks like and incorporates is an extension of the definition of the purpose of a system. From
the disaster literature some of the definitions of recovery are shown in Table 2-2.
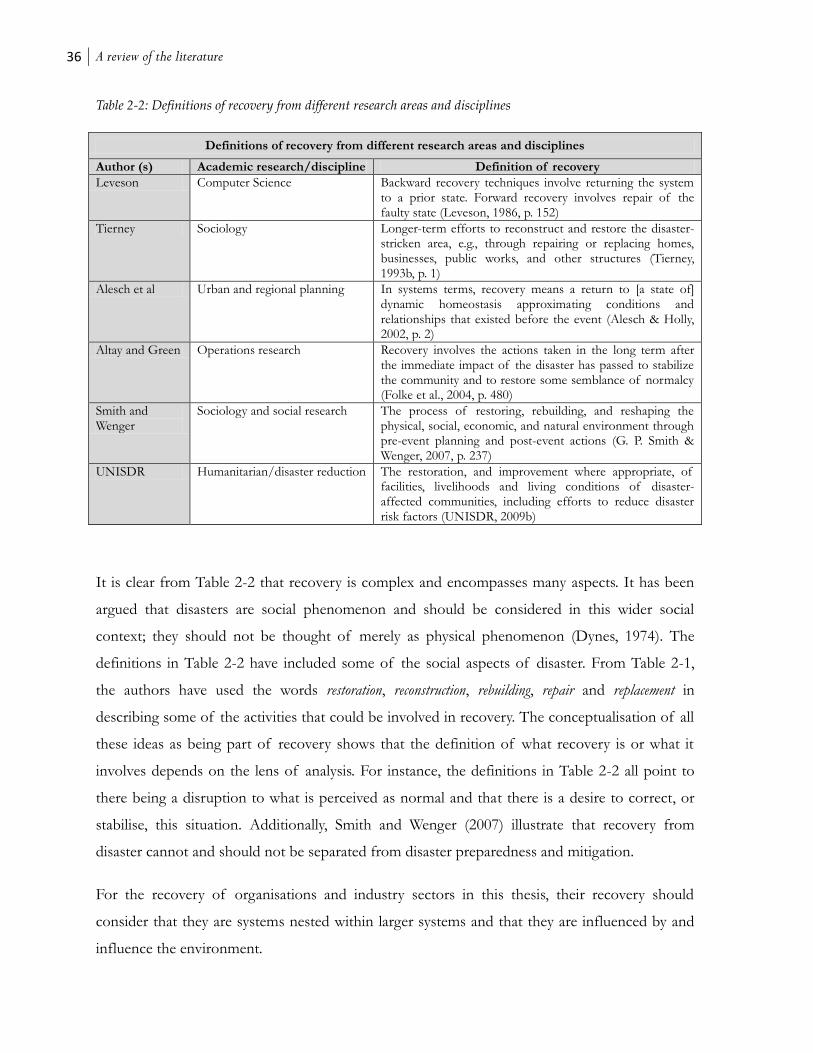
36 A review of the literature
Table 2-2: Definitions of recovery from different research areas and disciplines
Definitions of recovery from different research areas and disciplines
Author (s) Academic research/discipline Definition of recovery
Leveson Computer Science Backward recovery techniques involve returning the system to a prior state. Forward recovery involves repair of the faulty state (Leveson, 1986, p. 152)
Tierney Sociology Longer-term efforts to reconstruct and restore the disaster-stricken area, e.g., through repairing or replacing homes, businesses, public works, and other structures (Tierney, 1993b, p. 1)
Alesch et al Urban and regional planning In systems terms, recovery means a return to [a state of] dynamic homeostasis approximating conditions and relationships that existed before the event (Alesch & Holly, 2002, p. 2)
Altay and Green Operations research Recovery involves the actions taken in the long term after the immediate impact of the disaster has passed to stabilize the community and to restore some semblance of normalcy (Folke et al., 2004, p. 480)
Smith and Wenger
Sociology and social research The process of restoring, rebuilding, and reshaping the physical, social, economic, and natural environment through pre-event planning and post-event actions (G. P. Smith & Wenger, 2007, p. 237)
UNISDR Humanitarian/disaster reduction The restoration, and improvement where appropriate, of facilities, livelihoods and living conditions of disaster-affected communities, including efforts to reduce disaster risk factors (UNISDR, 2009b)
It is clear from Table 2-2 that recovery is complex and encompasses many aspects. It has been
argued that disasters are social phenomenon and should be considered in this wider social
context; they should not be thought of merely as physical phenomenon (Dynes, 1974). The
definitions in Table 2-2 have included some of the social aspects of disaster. From Table 2-1,
the authors have used the words restoration, reconstruction, rebuilding, repair and replacement in
describing some of the activities that could be involved in recovery. The conceptualisation of all
these ideas as being part of recovery shows that the definition of what recovery is or what it
involves depends on the lens of analysis. For instance, the definitions in Table 2-2 all point to
there being a disruption to what is perceived as normal and that there is a desire to correct, or
stabilise, this situation. Additionally, Smith and Wenger (2007) illustrate that recovery from
disaster cannot and should not be separated from disaster preparedness and mitigation.
For the recovery of organisations and industry sectors in this thesis, their recovery should
consider that they are systems nested within larger systems and that they are influenced by and
influence the environment.

Key elements of sectoral recovery and resilience after the Canterbury earthquakes: A system dynamics approach
Hlekiwe Kachali
37
2.5.1 Sectoral and organisational recovery
It is the opinion of the author that recovery encompasses all of the ideas in Table 2-2 and is not
about returning to how things were before a disaster eventuated. This is impossible as even in
non-disaster circumstances, everything changes with time. Alesch at al., (2009) in looking at
community recovery after different disasters attest to this. For the purposes of this thesis,
recovery of an organisation8 or sector is defined as
when an organisation or sector can function and sustain itself (continually) in its new post-disaster environment.
Recovery is also about setting the conditions where organisations can thrive, so not only
rebuilding and recovering for the short-term but also about orienting the wider economic, social
and political conditions of an area in order for organisations to prosper in the medium- to long-
term. Additionally, organisations and sectors are affected in different ways by disaster; these
effects (or impacts) can be direct or indirect and can be positive or negative.
2.5.2 Organisational recovery after disaster
With every disaster, it is evident that the losses that result are not instantaneous. Instead, they
accrue over time. This is partly to do with systemic characteristics of non-linear cause and effect
as well as delays (see chapter 8.4.2 for more detail on system delays and environmental time
delays). Even more, the effects of disaster should be placed in context; organisations, industry
sectors, people and places are not affected the same by disaster and the process of recovery can
be long, complex and arduous.
With the increasing numbers and costs of disaster, there has been a lot of interest in recovery
from various parties such as governments, local authorities, insurers and the disaster research
community at large. However, after a review of the disaster literature, recovery (especially for
response and short-term recovery) after disaster does not seem to have been rigorously
examined and outlined. Quarantelli (1999) and Rubin (2009) propose that this is likely because
the process of recovery is lengthy and complex and involves physical, social, political and
8 Dawson (1992, p. xviii) defines organisations as collections of people joining together in some formal association in order to achieve
group or individual objectives.
38 A review of the literature
economic aspects. The involvement of these different aspects pointed out by Quarantelli and
Rubin means that recovery is a systemic process and where systems analysis should be used.
Alesch (2002) also advocates planning for recovery from a systems point of view. Further
examination of the disaster literature shows that the process of recovery is without a clearly
determinable point of completion. While this point is valid, it can be argued, that depending on
the definition of recovery, i.e. aligned with the purpose of the system, it may be possible to
recognise recovery at some point from a disaster event.
In the disaster and recovery literature, there are numerous studies that have analysed different
aspects of recovery for organisations but this has been done in the context of the recovery of
larger areas or economies. Losses from recovery have traditionally also been looked at from the
household or regional level. However these aggregated loss reports (e.g. Kunreuther and Fiore
(1966), Alexander (1981), Okuyama (2003)) do not tell the story of how different industry
sectors and organisations are affected differently by a disaster event. The task is made even more
formidable because of the deficiency of relevant information, data and methods in the disaster
literature for evaluating recovery after disaster. The development of a framework for system
influences on recovery will be one contribution of this thesis. Additionally, the effects of
disaster are usually reported in terms of physical damage to the built environment, injury or loss
of life. However, there are additional social and economic consequences that extend temporally
and spatially. For example, physical damage to buildings and infrastructure can lead to disruption
of operations and routines in organisations and communities. This disruption, often intangible
or indirect, is frequently difficult to measure and can have regional, national and international
repercussions.
Influences on organisational recovery
From the available literature, there are numerous determinants put forward as having an
influence on organisational recovery after a hazard event turns into a disaster. These include the
level of physical damage, damage to the organisation’s non-structural elements such as
machinery (Godschalk, 2003; Webb, Tierney, & Dahlhamer, 2002) and also the location of the
organisation’s premises (Alesch, Holly, Mittler, & Nagy, 2001). Runyan (2006) further illustrates
the role that an organisation’s physical location plays in determining the types and magnitude of
effects experienced by the organisation. The location of the organisation, e.g. in a central

Key elements of sectoral recovery and resilience after the Canterbury earthquakes: A system dynamics approach
Hlekiwe Kachali
39
business district or a rural area, as well as the pre-disaster trends and plans that have shaped the
area’s development are all part of this physical context. For example, Chang and Nojima (2001)
showed that urban areas that experienced decentralisation before a disaster often see an
acceleration of this trend in the recovery period. Decentralisation can lead to organisations
having local customers. Organisations that have a local custom, especially those in retail that rely
on foot-traffic, tend to recover more slowly (Alesch & Holly, 1998; Chang & Falit-Baiamonte,
2002; Kroll, Landis, Shen, & Stryker, 1991). Alesch and Holly (1996) in their study of businesses
disrupted by the 1994 Northridge earthquake, found that businesses located in highly damaged
areas, especially if they depended heavily on a local customer-base, suffered proportionately
more than others.
Alesch and Holly (1998), Kroll et al (Kroll, 1991), as well as Tierney and Dahlhamer (1997) have
all noted that the size of the business or its financial state before a disaster can act to influence
its recovery. Other reasons that could contribute to the recovery of organisations after disaster
include the need for the organisation’s goods and services after a disaster event, the access to
needed resources as well as the leadership style in the organisation (Alesch et al., 2009).
Furthermore, organisations affected by disaster face disruptions that flow on to the community
and other organisations that depend on them (Tierney & Nigg, 1995; Webb et al., 2002).
The literature also contains accounts of recovery based on empirical observation of community
attempts at recovery after disaster, for example Alesch et al., (2009), Webb at al., (2002) as well as
Galbraith and Stiles (2006). Other authors have looked at recovery from the perspective of the
need for adequate shelter and how this affects recovery (Bolin & Stanford, 1991; Comerio, 1997;
Quarantelli, 1982a; Wu & Lindell, 2004). Some studies have specifically focused on the
mitigation of critical infrastructure loss or disruption as a way of mitigating the wider effects of
disaster (Chang, Svekla, & Shinozuka, 2002; Gordon, Richardson, & Davis, 1998; Rose,
Benavides, Chang, Szczesniak, & Lim, 1997).
However, there are not many studies in the organisational recovery literature that have been
intentionally conducted to investigate how industry sectors recover from disaster. Some
exceptions are Ritchie (2003) and Shrivastava (1988): Ritchie focused on the tourism industry
while Shrivastava investigated the accident at Bhopal. Other authors such as Anderson (1969)
40 A review of the literature
and Tierney (1993a, 1997) have also touched on facets of sectoral recovery. In an 18 month long
study of 23 organisations involved in the emergency community response after the 1964
earthquake in Anchorage, Alaska, Anderson (1969) reports that 73% of the organisations
studied changed structurally and/or functionally because of the earthquake. For some of the
organisations in Anderson’s study, the disaster led to the emergence of new patterns of change
while in other organisations it hastened pre-existing trends. Anderson further found that
organisations experienced this change when the earthquake significantly altered their
environments, for example, by creating new demands, and when it brought about or intensified
already present internal problems such as organisational tensions. In later work, Tierney (1993a,
1997) conducted studies of organisational recovery after the 1993 Midwest floods and 1994
earthquake at Northridge by sampling organisations using business type and business size. For
the organisations affected by the floods, results show that a disruption to critical infrastructure
services affected the organisations more than the actual flooding. Businesses affected by the
Northridge earthquake showed that some of the losses suffered by businesses were caused by
disruption to the businesses and were not just from physical damage.
From other analyses of disaster recovery in general, there have been indications that
organisation type or industry sector do have a bearing on post-disaster effects on organisations.
For example, in examining the effects in the aftermath of the 1989 Loma Prieta earthquake in
the San Francisco Bay Area of California, Kroll et al. (1991) found that single location retail and
service organisations in the cities of Santa Cruz and Oakland, experienced greater losses and
had more difficulty recovering when compared to other types of organisations. Despite these
findings, Dahlhamer and Tierney (1998) found that industry sector was not a statistically
significant predictor of short-term business recovery in Santa Cruz after the Loma Prieta
earthquake or in South Dade after Hurricane Andrew. In a follow-up study with the same
businesses conducted by Webb et al. (2002), economic sector was found to be a strong predictor
of long-term recovery in South Dade but not in Santa Cruz.
Some of the theories outlined above, on the determinants of recovery, will be tested in chapter 7
of this thesis. Additionally, results from various studies serve to show that there are several
factors that interact to influence the recovery of organisations and industry sectors after disaster.
Recovery for an organisation begins before the disaster manifests by the existence of
organisational planning and environmental conditions for the prevention and detection of
Key elements of sectoral recovery and resilience after the Canterbury earthquakes: A system dynamics approach
Hlekiwe Kachali
41
potential disaster. Crises will happen and even the best laid plans will eventually be put to the
test. Turner (1976), Smith and Sipika (1993) and others demonstrate how crisis planning alone is
insufficient, organisations should also plan how to respond to and manage crises as well as the
aftermath. This is in part because the impacts of the disaster are influenced by some of the
decisions that are arrived at and actions taken before and after disaster. For example, an
organisation with no disaster insurance might have to dip into its much needed own cash
reserves to finance recovery, while the loss of a key customer or supplier because of crisis can
also affect organisational recovery. This goes back to the system and its environment influencing
each other. It should be kept in mind that systems thinking is an aid in analysis of the many
interacting components involved in organisational and sectoral recovery.
Supply Web9 aspects of disaster recovery
Organisations work with and rely on each other to exchange inputs (e.g. raw materials,
information) that are then transformed into goods and services for commerce (Lambert &
Cooper, 2000). For the provision of goods and services, organisations require input material
sourced from various suppliers who together form a supply chain (Lambert & Cooper, 2000), or
web. In essence, and taking the systems perspective, all the structures and processes that are used
by an organisation10 to deliver goods and services to its customers are part of its supply web.
Harland (1996) states the same. Figure 2-4 illustrates the primary elements in an organisation’s
supply web and shows the flow of material from suppliers to end customers through processes
of conversion and distribution. Of importance in Figure 2-4 is the information that flows in the
supply web. The flows in the web are governed by the organisation’s control systems and
processes and corporate culture.
9 A supply chain implies a linear relationship between a focal organisation, suppliers, customers and infrastructure used to
manufacture/produce and deliver goods and services. From a system dynamics point of view, the interactions between these
system actors is non-linear, hence the idea of the supply web
10 The organisation at the centre of a supply web will herein be referred to as the focal organisation

42 A review of the literature
Figure 2-4 - Elements of a supply web (adapted from (Sheffi & Rice, 2005))
Supply Chain Management (SCM) is important as it deals with operations management,
materials and production which may be affected by disaster. As one way of increasing and
maintaining the competitive advantage of the organisation, the management of its supply web is
now seen as vital. Porter (1998) reiterates this when he shows the significance and benefits of
utilising an organisation’s internal and external connections. From a systems perspective, a
supply web has essential parts that include but are not limited to suppliers, production facilities,
distribution services as well as customers, all connected by way of the forward flow of materials and
the feedback flow of information (Stevens, 1989). Such crucial links have a bearing on the recovery of
an organisation post-disaster.
Over time, many organisations have spent vast amounts of resources in trying to predict and
control their supply web (Choi, Dooley, & Rungtusanatham, 2001). In addition, supply web
managers now need to harmonise the need for organisational demands such as low-cost and
efficiency with the knowledge that the supply web might fail (Christopher & Peck, 2004;
Kleindorfer & Saad, 2005). For instance, in the 1950s, Taiichi Ohno of Toyota developed what
came to be known as lean manufacturing (LM) (Sato & Hoshino, 1984) based on increasing
efficiency and decreasing waste as a way of managing the supply web. LM is driven by forecast
rather than demand which leads to tight coupling between supply and demand and which makes
the organisation vulnerable to supply web disruptions (Christopher, 2000; Christopher &
Supply
Corporate Culture
Distribution Conversion
Control Systems
Information
Key elements of sectoral recovery and resilience after the Canterbury earthquakes: A system dynamics approach
Hlekiwe Kachali
43
Rutherford, 2004). This means that organisations have to find the balance between an efficient
supply web and a resilient supply web.
Several authors (Asbjornslett, 1999; Bak et al., 1988; Pathak, Day, Nair, Sawaya, & Kristal, 2007)
are of the view that organisations should understand not only how a disaster event might affect
their assets; they also need to prepare and plan for what effects this might have on their supply
web and other organisational structures and processes. As supply webs are made up of
organisations from various industries, it can be argued that they should be treated as complex
adaptive systems that are tightly-coupled. From the systems point of view, the failure of one
organisation might lead to adverse consequences to its supply web as the system is
interdependent (Christopher & Peck, 2004). For example, a deviation from the usual
consumption, as is possible after disaster, can lead to changes in supply starting at one node
which could then be amplified along the supply web. This is systemic non-linear feedback. In the
beer game11 designed by Jay Forrester (Sterman, 1989) it was illustrated that this is partly the
effect of the individual reactions to the change of information as it travelled along the supply
web and the inability of the members of the chain to recognise that the different parts of the
supply chain are interconnected. This further shows that the reduction of a whole to its
component parts presents a distorted picture of how the individual parts work together.
There has been recognition that the recovery of organisations after disaster can be affected by
and is closely linked to upstream and downstream supply web partners (Christopher & Peck,
2004; Finch, 2004). For instance, an organisation’s inability to meet a critical customer’s supply
needs for an extended period might compel the customer to turn to other suppliers for the
foreseeable future which would affect the recovery of an organisation at the time when it is
crucial for them to be trading. This was seen after the 2011 Japanese earthquake; one of the
indirect effects was the disruption to the global motor vehicle supply web. This was due to the
inability of organisations in the disaster affected area to supply parts or to assemble motor
vehicles (Canis, 2011). This is related to points made in chapter 2.2.2 on the time horizon in a
system being important and on system hierarchy and self-organisation. The different but
11 The beer game was invented by Jay Forrester and is a role-play supply chain simulation that lets students experience typical
supply chain problems. It can be played at http://www.beergame.org/the-game, accessed 19 July 2012.
44 A review of the literature
interlinked (sub)-parts of the system have differing timescales. On the one hand customers need
goods and services in a certain timeframe which does not match the post-disaster delivery times
of affected organisations. However, customers can organise themselves by turning to other
suppliers for goods and services.
In today’s exceedingly interconnected world, organisations are even more vulnerable to
disruptions of the supply web. Organisations now need to learn how to prevent or mitigate this
particular kind of risk. Starr et al (2003) advocate this when they state that organisations now
face a more complex interdependent type of risk. Notwithstanding any measures an
organisation may take, just as with any other type of risk, it is all but impossible to eliminate all
risk from the supply web. The supply web is part of the organisation’s environment enabling the
delivery of goods and services and may be affected in a regional disaster. Therefore, it is vital
that supply web aspects be considered in looking at organisational or sectoral recovery.
2.6 Framework for recovery after disaster
The path recovery takes can be long and there are different influences on this as one moves
away from the initial point of the disaster event. It is these influences on recovery that are of
great import to organisations as well as policy- and decision-makers. This temporal trajectory of
recovery can be used to understand that what happens many months after disaster in the main
recovery phase is as important as what took place in the response and early recovery phase.
One of the most well-known models for recovery, based on practical experience, is the cyclical
process of recovery after [natural] disaster proposed by Haas, Kates and Bowden (1977) and
shown in Figure 2-5. The process involves four separate stages: the emergency phase, the
restoration phase, the replacement reconstruction phase and the developmental reconstruction
phase. The emergency phase begins immediately after the disaster event and can last for several
weeks or months depending on the severity of the damage caused by the disaster event. It
involves search and rescue operations, debris clearing, and basic utility and infrastructure
restoration. The restoration of utilities can include temporary bridges, temporary water and
sewage lines, and generator power to critical facilities and systems. The restoration phase
includes all permanent repairs to facilities and infrastructure. The replacement construction
phase is described as where construction of housing and workplaces takes place while the
development reconstruction phase involves putting up correspondent infrastructure such as
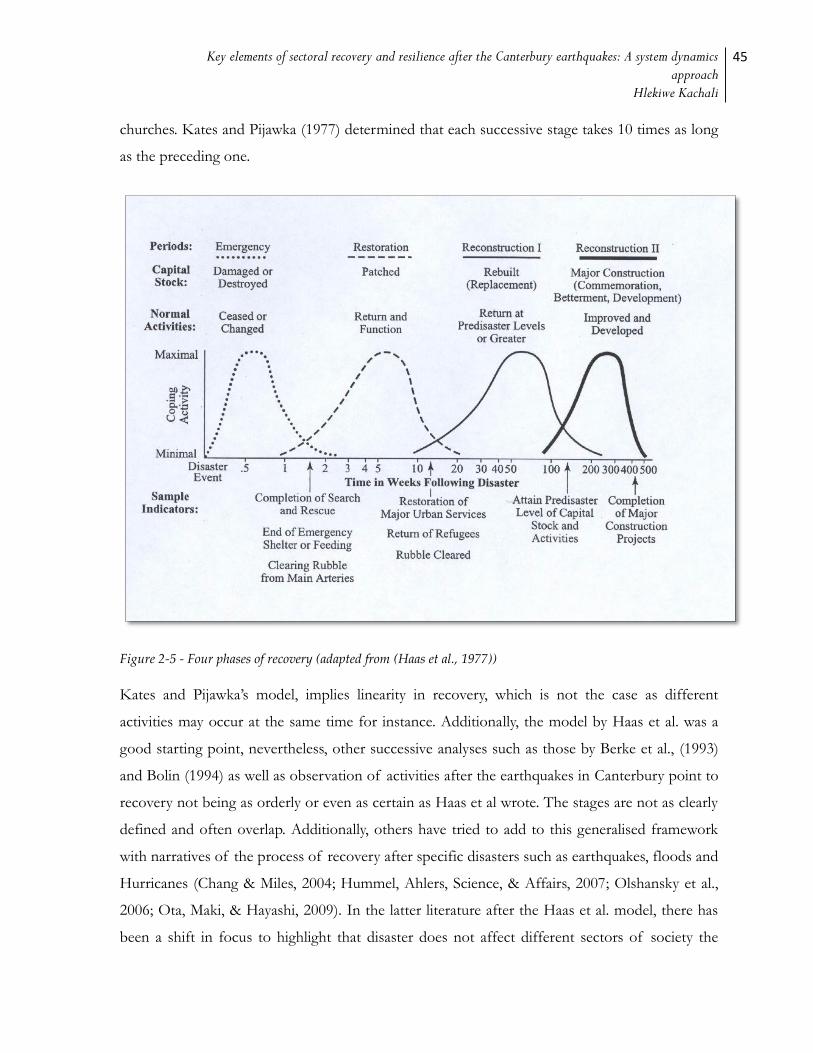
Key elements of sectoral recovery and resilience after the Canterbury earthquakes: A system dynamics approach
Hlekiwe Kachali
45
churches. Kates and Pijawka (1977) determined that each successive stage takes 10 times as long
as the preceding one.
Figure 2-5 - Four phases of recovery (adapted from (Haas et al., 1977))
Kates and Pijawka’s model, implies linearity in recovery, which is not the case as different
activities may occur at the same time for instance. Additionally, the model by Haas et al. was a
good starting point, nevertheless, other successive analyses such as those by Berke et al., (1993)
and Bolin (1994) as well as observation of activities after the earthquakes in Canterbury point to
recovery not being as orderly or even as certain as Haas et al wrote. The stages are not as clearly
defined and often overlap. Additionally, others have tried to add to this generalised framework
with narratives of the process of recovery after specific disasters such as earthquakes, floods and
Hurricanes (Chang & Miles, 2004; Hummel, Ahlers, Science, & Affairs, 2007; Olshansky et al.,
2006; Ota, Maki, & Hayashi, 2009). In the latter literature after the Haas et al. model, there has
been a shift in focus to highlight that disaster does not affect different sectors of society the

46 A review of the literature
same: there are variations in the rates and paths of recovery including for industry sectors and
individual organisations. This has made more prominent some of the factors that have been
reported in the literature as affecting the recovery of different organisations.
In the Canterbury context, apart from recovery not being a linear process, the time horizons in
the model by Haas et al do not fit. To start, Canterbury experienced multiple large aftershocks at
different times from the initial earthquake on 4 September 2010 event. Another difference that is
not accounted for in the Canterbury sequence of earthquakes is that different parts of the
greater Christchurch area were affected to varying degrees. Haas et al do not detail what recovery
looks like for such a scenario. In general, it would appear that the Haas et al model focuses on
the built environment. However, the social, economic, political and other aspects of disaster
need to be included also. Some of these aspects are covered in Pugsley’s (1973) model on the
proneness of structures to failure.
As yet, there has not been a comprehensive account of recovery after disaster from the
perspective of the organisation or industry sector and the systemic interdependencies that affect
this recovery. Hence the need for a more consolidated and integrated approach to the subject of
disaster recovery for organisations. One of the aims of this thesis, and using the system
dynamics approach, is to advance the knowledge of the elements that influence the recovery of
organisations and sectors.
2.7 Organisational resilience
In 2005, at the United Nations World Conference on Disaster Reduction, the concept of
resilience was adopted via the Hyogo Framework for Action 2005-2015. This relates to and calls
for the focal points to be on the prioritisation of risk identification and reduction; the
enhancement of early warning systems; the building of a culture of safety and resilience, and the
strengthening of disaster preparedness and response capabilities (UNISDR, 2005).
In order to avoid repeated crises or disasters that leave organisations unable to cope, the idea of
organisational resilience has been put forward as a means for organisations to maintain their
ability in the face of crisis (Hamel & Välikangas, 2003; Seville et al., 2008; Tierney, 2003). One
argument in this thesis is that this general concept of organisational resilience should be
extended into that of organisational disaster resilience. Several authors (Brewer, Weinstein, Cuite,
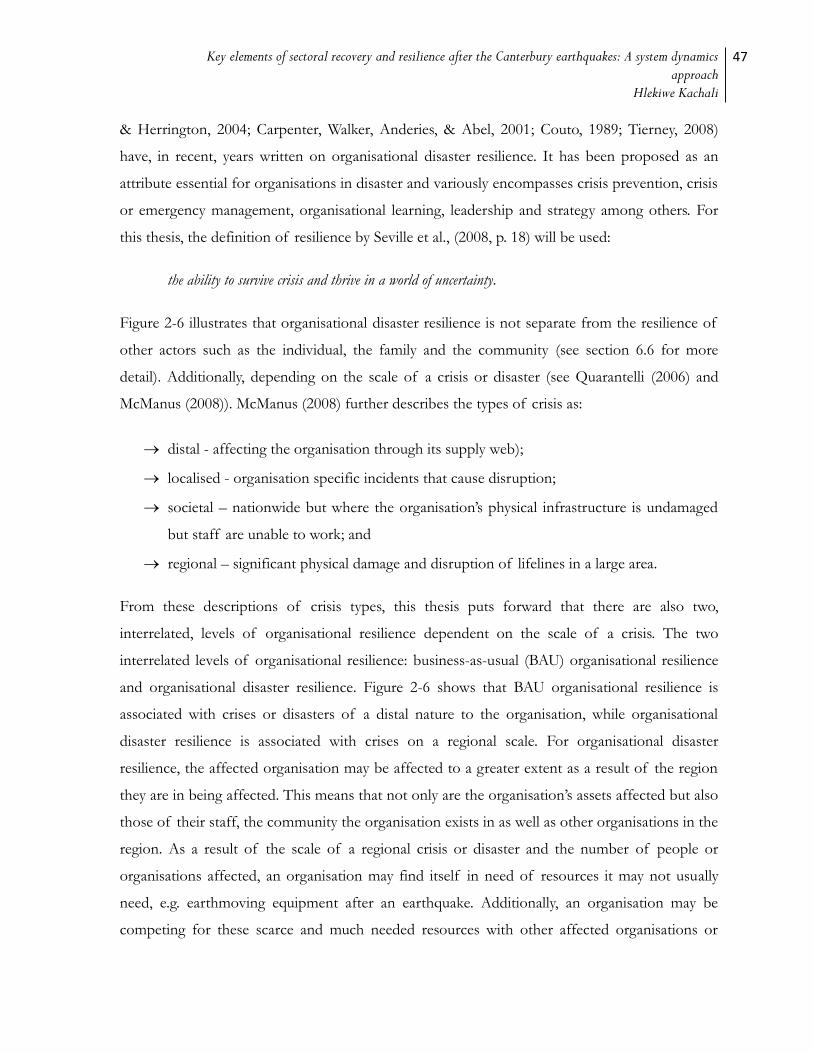
Key elements of sectoral recovery and resilience after the Canterbury earthquakes: A system dynamics approach
Hlekiwe Kachali
47
& Herrington, 2004; Carpenter, Walker, Anderies, & Abel, 2001; Couto, 1989; Tierney, 2008)
have, in recent, years written on organisational disaster resilience. It has been proposed as an
attribute essential for organisations in disaster and variously encompasses crisis prevention, crisis
or emergency management, organisational learning, leadership and strategy among others. For
this thesis, the definition of resilience by Seville et al., (2008, p. 18) will be used:
the ability to survive crisis and thrive in a world of uncertainty.
Figure 2-6 illustrates that organisational disaster resilience is not separate from the resilience of
other actors such as the individual, the family and the community (see section 6.6 for more
detail). Additionally, depending on the scale of a crisis or disaster (see Quarantelli (2006) and
McManus (2008)). McManus (2008) further describes the types of crisis as:
distal - affecting the organisation through its supply web);
localised - organisation specific incidents that cause disruption;
societal – nationwide but where the organisation’s physical infrastructure is undamaged
but staff are unable to work; and
regional – significant physical damage and disruption of lifelines in a large area.
From these descriptions of crisis types, this thesis puts forward that there are also two,
interrelated, levels of organisational resilience dependent on the scale of a crisis. The two
interrelated levels of organisational resilience: business-as-usual (BAU) organisational resilience
and organisational disaster resilience. Figure 2-6 shows that BAU organisational resilience is
associated with crises or disasters of a distal nature to the organisation, while organisational
disaster resilience is associated with crises on a regional scale. For organisational disaster
resilience, the affected organisation may be affected to a greater extent as a result of the region
they are in being affected. This means that not only are the organisation’s assets affected but also
those of their staff, the community the organisation exists in as well as other organisations in the
region. As a result of the scale of a regional crisis or disaster and the number of people or
organisations affected, an organisation may find itself in need of resources it may not usually
need, e.g. earthmoving equipment after an earthquake. Additionally, an organisation may be
competing for these scarce and much needed resources with other affected organisations or
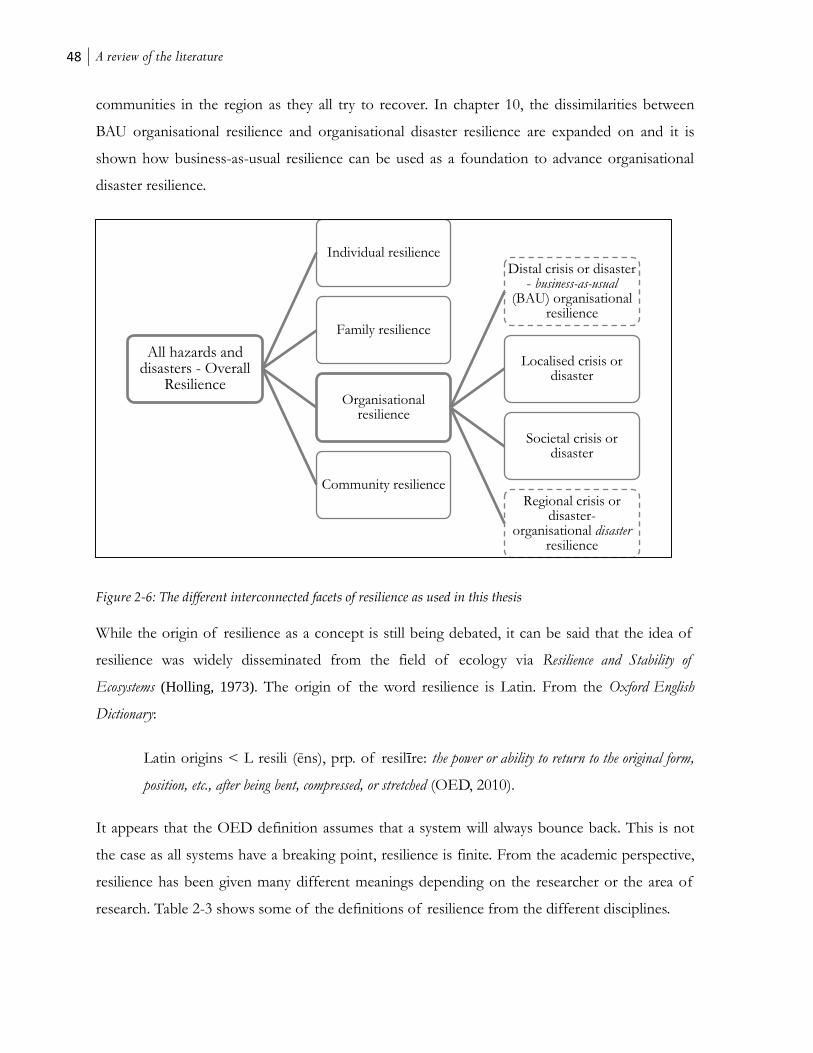
48 A review of the literature
communities in the region as they all try to recover. In chapter 10, the dissimilarities between
BAU organisational resilience and organisational disaster resilience are expanded on and it is
shown how business-as-usual resilience can be used as a foundation to advance organisational
disaster resilience.
Figure 2-6: The different interconnected facets of resilience as used in this thesis
While the origin of resilience as a concept is still being debated, it can be said that the idea of
resilience was widely disseminated from the field of ecology via Resilience and Stability of
Ecosystems (Holling, 1973). The origin of the word resilience is Latin. From the Oxford English
Dictionary:
Latin origins < L resili (ēns), prp. of resilīre: the power or ability to return to the original form,
position, etc., after being bent, compressed, or stretched (OED, 2010).
It appears that the OED definition assumes that a system will always bounce back. This is not
the case as all systems have a breaking point, resilience is finite. From the academic perspective,
resilience has been given many different meanings depending on the researcher or the area of
research. Table 2-3 shows some of the definitions of resilience from the different disciplines.
All hazards and disasters - Overall
Resilience
Individual resilience
Family resilience
Organisational resilience
Distal crisis or disaster - business-as-usual
(BAU) organisational resilience
Localised crisis or disaster
Societal crisis or disaster
Regional crisis or disaster-
organisational disaster resilience
Community resilience
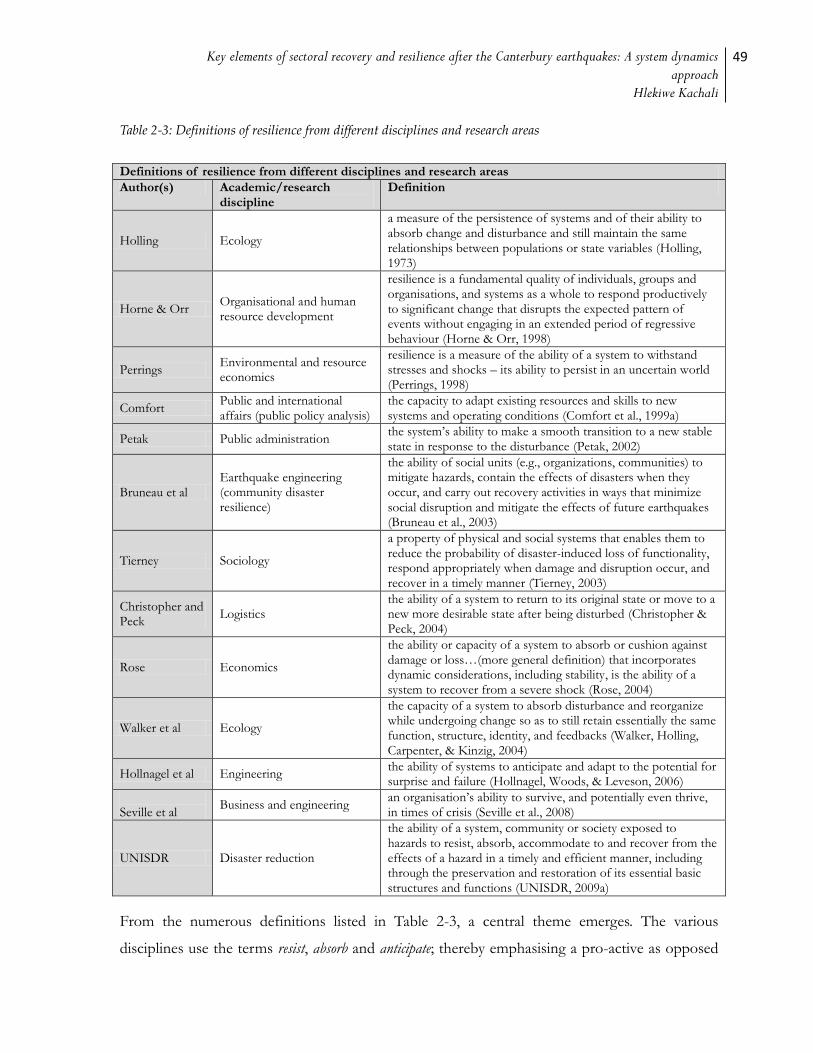
Key elements of sectoral recovery and resilience after the Canterbury earthquakes: A system dynamics approach
Hlekiwe Kachali
49
Table 2-3: Definitions of resilience from different disciplines and research areas
Definitions of resilience from different disciplines and research areas
Author(s) Academic/research discipline
Definition
Holling Ecology
a measure of the persistence of systems and of their ability to absorb change and disturbance and still maintain the same relationships between populations or state variables (Holling, 1973)
Horne & Orr Organisational and human resource development
resilience is a fundamental quality of individuals, groups and organisations, and systems as a whole to respond productively to significant change that disrupts the expected pattern of events without engaging in an extended period of regressive behaviour (Horne & Orr, 1998)
Perrings Environmental and resource economics
resilience is a measure of the ability of a system to withstand stresses and shocks – its ability to persist in an uncertain world (Perrings, 1998)
Comfort Public and international affairs (public policy analysis)
the capacity to adapt existing resources and skills to new systems and operating conditions (Comfort et al., 1999a)
Petak Public administration the system’s ability to make a smooth transition to a new stable state in response to the disturbance (Petak, 2002)
Bruneau et al Earthquake engineering (community disaster resilience)
the ability of social units (e.g., organizations, communities) to mitigate hazards, contain the effects of disasters when they occur, and carry out recovery activities in ways that minimize social disruption and mitigate the effects of future earthquakes (Bruneau et al., 2003)
Tierney Sociology
a property of physical and social systems that enables them to reduce the probability of disaster-induced loss of functionality, respond appropriately when damage and disruption occur, and recover in a timely manner (Tierney, 2003)
Christopher and Peck
Logistics the ability of a system to return to its original state or move to a new more desirable state after being disturbed (Christopher & Peck, 2004)
Rose Economics
the ability or capacity of a system to absorb or cushion against damage or loss…(more general definition) that incorporates dynamic considerations, including stability, is the ability of a system to recover from a severe shock (Rose, 2004)
Walker et al Ecology
the capacity of a system to absorb disturbance and reorganize while undergoing change so as to still retain essentially the same function, structure, identity, and feedbacks (Walker, Holling, Carpenter, & Kinzig, 2004)
Hollnagel et al Engineering the ability of systems to anticipate and adapt to the potential for surprise and failure (Hollnagel, Woods, & Leveson, 2006)
Seville et al
Business and engineering an organisation’s ability to survive, and potentially even thrive, in times of crisis (Seville et al., 2008)
UNISDR Disaster reduction
the ability of a system, community or society exposed to hazards to resist, absorb, accommodate to and recover from the effects of a hazard in a timely and efficient manner, including through the preservation and restoration of its essential basic structures and functions (UNISDR, 2009a)
From the numerous definitions listed in Table 2-3, a central theme emerges. The various
disciplines use the terms resist, absorb and anticipate; thereby emphasising a pro-active as opposed

50 A review of the literature
to re-active stance in terms of resilience. These definitions also indicate that most disciplines
regard resilience as an end result of other contributing factors rather than as a process. At the
same time, the major line of thinking in terms of resilience is the concept of bouncing back
(Paton, 2007). However, it can be said that resilience especially after disaster is about more than
just bouncing back, it also requires adaptability and transformability as the post-disaster context
is markedly changed. As stated earlier, the definition of organisational resilience used in this
thesis is that of Seville et al (2008, p. 18): the ability to survive crisis and thrive in a world of uncertainty.
The reason for using this definition of organisational resilience is because it is not restricted to
one type of crisis, instead it is all encompassing. As well, it talks of the uncertainty of an
organisation’s environment and the organisation’s possibility to thrive, i.e., to adapt post-disaster.
2.8 Organisational disaster resilience
In this thesis, the perspective on organisational resilience is that of organisational disaster resilience.
This is a focus on how organisations can become less vulnerable and make themselves more
resilient to disaster. Extreme events can cause damage to physical infrastructure, cause
disruptions to organisation and impinge on people’s livelihoods. Disruptions can adversely affect
the operations of organisations and investments in resilience can give a business a competitive
advantage over organisations not as well prepared for dynamic circumstances.
A search in the disaster literature for organisational disaster resilience shows that this is a
relatively young but growing field. In the disaster scholarship, there exists work on the disaster
resilience of communities by Chang and Shinozuka (2004), Paton (2007) and Mayunga (2007). In
addition to this view, there is an emerging, but limited, body of literature that links an
organisation’s level of resilience to its recovery post-disaster (Bruneau et al., 2003; Chang, Rose,
Shinozuka, Svekla, & Tierney, 2000). It appears that this growing focus on organisational disaster
resilience stems from the awareness that some organisations adapt better than others during
times of crisis and turbulence. There is recognition that resilience is a fundamental
organisational attribute that facilitates adaptation, transformability, learning and functional
stability post-disaster. Tierney and Bruneau (2003, p. 14) say of disaster resilience that it
reflects a concern for improving the capacity of physical and human systems to respond to and recover from
extreme events.
Key elements of sectoral recovery and resilience after the Canterbury earthquakes: A system dynamics approach
Hlekiwe Kachali
51
From the Resilience Alliance (2012), resilience as pertaining to socio-ecological systems (of
which organisations are a part) has three defining aspects:
the amount of change the system can undergo and still retain the same controls on
function and structure;
the degree to which the system is capable of self- organisation (recovery); and
the ability to build and increase the capacity for learning and adaptation.
For this thesis, the Resilience Alliance make an important point that a lot of the work reviewed
for this thesis does not: the amount of change the system can undergo. This means that
resilience is not infinite and every system can break depending on the conditions. Additionally,
the adaptive capacity referred to is taken to be the ability of the actors in a system to influence
or direct their resilience. This is a trait of systems that learn and store knowledge. Walker and
Meyers (2004) write that the capacity for forward planning demonstrates the difference between
resilience in ecosystems and social systems.
2.8.1 The need for organisations to be disaster resilient
For some organisations struggling to recover after disaster, the destruction and the task before
them can seem insurmountable. Government departments, critical infrastructure providers, local
authorities, emergency services, businesses, civil society and other community organisations can
all be affected by disaster and should therefore all strive to be disaster resilient. In addition, when
an organisation can demonstrate that it is disaster resilient, this leads to an elevated level of trust
in the organisation from other organisations or people that work with it. For example, in the
case of critical infrastructure providers, the Australian Resilience Expert Advisory Group (2011)
write that a benefit of this is the possibility for less regulation from the government for
organisations seen as resilient.
While organisations that are owned or run by the government may be under mandate not to fail,
the same cannot be said of private enterprise. However, these organisations, part of larger
systems, also carry responsibilities that mean that they should be able to continue to some
extent, in a disaster situation (A. B. Carroll, 1991; Lindgreen & Swaen, 2010). These
responsibilities extend to the organisation’s employees (and by extension the communities these
52 A review of the literature
employees belong to), customers, supply chain partners and shareholders. Were an organisation
to close or to take a long time recovering after disaster, this would have an effect on the
livelihoods and operations of many who depend on it.
To extend this further, organisations are also a part of the social and economic fabric of the
regions they contribute to and could affect a whole region’s social and economic wellbeing if
they failed. For example, organisations whose goods and services are necessary for a region’s
economic growth and by extension its recovery (Popp, 2006). In addition, organisations also
contribute to the community and the region by way of the rates and taxes they pay. Prolonged
disruption or closure of business may put a financial strain on the local or national government
which in turn could have a bearing on development plans (Chang, 1983). Other organisations
that need to be disaster resilient are those that are part of civil society 12 . Aldrich (2008)
examined the role of civil society in recovery after the Kobe earthquake in Japan and concluded
that the quick recovery of some parts of the area was because of the work carried out by civil
society.
2.8.2 Organisational resilience – from theory to application
For most organisations, the overall concept of resilience, its characteristics and how to measure
them remain intangible. Sutcliffe and Vogus (2003) report that there is increased resilience when
emphasis is placed on the positive attributes of individuals and the organisation. According to
Bruneau et al (2003), it is possible to quantify the effects of resilience beforehand by calculating
the losses incurred as a result of resilient actions not carried out before a crisis. This
quantification would be the next step in the previously discussed qualitative indicators proposed
by Heinrich and Pugsley (see section 2.3.2).
Other actions, or metrics, leading to resilience include how long it takes to resolve a crisis should
it occur (Rose, 2004). Resilience can also be measured as savings made by actions such as
sustainable production methods (Fiksel, 2006). Being able to measure resilience in such tangible
ways would help to make resilience a point of discussion in organisational boardrooms as it can
be shown how resilient actions can add to the bottom line. From the system dynamics
perspective, measures of resilience could be how far from a pre-disaster state the system deviates
12 The Oxford English Dictionary (OED) defines civil society as ‘that aspect of society concerned with and operating for the
collective good, independent of state control or commercial influence’. Accessed on 19 July 2012 from www.oed.com
Key elements of sectoral recovery and resilience after the Canterbury earthquakes: A system dynamics approach
Hlekiwe Kachali
53
or the time taken for the system to return to a pre-disaster state or better, for example revenue
earnings for organisations. This makes use of the system characteristic of negative feedback
which is goal seeking. There is more discussion in chapters 7 and 10 on revenue and time as
measures of disaster resilience.
In some cases, organisations fail to realise that environmental changes outside the organisation,
such as those brought on by disaster, necessitate changing the goal(s) of the organisation (Evan
& Black, 1967; D. Kelly & Amburgey, 1991). Other actions of resilient organisations include
redefining the organisation’s goals and aligning these goals with the organisation’s operations
(Rummler & Brache, 1990). The equivalent of this process in systems terms is systems re-
optimisation13.
Additionally, dealing with a crisis effectively is part of being resilient. Knight and Pretty (1996)
showed that organisations that did not deal with crises effectively or adequately suffered a 10%
decrease in the price of their stock after the first week of the crisis and a 15% decrease below
pre-crisis prices in the first year following the crisis. Alternatively, organisations that effectively
managed a crisis had just a 5% stock price dip in the wake of the crisis and the stock price
recovered quickly in the year after the crisis (Knight & Pretty, 1996). For a resilient organisation,
the emphasis should not be on disaster preparedness but on general preparedness for all hazards
and for day-today activities (Reason, 1998).
Lastly, apart from being able to determine the organisation’s level of resilience, organisations are
also concerned with knowing when they should evolve from a certain level of resilience to
another, for instance after disaster when there are many changes and uncertainties. The primary
question is: should organisations strive to get back to the level of disaster resilience they had
prior to the disaster event? On the contrary, a resilient system need not be stable in the
traditional sense. Lebel et al (2006) posit that a resilient system should be stable in being able to
withstand turbulent conditions and still survive, adapting and changing if necessary.
13 To optimise the system and redefine the goal, principles from systems engineering can be used (for more on this, see
Laplante (2007), Sommerville (2000) and Bhamadipiti (2010)).

54 A review of the literature
2.8.3 Measuring organisational resilience
Sutcliffe and Vogus (2003) make the link between organisational resilience and positive
performance at the individual and organisational levels. They also argue that resilience should be
viewed as always being developed, as an ability that develops over time from continually
managing risks. From a systems viewpoint, it can be concluded that resilience is relative, is an
emergent property of the system and changes depending on specific circumstances, i.e. resilience
displayed in one situation may not be sustained over time or transposed to other circumstances.
It is implied in this developmental perspective that resilience depends on the presence of
inherent or dormant resources that can be activated and put together using various permutations
as the situation warrants. For example, Maguire and Hagan (2007) posit that the development of
emergency plans must use some of the inherent existing organisational social resilience as part
of their foundation.
Before disaster strikes, the resilience of an organisation can be strengthened. However, as has
been shown, the idea of resilience is broad and multifaceted. A cardinal point is how to
recognise and determine the level of resilience for an organisation. Therefore it is helpful to
break it down into components that are understandable, easily usable, can be measured, are of
relevance and explain the overall concept. Some work has been undertaken in this area.
McManus (2008) and Stephenson (2010), starting with an appraisal of the wider organisational
literature and using case studies, surveys and focus groups, went on to identify 13 organisational
characteristics that together form the umbrella concept of organisational resilience. These 13
indicators of organisational resilience can be used by organisations to appraise their overall level
of resilience and based on the score for each indicator can also be used for identification of any
possible areas of improvement. These indicators of organisational resilience are sometimes
referred to as the attributes or components of organisational resilience.
The Benchmark Resilience Tool (BRT-53) (Resilient Organisations, 2010b) is a multiple indicator
measure of resilience. Quantification of indicators of resilience allows for the measure of
differentiation of resilience at different points in time. For recovery after disaster, it is as yet
unclear which, if any, of these indicators of organisational resilience has a more substantive
effect. In chapter 10, it will be shown how the BRT-53 can be enhanced for organisational
disaster resilience.
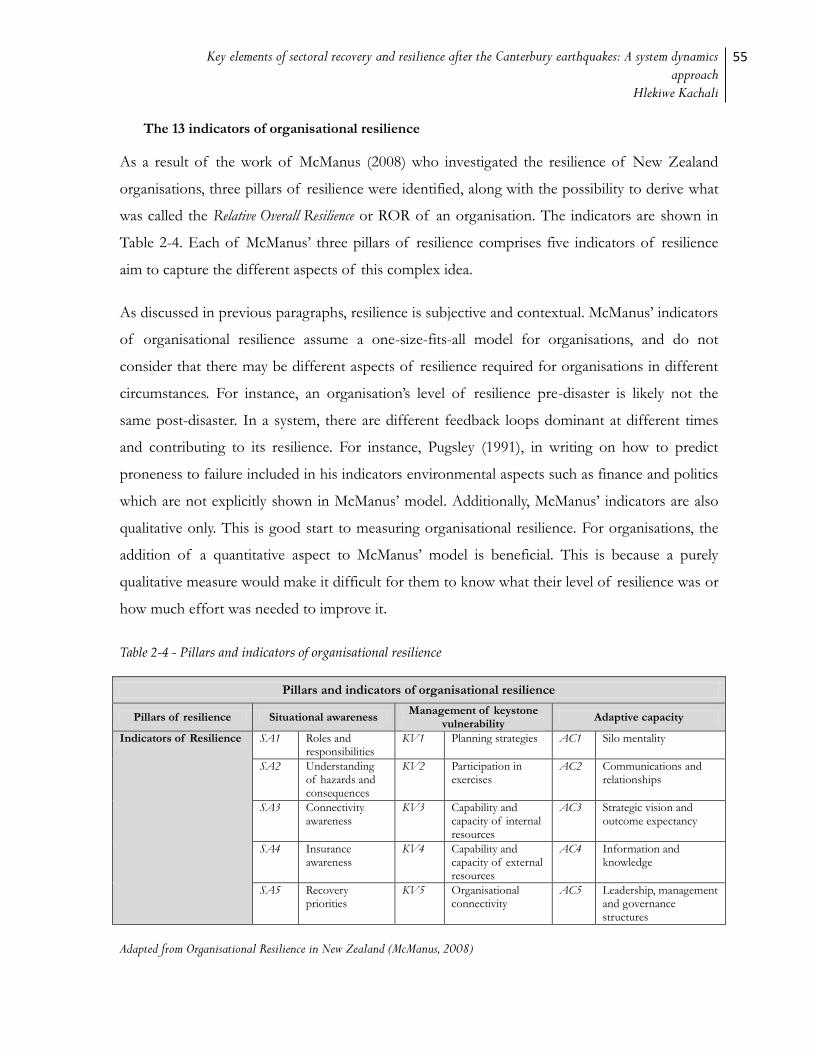
Key elements of sectoral recovery and resilience after the Canterbury earthquakes: A system dynamics approach
Hlekiwe Kachali
55
The 13 indicators of organisational resilience
As a result of the work of McManus (2008) who investigated the resilience of New Zealand
organisations, three pillars of resilience were identified, along with the possibility to derive what
was called the Relative Overall Resilience or ROR of an organisation. The indicators are shown in
Table 2-4. Each of McManus’ three pillars of resilience comprises five indicators of resilience
aim to capture the different aspects of this complex idea.
As discussed in previous paragraphs, resilience is subjective and contextual. McManus’ indicators
of organisational resilience assume a one-size-fits-all model for organisations, and do not
consider that there may be different aspects of resilience required for organisations in different
circumstances. For instance, an organisation’s level of resilience pre-disaster is likely not the
same post-disaster. In a system, there are different feedback loops dominant at different times
and contributing to its resilience. For instance, Pugsley (1991), in writing on how to predict
proneness to failure included in his indicators environmental aspects such as finance and politics
which are not explicitly shown in McManus’ model. Additionally, McManus’ indicators are also
qualitative only. This is good start to measuring organisational resilience. For organisations, the
addition of a quantitative aspect to McManus’ model is beneficial. This is because a purely
qualitative measure would make it difficult for them to know what their level of resilience was or
how much effort was needed to improve it.
Table 2-4 - Pillars and indicators of organisational resilience
Pillars and indicators of organisational resilience
Pillars of resilience Situational awareness Management of keystone
vulnerability Adaptive capacity
Indicators of Resilience SA1 Roles and responsibilities
KV1 Planning strategies AC1 Silo mentality
SA2 Understanding of hazards and consequences
KV2 Participation in exercises
AC2 Communications and relationships
SA3 Connectivity awareness
KV3 Capability and capacity of internal resources
AC3 Strategic vision and outcome expectancy
SA4 Insurance awareness
KV4 Capability and capacity of external resources
AC4 Information and knowledge
SA5 Recovery priorities
KV5 Organisational connectivity
AC5 Leadership, management and governance structures
Adapted from Organisational Resilience in New Zealand (McManus, 2008)

56 A review of the literature
The later work of Stephenson (2010), based on that of McManus (2008) and carried out with
organisations based in Auckland, led to the benchmarking of organisational resilience with the
aim of giving organisations a standard for resilience that they could use as a comparison. From
the Auckland study, based on statistical analysis, Stephenson also developed a restructured,
revised and more refined model of organisational resilience that had 13 indicators of resilience
illustrated in Table 2-5.
Table 2-5: Newer model of organisational resilience
Organisational resilience factors and indicators contained in newer model
Adaptive Capacity Planning
Minimisation of silo mentality Planning strategies
Capability and capacity of internal resources Participation in exercises
Staff engagement and involvement Proactive posture
Information and knowledge Capability and capacity of external resources
Leadership, management and governance structures
Recovery priorities
Innovation and creativity
Devolved and responsive decision making
Internal and external situation monitoring and reporting
(Stephenson, 2010, p. 176)
The advantage of Stephenson’s model is that it is quantitative. However, this latest model by
Stephenson (2010) also assumes that the indicators would work for organisations of different
types. As organisations are different and have different entities they interact with, this may not
be the case. For instance, minimisation of silo mentality or leadership, management and
governance structures may not be applicable to an organisation with no departmental barriers or
with different leadership structures. As an example, Handler and Kram (2004) concluded that
leadership and governance are not the same in family businesses as in other organisations.
Stephenson included traditional financial measures (cash flow, return on investment-(ROI) and
profits) used to measure a firm’s excellence or viability. This is useful for organisations as these
are measures already in use or are easy for the organisation to understand. However, as was also
noted by Chakravarthy (1986), these conventional measures, such as ROI and profits, have the
limitation that they are usually taken in isolation, and while important, show an organisation’s
history but not the direction in which it might go. Graham (2001) calls these lagging, or past,
indicators which should be used in conjunction with leading (or future) indicators such as how

Key elements of sectoral recovery and resilience after the Canterbury earthquakes: A system dynamics approach
Hlekiwe Kachali
57
aware employees are of services to be offered in future, as well as the potential value of these
services (monetary or otherwise) to the organisation (see chapter 10 of this thesis). Examining
the nature and type of a firm’s decisions and shifts, via its strategy for example, could be used as
an alternative measure (Evan, 1978). As well, intangibles like team spirit should not be devalued
when measuring an organisation’s performance as these also give an indication of the state of
health of an organisation (Senge, 2006). Stephenson’s (2010) work asks about staff satisfaction
at a broad organisational level. In addition to overall staff satisfaction questions, the organisation
could ask for specific reasons for the level(s) of satisfaction of their staff. In short, measures
that are relevant to the organisation and the context should be used.
Stephenson’s model of organisational resilience provides organisations with metrics for
measuring organisational resilience. Organisations can use changes in these metrics to monitor
changes in organisational resilience over time. Stephenson’s model would benefit from having
different versions to suit different organisations and different industry sectors as well as
questions specifically to do with disaster resilience. One of the aims of this thesis is to highlight
how Stephenson’s model could be advanced, especially for organisational disaster resilience. This
is discussed in detail in chapter 10.
Lastly, Stephenson’s quantitative model leads to an overall organisational resilience figure. The
overall organisational resilience score is useful as a general marker for the organisation’s change
in resilience. However, organisations concentrating on only this aggregated measure of resilience
may find that it does not aid in making improvements to specific aspects of their resilience.
Additionally, both McManus and Stephenson talk of the resilience of the organisation.
However, organisations are part of larger systems. Therefore, both the resilience of the
organisation and the resilience of the system it is a part of need to be measured. This can be
defined dependent on the purpose or goal of the system.
Other indicators of organisational resilience in the literature
There are other occurrences of organisational resilience in the literature and they have all been
used in the context of organisations overcoming turbulent environments. As with the definitions
of resilience, the indicators or attributes of organisational resilience are also assigned different
labels by different researchers. However, the descriptions have a similar theme.
58 A review of the literature
Lengnick-Hall and Beck (2005) characterise organisational resilience as having three
components: cognitive, behavioural and contextual. Meanwhile, Walker et al (2004) write that
factors important to the future direction of an organisation are resilience, adaptability and
transformability. Resilience is further broken down into four parts, latitude, resistance,
precariousness, and panarchy. Adaptability is defined as the capacity of actors in the system to
influence resilience whereas transformability is the capacity to create a fundamentally new
system when ecological, economic, or social structures make the existing system untenable.
Rose (2004) talks of organisations having inherent and adaptive types of resilience. Tierney
(2008) writes about the 4-R framework of resilience that also applies to organisations and
includes technical, organisation, social and economic aspects. Bell (2002) also cites five pillars of
organisational resilience: leadership, culture, people, systems and settings. Horne and Orr (1998)
have gone further than most authors and aligned organisational performance to their seven streams
of resilient behaviour:
community;
competence;
connections;
commitment;
communication;
coordination; and
consideration.
These seven streams, if present in organisations, have been identified as actions that contribute
to the creation of a resilient organisation. Horne and Orr state that the streams are intertwined.
This is in line with the notion of organisations as systems that is used in this thesis. According to
Horne and Orr (1998), community is the employees’ understanding of the purpose, vision,
mission and values in the organisation while competence is the repertoire of skills the employees
possess to meet the demands of changing environments. The connections stream deals with the
extent of an organisation’s social support in periods of crisis, commitment is the ability of all
units in the organisation to work together effectively in times of change. Communication
focuses on sharing relevant information during these times of change. Coordination is the act of

Key elements of sectoral recovery and resilience after the Canterbury earthquakes: A system dynamics approach
Hlekiwe Kachali
59
arranging the entire system in order to have effective results. The last stream, consideration, is
about factoring in the human element in the everyday dealings of the organisation.
The measures of organisational resilience from Lengnick-Hall and Beck, Rose, Tierney, Bell and
Horne and Orr, while descriptive, do not detail how organisational resilience can be measured so
that organisations can use these metrics for improvement. This is especially vital after a disaster.
2.8.4 The case for investment in organisational disaster resilience
If any measure of disaster resilience is to be useful to the organisation, it should be invested in
prior to any disaster and improved upon as the organisation learns. For instance, Knight and
Pretty (1996) and Rose (2004) demonstrate that organisations can minimise disaster losses as a
result of engaging in resilient pre-disaster actions. Resilience is necessary because organisations
now have to deal with situations where new problems come up and the old methods of
analysing problems have themselves become problems (Jacques, 1996). Additionally,
organisations now have to compete with everyone for everything from everywhere (Sirkin, Hemerling, &
Bhattacharya, 2008, p. 6). Being able to adjust to different situations such as those brought on by
disaster, being creative and learning are some of the traits and actions of a resilient organisation.
This means organisational disaster resilience is more than just returning to the situation as it was
before a disaster. Adapting to suit changing circumstances is another characteristic of a resilient
organisation. According to Pascale and Athos (1981), one indication of an organisation that has
adapted effectively is that it can partner its strengths and its abilities with the opportunities
presented by the environment, and then choose a strategy that aligns with these opportunities.
Pascale and Athos’ advice, while very true, may not take into account the sustainability of taking
up these opportunities if the long-term purpose of the organisation is not considered.
Moreover, the ways of doing business grow more intricate and competing financial, social, and
political interests increase. Leveson (2002) and Perrow (1986) acknowledge that as a result of
such interconnectedness systemic risk cannot be avoided; rather, the innate risks in the way
organisations operate should be recognised as much as possible. Furthermore, the system should
be made resilient to external and internal factors (Thain & Goldthorpe, 1989) to ensure
continued existence. It is tempting to try and design risks out of a system; however, this is close
60 A review of the literature
to impossible and may create more complications as the system might then not be fit for
purpose.
Worldwide, in just the last few years, numerous events have had a bearing on organisational
recovery and resilience. These include events such as the boxing day Tsunami of 2004 in which
many lives were lost and which had a negative impact on the tourism industry of the majority of
the countries affected (Birkland, Herabat, Little, & Wallace, 2005; Majumder, 2005). The
importance of disaster resilience is so that in times of disaster an organisation has the ability to
accept change gracefully (H. D. Foster, 1997, p. 6) and without near permanent collapse (Bolin &
Stanford, 1998; H. D. Foster, 1997). Therefore, there is a need to investigate what actions can
lead to organisational and sectoral disaster resilience.
2.9 The frame of reference for this research
Organisations in New Zealand are exposed to a wide range of hazards, natural and otherwise.
While the focus in this thesis is on organisations and sectors, there is recognition that especially
in crises that are regional, the recovery of the organisation, the sector, the community and the
region are very closely linked. The frames of reference used in this thesis are from the literature
on organisations, crisis management and disaster recovery. These are brought together through
the use of the grounded theory and system dynamics approaches.
This research therefore addresses the gap in the literature on the recovery of individual
organisations as well as industry sectors and also the interlinked nature of organisational
recovery after disaster by taking a systems (or holistic) view of disaster recovery. There is also a
gap in addressing what aspects are most important in organisations in the response and short-
term recovery phases of disaster. Moreover, it has been noted that much of the existing research
and documented work on organisational crisis and disaster management has been focused on the
internal working of an organisation, not taking the organisation in the context of its
environment (Evan, 1965; Senge, 2006). Using the organisational, crisis management and
disaster recovery literature points of view, underpinned by systems thinking helps in
understanding how organisations belong to the bigger picture that is Canterbury post 2010-2011
earthquakes. Consequently, another component of this thesis will be to start to answer the
question of what are some of the determinants of recovery, prosperity or failure of an
organisation and sector after a major hazard event.
Key elements of sectoral recovery and resilience after the Canterbury earthquakes: A system dynamics approach
Hlekiwe Kachali
61
Furthermore, in the disaster and organisational literature, there is a gap in knowledge of how
different industry sectors are affected by disaster as well as how they recover. As industry sectors
and the interconnections between them play a crucial role in the economic and social well-being
of an area, the way(s) in which they recover from disaster is conspicuous in its absence from the
disaster literature. This is even as there has been some research focused on how (mainly) for-
profit organisations fared after other disasters similar to the earthquake(s) in Canterbury, New
Zealand. Examples include the earthquakes in San Francisco (Webb et al., 2002) and Northridge
(Bolin & Stanford, 1998; Tierney, 1997) in the USA as well as Gisborne (F. Powell & Harding,
2009) and the Ruapehu eruptions (Miller, Paton, & Johnston, 1999) both on New Zealand’s
North Island. However, the damage and effects of these disasters and the subsequent recovery
have been scrutinised from a broad local or national level (Alesch et al., 2001) masking how
industry sectors were particularly affected and how they fared afterwards. In contrast, it has been
documented that small business might have difficulty recovering (Alesch & Holly, 1998; Runyan,
2006) and that certain individual sectors such as construction and manufacturing might
experience a boom in the immediate aftermath of an earthquake (Tierney, 1993a; Tierney &
Webb, 2001). However Tierney’s work does not extend to the development of a recovery
framework for organisations and industry sectors and the systemic linkages involved. Adding to
this segment of the disaster scholarship will be another contribution of this thesis. From the
disaster recovery and organisational bodies of work, some of the other theories that will be
tested in this thesis are what determines recovery for organisations and sectors and is it a linear
process?
Additionally, in this PhD research, the recovery from, resilience to and short-term impacts of
disaster on individual organisations, localities (central business districts) and multiple industry
sectors (e.g. hospitality, trucking, retail) will be analysed. Included in the study is the investigation
of the transitory effects of disaster on different sectors, for example as a result of increased or
decreased demand for goods and services at certain points after the earthquake. In this work,
specific attention is also paid to the repercussions of multiple organisations in a supply chain
being disrupted by the same event as well as the effects when a critical node in a supply chain is
shaken by disaster. Apart from investigating the key elements of recovery for organisations and
62 A review of the literature
industry sectors, another contribution of this work will be through the addition made to the
existing literature on organisational disaster resilience.
In light of the above, it is imperative that a new, systemic, way of looking at organisational and
sectoral recovery from disaster be taken up by organisations as well as organisational and disaster
scholars. Keeping in mind the extent of the Canterbury series of earthquakes and the number
of organisations involved, the analysis in this work is that of a regional disaster perspective.
From the previously outlined retrospective on the organisational, crisis management, disaster
recovery and systems thinking literature, research aims and questions were developed to aid in
achieving the intended contributions of this work.
2.10 Research Aims
The aims of this research are to:
Investigate the major factors involved in the recovery of organisations after a major (regional) hazard
event.
Determine the system dynamics involved in the recovery of organisations and sectors.
Review the work done by Stephenson and McManus, enhance the Organisational Resilience
Measurement Tool and contribute to the overall aims of ResOrgs.
Explore ways of enhancing the (business) case for resilience.
2.11 Research Questions
From the aims stated above, the research questions are:
What factors - severity of the effects (direct and indirect) of a major hazard event, or the pre-or post-
event performance - have substantial effects on the recovery of organisations and what are the relative
magnitudes of these effects?
What are the system behaviours that contribute to the recovery of an individual organisation, a sector
and between sectors?
Which of the indicators of organisational resilience are prominent in a regional disaster?
What is the link between resilience and organisational performance?
Key elements of sectoral recovery and resilience after the Canterbury earthquakes: A system dynamics approach
Hlekiwe Kachali
63
2.12 Chapter summary
In this chapter, it has been shown that the literature on different aspects of the recovery process
and that on how organisations deal with crises continues to expand. This chapter reviewed the
critical points of current knowledge in the literature on organisational crisis management,
disaster recovery, disaster resilience and organisations as systems. In the chapter, it was further
emphasised that disaster recovery needs to be looked at from the sectoral perspective and within
a system dynamics framework. This knowledge is valuable not only for strategy and policy
formulation after disaster but also for future decisions for organisations and sectors.
However, there has so far not been a system dynamics model or framework that brings together
the complementary disciplines reviewed, to outline the process of recovery for organisations and
industry sectors in a disaster environment as well as what that might involve. Specifically a
framework that takes into consideration the systemic nature of organisations and industry
sectors, to track their recovery from almost immediately after a disaster event to the short-term.
A framework that takes into account that recovery from disaster is a long, complex, inter-
organisational and systemic affair. In this thesis, the frames of reference utilised are from the
existing literature on organisations, crisis management and disaster recovery. Importantly, these
will be underpinned by the grounded theory and systems thinking approaches and used to
investigate and establish the key elements of recovery for organisations and sectors after the
2010 – 2011 earthquakes in Canterbury. The gaps to be addressed in this thesis include:
considering organisations and industry sectors as systems and belonging to larger
systems, what are some of the determinants of recovery, prosperity or failure after the
2010-2011 Canterbury series of earthquakes?;
what are some of the aspects that are important in organisations in the immediate
response and short-term recovery phase of disaster?;
what are some of the key characteristics of disaster resilience for organisations and
industry sectors as well as the interlinked nature of organisational and sectoral recovery?;
and
what is contained in a systems dynamics post-disaster recovery framework for
organisations and industry sectors?

64 A review of the literature
The next chapter is on the rationale used for the design of the research.
Key elements of sectoral recovery and resilience after the Canterbury earthquakes: A system dynamics approach
Hlekiwe Kachali
65
3 Research methods and design
Recovery from any major event is long term and can last anything from 5 years to decades after
an event. In the overall recovery process, this research was conducted over the two year period
spanning response and short-term recovery. The study was carried out starting from a few weeks
after the 4 September, 2010 MW 7.1 Darfield earthquake and was designed to follow sampled
organisations and industry sectors through their recovery process after the 2010 and 2011 series
of earthquakes. The aim of the study was to chart the effects and consequences, in the
immediate and short-term, of the earthquakes on these selected organisations and industry
sectors in Canterbury.
The study utilises a multi-method research strategy which draws on the strengths of different
research methods. This way of conducting research is sometimes known as triangulation (Denzin,
2009; Robson, 2002). Specifically methodological triangulation, a process of combining
quantitative and qualitative approaches, was employed for analysis of surveys, contextual
interviews and case studies. The combination of quantitative and qualitative approaches ensures
a richer data set as the two methods can be used to collect data that is complementary. This is
seen as advantageous for research (Campbell & Fiske, 1998; Jick, 1979). Furthermore, all of the
data were analysed from a system dynamics perspective which aids in the analysis of situations
with numerous interrelated elements. The system dynamics approach is used because the post-
disaster situation being analysed is complex and dynamic and stems from the interaction of
physical, social, economic, political and environmental systems. In the case of organisations,
their recovery involves all these facets as well as the possibility of an affected organisation having
an effect on other organisations it interacts with or vice-versa.
Given the sensitive and emotive nature of this research, measures were taken to ensure that it
would be conducted in an ethically sensitive manner. This included seeking and receiving
permission from the University of Canterbury Human Ethics Committee (HEC).

66 Research methods and design
3.1 Sample group14
The main research site was the earthquake hit Canterbury region on the South Island of New
Zealand; with a focus on the greater Christchurch area, Waimakariri district and Selwyn district.
The sectors that make up the sample group were selected so as to reflect various elements of the
Canterbury economy. For the purposes of this thesis, a group of organisations that operate in
the same segment of the economy or share a similar business type are characterised as making
up an industry sector. The selection of the sectors was done in collaboration with a research
team comprised of organisational, resilience and recovery experts. The experts were consulted
for their knowledge of the economies and business landscapes of Christchurch and Canterbury.
The reason for selection at the sector level was to establish the effects of the recovery on a
whole sector as well as individual organisations in a sector. Also, to make the research valid and
applicable, one of the factors in picking the sample was that some of the organisations should
belong to industry and geographic sectors that were an integral part of the economy of
Christchurch. Additionally, the sectors selected had interactions with each other. This to better
show the effects that sectors can have on each other’s recovery. From a system’s perspective, the
primary aim of this thesis is to investigate the key elements of recovery and resilience for
industry sectors. The sectors selected fulfilled this purpose.
Therefore, included in the overall sampling frame were sectors noted in the Canterbury Regional
Economic Development Strategy (CREDS) 2005 – 2015 part of whose vision includes making
Canterbury a world leading regional economy founded on innovation, diversity and sustainability (Canterbury
Economic Development Co. Ltd., 2009). Included in CREDS are the agricultural, information
and communication technology (ICT), manufacturing and business services sectors; not all of
these sectors were selected for the study. After some discussion a shortlist of other possible
sectors seen as vital to the recovery of Canterbury after the earthquake was drawn up. This
shortlist was further whittled down to the final list of sectors shown in Table 3-1.
14 A more detailed description of each sample group can be found in chapter 4.

Key elements of sectoral recovery and resilience after the Canterbury earthquakes: A system dynamics approach
Hlekiwe Kachali
67
Table 3-1: Final list of industry sectors selected for the study
Final list of industry sectors selected for the study
Sector or sub-sector Details of sector or sub-sector Brief explanation for inclusion in study
Construction Building suppliers
involved in the repair, remediation, restoration and reconstruction process of the built environment. Also may possibly experience an increase in demand during the recovery process
Critical Infrastructure (Lifelines)
Engineering and non-engineering provision of essential services to all other sectors in the study
Fast Moving Consumer Goods (FMCG)
Food producers, supermarkets, dairies, service stations with dairies
vendors of consumables like milk, bread and other perishable goods part of customer non-discretionary spending
Hospitality Bars, cafés, restaurants track the discretionary spending habits of the general population and how this affects recovery
Information and Communication Technology (ICT)
Light manufacturing, software and professional service providers
high-growth sector identified as a key component of Canterbury’s regional economic plan
Transport Trucking part of the logistics chain for all the other industry sectors in the study
Christchurch Central Business District (CBD)
Mixed business types. The Christchurch Central Business District (CBD) is defined as the area bound by the four Avenues: Bealey Avenue, Fitzgerald Avenue, Deans Avenue and Moorehouse Avenue
economic hub of Christchurch, heavily affected by the 22 February 2011 earthquake
Kaiapoi Town Centre
Mixed business types. The Kaiapoi Town Centre is located primarily along the main street (Williams Street) and adjacent streets bound by Cass Street and Ohoka Road
heavily affected town centre following the 4 September 2010 earthquake
Lyttelton Town Centre
Mixed business types. Lyttelton Town Centre is bounded by London Street, Dublin Street, Oxford Street and Norwich Quay
heavily affected town centre following the 22 February 2011 earthquake
The study was targeted at investigating the recovery of organisations in an urban setting.
Therefore, the agriculture sector was excluded (see (Z.R. Whitman et al., 2011)) for detail on
effects to the agriculture sector). With the resources available for the research, only a limited

68 Research methods and design
number of sectors could be examined in detail. For instance, manufacturing and business
services, even though they are high growth sectors, were excluded because of research resource
limitations. These and other sectors could be investigated in future studies
However, it was identified that some of the sectors selected, e.g. ICT, had organisations that
were involved with aspects of manufacturing or business services. In addition, the
manufacturing sector is closely linked to some of the sectors selected such as trucking and retail.
Analysing the trucking and retail sectors should provide some insights into some of the factors
that might affect the manufacturing industry. The manufacturing sector also shares some
commonalities with ICT as they are both export oriented.
Once the industry and geographic sector groups were selected, organisations were randomly
sampled from within each sector (this was done by the researcher). The selected organisations
share the main characteristic of being based in Canterbury and doing business in the region. As
the organisations were from the entire Canterbury region, this means that the list includes
organisations positively, negatively or not at all affected by the earthquakes. Part of the reason
for this was to find out what different organisations had done differently before and after the
earthquake and if this was a factor in how organisations were affected by and would recover
from the event. Additionally, an individual sector had to be large enough that the conclusions
formed would be applicable to the wider sector.
After review of the literature (Knight & Pretty, 1996; Lansing, 2003) and inspection of resource
availability (time and funding), 100 organisations per sector was deemed a suitable sample size
for each industry sector. This number would account for those who did not want to participate,
for the attrition rate that is a part of any extended study and also allow for generalisations to be
made about the sector. Also, for each of the 9 sectors sampled, giving a total of 900
organisations, 100 organisations per sector is also a manageable size given the available resources
to conduct the study.
3.2 Industry sectors
3.2.1 Building suppliers
The building suppliers sector was selected because after the physical damage caused by the
earthquakes; they would be involved in the repair, remediation, restoration and reconstruction
Key elements of sectoral recovery and resilience after the Canterbury earthquakes: A system dynamics approach
Hlekiwe Kachali
69
process of the built environment. Also, they are a good barometer for the performance of the
construction industry sector as they have interactions with almost all levels of the sector. The
starting sample list for the building suppliers sectors was from the Yellow Pages15 2010/2011.
From this, every third organisation was selected until 100 organisations were on the list. The
sample group included wholesale and retail building suppliers.
3.2.2 Critical infrastructure
Critical infrastructure is regarded as one of the cornerstones of recovery post-disaster. These
organisations were included because of the essential services they provide to all other sectors in
the region. Their inclusion was to investigate how the loss or disruption of critical services
affects other sectors and also to investigate how this particular sector was affected. The
organisation list for critical infrastructure was obtained from the endorsing agency16 which has
ties to the sector. The list was made up of 45 organisations and includes engineering and non-
engineering critical infrastructure providers.
3.2.3 Fast Moving Consumer Goods (FMCG)
The Fast Moving Consumer Goods (FMCG) sector includes secondary food producers,
supermarkets and dairies17. Apart from the intra-sectoral linkages, this sector has linkages with
the trucking sector and these organisations are sellers of everyday consumables like milk, bread
and other perishable goods which are part of consumer non-discretionary spending. The Food
and Grocery Council of New Zealand (FGC) advised that there were four major branches (not
listed for reasons of confidentiality) to this sector in Canterbury. Twenty-five organisations from
each branch were randomly selected.
3.2.4 Hospitality (bars, cafes, restaurants)
Hospitality is a sector that comes under people’s discretionary spending habits making it possible
to track the discretionary spending habits of the general population and how this affects
15 The New Zealand Yellow Pages are a directory listing for businesses
16 Not named here for confidentiality reasons
17 A dairy is the New Zealand equivalent of a corner store or a convenience store

70 Research methods and design
recovery. It also has strong connections to the tourism sector which is a high-impact sector in
the Canterbury region. Half (50) of the sample was from the Yellow Pages 2009/2010. The
other half of the sample came from an internet list provided by the Central City Business
Association (CCBA), along with their endorsement.
3.2.5 Information and Communication Technology (ICT)
Increasingly, organisations rely on some part of information and communication technology
(ICT) to conduct their affairs. In addition, ICT is a high-growth sector identified as a key
component of Canterbury’s regional economic plan. The concentration of ICT firms in
Canterbury leads to it being known as the Silicon Plains of New Zealand (after Silicon Valley in
the USA). The starting sample list was provided by the Canterbury Development Corporation
(CDC) after they had consulted the organisations on the list. The list had organisation names
only. It was left to the researcher to find out the organisations’ addresses and whom to address
the survey to. A random sample of 100 was picked from the list provided using Microsoft
Excel’s random generator function.
3.2.6 Trucking
Trucking represents the transport sector but was specifically selected because they are part of the
logistics chain for all the other industry sectors in the study. The trucking sector also has linkages
with some of the other sectors selected for this study making it possible to observe how these
sectors affected each other in recovery as well as how sectors not included in this study might be
affected because of such linkages. The names and addresses for the trucking sector organisation
were provided by the Road Transport Association New Zealand Inc. (RTANZ), in consultation
with their members. The Association’s endorsement was also obtained so as to help increase the
response rate. A random sample of 100 organisations was picked from the list provided using
Microsoft Excel’s random generator function.
3.3 Geographic locales
Also strategically selected were specific geographic sectors not related to business type. The
geographically selected groups were included based on their role in the Canterbury economy as
well as because of their location to exemplify the importance of environmental context on
organisational recovery. Additionally, the geographic sectors, with the existence of a large
Key elements of sectoral recovery and resilience after the Canterbury earthquakes: A system dynamics approach
Hlekiwe Kachali
71
number of organisations concentrated in one physical area, represent a system which has
interactions between organisations from different industry sectors. As well, the geographic
locations are economically and culturally significant to the regions they are in. These geographic
locations were also severely affected by the earthquakes.
3.3.1 Christchurch Central Business District (CBD)
The central business district (CBD) is the economic hub of Christchurch18, has some of the city’s
major tourist attractions and represents an aggregation of organisations in one locality. For this
study, the Christchurch Central Business District (CBD) is defined as the area bound by the four
Avenues: Bealey Avenue, Fitzgerald Avenue, Deans Avenue and Moorehouse Avenue. The
organisations for the Christchurch CBD sample group were selected from a list of organisations
within the Four Avenues. The final sample list was arrived at using stratified sampling by
business type and by percentage of that business type on the starting list. This was in an effort to
ensure proportional representation.
3.3.2 Kaiapoi Town Centre
Kaiapoi is a satellite town about 20kms north of Christchurch. Kaiapoi was one of the most
heavily affected town centres following the 4 September 2010 earthquake. As well, it is also an
aggregation of organisations in one locality. A sizeable proportion of the local population works
in Christchurch city. The Kaiapoi Town Centre is the town’s central business district and is
located primarily along the main street (Williams Street) and adjacent streets bound by Cass
Street and Ohoka Road. A list of organisations was provided by the recovery office formed after
the 4 September 2010 earthquake. The cluster sampling method, i.e. all organisations were
included, was used for Kaiapoi as the sample population was less than 100.
3.3.3 Lyttelton Town Centre
Lyttelton has the main port for the South Island of New Zealand and is connected to
Christchurch by the Lyttelton Road Tunnel which is used for the transportation of imports and
exports. Lyttelton is also known for its vibrant arts and crafts scene. Lyttelton Town Centre is
18 Prior to the 22 February 2011 earthquake.
72 Research methods and design
roughly bounded by London Street, Dublin Street, Oxford Street and Norwich Quay. For
Lyttelton also, cluster sampling was used. The sample organisations for Lyttelton Town Centre
were from a list provided by the town’s business association.
3.4 Data collection
3.4.1 Research instruments and methods
In this thesis, the unit of analysis is the industry or geographic sector. However, the primary unit
of inquiry, to enable data collection, is the organisation. This is similar to an investigation on
community recovery collecting data from individual households
Data were collected using multiple methods; surveys, contextual interviews and case studies. The
information from the surveys was augmented by information from semi-structured interviews
conducted for the establishment of context and background with industry sector and business
leaders. Data were also collected from case studies with selected organisations within the study
sample group. There are several reasons for this combination of methods for data collection.
The survey, sent in hard or soft copy, is less expensive than a telephone call or a face-to-face
visit and it might be more convenient for the respondent as they can complete it at a time of
their choosing. However, there are advantages to telephone or face-to-face interviews. The
researcher is able to establish rapport with the respondent; he/she can amend and adapt the
research questions as the interview progresses and can clear any doubt and misunderstanding by
repeating or rephrasing the questions. In addition, the face-to-face interview allows the
interviewer to observe the body language or facial expressions of the respondent. These can
work as non-verbal prompts, which is of advantage to the researcher. The interviews also
provide the opportunity for the researcher to ask for more in-depth information that would be
difficult to collect using a survey.
The case study gives the chance to get more detailed information about specific organisations
(Yin, 1989). Also, for small businesses, it has been shown that case studies done in conjunction
with other research methods, yields a richer data set (Romano, 1989). This is in part due to each
small business having a different management structure. The case studies were to supplement
and add to the information already collected via surveys and contextual interviews. Part of the
reason for this is that some qualitative, in-depth information is not as easy to obtain via survey
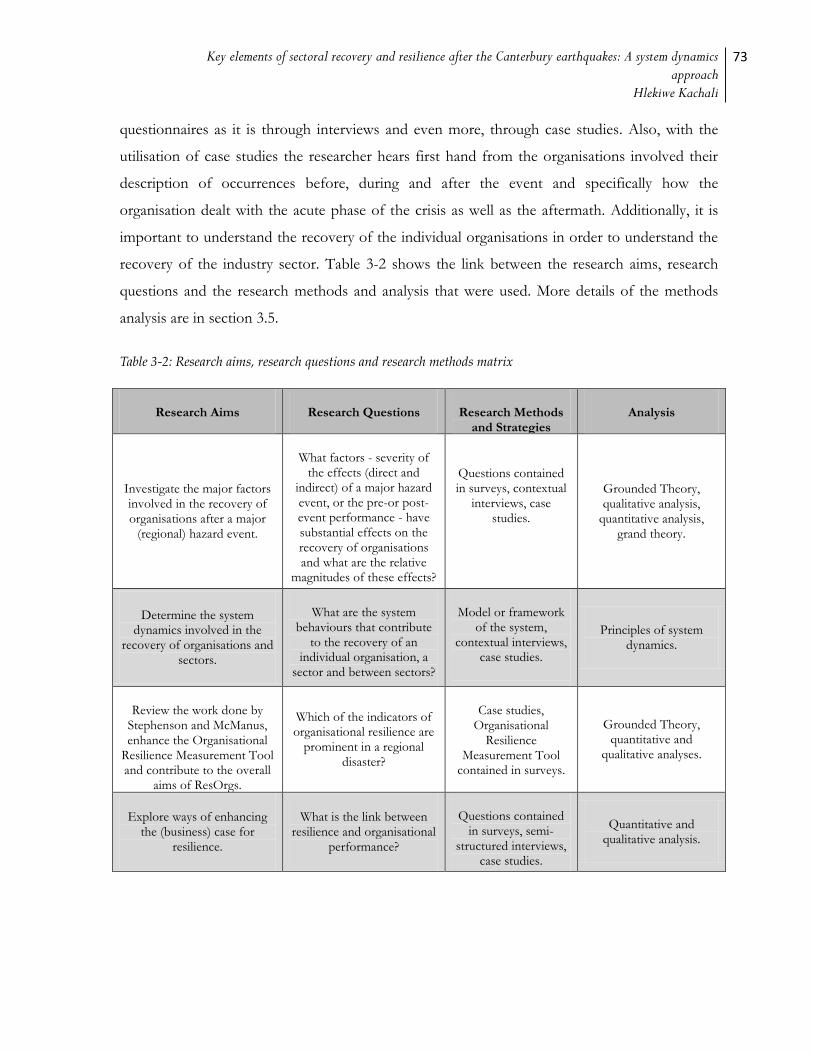
Key elements of sectoral recovery and resilience after the Canterbury earthquakes: A system dynamics approach
Hlekiwe Kachali
73
questionnaires as it is through interviews and even more, through case studies. Also, with the
utilisation of case studies the researcher hears first hand from the organisations involved their
description of occurrences before, during and after the event and specifically how the
organisation dealt with the acute phase of the crisis as well as the aftermath. Additionally, it is
important to understand the recovery of the individual organisations in order to understand the
recovery of the industry sector. Table 3-2 shows the link between the research aims, research
questions and the research methods and analysis that were used. More details of the methods
analysis are in section 3.5.
Table 3-2: Research aims, research questions and research methods matrix
Research Aims Research Questions Research Methods and Strategies
Analysis
Investigate the major factors involved in the recovery of organisations after a major
(regional) hazard event.
What factors - severity of the effects (direct and
indirect) of a major hazard event, or the pre-or post-event performance - have substantial effects on the recovery of organisations and what are the relative
magnitudes of these effects?
Questions contained in surveys, contextual
interviews, case studies.
Grounded Theory, qualitative analysis,
quantitative analysis, grand theory.
Determine the system dynamics involved in the
recovery of organisations and sectors.
What are the system behaviours that contribute
to the recovery of an individual organisation, a
sector and between sectors?
Model or framework of the system,
contextual interviews, case studies.
Principles of system dynamics.
Review the work done by Stephenson and McManus, enhance the Organisational
Resilience Measurement Tool and contribute to the overall
aims of ResOrgs.
Which of the indicators of organisational resilience are
prominent in a regional disaster?
Case studies, Organisational
Resilience Measurement Tool
contained in surveys.
Grounded Theory, quantitative and
qualitative analyses.
Explore ways of enhancing the (business) case for
resilience.
What is the link between resilience and organisational
performance?
Questions contained in surveys, semi-
structured interviews, case studies.
Quantitative and qualitative analysis.
74 Research methods and design
3.4.2 Research timeline
Richards and Morse (2007) note that data is not collected but rather is made through an interactive
process occurring between researchers and participants. For this extended study participants
were sampled at different times from the 4 September 2010 event through the various research
methods mentioned. The research time line is shown in Figure 3-1.
Survey 1 was deployed a few weeks after the 4 September 2010 earthquake to capture
information in the critical period just after a disaster has occurred. This was followed by Survey
2 which was deployed after the 22 February 2011 earthquake and was ongoing during the 13
June 2011 aftershocks. Contextual interviews were started while the second survey was
underway. The case studies were begun after Survey 2 had drawn to a close and the bulk of the
contextual interviews had been done. Survey 3 was deployed as the case studies came to a close.
Each part of the research was informed by the preceding part which enabled the adjusting of the
overall research plan to best answer the research questions. The case study research was an
opportunity to establish a grounded theory (see section 3.5) toward answering the cardinal
research question: How do organisations recover after disaster?

Key elements of sectoral recovery and resilience after the Canterbury earthquakes: A system dynamics approach
Hlekiwe Kachali
75
Figure 3-1: Research timeline for this thesis
4 September 2010
26 December 2010
22 February 2011
13 June 2011
23 December 2011
17 November 2010
18 February 2011
31 May 2011
16 September 2011
12 March 2012
20 April 2012
Survey 1 Survey 2
Contextual Interviews
Organisational Case Studies
Survey 3
Eart
hq
uak
es
Dep
loym
en
t d
ate
s R
ese
arc
h A
cti
vity
76 Research methods and design
3.4.3 Surveys
Surveys come in a wide range of forms and can be distributed using a variety of media (written,
oral or electronic). As with all modes of research, surveys also have strengths and weaknesses.
Several authors (e.g. (Prud'homme, 2008), (Craighead, Blackhurst, Rungtusanatham, &
Handfield, 2007), (Jaeger et al., 2007), (Cruz & Steinberg, 2005)) have written on the pros and
cons of using surveys as a data collection tool. Some of the strengths of surveys include their
relative affordability and reach; they can be administered from remote locations using physical
mail, electronic mail or telephone. It is also possible to administer a survey to a large population
and the results can then be used to describe the characteristics of the general population. The
standardisation of the questions in a survey makes measurement more exact because the
questions use uniform definitions for each participant. This also means that similar data can be
collected from different groups and the results compared.
Some of the weaknesses of surveys are that the standardisation of questions to make them
applicable to a sample group means that some of the questions may end up being too general
and not elicit the information sought. In addition, the initial survey study design cannot be
changed over the course of the data collection period once the survey is deployed. Lastly, the
researcher needs to ensure that a large enough number of respondents complete the survey
especially for purposes of statistical validity and generalisation.
Survey deployment
After a review of the literature (Knight & Pretty, 1996; Richards & Morse, 2007), the research
team concluded that 100 organisations per sector was a suitable sample size for an extended
study of this nature. Firstly, this would account for the attrition, for instance through non-
response, that is a part of a study of this length. Second, the number of respondents per group
was also designed to allow the researcher to make generalisations about a particular sector.
To help with the initial deployment of the survey, research assistants (RAs) were hired. The RA
positions were advertised through Student Job Search Canterbury which works in collaboration
with the University of Canterbury. Each applicant was asked to send a CV and cover letter. One
criterion for making the RA shortlist included that the applicant have a grade point average

Key elements of sectoral recovery and resilience after the Canterbury earthquakes: A system dynamics approach
Hlekiwe Kachali
77
(GPA) higher than 6.5 (as measured in New Zealand where the maximum is 9), or B+.
Shortlisted applicants were invited to face-to-face interviews with a minimum of two
interviewers from the research team present. Successful applicants were then invited to an
information session on the aims of the research as well as to be told in more detail what the job
entailed. The information session also included telephone etiquette to ensure uniformity among
the RAs.
The survey used for this research was designed so that it could be completed by the respondent
and could also be administered using different media. The multi-media format was to give
respondents the flexibility to complete the survey at a time of their choosing. It was recognised
that in some cases, the respondents might have no time to complete the survey for instance
during regular business hours as they effected recovery for their organisation.
Organisations were contacted by telephone to establish who would be the right person to
complete the survey on behalf of the organisation as well as how they would like to receive the
survey. Respondents were then asked to give their preferred address; electronic or physical. The
survey was then sent to the nominated person and a follow up call made a few days later to offer
them the option of completing the survey over the telephone with a research assistant taking
down the answers or a researcher meeting with them in person.
The survey used a paper based questionnaire that was sent out to participants via physical mail
or electronically (as an attached text document in e-mail). Respondents also had the option of
completing the survey online via the University of Canterbury’s Qualtrics survey engine. All
respondents who agreed to take part in the study were sent a survey cover letter detailing the
nature of the research. The cover letters were tailored for the different sectors. In addition to a
survey cover letter, organisations that opted to receive a physical copy of the survey were sent
the survey booklet and a pre-addressed, pre-paid return envelope. Respondents that received the
survey as an electronic document had the option of returning the survey in the same format or
as a printed copy sent by physical mail.
Each survey contained 2 main parts, the recovery part and the resilience part. For recovery, the first
survey (Survey 1) was deployed to capture perishable data while it was still somewhat fresh in
respondents’ minds. The survey included questions that asked about initial impacts and initial
78 Research methods and design
perceptions of respondents soon after the 4 September 2010 event. Survey 2 was to gather more
detailed information about ongoing effects and also included organisations from Lyttelton that
were not part of the original sample group. This is because Lyttelton was relatively unaffected by
the 4 September 2010 earthquake but severely affected by the 22 February 2011 earthquake.
Survey 3 asked about continuing effects more than 18 months after the 4 September 2010
earthquake as well as effects due to the ongoing aftershocks.
For the questions on organisational resilience, Survey 1 contained a shortened (13 questions)
trial version of the complete (53 questions) Benchmark Resilience Tool (BRT-53) developed
from the work of Stephenson (2010) and McManus (2008). The reason for this was to test for
the accuracy of predicting the resilience score using fewer questions from the tool in place of
deploying a full version. Another reason was to keep the surveys to a reasonable length for
participants. The results from this were compared to results of the BRT-53 deployed in Survey
2. Survey 3 also contained a shortened version of the BRT-53. The questions contained in the
BRT-53 are in appendix F. The development of the shortened version of the BRT-53 is detailed
in Whitman et al. (2013).
From the outset, it was acknowledged that the respondents would most likely suffer from survey
fatigue as the number of researchers and organisations with an interest in the aftereffects of the
earthquakes was large. Importantly, the nature of the subject was very emotive and somewhat
invasive as this was to do with people’s lives and livelihoods. To help increase the survey
response, industry associations and other local bodies like the Canterbury Development
Corporation (CDC) 19 were asked for their support and endorsement (see Table 3-3).
Endorsements were included in the cover letters.
19 CDC is funded by the economic development arm of the Christchurch City Council (CCC)

Key elements of sectoral recovery and resilience after the Canterbury earthquakes: A system dynamics approach
Hlekiwe Kachali
79
Table 3-3: Industry sector and endorsing organisation
Sector or Sub-sector Industry Association or Endorsement
Building Suppliers New Zealand Building Industry Federation (BIF)
Critical Infrastructure Critical Lifelines and Infrastructure Group
Retail (FMCG) Food and Grocery Council of New Zealand (FGC)
Hospitality 20
Information and Communication Technology (ICT)
Canterbury Development Cooperation (CDC)
Trucking Road Transport Association NZ (RTANZ)
Christchurch Central Business District (CBD) Christchurch City Council (CCC), Canterbury Employers’ Chamber of Commerce (CECC)
Kaiapoi Town Centre Enterprise North Canterbury (ENC)
Lyttelton Town Centre Lyttelton Harbour Business Association (LHBA)
3.4.4 Semi-structured interviews
Semi-structured interview techniques were used for the contextual interview and case study
phases. This is because it is not easy to capture in-depth answers to the why and how questions
using only surveys. Additionally, although basic information such as demographic and social
indicators were captured throughout the surveys, the questions more specific to organisational
response and recovery changed over time the farther away from the event. Consequently, some
of the contextual and case study questions were modified based on the answers to the survey
questions. The interviews were conducted face-to-face with each interviewee. However, in two
instances, the contextual interviews were done by e-mail due to the distance between the
researcher and interviewee. Information from the interviews was also used to inform the
qualitative part of the system dynamics models in this study.
20 The team was advised that there were many associations within the hospitality industry which did not all have the same
organisations as members. Further, not all hospitality organisations belonged to any association.

80 Research methods and design
Kvale (1996) writes that the research interview is a particular type of conversation between
interviewer and interviewee. The semi-structured interview approach allowed the researcher to
consider a pre-specified list of areas of discussion with each interviewee. The time assigned to
each area of conversation was left to the discretion of the interviewer. The open format of the
semi-structured interview ensured that unexpected facts, attitudes or opinions could easily be
further examined.
The semi-structured interviews were specifically tailored to the nature of the information sought,
contextual or case study. However, each phase (contextual or case study) had a specific interview
guide developed to ensure that the respondents were all asked the same basic questions. This
was for the purposes of comparability later in the research and also to ensure that all topics of
relevance were covered with each interviewee.
Contextual interviews
Each situation has background and context, so too the recovery of organisations after the
Canterbury series of earthquakes. Contextual interviews were conducted with industry sector
representatives, business leaders, experts on the Canterbury economy as well as those working
with recovery agencies. The interviews were meant to enrich the information gathered via the
quantitative portion of this research, to explore prevalent themes among the different industry
sectors and to identify issues that transpired as recovery progressed.
The researcher called each interviewee to ask if they would participate in the research. A follow
up e-mail was then sent to the interviewee with a brief description of the research and their
involvement in it. The interview details (time and place) discussed on the phone were confirmed
by e-mail.
The common question set designed for this phase of the study was modified dependent on the
interviewee. Each interviewee signed an interview consent form which contained details of who
was conducting the research and that everything they said was anonymous and confidential. At
the end of each session, interviewees were asked if there was anyone else they thought the
interviewer/researcher should speak with in relation to the research. All interviews were
recorded and the researcher made extended field notes after each interview. Copies of the
interview consent form and interview guide are in appendix A and appendix B. Further
Key elements of sectoral recovery and resilience after the Canterbury earthquakes: A system dynamics approach
Hlekiwe Kachali
81
treatment of contextual interview data will be described in section 3.5 on data processing and
analysis.
Case studies
A re-analysis of the data from Surveys 1 and 2 as well as the contextual interviews provided the
background context of this segment of the research. To start, all the organisations that had been
contacted for Survey 2 were included in the long list as possible case study organisations. As the
information from the case studies complement that from the survey and contextual interviews, it
was decided that at least two organisations from each sector would be studied. Organisations
were selected based on the criteria outlined below.
The criteria used in selecting the organisations included:
that the organisation had agreed to take part in further research after Survey 2;
at least two organisations from each sector and geographic area sampled;
if possible, at most three people from each organisation;
different size organisations (by employee number);
possible supply chain or locational relationships between some of the organisations, this
to enhance the system dynamics analysis and to establish the effects of disruption to
supply chains;
organisations with different ownership structures (e.g. sole owner, franchise); and
the organisation’s resilience score based on Survey 2 (if possible one high and one low
resilience scoring organisation, using the BRT-53, from each sector or geographic
location).
Eighteen case study organisations were selected based on the criteria outlined. In total, 26
interviews were conducted. A maximum of three (qualitative) semi-structured interviews with
different people were conducted with each organisation selected for this part of the study.
Bertaux (2002) advises that 15-20 interviews are sufficient for qualitative research in general
while Morse (2005) and Creswell (2010) write that 30-50 interviews are sufficient for the
formation of a grounded theory. Where possible, the interviewees were from different
departments in the organisation to give a fuller picture of events before, during and after the
82 Research methods and design
crisis in relation to their organisation. The primary organisation contact, based on Survey 2
information, was asked to recommend other interviewees who would contribute to the study
and provide an alternative organisational perspective. In addition to the two organisations
selected from each sector, there were two other back-up organisations in case the primary
organisations declined to be interviewed.
Interviewees were first contacted by telephone and reminded of previous participation and
contribution to the research. They were then asked if they would be willing to participate in this
part of the study. The researcher explained the case study process and asked what dates were
suitable for the interviewee. The interviewees were then sent an e-mail with the interview date
and other details. The researcher met each interviewee at a location of their choosing; this was
usually the organisation’s premises for those organisations that had returned to their premises or
alternative locations if the organisation were working from elsewhere. When possible, the
interviews were conducted back-to-back for each organisation so that organisational information
from one interview to the next was still fresh in the interviewer’s mind. All interviews were
recorded using an audio recorder. This was with the interviewee’s permission who also signed
interview consent and agreement forms.
Prior to interviewing the first participant, an interview guide with interview questions was
developed. This was to ensure that the same topics were covered with all participants (please see
appendix H for the interview guide). The guide was roughly divided into three main parts:
pre-crisis;
during the crisis; and
post-crisis.
Two further supporting parts of the interview guide contained specific questions on what the
interviewees thought of the resilience and recovery of organisations after disaster. In the
interviews, the first few questions were to establish the organisation’s background (financial
position, pre-crisis experience) and also served to put the interviewees at ease. The questions
that followed were not always asked in the order in which they appear in the interview guide, this
was dependent on answers given by the interviewee.
Key elements of sectoral recovery and resilience after the Canterbury earthquakes: A system dynamics approach
Hlekiwe Kachali
83
3.5 Data processing and analysis
The analysis of the data is tailored to the research aims and questions as demonstrated in Table
3-2. In this thesis, grounded theory (Glaser & Strauss, 1967) is used for theory development. In
the grounded theory method, the theory emerges from the data collected. To a limited extent,
grand theory will also be used as it involves the prior formulation of theory as well as deduction
and testing. The prior formulated theory is based on the literature on disaster recovery,
organisations and crisis management reviewed earlier. It has been suggested that both theories
should be used in tandem as they are normally involved in research and it is difficult to separate
the two (Eisenhardt & Graebner, 2007). Additionally, Suddaby (2006) writes that the developers
of grounded theory did not intend to replace the grand theory method but rather to complement
it.
3.5.1 Grand theory
A lot of research is designed not to generate new theory but to verify existing theory. This
means that findings are arrived at through logical deduction from past studies and knowledge
and not from the data itself. For instance, in the disaster research literature some studies that fit
this mould include those by Toder and Allen (2004), Corey and Deitch (2011) and Dahlhamer
and Tierney (1996).
This way of conducting research is often referred to as the grand theory research method which,
according to Skinner (1990), was developed by Mills (1959). Perz (2007) goes on to describe
grand theory as having global, abstract concepts while Merton (1967) criticised the
abstractedness of grand theory as a disadvantage when making the link between theory and
observed phenomena. Merton argues that this disadvantage stemmed from grand theory not
providing sufficient direction in how data for particular theories should be collected. In this
thesis, grand theory will be used only to a limited extent.
3.5.2 Grounded theory
The grounded theory research methodology was developed in 1967 by Barney Glaser and
Anselm Strauss (1967). It is a systematic methodology involving the discovery of theory through
the analysis of data (Martin & Turner, 1986). According to Strauss and Corbin (1990, p. 23), a
84 Research methods and design
grounded theory is one that is inductively derived from the study of the phenomenon it represents.
Additionally, in the literature the term grounded theory is used for both the process and
outcome i.e. using the grounded theory research approach leads to a theory grounded in data.
From the extensive works on the grounded theory approach, it can be deduced that the stages
for the process involve:
Identification of the area to be studied: the study is carried out via the perspective of
people involved in the area e.g. interviewees in disaster affected organisations
Collection of data: the data for grounded theory can be qualitative or quantitative.
Simultaneous collection and open coding of data: in the grounded theory approach,
these are integrated activities. Strauss and Corbin (1990, p. 96) further proposed axial
coding which is a set of procedures whereby data are put back together in new ways after open coding,
by making connections between categories. They proposed a coding paradigm comprising conditions,
context, action/ interactional strategies and consequences (Strauss & Corbin, 1990, p. 96).
The writing of notes or memos in relation to the coding: from this the main dimensions
and their sub-themes develop. Pidgeon and Harwood (1996) describe memo writing as
the externalisation of data analysis and that it enables further theorising.
Selective coding of data: after the main dimensions and sub-themes have been identified,
coding is carried out for these main dimensions and sub-themes only. Further sampling
is then directed by the theory being developed and is used to enhance and corroborate
the main dimensions and sub-themes.
Several authors point to the advantages of using the grounded theory approach (see e.g.
(Borgatti, 2004; Charmaz, 2003; Cutcliffe, 2000; Turner, 1981)). Some of the advantages include
the possibility of using simultaneous inductive and deductive thinking; the approach is open yet
structured in how it allows researchers to explore themes; and its emergent nature allows for
analysis of how different parts interact as opposed to only studying specific variables. Lastly,
Turner (1983) illustrates how grounded theory can be used in organisational research because of
organisational complex social interactions, while Eisenhardt (1989) points out that the emergent
properties of the grounded theory approach are ideal for use in case study analysis and cross-
case comparisons.
Key elements of sectoral recovery and resilience after the Canterbury earthquakes: A system dynamics approach
Hlekiwe Kachali
85
Interestingly, Strauss and Corbin (1990) characterise two levels of theory generated when using
the grounded theory approach: grand theory and substantive theory. Grand theory evolves from
exploring a phenomenon in a variety of contexts, for example the study of disaster recovery in
organisations from different sectors. From the description of grand theory in section 3.5.1, the
different contexts of recovery can include determining factors of recovery after different
disasters. Substantive theory on the other hand is derived from the study of phenomena situated
in a particular situational context. In this research, this is equivalent to the study of disaster
recovery in an individual organisation.
3.5.3 System dynamics modelling
For this thesis, system dynamics principles are used in analysis (see chapter 2 for detailed
description of system dynamics). Systems thinking and system dynamics are used to analyse the
system attributes (organisational, inter- and intra-sectoral) that are involved in recovery after a
major hazard event. This is done using causal loop diagrams (CLDs) and stock and flow
diagrams from system dynamics. Input information for the system dynamics modelling was
obtained from both the quantitative and qualitative portions of the research. The system
dynamics principles work well with the diagramming that is part of the analysis in grounded
theory used in analysing the semi-structured interview. The inputs to and outputs from the
system were examined to determine the system’s behaviour. System dynamics modelling is
iterative and has five key steps (Sterman, 2000) shown in Figure 3-2.
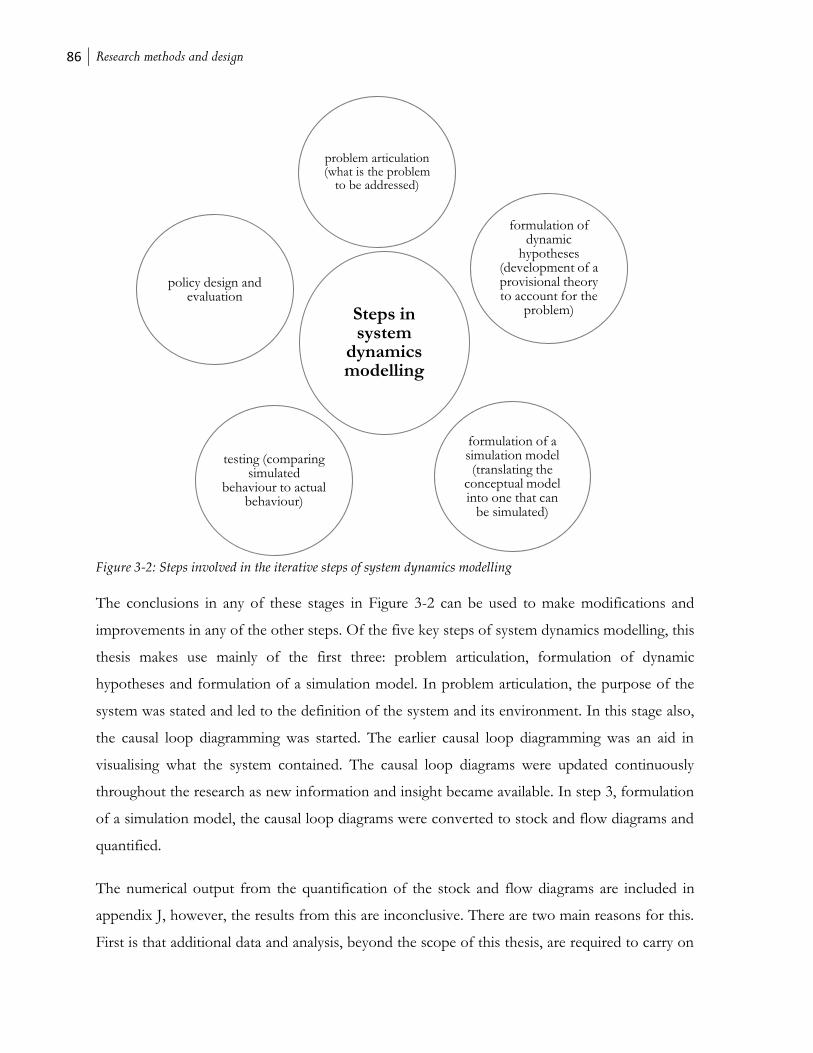
86 Research methods and design
Figure 3-2: Steps involved in the iterative steps of system dynamics modelling
The conclusions in any of these stages in Figure 3-2 can be used to make modifications and
improvements in any of the other steps. Of the five key steps of system dynamics modelling, this
thesis makes use mainly of the first three: problem articulation, formulation of dynamic
hypotheses and formulation of a simulation model. In problem articulation, the purpose of the
system was stated and led to the definition of the system and its environment. In this stage also,
the causal loop diagramming was started. The earlier causal loop diagramming was an aid in
visualising what the system contained. The causal loop diagrams were updated continuously
throughout the research as new information and insight became available. In step 3, formulation
of a simulation model, the causal loop diagrams were converted to stock and flow diagrams and
quantified.
The numerical output from the quantification of the stock and flow diagrams are included in
appendix J, however, the results from this are inconclusive. There are two main reasons for this.
First is that additional data and analysis, beyond the scope of this thesis, are required to carry on
Steps in system
dynamics modelling
problem articulation (what is the problem
to be addressed)
formulation of dynamic
hypotheses (development of a provisional theory to account for the
problem)
formulation of a simulation model (translating the
conceptual model into one that can
be simulated)
testing (comparing simulated
behaviour to actual behaviour)
policy design and evaluation
Key elements of sectoral recovery and resilience after the Canterbury earthquakes: A system dynamics approach
Hlekiwe Kachali
87
the simulation from the quantified stock and flow diagrams. Second, the time horizon for data
collection may have contributed to the inconclusive results as the medium-term effects of
recovery were not yet manifest. As a result of inconclusive results from the quantification and
simulation of the stock and flow diagrams, step 4 in Figure 3-2 (testing) was not much utilised.
This thesis did not outline the policy design and evaluation in step 5. However, the aids,
hindrances and point of intervention in recovery (see chapter 9) resulted from examination of
the causal loop and stock and flow diagrams. Part of the reason for not outlining comprehensive
policy is that the time horizon of this research falls within the first two years after a disaster
event. The design and evaluation of recovery policy would be more beneficial incorporating a
longer time period, as is suggested in the future work section in chapter 11.
There is particular notation used in system dynamics modelling. CLDs are used in the initial
phases of modelling to represent the information gathered and to help articulate the problem.
An example of a CLD is shown in Figure 3-3. The figure has elements and causal links (the
arrows). Each causal link has a sign (polarity) showing the effect one element has on another.
Positive polarity, e.g. between deficit in organisational and sectoral throughput and organisational or sectoral
recovery measures and programmes means that as the element at the tail of the arrow changes, it
produces a change in the element at the head of the arrow in the same direction. Negative
polarity, e.g. between organisational and sectoral throughput and deficit in organisational and sectoral
throughput, means that as the element at the tail of the arrow changes, it produces a change in the
element at the head of the arrow in the opposite direction. The feedback loop, B, represents a
negative feedback loop which means the system depicted is goal seeking. Causal loop diagrams
are especially useful in articulating a problem and visualising complex interactions between
numerous system components. Additionally, causal loop diagrams are the foundation upon
which stock and flow diagrams are built so that the behaviour of the system can be observed
over time. Figure 3-4 shows a stock and flow diagram. A stock is anything that accumulates or
depletes over time while a flow is the rate of change of a stock. Inflow adds to the stock while
outflow depletes the stock. The arrows from Stock to inflow and outflow show that there is an
exchange of information between the stock and the flows which can contribute to the rate of
the flows. The clouds on the ends of the flow arrows depict the environment of the system.
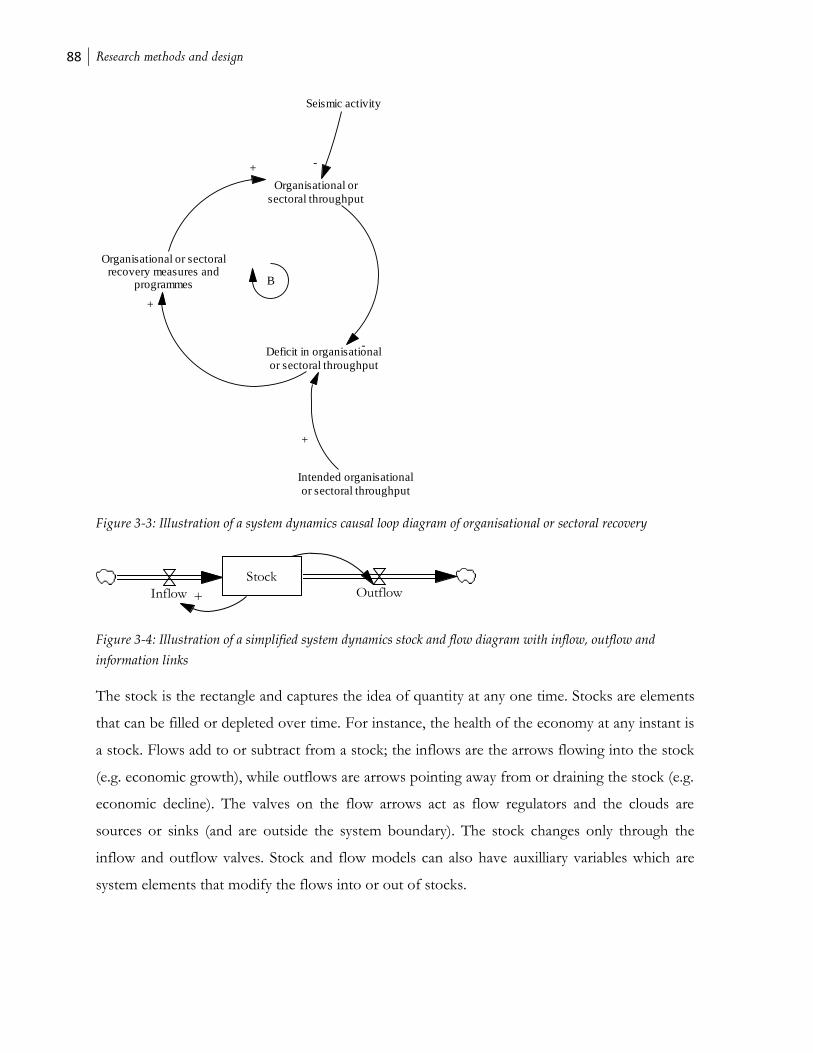
88 Research methods and design
Figure 3-3: Illustration of a system dynamics causal loop diagram of organisational or sectoral recovery
Figure 3-4: Illustration of a simplified system dynamics stock and flow diagram with inflow, outflow and
information links
The stock is the rectangle and captures the idea of quantity at any one time. Stocks are elements
that can be filled or depleted over time. For instance, the health of the economy at any instant is
a stock. Flows add to or subtract from a stock; the inflows are the arrows flowing into the stock
(e.g. economic growth), while outflows are arrows pointing away from or draining the stock (e.g.
economic decline). The valves on the flow arrows act as flow regulators and the clouds are
sources or sinks (and are outside the system boundary). The stock changes only through the
inflow and outflow valves. Stock and flow models can also have auxilliary variables which are
system elements that modify the flows into or out of stocks.
Organisational or
sectoral throughput
Organisational or sectoralrecovery measures and
programmes
Intended organisational
or sectoral throughput
Deficit in organisational
or sectoral throughput
-
+
+
+
B
Seismic activity
-
StockOutflowInflow +
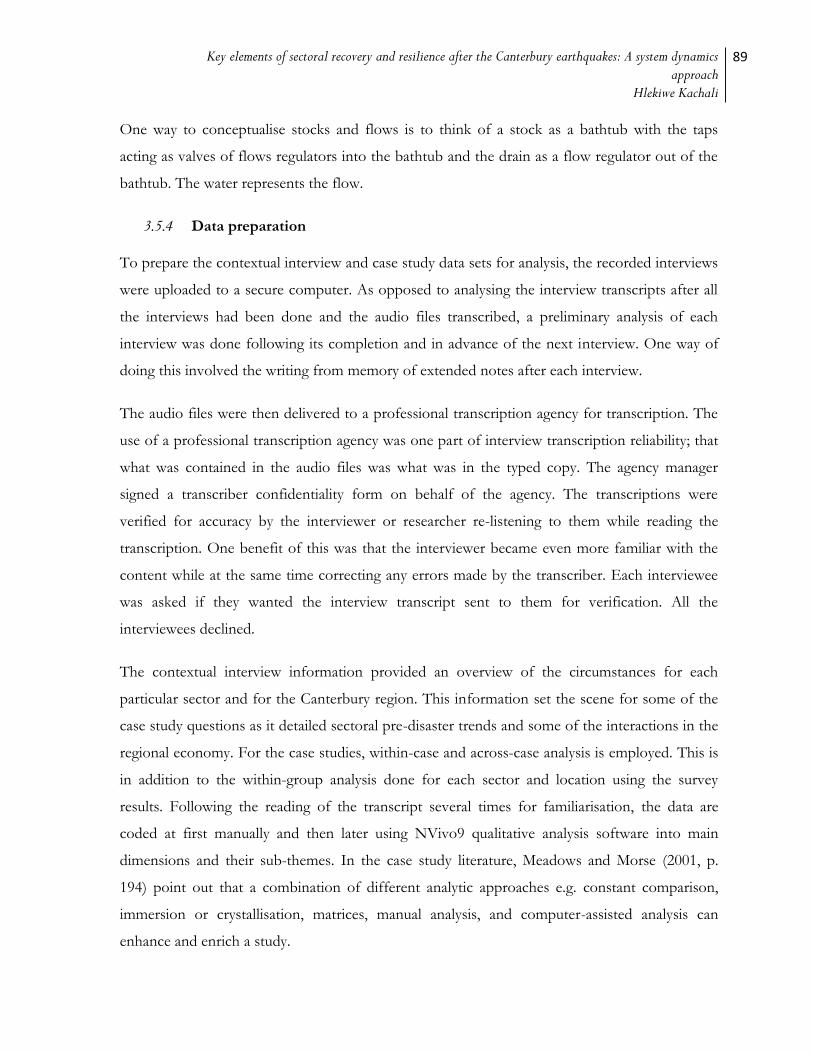
Key elements of sectoral recovery and resilience after the Canterbury earthquakes: A system dynamics approach
Hlekiwe Kachali
89
One way to conceptualise stocks and flows is to think of a stock as a bathtub with the taps
acting as valves of flows regulators into the bathtub and the drain as a flow regulator out of the
bathtub. The water represents the flow.
3.5.4 Data preparation
To prepare the contextual interview and case study data sets for analysis, the recorded interviews
were uploaded to a secure computer. As opposed to analysing the interview transcripts after all
the interviews had been done and the audio files transcribed, a preliminary analysis of each
interview was done following its completion and in advance of the next interview. One way of
doing this involved the writing from memory of extended notes after each interview.
The audio files were then delivered to a professional transcription agency for transcription. The
use of a professional transcription agency was one part of interview transcription reliability; that
what was contained in the audio files was what was in the typed copy. The agency manager
signed a transcriber confidentiality form on behalf of the agency. The transcriptions were
verified for accuracy by the interviewer or researcher re-listening to them while reading the
transcription. One benefit of this was that the interviewer became even more familiar with the
content while at the same time correcting any errors made by the transcriber. Each interviewee
was asked if they wanted the interview transcript sent to them for verification. All the
interviewees declined.
The contextual interview information provided an overview of the circumstances for each
particular sector and for the Canterbury region. This information set the scene for some of the
case study questions as it detailed sectoral pre-disaster trends and some of the interactions in the
regional economy. For the case studies, within-case and across-case analysis is employed. This is
in addition to the within-group analysis done for each sector and location using the survey
results. Following the reading of the transcript several times for familiarisation, the data are
coded at first manually and then later using NVivo9 qualitative analysis software into main
dimensions and their sub-themes. In the case study literature, Meadows and Morse (2001, p.
194) point out that a combination of different analytic approaches e.g. constant comparison,
immersion or crystallisation, matrices, manual analysis, and computer-assisted analysis can
enhance and enrich a study.
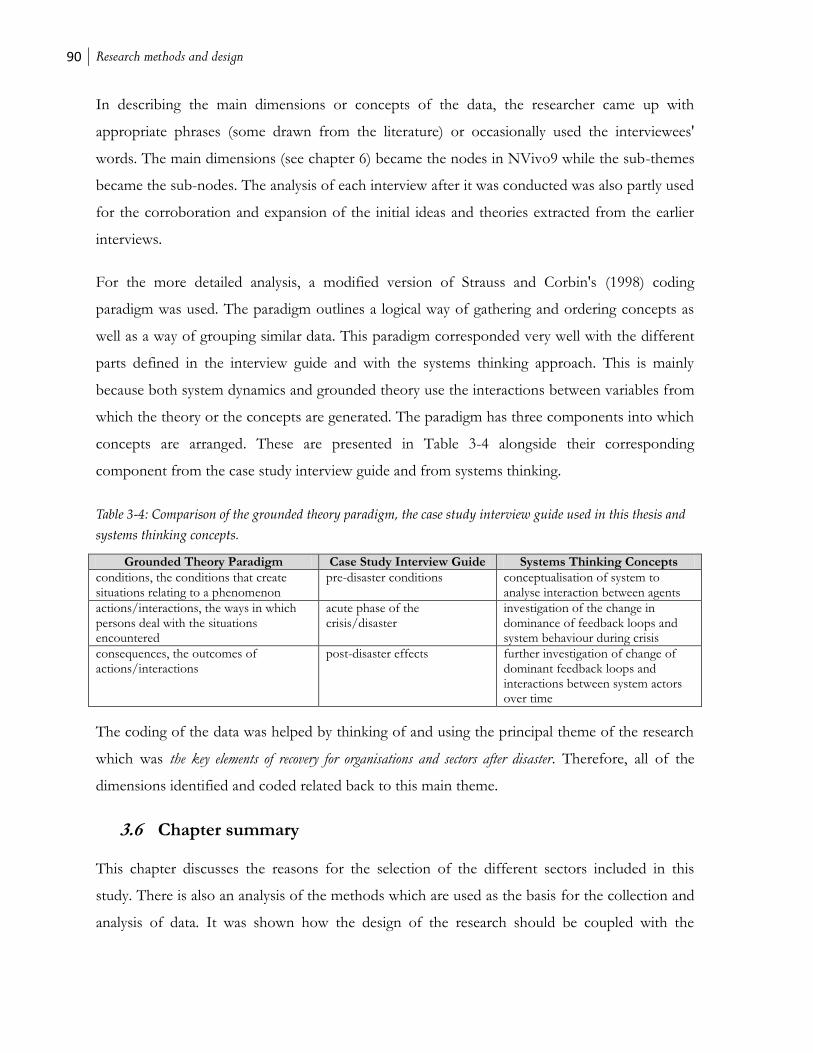
90 Research methods and design
In describing the main dimensions or concepts of the data, the researcher came up with
appropriate phrases (some drawn from the literature) or occasionally used the interviewees'
words. The main dimensions (see chapter 6) became the nodes in NVivo9 while the sub-themes
became the sub-nodes. The analysis of each interview after it was conducted was also partly used
for the corroboration and expansion of the initial ideas and theories extracted from the earlier
interviews.
For the more detailed analysis, a modified version of Strauss and Corbin's (1998) coding
paradigm was used. The paradigm outlines a logical way of gathering and ordering concepts as
well as a way of grouping similar data. This paradigm corresponded very well with the different
parts defined in the interview guide and with the systems thinking approach. This is mainly
because both system dynamics and grounded theory use the interactions between variables from
which the theory or the concepts are generated. The paradigm has three components into which
concepts are arranged. These are presented in Table 3-4 alongside their corresponding
component from the case study interview guide and from systems thinking.
Table 3-4: Comparison of the grounded theory paradigm, the case study interview guide used in this thesis and
systems thinking concepts.
Grounded Theory Paradigm Case Study Interview Guide Systems Thinking Concepts
conditions, the conditions that create situations relating to a phenomenon
pre-disaster conditions conceptualisation of system to analyse interaction between agents
actions/interactions, the ways in which persons deal with the situations encountered
acute phase of the crisis/disaster
investigation of the change in dominance of feedback loops and system behaviour during crisis
consequences, the outcomes of actions/interactions
post-disaster effects further investigation of change of dominant feedback loops and interactions between system actors over time
The coding of the data was helped by thinking of and using the principal theme of the research
which was the key elements of recovery for organisations and sectors after disaster. Therefore, all of the
dimensions identified and coded related back to this main theme.
3.6 Chapter summary
This chapter discusses the reasons for the selection of the different sectors included in this
study. There is also an analysis of the methods which are used as the basis for the collection and
analysis of data. It was shown how the design of the research should be coupled with the
Key elements of sectoral recovery and resilience after the Canterbury earthquakes: A system dynamics approach
Hlekiwe Kachali
91
methods used to gather data and to analyse it. The methods to be used are drawn from different
fields: mainly grounded theory and system dynamics and to a limited extent from grand theory.
These methods complement each other and are useful for investigation and analysis of sectoral
and organisational disaster recovery.
The next chapter has a background description of the sectors included in this study. The
description includes some of the conditions surrounding the individual sectors prior to the
earthquakes and how such conditions may influence the way the individual sectors were affected
by the earthquakes.
92 Contextual interviews
4 Contextual interviews
This section presents results from the contextual interview part of the research. The aim is to
provide background information for the climate the affected organisations and sectors operated
in both prior to and after the earthquakes in Canterbury. Contextual interviews were with
business and industry leaders, individuals knowledgeable about the economies of Christchurch,
Canterbury and New Zealand as well as people working with recovery agencies. The interviews
are also meant to enrich the information gathered via the quantitative portion of this research, to
explore prevalent themes among the different industry sectors and to identify issues that
transpired as recovery progressed. In some cases, the interview responses also act as a guide for
some of the questions crafted for the surveys. Organisations that participated in the contextual
interviews are shown in Table 4-1.
Findings from the contextual interviews are presented in three main parts. The first part is an
overview followed by a brief discussion of each sector in the study. After this is a short
discussion on the acute phase after the earthquakes and how some of the sectors were affected.
The chapter closes with a presentation of the main themes, common to the sectors, which arose
post-disaster.
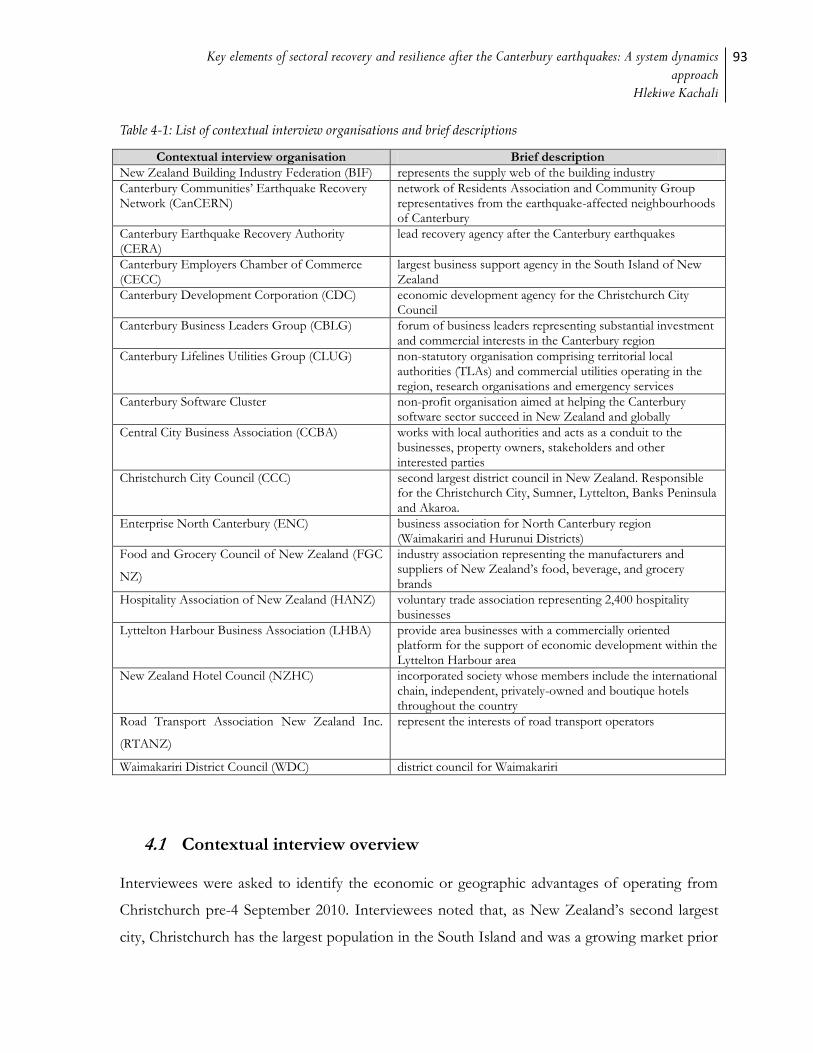
Key elements of sectoral recovery and resilience after the Canterbury earthquakes: A system dynamics approach
Hlekiwe Kachali
93
Table 4-1: List of contextual interview organisations and brief descriptions
Contextual interview organisation Brief description
New Zealand Building Industry Federation (BIF) represents the supply web of the building industry
Canterbury Communities’ Earthquake Recovery Network (CanCERN)
network of Residents Association and Community Group representatives from the earthquake-affected neighbourhoods of Canterbury
Canterbury Earthquake Recovery Authority (CERA)
lead recovery agency after the Canterbury earthquakes
Canterbury Employers Chamber of Commerce (CECC)
largest business support agency in the South Island of New Zealand
Canterbury Development Corporation (CDC) economic development agency for the Christchurch City Council
Canterbury Business Leaders Group (CBLG) forum of business leaders representing substantial investment and commercial interests in the Canterbury region
Canterbury Lifelines Utilities Group (CLUG) non-statutory organisation comprising territorial local authorities (TLAs) and commercial utilities operating in the region, research organisations and emergency services
Canterbury Software Cluster non-profit organisation aimed at helping the Canterbury software sector succeed in New Zealand and globally
Central City Business Association (CCBA) works with local authorities and acts as a conduit to the businesses, property owners, stakeholders and other interested parties
Christchurch City Council (CCC) second largest district council in New Zealand. Responsible for the Christchurch City, Sumner, Lyttelton, Banks Peninsula and Akaroa.
Enterprise North Canterbury (ENC) business association for North Canterbury region (Waimakariri and Hurunui Districts)
Food and Grocery Council of New Zealand (FGC
NZ)
industry association representing the manufacturers and suppliers of New Zealand’s food, beverage, and grocery brands
Hospitality Association of New Zealand (HANZ) voluntary trade association representing 2,400 hospitality businesses
Lyttelton Harbour Business Association (LHBA) provide area businesses with a commercially oriented platform for the support of economic development within the Lyttelton Harbour area
New Zealand Hotel Council (NZHC) incorporated society whose members include the international chain, independent, privately-owned and boutique hotels throughout the country
Road Transport Association New Zealand Inc.
(RTANZ)
represent the interests of road transport operators
Waimakariri District Council (WDC) district council for Waimakariri
4.1 Contextual interview overview
Interviewees were asked to identify the economic or geographic advantages of operating from
Christchurch pre-4 September 2010. Interviewees noted that, as New Zealand’s second largest
city, Christchurch has the largest population in the South Island and was a growing market prior
94 Contextual interviews
to the earthquakes. Other advantages for business were that Christchurch is the hub of and
gateway to the South Island, the proximity to Lyttelton port and Christchurch airport for import
and export as well as the proximity to primary producers. Having Christchurch as a hub with its
sea and air ports cut down on transportation and logistics costs for many of the sectors. Except
for most of the standalone organisations in the hospitality sector, Christchurch is the primary
hub in the South Island for the rest of the sectors in the study; where they run their South Island
operations and distribute or provide goods and services to the rest of the South Island.
Respondents reported that apart from commercial reasons, Christchurch is attractive to their
staff for the lifestyle it affords them: the proximity to the sea, the mountains and nature.
Interviewees narrated that the response phase was characterised by a great deal of uncertainty as
people tried to comprehend what had occurred. In the midst of all this, there was a lot of
information that had to be made sense of. However, the general consensus was that
communication from relevant authorities and agencies during the response phase was not as
good as it could have been. Sector representatives reported that information was not timely, at
times not relevant and details remained unclear. For instance, building suppliers state that there
were too many messages from too many agencies regarding temporary housing which made it
difficult to decipher what was required of the sector.
From contextual interviews, none of the industry sectors reported having previously faced a
disaster of the magnitude caused by the earthquakes. Prior to the earthquakes some sectors such
as building suppliers, the Christchurch CBD and hospitality were not in the best financial health
(see sections 4.2.1 and 4.2.4 for details). This affected their organisation’s financial situation, e.g.
with reduced sales and cash flow, in the time after the earthquakes. Further, interviewees
characterised recovery for their sectors as a return to pre-earthquake levels of revenue or better.
Additionally, several contextual interviewees reported that their sector had identified
opportunities after the earthquakes that were new or that were thought about prior to the
earthquakes and could be incorporated into a future rebuild strategy. However, sectors reported
that identifying the right people to speak with about their ideas was not easy. A lot of time and
energy was wasted being passed on from one agency to the next. As the recovery period
progressed, interviewees detailed how the plan for the recovery of greater Christchurch was not
clear. Particularly affected were trucking, hospitality, building suppliers and Christchurch CBD.
Key elements of sectoral recovery and resilience after the Canterbury earthquakes: A system dynamics approach
Hlekiwe Kachali
95
From the overview of the sectors, inter-sectoral linkages are apparent. These will be explored
fully in chapter 8 where the system dynamics of recovery are discussed.
4.2 Industry sectors
4.2.1 Building suppliers
Building suppliers were selected for this study on the basis of their being a gauge for activity in
the construction industry. This is because they have contact with all other parts of this industry.
The building suppliers sample group in this study is comprised of wholesale and retail
organisations. These are organisations representing the spectrum of building suppliers: some of
the suppliers deal in building machinery, others in light manufacturing and yet others in building
products and construction materials.
According to Careers New Zealand (2011a), the construction industry was the fifth largest in the
country, accounting for eight per cent of economic output. Careers New Zealand also added
that the residential rebuilding part of the sector was struggling. Meanwhile, the New Zealand
Institute of Economic Research (NZIER) in their August 2010 outlook predicted that the
commercial part of construction would collapse (New Zealand Institute of Economic Research,
2010). This outlook was based on the number of building consents applied for in the time
leading up to this information release. This shows the state of the both the residential and
commercial parts of the construction industry prior to the 4 September 2010 earthquake was
poor.
The industry sector representative interviewed narrated that for each new house built, there is a
multiple of three jobs created inside and outside the construction sector. Consequently, an
important aspect that also needed to be looked at in the construction sector, after the
earthquakes and prior to the larger part of the rebuild commencing, was the shortage of
tradespeople (e.g. tillers, plasterers and plumbers). Chang-Richards et al. (2012) detail some of
the challenges of resourcing in the construction industry after disaster.
Pre-earthquakes, building suppliers were affected by the recession in the construction industry
and were running at about 60% less than their full capacity (industry sector representative,
personal correspondence, 2011). This led to a lot of competition for work within the industry
96 Contextual interviews
prior to the earthquakes. The effects of the earthquakes then increased pressure on already tight
profit margins. The sector was most affected after the earthquakes by the uncertainty of when
the rebuild would start and what would be required (what kind of materials and in what
quantities). Part of the uncertainty can be attributed to the long, unprecedented delays in the
settlement of insurance claims caused by the unclear regulations surrounding rebuild and repair
of properties on liquefiable soils. At the time of interview, a few months after the 22 February
2011 earthquake, the sector was optimistic but admitted that the uncertainty made it difficult to
plan organisational strategies. This is in contrast to findings after other disasters (see Durkin
(1984) and Tierney and Webb (2001)) where construction and manufacturing were more likely to
recover in the short-term after disaster than service or retail organisations.
4.2.2 Critical infrastructure
The New Zealand Ministry of Civil Defence and Emergency Management (MCDEM) defines
critical infrastructure providers, also known as lifeline utilities, as entities that provide essential
infrastructure services to the community such as water, wastewater, transport, energy and telecommunications.
These services support the life of our community and are enablers of businesses, and underpin the functioning of the
public sector social economy (New Zealand Ministry of Civil Defence and Emergency Management,
2012). The utility companies in Christchurch are also voluntary members of a non-statutory
body, the Canterbury Lifelines Utilities Group (CLUG). The CLUG was formed after the
completion of the Christchurch Engineering Lifelines Project which culminated in the
publication of the text Risks and Realities (Canterbury Engineering Lifelines Group, 1997). The
project involved critical infrastructure organisations working together to identify network
vulnerabilities. This information was used in carrying out the strengthening and reinforcement of
infrastructure in the mid-1990s. Members of CLUG reported that they have benefitted from
their longstanding networking efforts as utility and non-utility critical infrastructure service
providers.
This sector was severely affected by the earthquakes in part due to the nature of their assets (e.g.
buried infrastructure vulnerable to ground motion) and suffered a loss of capital value as a
consequence of damaged infrastructure. They detailed that they recognised the value of the
services they provide to their customers and that theirs is a different level of expectation and
performance compared to other businesses. Rose and Lim (2002) discuss how business losses
Key elements of sectoral recovery and resilience after the Canterbury earthquakes: A system dynamics approach
Hlekiwe Kachali
97
can be exacerbated by dependency on lifeline services and the length of disruption to those
services. For instance, petroleum and manufacturing are heavily dependent on electricity while
this is not the case for construction.
According to the critical infrastructure sector representative, the most affected critical
infrastructure organisations were the ones that deal with wastewater as their buried infrastructure
suffered the most damage from ground shaking and liquefaction. Conversely, some of the other
critical infrastructure providers detailed that the costs of repair to damaged infrastructure after
the earthquakes would have been much higher had the seismic retrofit (e.g. of transformers) of
the mid-1990s not been done. As a results of the pre-earthquake retrofit, critical infrastructure
providers calculated that the savings made are approximately 90% of what the post-earthquake
repairs would have cost (Canterbury Engineering Lifelines Group, 2011).
Some of the utility infrastructure is tightly coupled and interdependent, for instance electricity,
wastewater and gas lines in close proximity to each other and also sometimes dependent on each
other for operation. As a consequence, utility providers worked closely after the earthquakes to
share best practice and discuss what further improvement measures could be undertaken to
strengthen their networks. They recognised that the types of assets they own are not renewed
often. Consequently, repair and remediation after the earthquakes should be used to implement
newer standards and technologies that can withstand multiple hazard events.
4.2.3 Fast Moving Consumer Goods (FMCG)
The FMCG sector in this study comprises manufacturers (secondary producers), suppliers and
retailers (e.g. supermarkets and dairies) of consumables. Some of the manufacturers and
suppliers are part of larger multinational companies. Additionally, there are two organisations
that own the majority of the supermarkets in New Zealand (supermarket representative,
personal correspondence, 2011). Both organisations own supermarket chains that cater to
different market segments from low end to high end. A dairy is the New Zealand equivalent of a
corner store or convenience store and is usually privately owned. However, petrol (gas) stations
usually also have a retail consumables area similar to a dairy.
98 Contextual interviews
In interviews FMCG manufacturers, suppliers and the supermarket chains all described having
major distribution centres in Auckland and Christchurch. The Auckland distribution centres
receive the bulk of shipped goods, service the North Island and also send goods to the South
Island. The Christchurch distribution centres, some of which receive goods from the North
Island, service the South Island. Apart from the convenience of having major distribution
centres in Christchurch, some organisations spoke of very high transport and storage costs if
they did not have their own distribution centres on the South Island.
The FMCG sector was in good financial health pre-earthquakes. Sales initially dropped
considerably just after the earthquakes but this did not last long as most of the organisations in
this sector produce and provide goods essential to sustain life. This sector was particularly
affected by the disruption to utilities however. Further, as a consequence of dealing with
putrescible products, the FMCG sector was faced with a massive clean-up job after the
earthquakes due to shelving collapse and the need to dispose of stock. Also, the size and access
to resources of most of the FMCG organisations in the sample meant that they were in a
position to assist other organisations such as the Red Cross by donating food items.
4.2.4 Hospitality
The hospitality organisations in the sample are specifically cafes, bars and restaurants:
organisations subject to customer discretionary spending. In the five years leading up to the 4
September 2010 earthquake, the hospitality industry in general had been affected by the global
financial crisis. Visitor numbers to New Zealand were down and New Zealanders also cut back
on their discretionary spending (Careers New Zealand, 2011b). However, in a July 2011 release,
Statistics New Zealand (Statistics New Zealand, 2011d) reported that the highest increase in
electronic card transactions for the year ending July 2011 was in the hospitality industry.
However this information from Careers New Zealand and Statistics New Zealand is unclear.
This is because the information is not presented by region, includes hospitality accommodation
organisations and could be partly attributed to bookings for the 2011 Rugby World Cup which
was hosted in New Zealand. For the year to February 2012 however, the largest decrease in
electronic card transactions was in the hospitality industry (Statistics New Zealand, 2012d). This
reflects the drop in customer discretionary spending which Statistics New Zealand reported was
partly attributable to customers not spending as much in the uncertain economic climate. In past
Key elements of sectoral recovery and resilience after the Canterbury earthquakes: A system dynamics approach
Hlekiwe Kachali
99
disaster studies, Tierney (2007b) found that businesses dependent on customer discretionary
spending may struggle to recover after disaster as people spend less.
Interviewed representatives from the hospitality industry reported that pre-earthquakes, the
sector had been over-licensed, i.e. operational licenses, for an area the size of Christchurch.
What is unclear is whether cafes were also over-licensed. The hospitality sector also had a high
staff turnover pre-earthquake as a consequence of the decline in sectoral performance and the
low wage structure common in the industry (New Zealand Department of Treasury, 2002). Pre-
earthquakes, hospitality organisations located in or near the Christchurch CBD benefitted from
the proximity to other businesses as well as from the visitor numbers to the CBD’s tourist icons.
Others hospitality organisations also had a steady custom from the people who worked in the
CBD. These advantages became disadvantages after the earthquakes as some organisations
whose premises were not damaged had to close due to the cordoning off of the CBD or of
nearby buildings. For some hospitality organisations, their equipment was subject to direct
physical damage and in other instances was not easily moveable which made relocation difficult.
4.2.5 Information and Communication Technology (ICT)
Information and Communication Technology (ICT) was identified in the Canterbury region’s
economic strategy as a high-growth sector (Canterbury Economic Development Co. Ltd., 2009)
and is second only to dairy in export earnings (New Zealand Information and Communication
Technologies Group, 2010). Additionally, the Canterbury Development Corporation (personal
correspondence, 2012) regards ICT as a pull sector. Nemet (2009) describes a pull sector as one
where demand for goods and services is a principal driver for the rate and direction of
innovation. This description corresponds to the reported rise in demand for ICT services from
organisations affected by the earthquakes. Despite this, the sector reported facing a shortage of
skilled personnel before the earthquakes. The sector thought that this trend would be
exacerbated by the earthquakes as a lot of expatriate ICT personnel were thinking of leaving the
region.
The interviewee reported that a significant number of ICT organisations in New Zealand are
export focused. However, a small proportion of ICT organisations serve the local market for
activities such as server installation, maintenance, data management and programming. For this
100 Contextual interviews
proportion of ICT organisations the earthquakes brought with them an increased workload.
There was a surge in requests for data retrieval and for the migration to newer methods of data
management such as cloud computing. ICT has become a core part of the operations of many
organisations and for them to get back up and running as quickly as possible their ICT systems
had to be functional.
4.2.6 Trucking
The National Road Carriers Inc. (NRC) reported that more than 90% of New Zealand’s freight,
by weight, is transported by road (National Road Carriers Inc, 2012). This is consistent with the
information from FMCG organisations who stated that a significant portion of their goods are
transported in this way and illustrates the level of interdependency between these two sectors.
Apart from those trucking organisations working with FMCG, other trucking organisations
work closely with the construction industry while others are involved in cross-country
transportation of goods.
A characteristic of the trucking industry in New Zealand is that trucking organisations pay road
user charges based on the weight of the goods they carry and also on the distance their vehicles
travel (New Zealand Transport Agency, 2012b). This means that it is in their interests to
transport goods in the shortest distance possible. Trucking organisations reported that after the
22 February 2011 earthquake, they faced increased costs from more time on the road due to
reduced road capacity, increased distance caused by detours, as well as from more frequent
vehicle maintenance because of earthquake damage to road surfaces (this will be discussed in
more detail in chapters 7 and 8). After the Loma Prieta earthquake, findings point to significant
economic impacts in surrounding areas such as Santa Cruz as a result of damage to road surfaces
and supporting infrastructure such as bridges (Kroll et al., 1991).
The trucking industry representative interviewed expressed that the fortunes in this sector were
looking up in the 18-to-24 month period leading up to the earthquakes. This was due to growth
in the timber, dairy and mining industries. Preceding this period of growth, the trucking industry
had been challenged by 3-to-4 years of recession. Trucking is another industry that had a skills
shortage before the earthquakes. This was even more noticeable in the response phase after the
22 February 2011 earthquake as this type of skill was required to operate some of the heavy
machinery used to deconstruct buildings. The sector talked of the earthquakes bringing with

Key elements of sectoral recovery and resilience after the Canterbury earthquakes: A system dynamics approach
Hlekiwe Kachali
101
them the opportunity to improve the road network design in the Canterbury region and make it
more heavy vehicle friendly. For instance, one improvement identified was the re-design of
some of the pre-earthquake road network in the Christchurch CBD to make it easier to deliver
goods and services.
4.3 Geographic locales
4.3.1 Christchurch Central Business District (CBD)
The Christchurch Central Business District (CBD), also known as the Central City, is defined as
the area bound by the four avenues: Bealey Avenue, Fitzgerald Avenue, Deans Avenue and
Moorehouse Avenue. The CBD had a mix of organisations that gained from its geographical
centrality as well as from having other organisations around them. Most of the major hotels in
Christchurch were in or around the CBD; it had some of the tallest buildings in the region and a
lot of unreinforced masonry structures vulnerable to earthquake shaking. The CBD also had
some of Christchurch’s major tourist attractions such as the Cathedral, which was badly
damaged in the 22 February 2011 earthquake and may be deconstructed. After the 22 February
2011 earthquake, a number of other heritage buildings in the Christchurch CBD were damaged
and subsequently demolished. These heritage buildings were on the national register maintained
by the New Zealand Historic Places Trust (NZHPT)21 (2012).
Among the 34 Organisation for Economic Co-operation and Development (OECD) countries,
New Zealand has the fifth highest car ownership rate (New Zealand Ministry for the
Environment, 2012). Furthermore, Christchurch’s car ownership rate is slightly higher than the
New Zealand national average, while the Christchurch CBD had one of the highest ratios of car
parks to employees among the OECD countries. A lot of these car parks could not be used after
the 22 February 2011 earthquake which affected the Christchurch City Council’s rates and
revenue sources. In addition, the Christchurch CBD had the city’s main bus interchange.
Consequently, the damage to and cordoning off of the CBD brought about re-routing of public
and other vehicle transport to the remaining roads in greater Christchurch. As discussed earlier,
21 A crown entity set up to preserve and conserve the culture and history of New Zealand
102 Contextual interviews
trucking associations mentioned the increased amount of time they spent on the road due to
decreased road capacity.
At the time of the 22 February 2011 earthquake the CBD had the largest selection of retail,
hospitality and entertainment establishments in the South Island (Central City Business
Association, 2011). However, as detailed by the sector representative, the CBD was in decline in
the time leading up to the earthquakes. It had stiff competition from the expanding suburban
malls which were increasingly preferred by shoppers. It has been argued that Christchurch City
had too much retail space per capita (Buchanan, 2011). However, as the hub of the South Island,
retailers argued that the city served all of the South Island. The trucking and FMCG associations
emphasised this as one of the pre-disaster advantages of having a presence in Christchurch.
Some studies have looked at the recovery and performance of central business districts after
disaster. Chang and Falit-Baiamonte (2002) stress the importance of considering neighbourhood
effects in how organisations in business districts are affected by disaster. The same
neighbourhood effects also have a bearing on how the organisations recover. Olshansky (2006),
in his paper on planning after Hurricane Katrina and the lessons that can be learned, talks of the
successful rebuild of Kobe’s CBD after the 1995 Great Hanshin earthquake.
4.3.2 Kaiapoi Town Centre
Kaiapoi is a historic river town which in its boom years had wool and meat processing factories.
With the closure of these industries in the 1970s and 1980s respectively, Kaiapoi later became a
dormitory suburb of Christchurch. Blackwell’s Department Store, started in 1871 and the oldest
family owned department store still operating in New Zealand, is situated in Kaiapoi (Kaiapoi
Promotion Association Inc, 2012). Kaiapoi also had some heritage buildings listed with the New
Zealand Historic Places Trust (NZHPT). One of these was the Kaiapoi Museum which was
damaged in the 4 September 2010 earthquake and later demolished. The community in the town
was very close knit.
The modern day Kaiapoi Town Centre (mainly along Williams Street) was the main retail and
business area for the town and had a substantial number of unreinforced masonry (URM)
buildings which were badly damaged in the 4 September 2010 earthquake. Kaiapoi had a

Key elements of sectoral recovery and resilience after the Canterbury earthquakes: A system dynamics approach
Hlekiwe Kachali
103
tremendous amount of liquefaction after the 4 September 2010 earthquake which also
contributed to the damage.
4.3.3 Lyttelton Town Centre
In 2009, the New Zealand Historic Places Trust (2009) made a significant portion of Lyttelton
Town one of the largest historic areas in New Zealand. This was in addition to the historic sites,
such as the Lyttelton Timeball, that were already listed with the Trust. The epicentre of the 22
February 2011 earthquake was located five kilometres away from the town (GeoNet, 2011). Just
as with the Christchurch CBD and Kaiapoi Town Centre, Lyttelton had a lot of URM buildings
which were subsequently demolished following the 22 February 2011 earthquake. The URM
buildings that were demolished were part of the history and culture of the town and this meant
that the character of the town was altered.
The port town of Lyttelton has a lot of locals loyal to the town that have set up there because
their roots are in Lyttelton. Lyttelton also has strong business and other associations led by a few
prominent, very active people. Additionally, Lyttelton serves as an important part of the arts and
crafts scene of the greater Christchurch area. This, coupled with the historic nature of the town,
is a tourist draw card. Lyttelton is also home to the Port of Lyttelton and is connected to the
greater Christchurch area by the Lyttelton Road Tunnel which is a conduit for most of the
import and export traffic to the port. Also of importance is Evans Pass/Sumner Road used by
the trucking sector to get to the port, especially important for transporting dangerous goods.
The Evans Pass/Sumner road is still closed at the time of writing (July 2012). More details on
the impacts of the damage to critical infrastructure in and around Lyttelton are in chapter 7.
4.4 Emergent themes from contextual interviews
This section details some of the commonalities between sectors in the response and short-term
recovery phase. For most of the interviewees, aside from the ongoing earthquakes making
planning difficult, the change from response to recovery was marked by the day that the
Canterbury Earthquake Recovery Authority (CERA) officially took office. The continuing
earthquakes made it difficult for people and for organisations to transition from response to
recovery as the response clock was continually reset. With each major earthquake, buildings had
104 Contextual interviews
to be rechecked, staff left places of work to check on families and property and people’s
mindsets went back to response mode.
During the response, i.e. acute, phase after the earthquakes, some industries in the sample had
an increased demand for their goods and services immediately following the earthquake. There
was awareness of these requirements within the sampled industries. The goods and services
required fell into three broad categories:
non-substitutable services;
equipment and goods required to support the response and search and rescue efforts
(Urban Search and Rescue gear, fuel, heavy earth-moving machinery such as diggers, pre-
fab housing units) and also for repair of damage to infrastructure; and
essential goods and services for the public (e.g. water, fuel, portable toilets, tents).
Those sectors that were needed immediately following the earthquakes had different amounts of
time, after the main event, in which to provide goods and services. The trucking industry for
example had a few hours to prepare as buildings in the CBD were being checked and rescue
preparations made before they were called in. Sectors providing rescue gear were called on
almost immediately. One organisation22 had approximately a fortnight to prepare before needing
to provide their non-substitutable services.
4.4.1 Pre-existing sectoral conditions and attributes
Interviewees were asked about other pre-existing systemic conditions that contributed to how
different sectors were affected (positively or negatively) by the earthquakes. One effect was to
organisations that were in or around the Christchurch CBD area; apart from the economic
decline affecting these businesses, they were also subject to neighbour effects. These effects,
such as benefiting from the close proximity to numerous other organisations in the same area
and also the general foot traffic from the number of people who worked in or visited the CBD,
were an advantage pre-disaster and became a disadvantage post-disaster. The advantage was that
there was a continual flow of foot traffic in the area before the earthquakes and the disadvantage
was that a large number of people, tourists and employees for instance, did not go to the CBD
22 This service cannot be described for reasons of confidentiality
Key elements of sectoral recovery and resilience after the Canterbury earthquakes: A system dynamics approach
Hlekiwe Kachali
105
after the earthquakes. A second effect of pre-earthquake conditions was that organisations on
the edge of the CBD cordon reported that post-September 2010, apart from the fall in numbers
of people shopping, working and visiting the CBD, another reason for the decrease in customer
numbers was that people perceived them to be closed because of their proximity to the cordon.
Furthermore, other contributing pre-earthquake conditions had to do with the industry sector of
some of the affected organisations. For instance, location specific23 businesses such as those in
hospitality or retail spoke of the inability to retrieve specialised equipment or merchandise from
within the Red Zone of the CBD. Both food and accommodation hospitality establishments
faced difficulties relocating. This contributed to some of these organisations not being able to
relocate quickly for lack of equipment or merchandise. However, the Christchurch CBD
industry representative mentioned organisations that had modified the way they interacted with
their customers by either starting to trade online or even door-to-door. For building suppliers, at
the time of the 4 September 2010 and 22 February 2011 earthquakes the sector was still
struggling to recover from the global financial crisis whereas ICT and trucking were concerned
about the shortage of skilled labour.
4.4.2 Factors that aided recovery
On factors that aided the recovery, interviewees highlighted some organisations that had adapted
to the post-disaster environment by relocating to other retail areas such as shopping malls.
Interviewees were asked what would happen to the retail space used by relocated organisations
when they vacated and moved back to the CBD. Almost all the respondents said this had not yet
been thought about in detail but would most certainly have an effect later on in time. One
respondent was of the opinion that as opposed to having the donut effect, with an underdeveloped
CBD and well developed suburban shopping, perhaps Christchurch would need to sacrifice some
of its shopping malls in the long run. Furthermore, some central city property owners and some
of the business leaders suggested that there be a decade long moratorium on new licenses for
accommodation or for the expansion of shopping malls. They explained that this would provide
an opportunity to existing earthquake affected businesses to recover. Second, the moratorium
23 The phrase “location specific businesses” is meant in two ways: the first is that clientele came because of where the
organisation was located and the second is that the organisation had machinery and equipment that they could not (easily)
move.
106 Contextual interviews
would work as a check for the sectors already over licensed prior to the 4 September 2010
earthquake. Interestingly this was in contrast to some of the messages that came from the
Canterbury Earthquake Recovery Authority (CERA) on limited interference and leaving the
market to sort itself.
The New Zealand Central Government made available an Earthquake Support Subsidy (ESS)24
for organisations with 50 employees or less. The Earthquake Support Subsidy (ESS) was paid to
eligible organisations in the Christchurch area that employed 50 people or less. It was originally
to be paid for up to six weeks after the 22 February 2011 earthquakes but was extended to eight
weeks. There was unanimity among interviewees that the ESS for businesses was especially
helpful as businesses worked through insurance policies and waited for insurance payments for
lost wages while also trying to plan how to move forward. Another positive step has been the
collaboration between organisations post-earthquake. Interviewees noted that organisations that
had different purposes or that represented opposing interests prior to the 4 September 2010
earthquake worked together afterwards towards a common goal of recovery.
Chapter 9 has a more comprehensive discussion on the aids and hindrances to recovery after the
2010 – 2011 Canterbury earthquake sequence.
4.4.3 Factors that hindered recovery
On elements that could or did hinder recovery, interviewees felt that the initial Draft Central
City Plan25, before its adoption by the Christchurch City Council (CCC), was not economically
viable in the long run. Notably the proposed 7-storey height limit for buildings was seen as a
disincentive for investors wanting to put their money in the Christchurch CBD as it did not
offer a good enough return on investment. Also mentioned was that the recovery plan for the
CBD should overall be good enough to attract new and returning investors by designing and
planning for a commercially viable CBD. Interviewees said one way to do this could be by
24 Detailed information on the Earthquake Support Subsidy can be found at http://www.msd.govt.nz/about-msd-and-our-
work/newsroom/media-releases/2011/millions-for-christchurch-quake-employment-support.html.
25 The fundamental ideas in this plan came from the CCC pre-earthquake long-term plan and from submissions by the public.
Final sign-off and approval for the plan was by CERA. At the time of writing, March 2013, the plan had been reviewed and
amended.

Key elements of sectoral recovery and resilience after the Canterbury earthquakes: A system dynamics approach
Hlekiwe Kachali
107
having the CBD as a mixed use residential, business and work area with multiple precincts as
well as the right mix of businesses and tenants.
Without exception, all interviewees talked of the uncertainties concerning aftershocks, delayed
insurance pay-outs and the consequent delay to start of rebuilding work as barriers to recovery.
The general consensus was that there was not much that could be done about insurance by the
various industry sectors and that it was a matter of time before this was solved. Some
interviewees further expressed concern that Christchurch needed to actively market itself as still
being open for business to counter the possibility of being forgotten.
4.4.4 Lessons
Interviewees were asked what lessons have been learnt after the earthquakes. One of the biggest
lessons was for organisations to have business continuity and disaster recovery plans, as well as
being ready to adapt and use new ways of working for example in communicating with staff and
customers. Also, all the interviewees highlighted the interdependencies between the different
industry sectors with each other and with the wider economy and how a problem in one sector
could propagate to other sectors. This brings to the fore the need for organisations and industry
sectors to be cognisant of how other organisations or sectors can affect their operations.
Importantly, all the interviewees emphasised that the primary importance for recovery is the
wellbeing of people as they make up the organisation. An organisation’s and a sector’s recovery
partly depended on the recovery of the people in it.
4.4.5 Challenges and opportunities
One of the main messages to emanate from the contextual interviews was that striking the right
balance between short- and long-term recovery priorities was a challenge. This was made more
difficult by the continuing earthquakes and by the lack of a clear vision for what the greater
Christchurch area would recover to. Related to this was the worry many of the sectors had that if
the recovery strategy and recovery activities took too long, Christchurch would be forgotten as the
rest of New Zealand and the world moved on. Interviewees mentioned that Christchurch should
not just be a gateway to the South Island but also a stopping place. However, it was
acknowledged that a lot of what tourists stopped for, in the CBD at least, was damaged in the
108 Contextual interviews
earthquakes. Also, the extended closure of the CBD did not serve as good advertising for the
City, although the pop-up mall26 was a reminder of where the CBD used to be and what it could
be again. Interestingly, in the second half of 2012, the travel site Lonely Planet 27 named
Christchurch as one of the most exciting cities in New Zealand. This was attributed to the city’s
resilience and the emergence of new entertainment areas.
At the time of interviewing, interviewees felt that a credible vision of recovery as well as a plan
to fulfill that vision were necessary to give confidence that recovery would happen.
4.4.6 Industry representation after the earthquakes
Studies (e.g. (Olshansky & Johnson, 2012; Tyhurst, 1951)) show that the formation of groups in
reaction to disaster is a common phenomenon. The Canterbury earthquakes were no different.
Among the myriad groups that formed were associations purporting to support one or other
industry groups. These new associations were in addition to the already existing pre-earthquake
industry associations. This trend was both positive and negative. Positive in that people were
represented, felt empowered and could put their views across. However, in other cases this was
to the detriment of the affected population or sector (e.g. Christchurch CBD) as groups claiming
to represent the same organisations did not always have a unified message. Also, the associations
were all vying for the attention of the same agencies involved in disaster recovery activities. This
meant that the agencies had to decide who to pick and work with in recovery, which may have
marginalised some groups. The associations that were the loudest were not necessarily the ones
chosen. Instead, according to one recovery agency representative, the associations chosen were
the ones that either had a proven track record or a viable plan for recovery (Recovery agency
representative, personal communication, 2012).
Some industry sectors chose to come together and speak with one voice. This was the case in
the hospitality industry where there are traditionally many associations (mostly with membership
dependent on type of hospitality establishment). After the earthquakes, several hospitality
associations came together to form Christchurch Hospitality Inc. (CHI). However, there are
26 The pop-up mall was set up in October 2011 to temporarily house retail establishments as plans for the rebuild of the
Christchurch CBD were still being drafted.
27 The full Christchurch Lonely Planet review can be found at http://www.lonelyplanet.com/new-zealand/christchurch-and-
canterbury/christchurch/travel-tips-and-articles/76957 (accessed March 2013)
Key elements of sectoral recovery and resilience after the Canterbury earthquakes: A system dynamics approach
Hlekiwe Kachali
109
many hospitality establishments that do not belong to any industry association. Similarly, not all
the organisations in the CBD belonged to the Central City Business Association (CCBA) which
was very prominent in speaking up for its membership. This might have led the authorities to
think that all organisations were represented and if the unrepresented organisations wanted to be
heard, they would have had to find alternative means. Regardless, the industry associations acted
as representatives for their members with recovery agencies such as the Christchurch City
Council (CCC) and the Canterbury Earthquake Recovery Authority (CERA).
4.4.7 Recovery goals and recovery of the Christchurch central business district
(CBD)
When asked who they thought was driving the recovery, interviewees had varied responses.
Some of the answers given included CERA, CCC, financiers, re-insurers and the continuing
aftershocks. This list showed that Christchurch still had a way to go in articulating a common
vision of recovery and how it would be achieved. A common vision is important so that all
parties concerned have a common understanding of the end goal and can therefore align their
organisational and sectoral goal(s) with the overall goal for recovery. This aspect is discussed in
sections 8.4.3 and 9.6.1 on how uncertainty in recovery planning can be detrimental.
In addition to the recovery of their sector, interviewees were concerned about the recovery of
greater Christchurch as the two were somewhat entwined. Pre-earthquakes, Canterbury,
specifically greater Christchurch, was growing and for this growth to continue required external
sources of funding, investment and in certain instances in-migration. This was even more
important after the earthquakes. Although not explicitly stated by all interviewees, the view was
that the CBD was the most visible element of the greater Christchurch rebuild, which if planned
and advertised well, would serve as the flagship that would make people want to invest funds
and manpower in Canterbury.
Interviewees were of the mind that it was not a matter of if but when Christchurch recovered and
that it would take a concerted effort. Also dominant was the clear need to build back better than
what existed before the 4 September 2010 earthquake, both for improvement as well as for
financial and economic viability. Interviewees stated that there was a need to realise that the
rebuild, if it was done right, presented a chance to revitalise the economy of Christchurch and

110 Contextual interviews
that the city’s fundamental advantages had not changed following 4 September 2010. This is
even as the city was different as a result of the earthquakes. For instance, one of the pre-existing
conditions pointed out was that prior to the earthquakes the retail sector in the CBD in
particular and the hospitality sector were performing poorly. In addition, the increasingly
popular suburban malls were directly competing against the CBD for clientele. There was a
chance after the earthquakes to evaluate the interaction between the CBD and suburban malls
and craft an overall strategy with that in mind.
Interviewees emphasised that everyone involved in the rebuild should remember that
Christchurch was not returning to where or what it was pre-4 September 2010 as the landscape
had changed almost irrevocably. For instance, the pattern in the last few years before the
earthquakes had been for businesses to set up or relocate in the west of the city in the Riccarton-
Addington area. With the cordoning off of much of the CBD this trend accelerated. It was
therefore critical for people to understand that the idea was not necessarily to rebuild the
Christchurch CBD as was but to design and construct a Downtown Christchurch attractive to all
users. Instead of having businesses as primary tenants, it was proposed that the Central City
might be a centre for the arts, for retail and for hospitality.
In redesigning the Christchurch CBD, interviewees spoke about other opportunities for
improvement. The trucking sector wish list included the possibility to enhance the road network
in and around the CBD to make it more user-friendly for delivery trucks, public transport and
other road users. Further opportunities came from the ICT and building suppliers sectors to trial
and implement new technologies creating a hi-tech Christchurch. The ICT sector mentioned the
possibility for use of smart technologies for whoever would occupy the Central City whereas for
the construction (building suppliers) sector the use of building techniques to minimise damage
and disruption could be incorporated. There is more discussion on the recovery of the CBD in
chapter 7.
4.5 Chapter summary
This chapter presented the results from the contextual interviews with business and industry
leaders. Also presented was contextual information on the sectors included in the study,
complemented with findings from past research into organisational disaster recovery. The
information from this section will be used with data from the other results chapters, 5 and 6, in

Key elements of sectoral recovery and resilience after the Canterbury earthquakes: A system dynamics approach
Hlekiwe Kachali
111
later parts of the thesis for an analysis of the key elements of organisational and sectoral
recovery.
From the contextual interviews, respondents detailed the economic and geographic advantages
of being in Christchurch: its geographic location allowing for easy access to land and sea ports as
well as the ease of reaching the South Island market. Another advantage is Christchurch’s
attractiveness to potential and current employees. No industry sector reported having faced a
disaster of such magnitude in their history in New Zealand.
Findings from the contextual interview data point to sectors being affected in varying ways after
the earthquakes. For instance, some sectors such as trucking had increased demand for their
services while building suppliers were affected conversely. Some of the effects were a result of
pre-earthquake characteristics such as type of goods and services delivered or organisational
location. Furthermore, some of the interdependencies between different industry sectors as well
as with the wider economy highlighted how a problem in one sector could propagate to other
sectors.
Other lessons brought up are the importance of staff in recovery and the role of business
continuity plans after disaster. Some of the major post-earthquake challenges identified included
making the transition from response to recovery as well as the shortage of skills for sectors such
as hospitality and trucking. However, respondents narrated that there were also opportunities
post-disaster such as the chance to incorporate long planned for and needed improvements
while crafting recovery strategies.
Interviewees reported that factors that aided recovery included the willingness and ability of
organisations to adapt as well as assistance from Central Government in the form of the
earthquake support subsidy (ESS). Interviewees detailed that they thought the financial non-
viability of the Central City recovery plan was a hindrance to recovery. Similarly, the uncertainty
on the duration of earthquake activity was also seen as a hindrance to recovery.
Furthermore, interviewees spoke of what they viewed as lack of clear leadership, in leading the
recovery effort, as not helpful. It should be noted that this was at the start of the short-term
recovery phase.
112 Contextual interviews
Specific to the geographic locales, an emergent theme was the existence of unreinforced
masonry (URM) buildings making them more vulnerable to earthquakes. In addition, the extent
of damage to individual buildings, in the CBD or town centres, also had an effect on
neighbouring buildings.
Interestingly, some of the aspects identified from the contextual interviews with business and
industry representatives were the same as those identified in the case study interviews with
organisations in the study. Results from the case study interviews are presented in chapter 6.
The next chapter has findings from the surveys, deployed to collect mainly quantitative
information for the study.

Key elements of sectoral recovery and resilience after the Canterbury earthquakes: A system dynamics approach
Hlekiwe Kachali
113
114 Surveys
5 Surveys
In this study, the surveys were used to capture mainly quantitative data. Their advantage lay in
the possibility to collect information from multiple respondents using standardised questions
and in the same timeframe. As outlined in chapter 3, all three surveys deployed contained two
main components: 1) questions on impacts of the earthquakes to organisations and industry
sectors as well as what measures they undertook to recover, and 2) questions asking about
organisational resilience. The survey questionnaires are in appendices K to M. For each of the
surveys, not all the survey results are presented here. This is both for reasons of space and to
present results that will best explain the effects of the earthquakes. Extra results tables are
included in appendices C to E.
In this chapter, the survey results are presented in the order in which the surveys were deployed.
For some of the larger tables, some of the values have been highlighted to make it easier for the
reader. There is also some brief discussion of the survey results throughout the chapter. The
results from all surveys are then summarised in section 5.4 in a discussion on sectoral challenges
and temporal trends across sectors. Crucially, the aspects that emerge in this chapter are used in
analysis to come up with sectoral signifiers of recovery (chapter 7), system behaviour that
influences recovery (chapter 8), aids, hindrances and points of intervention in recovery (chapter
9) and organisational disaster resilience (chapter 10).
The surveys were sent to the same organisations for the duration of the study, however as
shown in Tables 5-1 and 5-2, the number of survey responses decreased but the response rates
increased with subsequent surveys. At each survey point, organisations were asked if they wished
to take part in future research. Some of the respondents declined and for ethical reasons were
not contacted again. It should also be noted that some of the organisations in this study fall
within an industry sector group and might also physically be in one of the geographic sectors
sampled (e.g. hospitality organisations located in the Christchurch CBD). In such cases, data
were analysed based only on the sector (industry or geographic) they were selected for in this
study. Tables 5-1 and 5-2 show when each survey was deployed and what the survey response
rates were. The entire sample group totals in Tables 5-1 and 5-2 are not the same because Table
5-2 shows the complete survey responses that were used in the analysis.
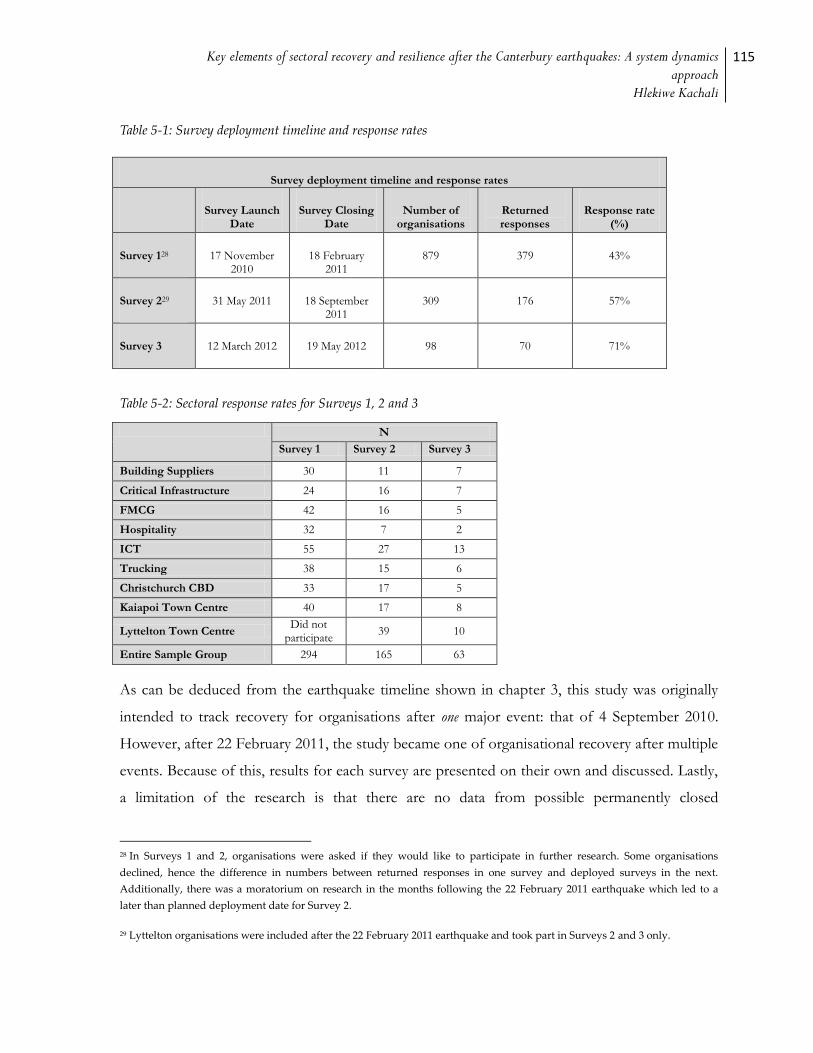
Key elements of sectoral recovery and resilience after the Canterbury earthquakes: A system dynamics approach
Hlekiwe Kachali
115
Table 5-1: Survey deployment timeline and response rates
Survey deployment timeline and response rates
Survey Launch Date
Survey Closing Date
Number of organisations
contacted
Returned responses
Response rate (%)
Survey 128 17 November 2010
18 February 2011
879 379 43%
Survey 229 31 May 2011 18 September 2011
309 176 57%
Survey 3 12 March 2012 19 May 2012 98 70 71%
Table 5-2: Sectoral response rates for Surveys 1, 2 and 3
N
Survey 1 Survey 2 Survey 3
Building Suppliers 30 11 7
Critical Infrastructure 24 16 7
FMCG 42 16 5
Hospitality 32 7 2
ICT 55 27 13
Trucking 38 15 6
Christchurch CBD 33 17 5
Kaiapoi Town Centre 40 17 8
Lyttelton Town Centre Did not
participate 39 10
Entire Sample Group 294 165 63
As can be deduced from the earthquake timeline shown in chapter 3, this study was originally
intended to track recovery for organisations after one major event: that of 4 September 2010.
However, after 22 February 2011, the study became one of organisational recovery after multiple
events. Because of this, results for each survey are presented on their own and discussed. Lastly,
a limitation of the research is that there are no data from possible permanently closed
28 In Surveys 1 and 2, organisations were asked if they would like to participate in further research. Some organisations
declined, hence the difference in numbers between returned responses in one survey and deployed surveys in the next.
Additionally, there was a moratorium on research in the months following the 22 February 2011 earthquake which led to a
later than planned deployment date for Survey 2.
29 Lyttelton organisations were included after the 22 February 2011 earthquake and took part in Surveys 2 and 3 only.
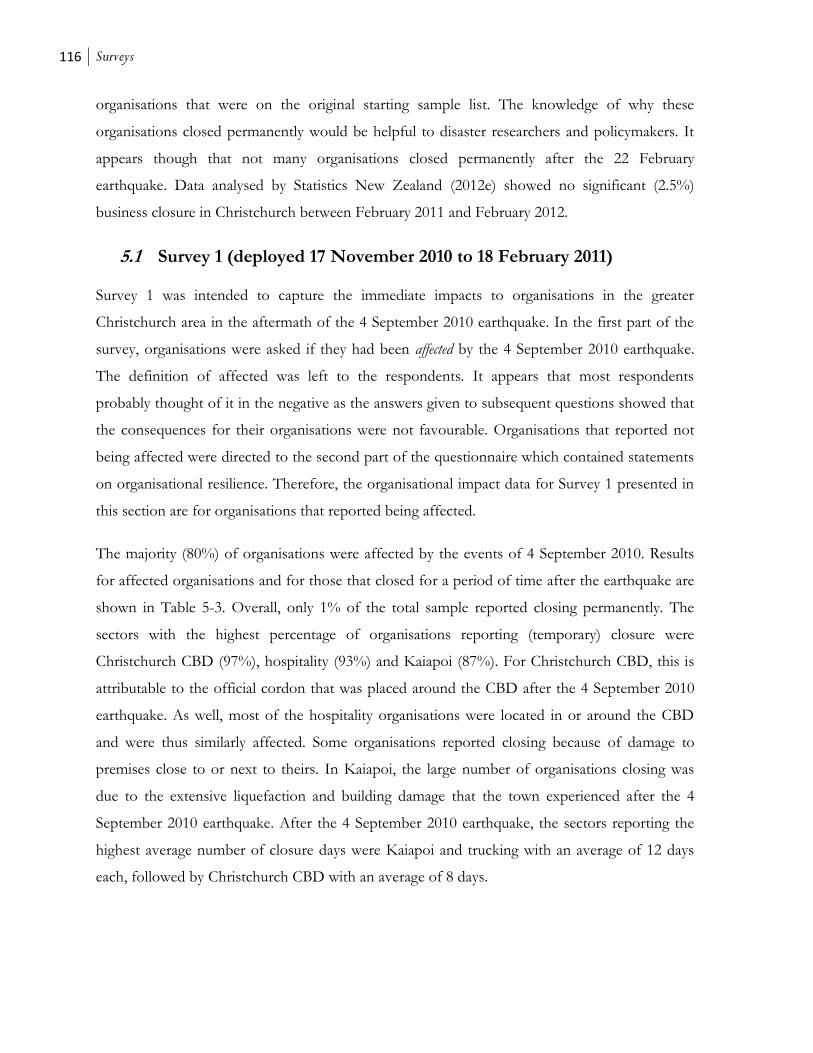
116 Surveys
organisations that were on the original starting sample list. The knowledge of why these
organisations closed permanently would be helpful to disaster researchers and policymakers. It
appears though that not many organisations closed permanently after the 22 February
earthquake. Data analysed by Statistics New Zealand (2012e) showed no significant (2.5%)
business closure in Christchurch between February 2011 and February 2012.
5.1 Survey 1 (deployed 17 November 2010 to 18 February 2011)
Survey 1 was intended to capture the immediate impacts to organisations in the greater
Christchurch area in the aftermath of the 4 September 2010 earthquake. In the first part of the
survey, organisations were asked if they had been affected by the 4 September 2010 earthquake.
The definition of affected was left to the respondents. It appears that most respondents
probably thought of it in the negative as the answers given to subsequent questions showed that
the consequences for their organisations were not favourable. Organisations that reported not
being affected were directed to the second part of the questionnaire which contained statements
on organisational resilience. Therefore, the organisational impact data for Survey 1 presented in
this section are for organisations that reported being affected.
The majority (80%) of organisations were affected by the events of 4 September 2010. Results
for affected organisations and for those that closed for a period of time after the earthquake are
shown in Table 5-3. Overall, only 1% of the total sample reported closing permanently. The
sectors with the highest percentage of organisations reporting (temporary) closure were
Christchurch CBD (97%), hospitality (93%) and Kaiapoi (87%). For Christchurch CBD, this is
attributable to the official cordon that was placed around the CBD after the 4 September 2010
earthquake. As well, most of the hospitality organisations were located in or around the CBD
and were thus similarly affected. Some organisations reported closing because of damage to
premises close to or next to theirs. In Kaiapoi, the large number of organisations closing was
due to the extensive liquefaction and building damage that the town experienced after the 4
September 2010 earthquake. After the 4 September 2010 earthquake, the sectors reporting the
highest average number of closure days were Kaiapoi and trucking with an average of 12 days
each, followed by Christchurch CBD with an average of 8 days.
Key elements of sectoral recovery and resilience after the Canterbury earthquakes: A system dynamics approach
Hlekiwe Kachali
117
Table 5-3: Affected organisations after the 4 September 2010 earthquake including organisations that reported
closure*
Affected organisations after the 4 September 2010 earthquake including organisations that reported closure
Affected Not Affected***
Affected organisations that
temporarily or permanently closed
Affected organisations that
did not close
Building Suppliers** 70% 27% 45% 55%
Critical Infrastructure 92% 8% 41% 59%
FMCG 88% 12% 76% 24%
Hospitality 94% 6% 93% 7%
ICT 56% 44% 57% 43%
Trucking 71% 29% 29% 71%
Christchurch CBD 91% 9% 97% 3%
Kaiapoi Town Centre 90% 10% 87% 13%
Entire Survey 1 Sample 80% 20% 69% 31%
*Owing to rounding, for this and subsequent tables some of the figures might add up to just under or just over 100% ** Not all organisations answered this question; totals may not add up to 100% *** Figures for not affected organisations are included for completion
After a disaster, it has been documented that organisations can experience a change in revenue
for various reasons including supply chain problems, lack of customers or even their goods and
services not being required after disaster (Rose & Lim, 2002). Organisations in this study were
asked to provide information on changes to revenue, suppliers and customers in the aftermath
of the 4 September 2010 earthquake. These results are presented in Tables 5-4 and 5-5.
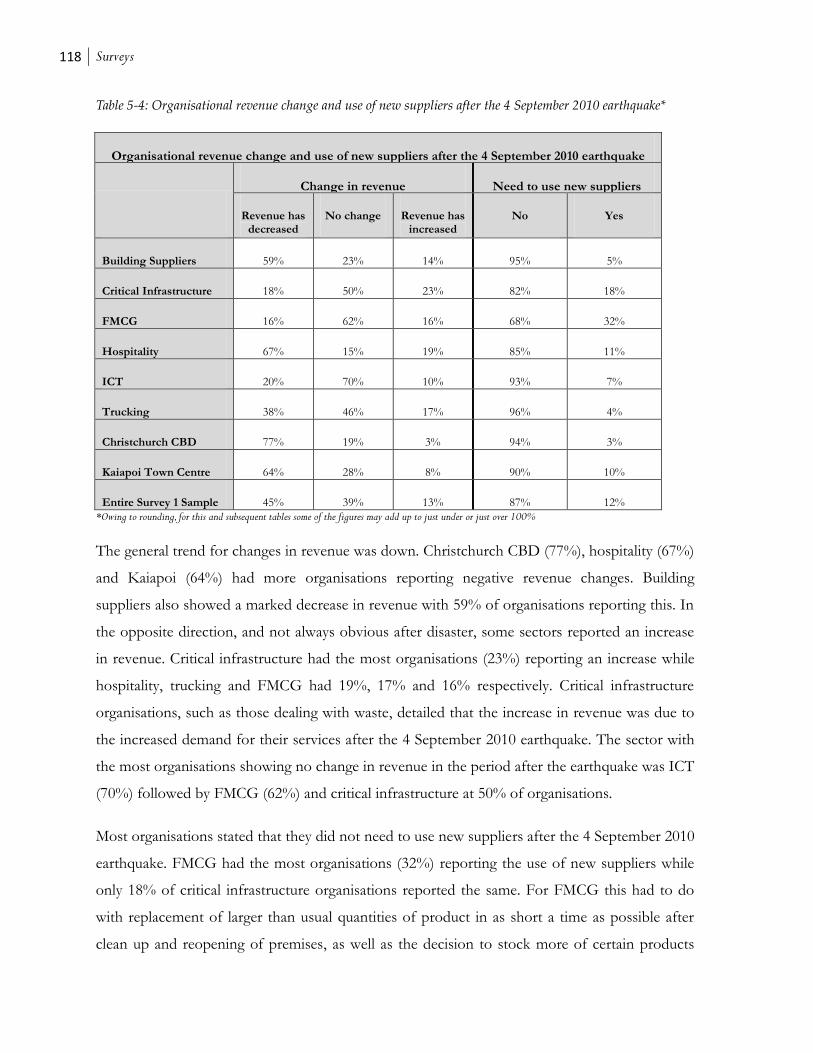
118 Surveys
Table 5-4: Organisational revenue change and use of new suppliers after the 4 September 2010 earthquake*
Organisational revenue change and use of new suppliers after the 4 September 2010 earthquake
Change in revenue Need to use new suppliers
Revenue has decreased
No change Revenue has increased
No Yes
Building Suppliers 59% 23% 14% 95% 5%
Critical Infrastructure 18% 50% 23% 82% 18%
FMCG 16% 62% 16% 68% 32%
Hospitality 67% 15% 19% 85% 11%
ICT 20% 70% 10% 93% 7%
Trucking 38% 46% 17% 96% 4%
Christchurch CBD 77% 19% 3% 94% 3%
Kaiapoi Town Centre 64% 28% 8% 90% 10%
Entire Survey 1 Sample 45% 39% 13% 87% 12%
*Owing to rounding, for this and subsequent tables some of the figures may add up to just under or just over 100%
The general trend for changes in revenue was down. Christchurch CBD (77%), hospitality (67%)
and Kaiapoi (64%) had more organisations reporting negative revenue changes. Building
suppliers also showed a marked decrease in revenue with 59% of organisations reporting this. In
the opposite direction, and not always obvious after disaster, some sectors reported an increase
in revenue. Critical infrastructure had the most organisations (23%) reporting an increase while
hospitality, trucking and FMCG had 19%, 17% and 16% respectively. Critical infrastructure
organisations, such as those dealing with waste, detailed that the increase in revenue was due to
the increased demand for their services after the 4 September 2010 earthquake. The sector with
the most organisations showing no change in revenue in the period after the earthquake was ICT
(70%) followed by FMCG (62%) and critical infrastructure at 50% of organisations.
Most organisations stated that they did not need to use new suppliers after the 4 September 2010
earthquake. FMCG had the most organisations (32%) reporting the use of new suppliers while
only 18% of critical infrastructure organisations reported the same. For FMCG this had to do
with replacement of larger than usual quantities of product in as short a time as possible after
clean up and reopening of premises, as well as the decision to stock more of certain products
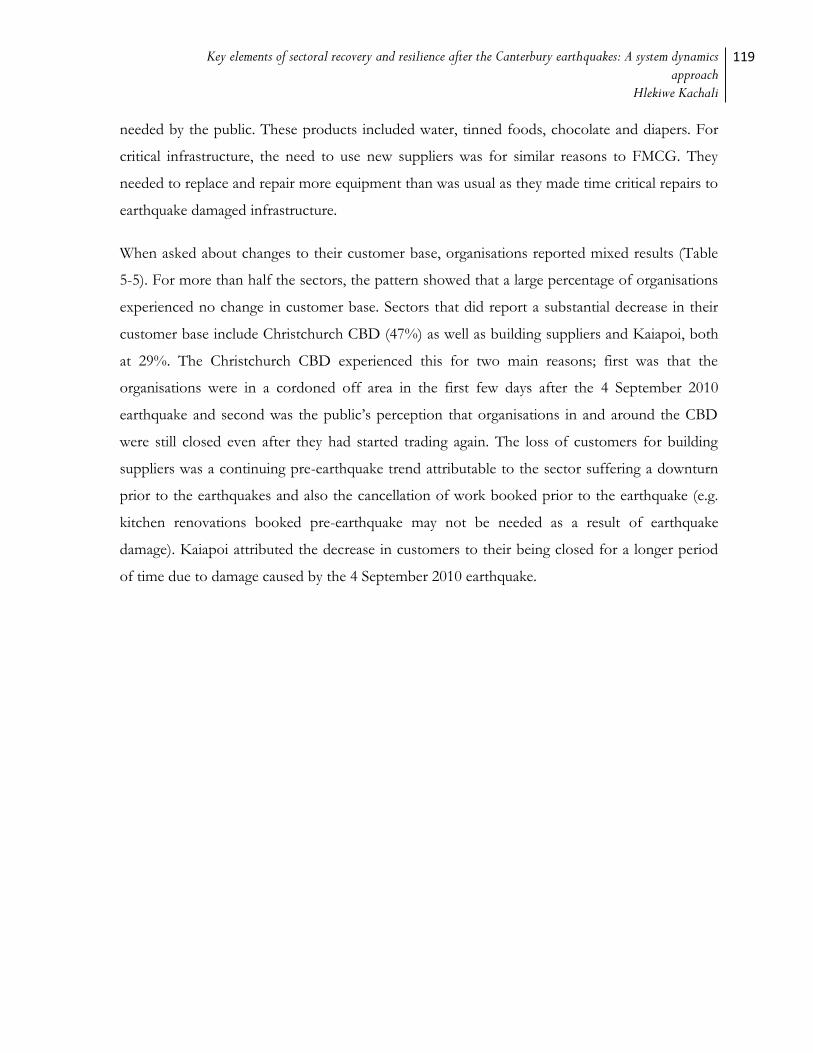
Key elements of sectoral recovery and resilience after the Canterbury earthquakes: A system dynamics approach
Hlekiwe Kachali
119
needed by the public. These products included water, tinned foods, chocolate and diapers. For
critical infrastructure, the need to use new suppliers was for similar reasons to FMCG. They
needed to replace and repair more equipment than was usual as they made time critical repairs to
earthquake damaged infrastructure.
When asked about changes to their customer base, organisations reported mixed results (Table
5-5). For more than half the sectors, the pattern showed that a large percentage of organisations
experienced no change in customer base. Sectors that did report a substantial decrease in their
customer base include Christchurch CBD (47%) as well as building suppliers and Kaiapoi, both
at 29%. The Christchurch CBD experienced this for two main reasons; first was that the
organisations were in a cordoned off area in the first few days after the 4 September 2010
earthquake and second was the public’s perception that organisations in and around the CBD
were still closed even after they had started trading again. The loss of customers for building
suppliers was a continuing pre-earthquake trend attributable to the sector suffering a downturn
prior to the earthquakes and also the cancellation of work booked prior to the earthquake (e.g.
kitchen renovations booked pre-earthquake may not be needed as a result of earthquake
damage). Kaiapoi attributed the decrease in customers to their being closed for a longer period
of time due to damage caused by the 4 September 2010 earthquake.
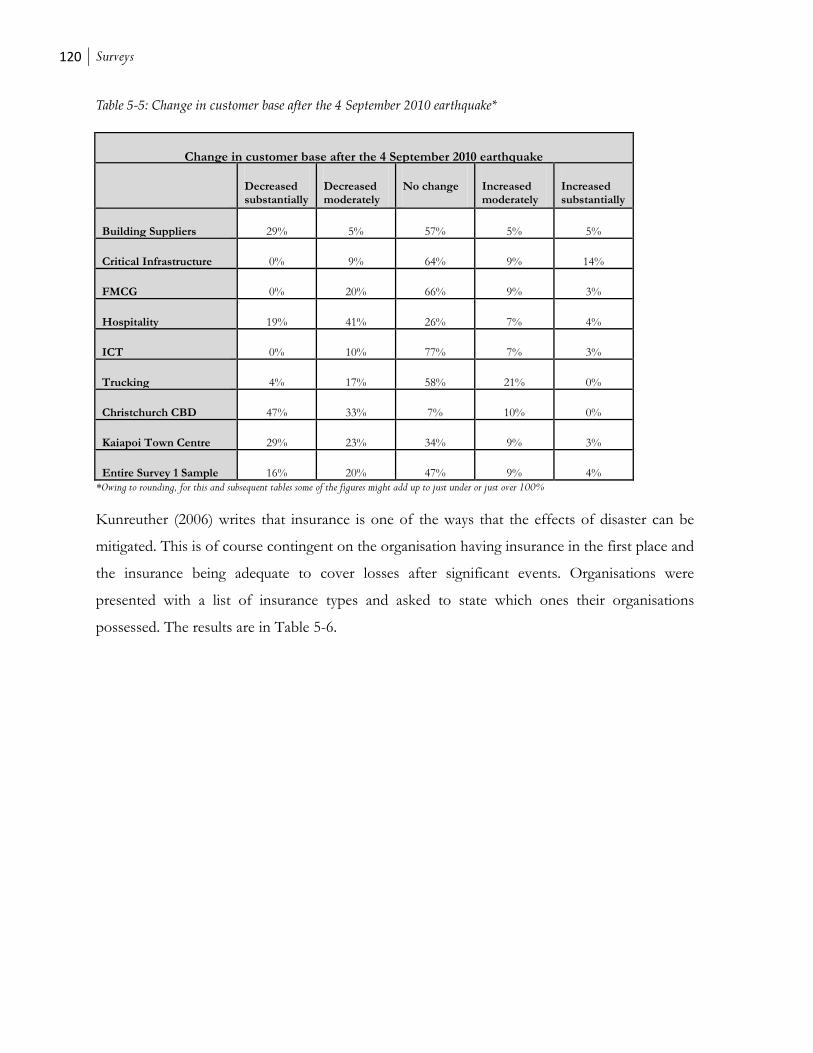
120 Surveys
Table 5-5: Change in customer base after the 4 September 2010 earthquake*
Change in customer base after the 4 September 2010 earthquake
Decreased substantially
Decreased moderately
No change Increased moderately
Increased substantially
Building Suppliers 29% 5% 57% 5% 5%
Critical Infrastructure 0% 9% 64% 9% 14%
FMCG 0% 20% 66% 9% 3%
Hospitality 19% 41% 26% 7% 4%
ICT 0% 10% 77% 7% 3%
Trucking 4% 17% 58% 21% 0%
Christchurch CBD 47% 33% 7% 10% 0%
Kaiapoi Town Centre 29% 23% 34% 9% 3%
Entire Survey 1 Sample 16% 20% 47% 9% 4%
*Owing to rounding, for this and subsequent tables some of the figures might add up to just under or just over 100%
Kunreuther (2006) writes that insurance is one of the ways that the effects of disaster can be
mitigated. This is of course contingent on the organisation having insurance in the first place and
the insurance being adequate to cover losses after significant events. Organisations were
presented with a list of insurance types and asked to state which ones their organisations
possessed. The results are in Table 5-6.
Key elements of sectoral recovery and resilience after the Canterbury earthquakes: A system dynamics approach
Hlekiwe Kachali
121
Table 5-6: Type of insurance*
Type of insurance
C
ash
flo
w,
inco
me
pro
tecti
on
, o
rgan
isati
on
inte
rru
pti
on
Pro
pert
y a
nd
Bu
ild
ing
s
Org
an
isati
on
ass
ets
an
d
eq
uip
men
t
Mo
tor
Veh
icle
s
Pu
bli
c L
iab
ilit
y
Co
mm
od
itie
s an
d G
oo
ds
Oth
er
Building Suppliers 62% 62% 81% 81% 90% 71% 14%
Critical Infrastructure 41% 59% 55% 59% 73% 36% 45%
FMCG 71% 66% 71% 74% 71% 66% 26%
Hospitality 85% 48% 81% 44% 74% 74% 0%
ICT 40% 50% 90% 53% 77% 37% 27%
Trucking 50% 63% 71% 67% 71% 33% 25%
Christchurch CBD 77% 53% 80% 60% 70% 77% 13%
Kaiapoi Town Centre 51% 46% 74% 43% 77% 40% 14%
Entire Survey 1 Sample 60% 55% 76% 59% 75% 54% 20%
*Owing to rounding, for this and subsequent tables some of the figures might add up to just under or just over 100%
Organisation assets and equipment and public liability were the most common types of insurance
across all the sectors. The breakdown for the other types of insurance shows differences
between sectors. For instance building suppliers and FMCG have the highest incidences of motor
vehicle insurance. This is a result of their owning the vehicles that they use, for example to deliver
product in their day-to-day operations. Additionally, a lot of the critical infrastructure providers
(45%) reported having other types of insurance. For those that gave a description, in all cases this
was self-insurance. In a report on liability and insurance for critical infrastructure providers,
Coopers and Lybrand (1997) found that self-insurance was common in this sector partly because
the deductibles with traditional insurance are large.
Related to insurance is the ability of organisations to finance possible increased or unforeseen
costs after a major event and is one of the ways organisations can recover (Alesch & Holly,
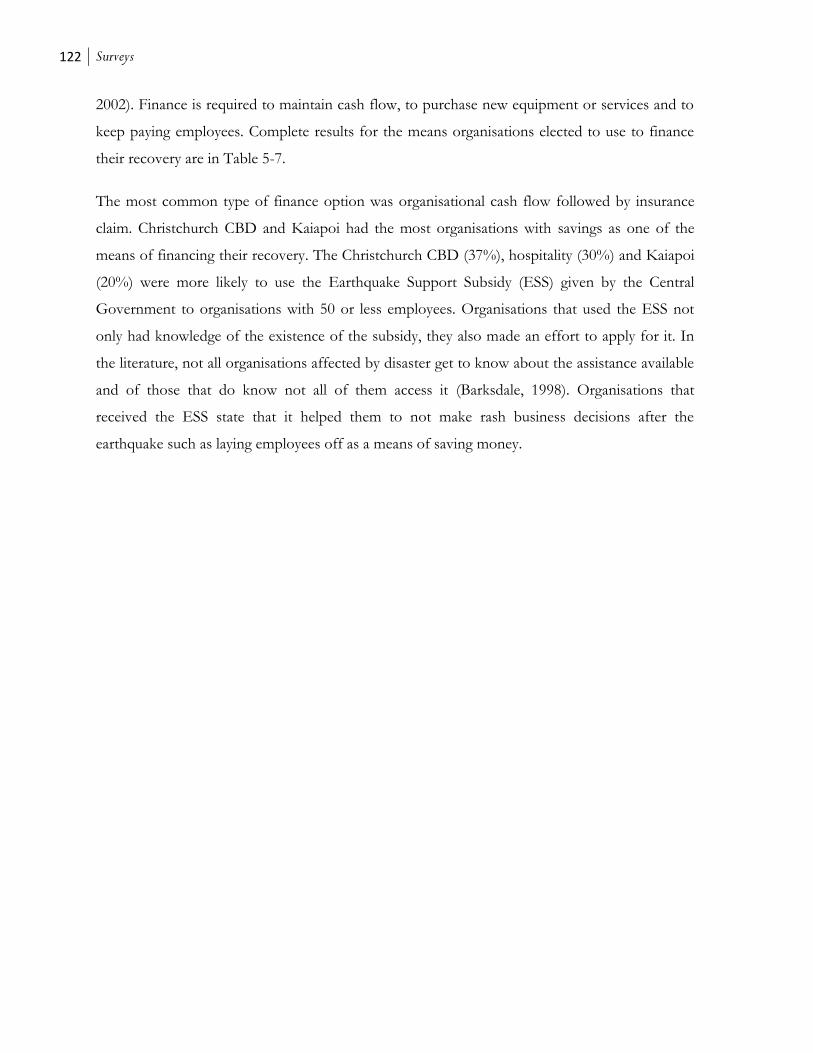
122 Surveys
2002). Finance is required to maintain cash flow, to purchase new equipment or services and to
keep paying employees. Complete results for the means organisations elected to use to finance
their recovery are in Table 5-7.
The most common type of finance option was organisational cash flow followed by insurance
claim. Christchurch CBD and Kaiapoi had the most organisations with savings as one of the
means of financing their recovery. The Christchurch CBD (37%), hospitality (30%) and Kaiapoi
(20%) were more likely to use the Earthquake Support Subsidy (ESS) given by the Central
Government to organisations with 50 or less employees. Organisations that used the ESS not
only had knowledge of the existence of the subsidy, they also made an effort to apply for it. In
the literature, not all organisations affected by disaster get to know about the assistance available
and of those that do know not all of them access it (Barksdale, 1998). Organisations that
received the ESS state that it helped them to not make rash business decisions after the
earthquake such as laying employees off as a means of saving money.
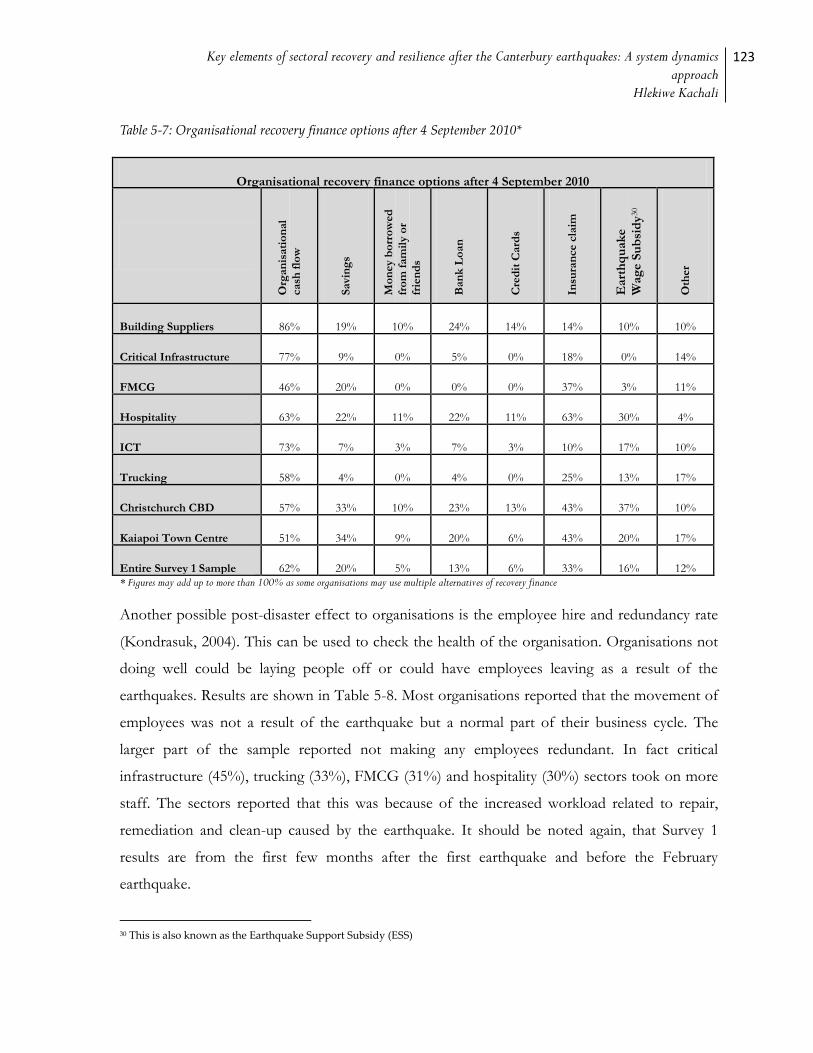
Key elements of sectoral recovery and resilience after the Canterbury earthquakes: A system dynamics approach
Hlekiwe Kachali
123
Table 5-7: Organisational recovery finance options after 4 September 2010*
Organisational recovery finance options after 4 September 2010
Org
an
isati
on
al
cash
flo
w
Savi
ng
s
Mo
ney b
orr
ow
ed
fro
m f
am
ily o
r
frie
nd
s
Ban
k L
oan
Cre
dit
Card
s
Insu
ran
ce c
laim
Eart
hq
uak
e
Wag
e S
ub
sid
y30
Oth
er
Building Suppliers 86% 19% 10% 24% 14% 14% 10% 10%
Critical Infrastructure 77% 9% 0% 5% 0% 18% 0% 14%
FMCG 46% 20% 0% 0% 0% 37% 3% 11%
Hospitality 63% 22% 11% 22% 11% 63% 30% 4%
ICT 73% 7% 3% 7% 3% 10% 17% 10%
Trucking 58% 4% 0% 4% 0% 25% 13% 17%
Christchurch CBD 57% 33% 10% 23% 13% 43% 37% 10%
Kaiapoi Town Centre 51% 34% 9% 20% 6% 43% 20% 17%
Entire Survey 1 Sample 62% 20% 5% 13% 6% 33% 16% 12%
* Figures may add up to more than 100% as some organisations may use multiple alternatives of recovery finance
Another possible post-disaster effect to organisations is the employee hire and redundancy rate
(Kondrasuk, 2004). This can be used to check the health of the organisation. Organisations not
doing well could be laying people off or could have employees leaving as a result of the
earthquakes. Results are shown in Table 5-8. Most organisations reported that the movement of
employees was not a result of the earthquake but a normal part of their business cycle. The
larger part of the sample reported not making any employees redundant. In fact critical
infrastructure (45%), trucking (33%), FMCG (31%) and hospitality (30%) sectors took on more
staff. The sectors reported that this was because of the increased workload related to repair,
remediation and clean-up caused by the earthquake. It should be noted again, that Survey 1
results are from the first few months after the first earthquake and before the February
earthquake.
30 This is also known as the Earthquake Support Subsidy (ESS)
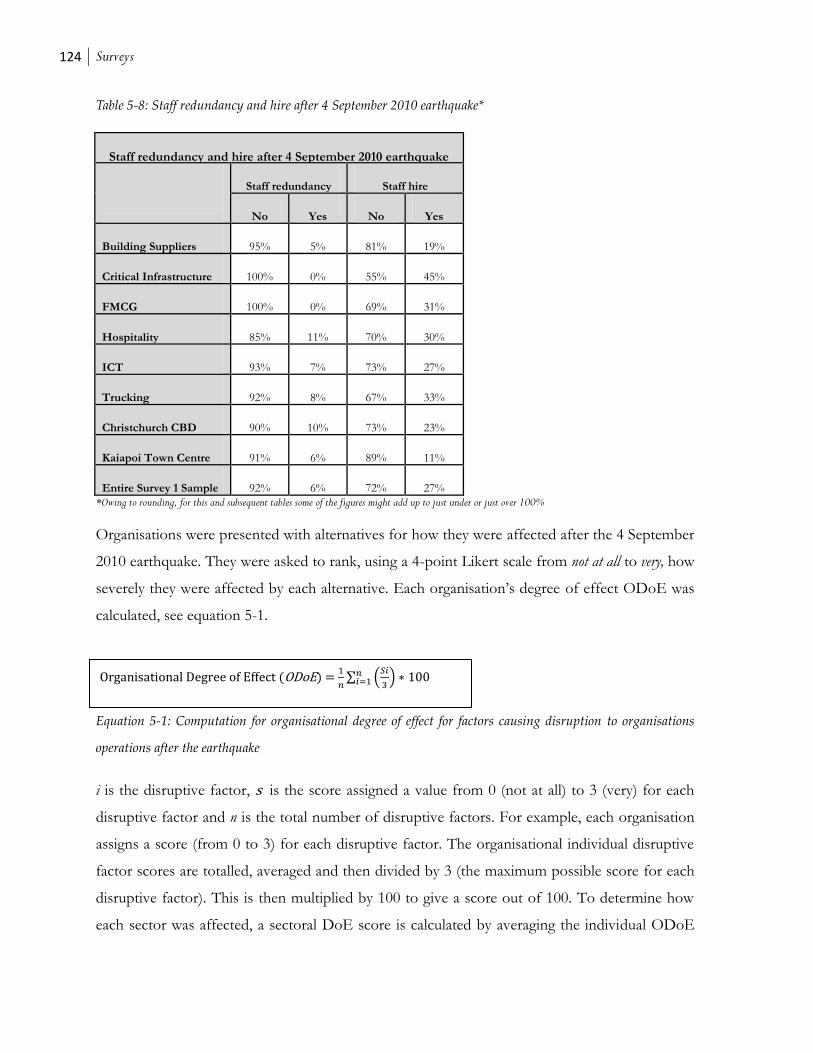
124 Surveys
Table 5-8: Staff redundancy and hire after 4 September 2010 earthquake*
Staff redundancy and hire after 4 September 2010 earthquake
Staff redundancy Staff hire
No Yes No Yes
Building Suppliers 95% 5% 81% 19%
Critical Infrastructure 100% 0% 55% 45%
FMCG 100% 0% 69% 31%
Hospitality 85% 11% 70% 30%
ICT 93% 7% 73% 27%
Trucking 92% 8% 67% 33%
Christchurch CBD 90% 10% 73% 23%
Kaiapoi Town Centre 91% 6% 89% 11%
Entire Survey 1 Sample 92% 6% 72% 27%
*Owing to rounding, for this and subsequent tables some of the figures might add up to just under or just over 100%
Organisations were presented with alternatives for how they were affected after the 4 September
2010 earthquake. They were asked to rank, using a 4-point Likert scale from not at all to very, how
severely they were affected by each alternative. Each organisation’s degree of effect ODoE was
calculated, see equation 5-1.
Equation 5-1: Computation for organisational degree of effect for factors causing disruption to organisations
operations after the earthquake
i is the disruptive factor, s is the score assigned a value from 0 (not at all) to 3 (very) for each
disruptive factor and n is the total number of disruptive factors. For example, each organisation
assigns a score (from 0 to 3) for each disruptive factor. The organisational individual disruptive
factor scores are totalled, averaged and then divided by 3 (the maximum possible score for each
disruptive factor). This is then multiplied by 100 to give a score out of 100. To determine how
each sector was affected, a sectoral DoE score is calculated by averaging the individual ODoE
Organisational Degree of Effect (ODoE) =
∑ (
)
Key elements of sectoral recovery and resilience after the Canterbury earthquakes: A system dynamics approach
Hlekiwe Kachali
125
scores. The higher the score the more severely that sector was affected by the given alternative.
The results from this computation are in Table 5-9. The three highest degrees of effect for each
sector are in bold highlighted cells.
Most of the sectors were not affected by injury to employees. This is because of the timing of
the 4 September 2010 earthquake which occurred in the early hours on a Saturday morning
when not many people were at work. More sectors were affected by the disruption to electricity
than by any other factors. This shows how dependent industry is on the use of electricity to run
their operations (Rose et al., 1997). Across the entire sample, the highest degrees of effect (DoE)
were for electricity disruption (38/100), damage to or closure of nearby buildings (37/100) and
damage to or closure of adjacent organisations or buildings (35/100). An inspection of the
responses shows that both Christchurch CBD and Kaiapoi were heavily affected by damage to
or closure of adjacent organisations or buildings and damage to or closure of nearby buildings.
This exemplifies the neighbourhood effects that organisations in CBDs and town centres face
even as they benefit from having organisations in close proximity whose foot traffic also adds to
their business. Additionally, the Christchurch CBD (DoE 69/100) was affected by their inability
to access their premises. This is again because of the CBD cordon as well as being in close
proximity to buildings that were declared unsafe and fenced off. Kaiapoi on the other hand was
affected by water supply disruption (DoE 75/100) as a result of damage to water and waste
water systems caused by the ground shaking and subsequent liquefaction (Tonkin & Taylor,
2011). FMCG organisations report being affected by non-structural damage and damage to
inventory which was caused by the shaking as well as the collapse of shelving.
For most disasters, a lot of emphasis is placed on physical damage of the organisation’s
premises. The results in Table 5-9 show that there are other contributors to business disruption
after an earthquake or other disaster apart from physical damage. For instance, after the 4
September 2010 earthquake, non-physical damage factors such as electricity supply disruption or
inability to access premises were reported to be more disruptive than physical damage to the
organisation’s premises.
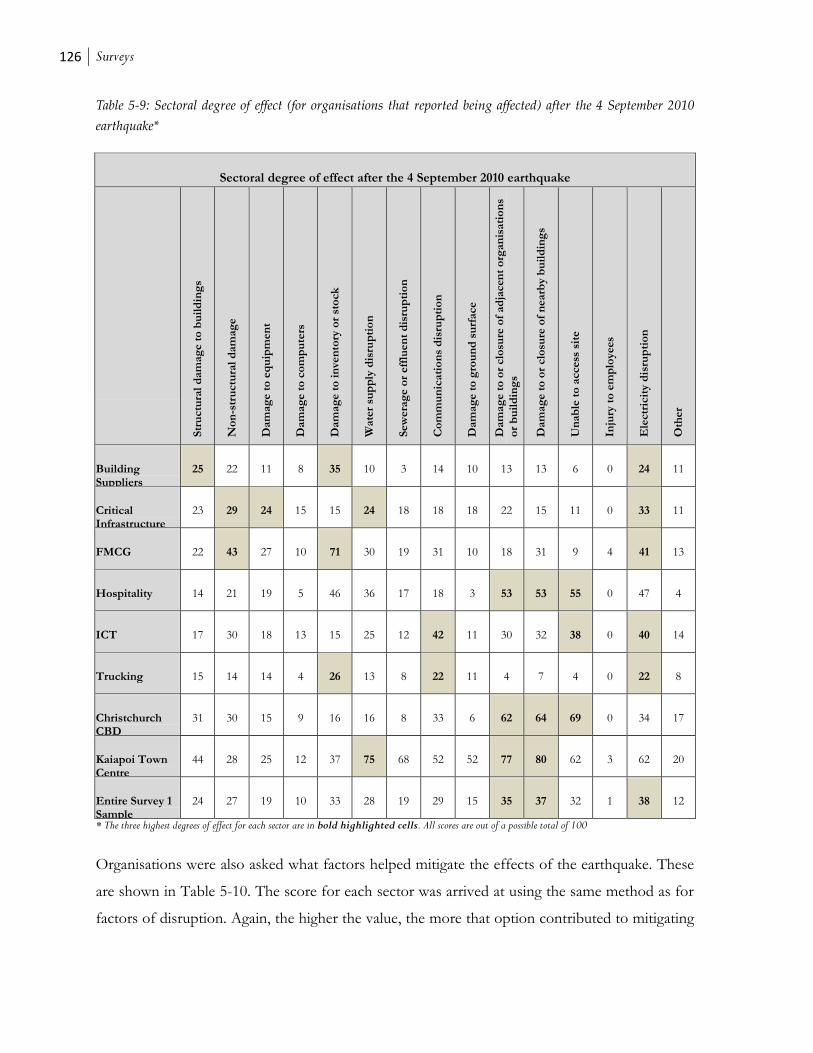
126 Surveys
Table 5-9: Sectoral degree of effect (for organisations that reported being affected) after the 4 September 2010
earthquake*
Sectoral degree of effect after the 4 September 2010 earthquake
Str
uctu
ral
dam
ag
e t
o b
uil
din
gs
No
n-s
tru
ctu
ral
dam
ag
e
Dam
ag
e t
o e
qu
ipm
en
t
Dam
ag
e t
o c
om
pu
ters
Dam
ag
e t
o i
nve
nto
ry o
r st
ock
Wate
r su
pp
ly d
isru
pti
on
Sew
era
ge o
r eff
luen
t d
isru
pti
on
Co
mm
un
icati
on
s d
isru
pti
on
Dam
ag
e t
o g
rou
nd
su
rface
Dam
ag
e t
o o
r clo
sure
of
ad
jacen
t o
rgan
isati
on
s
or
bu
ild
ing
s
Dam
ag
e t
o o
r clo
sure
of
nearb
y b
uil
din
gs
Un
ab
le t
o a
ccess
sit
e
Inju
ry t
o e
mp
loyees
Ele
ctr
icit
y d
isru
pti
on
Oth
er
Building Suppliers
25 22 11 8 35 10 3 14 10 13 13 6 0 24 11
Critical Infrastructure
23 29 24 15 15 24 18 18 18 22 15 11 0 33 11
FMCG 22 43 27 10 71 30 19 31 10 18 31 9 4 41 13
Hospitality 14 21 19 5 46 36 17 18 3 53 53 55 0 47 4
ICT 17 30 18 13 15 25 12 42 11 30 32 38 0 40 14
Trucking 15 14 14 4 26 13 8 22 11 4 7 4 0 22 8
Christchurch CBD
31 30 15 9 16 16 8 33 6 62 64 69 0 34 17
Kaiapoi Town Centre
44 28 25 12 37 75 68 52 52 77 80 62 3 62 20
Entire Survey 1 Sample
24 27 19 10 33 28 19 29 15 35 37 32 1 38 12
* The three highest degrees of effect for each sector are in bold highlighted cells. All scores are out of a possible total of 100
Organisations were also asked what factors helped mitigate the effects of the earthquake. These
are shown in Table 5-10. The score for each sector was arrived at using the same method as for
factors of disruption. Again, the higher the value, the more that option contributed to mitigating
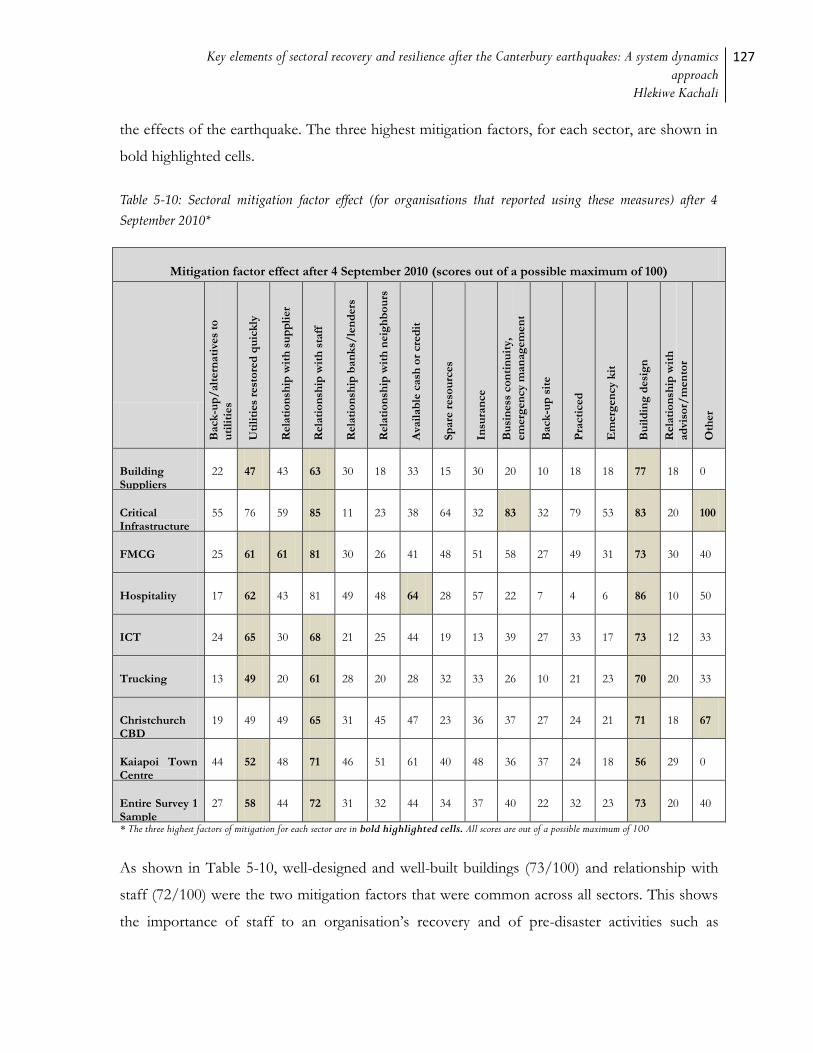
Key elements of sectoral recovery and resilience after the Canterbury earthquakes: A system dynamics approach
Hlekiwe Kachali
127
the effects of the earthquake. The three highest mitigation factors, for each sector, are shown in
bold highlighted cells.
Table 5-10: Sectoral mitigation factor effect (for organisations that reported using these measures) after 4
September 2010*
Mitigation factor effect after 4 September 2010 (scores out of a possible maximum of 100)
Back
-up
/alt
ern
ati
ves
to
uti
liti
es
Uti
liti
es
rest
ore
d q
uic
kly
Rela
tio
nsh
ip w
ith
su
pp
lier
Rela
tio
nsh
ip w
ith
sta
ff
Rela
tio
nsh
ip b
an
ks/
len
ders
Rela
tio
nsh
ip w
ith
neig
hb
ou
rs
Ava
ilab
le c
ash
or
cre
dit
Sp
are
reso
urc
es
Insu
ran
ce
Bu
sin
ess
co
nti
nu
ity,
em
erg
en
cy m
an
ag
em
en
t
Back
-up
sit
e
Pra
cti
ced
Em
erg
en
cy k
it
Bu
ild
ing
desi
gn
Rela
tio
nsh
ip w
ith
ad
viso
r/m
en
tor
Oth
er
Building Suppliers
22 47 43 63 30 18 33 15 30 20 10 18 18 77 18 0
Critical Infrastructure
55 76 59 85 11 23 38 64 32 83 32 79 53 83 20 100
FMCG 25 61 61 81 30 26 41 48 51 58 27 49 31 73 30 40
Hospitality 17 62 43 81 49 48 64 28 57 22 7 4 6 86 10 50
ICT 24 65 30 68 21 25 44 19 13 39 27 33 17 73 12 33
Trucking 13 49 20 61 28 20 28 32 33 26 10 21 23 70 20 33
Christchurch CBD
19 49 49 65 31 45 47 23 36 37 27 24 21 71 18 67
Kaiapoi Town Centre
44 52 48 71 46 51 61 40 48 36 37 24 18 56 29 0
Entire Survey 1 Sample
27 58 44 72 31 32 44 34 37 40 22 32 23 73 20 40
* The three highest factors of mitigation for each sector are in bold highlighted cells. All scores are out of a possible maximum of 100
As shown in Table 5-10, well-designed and well-built buildings (73/100) and relationship with
staff (72/100) were the two mitigation factors that were common across all sectors. This shows
the importance of staff to an organisation’s recovery and of pre-disaster activities such as
128 Surveys
reinforcing buildings. In comparison to the other sectors in the study, organisations from the
critical infrastructure sector found the existence of business continuity or emergency plans and
the practicing of these plans as being helpful in lessening the effects of the earthquake. For
FMCG organisations that carry a lot of stock and rely on timely delivery, relationship with
supplier proved crucial. For ICT and trucking, the non-disruption or quick restoration of
services (e.g. electricity and roads) was of benefit. After the 4 September 2010 earthquake, the
restoration times for electricity was exemplary (Eidinger, Tang, & O'Rourke, 2010). However,
for organisations from the Christchurch CDB and hospitality samples, quick restoration times
may not have featured prominently because by the time organisations were let into their
premises, services had been restored.
5.2 Survey 2 (deployed 31 May 2011 to 18 September 2011)
The original aim of Survey 2 was to gather information on ongoing recovery efforts from
affected organisations and industry sectors after the 4 September 2010 earthquake. Although
Survey 2 was used for this purpose, it was also used to gather information on impacts to
organisations after the 22 February 2011 Christchurch earthquake. This earthquake’s epicentre
was located near the town of Lyttelton and close to the built up area of the Christchurch CBD.
It occurred at 12:51pm on a weekday. Organisations from the port town of Lyttelton were
included in the study at this point as the town centre was badly damaged by the earthquake.
Consequently, some of the questions in Survey 2 asked for information on both the 4 September
2010 and 22 February 2011 events.
The results for how the different sectors were affected after the 22 February 2011 earthquake are
presented in Table 5-11. It is clear that the nature and location of the 22 February 2011
earthquake, close to a built up area and at shallow depth, resulted in more severe impacts to
organisations than the 4 September 2010 earthquake. Almost all organisations taking part in
Survey 2 reported being affected by the 22 February 2011 earthquake.
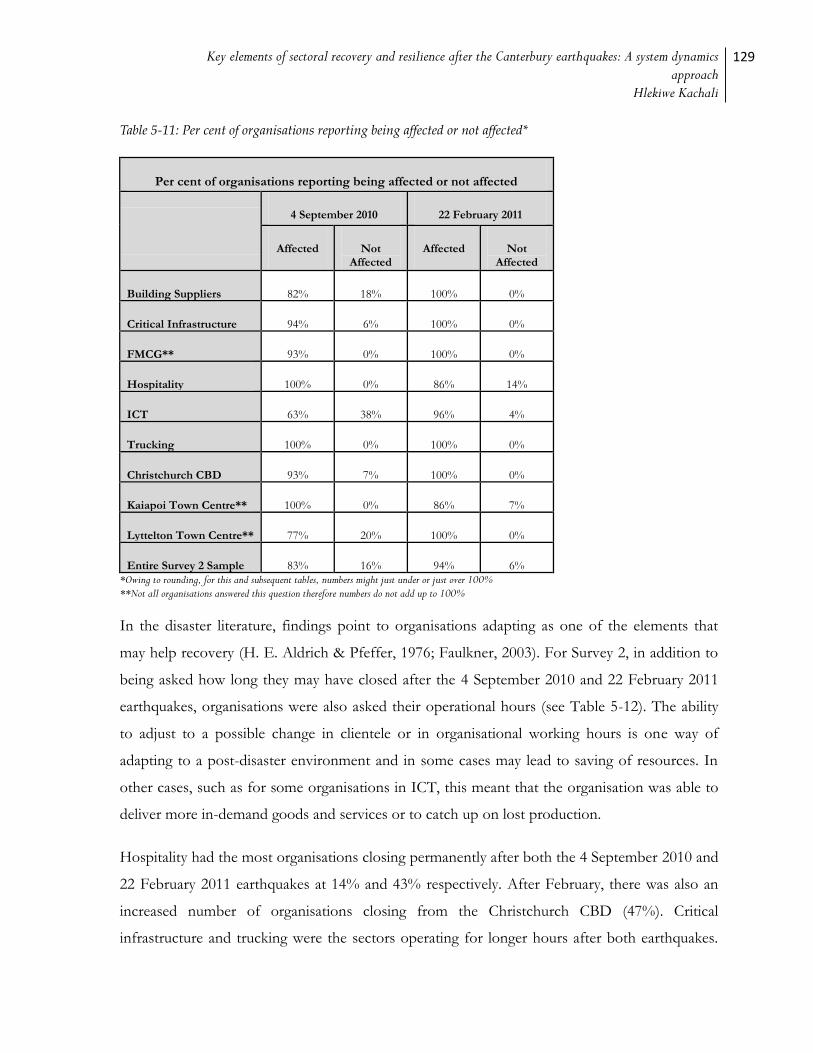
Key elements of sectoral recovery and resilience after the Canterbury earthquakes: A system dynamics approach
Hlekiwe Kachali
129
Table 5-11: Per cent of organisations reporting being affected or not affected*
Per cent of organisations reporting being affected or not affected
4 September 2010 22 February 2011
Affected Not Affected
Affected Not Affected
Building Suppliers 82% 18% 100% 0%
Critical Infrastructure 94% 6% 100% 0%
FMCG** 93% 0% 100% 0%
Hospitality 100% 0% 86% 14%
ICT 63% 38% 96% 4%
Trucking 100% 0% 100% 0%
Christchurch CBD 93% 7% 100% 0%
Kaiapoi Town Centre** 100% 0% 86% 7%
Lyttelton Town Centre** 77% 20% 100% 0%
Entire Survey 2 Sample 83% 16% 94% 6%
*Owing to rounding, for this and subsequent tables, numbers might just under or just over 100% **Not all organisations answered this question therefore numbers do not add up to 100%
In the disaster literature, findings point to organisations adapting as one of the elements that
may help recovery (H. E. Aldrich & Pfeffer, 1976; Faulkner, 2003). For Survey 2, in addition to
being asked how long they may have closed after the 4 September 2010 and 22 February 2011
earthquakes, organisations were also asked their operational hours (see Table 5-12). The ability
to adjust to a possible change in clientele or in organisational working hours is one way of
adapting to a post-disaster environment and in some cases may lead to saving of resources. In
other cases, such as for some organisations in ICT, this meant that the organisation was able to
deliver more in-demand goods and services or to catch up on lost production.
Hospitality had the most organisations closing permanently after both the 4 September 2010 and
22 February 2011 earthquakes at 14% and 43% respectively. After February, there was also an
increased number of organisations closing from the Christchurch CBD (47%). Critical
infrastructure and trucking were the sectors operating for longer hours after both earthquakes.
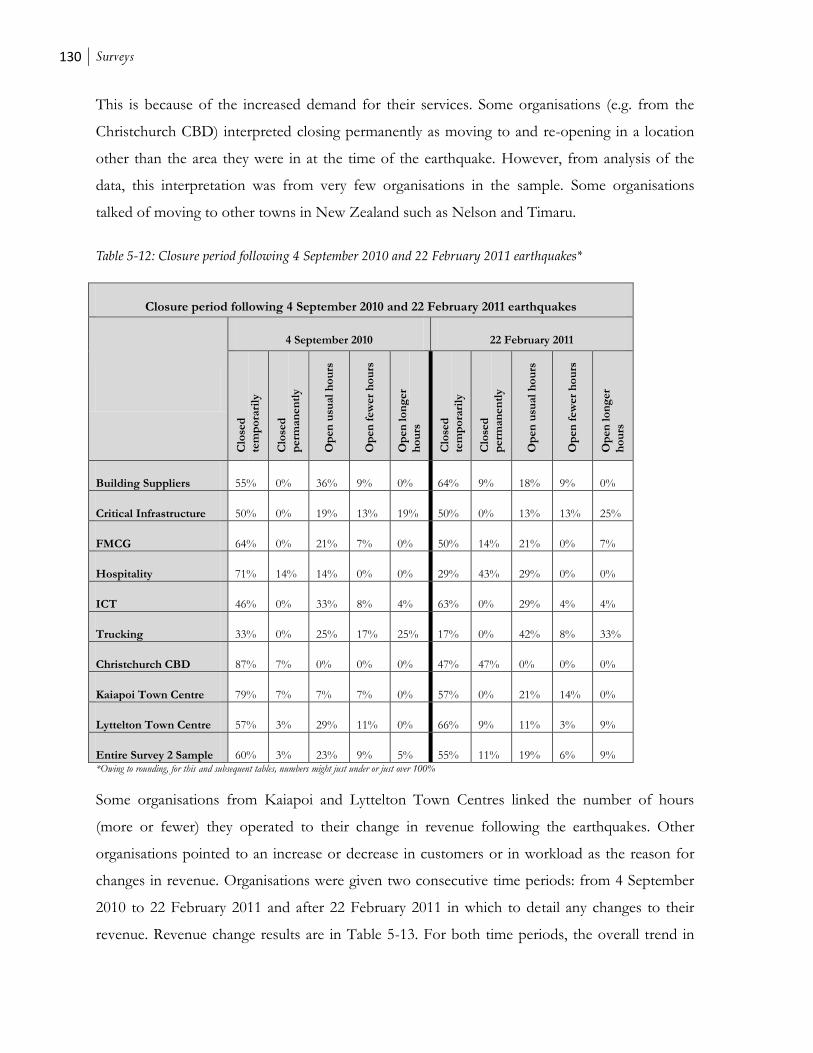
130 Surveys
This is because of the increased demand for their services. Some organisations (e.g. from the
Christchurch CBD) interpreted closing permanently as moving to and re-opening in a location
other than the area they were in at the time of the earthquake. However, from analysis of the
data, this interpretation was from very few organisations in the sample. Some organisations
talked of moving to other towns in New Zealand such as Nelson and Timaru.
Table 5-12: Closure period following 4 September 2010 and 22 February 2011 earthquakes*
Closure period following 4 September 2010 and 22 February 2011 earthquakes
4 September 2010 22 February 2011
Clo
sed
tem
po
rari
ly
Clo
sed
perm
an
en
tly
Op
en
usu
al
ho
urs
Op
en
few
er
ho
urs
Op
en
lo
ng
er
ho
urs
Clo
sed
tem
po
rari
ly
Clo
sed
perm
an
en
tly
Op
en
usu
al
ho
urs
Op
en
few
er
ho
urs
Op
en
lo
ng
er
ho
urs
Building Suppliers 55% 0% 36% 9% 0% 64% 9% 18% 9% 0%
Critical Infrastructure 50% 0% 19% 13% 19% 50% 0% 13% 13% 25%
FMCG 64% 0% 21% 7% 0% 50% 14% 21% 0% 7%
Hospitality 71% 14% 14% 0% 0% 29% 43% 29% 0% 0%
ICT 46% 0% 33% 8% 4% 63% 0% 29% 4% 4%
Trucking 33% 0% 25% 17% 25% 17% 0% 42% 8% 33%
Christchurch CBD 87% 7% 0% 0% 0% 47% 47% 0% 0% 0%
Kaiapoi Town Centre 79% 7% 7% 7% 0% 57% 0% 21% 14% 0%
Lyttelton Town Centre 57% 3% 29% 11% 0% 66% 9% 11% 3% 9%
Entire Survey 2 Sample 60% 3% 23% 9% 5% 55% 11% 19% 6% 9% *Owing to rounding, for this and subsequent tables, numbers might just under or just over 100%
Some organisations from Kaiapoi and Lyttelton Town Centres linked the number of hours
(more or fewer) they operated to their change in revenue following the earthquakes. Other
organisations pointed to an increase or decrease in customers or in workload as the reason for
changes in revenue. Organisations were given two consecutive time periods: from 4 September
2010 to 22 February 2011 and after 22 February 2011 in which to detail any changes to their
revenue. Revenue change results are in Table 5-13. For both time periods, the overall trend in
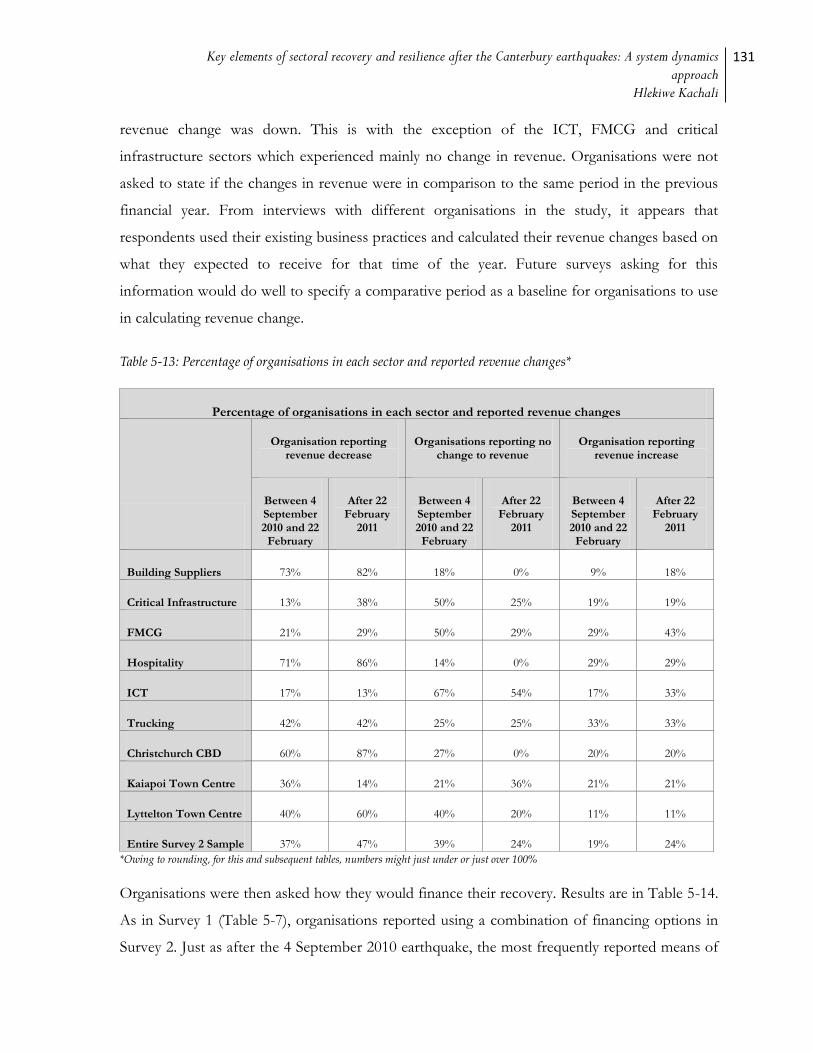
Key elements of sectoral recovery and resilience after the Canterbury earthquakes: A system dynamics approach
Hlekiwe Kachali
131
revenue change was down. This is with the exception of the ICT, FMCG and critical
infrastructure sectors which experienced mainly no change in revenue. Organisations were not
asked to state if the changes in revenue were in comparison to the same period in the previous
financial year. From interviews with different organisations in the study, it appears that
respondents used their existing business practices and calculated their revenue changes based on
what they expected to receive for that time of the year. Future surveys asking for this
information would do well to specify a comparative period as a baseline for organisations to use
in calculating revenue change.
Table 5-13: Percentage of organisations in each sector and reported revenue changes*
Percentage of organisations in each sector and reported revenue changes
Organisation reporting revenue decrease
Organisations reporting no change to revenue
Organisation reporting revenue increase
Between 4 September 2010 and 22
February 2011
After 22 February
2011
Between 4 September 2010 and 22 February
2011
After 22 February
2011
Between 4 September 2010 and 22 February
2011
After 22 February
2011
Building Suppliers 73% 82% 18% 0% 9% 18%
Critical Infrastructure 13% 38% 50% 25% 19% 19%
FMCG 21% 29% 50% 29% 29% 43%
Hospitality 71% 86% 14% 0% 29% 29%
ICT 17% 13% 67% 54% 17% 33%
Trucking 42% 42% 25% 25% 33% 33%
Christchurch CBD 60% 87% 27% 0% 20% 20%
Kaiapoi Town Centre 36% 14% 21% 36% 21% 21%
Lyttelton Town Centre 40% 60% 40% 20% 11% 11%
Entire Survey 2 Sample 37% 47% 39% 24% 19% 24%
*Owing to rounding, for this and subsequent tables, numbers might just under or just over 100%
Organisations were then asked how they would finance their recovery. Results are in Table 5-14.
As in Survey 1 (Table 5-7), organisations reported using a combination of financing options in
Survey 2. Just as after the 4 September 2010 earthquake, the most frequently reported means of
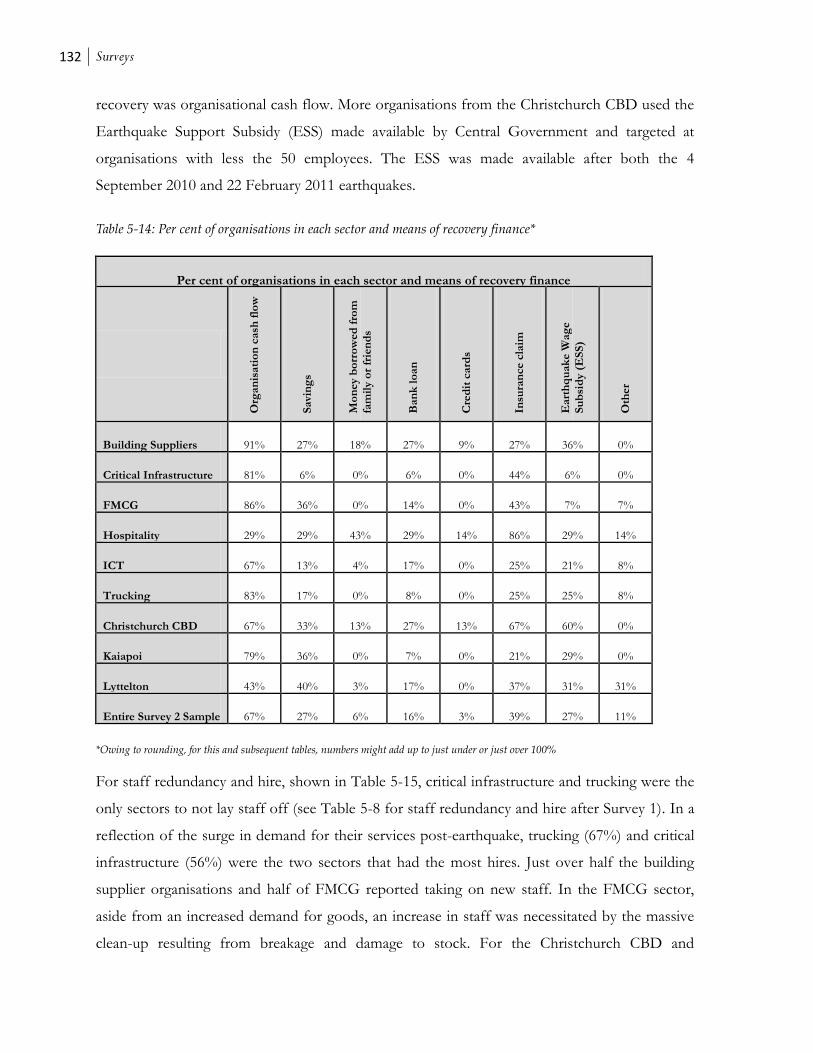
132 Surveys
recovery was organisational cash flow. More organisations from the Christchurch CBD used the
Earthquake Support Subsidy (ESS) made available by Central Government and targeted at
organisations with less the 50 employees. The ESS was made available after both the 4
September 2010 and 22 February 2011 earthquakes.
Table 5-14: Per cent of organisations in each sector and means of recovery finance*
Per cent of organisations in each sector and means of recovery finance
Org
an
isati
on
cash
flo
w
Savi
ng
s
Mo
ney b
orr
ow
ed
fro
m
fam
ily o
r fr
ien
ds
Ban
k l
oan
Cre
dit
card
s
Insu
ran
ce c
laim
Eart
hq
uak
e W
ag
e
Su
bsi
dy (
ES
S)
Oth
er
Building Suppliers 91% 27% 18% 27% 9% 27% 36% 0%
Critical Infrastructure 81% 6% 0% 6% 0% 44% 6% 0%
FMCG 86% 36% 0% 14% 0% 43% 7% 7%
Hospitality 29% 29% 43% 29% 14% 86% 29% 14%
ICT 67% 13% 4% 17% 0% 25% 21% 8%
Trucking 83% 17% 0% 8% 0% 25% 25% 8%
Christchurch CBD 67% 33% 13% 27% 13% 67% 60% 0%
Kaiapoi 79% 36% 0% 7% 0% 21% 29% 0%
Lyttelton 43% 40% 3% 17% 0% 37% 31% 31%
Entire Survey 2 Sample 67% 27% 6% 16% 3% 39% 27% 11%
*Owing to rounding, for this and subsequent tables, numbers might add up to just under or just over 100%
For staff redundancy and hire, shown in Table 5-15, critical infrastructure and trucking were the
only sectors to not lay staff off (see Table 5-8 for staff redundancy and hire after Survey 1). In a
reflection of the surge in demand for their services post-earthquake, trucking (67%) and critical
infrastructure (56%) were the two sectors that had the most hires. Just over half the building
supplier organisations and half of FMCG reported taking on new staff. In the FMCG sector,
aside from an increased demand for goods, an increase in staff was necessitated by the massive
clean-up resulting from breakage and damage to stock. For the Christchurch CBD and

Key elements of sectoral recovery and resilience after the Canterbury earthquakes: A system dynamics approach
Hlekiwe Kachali
133
hospitality sectors, certain organisations reported that some of their employees were let go in
order to look for jobs elsewhere due to the extended closure period and the uncertainty around
re-opening.
Table 5-15: Staff redundancy and hire after 22 February 2011*
*Owing to rounding, for this and subsequent tables, numbers might add up to just under or just over 100%
Organisations were asked the major reasons for the closure of the organisation (Table 5-16). The
three most cited reasons for closure, per sector, are in bold highlighted cells. More organisations
outlined the need to clear up damage to the interior as the major reason for closure. All of the
organisations in the Christchurch CBD and most (71%) of the hospitality organisations reported
building located within cordoned-off area31 as one of the reasons for closure. For the critical
infrastructure sector, there was no one main reason for closure. This might be an artefact of the
organisations having assets and infrastructure across town and being able to work from many
31 The Christchurch CBD was cordoned off for an extended period after the 22 February 2011 earthquake in some cases for as
long as a year. More detail about the progressive access can be found at www.cera.govt.nz.
Staff redundancy and hire after 22 February 2011
Staff redundancy Staff hire
No Yes No Yes
Building Suppliers 82% 18% 45% 55%
Critical Infrastructure 100% 0% 44% 56%
FMCG 93% 7% 43% 50%
Hospitality 43% 57% 86% 14%
ICT 88% 8% 63% 33%
Trucking 100% 0% 33% 67%
Christchurch CBD 47% 47% 73% 20%
Kaiapoi 79% 14% 71% 21%
Lyttelton 71% 26% 66% 29%
Entire Survey 2 Sample 81% 19% 61% 39%
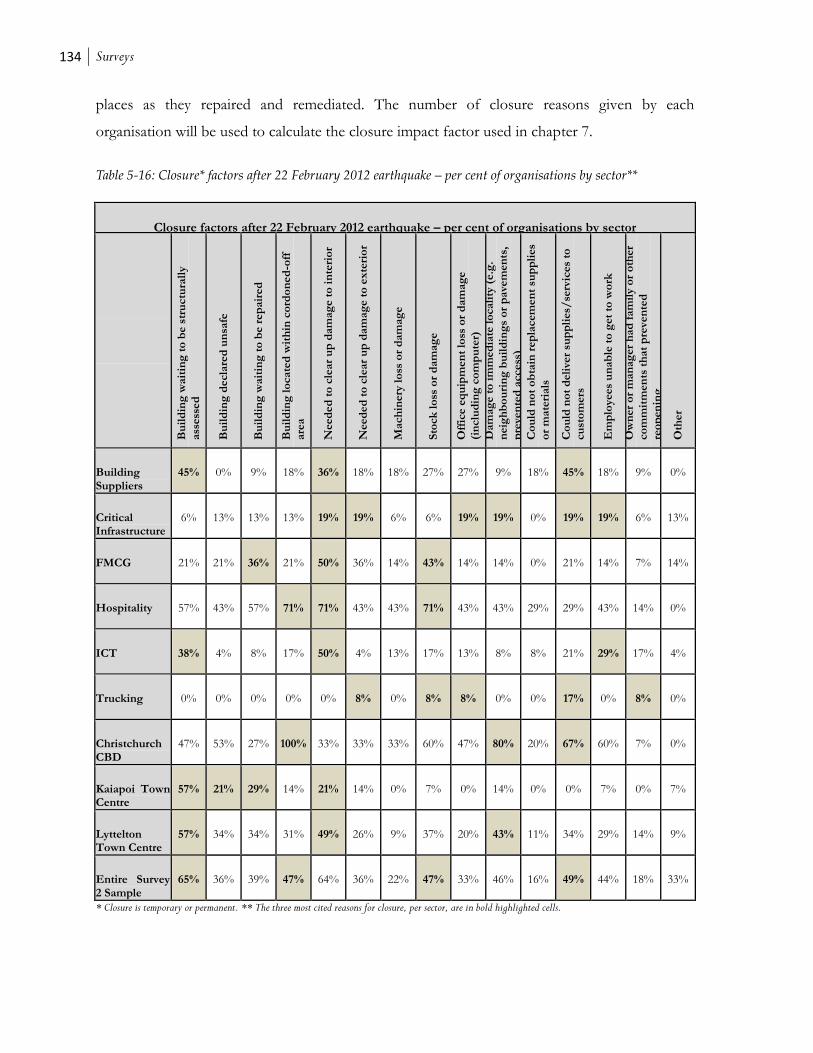
134 Surveys
places as they repaired and remediated. The number of closure reasons given by each
organisation will be used to calculate the closure impact factor used in chapter 7.
Table 5-16: Closure* factors after 22 February 2012 earthquake – per cent of organisations by sector**
Closure factors after 22 February 2012 earthquake – per cent of organisations by sector
Bu
ild
ing
wait
ing
to
be s
tru
ctu
rall
y
ass
ess
ed
Bu
ild
ing
decla
red
un
safe
Bu
ild
ing
wait
ing
to
be r
ep
air
ed
Bu
ild
ing
lo
cate
d w
ith
in c
ord
on
ed
-off
are
a
Need
ed
to
cle
ar
up
dam
ag
e t
o i
nte
rio
r
Need
ed
to
cle
ar
up
dam
ag
e t
o e
xte
rio
r
Mach
inery
lo
ss o
r d
am
ag
e
Sto
ck
lo
ss o
r d
am
ag
e
Off
ice e
qu
ipm
en
t lo
ss o
r d
am
ag
e
(in
clu
din
g c
om
pu
ter)
Dam
ag
e t
o i
mm
ed
iate
lo
cali
ty (
e.g
.
neig
hb
ou
rin
g b
uil
din
gs
or
pave
men
ts,
pre
ven
ted
access
)
Co
uld
no
t o
bta
in r
ep
lacem
en
t su
pp
lies
or
mate
rials
Co
uld
no
t d
eli
ver
sup
pli
es/
serv
ices
to
cu
sto
mers
Em
plo
yees
un
ab
le t
o g
et
to w
ork
Ow
ner
or
man
ag
er
had
fam
ily o
r o
ther
co
mm
itm
en
ts t
hat
pre
ven
ted
reo
pen
ing
Oth
er
Building Suppliers
45% 0% 9% 18% 36% 18% 18% 27% 27% 9% 18% 45% 18% 9% 0%
Critical Infrastructure
6% 13% 13% 13% 19% 19% 6% 6% 19% 19% 0% 19% 19% 6% 13%
FMCG 21% 21% 36% 21% 50% 36% 14% 43% 14% 14% 0% 21% 14% 7% 14%
Hospitality 57% 43% 57% 71% 71% 43% 43% 71% 43% 43% 29% 29% 43% 14% 0%
ICT 38% 4% 8% 17% 50% 4% 13% 17% 13% 8% 8% 21% 29% 17% 4%
Trucking 0% 0% 0% 0% 0% 8% 0% 8% 8% 0% 0% 17% 0% 8% 0%
Christchurch CBD
47% 53% 27% 100% 33% 33% 33% 60% 47% 80% 20% 67% 60% 7% 0%
Kaiapoi Town Centre
57% 21% 29% 14% 21% 14% 0% 7% 0% 14% 0% 0% 7% 0% 7%
Lyttelton Town Centre
57% 34% 34% 31% 49% 26% 9% 37% 20% 43% 11% 34% 29% 14% 9%
Entire Survey 2 Sample
65% 36% 39% 47% 64% 36% 22% 47% 33% 46% 16% 49% 44% 18% 33%
* Closure is temporary or permanent. ** The three most cited reasons for closure, per sector, are in bold highlighted cells.
Key elements of sectoral recovery and resilience after the Canterbury earthquakes: A system dynamics approach
Hlekiwe Kachali
135
For Survey 2, organisations were asked about organisational disruption specifically caused by
utilities and non-utilities. In both cases, organisations were presented with a list of possible
disruptions and asked to state (yes or no) whether they were affected by disruption to this.
Organisations that were affected were then asked to rank from 0 (not at all) to 3 (very) how
disrupted they were to ascertain the degree to which they were affected. Results are in Tables 5-
17 to 5-19.
For each sector, the three most cited disruptive factors are in bold highlighted cells. For non-
utility disruption, the most commonly experienced form of disruption, except for Christchurch
and Lyttelton, was change in staff emotional wellbeing (see Table 5-17). In the case of
Christchurch CBD, this is likely because a lot of these organisations were closed for a period of
time and survey respondents were not witness to the changes in emotional wellbeing of their
colleagues at the time the survey was deployed. For Lyttelton, the town has a very strong sense
of community and they reported that this led to people banding together and sharing the burden
that was the earthquake. All the organisations from the Christchurch CBD were disrupted by
damage to inventory or stock, damage to or closure of nearby buildings or organisations and also
our organisation was located within a cordoned-off area. This again brings forward the issue of
neighbour effects in CBDs and town centres as all the geographic locales as well as hospitality
were affected by damage to or closure of nearby buildings or organisations. Lyttelton
organisations were further affected by damage to or closure of nearby buildings or organisations
and by non-structural damage (fittings damaged e.g. windows or light fixtures). More
organisations from the FMCG (93%), trucking (83%) and building suppliers (82%) sectors
reported customer issues as one of the most disruptive factors.

136 Surveys
Table 5-17: Per cent of organisations, by sector, reporting disruption from non-utilities*
Per cent of organisations reporting disruption from non-utilities
Str
uctu
ral
dam
ag
e t
o b
uil
din
g(s
) (i
nte
gri
ty o
f
bu
ild
ing
co
mp
rom
ised
)
No
n-s
tru
ctu
ral
dam
ag
e (
fitt
ing
s d
am
ag
ed
e.g
.
win
do
ws
or
lig
ht
fix
ture
s)
Dam
ag
e t
o e
qu
ipm
en
t (n
on
-co
mp
uti
ng
)
Dam
ag
e t
o c
om
pu
ters
Dam
ag
e t
o i
nve
nto
ry o
r st
ock
Dam
ag
e t
o g
rou
nd
su
rface
Dam
ag
e t
o o
r clo
sure
of
ad
jacen
t (n
ex
t d
oo
r)
org
an
isati
on
s o
r b
uil
din
gs
Dam
ag
e t
o o
r clo
sure
of
nearb
y b
uil
din
gs
or
org
an
isati
on
s
Ou
r o
rgan
isati
on
was
locate
d w
ith
in
co
rdo
ned
-off
are
a
Ph
ysi
cal
harm
to
em
plo
yees
Su
pp
lier
issu
es
Cu
sto
mer
issu
es
Sta
ff
tem
po
rari
ly r
elo
cate
d
Sta
ff p
erm
an
en
tly r
elo
cate
d
Sta
ff d
id n
ot
feel
safe
retu
rnin
g t
o b
uil
din
g
Ch
an
ges
in s
taff
em
oti
on
al
well
bein
g
Oth
er
Building Suppliers
45%
73%
45%
9% 64%
55%
45%
27%
27%
9% 64%
82%
36%
0% 64%
82%
9%
Critical Infrastructure
56%
75%
63%
50%
38%
75%
38%
44%
38%
13%
75%
75%
56%
25%
56%
94%
13%
FMCG 64%
71%
57%
21%
79%
64%
21%
36%
21%
7% 57%
93%
36%
14%
57%
100%
0%
Hospitality 71%
57%
57%
43%
71%
43%
57%
57%
71%
14%
43%
43%
43%
43%
43%
57%
14%
ICT 29%
63%
54%
33%
38%
25%
33%
38%
25%
8% 42%
54%
33%
21%
29%
67%
8%
Trucking 33%
33%
25%
0% 25%
42%
33%
17%
0% 0% 33%
83%
17%
0% 0% 92%
8%
Christchurch CBD
93%
73%
60%
20%
100%
40%
93%
100%
100%
0% 67%
73%
47%
53%
60%
60%
0%
Kaiapoi 43%
43%
7% 14%
50%
36%
29%
57%
29%
0% 57%
57%
36%
7% 29%
64%
0%
Lyttelton 69%
71%
37%
26%
57%
46%
60%
77%
31%
3% 40%
63%
37%
29%
40%
66%
11%
Entire Survey 2 Sample
57%
66%
46%
26%
57%
48%
48%
55%
36%
6% 52%
72%
39%
23%
44%
79%
21%
* The three most cited disruptive factors are in bold highlighted cells
While Table 5-17 contains information on the percentage of organisations from each sector
citing which factors affected their operations, Table 5-18 shows to what extent the affected
organisations from each sector were affected by disruption to non-utilities (the computation is
the same as that used in section 5.1). Again, the three highest degrees of effect, for each sector,
are in bold highlighted cells. For instance, from Table 5-17, overall more organisations reported
staff wellbeing as being a disruptive factor. However, in considering the extent to which this
factor was disruptive, only the trucking sector found changes in staff emotional wellbeing to be
very disruptive. The trucking sector also shows the lowest scores altogether for the degree to
Key elements of sectoral recovery and resilience after the Canterbury earthquakes: A system dynamics approach
Hlekiwe Kachali
137
which they were affected by different factors. Across the entire sample group, the factor whose
disruption affected organisations the most was the organisation being located in a cordoned off
area. This is prominent for the geographic sectors as they all had a lot of unreinforced masonry
buildings that were damaged and demolished after 22 February 2011 earthquake. The hospitality
organisations that were affected by being in a cordoned off area found this to be very disruptive.
Only 38% of critical infrastructure organisations reported being affected by their organisation
being in a cordoned off area (see Table 5-17). However, these affected critical infrastructure
organisations found this to be very disruptive (see Table 5-18). These are organisations that had
major infrastructure in Christchurch CBD and faced some difficulties even accessing their assets
for repair.

138 Surveys
Table 5-18: Degree of effect to sector (for organisations that reported being disrupted) after disruption of non-
utilities*
Degree of effect to sector after disruption of non-utilities (scores out of a possible maximum of 100)
Str
uctu
ral
dam
ag
e t
o b
uil
din
g(s
)
(in
teg
rity
of
bu
ild
ing
co
mp
rom
ised
)
No
n-s
tru
ctu
ral
dam
ag
e (
fitt
ing
s d
am
ag
ed
e.g
. w
ind
ow
s o
r li
gh
t fi
xtu
res)
Dam
ag
e t
o e
qu
ipm
en
t (n
on
-co
mp
uti
ng
)
Dam
ag
e t
o c
om
pu
ters
Dam
ag
e t
o i
nve
nto
ry o
r st
ock
Dam
ag
e t
o g
rou
nd
su
rface
Dam
ag
e t
o o
r clo
sure
of
ad
jacen
t (n
ex
t
do
or)
org
an
isati
on
s o
r b
uil
din
gs
Dam
ag
e t
o o
r clo
sure
of
nearb
y b
uil
din
gs
or
org
an
isati
on
s
Ou
r o
rgan
isati
on
was
locate
d w
ith
in
co
rdo
ned
-off
are
a
Ph
ysi
cal
harm
to
em
plo
yees
Su
pp
lier
issu
es
Cu
sto
mer
issu
es
Sta
ff
tem
po
rari
ly r
elo
cate
d
Sta
ff p
erm
an
en
tly r
elo
cate
d
Sta
ff d
id n
ot
feel
safe
retu
rnin
g t
o
bu
ild
ing
Ch
an
ges
in s
taff
em
oti
on
al
well
bein
g
Oth
er
Building Suppliers
38 41 29 0 33 37 33 33 60 22 50 71 50 22 33 42 17
Critical Infrastructure
77 56 60 58 63 47 57 50 76 25 53 64 67 73 50 43 33
FMCG 64 42 47 6 67 43 50 72 67 8 50 56 33 33 40 52 0
Hospitality 78 73 73 75 78 75 80 80 83 50 42 53 56 67 73 61 56
ICT 45 53 44 56 56 50 24 25 50 8 45 57 50 38 48 44 11
Trucking 33 17 7 0 33 20 8 0 0 0 39 67 17 0 0 37 0
Christchurch CBD
90 70 67 43 79 46 92 90 100 0 55 87 57 87 71 75 33
Kaiapoi 59 19 8 40 29 33 44 57 57 0 52 50 56 25 33 48 0
Lyttelton 71 68 62 42 73 58 67 65 77 0 67 84 64 56 58 57 75
Entire Survey 2 Sample
62 49 44 36 57 45 51 52 63 13 50 65 50 45 45 51 25
* The three highest degrees of effect, for each sector, are in bold highlighted cells. All scores out of a possible maximum of 100.
For interruption caused by the disruption of utilities (Table 5-19), more critical infrastructure
organisations reported being affected by disruption of all the alternatives presented. This is
because of the closely coupled location of infrastructure where one service needing repair means
all the other utilities are affected. For instance, the disruption to utilities like roads and gas meant
that the repair and remediation work to be carried out was slowed down as they were unable to
get to repair sites or could not access the sites until electricity, gas or water had been turned off.
This required considerable coordination from the lifeline utilities in the greater Christchurch area
and was made easier by the fact that they had good pre-existing relationships from the regular
Engineering Lifelines Group meeting (see section 4.2.2). Disruption to utilities after the 22
Key elements of sectoral recovery and resilience after the Canterbury earthquakes: A system dynamics approach
Hlekiwe Kachali
139
February 2011 earthquake in some cases also affected search and rescue as rescue teams had to
ensure that all utilities would not be hazards to operations.
More organisations reported being affected by disruption to road networks, communications
and water than by disruption to sewerage and electricity. For the Christchurch CBD sector
affected organisations reported being very disrupted. This is a result of the extensive damage
caused by ground motion from the earthquake32.
32 The 22 February earthquake had some of the highest peak ground accelerations ever recorded for an earthquake of MW 6.3
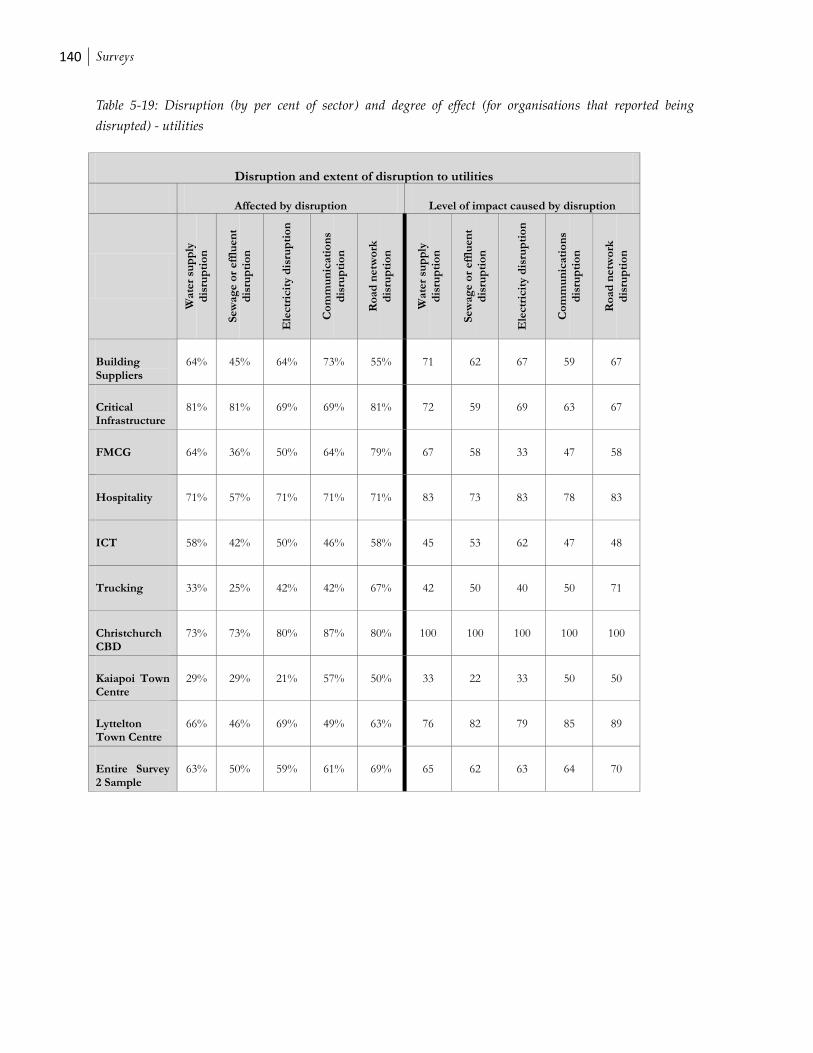
140 Surveys
Table 5-19: Disruption (by per cent of sector) and degree of effect (for organisations that reported being
disrupted) - utilities
Disruption and extent of disruption to utilities
Affected by disruption Level of impact caused by disruption
Wate
r su
pp
ly
dis
rup
tio
n
Sew
ag
e o
r eff
luen
t
dis
rup
tio
n
Ele
ctr
icit
y d
isru
pti
on
Co
mm
un
icati
on
s
dis
rup
tio
n
Ro
ad
netw
ork
dis
rup
tio
n
Wate
r su
pp
ly
dis
rup
tio
n
Sew
ag
e o
r eff
luen
t
dis
rup
tio
n
Ele
ctr
icit
y d
isru
pti
on
Co
mm
un
icati
on
s
dis
rup
tio
n
Ro
ad
netw
ork
dis
rup
tio
n
Building Suppliers
64% 45% 64% 73% 55% 71 62 67 59 67
Critical Infrastructure
81% 81% 69% 69% 81% 72 59 69 63 67
FMCG 64% 36% 50% 64% 79% 67 58 33 47 58
Hospitality 71% 57% 71% 71% 71% 83 73 83 78 83
ICT 58% 42% 50% 46% 58% 45 53 62 47 48
Trucking 33% 25% 42% 42% 67% 42 50 40 50 71
Christchurch CBD
73% 73% 80% 87% 80% 100 100 100 100 100
Kaiapoi Town Centre
29% 29% 21% 57% 50% 33 22 33 50 50
Lyttelton Town Centre
66% 46% 69% 49% 63% 76 82 79 85 89
Entire Survey 2 Sample
63% 50% 59% 61% 69% 65 62 63 64 70
Key elements of sectoral recovery and resilience after the Canterbury earthquakes: A system dynamics approach
Hlekiwe Kachali
141
5.3 Survey 333 (deployed 12 March 2012 to 19 May 2012)
Survey 3 was designed to bring together data on the after-effects of the earthquakes 18 months
after the initial 4 September 2010 earthquake and 12 months after the more destructive 22
February 2011 earthquake. Survey 3 was also intended to determine how organisations were
affected by subsequent aftershocks, such as those on 13 June and 23 December 2011. It should
be kept in mind that results presented for Survey 3 are only for organisations that participated in
Survey 3 (see tables 5-1 and 5-2 for survey response rates). Additionally, results for the
hospitality sector are not reported in this section because of the small number of responses
received from the sector for Survey 3. Some organisations chose not to participate further after
Survey 1 and Survey 2.
In Survey 3, organisations were asked to state whether they were open or trading, permanently
closed or intended to re-open. Table 5-20 has the organisational responses by sector showing
organisations that were open or trading or those that intended to re-open. Only organisations
from the CBD and Town Centres reported that they were still closed but intended to re-open.
Reasons for those intending to re-open included the building of new premises and waiting for
issues to do with their building to be resolved before it could be re-occupied.
33 It should be noted that the hospitality sector has been omitted from the numerical results presentation for Survey 3 because
of the low participation of organisations from the sector.
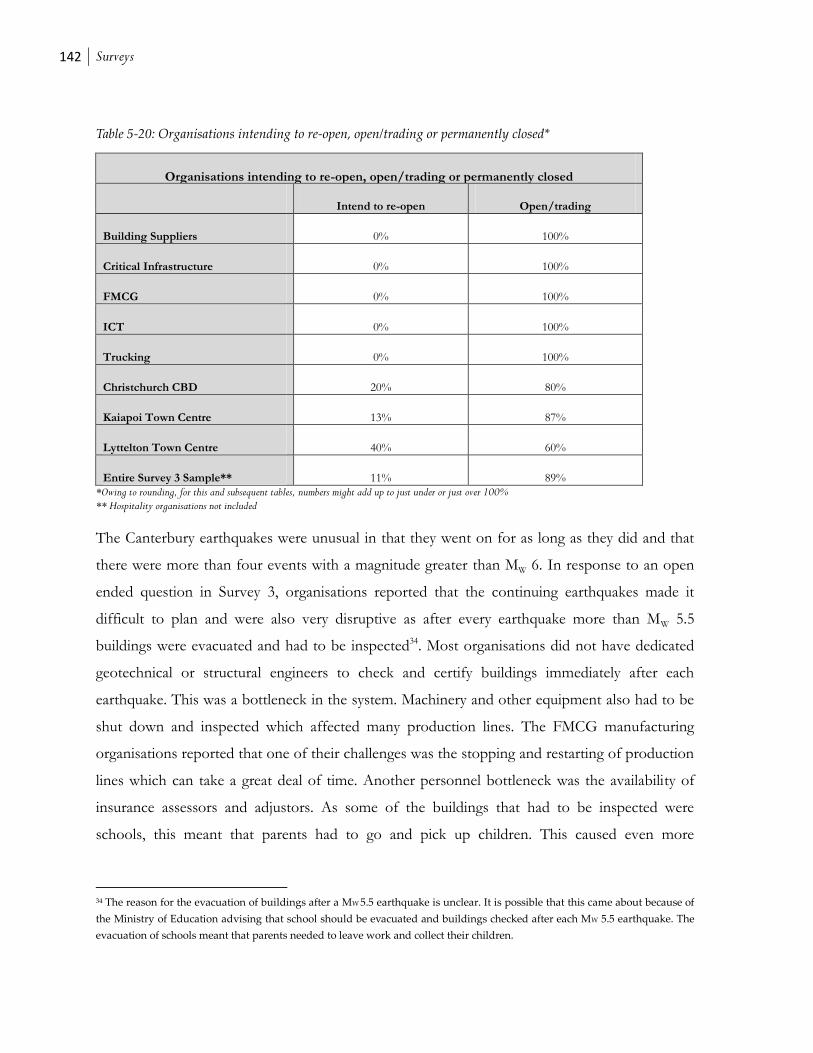
142 Surveys
Table 5-20: Organisations intending to re-open, open/trading or permanently closed*
Organisations intending to re-open, open/trading or permanently closed
Intend to re-open Open/trading
Building Suppliers 0% 100%
Critical Infrastructure 0% 100%
FMCG 0% 100%
ICT 0% 100%
Trucking 0% 100%
Christchurch CBD 20% 80%
Kaiapoi Town Centre 13% 87%
Lyttelton Town Centre 40% 60%
Entire Survey 3 Sample** 11% 89%
*Owing to rounding, for this and subsequent tables, numbers might add up to just under or just over 100% ** Hospitality organisations not included
The Canterbury earthquakes were unusual in that they went on for as long as they did and that
there were more than four events with a magnitude greater than MW 6. In response to an open
ended question in Survey 3, organisations reported that the continuing earthquakes made it
difficult to plan and were also very disruptive as after every earthquake more than MW 5.5
buildings were evacuated and had to be inspected34. Most organisations did not have dedicated
geotechnical or structural engineers to check and certify buildings immediately after each
earthquake. This was a bottleneck in the system. Machinery and other equipment also had to be
shut down and inspected which affected many production lines. The FMCG manufacturing
organisations reported that one of their challenges was the stopping and restarting of production
lines which can take a great deal of time. Another personnel bottleneck was the availability of
insurance assessors and adjustors. As some of the buildings that had to be inspected were
schools, this meant that parents had to go and pick up children. This caused even more
34 The reason for the evacuation of buildings after a MW 5.5 earthquake is unclear. It is possible that this came about because of
the Ministry of Education advising that school should be evacuated and buildings checked after each MW 5.5 earthquake. The
evacuation of schools meant that parents needed to leave work and collect their children.

Key elements of sectoral recovery and resilience after the Canterbury earthquakes: A system dynamics approach
Hlekiwe Kachali
143
disruption as they could sometimes not return to the office or if they did had on their minds the
welfare of their families.
In the aftershock sequence, overall more organisations (31%) reported being affected by the 13
June 2011 aftershock than by either the 26 December 2010 (3%) or 23 December 2011 (26%)
aftershocks. The sector with the most organisations affected by both the 13 June and 23
December 2011 aftershocks was critical infrastructure. The continuing aftershocks made it
difficult to renew or get new building insurance or contract works insurance for builders as
insurance companies weighed up the risks.
Considering the extended closure of the CBD and the difficulty in getting buildings constructed
or repaired as a result of the aftershocks, it is interesting to note that over two-thirds of
organisations participating in Survey 3 did not relocate (see Table 5-21). However, Christchurch
CBD at 80%, building suppliers (43%) and Lyttelton (40%) were the sectors with the most
organisations reporting relocating. This emphasises the localised nature that was characteristic of
the 22 February 2011 earthquake; the more devastating effects of the earthquake manifested in
the CBD, Lyttelton and in the eastern suburbs of Christchurch. This meant the organisations
that were able could relocate and work from different parts of the greater Christchurch area.
This was also made possible by the quick restoration or non-disruption of utilities to many parts
of Christchurch (Giovinazzi & Wilson, 2012). Additionally, this means that prior to the
earthquakes, Christchurch had slack building resources in areas outside the CBD that could be
used as commercial accommodation.
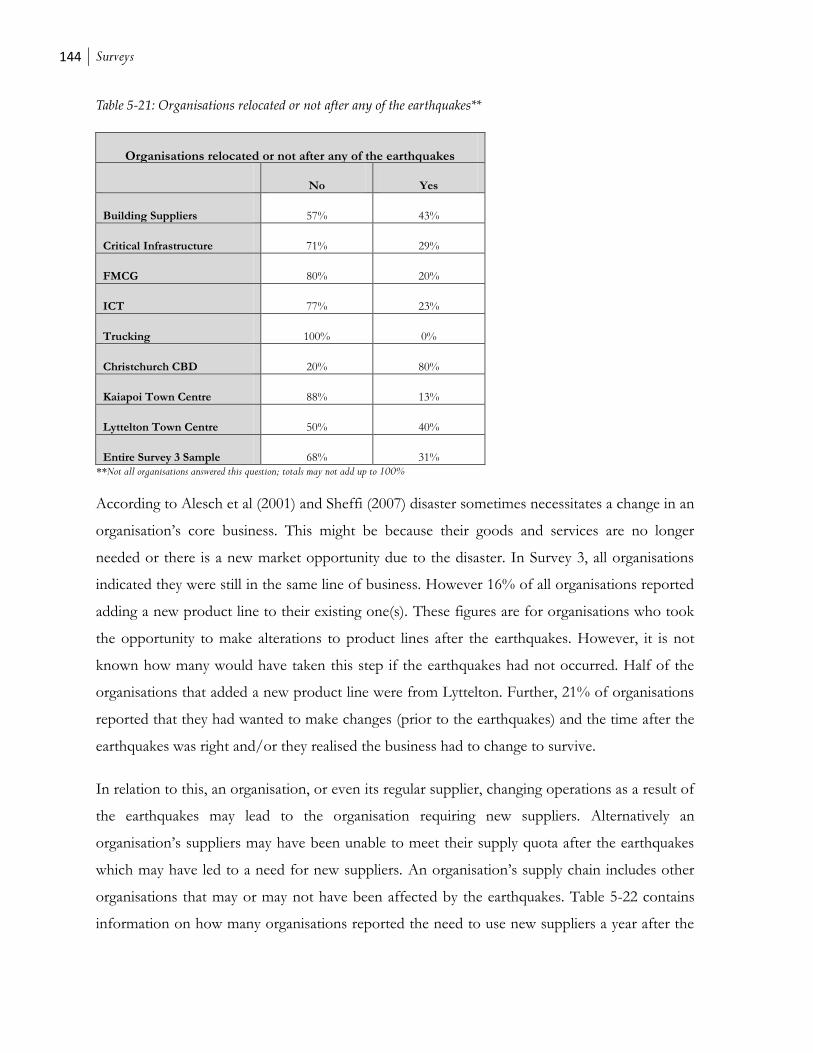
144 Surveys
Table 5-21: Organisations relocated or not after any of the earthquakes**
Organisations relocated or not after any of the earthquakes
No Yes
Building Suppliers 57% 43%
Critical Infrastructure 71% 29%
FMCG 80% 20%
ICT 77% 23%
Trucking 100% 0%
Christchurch CBD 20% 80%
Kaiapoi Town Centre 88% 13%
Lyttelton Town Centre 50% 40%
Entire Survey 3 Sample 68% 31%
**Not all organisations answered this question; totals may not add up to 100%
According to Alesch et al (2001) and Sheffi (2007) disaster sometimes necessitates a change in an
organisation’s core business. This might be because their goods and services are no longer
needed or there is a new market opportunity due to the disaster. In Survey 3, all organisations
indicated they were still in the same line of business. However 16% of all organisations reported
adding a new product line to their existing one(s). These figures are for organisations who took
the opportunity to make alterations to product lines after the earthquakes. However, it is not
known how many would have taken this step if the earthquakes had not occurred. Half of the
organisations that added a new product line were from Lyttelton. Further, 21% of organisations
reported that they had wanted to make changes (prior to the earthquakes) and the time after the
earthquakes was right and/or they realised the business had to change to survive.
In relation to this, an organisation, or even its regular supplier, changing operations as a result of
the earthquakes may lead to the organisation requiring new suppliers. Alternatively an
organisation’s suppliers may have been unable to meet their supply quota after the earthquakes
which may have led to a need for new suppliers. An organisation’s supply chain includes other
organisations that may or may not have been affected by the earthquakes. Table 5-22 contains
information on how many organisations reported the need to use new suppliers a year after the

Key elements of sectoral recovery and resilience after the Canterbury earthquakes: A system dynamics approach
Hlekiwe Kachali
145
22 February 2011 earthquake. More critical infrastructure organisations reported using new
suppliers than any other sector. Interviews with some of the critical infrastructure organisations
revealed that this was due to their regular suppliers not carrying the amount of supplies required
for earthquake repairs.
Table 5-22: Organisations reporting the need to use new suppliers**
Organisations reporting the need to use new suppliers
No Yes
Building Suppliers 86% 14%
Critical Infrastructure 43% 57%
FMCG 80% 20%
ICT 92% 8%
Trucking 83% 17%
Christchurch CBD 60% 40%
Kaiapoi Town Centre 88% 13%
Lyttelton Town Centre 70% 20%
Entire Survey 3 Sample 76% 23%
**Not all organisations answered this question; totals may not add up to 100%
The sequence of earthquakes in Canterbury and the cost of the disaster (Munich Re, 1999)
caused massive insurance settlement delays. In Survey 3 organisations were asked if they had
lodged insurance claims, if their insurance cover was adequate and if insurance claims had been
settled in full following the 22 February 2011 earthquakes. Results are in Table 5-23. More
organisations from Lyttelton, trucking and Kaiapoi did not lodge insurance claims after the 22
February 2011 earthquake than from other sectors. Some organisations reported that the reason
for this was because the insurance excess was more than the cost of the damage incurred. For
Lyttelton however, the sector had the most organisations (40%) report that they did not have
insurance cover. Most of the organisations in the Lyttelton sample are small- to medium-sized
enterprises (SMEs). Also in the Lyttelton sample are some not-for-profit organisations. Both the
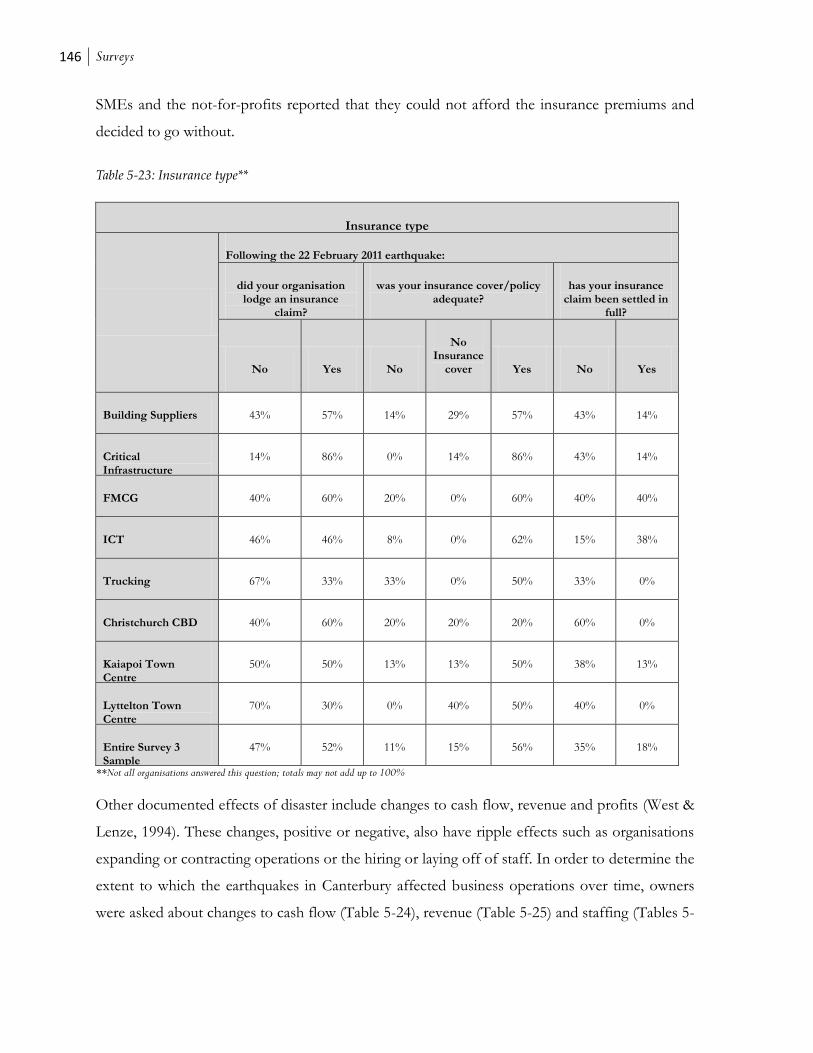
146 Surveys
SMEs and the not-for-profits reported that they could not afford the insurance premiums and
decided to go without.
Table 5-23: Insurance type**
Insurance type
Following the 22 February 2011 earthquake:
did your organisation lodge an insurance
claim?
was your insurance cover/policy adequate?
has your insurance claim been settled in
full?
No Yes No
No Insurance
cover Yes No Yes
Building Suppliers 43% 57% 14% 29% 57% 43% 14%
Critical Infrastructure
14% 86% 0% 14% 86% 43% 14%
FMCG 40% 60% 20% 0% 60% 40% 40%
ICT 46% 46% 8% 0% 62% 15% 38%
Trucking 67% 33% 33% 0% 50% 33% 0%
Christchurch CBD 40% 60% 20% 20% 20% 60% 0%
Kaiapoi Town Centre
50% 50% 13% 13% 50% 38% 13%
Lyttelton Town Centre
70% 30% 0% 40% 50% 40% 0%
Entire Survey 3 Sample
47% 52% 11% 15% 56% 35% 18%
**Not all organisations answered this question; totals may not add up to 100%
Other documented effects of disaster include changes to cash flow, revenue and profits (West &
Lenze, 1994). These changes, positive or negative, also have ripple effects such as organisations
expanding or contracting operations or the hiring or laying off of staff. In order to determine the
extent to which the earthquakes in Canterbury affected business operations over time, owners
were asked about changes to cash flow (Table 5-24), revenue (Table 5-25) and staffing (Tables 5-
Key elements of sectoral recovery and resilience after the Canterbury earthquakes: A system dynamics approach
Hlekiwe Kachali
147
26 and 5-27). Organisations were also asked to indicate whether their businesses were worse off,
better off or about the same compared to before the earthquakes.
Organisations from the FMCG (80%) and trucking (66%) sectors were more likely to indicate
excellent or good cash flow while more organisations from critical infrastructure (57%) reported
having good cash flow. The building suppliers and Christchurch CBD sectors stood out with
more organisations, 43% and 40% respectively reporting poor cash flow. The sectors have
slightly different reasons for this, however, all related to not having enough custom. The
building suppliers (mainly those selling products like floors and roofs) spoke of still not profiting
because of the slow start to rebuild work. The CBD organisations stated that with the relocation
of major employers out of the CBD and the drop in foot traffic, there were not enough
customers. It is worth remembering that some of the organisations that were in the CBD prior
to the earthquakes may not return there.

148 Surveys
Table 5-24: Organisational cash flow**
Organisational cash flow
With your organisation's cash flow in mind, which of the following applies:
Excellent Good Satisfactory Poor Very Poor Don't
Know
Building
Suppliers
0% 14% 43% 43% 0% 0%
Critical
Infrastructure
14% 57% 29% 0% 0% 0%
FMCG 40% 40% 20% 0% 0% 0%
ICT 15% 15% 46% 8% 0% 8%
Trucking 33% 33% 33% 0% 0% 0%
Christchurch
CBD
0% 20% 40% 40% 0% 0%
Kaiapoi Town
Centre
13% 38% 13% 25% 13% 0%
Lyttelton Town
Centre
20% 20% 30% 20% 0% 0%
Entire Survey 3
Sample
16% 27% 34% 16% 2% 2%
**Not all organisations answered this question; totals may not add up to 100%
In comparison to results from Surveys 1 and 2 (see Tables 5-7 and 5-14 respectively), the
building suppliers sector was still the sector with the most organisations reporting a decrease in
revenue after Survey 3. Some of the organisations from the building suppliers sector however,
commented that business has picked up and this will be reflected on the balance sheet in the
months following. Forty per cent of FMCG organisations reported a drop in revenue. This is
attributed to pricing changes, i.e. decreases, which led to lower profit margins on many product
lines after the earthquakes. Organisations reported reducing prices, as a short-term measure, in
order to attract customers (see section 7.5 for more detail). In contrast, organisations in the ICT
sector that reported no change or an increase in revenue ascribed this to the continued growth
of their sector and also to having a customer base outside of the Canterbury region and New
Zealand.
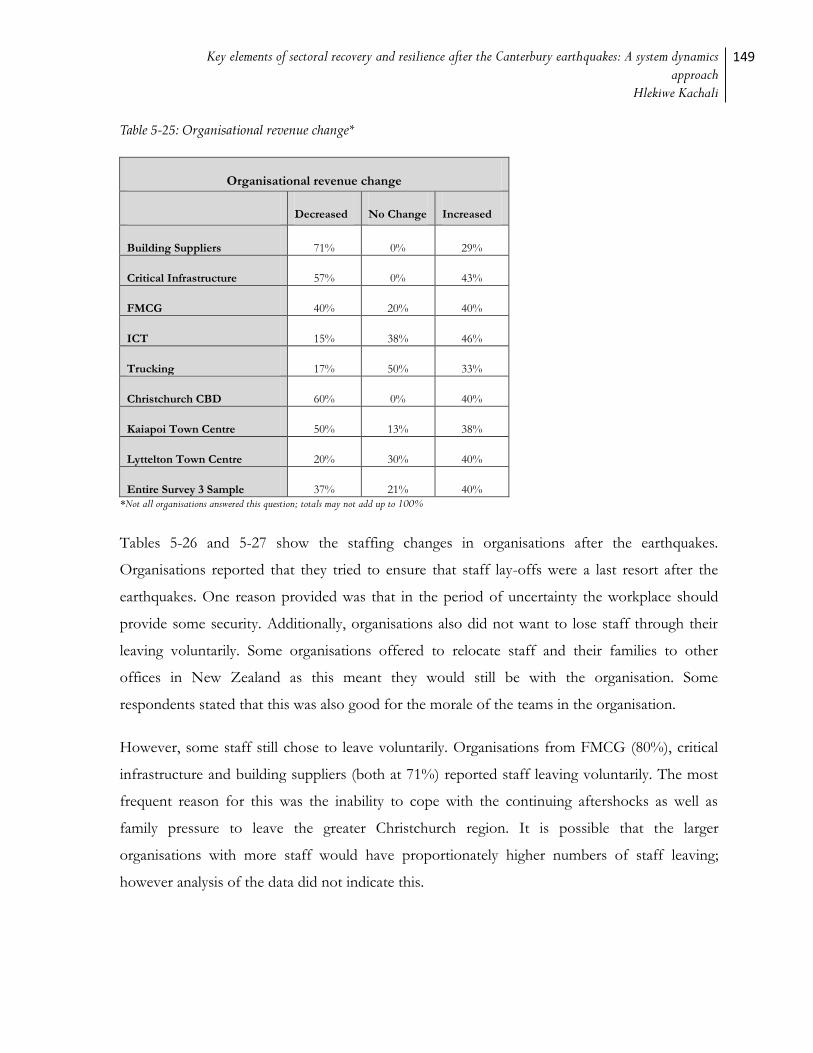
Key elements of sectoral recovery and resilience after the Canterbury earthquakes: A system dynamics approach
Hlekiwe Kachali
149
Table 5-25: Organisational revenue change*
Organisational revenue change
Decreased No Change Increased
Building Suppliers 71% 0% 29%
Critical Infrastructure 57% 0% 43%
FMCG 40% 20% 40%
ICT 15% 38% 46%
Trucking 17% 50% 33%
Christchurch CBD 60% 0% 40%
Kaiapoi Town Centre 50% 13% 38%
Lyttelton Town Centre 20% 30% 40%
Entire Survey 3 Sample 37% 21% 40%
*Not all organisations answered this question; totals may not add up to 100%
Tables 5-26 and 5-27 show the staffing changes in organisations after the earthquakes.
Organisations reported that they tried to ensure that staff lay-offs were a last resort after the
earthquakes. One reason provided was that in the period of uncertainty the workplace should
provide some security. Additionally, organisations also did not want to lose staff through their
leaving voluntarily. Some organisations offered to relocate staff and their families to other
offices in New Zealand as this meant they would still be with the organisation. Some
respondents stated that this was also good for the morale of the teams in the organisation.
However, some staff still chose to leave voluntarily. Organisations from FMCG (80%), critical
infrastructure and building suppliers (both at 71%) reported staff leaving voluntarily. The most
frequent reason for this was the inability to cope with the continuing aftershocks as well as
family pressure to leave the greater Christchurch region. It is possible that the larger
organisations with more staff would have proportionately higher numbers of staff leaving;
however analysis of the data did not indicate this.
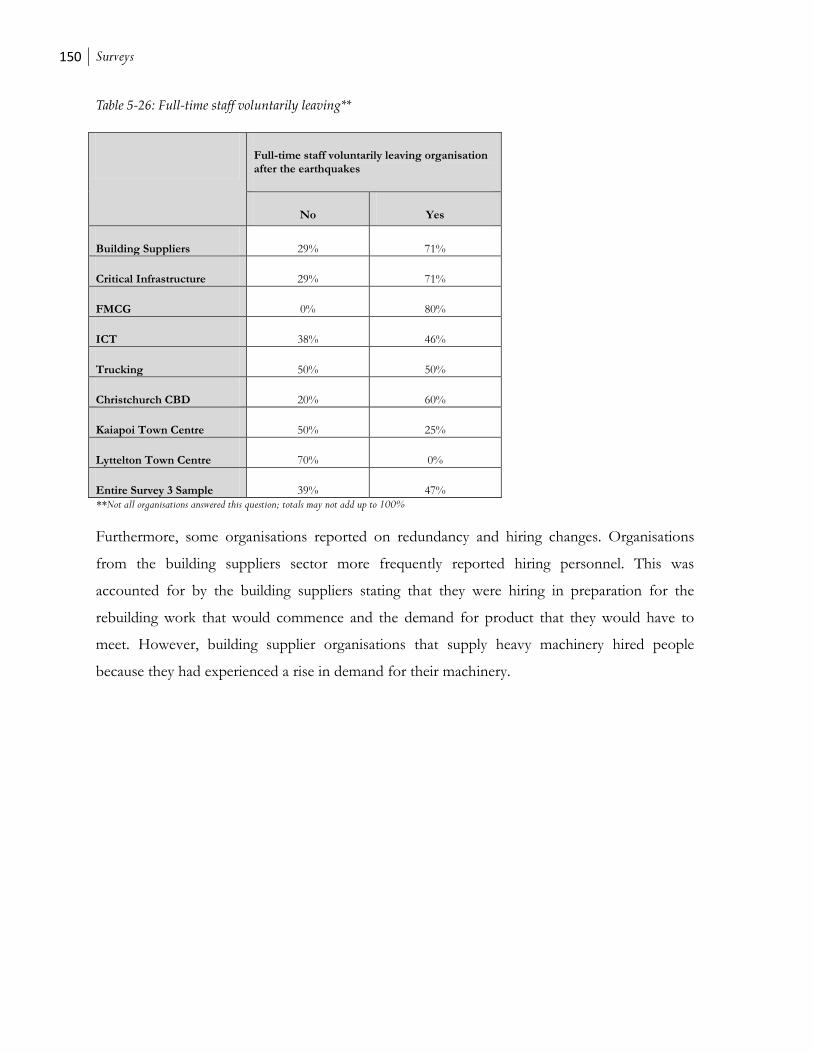
150 Surveys
Table 5-26: Full-time staff voluntarily leaving**
Full-time staff voluntarily leaving organisation after the earthquakes
No Yes
Building Suppliers 29% 71%
Critical Infrastructure 29% 71%
FMCG 0% 80%
ICT 38% 46%
Trucking 50% 50%
Christchurch CBD 20% 60%
Kaiapoi Town Centre 50% 25%
Lyttelton Town Centre 70% 0%
Entire Survey 3 Sample 39% 47%
**Not all organisations answered this question; totals may not add up to 100%
Furthermore, some organisations reported on redundancy and hiring changes. Organisations
from the building suppliers sector more frequently reported hiring personnel. This was
accounted for by the building suppliers stating that they were hiring in preparation for the
rebuilding work that would commence and the demand for product that they would have to
meet. However, building supplier organisations that supply heavy machinery hired people
because they had experienced a rise in demand for their machinery.
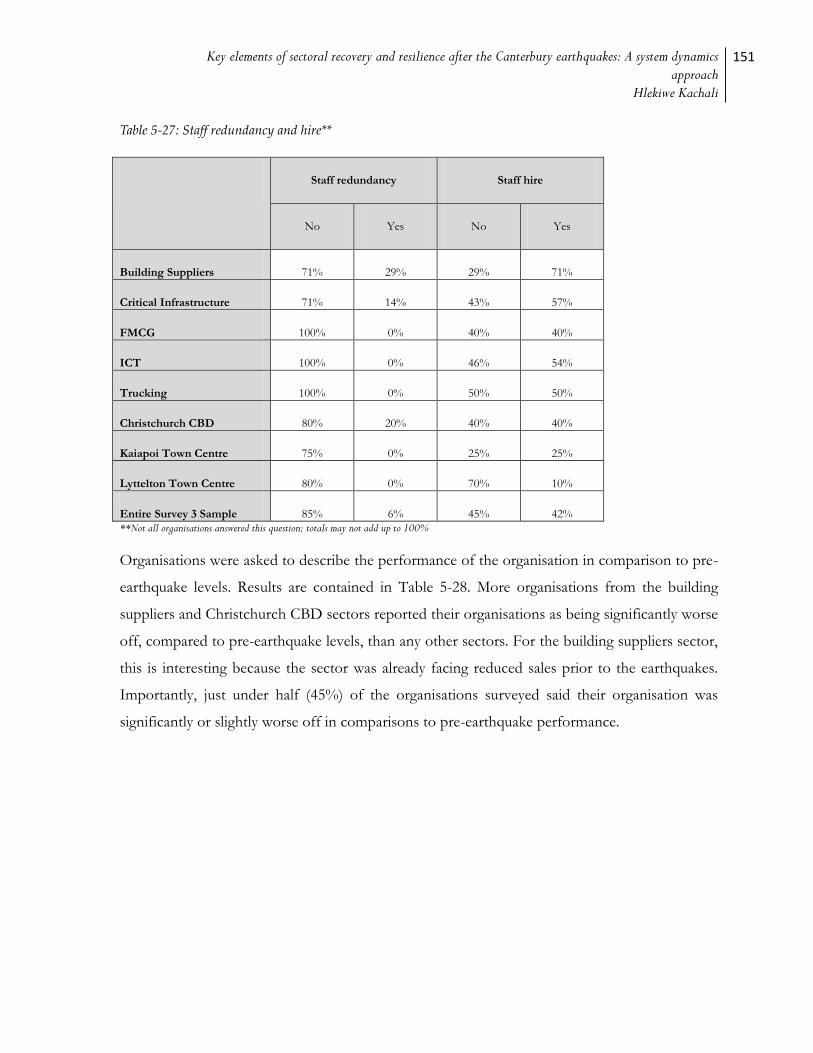
Key elements of sectoral recovery and resilience after the Canterbury earthquakes: A system dynamics approach
Hlekiwe Kachali
151
Table 5-27: Staff redundancy and hire**
Staff redundancy Staff hire
No Yes No Yes
Building Suppliers 71% 29% 29% 71%
Critical Infrastructure 71% 14% 43% 57%
FMCG 100% 0% 40% 40%
ICT 100% 0% 46% 54%
Trucking 100% 0% 50% 50%
Christchurch CBD 80% 20% 40% 40%
Kaiapoi Town Centre 75% 0% 25% 25%
Lyttelton Town Centre 80% 0% 70% 10%
Entire Survey 3 Sample 85% 6% 45% 42%
**Not all organisations answered this question; totals may not add up to 100%
Organisations were asked to describe the performance of the organisation in comparison to pre-
earthquake levels. Results are contained in Table 5-28. More organisations from the building
suppliers and Christchurch CBD sectors reported their organisations as being significantly worse
off, compared to pre-earthquake levels, than any other sectors. For the building suppliers sector,
this is interesting because the sector was already facing reduced sales prior to the earthquakes.
Importantly, just under half (45%) of the organisations surveyed said their organisation was
significantly or slightly worse off in comparisons to pre-earthquake performance.

152 Surveys
Table 5-28: Self-report performance of organisations pre- and post-earthquake**
Performance of organisations pre- and post-earthquake
With the earthquakes in mind, is your organisation:
Significantly worse off
Slightly worse Same Slightly better Significantly better
Building Suppliers 57% 14% 0% 14% 14%
Critical Infrastructure 14% 43% 14% 29% 0%
FMCG 20% 20% 0% 40% 20%
ICT 0% 23% 46% 31% 0%
Trucking 0% 33% 17% 50% 0%
Christchurch CBD 40% 20% 20% 20% 0%
Kaiapoi Town Centre 25% 38% 13% 13% 13%
Lyttelton Town Centre 20% 10% 30% 30% 10%
Entire Survey 3 Sample 19% 26% 21% 27% 6%
**Not all organisations answered this question; totals may not add up to 100%
5.4 Sectoral challenges
In all three surveys deployed, organisations were asked what particular challenges their
organisations faced after the earthquakes. In all three instances, the biggest challenge across all
sectors was the wellbeing of staff. Organisations reported increased stress levels and drops in
motivation. This was partly a result of the ongoing earthquakes and also because people had to
deal with relocation, repairs, restoration or demolition of their properties on top of the insurance
and other paperwork that needed to be done. Table 5-29 contains complete results of each
sector’s challenges.
From Table 5-29, after Survey 1, Kaiapoi and Christchurch CBD both identified as challenges
reduced customers numbers and reduced customer spending. The hospitality sector also listed
these as some of their challenges. However, the CBD and Town Centres were also subject to
neighbour effects. This was a concern for all three geographic locales in all the surveys. From
Surveys 2 and 3, common to Lyttelton and Kaiapoi were comments from not-for-profits about
difficulty maintaining their profiles in the community as people’s time was taken up dealing with
Key elements of sectoral recovery and resilience after the Canterbury earthquakes: A system dynamics approach
Hlekiwe Kachali
153
the consequences of the earthquakes. After Survey 3, it emerged that the trucking and critical
infrastructure sectors were in competition for some of the same human resources as a result of a
shortage of that particular skillset.
The critical infrastructure sector listed damage to their infrastructure, especially the buried
infrastructure, as a considerable challenge. This continued throughout the different survey
periods and was compounded by continued damage due to aftershocks and having to ensure
that infrastructure was assessed after every significant aftershock. Also challenging was planning
for and implementation of seismic retrofitting measures while not knowing where people would
relocate to as a result of land use planning decisions such as the residential zoning. Critical
infrastructure organisations stood out in particular for staff wellbeing because of the extended
hours their staff worked to effect repairs to damaged infrastructure.
After both Surveys 1 and 2, those ICT organisations with local customers detailed having
trouble accessing their customers, especially those who had been located in the Christchurch
CBD at the time of the 22 February 2011 earthquake. Also, due to the mobile nature of some of
their work, some of these ICT organisations wrote of worrying about the safety of their staff in
case of earthquakes as they worked from customers’ alternative premises such as private homes
which may not have been checked for earthquake resistance. For ICT organisations with
customers outside the Christchurch region and New Zealand, one of their challenges was
reassuring clients that they could still deliver.
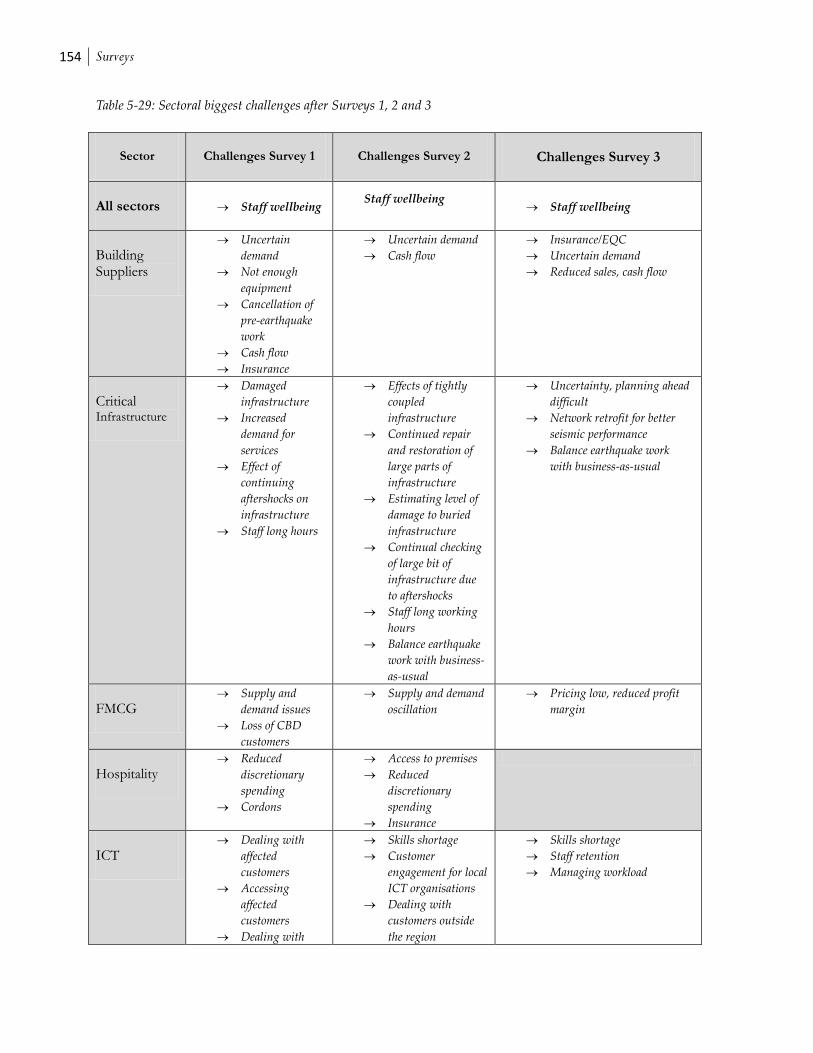
154 Surveys
Table 5-29: Sectoral biggest challenges after Surveys 1, 2 and 3
Sector Challenges Survey 1 Challenges Survey 2 Challenges Survey 3
All sectors Staff wellbeing Staff wellbeing
Staff wellbeing
Building Suppliers
Uncertain
demand
Not enough
equipment
Cancellation of
pre-earthquake
work
Cash flow
Insurance
Uncertain demand
Cash flow
Insurance/EQC
Uncertain demand
Reduced sales, cash flow
Critical Infrastructure
Damaged
infrastructure
Increased
demand for
services
Effect of
continuing
aftershocks on
infrastructure
Staff long hours
Effects of tightly
coupled
infrastructure
Continued repair
and restoration of
large parts of
infrastructure
Estimating level of
damage to buried
infrastructure
Continual checking
of large bit of
infrastructure due
to aftershocks
Staff long working
hours
Balance earthquake
work with business-
as-usual
Uncertainty, planning ahead
difficult
Network retrofit for better
seismic performance
Balance earthquake work
with business-as-usual
FMCG
Supply and
demand issues
Loss of CBD
customers
Supply and demand
oscillation
Pricing low, reduced profit
margin
Hospitality
Reduced
discretionary
spending
Cordons
Access to premises
Reduced
discretionary
spending
Insurance
ICT
Dealing with
affected
customers
Accessing
affected
customers
Dealing with
Skills shortage
Customer
engagement for local
ICT organisations
Dealing with
customers outside
the region
Skills shortage
Staff retention
Managing workload
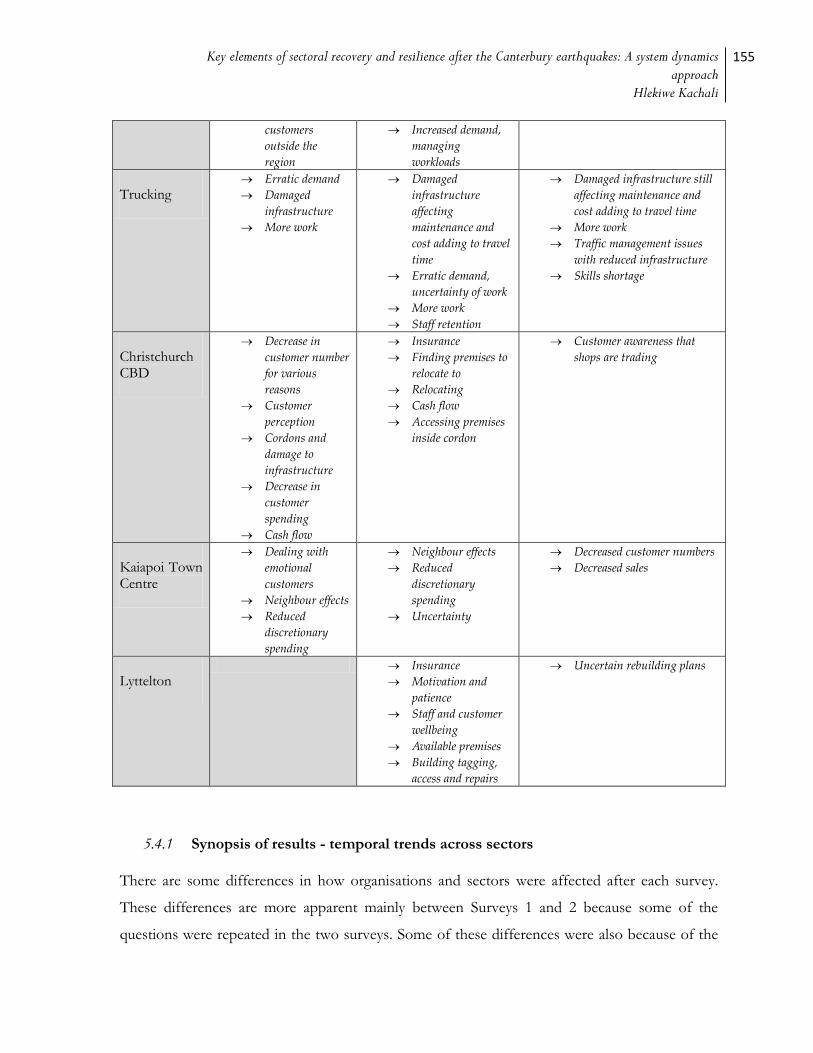
Key elements of sectoral recovery and resilience after the Canterbury earthquakes: A system dynamics approach
Hlekiwe Kachali
155
customers
outside the
region
Increased demand,
managing
workloads
Trucking
Erratic demand
Damaged
infrastructure
More work
Damaged
infrastructure
affecting
maintenance and
cost adding to travel
time
Erratic demand,
uncertainty of work
More work
Staff retention
Damaged infrastructure still
affecting maintenance and
cost adding to travel time
More work
Traffic management issues
with reduced infrastructure
Skills shortage
Christchurch CBD
Decrease in
customer number
for various
reasons
Customer
perception
Cordons and
damage to
infrastructure
Decrease in
customer
spending
Cash flow
Insurance
Finding premises to
relocate to
Relocating
Cash flow
Accessing premises
inside cordon
Customer awareness that
shops are trading
Kaiapoi Town Centre
Dealing with
emotional
customers
Neighbour effects
Reduced
discretionary
spending
Neighbour effects
Reduced
discretionary
spending
Uncertainty
Decreased customer numbers
Decreased sales
Lyttelton
Insurance
Motivation and
patience
Staff and customer
wellbeing
Available premises
Building tagging,
access and repairs
Uncertain rebuilding plans
5.4.1 Synopsis of results - temporal trends across sectors
There are some differences in how organisations and sectors were affected after each survey.
These differences are more apparent mainly between Surveys 1 and 2 because some of the
questions were repeated in the two surveys. Some of these differences were also because of the

156 Surveys
very different characteristics of the 4 September 2010 and 22 February 2011 earthquakes (see
chapter 1 for more detail).
More building supplier organisations closed temporarily after Survey 1 than after Survey 2.
However, fewer organisations from FMCG, hospitality and trucking reported temporary or
permanent closure after Survey 1. After Survey 2, there were also less organisations reporting
closure in Kaiapoi and more organisations closed in the CBD. In keeping with the reported
increased workload, more trucking and critical infrastructure organisations reported working
longer hours after Survey 2. In Survey 1, these were also the 2 sectors that worked more hours
than any other.
Table 5-30 shows the sectoral revenue changes after Surveys 1 and 2. With each survey, there
was an increase in the percentage of building supplier organisations reporting revenue losses.
This is in addition to the building suppliers sector reporting a downward trend in revenue for the
period before the earthquakes (see section 4.2.1). Some organisations reported that this
continuing pattern of reduced revenue was a hindrance to recovery as they did not have
sufficient cash reserves post-earthquakes. In the disaster literature, (Alesch et al., 2009;
Olshansky & Johnson, 2012; Quarantelli, 1999; Rose & Lim, 2002) it has been documented how
recovery can be a long, slow process and can be linked to the amount of resources an
organisation has access to in the recovery period as well as the effective use of those resources.
Effective utilisation of resources (Gladwell, 2000; Hummel et al., 2007) ensures that they are
used in the phase of recovery when they are most needed (see chapter 6.8.6).

Key elements of sectoral recovery and resilience after the Canterbury earthquakes: A system dynamics approach
Hlekiwe Kachali
157
Table 5-30: Comparison of sectoral revenue changes after 4 September 2010 earthquake (data from Survey 1)
and 22 February 2011 earthquake (data from after Survey 2)
Comparison of sectoral revenue changes after 4 September 2010 earthquake (data from Survey 1) and 22 February 2011 earthquake (data from after Survey 2)
Revenue has decreased No change Revenue has increased
After 4 September
2010 earthquake (Survey 1)
After 22 February
2011 earthquake (Survey 2)
After 4 September
2010 earthquake (Survey 1)
After 22 February
2011 earthquake (Survey 2)
After 4 September
2010 earthquake (Survey 1)
After 22 February
2011 earthquake (Survey 2)
Building Suppliers 59% 82% 23% 0% 14% 18%
Critical Infrastructure 18% 38% 50% 25% 23% 19%
FMCG 16% 29% 62% 29% 16% 43%
Hospitality 67% 86% 15% 0% 19% 29%
ICT 20% 13% 70% 54% 10% 33%
Trucking 38% 42% 46% 25% 17% 33%
Christchurch CBD 77% 87% 19% 0% 3% 20%
Kaiapoi Town Centre 64% 14% 28% 36% 8% 21%
Lyttelton Did not participate
60% Did not participate
20% Did not participate
11%
Entire Survey 1 Sample 45% 47% 39% 24% 13% 24%
In contrast, the FMCG sector had a higher percentage of organisations with revenue increases in
Survey 2 than in Survey 1. There was a slight dip in Survey 3 compared to Survey 2. In personal
communication with a FMCG business leader, he pointed to the population shift after the
earthquakes as a challenge for the sector: both in customer numbers and in long-term planning.
He noted that some FMCG retail locations had far lower numbers than pre-earthquake while
some had more. The hospitality sector also had a larger percentage of organisations reporting
revenue increases from Survey 1 to Survey 2. Considering the timing of Survey 2, there are two
possible reasons for this. The first is that they had increased revenues because of the Rugby
World Cup (hosted by New Zealand) and the second is that the open hospitality associations
profited from others being closed. Trucking and Kaiapoi also had more businesses experience
158 Surveys
revenue increases after Survey 2. For trucking this is consistent with the increased post-
earthquake work load they reported. In Kaiapoi this may be a result of the joint marketing
campaign the organisations embarked on, profiting from the closure of the Christchurch CBD
and local customer loyalty. Kaiapoi was also the only sector where there were more businesses
reporting no change to their revenue after Survey 2. There were less Lyttelton organisations
reporting revenue decreases after Survey 3. The trends for revenue changes are displayed in the
form of the recovery rate coefficient (RRC) discussed in chapter 7: significant contributors to
recovery.
After Survey 2, more organisations cited insurance as one of their means of recovery finance
compared to after Survey 1. After Survey 1, some organisations pointed to not filing insurance
claims because the damage was less than the excess. The increase in reports of insurance as a
means of recovery finance is likely because more organisations were affected by the 22 February
2011 than by the 4 September 2010 earthquake (see Table 5-11) and the more severe damage
after the 22 February 2011 earthquake. However, from analysis of sectoral biggest challenges,
insurance was cited more frequently as a challenge after Survey 2. The primary reason for this is
likely the delay in resolving insurance issues. Interestingly, hospitality had an increase in the
number of organisations using money borrowed from family or friends to finance their recovery. Berger
(1998) and Avery (1998) found that in small organisations it is often difficult for owners to
separate their personal assets from organisational assets. In such instances, it is not easy for the
firm to get a loan from lending agencies. In this thesis, the size of the organisation is just one of
the attributes investigated. Therefore, a separate more detailed analysis of the effects of recovery
based on organisation size is contained in appendix I.
The biggest challenge faced by all sectors was staff wellbeing. Organisations noted that one year
after the 22 February 2011 earthquake, staff were more likely to suffer fatigue. Some
organisations commented on the increase in frequency of mistakes made by tired staff.
Organisations reported that they took measures such as booking holiday getaways, away from
Christchurch, for staff members to help with the problem of fatigue. In other cases,
organisations offered staff the option of working from alternate locations instead of having staff
leave. There is more discussion on staff wellbeing in chapters 6 and 10.
Key elements of sectoral recovery and resilience after the Canterbury earthquakes: A system dynamics approach
Hlekiwe Kachali
159
Another way in which organisations can be affected after disaster is through staff retention.
Over the three surveys, the numbers of staff taken on and let go increased for the building
suppliers sector. This was the general trend for the critical infrastructure, FMCG and trucking
sectors. These sectors reported requiring more staff for the increased workload after the
earthquakes. More hospitality and CBD organisations had staff redundancies from survey to
survey. They also had less hires over this time period. Organisations that had staff redundancies
reported this being due to their extended closure. The ICT sector had an increase in workforce
between Surveys 2 and 3. Keeping in mind ICT sector reports of a continuing skills shortage, it
is unclear where the hires were from. Trucking had more staff hires from Survey 1 to Survey 2
and experienced a very slight drop between Surveys 2 and 3 in businesses reporting hiring staff.
Kaiapoi had a slight increase in organisations reporting hires while Lyttelton showed a drop in
number of organisations reporting redundancies after Survey 3.
In an illustration of neighbourhood effects, a substantial proportion of CBD and hospitality
organisations reported one of their biggest causes of disruption to be damage to or closure of nearby
buildings as well as damage to adjacent buildings. Neighbourhood effects are some of the ecological
factors that can affect the recovery of organisations after disaster. Some of these effects are
discussed in chapters 7 and 8. From Survey 1 to Survey 2, there was also a rise in how affected
organisations were by utility disruption. This again shows the amount of damage caused by the
22 February 2011 earthquake to infrastructure compared to the 4 September 2011 earthquake.
5.5 Organisational resilience using the Benchmark Resilience Tool
(BRT)
Organisational researchers have long puzzled over what particular organisational traits enable
some organisations to survive crisis better than others and if it would be possible to ascertain
business survival before crisis or disaster struck. This has led to the attempt to quantify the
resilience of organisations.
The second part of all the surveys deployed for this investigation contained questions from the
Benchmark Resilience Tool (BRT) regarding the resilience of the organisation (there is more
discussion on the BRT in chapters 2 and 10). The BRT contains items (questions) to which
respondents are asked to indicate a level of agreement (strongly agree to strongly disagree) on a
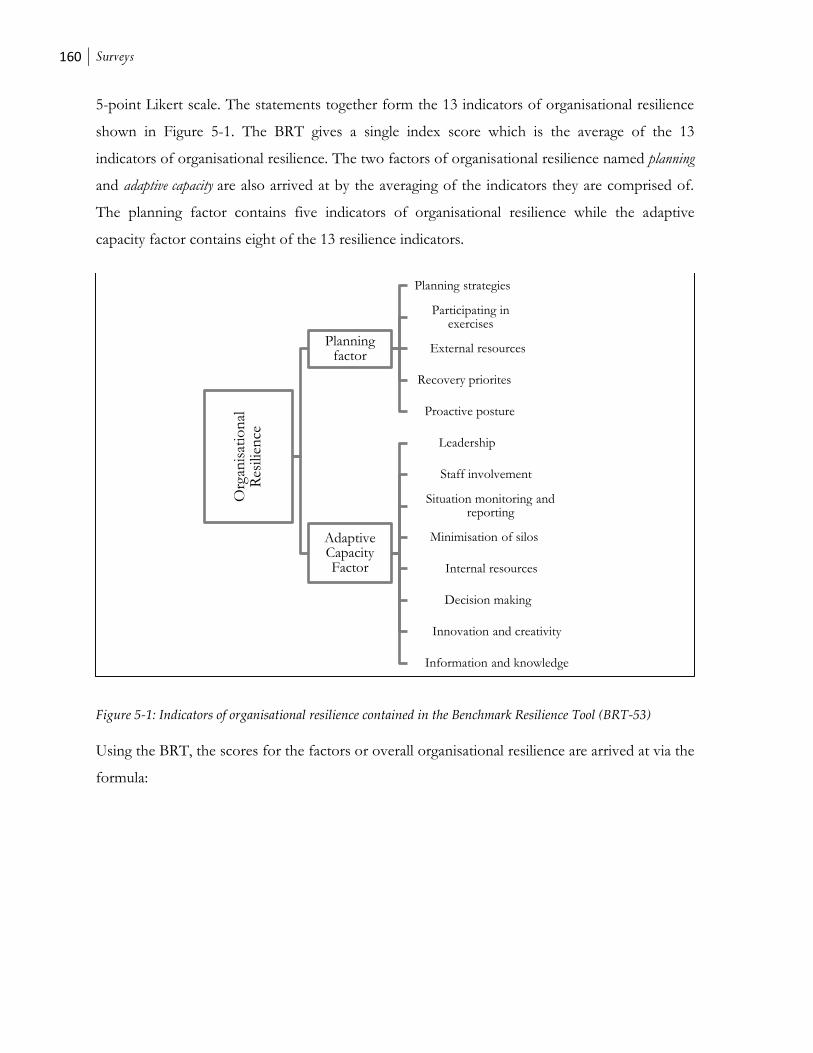
160 Surveys
5-point Likert scale. The statements together form the 13 indicators of organisational resilience
shown in Figure 5-1. The BRT gives a single index score which is the average of the 13
indicators of organisational resilience. The two factors of organisational resilience named planning
and adaptive capacity are also arrived at by the averaging of the indicators they are comprised of.
The planning factor contains five indicators of organisational resilience while the adaptive
capacity factor contains eight of the 13 resilience indicators.
Figure 5-1: Indicators of organisational resilience contained in the Benchmark Resilience Tool (BRT-53)
Using the BRT, the scores for the factors or overall organisational resilience are arrived at via the
formula:
Org
anis
atio
nal
R
esili
ence
Planning factor
Planning strategies
Participating in exercises
External resources
Recovery priorites
Proactive posture
Adaptive Capacity Factor
Leadership
Staff involvement
Situation monitoring and reporting
Minimisation of silos
Internal resources
Decision making
Innovation and creativity
Information and knowledge
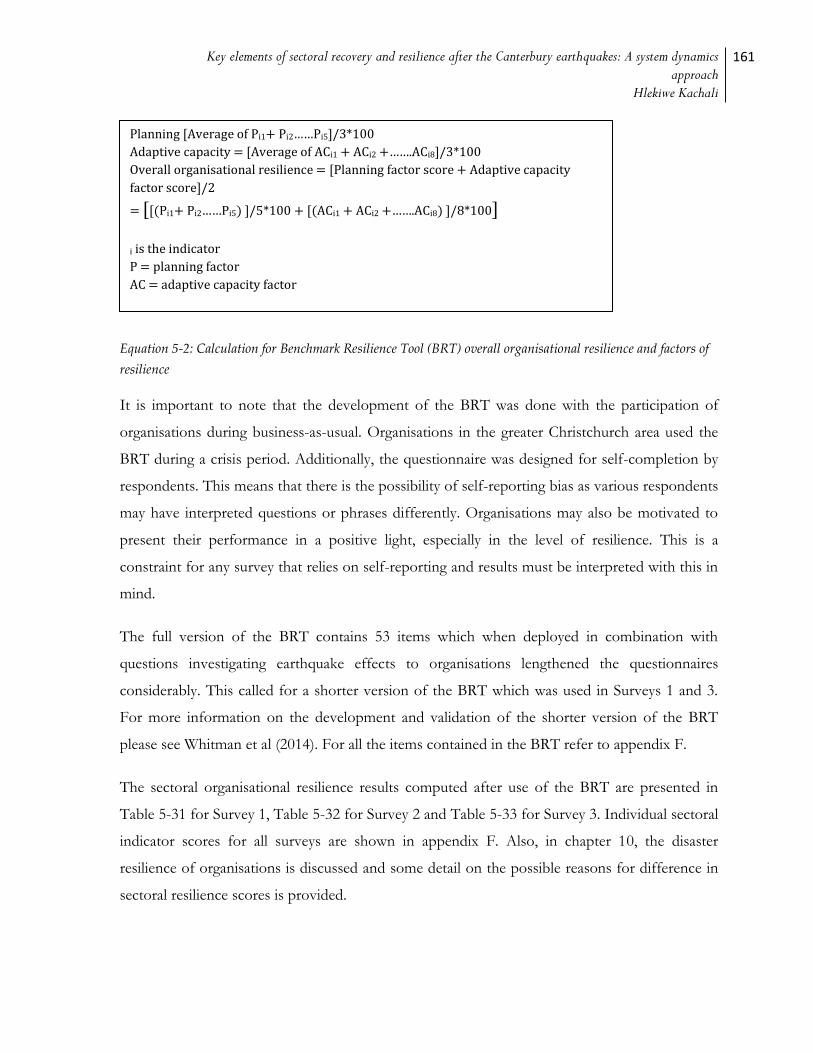
Key elements of sectoral recovery and resilience after the Canterbury earthquakes: A system dynamics approach
Hlekiwe Kachali
161
Equation 5-2: Calculation for Benchmark Resilience Tool (BRT) overall organisational resilience and factors of
resilience
It is important to note that the development of the BRT was done with the participation of
organisations during business-as-usual. Organisations in the greater Christchurch area used the
BRT during a crisis period. Additionally, the questionnaire was designed for self-completion by
respondents. This means that there is the possibility of self-reporting bias as various respondents
may have interpreted questions or phrases differently. Organisations may also be motivated to
present their performance in a positive light, especially in the level of resilience. This is a
constraint for any survey that relies on self-reporting and results must be interpreted with this in
mind.
The full version of the BRT contains 53 items which when deployed in combination with
questions investigating earthquake effects to organisations lengthened the questionnaires
considerably. This called for a shorter version of the BRT which was used in Surveys 1 and 3.
For more information on the development and validation of the shorter version of the BRT
please see Whitman et al (2014). For all the items contained in the BRT refer to appendix F.
The sectoral organisational resilience results computed after use of the BRT are presented in
Table 5-31 for Survey 1, Table 5-32 for Survey 2 and Table 5-33 for Survey 3. Individual sectoral
indicator scores for all surveys are shown in appendix F. Also, in chapter 10, the disaster
resilience of organisations is discussed and some detail on the possible reasons for difference in
sectoral resilience scores is provided.
Planning [Average of Pi1+ Pi2……Pi5]/3*100
Adaptive capacity = [Average of ACi1 + ACi2 +…….ACi8]/3*100
Overall organisational resilience = [Planning factor score + Adaptive capacity
factor score]/2
= [[(Pi1+ Pi2……Pi5) ]/5*100 + [(ACi1 + ACi2 +…….ACi8) ]/8*100]
i is the indicator
P = planning factor
AC = adaptive capacity factor
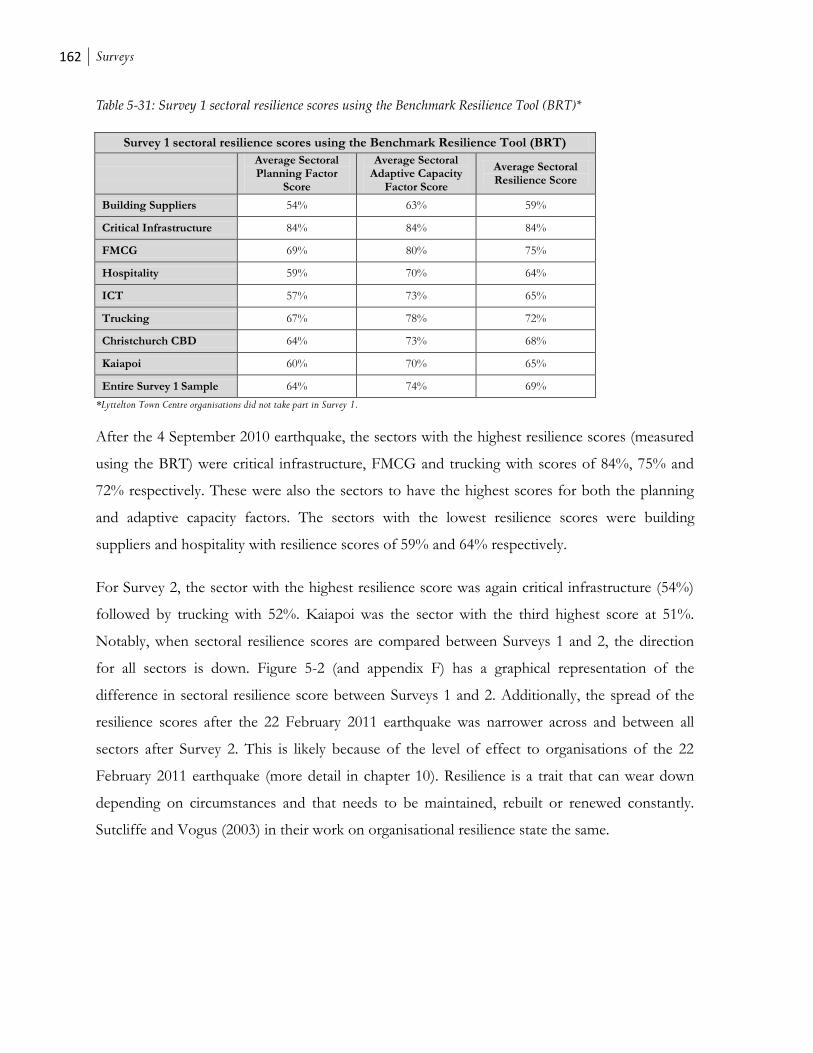
162 Surveys
Table 5-31: Survey 1 sectoral resilience scores using the Benchmark Resilience Tool (BRT)*
Survey 1 sectoral resilience scores using the Benchmark Resilience Tool (BRT)
Average Sectoral Planning Factor
Score
Average Sectoral Adaptive Capacity
Factor Score
Average Sectoral Resilience Score
Building Suppliers 54% 63% 59%
Critical Infrastructure 84% 84% 84%
FMCG 69% 80% 75%
Hospitality 59% 70% 64%
ICT 57% 73% 65%
Trucking 67% 78% 72%
Christchurch CBD 64% 73% 68%
Kaiapoi 60% 70% 65%
Entire Survey 1 Sample 64% 74% 69%
*Lyttelton Town Centre organisations did not take part in Survey 1.
After the 4 September 2010 earthquake, the sectors with the highest resilience scores (measured
using the BRT) were critical infrastructure, FMCG and trucking with scores of 84%, 75% and
72% respectively. These were also the sectors to have the highest scores for both the planning
and adaptive capacity factors. The sectors with the lowest resilience scores were building
suppliers and hospitality with resilience scores of 59% and 64% respectively.
For Survey 2, the sector with the highest resilience score was again critical infrastructure (54%)
followed by trucking with 52%. Kaiapoi was the sector with the third highest score at 51%.
Notably, when sectoral resilience scores are compared between Surveys 1 and 2, the direction
for all sectors is down. Figure 5-2 (and appendix F) has a graphical representation of the
difference in sectoral resilience score between Surveys 1 and 2. Additionally, the spread of the
resilience scores after the 22 February 2011 earthquake was narrower across and between all
sectors after Survey 2. This is likely because of the level of effect to organisations of the 22
February 2011 earthquake (more detail in chapter 10). Resilience is a trait that can wear down
depending on circumstances and that needs to be maintained, rebuilt or renewed constantly.
Sutcliffe and Vogus (2003) in their work on organisational resilience state the same.
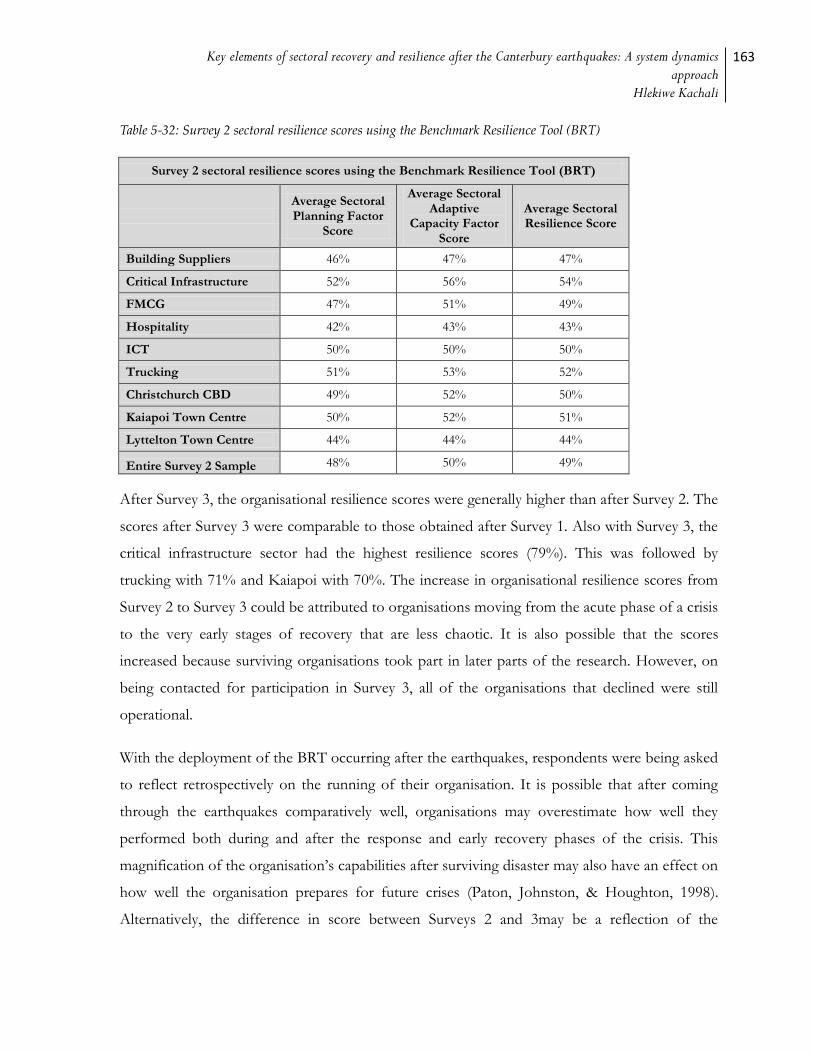
Key elements of sectoral recovery and resilience after the Canterbury earthquakes: A system dynamics approach
Hlekiwe Kachali
163
Table 5-32: Survey 2 sectoral resilience scores using the Benchmark Resilience Tool (BRT)
Survey 2 sectoral resilience scores using the Benchmark Resilience Tool (BRT)
Average Sectoral Planning Factor
Score
Average Sectoral Adaptive
Capacity Factor Score
Average Sectoral Resilience Score
Building Suppliers 46% 47% 47%
Critical Infrastructure 52% 56% 54%
FMCG 47% 51% 49%
Hospitality 42% 43% 43%
ICT 50% 50% 50%
Trucking 51% 53% 52%
Christchurch CBD 49% 52% 50%
Kaiapoi Town Centre 50% 52% 51%
Lyttelton Town Centre 44% 44% 44%
Entire Survey 2 Sample 48% 50% 49%
After Survey 3, the organisational resilience scores were generally higher than after Survey 2. The
scores after Survey 3 were comparable to those obtained after Survey 1. Also with Survey 3, the
critical infrastructure sector had the highest resilience scores (79%). This was followed by
trucking with 71% and Kaiapoi with 70%. The increase in organisational resilience scores from
Survey 2 to Survey 3 could be attributed to organisations moving from the acute phase of a crisis
to the very early stages of recovery that are less chaotic. It is also possible that the scores
increased because surviving organisations took part in later parts of the research. However, on
being contacted for participation in Survey 3, all of the organisations that declined were still
operational.
With the deployment of the BRT occurring after the earthquakes, respondents were being asked
to reflect retrospectively on the running of their organisation. It is possible that after coming
through the earthquakes comparatively well, organisations may overestimate how well they
performed both during and after the response and early recovery phases of the crisis. This
magnification of the organisation’s capabilities after surviving disaster may also have an effect on
how well the organisation prepares for future crises (Paton, Johnston, & Houghton, 1998).
Alternatively, the difference in score between Surveys 2 and 3may be a reflection of the
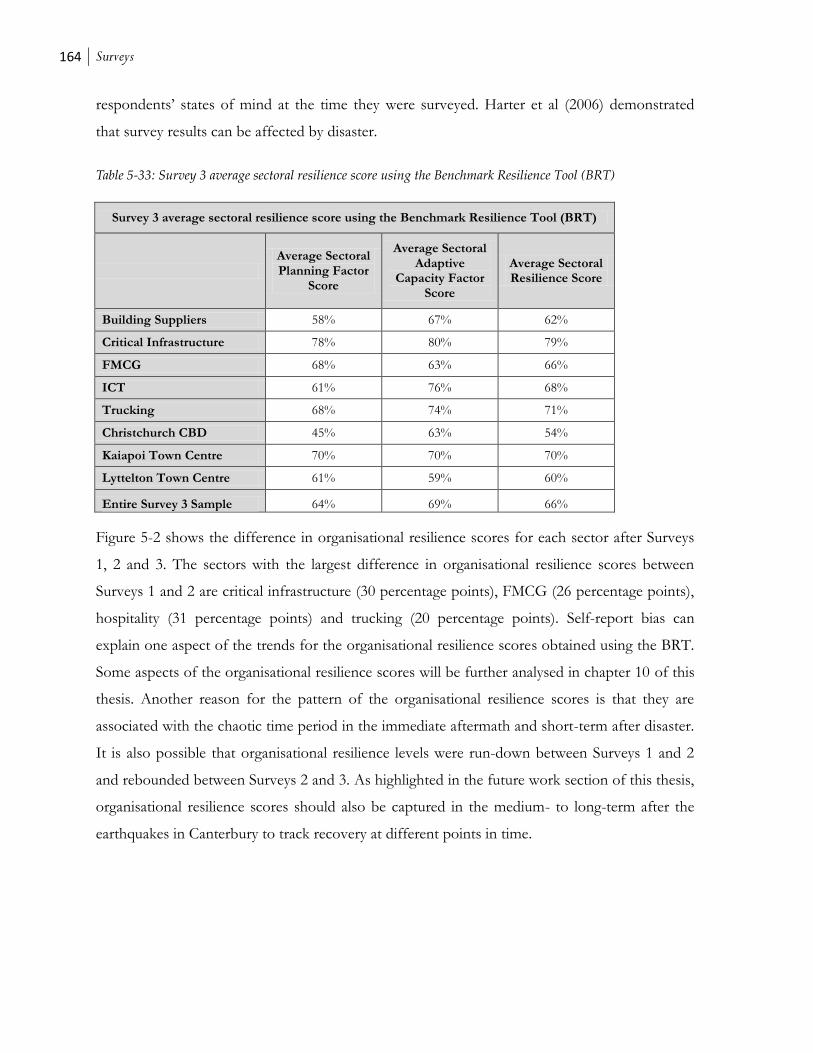
164 Surveys
respondents’ states of mind at the time they were surveyed. Harter et al (2006) demonstrated
that survey results can be affected by disaster.
Table 5-33: Survey 3 average sectoral resilience score using the Benchmark Resilience Tool (BRT)
Survey 3 average sectoral resilience score using the Benchmark Resilience Tool (BRT)
Average Sectoral Planning Factor
Score
Average Sectoral Adaptive
Capacity Factor Score
Average Sectoral Resilience Score
Building Suppliers 58% 67% 62%
Critical Infrastructure 78% 80% 79%
FMCG 68% 63% 66%
ICT 61% 76% 68%
Trucking 68% 74% 71%
Christchurch CBD 45% 63% 54%
Kaiapoi Town Centre 70% 70% 70%
Lyttelton Town Centre 61% 59% 60%
Entire Survey 3 Sample 64% 69% 66%
Figure 5-2 shows the difference in organisational resilience scores for each sector after Surveys
1, 2 and 3. The sectors with the largest difference in organisational resilience scores between
Surveys 1 and 2 are critical infrastructure (30 percentage points), FMCG (26 percentage points),
hospitality (31 percentage points) and trucking (20 percentage points). Self-report bias can
explain one aspect of the trends for the organisational resilience scores obtained using the BRT.
Some aspects of the organisational resilience scores will be further analysed in chapter 10 of this
thesis. Another reason for the pattern of the organisational resilience scores is that they are
associated with the chaotic time period in the immediate aftermath and short-term after disaster.
It is also possible that organisational resilience levels were run-down between Surveys 1 and 2
and rebounded between Surveys 2 and 3. As highlighted in the future work section of this thesis,
organisational resilience scores should also be captured in the medium- to long-term after the
earthquakes in Canterbury to track recovery at different points in time.
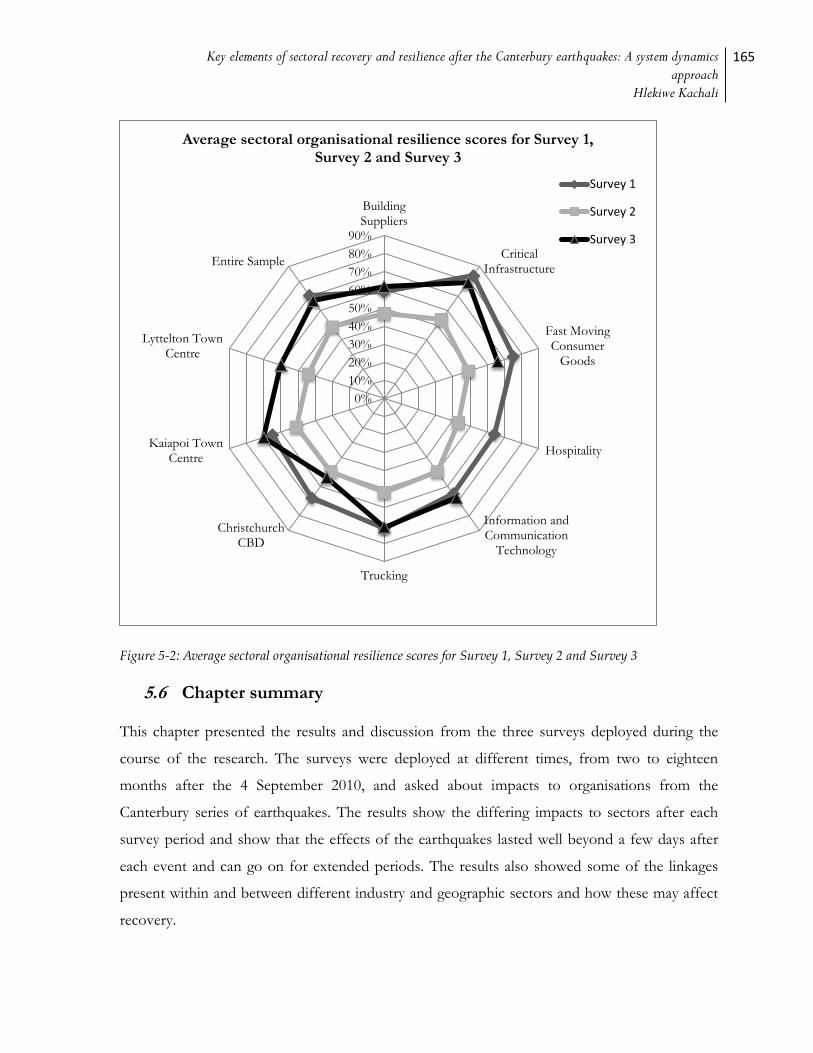
Key elements of sectoral recovery and resilience after the Canterbury earthquakes: A system dynamics approach
Hlekiwe Kachali
165
Figure 5-2: Average sectoral organisational resilience scores for Survey 1, Survey 2 and Survey 3
5.6 Chapter summary
This chapter presented the results and discussion from the three surveys deployed during the
course of the research. The surveys were deployed at different times, from two to eighteen
months after the 4 September 2010, and asked about impacts to organisations from the
Canterbury series of earthquakes. The results show the differing impacts to sectors after each
survey period and show that the effects of the earthquakes lasted well beyond a few days after
each event and can go on for extended periods. The results also showed some of the linkages
present within and between different industry and geographic sectors and how these may affect
recovery.
0%
10%
20%
30%
40%
50%
60%
70%
80%
90%
BuildingSuppliers
CriticalInfrastructure
Fast MovingConsumer
Goods
Hospitality
Information andCommunication
Technology
Trucking
ChristchurchCBD
Kaiapoi TownCentre
Lyttelton TownCentre
Entire Sample
Average sectoral organisational resilience scores for Survey 1, Survey 2 and Survey 3
Survey 1
Survey 2
Survey 3
166 Surveys
After all three surveys, organisations reported that their greatest challenge was the wellbeing of
their staff. This was partly due to the prolonged earthquake sequence taking its toll on staff
leading to fatigue and in some cases mistakes at work. The ongoing earthquakes also made it
difficult to plan for and transition from response to early recovery. Other factors that
contributed (positively or negatively) to organisational recovery after the earthquakes were:
the short or non-existent disruption times for utilities;
the localised damage which enabled relocation for organisations that were able;
the ability of organisations to work together;
neighbourhood effects (especially for the CBD and town centres);
skills shortage for some sectors;
increased workload for some sectors and decreased customer numbers for others;
location of customers (inside or outside the earthquake affected region);
uncertainty of supply, demand and a plan for recovery; and
adaptation to the dynamic conditions, e.g. by modifying delivery of goods and services.
These factors, from the surveys, that affected recovery are comparable to those identified in the
contextual interviews in chapter 4 and those from the case studies in chapter 6.
The next chapter contains the results and analysis from case studies with selected organisations
from each of the industry and geographic sectors in the study. Apart from standing on their
own, the results from the case studies provide explanation for some of the data seen in this
chapter with the quantitative portion of the research. The information in this and the next
chapter will be used in tandem to determine which of three contributors; level of organisational
or sectoral resilience, pre-earthquake conditions or direct and indirect earthquake effects; is the
most significant to organisational recovery for organisations.

Key elements of sectoral recovery and resilience after the Canterbury earthquakes: A system dynamics approach
Hlekiwe Kachali
167

168 Surveys

Key elements of sectoral recovery and resilience after the Canterbury earthquakes: A system dynamics approach
Hlekiwe Kachali
169
6 Case studies
This chapter introduces the case study organisations, presents the results of what issues the case
study organisations faced after the earthquakes and compares how the different sectors were
affected. The case study organisations are a subset of the entire sample group and had two
representatives from each sector. Resource constraints (i.e. time, manpower, finance) meant that
it was not possible to conduct in-depth case studies with the entire sample set. Criteria for
selection of the case study organisations are explained in chapter 3.4. The case studies were
designed to supplement and add to information collected via surveys and contextual interviews.
This is because some qualitative, in-depth information is not as easy to obtain via survey
questionnaires as it is through interviews with affected organisations. Using information from
the case study organisations also allows for a more in depth comparison of how the sectors,
represented by the case study organisations, were affected after the earthquakes: were they
affected differently; were they affected similarly; and the reasons for this. It should be noted that
the semi-structured interview technique was used for both the contextual interviews and case
study interviews. However, apart from the different interviewees, the questions for the two
segments were also different. Appendix A shows the informed interview consent form given to
all interviewees and appendix H is the case study interview guide designed to ensure that the
same baseline topics were covered with each interviewee. The baseline topics are for
comparability between and within sectors.
As the case studies were done after Survey 1, the case studies were also used to corroborate
some of the findings from the data analysis of Survey 1 and from the contextual interviews.
Additionally, with the utilisation of case studies the researcher heard first hand from the
organisations involved their description of events before, during and after the earthquakes and
specifically how the organisations dealt with the different phases after the earthquakes.
Understanding the recovery of the individual organisations enables the understanding of the
recovery of the industry sector they belong to as well as what other agents they might affect or
be affected by. The case study information, divided into the main-dimensions and sub-themes, is
further used as one of the sources for the modelling of the system shown in chapter 8. The main
dimensions and sub-themes are also used in the examination of system behaviour and for the
170 Case studies
extraction from the system of the aids, hindrances and points of intervention in recovery
(chapter 9).
The method used in the case study part of this study is outlined in section 3.4.4. The analysis was
done using a modified version of Strauss and Corbin's (1998) grounded theory coding paradigm
which outlines a logical way of gathering and ordering concepts or grouping of similar data.
Grounded theory uses main dimensions, which can be divided further into sub-themes, to better
organise data that falls within different groups.
This chapter starts with a description of the case study organisations and a synopsis of the
important attributes of the case study set. This is followed by the results from analysis of the
case study data, presented as the main dimensions and sub-themes, i.e. in what areas the sectors
were affected. Results and analysis are interspersed with significant quotes from interviewees.
The chapter ends with a comparison of the similarities or differences in how the sectors were
affected.
6.1 Case study organisations
Presented here are details of each of the case study organisations in this research. In order to
maintain confidentiality and anonymity, any identifying characteristics have not been given here.
Each interviewee signed an interview consent form (see appendix A) that informed them of the
confidential and anonymous fashion the information would be presented in. Each sector in the
study had two representative case study organisations. Each organisation was asked to provide at
least two interviewees, if possible from two different departments in the organisation. This was
to give a broader overview of how the organisation was affected by the earthquakes. Some
organisations provided only one interviewee while others provided two.
Additionally, each case study organisation was asked to provide details of the number of
employees prior to the 22 February 2011 earthquake. Depending on the type of organisation
(branch, subsidiary, standalone), some of the answers for employee numbers in this section are
for the branch of the organisation the interviewee was answering on behalf of, while others are
for the entire organisation.

Key elements of sectoral recovery and resilience after the Canterbury earthquakes: A system dynamics approach
Hlekiwe Kachali
171
Building suppliers
BS1: BS1 is a light manufacturing building supplier and has full time equivalent (FTE) staff of 80
in Christchurch. The organisation is half owned by an overseas company while the other half is
publicly listed. BS1 has multiple branch organisations in New Zealand, with a head office in
another city. The organisation has a functional role in head office specifically for organisational
crisis management. Prior to the 4 September 2010 earthquake, BS1 had a documented
emergency plan. They reported that for a manufacturing organisation, emergency planning
which includes a strong emphasis on health and safety is crucial. BS1 provided specialist
counselling services to staff and their families after the 22 February 2011 earthquake.
After the 22 February 2011 earthquake, BS1 in Christchurch got assistance from other branches
that sent supplies such as water and food that were then provided to staff in Christchurch. The
organisation reported that compared to other organisations or industries, BS1 was affected to a
minor extent after the earthquakes. However, they also reported delayed re-opening after the 22
February 2011 quake due to difficulties securing geotechnical and structural engineering
personnel to carry out the large number of inspections in the greater Christchurch area. They
further reported that they used contacts in their industry to get the technical inspections done
quicker. BS1 pointed to quick building inspections as crucial because of the closure of their
factory and office complex, for geotechnical and structural assessment work, after all
earthquakes over Mw 5.5.
BS1 worked with Civil Defence and with some of the critical infrastructure providers in the
response and early recovery phase after the 22 February 2011 earthquake. They provided
supplies for search and rescue as well as materials used to repair breaks in water and wastewater
pipes. Due to high demand, the organisation ran out of the supplies for the pipes and had to
look overseas for more stock.
Post-earthquakes, BS1 was affected by the uncertainty in the construction industry. They
reported that this made it difficult to make long term strategic plans regarding the rebuild. BS1
carried out a review of their emergency response and identified some areas to be worked on.
One of the areas for improvement was evacuation: how to ensure that people have left the site
and to verify their wellbeing in a timely fashion thereafter.
172 Case studies
BS2: BS2 has an FTE of 44 and is a wholly owned subsidiary of a larger New Zealand
organisation. They are a wholesale building supplier and reported being affected by the global
financial crisis. BS2 reported being relatively unaffected by either the 4 September 2010 or 22
February 2011 earthquake because of their location in the north-west of Christchurch. The
organisation also reported the possibility of getting assistance from their owner if the need arose.
BS2 has branches in other parts of New Zealand’s South Island. They detailed that if the
Christchurch plant were shut down, the combined capacity of the other branches could make up
for the shortfall in production. BS2 reported being affected by the uncertainty around when the
major part of the rebuild would start. The organisation narrated that they were able to supply
after earthquakes but there was little demand for their product.
BS2 used in-house civil engineers to check their premises for damage and subsequently to check
all employee houses. They then deployed these engineers to help with geotechnical and
structural assessments for the greater Christchurch area. BS2 organised counselling for their staff
on the organisation’s premises. This counselling was extended to family of staff as well.
Prior to 4 September 2010, the organisation did not place much emphasis on emergency
planning even though they had regular fire drills. The organisation reported that after the 4
September 2010 earthquake, they recognised that their emergency planning needed
improvement and were in the process of reviewing these plans. Also using the earthquakes as an
opportunity, BS2 were planning to outsource their logistics function. They cited increased
vehicle maintenance costs and the need to concentrate on their core business as reasons for this.
However, of concern to the organisation was the possible shortage of skilled labour (especially
heavy vehicle truck drivers) which would affect the construction industry when the rebuild got
underway. In readiness for the rebuild the organisation budgeted for staff hire and training and
redesigned some of their products to align with revisions in the building code.
Critical infrastructure
CI1: CI1 is a transport provider and has just over 250 FTE staff. They are owned by a larger
organisation but have an independent commercial board of directors. Their main office is in the
Christchurch CBD. The organisation reported no previous crisis experience. Prior to 4
September 2010, the organisation had a business continuity plan that they reported did not
specifically include earthquakes but considered hazards such as floods and power outages.
Key elements of sectoral recovery and resilience after the Canterbury earthquakes: A system dynamics approach
Hlekiwe Kachali
173
The organisation reported being more affected by the 22 February 2011 earthquake. Earthquake
damage to one of their workshops led to the extension of another of their buildings for use as a
workshop. CI1 detailed that their equipment could operate after 22 February 2011 but that they
were affected by the condition of the roads. They also pointed to increased maintenance costs
after earthquakes because of damage to roads. The organisation was further affected by
congestion on the roads due to reduced road capacity after the earthquakes. Additionally, CI1
narrated that customers reduced by approximately 40% post-earthquakes because of the
relocation of organisations and people to different parts of the city. Other effects were as the
result of damage and closure to Lyttelton Port. As part of managing the crisis after the
earthquakes, CI1 put on special services to cater for temporary route changes that had taken
place.
CI1 recognised that in the longer-term recovery period, the organisation would be affected by
population shifts and land use planning decisions. These shifts in population would also require
modification of existing services or the addition of new services. CI1 reported that one of the
aids in recovery for them was having a mature workforce that could handle crisis. Some
considerations in response and early recovery included making sure that no staff were made
redundant.
CI2: CI2 is a government department with a FTE staff of 26. They reported that in considering
their mandate, they were not very affected by the earthquakes. They were however affected in
the 22 February 2011 earthquake because their CBD offices were damaged. CI2 was affected by
restricted access to their CBD office as this meant that they could not access some
organisational information and specialised equipment. The organisation had both emergency
plans and business continuity plans. They reported that in the lifetime of the organisation, there
was some prior crisis experience but that these crises had been caused by other hazards such as
floods.
CI2 worked closely with Civil Defence in response and early recovery. They detailed that some
of their work with Civil Defence involved the modification of by-laws to suit the disaster
environment. They also brought experts in from their Auckland office to help manage the
response. The organisation reported that some of their repair work was affected by the ongoing
174 Case studies
earthquakes. In addition, the extra work done after the earthquakes increased the department’s
costs.
Post-earthquakes, CI2 related how they lost some of their qualified staff to private contractors in
the same line of work. They reported that they recognised that they could not compete to retain
staff based on salary as government roles have such details pre-defined. Instead, they wanted to
work on the environment inside the organisation as a way of retaining people. The organisation
reported that their future plans would also be affected by decisions on land use.
The organisation managed to relocate to new premises after the 22 February 2011 earthquake.
They also conducted a formal review of their actions in the response phase. Some areas for
improvement included the management of information and communication as well as
succession planning and relief for people in the response phase of a crisis. Pre-disaster
networking also emerged as important: particularly the awareness that it is people in
organisations who connect and not necessarily the organisation as an entity.
Fast Moving Consumer Goods (FMCG)
FMCG1: FMCG1 is an independent chain of service stations and associated retail outlets that
are part of a franchise. They are performance managed by the franchise and do not have to
follow franchise regulations to the letter. They have a FTE staff of 58 in eight locations in the
greater Christchurch area. As a consequence of the industry sector they belong to, health and
safety are taken very seriously. Prior to the 4 September 2010 earthquake, FMCG1 conducted
monthly trial evacuations and had a designated safety officer at each of their locations. The
organisation reported having very devolved decision making for each site and no prior
experience of a large crisis.
FMCG1 reported not having business interruption insurance because they did not think all eight
locations would be affected at the same time. The organisation was affected in different ways by
the 4 September 2010 and 22 February 2011 earthquakes. For 4 September 2010, they narrate
that it was more staff and their families who were affected and operations were restarted quickly.
After the 22 February 2011 earthquake, both people and the physical infrastructure of the
organisation were affected. Operations did not restart as quickly as in 4 September 2010, in part
because of a shortage of geotechnical skills to carry out inspections.
Key elements of sectoral recovery and resilience after the Canterbury earthquakes: A system dynamics approach
Hlekiwe Kachali
175
FMCG1 provided staff with supermarket vouchers after both the 4 September 2010 and 22
February 2011 earthquakes. This was in addition to the offer of counselling services. In
reviewing their actions in the response and early recovery phase, FMCG1 modified their internal
methods of communication. They upgraded their physical communication system as well as their
data management system and also instituted different measures of communication between
people in the organisation in the event of a crisis. After the 22 February 2011 earthquake,
EFTPOS (electronic point of sale) terminals did not work in some parts of the greater
Christchurch area. As a result, FMCG1 gave away product to customers for free until EFTPOS
service was restored or until goods ran out.
FMCG2: FMCG2 is wholly owned by a multinational corporation. It has multiple branches in
New Zealand and FTE staff of 53. The New Zealand part of its business is the supply of goods;
manufacturing of these goods is done in Australia and parts of Asia. The organisation reported
not knowing of any documented organisational emergency plan. However, they did have plans
for first aid and for security threats. The interviewee also reported having no knowledge of
organisational business continuity plans. It appears this may be because of their being a branch
organisation and the expectation that head office looked after such matters. FMCG2 reported
having no prior disaster experience.
After the 4 September 2010 earthquake, FMCG2 was affected by warehouse damage at two
levels. The first was damage to their own (third party run) warehouse as well as stock, and the
second was damage to customer warehouses and stock. Damage to customer warehouses meant
that FMCG2 could not deliver supplies to these warehouses. Damage to customer stock led to
an increase in demand for new supplies. Collaboration with the customer led to the delivery of
supplies directly to retail outlets. This required re-packaging of stock in quantities suitable for
smaller deliveries. Other collaboration with customers was in the form of identification of goods
needed in the response phase. They agreed to scale down on low volume sellers in order to bring
in more of needed goods.
FMCG2 reported that in the response phase, they were aware of which of their competitors
could not manage to meet demand. However, they did not take advantage of this in part because
this segment of the sector has only a few players and they would need to work with each other

176 Case studies
after the earthquakes. FMCG2 helped in the response effort by donating goods to the Red
Cross. FMCG2 reported that they had not done a formal review of their response to the
earthquakes but had spoken about it informally.
Hospitality (bars, cafes and restaurants)
H1: H1 is a franchise that was based in the CBD and had a FTE staff of 6.5. The organisation
was located in the CBD because of the large number of employers based there as well as other
foot traffic. H1 reported not having emergency or crisis plans prior to the 22 February 2011
earthquake and no prior crisis experience. However, they did have plans for power outages.
They reported that these plans were not helpful after the earthquakes. H1 did not have
computer data back-ups of key information. However, they reported that their head office had a
record of all daily transactions which they could use for tax purposes.
After the 4 September 2010 earthquake, H1 experienced a 20% drop in revenue because some
employers evacuated from the CBD area. After the 22 February 2011 earthquake, the
organisation lost their premises. H1 made arrangements for some employees to work in other
franchises locations on the proviso that they would return when the organisation re-opened. The
interviewee felt that, in general, there was too much bureaucracy in getting hospitality
organisations relocated and re-opened. They felt that the advice on insurance and legal issues
from the franchise owner was helpful. However, H1 reported that they did not think advice
from the industry association was helpful.
At the time of the interview (14 November 2011) H1 was looking for alternative premises to
relocate to outside the CBD area. They were however affected by the inability to access their
premises and equipment which were within the CBD cordon. The lack of information and
inconsistent information around building access was a source of frustration for H1. Access to
the premises was also needed so they could document damage for insurance purposes as part of
the relocation process. By the time the organisation accessed their premises, they had been
looted and vandalised. The organisation had good insurance cover but was affected by the delay
in settlement of their claim.
H2: In the 4 to 5 years leading up to the 4 September 2010 earthquake, H2 had bought out of a
franchise and gone through a period of rebranding. The rebranding involved the development of

Key elements of sectoral recovery and resilience after the Canterbury earthquakes: A system dynamics approach
Hlekiwe Kachali
177
a niche market in the hospitality sector. The organisation had a FTE staff of 6. The organisation
had documented plans and drills for fire but no other emergency plans. They also reported
having no prior crisis experience.
After the 22 February 2011 earthquake, H2’s premises were green-tagged (safe to enter) but in
the fall zone of other buildings in the CBD. H2 reported being affected by lack of access to their
premises as they had difficulties getting permission to enter the CBD cordon. At the time of
interview (15 November 2011), all of H2’s employees left H2 and were working in other
organisations. Prior to this, the organisation accessed the Earthquake Support Subsidy (ESS)
provided by Central Government.
H2 was willing to relocate but could not as their insurance company preferred to know the long-
term plan for the CBD before signing off on relocation. This was also one of the reasons given
by the insurance company in delaying settlement of their claim in full. However, H2’s
reoccupation of their old premises was also dependent on decisions by the building owner.
Additionally, H2 detailed that going back to the CBD was equally dependent on the overall plan
for the CBD rebuild. This is because the organisation was formerly reliant on custom from the
now relocated employees of large employers, as well as foot traffic into the area.
Considering the length of time the organisation was closed, health and safety laws decree that
the equipment should be disposed of. H2 reported that in case of their agreeing to an insurance
settlement, it would be based on the present value of equipment. However, if the organisation
re-opened or relocated, the insurance company would have to pay for new equipment. After the
22 February 2011 earthquake, H2 worked with some of the other business owners from the
same vicinity of the CBD. This was for the purposes of information sharing and support. H2’s
owner also kept in regular contact with the organisation’s former employees.
Information and Communication Technology (ICT)
ICT1: ICT1 is a manufacturing ICT organisation with FTE staff of 135. They are a subsidiary of
a multinational corporation. The organisation reported that prior to the earthquakes, they had
been affected by the shift of manufacturing to places with lower labour rates, e.g. China. ICT1
had no previous crisis experience but had very detailed emergency, crisis and business continuity

178 Case studies
plans formulated to enable response to different hazards. The organisation reported that the
plans were of value in that people knew what to do in the immediate aftermath of the
earthquakes. However, the interviewee spoke of gaps in the plan in relation to employees
accessing their personal belongings such as mobile phones and keys, which could not be taken
onto the shop floor, and also in procedures to safely re-enter the building. ICT1 has a focus on
staff health and safety.
The 22 February 2011 earthquake caused considerable damage to ICT1’s premises and
equipment. However, the organisation was operating again approximately two to three weeks
after the earthquake. They reported that they could have opened sooner had they been able to
have their premises inspected quicker by geotechnical personnel. Despite this delay, ICT1
managed to supply spare parts to critical infrastructure organisations in the response phase. The
organisation narrated running out of spare parts that are usually not replaced frequently during
business-as-usual. ICT1 reported that they were also very aware of when and how their other
customers (especially those outside Christchurch) would be affected by disruption to the supply
web. This timeline was affected by ICT1 not knowing what condition their manufacturing
equipment was in as they could not access their premises. The organisation reported that the
equipment they use is not available in New Zealand and has a three month lead time when
ordered. In order to meet demand, ICT1 prioritised customers in their supply chain and worked
overtime to catch up on lost production. They also reported that they met with their non-
Christchurch customers to reassure them of continued ability to supply. ICT1 had mutual aid
agreements for location sharing. However, any alternative location was only helpful to a point as
the manufacturing equipment was on ICT1’s main premises.
ICT1 reported that the damage to their premises, worth hundreds of thousands of dollars, had
to be paid for from local profits. This was because the excess on their organisation’s corporate
insurance policy was larger than the damage to the Christchurch plant. However, ICT1 could
not make major repairs to their buildings as the area they were in had liquefiable soils. They
therefore had to wait for more extensive geotechnical inspections before knowing if they could
repair the building or had to move to new premises altogether. ICT1 detailed that all pre-
earthquake expansion plans had been put on hold as the funding for these was directed to
earthquake repairs. The organisation applied to the New Zealand Ministry of Science and
Innovation (MSI) for a recovery grant to help pay for the resumption of expansion plans.
Key elements of sectoral recovery and resilience after the Canterbury earthquakes: A system dynamics approach
Hlekiwe Kachali
179
ICT1 set up an earthquake fund for staff. They also engaged counsellors to work from the
organisation’s premises readily available for staff. ICT1 conducted an official review of their
response after both the 4 September 2010 and 22 February 2011 earthquakes. The organisation
recognised that they had good evacuation plans but no re-entry procedures. Re-entry procedures
and Tsunami evacuation plans were added to the reviewed crisis plans. Other measures included
all employees, not just those on the shop floor, signing in and signing out as a way of keeping
track of who was on site. Further, staff on the shop floor were allowed to have their keys and
mobile phones with them, which pre-earthquakes were kept in lockers in a different part of the
premises. This was to avoid staff going back into a potentially unsafe building to retrieve these
items or delaying getting out because they needed to look for them. ICT1 also reported that
other actions from the review centred on better communication in crisis and better succession
planning.
ICT2: ICT2 provides professional, specialised ICT services to other sectors such as health. They
are a wholly owned, privately held New Zealand company with an Australian subsidiary. Their
main office is in Christchurch with a small branch in Auckland and they have FTE staff of 31.5.
Prior to 22 February 2011, ICT2 was located in the CBD. In their field, ICT2 have a large
segment of the New Zealand market and approximately 30% of the Australian market.
ICT2 reported having a combined emergency and business continuity plan that was incomplete
and had been in development (slowly) for a long time prior to the 4 September 2010 earthquake.
The organisation reported that this plan fell far short of what was needed especially for an event
such as the 22 February 2011 earthquake. The organisation had a skills shortage prior to the
earthquakes and this was magnified after. In fact, ICT2 reported that experienced staff
voluntarily left the organisation because of the earthquakes.
After the 22 February 2011 earthquake ICT2’s premises were red tagged. The organisation
reported having trouble finding suitable accommodation to relocate to until August 2011. While
looking for accommodation, some staff were sent to work from the Australian office. Other
staff worked from home which they said affected their family relationships. They reported that
working from home for such long periods blurred the boundaries between work and home.
However, added to the shared experience of the earthquakes, working from the non-office
180 Case studies
environment of a co-worker’s home brought people even closer together and enhanced team
bonding. Team bonding was also reinforced because team members had the common goal of
wanting their organisation to recover.
ICT2 reported that they had problems accessing their premises after both the 4 September 2010
and 22 February 2011 earthquakes. This was because they were not allowed to enter the
cordoned area to retrieve business critical material and to restart equipment. After the 4
September 2010 earthquake, ICT2 faced the issue of not being able to access critical records
stored on their premises. Between the 4 September 2010 and 22 February 2011 events, ICT2
augmented their backup practices and also engaged another organisation to look after their
information technology (IT) system backup. However, after 22 February 2011, the organisation
looking after ICT2’s IT backup sustained damage to their premises and equipment. This meant
that for a time after the 22 February 2011 earthquake, ICT2 had problems retrieving some
organisational records. Additionally, as a result of building damage after the 22 February 2011
earthquake, ICT2 lost some organisational information in paper form. As a short-term measure
after 22 February 2011, ICT2 housed some of their technical equipment in seismically retrofitted
customer premises.
ICT2 detailed that their customers paying bills before the due date was a help in recovery.
Another aspect helpful in response and early recovery was that senior management were from
Christchurch and had also been affected by the earthquake. The interviewee reported that staff
felt this helped with some of the decision making. The Earthquake Support Subsidy (ESS) was
also a major boost. Additionally, ICT2 made the decision that even in the absence of complete
records, all staff would still be paid based on the last pre-earthquake payroll instructions to the
bank. ICT2 also ensured that all staff knew that they had access to counsellors. Employees were
given extra leave days, in addition to the statutory leave days, in order to sort out earthquake
issues.
ICT2 reported that their organisational expansion plans were put on hold while they assessed
their situation after the earthquakes. In a review of the organisation’s emergency plan, ICT2
identified that the staff communication plan for the response phase needed improvements. As
well, the organisation recognised that there had to be a trade-off between what preparedness
planning they could engage in relative to the size of the organisation.

Key elements of sectoral recovery and resilience after the Canterbury earthquakes: A system dynamics approach
Hlekiwe Kachali
181
Trucking
T1: T1 is part of an Australian multinational corporation and has FTE staff of 2500 in New
Zealand and 500 in Christchurch. The organisation’s head office is in Auckland. T1 reported
that they are in a very competitive market segment. The organisation also reported that it is the
largest in its subsector in NZ and that they have a diverse business portfolio. T1 reported not
having any documented crisis plans but did have an undocumented organisational response
mechanism for crisis because of prior experience with other hazards such as floods and fires.
The organisation reported that their senior management team was very good at dealing with
crisis.
After the 22 February 2011 earthquake, T1 worked closely with Civil Defence who required their
services. They also coordinated, for the trucking sector, sectoral activity in the aftermath of both
the 4 September 2010 and 22 February 2011 earthquakes. They noted that this had to be done
diplomatically to maintain good relations post-earthquake. As a result of an increase in demand
for their services, T1 brought in resources from other New Zealand branches. This was in
addition to dealing with their business-as-usual customers, some of whom had been adversely
affected by the 22 February 2011 earthquake. T1 reported that they prioritised customer work
depending on the importance of the customer.
The organisation mobilised resources to assist staff, especially after the 22 February 2011
earthquake. This assistance was in the form of a welfare fund for staff that qualified as well as
shower and laundry facilities. The organisation also organised a team to visit each staff member’s
house to assess recovery needs. Part of helping staff involved monitoring staff workload after
the increased demand for organisational services led to staff working longer hours.
T1 was affected by damage to roads and reported that they had to carry out more frequent
maintenance on their fleet. Other effects included increased traffic which led to congestion and
more time on the road. The organisation reported that the land reclamation in Lyttelton was a
help in the response phase as this meant they could dispose of demolition waste quicker and not
stockpile it on demolition sites which would have slowed down the demolition work. However,
in working with Civil Defence, T1 feel that the transition between the response and recovery

182 Case studies
phases was not done well. This is because the information for demolition and associated work
was unclear or non-existent during the transition phase.
T1 saw the need to expand some of their operations after the 22 February 2011 earthquake in
order to meet demand and provide better service. This increased demand and scaling up of
services resulted in higher revenues for the organisation. T1 conducted a semi-formal review of
the response actions and disseminated this information to all their New Zealand offices.
T2: T2 is a public-private-partnership (PPP). They provide an essential service and have FTE
staff of 45. The organisation had emergency plans prior to the 4 September 2010 earthquake.
They also had a business-as-usual independent telecommunications system which was helpful
for communication in the response phase.
After the 4 September 2010 earthquake, T2’s customers were severely affected which then
affected the organisation. After the 22 February 2011 earthquake, due to industry sector or
location, T2’s organisation’s customers were less severely affected. However demand for T2’s
services increased dramatically. They were assisted in meeting this increased demand by staff
from their other New Zealand offices as well as from contractors. Even then, staff still worked
long hours to meet demand. The organisation set up a welfare scheme for staff which included
an earthquake fund that staff could apply for. T2 also organised food, water, shower and laundry
facilities for staff and their families.
T2 reported that until September/October 2011, they were affected by the erratic nature of
demolition activity, especially from the CBD. This affected some of the organisation’s forward
planning. T2 carried out a review of its response and found that prior good relations with other
organisations were a help in response and early recovery. The organisation also reported that
they were in the process of setting up a shared resource database with other sister companies.
This is so that all branches would be aware what resources were available to them in case of
emergency.
Christchurch CBD
CCBD1: CCBD1 is a New Zealand owned company with branches around the country. Its
headquarters and main distribution centre are in Christchurch. Prior to 4 September 2010, the

Key elements of sectoral recovery and resilience after the Canterbury earthquakes: A system dynamics approach
Hlekiwe Kachali
183
organisation had no documented crisis plans and no prior crisis experience. The stock in
CCBD1’s Christchurch stores was uninsured. This decision was reached after the organisation
decided it was better to insure stock in Wellington branches as that was a higher seismic risk
than Christchurch. CCBD1 reported being more affected by the 22 February 2011 earthquake.
Of the three branches in Christchurch, the premises for two of them were severely damaged in
the earthquake. With the closure of two stores in Christchurch, CCBD1 made the decision to
cancel stock orders for March and reported that this affected their suppliers negatively. As part
of the response, one of the management team based in Auckland was brought in to assist staff in
Christchurch.
CCBD1 reported that they had difficulty accessing both of their CBD premises as they were not
allowed to enter the cordoned off area. Access to the stores was required to verify the conditions
of the stores and to retrieve millions of dollars’ worth of stock. The organisation also detailed
that they got conflicting information for entry procedures to the CBD Red Zone.
CCBD1’s third Christchurch branch had become operational approximately 1 month prior to
the 22 February 2011 earthquake. Staff from the two branches not in operation were transferred
to the third branch to avoid redundancies. The organisation reported that the Central
Government Earthquake Support Subsidy (ESS) was one of the contributors that enabled the
retention of all staff. After the 22 February 2011 earthquake, one of the top recovery priorities
for CCBD1 was business interruption for their other branches as the main distribution centre
was in Christchurch. However, in the first few days after the 22 February 2011 earthquake, their
couriers did not travel outside the Christchurch region which made it difficult to ship stock to
non-Christchurch branches. The organisation’s other priorities included the provision of
equipment to earthquake search and rescue teams.
CCBD1 expressed that they were interested in going back to the CBD but did not know when as
there was uncertainty surrounding when and how the CBD would be rebuilt. CCBD1 also
indicated that the lack of information on the selection process for the organisations involved in
the CBD’s Re:Start Project made it difficult to know what the rebuild plan for the CBD was.
This was a factor in the extension of the lease agreement on their third, newly opened,
Christchurch branch. Another factor was that their customers had got used to visiting the new
184 Case studies
store and there were plenty of support and professional services that had also set up in the area.
CCBD1 pointed out that they had been in talks with their competitors to find out if these other
organisations were willing to go back to the CBD. The collaboration with competitors came
about in part because they have a shared customer base which benefits all parties when they are
in the same vicinity.
CCBD1 added that the 4 September 2010 earthquake was a wake-up call for them to review
their emergency plans and how they delivered goods and services. They initiated a formal review
of these issues post-September 2010. This review was ongoing at the time of the 22 February
2011 earthquake. After 22 February 2011, the organisation also started trading online and was
able to reach a wider customer base.
When asked, CCBD1 did not provide employee numbers. No reason was given.
CCBD2: CCBD2 is a New Zealand owned organisation with FTE staff of 18 in the
Christchurch area. They provide specialised equipment and rely predominantly on customer
discretionary spending. CCBD2 had no documented emergency plans and no crisis experience
before 4 September 2010. Prior to the 4 September 2010 earthquake, CCBD2 and all their major
competitors were in close proximity to each other in the CBD.
After the 4 September 2010 earthquake, CCBD2’s store was in the fall zone of another building;
this led to the closure of the store for a period of time. After the 22 February 2011 earthquake
the organisation’s premises were badly damaged and closed. The organisation relocated after
overcoming the challenge of finding new premises they could lease short-term (to 2014). The
reason for the short-term lease was because they still had a lease on their damaged Christchurch
store. The organisation expressed that the uncertainty surrounding the rebuild of the CBD made
it difficult to negotiate out of their lease. Also, CCBD2 felt that it would have been easier to
break their lease and to get their insurance settlement if their premises had fallen completely and
if the stock had been damaged. Because the building was yellow-tagged (restricted use and
access), the insurance company communicated that they had to wait for the building inspector’s
report and retrieve stock.
In their new location, CCBD2 used advertising to inform the public of their new premises and
reported that their being a destination business was a help in getting their customers back. In the
Key elements of sectoral recovery and resilience after the Canterbury earthquakes: A system dynamics approach
Hlekiwe Kachali
185
aftermath of the 22 February 2011 earthquake, they travelled to customers’ premises as a way of
delivering goods and services. CCBD2 was affected by the reduced arts and entertainment
locations in Christchurch. This is because both the arts and entertainment venues and the
customers who frequented them were some of CCBD2’s main customers. CCBD2 were also
affected by reduced customer discretionary spending.
CCBD2 felt that there was a lack of support from their corporate office but that this allowed
them to make their own decisions. In addition, the staff in the Christchurch store said they felt
underappreciated after all the effort to get new premises operational. At the time of the
interview (31 January 2012), the manager for the Christchurch store said he was planning a
formal review of the organisation’s actions in response. However, this had not taken place as a
large percentage of time was taken up getting the new store up and running. This was crucial to
keep staff employed.
Kaiapoi Town Centre
KTC1: The organisation provides specialised, non-substitutable services and is an independent
organisation. However, KTC1 belongs to a family of similar independent organisations based in
different parts of New Zealand. In the history of the organisation, interviewees reported that the
only other large crisis the organisation may have faced was in the 1940s. However, none of the
current staff had been there for that crisis. KTC1 reported having emergency for plans for fire
and pandemics but did not have documented business continuity plans.
KTC1 was affected differently by the 4 September 2010 and 22 February 2011 earthquakes. The
4 September 2010 earthquake caused physical damage to the building and assets of their Kaiapoi
branch. The 22 February 2011 earthquake affected them by way of an increased demand for
their services. After the 22 February 2011 earthquake, in addition to dealing with business-as-
usual KTC1 worked closely with Civil Defence in response and early recovery. After the 22
February 2011 earthquake KTC1 reported collaborating with other Christchurch organisations
from their sector. They also had offers of assistance from their sister organisations outside
Christchurch and reported that it was good to know that the assistance was available, even if
they did not use it.

186 Case studies
In reviewing their actions in response, KTC1 expressed that the organisation came to the
conclusion that they did not need to change much of their existing arrangements. For longer-
term recovery however, KTC1 detailed that they would be affected by population and land use
decision plans.
When asked, KTC1 did not provide information on employee numbers.
KTC2: KTC2 is operated by its owner who occasionally works with a partner. Apart from the
owner, KTC2 has no other employees. The organisation reported not doing well financially prior
to the 4 September 2010 earthquake because of the global financial crisis (GFC). This is because
one of their primary clients, the agricultural sector in Canterbury, was affected by the GFC. The
owner reported that the organisation had inadequate insurance cover because they could not
afford the insurance premiums and that the organisation did not have prior crisis plans. KTC2
was located in Kaiapoi because of more affordable commercial accommodation while still being
in close proximity to Christchurch.
After the 4 September 2010 earthquake the organisations offices were damaged but usable. After
the 22 February 2011 earthquake, the organisation’s offices were severely damaged and closed.
The organisation was further affected by the shortage in geotechnical personnel as they had to
wait for technical inspections before they could access their premises to retrieve specialist
equipment and organisational records. The organisation had back-ups of its electronic but not
paper records. KTC2 eventually relocated but cited that this was a major cost.
KTC2 were indirectly affected by insurance delays as their customers who were waiting for
insurance claim settlements could not pay them. The organisation reported that they were
planning to expand their operations prior to the 4 September 2010 earthquake but that these
plans had been put on hold. KTC2 applied to New Zealand’s Ministry of Social Development
(MSD) for a monetary grant to help with cash flow.
For longer-term recovery, KTC1 reported being aware of the need to network more as a way of
hearing about upcoming work. This was especially important considering the small size of the
organisation. However, one of the post-earthquake options being considered by the organisation
was to close and move out of the Canterbury region.
Key elements of sectoral recovery and resilience after the Canterbury earthquakes: A system dynamics approach
Hlekiwe Kachali
187
Lyttelton Town Centre
LTC1: LTC1 is owner operated, has no staff apart from the owner and deals in semi-luxury
goods. The organisation was located in Lyttelton because the owner has strong ties to the town.
Prior to the 22 February 2011 earthquake, LTC1 had no documented emergency or crisis plans.
However, the organisation reported that they had a fire extinguisher and a first aid kit.
The organisation was more affected after the 22 February 2011 earthquake by minor damage to
premises and by being in the fall zone of a building to be demolished. LTC1 had a good
insurance policy but did not lodge an insurance claim after the 22 February 2011 earthquake as
the excess was more than the damage sustained. LTC1 detailed that the quick building
demolition in Lyttelton was helpful for the re-opening of the organisation. However, prior to re-
opening, LTC1 had a stall at the Lyttelton Farmers’ Market mainly to remind customers that the
organisation would re-open. LTC1 reported that having a stall at the market also enabled the
organisation to assess the post-earthquake need for their products as they were reliant on
customer discretionary spending. On re-opening, LTC1 was affected by the dust from the
ongoing demolition of nearby buildings and had to clean more regularly. The organisation
reported that this took up valuable time. LTC1 used the Earthquake Support Subsidy (ESS) as
part of recovery finance. Organisational expansion plans were put on hold after the earthquakes.
In the period of closure after the 22 February 2011 earthquake, LTC1 maintained contact with
their regular suppliers to inform them of progress on re-opening. LTC1 reported paying some of
their suppliers in advance in order to help with their cash flow and recovery. LTC1 also reached
the decision to use more Christchurch suppliers after the earthquake as way of helping them to
recover. LTC1 also offered space on their premises to another organisation from Lyttelton
Town Centre whose building had been demolished: no rent was asked for.
LTC2: LTC2 was run by two partners prior to the 22 February 2011 earthquake. The
organisation was a partnership with not much formal documentation. One partner had insurance
while the other did not. They offered specialist services heavily reliant on customer discretionary
spending both in New Zealand and overseas. LTC2 had no crisis plans and no prior crisis
experience. The organisation was based in Lyttelton because both partners thought the town
ideal for their type of work.
188 Case studies
LTC2’s premises suffered substantial damage after the 22 February 2011 earthquake and had to
be demolished. Prior to the demolition, the organisation faced delays and uncertainty on
whether they could access their premises and retrieve expensive, specialist equipment not
available in New Zealand. The delay was due to the shortage of structural engineering personnel
to conduct an inspection of the building. LTC2 reported that they decided to get around this by
using connections another tenant in the building had with people trained in search and rescue.
Search and rescue personnel escorted them on to the premises, however due to time constraints
they were unable to bring out all their equipment.
Without work space, the partners in LTC2 each worked from their homes. They reported that
they missed the creative environment they had when they worked together. The organisation
also reported being affected by reduced arts and entertainment locations in Christchurch, to
which they have strong links. As a consequence of reduced sales, LTC2 faced a cash flow
problem in the months after the 22 February 2011 earthquake. They applied for a monetary
grant made available to organisations in their line of work. The information about the grants was
got from being in touch with similar organisations that had come together to form an online
self-help group.
6.2 Synopsis of the case studies
All except one of the organisations interviewed reported doing well financially prior to the 4
September 2010 earthquake. The organisation facing financial difficulties reported that the
global financial crisis was the primary cause of its financial underperformance. All the
organisations had insurance except KTC2 which was under-insured and LTC2 which was half-
insured. Incidentally the organisation that reported not doing well financially was the same one
that reported the instance of under-insurance.
There are two main reasons that account for how the case study organisations were affected by
the earthquakes. The first is that sectoral attributes such as the type of goods and services
delivered played a part in what some of the effects to organisations were. For instance, trucking
organisations reported a rise in demand for their services while some hospitality organisations
reported a decrease in customer discretionary spending. The second main reason for differential
effects was the organisation’s location at the time of the earthquakes. Some parts of the greater
Christchurch area were more affected by the 4 September 2010 earthquake (e.g. Kaiapoi) than by

Key elements of sectoral recovery and resilience after the Canterbury earthquakes: A system dynamics approach
Hlekiwe Kachali
189
the 22 February 2011 earthquake (e.g. Lyttelton, Christchurch CBD and Christchurch’s eastern
suburbs.) Organisations described the 4 September 2010 earthquake as having partially prepared
them for the subsequent 22 February 2011 earthquake especially, the response and early
recovery phases.
To complement the mainly qualitative information provided by the case study organisations in
interviews, Table 6-1 is a snapshot of fundamental information from surveys 1, 2 and 3 that
encapsulates the main dimensions and sub-themes that follow. This information is also used in
chapter 10 in the discussion on organisational disaster resilience.
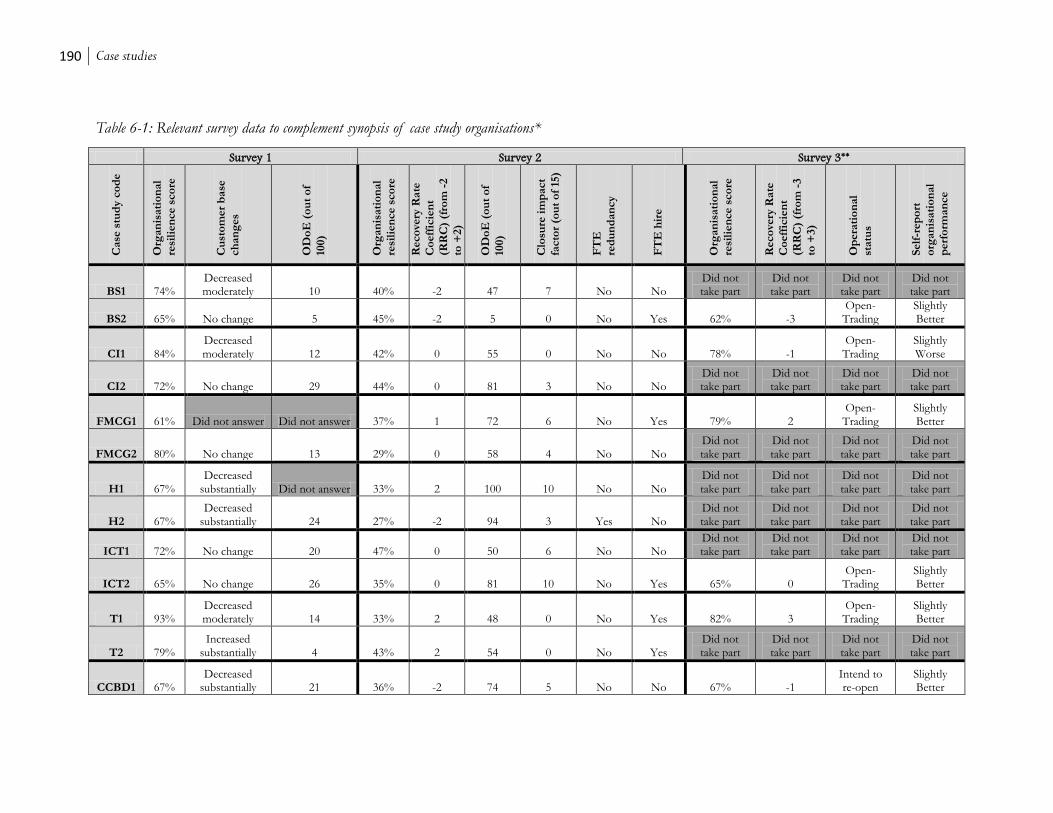
190 Case studies
Table 6-1: Relevant survey data to complement synopsis of case study organisations*
Survey 1 Survey 2 Survey 3**
Case
stu
dy c
od
e
Org
an
isati
on
al
resi
lien
ce s
co
re
Cu
sto
mer
base
ch
an
ges
OD
oE
(o
ut
of
100)
Org
an
isati
on
al
resi
lien
ce s
co
re
Reco
very
Rate
Co
eff
icie
nt
(RR
C)
(fro
m -
2
to +
2)
OD
oE
(o
ut
of
100)
Clo
sure
im
pact
facto
r (o
ut
of
15)
FT
E
red
un
dan
cy
FT
E h
ire
Org
an
isati
on
al
resi
lien
ce s
co
re
Reco
very
Rate
Co
eff
icie
nt
(RR
C)
(fro
m -
3
to +
3)
Op
era
tio
nal
statu
s
Self
-rep
ort
org
an
isati
on
al
perf
orm
an
ce
BS1 74% Decreased moderately 10 40% -2 47 7 No No
Did not take part
Did not take part
Did not take part
Did not take part
BS2 65% No change 5 45% -2 5 0 No Yes 62% -3 Open-
Trading Slightly Better
CI1 84% Decreased moderately 12 42% 0 55 0 No No 78% -1
Open-Trading
Slightly Worse
CI2 72% No change 29 44% 0 81 3 No No Did not take part
Did not take part
Did not take part
Did not take part
FMCG1 61% Did not answer Did not answer 37% 1 72 6 No Yes 79% 2 Open-
Trading Slightly Better
FMCG2 80% No change 13 29% 0 58 4 No No Did not take part
Did not take part
Did not take part
Did not take part
H1 67% Decreased
substantially Did not answer 33% 2 100 10 No No Did not take part
Did not take part
Did not take part
Did not take part
H2 67% Decreased
substantially 24 27% -2 94 3 Yes No Did not take part
Did not take part
Did not take part
Did not take part
ICT1 72% No change 20 47% 0 50 6 No No Did not take part
Did not take part
Did not take part
Did not take part
ICT2 65% No change 26 35% 0 81 10 No Yes 65% 0 Open-
Trading Slightly Better
T1 93% Decreased moderately 14 33% 2 48 0 No Yes 82% 3
Open-Trading
Slightly Better
T2 79% Increased
substantially 4 43% 2 54 0 No Yes Did not take part
Did not take part
Did not take part
Did not take part
CCBD1 67% Decreased
substantially 21 36% -2 74 5 No No 67% -1 Intend to re-open
Slightly Better

Key elements of sectoral recovery and resilience after the Canterbury earthquakes: A system dynamics approach
Hlekiwe Kachali
191
Survey 1 Survey 2 Survey 3**
Case
stu
dy c
od
e
Org
an
isati
on
al
resi
lien
ce s
co
re
Cu
sto
mer
base
ch
an
ges
OD
oE
(o
ut
of
100)
Org
an
isati
on
al
resi
lien
ce s
co
re
Reco
very
Rate
Co
eff
icie
nt
(RR
C)
(fro
m -
2
to +
2)
OD
oE
(o
ut
of
100)
Clo
sure
im
pact
facto
r (o
ut
of
15)
FT
E
red
un
dan
cy
FT
E h
ire
Org
an
isati
on
al
resi
lien
ce s
co
re
Reco
very
Rate
Co
eff
icie
nt
(RR
C)
(fro
m -
3
to +
3)
Op
era
tio
nal
statu
s
Self
-rep
ort
org
an
isati
on
al
perf
orm
an
ce
CCBD2 100% Decreased
substantially 36 33% -2 83 11 No No 31% -3 Open-
Trading Slightly Worse
KTC1 76% Did not answer Did not answer 35% 0 45 3 No No Did not take part
Did not take part
Did not take part
Did not take part
KTC2 68% No change 36 50% -2 35 7 No No 61% -3 Open-
Trading Slightly Worse
LTC1
Did not take part
Did not take part
Did not take part 42% -2 73 1 No No 21% -2
Intend to re-open
Slightly Better
LTC2
Did not take part
Did not take part
Did not take part 24% -1 97 3 No No
Did not take part
Did not take part
Did not take part
Did not take part
*The organisational degree of effect (ODoE) was presented in section 5.1. The recovery rate coefficient (RRC) and the closure impact factor are explained in detail in sections 7.3 and 7.4.5.
**The case studies were conducted in between Surveys 2 and 3; see research timeline in section 3.4.2.
192 Case studies
6.3 Main dimensions and sub-themes emergent after analysis of case
study data
The results in this chapter are documented under the headings of main dimensions and their
sub-themes. In other words, the main dimensions and sub-themes are the issues that the case
study organisations faced after the earthquakes. The main dimensions and sub-themes were
arrived at using the grounded theory approach: they were not pre-determined. They emerged
from analysis of the case study data and using open coding. Open coding allows for the
grouping of similar ideas without a pre-determined heading assigned. The analysis of the case
study data was done after each case study. Coding enabled the identification and
conceptualisation of the large body of case study data and led to these main themes and sub-
dimensions. The coding paradigm corresponds with the different parts defined in the case study
interview guide and with the systems thinking approach (see chapter 3.5.4).
The headings for the main dimensions and sub-themes are captured briefly in Table 6-2 and
then explained in detail, as sub-chapters 6.4 to 6.12, in the sections that follow. The captions of
the main dimensions and sub-themes were arrived at by using information that best
encapsulated the information in the main theme or sub-theme and sometimes from words used
by the interviewees. The main-dimensions and sub themes illustrate the ways in which the
sectors were affected. Even as the main dimensions and sub-themes are the issues that arose for
the sector, different sectors were sometimes affected differently for the same sub-theme.
The main dimension organisational actions in the response phase has no sub-themes. It emerged
as a result of the description of actions carried out by the case study organisations in the
response phase after the earthquakes. Some of these actions included verifying staff wellbeing,
checking buildings and machinery and confirming resumption of service to customers. Another
main dimension that emerged was wellbeing and its sub-themes of staff, family and community
wellbeing. All organisations interviewed spoke of how these three strands of wellbeing were
necessary for organisational recovery. A third main dimension was leadership where some of its
sub-themes are sectoral leadership, recognising and grasping opportunity, communication and
leadership of the overall recovery effort. Case study organisations pointed to good, competent
leadership as one of the important aspects of recovery. These and all the other main dimensions
and sub-themes are discussed in detail in chapters 6.4 to 6.12.
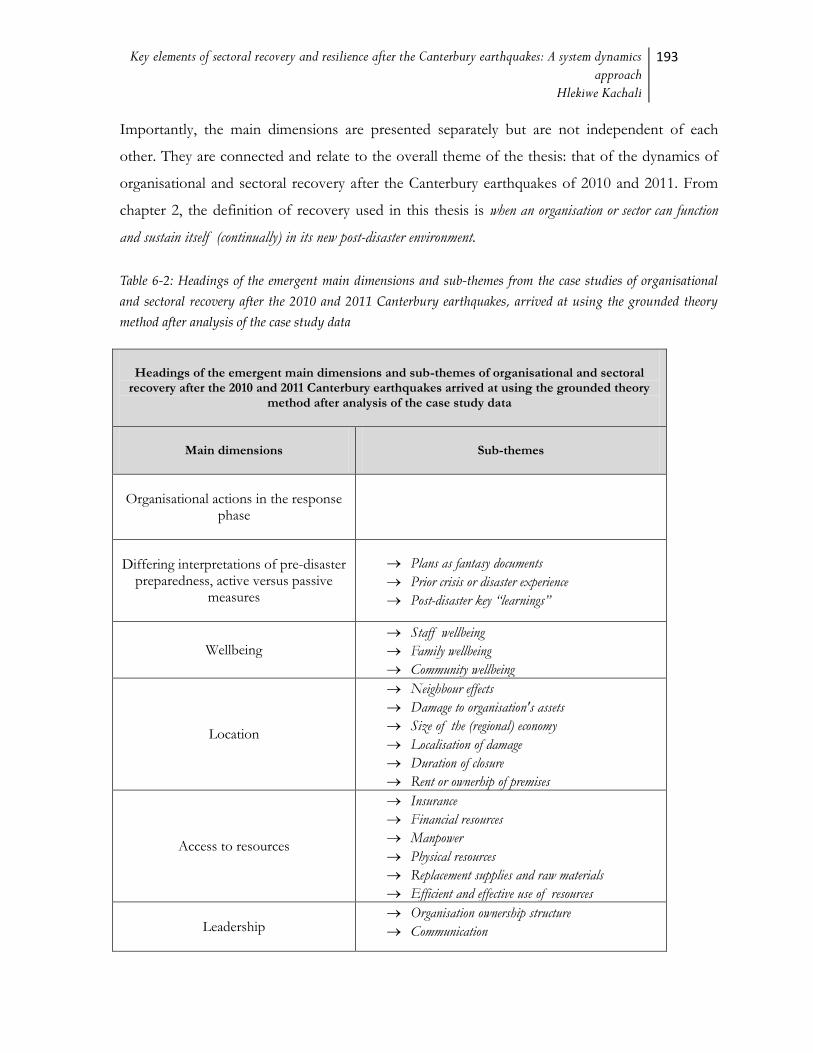
Key elements of sectoral recovery and resilience after the Canterbury earthquakes: A system dynamics approach
Hlekiwe Kachali
193
Importantly, the main dimensions are presented separately but are not independent of each
other. They are connected and relate to the overall theme of the thesis: that of the dynamics of
organisational and sectoral recovery after the Canterbury earthquakes of 2010 and 2011. From
chapter 2, the definition of recovery used in this thesis is when an organisation or sector can function
and sustain itself (continually) in its new post-disaster environment.
Table 6-2: Headings of the emergent main dimensions and sub-themes from the case studies of organisational
and sectoral recovery after the 2010 and 2011 Canterbury earthquakes, arrived at using the grounded theory
method after analysis of the case study data
Headings of the emergent main dimensions and sub-themes of organisational and sectoral recovery after the 2010 and 2011 Canterbury earthquakes arrived at using the grounded theory
method after analysis of the case study data
Main dimensions Sub-themes
Organisational actions in the response phase
Differing interpretations of pre-disaster preparedness, active versus passive
measures
Plans as fantasy documents
Prior crisis or disaster experience
Post-disaster key “learnings”
Wellbeing
Staff wellbeing
Family wellbeing
Community wellbeing
Location
Neighbour effects
Damage to organisation's assets
Size of the (regional) economy
Localisation of damage
Duration of closure
Rent or ownerhip of premises
Access to resources
Insurance
Financial resources
Manpower
Physical resources
Replacement supplies and raw materials
Efficient and effective use of resources
Leadership Organisation ownership structure
Communication
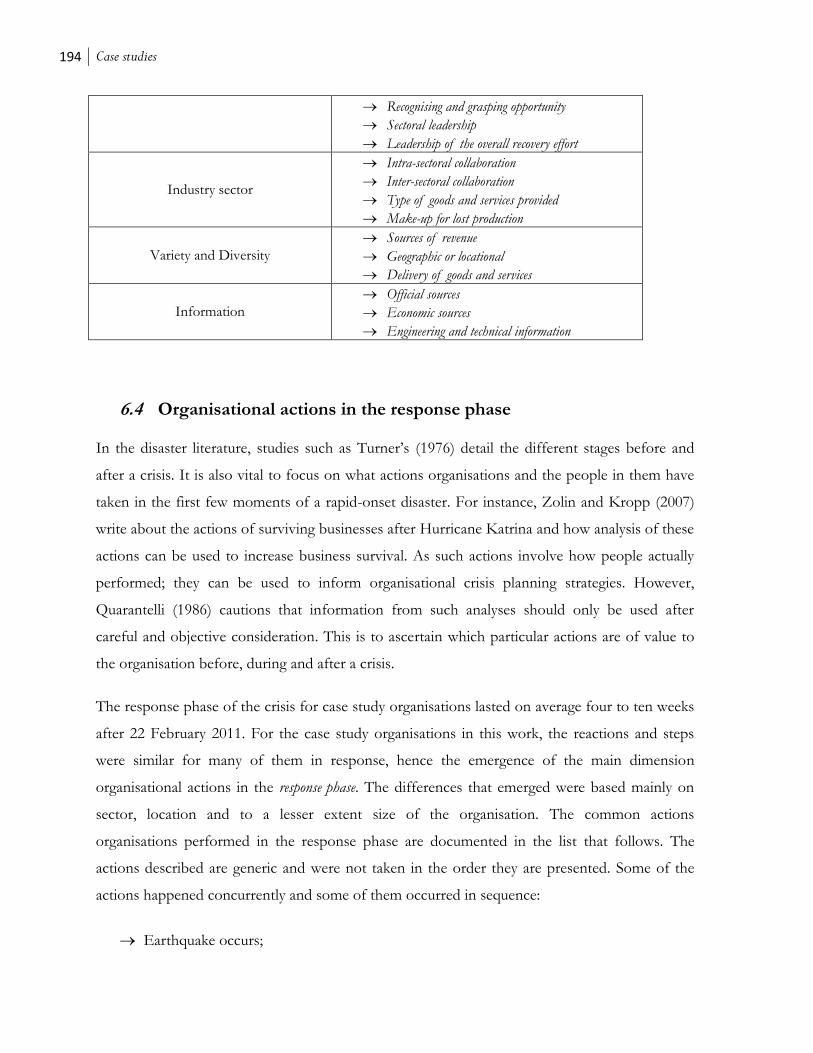
194 Case studies
Recognising and grasping opportunity
Sectoral leadership
Leadership of the overall recovery effort
Industry sector
Intra-sectoral collaboration
Inter-sectoral collaboration
Type of goods and services provided
Make-up for lost production
Variety and Diversity
Sources of revenue
Geographic or locational
Delivery of goods and services
Information
Official sources
Economic sources
Engineering and technical information
6.4 Organisational actions in the response phase
In the disaster literature, studies such as Turner’s (1976) detail the different stages before and
after a crisis. It is also vital to focus on what actions organisations and the people in them have
taken in the first few moments of a rapid-onset disaster. For instance, Zolin and Kropp (2007)
write about the actions of surviving businesses after Hurricane Katrina and how analysis of these
actions can be used to increase business survival. As such actions involve how people actually
performed; they can be used to inform organisational crisis planning strategies. However,
Quarantelli (1986) cautions that information from such analyses should only be used after
careful and objective consideration. This is to ascertain which particular actions are of value to
the organisation before, during and after a crisis.
The response phase of the crisis for case study organisations lasted on average four to ten weeks
after 22 February 2011. For the case study organisations in this work, the reactions and steps
were similar for many of them in response, hence the emergence of the main dimension
organisational actions in the response phase. The differences that emerged were based mainly on
sector, location and to a lesser extent size of the organisation. The common actions
organisations performed in the response phase are documented in the list that follows. The
actions described are generic and were not taken in the order they are presented. Some of the
actions happened concurrently and some of them occurred in sequence:
Earthquake occurs;

Key elements of sectoral recovery and resilience after the Canterbury earthquakes: A system dynamics approach
Hlekiwe Kachali
195
Building(s) evacuated, staff move to safer area and try to establish wellbeing of their
families;
One or a few individuals took charge and verified staff wellbeing by phone, e-mail, word
of mouth or social media (e.g. Facebook, Twitter). In the few hours after the earthquakes
phone lines were congested making it hard to reach people. For some of the larger
organisations this staff welfare verification took several days as some staff had left town;
Whoever was in charge (in the larger organisations, usually a group of three people) did
a preliminary (mostly visual) damage assessment. This happened in areas where the
building was still standing, where there was no official cordon around the building, and
while awaiting expert geotechnical and structural engineering appraisal 35 . Some
organisations that employed geotechnical or structural engineers as part of their
operations reported using in-house engineers for these assessments. Some organisations
later asked their engineers to assist with appraisals in the Christchurch region;
For those organisations that had to wait to get building assessments done, the
organisation’s leadership team met and decided on measures to be taken. Tasks were
delegated to different members of the leadership team as well as to other staff. In many
cases, task allocation was done by phone and e-mail. Arrangements to work from
alternative premises (e.g. the homes of staff members) were made;
The organisation’s position in relation to suppliers and customers was assessed, the
critical suppliers and customers identified and in what order or fashion they would be
dealt with;
Critical customers and suppliers were contacted and informed of the preliminary
assessment for when goods and services delivery could possibly continue;
Communication to employees continued, using various methods. The communication
usually involved further ascertaining the condition of employees, their families, their
dwellings and their community. In many instances, organisations offered some kind of
assistance (food packs, financial grants, laundry facilities) to employees;
35 In most cases, people did not (officially) go back into the building until an expert assessment had been done and the building
cleared for occupation
196 Case studies
A short-term business continuity plan was prepared. This used information on the state
of the organisation’s premises, equipment, supporting infrastructure and intelligence
from critical customers and suppliers;
Employees contacted, told the high level details of the business continuity plan and
asked about the possibility of coming back to work. In the main, employees had the
option of not coming back so soon after an event: some employees chose to work while
others chose not to;
Continued development of medium- to long-term organisational post-earthquake(s)
plan.
For the response phase of the crisis, organisations reported not planning too far ahead as the
situation changed continuously. As organisations transitioned into the short-term recovery
phase, they gradually started to look at what had occurred in relation to medium- and long-
term corporate recovery strategy.
6.5 Differing interpretations of pre-disaster preparedness: active versus
passive measures
Organisations were asked if they had pre-disaster or pre-crisis preparedness plans at the time of
the earthquakes and if these plans were documented. Of the 18 organisations interviewed, less
than half had a written emergency plan while one (T1) had a plan that was not documented. The
fullness of these documented emergency plans varied widely. Comparing with the rest of the
sample set, only 3% of organisations reported having a documented emergency plan when asked
in Survey 2
None of the case study interviewees interpreted the questions on pre-crisis or pre-disaster
preparedness to mean passive means of mitigation and preparedness like insurance or a fire
extinguisher, most of which they had. They all related the questions to specific plans dealing
with low probability high consequence events such as earthquakes. Their responses were likely
influenced by their recent experience of earthquakes.
All the organisations spoke of not thinking of Christchurch as being a significant earthquake
risk. After the 4 September 2010 earthquake, in which most of the case study organisations were
Key elements of sectoral recovery and resilience after the Canterbury earthquakes: A system dynamics approach
Hlekiwe Kachali
197
not very adversely affected, the occurrence and effects of the 22 February 2011 earthquake were
even more of a surprise.
“the person who was [in charge] decided that it wasn’t worth the additional
expense, and Christchurch wasn’t a risk, so we had quite solid insurance for our
Wellington store and for our Auckland store, but we didn’t for our Christchurch
stores” – CCBD1
Indeed, historically Christchurch was thought to have relatively moderate seismicity and the
actual faults that caused the 4 September 2010 and 22 February 2011 earthquakes were
previously unknown (Beavan et al., 2011). That the earthquakes happened and caused such
damage and disruption shows that organisations should have plans that encompass the broadest
range of hazards including ones they have not thought of.
“we all sort of expected that after [4] September [2010] the worst was over, and we
were probably going to be safe after that, but no, we were obviously quite wrong”
– CCBD1
6.5.1 Plans as fantasy documents36
Most of the organisations listed having plans for fire, low cash flow and pandemics; what they
called normal things, but not plans for earthquakes. This makes these organisational plans fantasy
documents as organisations think they are prepared (see chapter 2.3.3) but their plans bore little
resemblance to what they would need to do in the event of a disaster. Only one of the
organisations interviewed (ICT1) had specific plans in the event of an earthquake. It appears that
the majority of the case study organisations made plans for hazards they thought more likely to
occur (e.g. fire), hazards that were sector specific (e.g. shelf collapse) or hazards they had
experienced (e.g. pandemic). Additionally, some organisations reported that they felt the
overwhelming nature of the events in Canterbury would have rendered such plans almost useless.
This included both organisations with and without plans. This suggests that organisations may
have misconstrued the purpose of planning and of having plans. The value of prior planning lies
36 The phrase fantasy documents is from the book Mission Improbable: Using Fantasy Documents to Tame Disaster by Lee Clarke
(2001).

198 Case studies
in knowing what steps to take in the event of a disaster and may also help to minimise the
effects of a disaster. In a study on organisational recovery after Hurricane Andrew, Kruse (1993)
showed that organisations with pre-crisis planning recovered quicker after the event.
Furthermore, case study organisations expressed that in the response and early recovery phases,
the ability to take quick actions and make on-the-spot decisions with limited information was
important. Some of the actions seen as helpful after the event included the speedy assembly of
organisational crisis teams. It can be argued that actions such as these can surely be carried out
quicker and more efficiently with knowledge from prior planning exercises. However, in
planning and preparing for crisis, organisations need to recognise that aside from the speed of
decision making, any actions taken should be suited to the situation they find themselves in.
Quarantelli (1988) and Dynes (1974) also emphasise this while case study organisation KTC1
describes it as:
“…as far as I know, the management do that and then we just follow our orders
and their expectations…” – KTC1
From the information provided by interviewees about pre-earthquake plans, business owners
and managers were more likely to concentrate on employee safety than on business continuity
which would have included what steps to follow in recovery after disaster. Interestingly,
interviewees reported that in looking back at what happened in the first few hours after the
earthquakes, the most valuable type of plan is one that is not too specific and is adaptable.
Additionally, responses to other questions on actions organisations took after the earthquakes
exposed contrasting thoughts. It emerged that prior planning would have been of value; for
instance in procedures used to verify staff wellbeing. They also emphasised that having a plan is
one thing, rehearsing that plan is equally vital. Interviewees detailed being quicker off the mark
on 22 February 2011 for the response phase because of some of the motions they had gone
through after 4 September 2010. Some interviewees pointed to the possible inclusion of regular
practise drills as part of their organisation’s post-earthquake strategy.
6.5.2 Prior crisis or disaster experience
In reviewing their response to a crisis, some of the preparedness measures organisations engage
in afterwards may still not fully address the challenges of a wide range of disasters. In the disaster
Key elements of sectoral recovery and resilience after the Canterbury earthquakes: A system dynamics approach
Hlekiwe Kachali
199
literature, researchers have found that prior crisis or disaster experience is not that helpful when
faced with a major disaster (Dahlhamer & Reshaur, 1996; Tierney, 2009). Additionally, authors
such as Zhang et al (1973) and Zolin and Kropp (2007) further note that organisational hazard
mitigation plans often target the response phase after disaster and may not include business
continuity details. None of the interviewed case study organisations could recall their
organisation ever having faced a crisis of the magnitude brought about by the 22 February 2011
earthquake. Nonetheless, it emerged that some organisations from the critical infrastructure and
trucking sectors, as well as those providing essential or non-substitutable services, were used to
dealing with crisis of sorts in their day-to-day operations. They said this experience helped to a
degree in the response phase. However, they added that this limited experience was not adequate
for the kind of response or business continuity required after a major disaster. It appears that
exposure to minor crisis may not be adequate preparation for a major crisis. This point, on the
scale of disasters, has been emphasised by Quarantelli (2006).
6.5.3 Post-disaster key ‘learnings’37
One of the outcomes after the acute phase of a crisis has passed is the need to identify key
lessons that organisations can take away from the experience. These lessons may be used to
inform corporate strategy for post-disaster recovery or to help manage crises better in the future.
Other disaster researchers such as Stern and Sundelius (2002) write that learning from a disaster
should be an objective exercise if organisations are to get the most value from it. In essence, all
the case study organisations have used the earthquakes as a learning opportunity, but to varying
degrees. For instance, ICT1 noted that their emergency plans did not have building re-entry
procedures and did not make provisions for tsunamis. The organisation has since included both
of these parts into their updated emergency plans. H2 on the other hand believes that there is
not much that organisations can do about low probability, high consequence events although
they reported plans to improve the organisation’s health and safety arrangements in future.
37 A word that was used repeatedly by interviewees.
200 Case studies
6.5.4 Organisational resilience
Organisational as well as disaster researchers are interested in what makes some organisations
adapt better in crisis. Organisational resilience has been put forward as a differentiator in how
organisations handle and survive crises (Seville et al., 2008; Sutcliffe & Vogus, 2003; Tierney,
2008). The word resilience was used constantly, mainly in reference to the people of Canterbury,
after the 4 September 2010 earthquake. Interviewed organisations were asked how they would
define the resilience of an organisation, what the traits of a resilient organisation were from their
perspective and if an organisation being resilient added any value. Seville et al (2008) define
organisational resilience as the ability to survive crisis and thrive in a world of uncertainty while Hamel
and Välikangas (2003) describe resilience as the ability to dynamically reinvent business models and
strategies as circumstances change. When asked, the case study organisations’ definitions of
organisational resilience embodied that of both Seville et al and Hamel and Välikangas. The
organisations thought of a resilient organisation as:
“…essentially each organisation is there to do something and if it is able to
continue to be effective in doing that, despite the entire world changing around
it, then it’s probably reasonably resilient ” - T1
“…being able to ride this tough time out is probably the biggest measure I have
of resilience…The other one is for me personally, is psychologically getting
through it” - KTC2
“…two levels to me for organisational resilience….The first level would be the
resilience within the people, that your people aren’t cracking up, especially ones
in senior positions, you’ve got to be able to handle the psychological
impact….the second one, after people resilience is the resilience of your
processes, your procedures and your organisational structure.” – ICT1
Even with the different definitions of resilience, there was agreement on the importance of
resilience to organisations. Interviewees also portrayed resilience in both proactive and reactive
terms. There was no one particular element of resilience that was mentioned more frequently by
an individual sector. Some of the attributes interviewees said could lead to a resilient
organisation:
Key elements of sectoral recovery and resilience after the Canterbury earthquakes: A system dynamics approach
Hlekiwe Kachali
201
People employed, skills;
Leadership;
Networking of the organisation;
Financial position;
Adaptation;
Location;
Diversity;
Maintaining relationship with customer base;
Good knowledge of supply web;
Disaster plans;
Knowing interdependencies between departments in the organisation;
Good, solid infrastructure and equipment;
Robust organisational processes, procedures and structures;
Flexibility; and
Organisational (personnel) succession plans.
In chapter 10, the attributes of organisational resilience described here by case study respondents
will be contrasted against those in the 13 indicator model developed from the work of McManus
(2008) and Stephenson (2010).
6.6 Wellbeing
Organisations cited staff wellbeing as top of the list when they were asked what factors
influenced recovery. However, it emerged that there are multiple interrelated aspects to this
wellbeing.
6.6.1 Staff wellbeing
All interviewees reported that staff were the most important aspect of the recovery of their
organisation. As organisations are made up of people, recovery for the organisation is linked to
recovery of staff. However, for staff to devote their energies to organisational recovery, their
primary concerns, e.g. family welfare, need to be taken care of. In the case of disaster, staff need

202 Case studies
to take care of family needs before turning to those of the organisation. In Canterbury, there was
recognition that the personal wellbeing of staff was crucial in tackling the response to the
disaster and in the work to be done during the recovery phase, for instance in the case of staff
working longer hours to make up for lost production.
“…you have to have good people, because without execution a plan is worth
nothing…having a disaster recovery plan is a good place to start, and so long as
you have recruited well and you’ve got the right people in the right positions” –
ICT1
All organisations also reported paying attention to the number of hours staff worked.
Organisations also worked hard to ensure staff redundancy was a last resort in already turbulent
times and that work should be one source of certainty. The author spoke to staff in some of the
case study organisations and heard staff reports of being inspired by the level of care shown by
management especially without being prompted. Corporate support for staff has been
documented after other disasters also, for instance after Hurricane Andrew (Sanchez, Korbin, &
Viscarra, 1995). In Canterbury, organisations mobilised resources to support their staff;
providing for example basic services such as laundry and shower facilities. Some organisations,
for instance BS1, also assisted staff by paying for professional advice such as insurance claims
consultants. Essentially, this is an interpretation of Maslow’s (1954) hierarchy of needs, where
recovery starts with the fulfilment of the individual’s basic needs before moving on to other
aspects.
6.6.2 Family wellbeing
Employee wellbeing is very closely connected to family wellbeing. Employers recognised that
ensuring their employees were doing well was in itself not enough. They also had to look into
the wellbeing of the employees’ families and personal situations as this affected the employees’
performance at work and their decision to remain in the greater Christchurch area altogether.
For example, some ICT and critical infrastructure organisations reported that some employees
voluntarily left their employment due to family considerations. Measures taken to mitigate this
included giving staff the choice to relocate and still retain their jobs. They reported that, in the
main, this was a better option than losing staff altogether and helped with team spirit in the
Key elements of sectoral recovery and resilience after the Canterbury earthquakes: A system dynamics approach
Hlekiwe Kachali
203
organisation38. These efforts made staff feel more valued which often translated into increased
productivity.
“… it is important that we were given time to be with our families, we were given
time to have time out, we were given time to fix our own earthquake things that
were going on” – KTC1
6.6.3 Community wellbeing
To extend the concept of wellbeing further, employees and their families are part of
communities. To a certain extent, the organisation benefits from contributing to the recovery of
the community. The organisation relies on the community for provision of resources like
employees and in some cases for custom. Conversely, the community relies on the organisation
for provision of goods and services. Some organisations, e.g. ICT1 and FMCG2 reported that in
certain cases they were aware that they possessed more resources than earthquake ravaged
communities and felt that they had a duty to help the community. This also conveys that
community post-disaster recovery may have an influence on the recovery of organisations. For
instance, Elms et al (2012), Chang and Shinozuka (2004), Paton (2006) and Mayunga (2007)
demonstrate how organisations and the community are linked in recovery. These different
studies show that economic recovery and social recovery are very closely related and one cannot
occur without the other. Therefore, planning for one aspect of recovery should take related
aspects into consideration.
6.7 Location
Location has often been cited in disaster studies as important to organisational recovery (Chang
& Falit-Baiamonte, 2002). Organisations were asked why they chose the locations they were in
prior to the earthquakes. Reasons given covered the multiple aspects of location and included
the benefit from proximity to surrounding organisations; suitability for their type of (specialised)
business; to be with like businesses; as well as a sense of place and belonging as the owner had
lived in that area all their lives. These aspects that were an advantage prior to the earthquake in
38 One point that was not discussed was if and how organisations will maintain, in the long-term, the ‘satellite’
offices set up in response to staff needs after the earthquakes.

204 Case studies
some cases turned out to be disadvantages after. For instance, organisations that selected the
area they were in for its benefits pre-earthquake, but whose soils liquefied due to the
earthquakes.
“…every quake we get we have movement. We still have movement in the slabs,
even when we haven’t got quakes, because the ground underneath is soft” – ICT1
6.7.1 Neighbour effects
In some cases, the buildings next to or nearby an organisation’s premises were damaged and red-
tagged as unsafe to enter. This had cascading effects to organisation’s whose premises were not
damaged but could not be accessed until the damaged building was repaired or demolished. This
point is closely linked to the duration of closure of an organisation’s premises, their ability to
access resources such as customer information, as well as delays in getting buildings technically
assessed and if necessary repaired or demolished.
“By the [22] February [2011 earthquake], I had nothing, I still haven’t got my
business. CERA won’t let us in there…we’re in the fall zone of the Grand
Chancellor [hotel] and [named] Bank” – H2
6.7.2 Damage to organisation's assets
The extent of damage to the organisation’s premises and equipment as a result of the
earthquakes can have an effect on the recovery of organisations. Some assets were damaged by
the ground shaking, some by falling over and others by objects falling onto them.
“initially we made the decision to reopen the warehouse as soon as we could
because we needed to keep our other branches trading, because that was
potentially impacting on the whole business, compared to the fact that we already
just lost, or had three Christchurch stores shut down” – CCBD1
However, the repair or restoration of physical assets alone is not enough to ensure that an
organisation will recover post-disaster. Other elements such as loss of staff or customers might
also contribute to an organisation’s demise. Alesch et al (2009) demonstrated as much in their
work on community disaster recovery.
Key elements of sectoral recovery and resilience after the Canterbury earthquakes: A system dynamics approach
Hlekiwe Kachali
205
6.7.3 Size of the (regional) economy
In this case, the economy includes not only the gross domestic product (GDP) but also the
variety of goods and services produced in the greater Christchurch area and Canterbury region.
The economy was robust enough in size that even with the closure of the CBD, other sectors
and areas could still function.
“…we’re still operating, we’re still making a profit, and we’re in a relatively robust
economy down here compared to where other parts of [organisation] are in
Europe and the United States, so we’re actually doing quite well from a numbers
perspective” – ICT1
6.7.4 Localisation of damage
This sub-theme is very closely related to the point above, the size of the region’s economy, and
is a fundamental characteristic of the Canterbury earthquakes. The (physical) damage caused by
the 22 February 2011 Christchurch earthquake was localised or concentrated in Christchurch’s
CBD and eastern suburbs. In other work, Chang (2010) found that the widespread damage after
the Kobe earthquake was a barrier to recovery. Consequently, after the Canterbury earthquakes,
some organisations moved to alternative accommodation. This accommodation was in other
parts of the country, region or areas of Christchurch that had less or no damage. This was also
because of the non-interruption or quick restoration of critical services essential for the
functioning of many organisations. The geographic localisation of damage also meant that first,
resources could get to affected organisations and second, unaffected entities from outside the
affected area could send resources quickly.
This sub-theme is related to access to resources detailed in section 6.8. Additionally, some of the
organisations with their headquarters in Christchurch narrated that localisation of the damage
meant that important records stored by the head office could be retrieved. CCBD1, whose
headquarters and main distribution centre are both in the greater Christchurch area, detailed that
if the damage had been more spread out, this would have affected their organisation severely.
206 Case studies
6.7.5 Duration of closure
The length of closure of an organisation’s premises can also influence recovery especially for
those that cannot relocate or those that can relocate but have no access to equipment, stock or
business information. This is also linked to the organisation’s position in the supply web as the
longer the organisation is disrupted, the greater the disruption to their suppliers or customers
and so on.
“…we’ve learnt a lot, that we can move around, we can move the business around
to other places and continue working….we’ve got so many sites that we can just
get things moving around…we’re fortunate that we’re quite a large business. ” –
BS1
Duration of closure included that caused by intermittent downtime brought on by buildings or
equipment needing to be checked after every significant aftershock. Also, the duration of closure
for an organisation can have other effects such as customers not returning once the business has
re-opened. Some of the case study organisations, e.g. LTC1 and CCBD2, reported engaging in
extra promotional activities to remind customers that they had re-opened. In the disaster
literature, Nigg and Tierney (1990) found that the length of closure of an organisation may affect
the return of customers.
6.7.6 Rent or ownership of premises
It was evident from information provided by some of the interviewees that the issue of rent or
ownership of their organisation’s premises played a part in recovery. Dahlhamer and D’Souza
(2004) write that building owner/occupiers are more likely to engage in preparedness activities
than renters. From Survey 1, 73% of organisations reported renting their organisation’s
premises. Some of the (renter) interviewees spoke of wanting to engage in repair, restoration and
reinforcement work but that this was dependent on the building owners. Organisations report
that in many cases, they did not have much of a say in the level of repair or restoration decisions
after the earthquakes. Some owner/occupier organisations interviewed detailed ongoing plans
for seismic retrofitting in light of the earthquakes.
Renting a building could be an advantage as the renter can walk away and not have to think
about issues to do with building repair. However, organisations also spoke of being locked in to
Key elements of sectoral recovery and resilience after the Canterbury earthquakes: A system dynamics approach
Hlekiwe Kachali
207
their pre-earthquake leases even for buildings that would likely be demolished. This also
contributed to the delays in insurance payments. In the context of the Canterbury earthquakes, it
can be argued that rent or ownership of business premises was not very significant for most of
the organisations. This is because both owners and renters faced similar problems in accessing
qualified personnel, e.g. structural and geotechnical, to assess building and ground damage.
Additionally, both owners and renters were affected by delays, for example in getting insurance
payments (see chapter 8 for more detail). It is important to note that the majority of the sample
(see chapter 5) were renters.
6.8 Access to resources
Resources can be financial, physical (e.g. machinery), manpower (e.g. expert services), basic raw
materials and information. For the overall sample, this main dimension and its sub-themes is
related to the localisation of damage discussed in section 6.7.4. From the case study
organisations interviewed and for this main dimension of access to resources, the small- to
medium-sized enterprises (SMEs) faced more difficulties in accessing some resources than the
larger organisations (see appendix I for detailed analysis of entire sample by organisation size).
For instance, quick access to finance to purchase goods and services necessary for the recovery
process. It is clear from the case studies that smaller organisations did not have the capital
reserves that larger organisations did. For instance, H1 spoke of head office providing a lawyer
she would otherwise not have been able to afford if she had had to pay for the service. This
difficulty accessing resources means that SMEs are more likely to struggle to recover following
the earthquakes.
Additionally, it became apparent that the resources required after a regional disaster can be in
excess of what the organisation might require for a day-to-day crisis when costs such as
relocation, new equipment and extended revenue decreases are factored in. Organisations must
be prepared for sustained periods of financial underperformance and have a plan to weather
such periods.
“The building was closed and had to be inspected and so on, so we were out of
there for six weeks, two months. Gee that’s costly, I didn’t realise how costly it
was to move out of an office and set up somewhere else” - KTC2

208 Case studies
SMEs are more dependent on other ways to carry on operations after cash flow is disrupted
such as money borrowed from family and friends or on credit. H2 pointed to using family
savings to make payments for the business. This was in part because her insurance settlement
was delayed. This shows that for small business owners, their personal wealth is often tied up in
their business which compromises their financial security. Berger (1998) and Avery (1998) found
that small business owners often use personal assets to finance their organisations.
Furthermore, even among the SMEs there is a difference between those that are small and those
that are medium-sized. The interviewer noticed that the very small organisations with fewer
employees spoke more frequently about the possibility of closing the business. This was in
contrast to larger organisations that had more employees who could become redundant in the
case of organisational closure. The medium-sized organisations often had on their payroll in-
house professional services such as lawyers and accountants that the smaller organisations did
not have.
6.8.1 Insurance
In the disaster literature, Kunreuther (1996, 2008) has written extensively on the use of insurance
as a form of disaster mitigation. After the 22 February 2011 Christchurch earthquake, insurance
and the delayed settlement of insurance claims emerged as a massive issue. The continuing
occurrence of earthquakes in Canterbury was a major source of uncertainty for insurance
companies who delayed payment to policyholders as they assessed the risk. Additionally, the
insured costs of the earthquakes were unprecedented (Munich Re, 2012). The majority of
organisations interviewed talked of the delayed payment from their insurance companies as
having an adverse effect on their recovery as it restricted some of the decisions they could make.
This was especially so for the small organisations. The system dynamics analysis in chapter 8
shows what some of the consequences of this delayed or non-payment of insurance were.
6.8.2 Financial resources
This is linked to the point on delayed or non-payment of insurance (section 6.8.1). Most small
organisations do not normally have large amounts of cash flow in day-to-day operations (Dodge,
Fullerton, & Robbins, 1994). After the earthquakes in Canterbury, low levels of organisational
cash flow were magnified. The small organisations in the study spoke of still having to pay bills
Key elements of sectoral recovery and resilience after the Canterbury earthquakes: A system dynamics approach
Hlekiwe Kachali
209
(e.g. mortgages) even as there was no revenue coming in for a certain period after the
earthquakes. This put a further strain on their organisational and, in some cases, personal
finances.
Organisations reported that the quick action by Central Government, after both the 4
September 2010 and 22 February 2011 earthquakes, to assist organisations with 50 employees or
less has been hailed as one of the best decisions to come out of the Canterbury series of
earthquakes. The Earthquake Support Subsidy (ESS) enabled many organisations to consider
their decisions carefully before taking action in those crucial response and early recovery periods.
It also enabled them to retain staff.
Additionally, one of the FMCG organisations pointed to Central Government sending cash to
Christchurch as an aid. Due to infrastructure damage and a great demand on what infrastructure
was available, electronic point of sale terminals (EFTPOS) in stores did not work. Central
Government printed more money that they sent to greater Christchurch which enabled
customers to use cash to purchase goods and services.
6.8.3 Manpower
This includes specialist services such as those to do with accountancy, tax and law which are
usually functional roles in medium- to larger-sized organisations. Access to resources also
includes trained personnel who can work in the organisation once it is trading again. For
example, the hospitality organisations related how they had to let go of their trained staff due to
their inability to pay them as they waited to re-open. This is one of the consequences of
inadequate financial resources discussed in the previous section (6.8.2).
For organisations resuming operations after the earthquakes, training new staff may affect the
organisation’s efficiency at a crucial time in its recovery. This is because resources such as time
and money which could be targeted at recovery activities (e.g. advertising) would be channelled
to new staff training. New staff are not as efficient with organisational processes as longer
serving staff which leads to lower productivity (Guthrie, 2001).
Some organisations brought in assistance from other parts of their organisations, for example
Auckland or Wellington to relieve those on the ground in Christchurch. This turned out to be
210 Case studies
both a positive and a negative. The positive was that the people in Christchurch could rest and
also take care of their personal situations. The negative was that some Christchurch personnel
felt the visitors were stepping on their toes in essence, which caused some friction between the
locals and the visitors. Also, there was a period of adjustment as relief managers and the teams
they had to work with took time to get used to each other. Meanwhile, ICT and trucking sector
organisations spoke of facing a skills shortage prior to the earthquakes which was exacerbated by
the earthquakes. They also spoke of qualified people voluntarily leaving their employment which
worsened an already bad situation.
“…how much time it takes for constantly sending this information all the time.”
– H2
6.8.4 Physical resources
With limited monetary or physical resources, it is difficult to relocate even if an organisation
leader or owner wanted to.
“…with all the specialised software…specialised equipment that we use….We
couldn’t have worked without the equipment, especially the computers” – KTC2
For location specific industries such as hospitality their situation differed slightly. In order to
relocate they had to find the right premises to house their equipment and with all the necessary
utility services connected. They were also subject to sectoral health and safety regulations that
have to be met before they can serve customers or employ staff.
6.8.5 Replacement supplies and raw materials
An organisation’s access to resources includes the raw materials or replacement supplies they
need to deliver goods and services. This is influenced by other parts of their supply web
including but not limited to supplier organisations as well as critical infrastructure such as water,
electricity and roads.
“…I tried to buy from local people but they couldn’t supply because they were
affected…” - LTC1

Key elements of sectoral recovery and resilience after the Canterbury earthquakes: A system dynamics approach
Hlekiwe Kachali
211
Organisations also needed to access stock and records in damaged buildings. However, for some
this proved difficult.
“…one of the key stresses after the quake was the fact that we didn’t have access
to our stock in the centre of town, and that took some fights, for want of a better
word, with Civil Defence…we didn’t have earthquake insurance, so it was all
sitting in the centre of Christchurch uninsured” - CCBD1
6.8.6 Efficient and effective use of resources
The urge to use resources quickly in hopes that this will lead to a quicker recovery can result in a
waste of these resources. The access and availability of resources is intertwined with the effective
and efficient use of these resources (Gladwell, 2000). Effective in this thesis means that the
intended and actual outcomes are the same. As recovery can be long and drawn out, resource use
should be spread out and resources used at the right time in recovery to achieve the most return
on their investment.
“until the building owner decides what he’s going to do, there’s really no point in me
even going to my lawyer to see what I can do as far as my lease is concerned… if I go
to my lawyer now, it’s costing money that I don’t really need to spend at the moment
because I’m probably asking questions that I can’t get answers to” – H2
6.9 Leadership
In the aftermath of a crisis, leadership that is visible and decisive is vital for the organisation.
Leaders should also be inspired and inspiring. Chamlee-Wright and Storr (2008) write how
inspiring leadership helped the recovery of some communities after Hurricane Katrina. It
emerged in interviews that the leader’s primary roles are to take charge, to make decisions and to
provide vision to staff and others outside the organisation that the situation will get better. From
the organisations interviewed, the role of the leader was slightly different depending on the size
of the organisation and the ownership structure. In the larger case study organisations that had a
lot more employees and different departments with different people in charge of those
departments, the leader’s responsibilities included overseeing the entire organisation’s response
212 Case studies
and recovery plans. The leader’s role was that of coordination between the different departments
as well.
In all the case study organisations, the leadership mantle was taken up by those already in
leadership or management roles prior to the earthquakes. Quarantelli (1986) found that in
disaster existing chains of command do not usually break down even as people may take on
extra roles. Interviewees reported that in the response phase of the crisis, the leaders mainly
made decisions and prioritised activities in the very short-term whereas in the recovery phase
their role was to balance short- and long-term recovery priorities and look at corporate strategy.
Apart from decision making and prioritisation, planning and the implementation of plans turned
out to be extremely important. Also, different ways of thinking were required and in evidence in
the different phases of the crisis (more on this in chapter 8). KTC1, T1 and T2 resumed
operations a short time after the event or did not close at all. They relayed how in the days
following the 22 February 2011 earthquake, their organisations had to deal with the crisis as well
as with business-as-usual involving existing customers.
Organisations soon understood that leadership in normal times is not the same as leadership in
crisis and that different styles of leadership are required for the two situations. In fact, from the
interviews, one lesson is that even in crisis, the style of leadership needed for the different
phases is varied. The response and early recovery phases require an almost autocratic style of
leadership while the medium-term phase requires more of a consultative style. For some
organisations in this study, it was not just about the leadership but also where they came from.
Organisations report that they brought in leaders or managers from other parts of their
organisations partly to relieve those who were from Christchurch but also because the job had
changed and increased in scope. Of note was the interaction between local people and outsiders; it
was apparent that even in the same organisation there were several sub-cultures. There
sometimes was local resentment at being told by outsiders what to do and how to do it. From
reports, in many cases it was the people who came from outside the region who needed to adjust
to how we do things around here. This was on top of working in a disaster setting.
6.9.1 Organisation ownership structure
Under leadership are also included characteristics that determine the structure of an organisation
and how decisions are made. These characteristics include the ownership arrangements, lines of
Key elements of sectoral recovery and resilience after the Canterbury earthquakes: A system dynamics approach
Hlekiwe Kachali
213
communication as well as external influences on the organisation’s recovery. Organisations that
are franchises or part of larger concerns were able to get help from their franchise or from other
parts of the larger organisation they were a part of. However, franchisees had less freedom to
manoeuver and adapt as they were bound by franchise regulations. Branch organisations got
help from their corporate headquarters while standalone organisations belonging to a larger
group also got offers of help from sister companies (see section 6.8.3 on manpower).
“…We brought in staff from Auckland and from Timaru, they were really good,
and we put them on our trucks, they were very experienced people” – T2
6.9.2 Communication
After the earthquakes, communication, modes of communication and quality of communication
were vital. This was both within and outside the affected organisations. A crucial aspect is that
after the Christchurch earthquakes, the means of communication functioned. It is possible that
in bigger disasters, means of communication can be cut off which would make recovery even
more difficult as the exchange of information is so important. Organisational leadership also
needed to communicate with the world outside the organisation, i.e. with the actors in the
organisation’s environment. This included being in touch and working with customers, suppliers,
local and national authorities as well as the public at large if necessary. Crucially, the messages
communicated must be the right ones (see also chapter 6.12 for the link between information
and communication). For instance, communication to customers to assure them of delivery of
goods and services.
“…all on a one to one, we had lots of meetings, lots of gatherings [within the
organisation and with customers]” - KTC1
Within the organisation, communication was needed to keep the staff informed of what was
going on, that there was a response and recovery plan, what the plan was and that things were
under control (as much as is possible during crisis times). Staff needed re-assurance and when
they knew that there was someone in charge they were encouraged to do as much as they could
towards the recovery of the organisation. Some of the organisations pointed out that an
organisation facing and getting through crisis together was the best team building exercise.

214 Case studies
In some organisations, new roles were defined for the response and recovery effort. This was in
essence a new organisational structure which brought with it the need to establish new channels
of communication in addition to those that already existed. Palen (2007) writes of the emergence
of temporary organisations and structures after disaster while Tobin (2007) speaks of
incorporating this feature in hazard planning.
6.9.3 Recognising and grasping opportunity
All the organisations interviewed pointed to the disruptive nature of the disaster even as the
different organisations were unsettled to different levels. As it is not possible to be prepared for
all crises, adapting to the changed and still changing disaster landscape is crucial. Findings by
Dervitsiotis (2003) as well as Boisot and Child (1999) point to an organisation’s ability to adapt
as one way of surviving through turbulent times. Some interviewees spoke of their pre-
earthquake organisational expansion and/or improvement plans having to be put on hold,
revised or discarded altogether. However, there was also recognition that there were
opportunities that organisations could grasp in the response and recovery phases. Some of these
opportunities included exploring what help was available and who to ask for this help. As well,
organisations expressed that adaptability was one way they reacted to the crisis, as a way of
getting ahead and staying ahead in an altered environment and market.
“…the whole dynamics of Christchurch has changed, so you’ve got to think, “Well
will that work or can I do something else better?” And yeah, so that’s the sort of the
beginnings of the recovery plans.” – H2
6.9.4 Sectoral leadership
Some of the respondents recognised the importance of their industry sector and their
organisation’s place within the sector. They rose to the challenge and took charge of
coordinating their sector’s response to the crisis. However, this had to be done in such a way
that they did not cause offence to the other organisations in the sector. Some of the reasons for
this were that it was easier to get people to cooperate willingly and also that the sector would still
need to work together after the response and recovery efforts.
“….the task of coordinating the entire industry to fix the problems in the [niche
industry sector] area...had to work with all our competitors really to make sure,
Key elements of sectoral recovery and resilience after the Canterbury earthquakes: A system dynamics approach
Hlekiwe Kachali
215
because if everybody is fighting each other and so on, it just doesn’t work in that
environment, it has to be a team approach so we had to coordinate and talk daily
with all our competitors and figure out who was going to do what” – T1
In the organisational literature, cooperation between competing organisations is termed
coopetition. Bengtsson and Kock (2000) have shown how competitors working together can both
benefit. However, this is partly dependent on whether or not they are competing for the same
resources.
6.9.5 Leadership of the overall recovery effort
Leadership of the overall post-disaster recovery is crucial as they can help facilitate the process
(Hummel et al., 2007; Nakagawa & Shaw, 2004; Rubin & Barbee, 1985). Case study
organisations were not directly asked who they thought was in charge of the overall recovery
effort. However, it was clear from information given during the course of the interviews that
there was confusion about who was really in charge of the recovery effort as opposed to who was
appointed to be in charge of leading the recovery of the greater Christchurch area. There also seemed
to be some confusion as to which organisation was performing which roles; this included the
government agencies as well as the many business associations that were prominent at the time.
This confusion sometimes led to organisations wasting time talking to the wrong people about
issues of recovery or in the extreme not talking to anyone at all. The uncertainty surrounding
who was in charge changed with time as more information became available. However, in some
cases, the effectiveness of the plans of recovery agencies did not give interviewees confidence.
6.10 Industry sector attributes
Recovery for organisations belonging to the industry sectors in this study was dissimilar. The
differing industry sector attributes and how they affected recovery are encapsulated as the
signifiers of recovery in section 7.7. Additionally, in chapter 9; from the aids, hindrances and
points of intervention in recovery, the critical success factors (CSFs) are a summary of what was
important for each sector on its path to recovery. From the case study interviews, supported by
the contextual interviews and revenue survey data, hospitality organisations were not recovering
at the same rate as those from the ICT sector. This was so even when revenue data for the entire

216 Case studies
sample set was checked. This has to do with the goods and services produced by the two sectors
and where their customers were based. For hospitality, the custom was mainly local and they
were dependent on customer discretionary spending. People held on to their discretionary
finances after the earthquakes as they waited to see how the economic situation would evolve.
For ICT, some of their main customers were outside the region and the country. As well, for
those that serviced the local Christchurch market, their services were required after the
earthquakes. In a study on business vulnerability to earthquakes and other disasters (Tierney &
Webb, 2001), it was shown that the manufacturing and construction sectors recovered quicker
than hospitality and retail. However, in Canterbury this was not the case as more organisations
from the building suppliers sector struggled in short-term recovery due to low sales volumes.
After the earthquakes and depending on industry sector, there was post-disaster cooperation
between organisations in the same or different industry sectors to assist each other’s recovery.
The industry sectors involved in specialist and non-substitutable goods and services reported
that collaboration within the industry sector helped in recovery. This theme is linked to the
sectoral leadership discussed above (section 6.9.4) and the awareness that the recovery of the
whole sector is vital to maintain certain sectoral and economic dynamics. Other cases of inter-
sectoral collaboration were between trucking and FMCG (see chapter 5).
“we had a number of competitors around us [in pre-earthquake location], and
we’ve been speaking with them, because we’d like to be back, we’d like to be
near each other, because obviously you feed off each other’s advertising” –
CCBD1
6.10.1 Type of goods and services provided
The kind of goods and services supplied by an organisation also contribute to its recovery after
disaster. This has also been documented in other work on disaster recovery (Alesch et al., 2009).
For some organisations, especially those dealing with goods and services dependent on
consumer discretionary spending, the organisation’s recovery might be hampered as consumers
spend less on items they do not consider vital. For example, high-end retail fashion might face a
slump after disaster. This was a finding by other disaster researchers also (Tierney & Webb,
2001). An extension of this is that the organisation’s goods and services are not required in the
aftermath of a crisis. One retailer from Lyttelton said she realised that the luxury products she

Key elements of sectoral recovery and resilience after the Canterbury earthquakes: A system dynamics approach
Hlekiwe Kachali
217
sold were not needed in the three or so months after the 22 February 2011 earthquake. On the
other hand, for firms providing essential and non-substitutable services, their challenge might be
the ability to meet demand in the aftermath of a disaster event. In Canterbury, this was seen in
the trucking, critical infrastructure and FMCG sectors.
6.10.2 Make-up for lost production
The possibility to make up for lost-production is also sector dependent. One ICT organisation
reported that they made up for lost production after they re-opened by working longer hours.
The success of this possibility though is closely linked to some of the other dimensions and sub-
themes discussed such as the wellbeing (mental and physical) of the organisation’s employees in
the aftermath of a disaster, the amount of damage to the organisation’s premises or equipment,
the type of product as well as knowing which customers to prioritise. These factors are in turn
dependent on other factors such as critical infrastructure availability and suppliers’ ability to
meet the needs of the organisation.
“…we probably lost I’d say three and a half to four working days … we had to catch
up with overtime…But then there’s getting that balance between overtime and not
stressing people out at work so that they went home to their families” – ICT1
6.11 Variety and diversity
Researchers such as Sheffi (2007), Dervitsiotis (2003) and Alesch et al (2009) have shown how
important various forms of diversity are for businesses. Diversity can be in the goods and
services provided, how those goods and services are delivered, the location of customers, the
number of suppliers and in the location of the organisation (Hamel & Prahalad, 1996; Lengnick-
Hall & Beck, 2005; Porter, 2000; Senge, 2006). From the case study organisations affected by the
earthquakes in Canterbury, organisations with more than one product line or with dispersed
customers or premises were somewhat able to compensate for disruption as they had
alternatives. For instance, diversity in the way an organisation delivers goods and services to its
customers can be crucial after disaster.
218 Case studies
6.11.1 Sources of revenue
Customer base
The ICT sector spoke of their clientele being mainly outside Christchurch. One of their biggest
challenges after the 22 February 2011 earthquake was to re-assure customers outside the region
and the country that they could still be relied on to deliver. This is in contrast to the hospitality
sector whose main customer base was in Christchurch.
Product
This is connected to the type of goods and services provided by a firm but even more is about
an organisation not being reliant on one product or on producing different products on the
same line which could be damaged in a disaster event. For instance, FMCG2 had multiple
product lines some of which were in higher demand after the earthquakes.
6.11.2 Geographic or locational
Studies (Chang & Falit-Baiamonte, 2002; Dahlhamer & Tierney, 1998) have shown that the
location of an organisation can affect recovery. Geographically, and for an event such as an
earthquake, ground or soil conditions and proximity to the epicentre can affect an organisation.
Geographic distribution can mean that the organisation has customers in different locations (e.g.
Christchurch and Auckland). It can also mean that an organisation has alternative premises for
operation, production or storage.
“…after [4] September [2010] we were surrounded by buildings that, one in
particular Manchester Courts, which affected our front entrance. So we had no
front entrance, so we were closed for probably three and a half to four weeks, just
under four weeks.” – CCBD2
6.11.3 Delivery of goods and services
The way in which an organisation delivers goods and services can aid recovery after disaster. For
example an organisation can interact with customers from its physical premises as well as
conduct business online. This also ensures a diversity of customer base as those shopping online
do not necessarily have to be in the same physical location as the organisation. As well, in the
Key elements of sectoral recovery and resilience after the Canterbury earthquakes: A system dynamics approach
Hlekiwe Kachali
219
case of a disaster event damaging physical premises, the organisation can still serve their existing
clientele but in a different way.
“…and our internet store is based just downstairs in [branch location], and that is
primarily, probably 50/50 between international and New Zealand, so that’s where
our international access comes, is through the internet” – CCBD1
This is of course also dependent on the type of goods and services delivered by the organisation,
for example, location specific businesses such as some in hospitality might not be able to deliver
online.
6.12 Information
The availability and quality of information were key to the decisions organisations made post-
disaster. Information and communication are intertwined (also see chapter 9); it might be
possible to communicate but still not inform. For instance the means of communication are one
feature but the value of the information is also essential. Organisations on the whole were aware
that things had changed. They report that in certain instances, they wanted to adapt but were
partly hamstrung by the lack of credible and useful information. One retailer from Kaiapoi
spoke of wanting to move undamaged merchandise to a different location in the town centre but
could not access geotechnical information on the quality of the soil the new building sat on.
The availability and quality of information is closely related to the uncertainty about who was in
charge discussed in section 6.9.5. As the uncertainty lessened, the quality of the information
given by recovery agencies was not always of the standard useful to organisations for recovery.
6.12.1 Official sources of information
Knowing which organisation is responsible for what and who is at the forefront of the recovery
effort is essential (see section 6.9.5 on leadership of overall recovery effort). Post-earthquake
there were a myriad of organisations that said they were speaking for businesses but that had
never been in touch with the businesses they claimed to represent. Conversely, a lot of the case
study organisations interviewed say they had not contacted these emergent or already existing
associations either, as they did not know what they stood for. Also affecting the recovery of

220 Case studies
some organisations was the lack of information on the timeline for demolition, cordon removal
and the overall recovery plan for the CBD.
“….but that sort of first six weeks was definitely the critical part – we had a
million dollars of stock in the central city…..We knew that the doors were open in
the stores when the staff left…..we knew that people were accessing the central
city, without authority…we didn’t know what was going on with it – we had no
idea, and we couldn’t get any information about it” – CCBD1
6.12.2 Sources of economic information
Economic information is to do with insurance payments and other external sources of funding
as well as with the general financial health of the organisation itself, the industry sector it belongs
to and the greater economy it is connected to. Concerning insurance, organisations outlined how
it was not just the delay in payment that was affecting their businesses but also the lack of logical
explanation for why there was this delay. This was in addition to what turned out to be
ambiguous wording contained in policy statements as to what their insurance policy actually
covered. However, the Earthquake Support Subsidy (ESS) mentioned in section 4.4.2 was
helpful.
6.12.3 Engineering and technical sources
This was one of the most difficult aspects of the Canterbury series of earthquakes in that no one
had an answer for when the shaking would end or when land assessments would be completed.
The continuing earthquake and aftershock sequence was one of the reasons given by insurance
companies for the continued delay of payments to policy holders. The earthquakes also affected
the pace of building demolition and the clearing of rubble.
“…when we have aftershocks…I’ve got to arrange with the oil company to send an
engineer out, and let the engineer, as I said before, the site, what it’s structural
integrity is.” – FMCG1
6.13 Sectoral comparisons
It has been shown that after the earthquakes, the sectors in this research were affected by the
pre-earthquake characteristics and conditions as well as the direct and indirect effects of the

Key elements of sectoral recovery and resilience after the Canterbury earthquakes: A system dynamics approach
Hlekiwe Kachali
221
earthquakes. The CBD and the town centres in this study were the financial nuclei of the towns
they are in. However, for some sectors such as critical infrastructure, ICT and FMCG, the
factors that affected their rates of recovery in the short-term were more to do with the
characteristics prior to the earthquakes. Some of these include the nature of goods and services
delivered, the location of organisational assets, and the ability to work from alternative locations.
Additionally, the direction of the rate of recovery can be positive or negative. The ICT sector
showed a more positive rate of recovery than building suppliers, the majority of whom were still
reporting revenue decreases 18 months after the 4 September 2010 earthquake. In contrast to
FMCG where the bulk of the organisations are part of larger groups of companies and had over
50 employees, 80% of the ICT organisations had between 1 and 20 employees and yet had a
larger percentage of organisations with a positive recovery rate coefficient (RRC) measured using
changes in organisational revenue after the earthquakes (more detail on RRC is in chapter 7.2).
This again shows the differences in consequences to sectors after disaster and that factors such
as customer location (see chapter 7.5 also) and demand for goods and services also play a part in
recovery after disaster.
Still using the number of employees as a measure of organisation size39, sectors were affected in
yet other ways. For example a lot of the ICT organisations had less than 20 employees while
those in critical infrastructure had more than 50 employees. Both sectors reported that the rise in
demand for their services after the earthquakes necessitated more staff. Critical infrastructure
solved this problem by using contractors. On the contrary, the pre-earthquake lack of skilled
manpower meant that the ICT sector just about had no contractors they could call on to
distribute the workload to.
For the Canterbury series of earthquakes, one of the environmental factors that appeared and
was extremely important was the effects the earthquakes had on employees. Again, the
earthquakes in Canterbury are unique in that they went on for as long as they did which took its
toll on the people in the region. Organisations report that in the medium-term they realised that
people were suffering severe fatigue which was affecting their performance at work and
39 Appendix I has additional analysis on effects to organisations based on size calculated using full-time equivalent staff count.

222 Case studies
consequently the recovery of the organisation. This fatigue applied to even those who did not
have physical damage at home.
Organisations belonging to larger concerns such as franchises or branch organisations reported
receiving support from their corporate offices as a help in recovery. However, these
organisations also spoke of the strain of the ongoing earthquakes on their relationships with
their corporate offices. They detailed how they sometimes underplayed the effects of the
earthquakes when they had discussions with their head offices. Organisations also said people
from outside their organisation’s greater Christchurch office really only understood what was
going on when they came to view the devastation for themselves first-hand. However, this
goodwill could not go on forever. Some managers in Christchurch felt that if there was a report
of negative earnings in the extended time periods after the earthquakes, their head office might
decide to relocate the office to an alternative location outside the greater Christchurch region.
Two of the managers from case study organisations reported how they had not shared such
concerns with other staff in their Christchurch office until the situation was clearer. However,
such actions even when done with the best of intentions show the amount of strain leaders may
bear in the recovery period. Norwood (1997) documents how this kind of strain in disaster
situations can lead to fatigue while Dynes (1974) asserts that this overwork and fatigue in
disaster situations can lead to bad decisions.
Other sectoral differences were also apparent, for instance in the area of documented crisis or
emergency plans. Critical infrastructure and FMCG were the sectors most likely to have
organisations with documented crisis and emergency plans, more so in the critical infrastructure
sector. This was the same for the practise of crisis or emergency plans. The FMCG sector partly
attributed this to their sector’s handling of food which requires extra attention. However, the
hospitality sector also handles food and yet neither the prevalence of documented crisis and
emergency plans nor the rehearsal of these plans was as high as in the FMCG sector. In
interviews, hospitality organisations detailed how they had preparedness plans such as fire
extinguishers or first aid kits and other measures designed to preserve life of staff and clients.
However, they did not have plans for how their organisation would operate in a crisis or in
recovery after a crisis. In essence, the organisations with plans for life safety were prepared for
hazards they thought were likely to affect them and did not take in broader hazard risks. Analysis
of the sample shows that the hospitality organisations had fewer employees than FMCG
Key elements of sectoral recovery and resilience after the Canterbury earthquakes: A system dynamics approach
Hlekiwe Kachali
223
organisations: organisational size may be a factor in the level of preparation for crisis. Some of
the organisations that did not have crisis or emergency plans pointed to the fact that these plans
would not have been useful after the earthquake. However, prior planning may mean that the
organisation has a set of steps to follow in disaster that may help them recover quicker. Other
disaster researchers (e.g. Zolin and Kropp (2007), Zhang et al (1973), Corey and Deitch (1987)
and Tierney (2004)) found that preparedness was not a significant factor in recovery but that
larger organisations were the more likely to have emergency plans.
None of the sectors reported being affected greatly by the inability of suppliers to meet demand.
However, disruption to business operations took the form of customer issues, the other side of
the supply web (chapters 5 and 7 contain more detail on this). This was especially highlighted in
the hospitality sector because of their direct link to customer discretionary spending. Other
sectors such as FMCG also reported having customer issues; customers could not access their
premises due to damaged road infrastructure or nearby buildings and in some cases thought they
were closed. Trucking and FMCG organisations reported having the bulk of their custom from
their local place of business (e.g. Christchurch or Kaiapoi) and yet just after the earthquakes, the
goods and services of truckers were more in demand than for FMCG.
From a sectoral perspective, industry leaders spoke of a critical mass of organisations to make
the sector viable in the region. This means that if the earthquakes shocked one organisation into
moving out of the region, then the benefits to remaining organisations may decline and lead to a
mass egress of organisations from the region. Considering the interdependence between sectors,
the implications of one sector leaving the region might be that other sectors also leave the
region. For instance, as explained in chapter 5, the ICT sector is considered a key high-growth
sector in Canterbury. It has also been described as a pull sector for the region (Canterbury
Development Corporation, personal correspondence, 2012). This means that the presence of the
ICT sector leads to the establishment of other organisations supplying goods and services to
them. If they were to leave Canterbury, this may mean that these ICT supplier organisations may
also leave or close. The interdependence between sectors will also be illustrated in chapter 8.
The organisations in the geographic sectors shared some similarities in the pre-existing elements
that led to some of the consequences for them. For instance, they all had a large number of
224 Case studies
unreinforced masonry buildings that proved vulnerable to the ground motions produced by the
earthquakes and had to be torn down. Organisations occupied these unreinforced masonry
buildings for various reasons. They reported that the rent was cheaper but importantly, these
organisations had locational advantage in the number of customers they had in close proximity
almost every day. This advantage turned into a disadvantage after the earthquakes as they lost
their premises. More organisations in Christchurch CBD had a higher closure impact factor than
those in Kaiapoi or Lyttelton Town Centres. For the Christchurch CBD, their plight was even
more concerning as the cordon that was around the city was there for an unprecedented amount
of time when compared to other big disasters outside New Zealand such as the earthquake in
Santa Cruz (Comerio, 2011). The cordon was placed there mainly for the public’s protection due
to the number of unsafe buildings that had yet to come down. The cordon also acted as a barrier
to access of premises for those whose premises were located within the cordon.
The recovery of the Christchurch CBD and the organisations to be based there depends partly
on what will be contained in the plan for recovery. Some retail organisations that were in the
CBD spoke of not wanting to go back if their competitors, with whom they shared mutual
benefits such as a shared customer base, could not go back. Some of the reasons given for
organisations not being able to go back were that they would be locked into leases they could
not get out of or that the part of town they had moved to was more ideal than the prospect of
going back to the CBD.
6.14 Chapter summary
In this section, case studies were used to illustrate how vulnerable organisations can be to
hazards and that recovery is a complex operation that involves collaboration and alignment with
multiple actors from different sectors. All the industry sectors involved in the case studies
reported being affected in one way or another, positively or negatively, by the earthquakes.
Consequently, aggregated regional or national reports of disaster effects mask the true extent of
damage, physical and otherwise, that disaster can cause.
The findings from the case studies corroborate some of the findings from the contextual
interviews and survey data. From all three points of data collection, staff, access to resources,
some form of business continuity planning as well as information and communication are vital

Key elements of sectoral recovery and resilience after the Canterbury earthquakes: A system dynamics approach
Hlekiwe Kachali
225
in recovery. Additionally, neighbourhood effects and industry sector attributes such as type of
goods and services delivered also affect post-disaster recovery
However, from the myriad components that came together to affect operations, many of the
facets of the rate of recovery in the short-term are not entirely dependent on measures
organisations take prior to disaster. As the organisations themselves stated, a certain level of
organisational preparedness is helpful, however, measures at the level of the organisation may
prove inadequate for a disaster on a regional scale such as happened in greater Christchurch. The
characteristics of the event and the ecological conditions that resulted from that were also at
play. For instance, the majority of organisations had insurance and yet they still faced difficulties
in insurance companies settling claims. Other ecological factors relate to the recovery decisions
that were made after the earthquakes such as decisions on cordons and access to buildings. An
organisation’s actions are governed by its environment to the extent that the organisation is
dependent on this environment.
Furthermore, investigating sectoral and spatial effects of earthquakes is necessary for
determining what actions organisations can take to prepare for as well as reduce the effects of
disaster. The actions and decisions taken in the different stages of the recovery process also act
to inform recovery. Knowing what influences organisational and sectoral recovery, and at what
point in the recovery timeline, can be used to inform policy decisions. This knowledge can also
contribute towards increasing organisational and sectoral disaster resilience.
The next chapter brings together results and analysis from the quantitative and qualitative parts
of this research to determine the most significant contributors to recovery for organisations in
the greater Christchurch area after the 2010 and 2011 earthquakes.

226 Significant contributors to sectoral and organisational short-term recovery
7 Significant contributors to sectoral and organisational short-
term40 recovery
This chapter presents results of the investigation on whether the determinants of organisational
and sectoral short-term recovery documented after other disasters are the same for Canterbury
after the 2010 – 2011 earthquakes. These contributing factors of short-term recovery from other
disaster events were reviewed, based on the existing literature on disaster recovery, in chapter 2.
In this thesis, the determinants of short-term recovery are called components and are arranged
into three groups of contributors. The contributors are: (1) level of organisational or sectoral
resilience; (2) pre-disaster characteristics; and (3) direct and indirect post-earthquake effects. The
contributors and components of organisational and sectoral short-term recovery are correlated
against a sectorally comparable measure of short-term recovery, post-earthquake revenue, that
was articulated by the organisations participating in this research. Results from the correlations
are used to determine the effect size, if any, that each contributor and component has on short-
term recovery. Thereafter, based on the correlation results and the case study and interview data,
signifiers of short-term recovery are arrived at for organisations and sectors affected by the
Canterbury earthquakes of 2010 - 2011.
It is worth remembering that every disaster is unique and in Canterbury there were multiple
elements that made this so. First is that organisations faced a series of earthquakes since the first
MW 7.1 on 4 September 2010 as opposed to just one major event. The continuing earthquakes
and aftershocks acted to reset the recovery clock for organisations thereby making it more
challenging to advance from the mindset of response to recovery (in general) both of which
require a different set of skills. Second is that the earthquake of 22 February 2011, although
smaller in magnitude (MW 6.3) released more energy close to the Christchurch CBD than that of
4 September 2010. The 22 February 2011 earthquake showed some of the highest vertical peak
ground accelerations (PGA) associated with an earthquake (Bradley, 2012). As well, the
cumulative effects of multiple earthquakes caused more damage. Third is that the physical
effects of the earthquakes were localised at multiple levels within a larger system. The first level
of localisation was that the event was within New Zealand and the second is that the effects
40 In this chapter, references to recovery are taken to mean recovery in the overall sense to differentiate from
recovery in the short-term. See section 7.1.1 that follows.
Key elements of sectoral recovery and resilience after the Canterbury earthquakes: A system dynamics approach
Hlekiwe Kachali
227
were contained to within the South Island of New Zealand. Lastly, the physical effects were
more pronounced within the Canterbury region: specifically to certain parts of the greater
Christchurch area such as the CBD and eastern suburbs of Christchurch. This localisation
enabled assistance and resources for earthquake damaged areas from other parts of the region
and the country. This was in two primary ways. First, assistance and resources could get to the
affected organisations and second, unaffected parts could send assistance and resources quickly.
For instance, organisations with premises in earthquake damaged locations were able to relocate
to undamaged areas or personnel available from other parts of the region or country could get to
the greater Christchurch area. In addition, organisations with headquarters or primary
distribution centres in the greater Christchurch area, described how recovery would have been
made more difficult if the severe damage caused by the earthquakes had been more widespread
(see sections 6.6.4 and 6.7 for more).
Consequently, some of the lessons from this work are singular to the greater Christchurch area.
At the same time, some of the lessons are general enough that they can be applied to other
organisations, inside and outside New Zealand, to better prepare them for crises or to help them
recover afterwards. Again, the analysis presented in this section (and in chapters 8 – 10 that
follow) is based on combined results from the surveys41, contextual interviews and case studies
presented in earlier chapters.
7.1.1 Disaster management cycle – response and short-term recovery
As was pointed out in the introductory chapter of this thesis, the disaster management cycle is
characterised by different, overlapping, phases (see section 1.4 and for more detail). The data for
this thesis were collected in the response and short-term recovery phases after the earthquakes in
Canterbury. Response is the time period immediately following a disaster event when essential
services are restored. Short-term recovery is the period up to two years after a disaster event.
Consequently, it is important to remember that the results in this chapter are a reflection of the
situation in the post-earthquakes response and short-term recovery periods. It is the opinion of
this thesis that the short-term recovery period can be described as a transitional, chaotic post-
41 Lyttelton did not take part in Survey; two of the components used to calculate the more significant contributor to recovery
were not used for the Lyttelton sample as those data were collected in Survey 1.
228 Significant contributors to sectoral and organisational short-term recovery
disaster phase that organisations need to go through in trying to meet the objective of long-term
recovery. For instance, from section 2.3.3, Turner describes the first stages after the occurrence
of a crisis as having ad hoc adjustments which permit the work of rescue and salvage to be started. This
corresponds to the response phase. Furthermore, Alesch et al (2009) have written on how both
the response and short-term recovery after disaster can be characterised by uncertainty and
ambiguity. Therefore, it should be noted that the measure of recovery used herein is also affected
by the time span of the work, i.e. the response and short-term recovery period. Additionally, it
should be kept in mind that the statistical instruments, correlation and regression, used in this
chapter to verify cause and effect have been used on data collected during the very dynamic
situation after the earthquakes. The dynamism and complexity of the Canterbury system post-
earthquakes is captured in chapter 8. The numerous interactions between the system agents
illustrates that the interactions in the response and short-term recovery phases after disaster are
characterised by different behaviour leading to different emergent scenarios.
Importantly, from the systems perspective used in this thesis, the time horizon for analysis of a
system cannot be overemphasised (see chapter 2.2.2). System dynamics analysis must reach far
enough into the past to show how a problem may have started as well as the symptoms and,
especially in the case of disaster, it should also go far enough into the future that it can show
the delayed, indirect, unforeseen effects. This has been discussed extensively by systems thinkers
such as Forrester (1999), Meadows (1998), Sterman (2000). Therefore, for future research and
outside the scope of this thesis (see chapter 11 on future work), there is the need to investigate
organisational recovery trajectories at longer times from the occurrence of the event and using
multiple indicators (financial and non-financial) of organisational recovery. For instance after the
Loma Prieta earthquake, studies at two separate times with the same organisations showed
different results. Dahlhamer and Tierney (1998) found that the industry sector an organisation
belonged to was not a statistically significant predictor of short-term business recovery whereas
Webb et al. (2002) found that industry sector was indeed a strong predictor of long-term
recovery.
Throughout this chapter, to better illustrate the results, there is a distinction made between
short-term recovery and recovery in general.
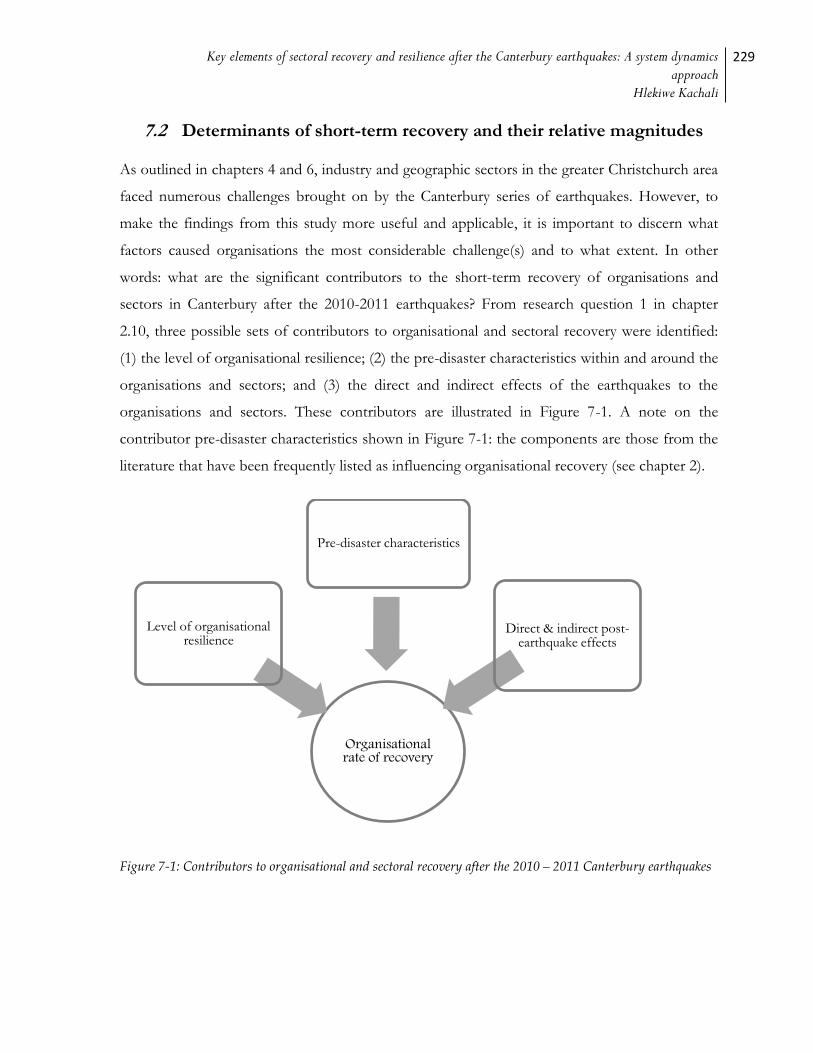
Key elements of sectoral recovery and resilience after the Canterbury earthquakes: A system dynamics approach
Hlekiwe Kachali
229
7.2 Determinants of short-term recovery and their relative magnitudes
As outlined in chapters 4 and 6, industry and geographic sectors in the greater Christchurch area
faced numerous challenges brought on by the Canterbury series of earthquakes. However, to
make the findings from this study more useful and applicable, it is important to discern what
factors caused organisations the most considerable challenge(s) and to what extent. In other
words: what are the significant contributors to the short-term recovery of organisations and
sectors in Canterbury after the 2010-2011 earthquakes? From research question 1 in chapter
2.10, three possible sets of contributors to organisational and sectoral recovery were identified:
(1) the level of organisational resilience; (2) the pre-disaster characteristics within and around the
organisations and sectors; and (3) the direct and indirect effects of the earthquakes to the
organisations and sectors. These contributors are illustrated in Figure 7-1. A note on the
contributor pre-disaster characteristics shown in Figure 7-1: the components are those from the
literature that have been frequently listed as influencing organisational recovery (see chapter 2).
Figure 7-1: Contributors to organisational and sectoral recovery after the 2010 – 2011 Canterbury earthquakes
Organisational rate of recovery
Level of organisational resilience
Pre-disaster characteristics
Direct & indirect post-earthquake effects

230 Significant contributors to sectoral and organisational short-term recovery
7.3 Short-term recovery rate coefficient (Short-term RRC)
It is useful to have a variable that can be used as a measure of the rate of organisational and
sectoral short-term recovery to which the components can be compared and one that is usable
across all sectors. As shown in section 2.3 the definition of recovery after disaster is contextual
and subjective. In other organisational disaster studies, measures of recovery include the time
taken for an organisation to recover (e.g. (Alesch et al., 2009)) or the self-report post-disaster status
of the organisation (e.g. (Dietch & Corey, 2011)). Although using slightly different lenses, in
both these studies, the measures of organisational recovery translated into the post-disaster
revenue changes organisations experienced. Returning to or increase on pre-disaster levels of
revenue is used as a marker for recovery. For instance, Sidel and Enrich (1998) show how, from
the investor perspective, revenue growth for an organisation is more important than expenditure
savings from cutting costs.
In interviews for this study, organisations were asked how they would measure recovery for their
organisations. All the organisations queried reported that they would compare pre- and post-
earthquake revenue (or budgets in the case of some governments departments) to analyse how
well their organisation was performing after the Canterbury earthquakes. Like Sidel and Enrich
(1998), Ailawadi et al (1999b) also write that organisations have a focus on financial performance
indicators because they are easier to interpret.
As organisations had spoken of a financial measure, they were also asked about other possible
financial measures of organisational recovery such as return on investment (ROI), profits and
sales. Revenue has the advantage that it is reported for goods and services that have been
delivered. Post-earthquake, revenue can also be directly compared to the organisation’s
expenditure. ROI has the disadvantage that the different organisations have various ways in
which they value the assets that contribute to this metric. Also, ROI is based on historic data.
Gunasekaran et al (2001) point to ROI decisions being based on the perspective at the time the
ROI calculations were done. It can be concluded that for earthquake affected organisations in
Canterbury, the ROI investments most likely did not allow for earthquake activity. Some of the
same reasons for not using ROI as a post-earthquake gauge of organisational recovery apply to
profit also. Bruns (1998) put forward that the historical information profit calculations are based
on does not indicate future performance. As well, using profit as a measure for all organisations
Key elements of sectoral recovery and resilience after the Canterbury earthquakes: A system dynamics approach
Hlekiwe Kachali
231
is problematic because different organisations calculate and report their profits dissimilarly
(Spathis, 2002). Additionally, reported profits are used by investors to make decisions about
whether or not to invest in an organisation. Therefore, it is in the organisation’s best interest to
present a favourable profit position (Beaver & Demski, 1974; Hunton, Libby, & Mazza, 2006).
When asked if sales would be an acceptable metric for measuring organisational rate of recovery
after the earthquakes, organisations replied that sales figures would show customer orders but
would not reflect that those orders had been honoured or that they had been paid for. It appears
that among interviewed organisations, the idea of sales differs. On closer examination, it seems
that the distinction is to do with the recorded amount of ordered goods and services as opposed
to the payment for these goods and services.
Considering the different sectors involved in the study and their responses when asked how they
would measure recovery, revenue was deemed the most suitable metric. Organisations thus
characterised recovery as a return to pre-earthquake levels of revenue or better. Figure 7-2
illustrates how organisations visualised their recovery. The + and – signs in the figure indicate
the post-earthquake direction of revenue change. Therefore, using revenue change data available
from Survey 2, a short-term recovery rate coefficient (short-term RRC) was determined for each
organisation. Organisations were asked about changes in revenue for two consecutive time
periods. Period 1 was between 4 September 2010 and 22 February 2011. Period 2 was after 22
February 2011 up to September 2011. Each instance of revenue decrease was assigned a score of
-1, each increase was +1 and no change in revenue was assigned a zero (0). Points for an
individual organisation, for each time period, were added to give the organisational short-term
RRC. The maximum short-term RRC value after Survey 2 is +2, an increase in revenue in each
of the time periods, while the minimum short-term RRC value is -2 which corresponds to a
decrease in revenue in each of the time periods. As with other metrics, the short-term RRC has
limitations as well as advantages. A limit to using the short-term RRC, in this case, is that it asks
about consecutive time periods in the chaotic short-term period after a disaster. The effects to
organisations in this time period may not be a reflection of their ability to recover in the
medium- to long-term. However, an advantage is that organisations can track the effects of
disaster to the organisation using a measure they understand. Also, it is possible for
organisations to use this short-term RRC information before a disaster happens. From analysis

232 Significant contributors to sectoral and organisational short-term recovery
of revenue change patterns, organisations can plan for and mitigate effects that manifest in the
period immediately following a disaster event. For instance, organisations can take actions like
ensuring availability and access of resources for a longer period after a disaster happens when
revenue might be low.
Figure 7-2: Organisational post-earthquake levels of recovery (using revenue changes) as defined by
organisations and sectors after the Canterbury earthquakes
Organisations were not explicitly asked to compare revenue changes with those from the same
period in the previous financial year or with changes from the time period immediately prior to
the ones asked about. However, some of the respondents spoken to described that their usual
revenue comparisons were year-on-year as that is how they normally analysed revenue changes.
Some organisations further stated that this way of comparing revenue changes took in to
consideration that revenue was different dependent on time of year. For instance, one hospitality
organisation (selling beverages) reported that revenue always increased in the summer months
while a retail organisation also pointed to an increase in revenue when people purchased
camping equipment in preparation for summer holidays. Table 7-1 shows the percentage of
organisations from each sector with specific RRC values after the 22 February 2011 earthquake.
Above pre-earthquake levels of revenue
Pre-earthquake levels of revenue
Below pre-earthquake levels of revenue
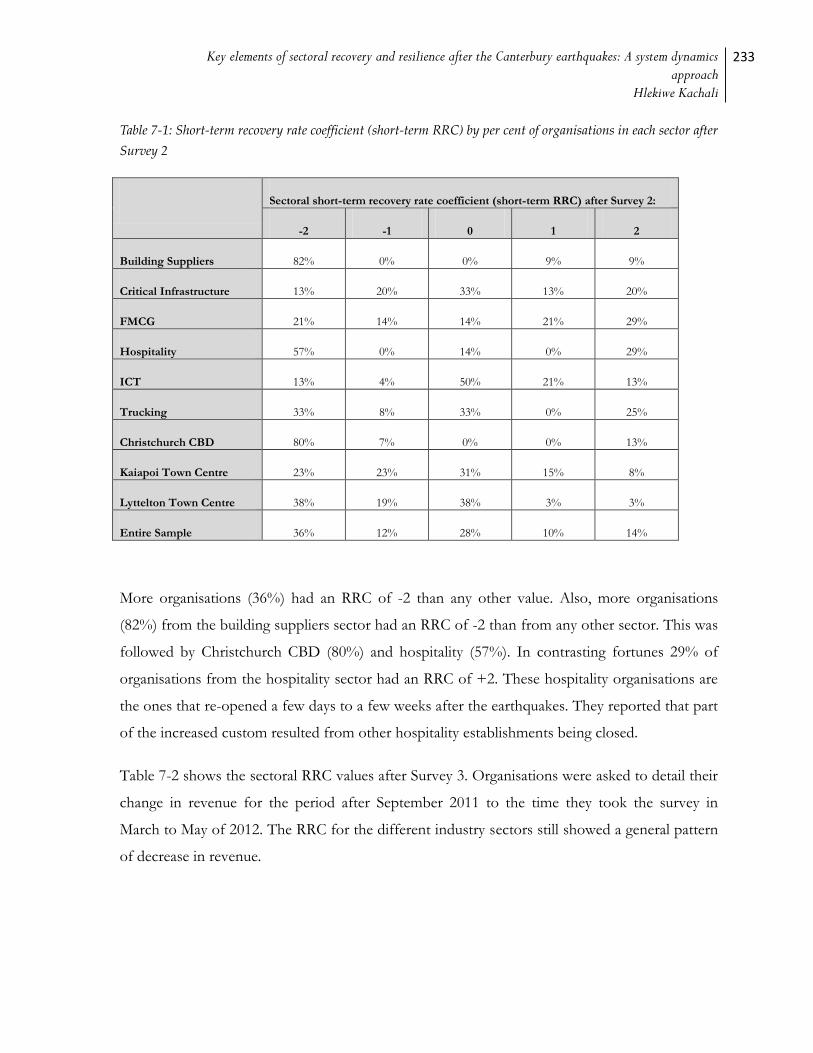
Key elements of sectoral recovery and resilience after the Canterbury earthquakes: A system dynamics approach
Hlekiwe Kachali
233
Table 7-1: Short-term recovery rate coefficient (short-term RRC) by per cent of organisations in each sector after
Survey 2
Sectoral short-term recovery rate coefficient (short-term RRC) after Survey 2:
-2 -1 0 1 2
Building Suppliers 82% 0% 0% 9% 9%
Critical Infrastructure 13% 20% 33% 13% 20%
FMCG 21% 14% 14% 21% 29%
Hospitality 57% 0% 14% 0% 29%
ICT 13% 4% 50% 21% 13%
Trucking 33% 8% 33% 0% 25%
Christchurch CBD 80% 7% 0% 0% 13%
Kaiapoi Town Centre 23% 23% 31% 15% 8%
Lyttelton Town Centre 38% 19% 38% 3% 3%
Entire Sample 36% 12% 28% 10% 14%
More organisations (36%) had an RRC of -2 than any other value. Also, more organisations
(82%) from the building suppliers sector had an RRC of -2 than from any other sector. This was
followed by Christchurch CBD (80%) and hospitality (57%). In contrasting fortunes 29% of
organisations from the hospitality sector had an RRC of +2. These hospitality organisations are
the ones that re-opened a few days to a few weeks after the earthquakes. They reported that part
of the increased custom resulted from other hospitality establishments being closed.
Table 7-2 shows the sectoral RRC values after Survey 3. Organisations were asked to detail their
change in revenue for the period after September 2011 to the time they took the survey in
March to May of 2012. The RRC for the different industry sectors still showed a general pattern
of decrease in revenue.
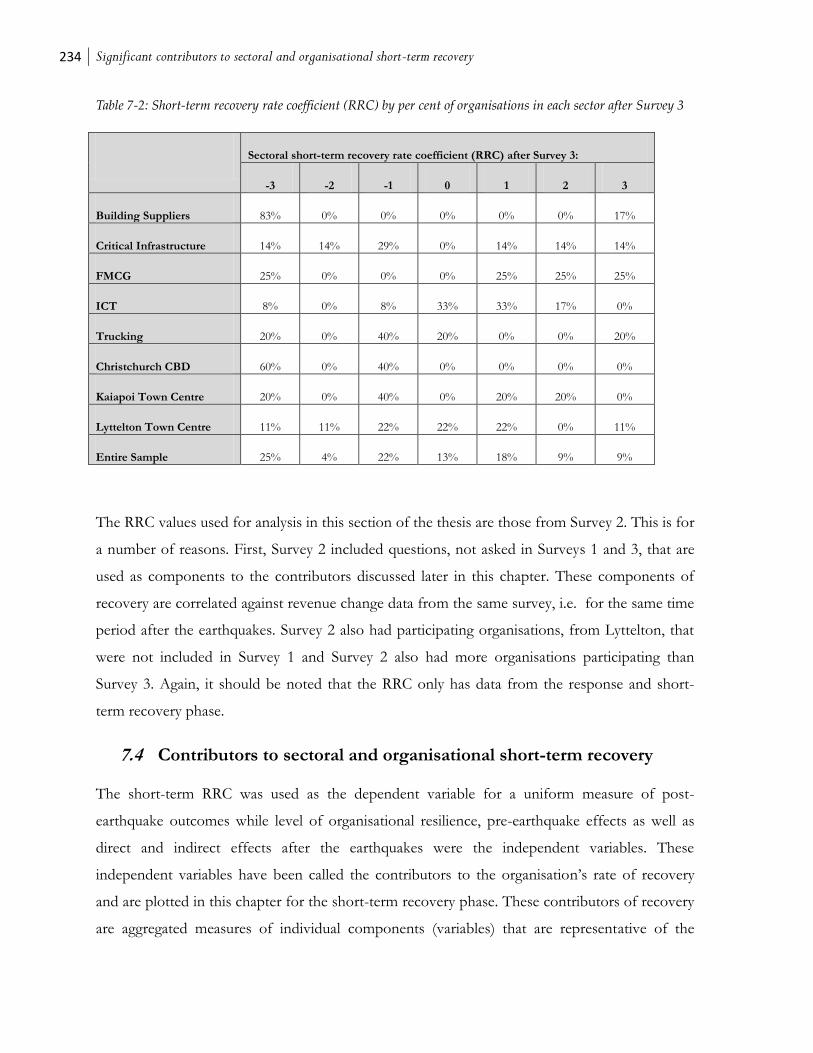
234 Significant contributors to sectoral and organisational short-term recovery
Table 7-2: Short-term recovery rate coefficient (RRC) by per cent of organisations in each sector after Survey 3
Sectoral short-term recovery rate coefficient (RRC) after Survey 3:
-3 -2 -1 0 1 2 3
Building Suppliers 83% 0% 0% 0% 0% 0% 17%
Critical Infrastructure 14% 14% 29% 0% 14% 14% 14%
FMCG 25% 0% 0% 0% 25% 25% 25%
ICT 8% 0% 8% 33% 33% 17% 0%
Trucking 20% 0% 40% 20% 0% 0% 20%
Christchurch CBD 60% 0% 40% 0% 0% 0% 0%
Kaiapoi Town Centre 20% 0% 40% 0% 20% 20% 0%
Lyttelton Town Centre 11% 11% 22% 22% 22% 0% 11%
Entire Sample 25% 4% 22% 13% 18% 9% 9%
The RRC values used for analysis in this section of the thesis are those from Survey 2. This is for
a number of reasons. First, Survey 2 included questions, not asked in Surveys 1 and 3, that are
used as components to the contributors discussed later in this chapter. These components of
recovery are correlated against revenue change data from the same survey, i.e. for the same time
period after the earthquakes. Survey 2 also had participating organisations, from Lyttelton, that
were not included in Survey 1 and Survey 2 also had more organisations participating than
Survey 3. Again, it should be noted that the RRC only has data from the response and short-
term recovery phase.
7.4 Contributors to sectoral and organisational short-term recovery
The short-term RRC was used as the dependent variable for a uniform measure of post-
earthquake outcomes while level of organisational resilience, pre-earthquake effects as well as
direct and indirect effects after the earthquakes were the independent variables. These
independent variables have been called the contributors to the organisation’s rate of recovery
and are plotted in this chapter for the short-term recovery phase. These contributors of recovery
are aggregated measures of individual components (variables) that are representative of the
Key elements of sectoral recovery and resilience after the Canterbury earthquakes: A system dynamics approach
Hlekiwe Kachali
235
contributors. From Surveys 1 and 2, different components representing pre-earthquake
characteristics and direct and indirect effects were assigned to the different contributors. For
example, an organisation’s cash flow situation prior to disaster is one of the elements considered
a component of the contributor pre-earthquake effects. The planning and adaptive capacity
factors make-up the contributor organisational resilience. Analysis of the indicators of recovery
shows that organisations leaned in the direction of one of the two factors of organisational
resilience. This is one of the reasons for the use of the factors of resilience as the components of
the contributor organisational resilience. As well, for reasons of space and to avoid repetition,
the individual indicators of recovery are discussed at length in chapter 10.
Details of the contributors to organisational recovery rates and their components are in Figure
7-3. The selection of components for each contributor was done based on a review of the
literature (see chapter 2) and in consideration of the geographical context of the research and the
sectors involved. For example, organisational closure for both the 4 September 2010 and 22
February 2011 earthquakes was included as the earthquakes caused different levels of damage
and in different locations.
The components of recovery can be thought of as indicators of recovery. Freudenberg (2003)
writes that indicators are measures, qualitative or quantitative, formulated from factual
observation and that act to better explain and convey complex circumstances. Nardo et al (2005)
add that using multiple indicators, or in this case components, brings together information of
different concepts that cannot be properly represented by an individual indicator or variable.
Additionally Freudenberg explains that indicators show the relative position of what is being
measured and when evaluated over time can show the magnitude and direction of change.

236 Significant contributors to sectoral and organisational short-term recovery
Figure 7-3: Organisational rate of recovery and contributors to organisational and sectoral recovery42
Weighting of the components and contributors of recovery43
For the purposes of this thesis, the weights of the contributors of recovery are taken to be equal.
This is because weighted aggregation would imply that the weightings of the different
components in the contributors are known. For the data in this study this is yet to be
ascertained. Additionally, this method of data aggregation leads to the loss of resolution. For
example on the pre-earthquake conditions contributor which has a total score of six: if one
organisation had component scores of (1, 0, 0.5, 0.5, 0.8, and 0.2) while another had component
scores of (0, 1, 0, 1, 0, and 1); both organisations would have a contributor score of three out of
six. However, the weight of the contributing components varies and this is lost when the
individual component scores are aggregated and added. In fact one of the aims of the study is to
determine the influence of each contributor. Consequently, the weighted method of aggregation
for the contributors will not be used at this stage.
42 One Full time equivalent (FTE) equals 1 employee working full time. For closure impact factor items, see question 16 in
appendix G.
43 Appendix N contains alternative data analysis technqiues that were attempted but have not been used
Pre-disaster conditions
• Full time equivalent (FTE)
• Insurance
• Crisis or emergency plan
• Practise crisis or emergency plan
• Cash flow
• Average annual sales growth
Organisational resilience
• Planning
• Adaptive Capacity
Direct & indirect impacts of
earthquakes
• Overall level of effect
• Regular suppliers' capability
• Change in customer base
• Closure September
• Closure February
• Closure impact factor
• FTE redundacies
• FTE hires
Organisational rate of recovery
Key elements of sectoral recovery and resilience after the Canterbury earthquakes: A system dynamics approach
Hlekiwe Kachali
237
7.4.1 Regression and correlation
Regression analysis is the name given to the family of techniques used for analysing and
modelling multiple variables. It is the study of dependence between variables (Asuero, Sayago, &
Gonzalez, 2006). Regression techniques are used when the focus is on the relationship between
a dependent variable and one or more independent variables. Regression analysis aids in the
understanding of the relationship and the strength of the relationship between two variables.
The strength of the relationship between two variables in a statistical population is called the
effect size. In analysing the interdependence between variables, their correlation values are used
(Asuero et al., 2006). For regression, the short-term recovery rate coefficient (short-term RRC)
will be plotted against all the component values and the coefficients of determination (R2) for each
relationship will be used to show the strength of the relationship. The computations will be
based on the entire sample in the study as opposed to at the sectoral level. This is because the
overall sample size is larger than the individual sector sample sizes. R2 is derived from the
regression equation whose standard form is Y = a + bX where
Y is the estimated score for the dependent variable;
X is the score for the independent variable;
b is the slope of the regression line; and
a is the intercept, or the point on the vertical axis where the regression line crosses the
vertical y-axis.
The regression equation states the mathematical relationship between the two variables being
investigated. The regression line on a graph can be used to predict the value of the dependent
variable for any value of the independent variable. The differences between these predicted
values and how far the dependent variables are from the regression line are called residuals. A
graphical plot of the residuals also shows how well the estimated regression line, R2 value, fits
the data.
R2 is the square of the correlation coefficient (r) and is a value between 0 and 1: 0 indicates no
relationship and 1 indicates a very strong relationship between variables. In the case of two
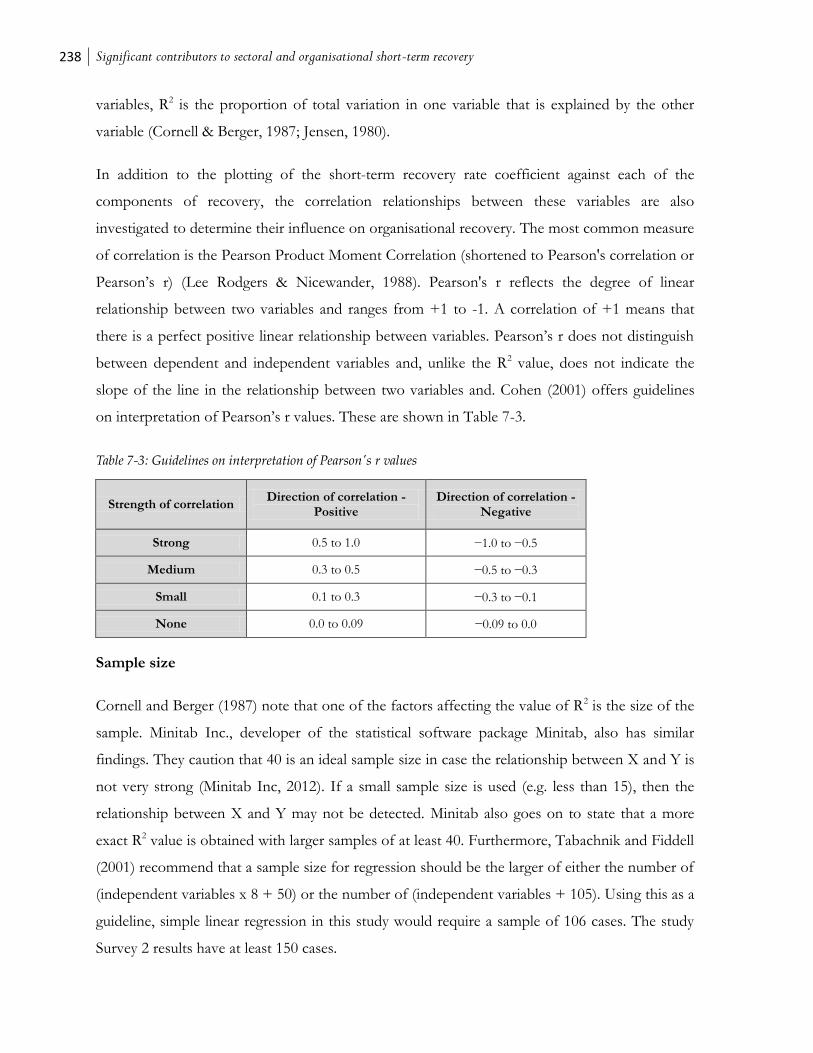
238 Significant contributors to sectoral and organisational short-term recovery
variables, R2 is the proportion of total variation in one variable that is explained by the other
variable (Cornell & Berger, 1987; Jensen, 1980).
In addition to the plotting of the short-term recovery rate coefficient against each of the
components of recovery, the correlation relationships between these variables are also
investigated to determine their influence on organisational recovery. The most common measure
of correlation is the Pearson Product Moment Correlation (shortened to Pearson's correlation or
Pearson’s r) (Lee Rodgers & Nicewander, 1988). Pearson's r reflects the degree of linear
relationship between two variables and ranges from +1 to -1. A correlation of +1 means that
there is a perfect positive linear relationship between variables. Pearson’s r does not distinguish
between dependent and independent variables and, unlike the R2 value, does not indicate the
slope of the line in the relationship between two variables and. Cohen (2001) offers guidelines
on interpretation of Pearson’s r values. These are shown in Table 7-3.
Table 7-3: Guidelines on interpretation of Pearson's r values
Strength of correlation Direction of correlation -
Positive Direction of correlation -
Negative
Strong 0.5 to 1.0 −1.0 to −0.5
Medium 0.3 to 0.5 −0.5 to −0.3
Small 0.1 to 0.3 −0.3 to −0.1
None 0.0 to 0.09 −0.09 to 0.0
Sample size
Cornell and Berger (1987) note that one of the factors affecting the value of R2 is the size of the
sample. Minitab Inc., developer of the statistical software package Minitab, also has similar
findings. They caution that 40 is an ideal sample size in case the relationship between X and Y is
not very strong (Minitab Inc, 2012). If a small sample size is used (e.g. less than 15), then the
relationship between X and Y may not be detected. Minitab also goes on to state that a more
exact R2 value is obtained with larger samples of at least 40. Furthermore, Tabachnik and Fiddell
(2001) recommend that a sample size for regression should be the larger of either the number of
(independent variables x 8 + 50) or the number of (independent variables + 105). Using this as a
guideline, simple linear regression in this study would require a sample of 106 cases. The study
Survey 2 results have at least 150 cases.
Key elements of sectoral recovery and resilience after the Canterbury earthquakes: A system dynamics approach
Hlekiwe Kachali
239
7.4.2 Overview
Each of the components of recovery is plotted directly against the short-term RRC and the R2
value computed. This is depicted in the scatter diagrams in Figures 7-5 to 7-21. Scatter diagrams
are usually a first step in exploring relationships between variables and are useful because they
convey information of the variables visually (Weihs, 1993). Some of the scatter diagrams are
converted into and presented as density plots for better illustration. This is in cases where
multiple data plots are in the same position.
As all the components are individually plotted against a common variable (the short-term RRC),
it is possible to compare the individual R2 values (Exner & Zvara, 1999; Kvalseth, 1985).
Therefore, using the percentage of variance accounted for, the significant contributors of short-
term recovery after the Canterbury earthquakes are described below.
7.4.3 Pre-earthquake characteristics as a contributor
From Figure 7-3, there are six contributors for the pre-earthquake conditions contributor. The
R2 values from the pre-earthquake components plotted against the short-term RRC are
presented here in Figures 7-4 to 7-18. Figures 7-4 to 7-6 and 7-18 show R2 values very close to 0
which denotes a very weak relationship between those pre-earthquake components and the
organisation’s short-term RRC. Figure 7-9 shows a marginally higher effect size for
organisational cash flow against organisational short-term RRC. All the R2 values for the pre-
earthquake components are shown in Table 7-4.
As all but one of the organisations in this study had insurance and there are more than two
sectoral groupings, the Kruskal-Wallis test (a non-parametric analysis of variance, ANOVA, test)
was used to statistically compare the different groups. This is instead of plotting organisational
insurance against the short-term RRC. There was no statistically significant difference between
the different the sectors (H (8) = 3.229, P = 0.919) for the insurance contributor.
Analysis of the components making up the pre-earthquake contributor and on the strength R2
values, cash flow is the more significant contributor (R2 value of 0.051). Table 7-4 contains the
correlation values of the pre-earthquake components and the recovery rate coefficient. As
expected, there is a positive correlation (r=.397, p<.01) between organisation’s having crisis or

240 Significant contributors to sectoral and organisational short-term recovery
emergency plans and the practising of the plans. Interestingly, there is a negative correlation (r=-
.226, p<.01) between the recovery rate coefficient and organisational cash flow and a negative
correlation (r=-.264, p<.01) between organisational cash flow and the number of full-time
equivalent staff. There is also a negative correlation (r=-.265, p<.01) between the size of the
organisation and the practising of crisis plans. This is in contrast to findings in the disaster
literature on the size of the organisation influencing the practising of crisis plans. From the
organisations in this study, the critical infrastructure and FMCG organisations were more likely
to have crisis or emergency plans. However, even within these sectors, the numbers of full-time
equivalent staff varied across the organisations. The critical infrastructure sector organisations
reported FTE staff from 20 to 1500 while FMCG organisations reported FTE staff from 6.5 to
1022.
Figure 7-4: Full-time equivalent staff (FTE) plotted against short-term recovery rate coefficient (short-term
RRC)
R² = 0,0015
0
200
400
600
800
1000
1200
1400
1600
-2,5 -2 -1,5 -1 -0,5 0 0,5 1 1,5 2 2,5
Fu
ll-t
ime e
qu
ivale
nt
(FT
E)
staff
Short-term Recovery Rate Coefficient (short-term RRC)
Full-time equivalent staff
Full-time equivalent staff

Key elements of sectoral recovery and resilience after the Canterbury earthquakes: A system dynamics approach
Hlekiwe Kachali
241
Crisis/emergency or business continuity plan (R² = 0.00721)
Figure 7-5: Existence of organisational crisis or emergency plan plotted against short-term recovery rate
coefficient (short-term RRC)
Prior to 4 September 2010 - practised emergency response (R² = 0.00148)
Figure 7-6: Practise of organisational crisis/emergency plan plotted against short-term recovery rate coefficient
(short-term RRC)

242 Significant contributors to sectoral and organisational short-term recovery
Organisational cash flow (R² = 0.05099)
Figure 7-7: Organisational cash flow levels plotted against short-term recovery rate coefficient (short-term
RRC)
Average annual sales growth/organisation's income budget (R² = 6.4E-06)
Figure 7-8: Organisational average annual sales growth or organisation's income budget plotted against short-
term recovery rate coefficient (short-term RRC)
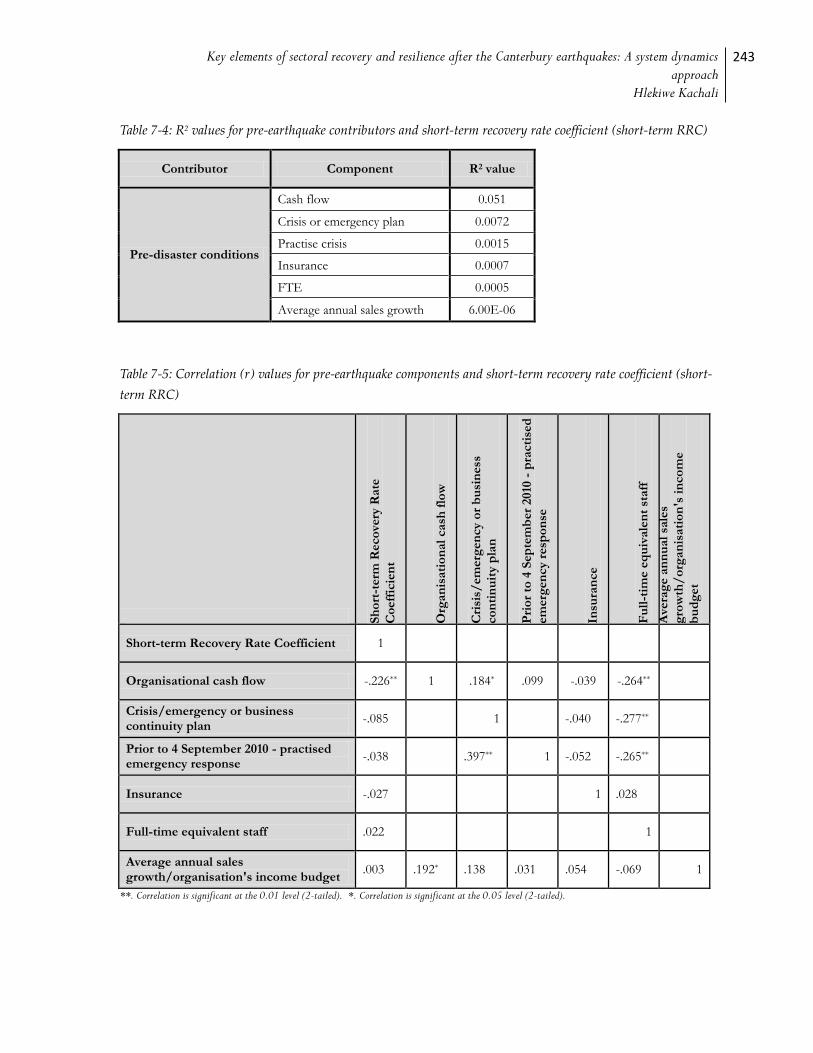
Key elements of sectoral recovery and resilience after the Canterbury earthquakes: A system dynamics approach
Hlekiwe Kachali
243
Table 7-4: R2 values for pre-earthquake contributors and short-term recovery rate coefficient (short-term RRC)
Contributor Component R2 value
Pre-disaster conditions
Cash flow 0.051
Crisis or emergency plan 0.0072
Practise crisis 0.0015
Insurance 0.0007
FTE 0.0005
Average annual sales growth 6.00E-06
Table 7-5: Correlation (r) values for pre-earthquake components and short-term recovery rate coefficient (short-
term RRC)
Sh
ort
-term
Reco
very
Rate
Co
eff
icie
nt
Org
an
isati
on
al
cash
flo
w
Cri
sis/
em
erg
en
cy o
r b
usi
ness
co
nti
nu
ity p
lan
Pri
or
to 4
Sep
tem
ber
2010
- p
racti
sed
em
erg
en
cy r
esp
on
se
Insu
ran
ce
Fu
ll-t
ime e
qu
ivale
nt
staff
Ave
rag
e a
nn
ual
sale
s
gro
wth
/o
rgan
isati
on
's i
nco
me
bu
dg
et
Short-term Recovery Rate Coefficient 1
Organisational cash flow -.226** 1 .184* .099 -.039 -.264**
Crisis/emergency or business continuity plan
-.085 1 -.040 -.277**
Prior to 4 September 2010 - practised emergency response
-.038 .397** 1 -.052 -.265**
Insurance -.027 1 .028
Full-time equivalent staff .022 1
Average annual sales growth/organisation's income budget
.003 .192* .138 .031 .054 -.069 1
**. Correlation is significant at the 0.01 level (2-tailed). *. Correlation is significant at the 0.05 level (2-tailed).
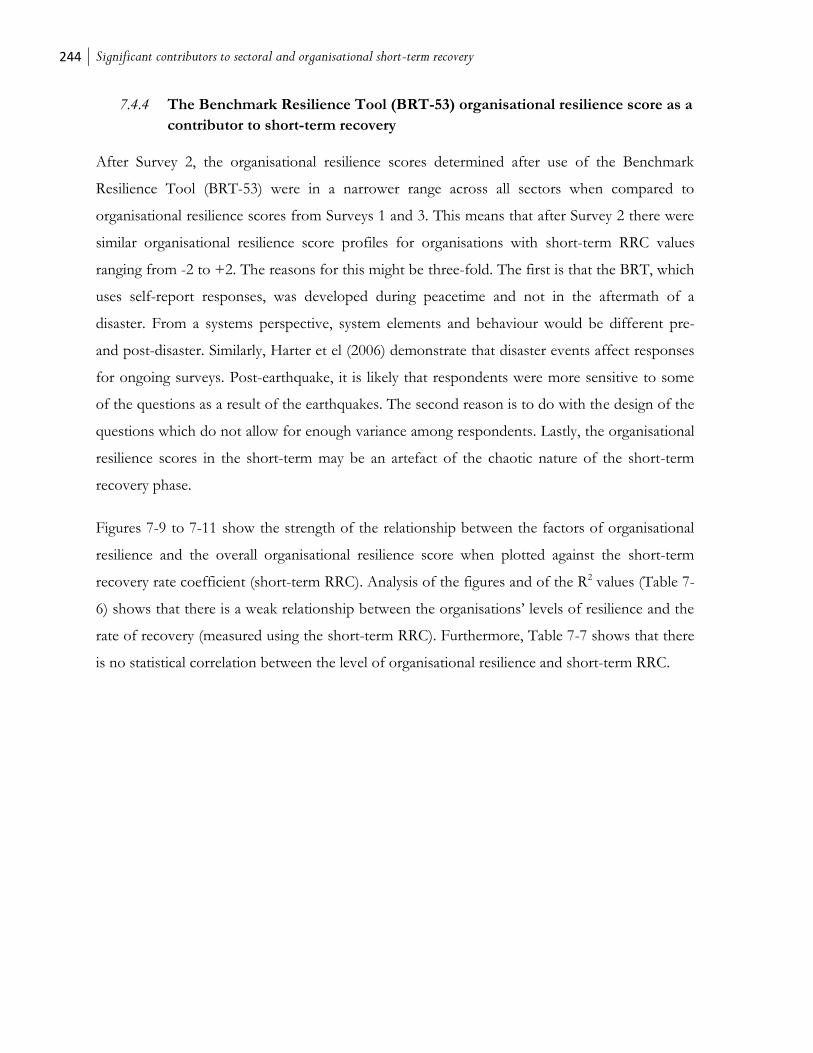
244 Significant contributors to sectoral and organisational short-term recovery
7.4.4 The Benchmark Resilience Tool (BRT-53) organisational resilience score as a
contributor to short-term recovery
After Survey 2, the organisational resilience scores determined after use of the Benchmark
Resilience Tool (BRT-53) were in a narrower range across all sectors when compared to
organisational resilience scores from Surveys 1 and 3. This means that after Survey 2 there were
similar organisational resilience score profiles for organisations with short-term RRC values
ranging from -2 to +2. The reasons for this might be three-fold. The first is that the BRT, which
uses self-report responses, was developed during peacetime and not in the aftermath of a
disaster. From a systems perspective, system elements and behaviour would be different pre-
and post-disaster. Similarly, Harter et el (2006) demonstrate that disaster events affect responses
for ongoing surveys. Post-earthquake, it is likely that respondents were more sensitive to some
of the questions as a result of the earthquakes. The second reason is to do with the design of the
questions which do not allow for enough variance among respondents. Lastly, the organisational
resilience scores in the short-term may be an artefact of the chaotic nature of the short-term
recovery phase.
Figures 7-9 to 7-11 show the strength of the relationship between the factors of organisational
resilience and the overall organisational resilience score when plotted against the short-term
recovery rate coefficient (short-term RRC). Analysis of the figures and of the R2 values (Table 7-
6) shows that there is a weak relationship between the organisations’ levels of resilience and the
rate of recovery (measured using the short-term RRC). Furthermore, Table 7-7 shows that there
is no statistical correlation between the level of organisational resilience and short-term RRC.
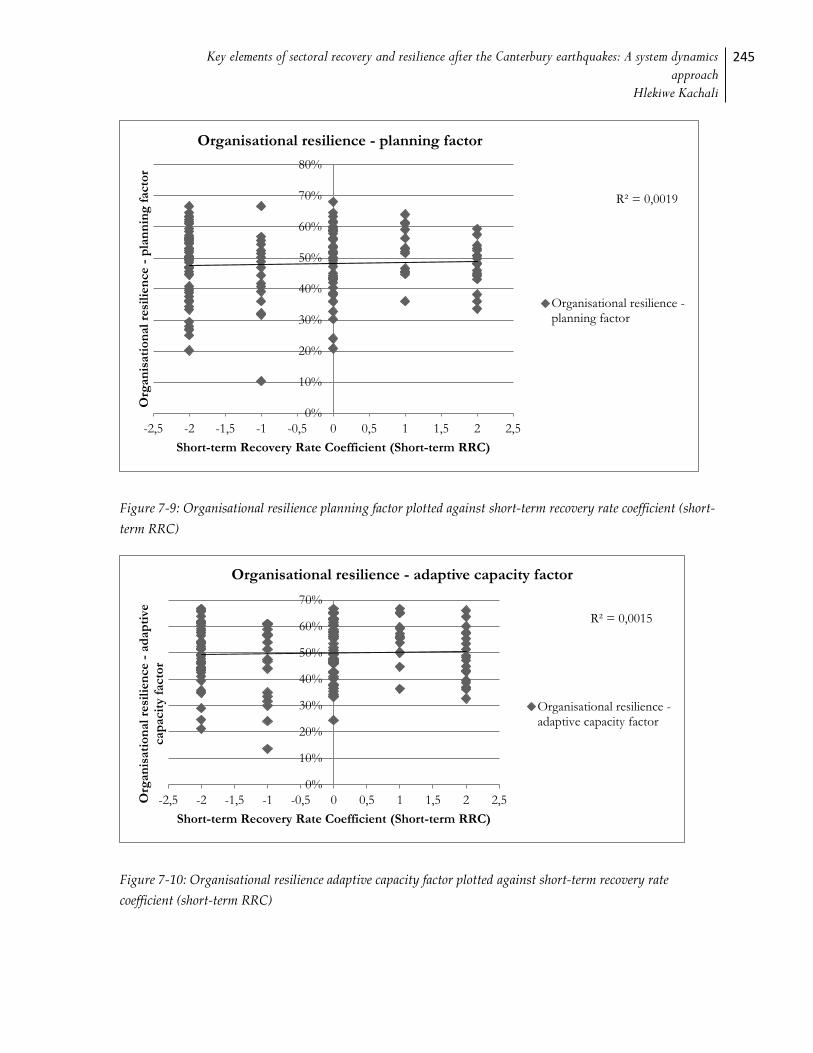
Key elements of sectoral recovery and resilience after the Canterbury earthquakes: A system dynamics approach
Hlekiwe Kachali
245
Figure 7-9: Organisational resilience planning factor plotted against short-term recovery rate coefficient (short-
term RRC)
Figure 7-10: Organisational resilience adaptive capacity factor plotted against short-term recovery rate
coefficient (short-term RRC)
R² = 0,0019
0%
10%
20%
30%
40%
50%
60%
70%
80%
-2,5 -2 -1,5 -1 -0,5 0 0,5 1 1,5 2 2,5
Org
an
isati
on
al
resi
lien
ce -
pla
nn
ing
facto
r
Short-term Recovery Rate Coefficient (Short-term RRC)
Organisational resilience - planning factor
Organisational resilience -planning factor
R² = 0,0015
0%
10%
20%
30%
40%
50%
60%
70%
-2,5 -2 -1,5 -1 -0,5 0 0,5 1 1,5 2 2,5Org
an
isati
on
al
resi
lien
ce -
ad
ap
tive
cap
acit
y f
acto
r
Short-term Recovery Rate Coefficient (Short-term RRC)
Organisational resilience - adaptive capacity factor
Organisational resilience -adaptive capacity factor
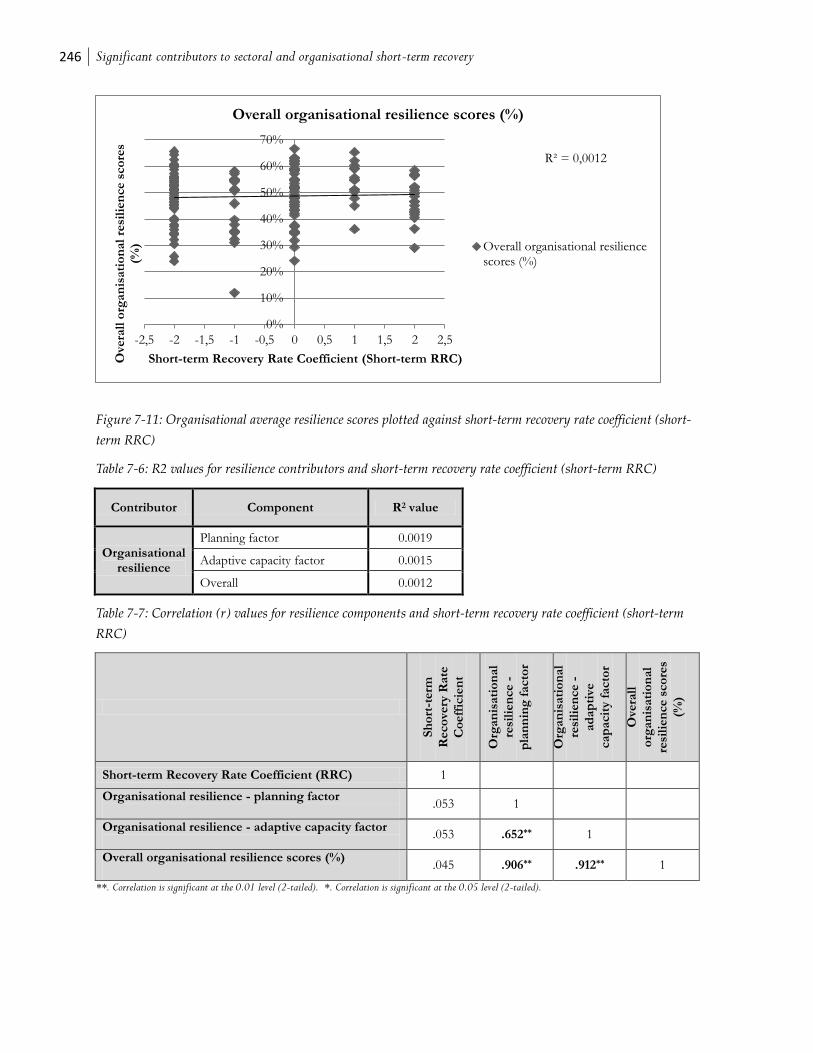
246 Significant contributors to sectoral and organisational short-term recovery
Figure 7-11: Organisational average resilience scores plotted against short-term recovery rate coefficient (short-
term RRC)
Table 7-6: R2 values for resilience contributors and short-term recovery rate coefficient (short-term RRC)
Contributor Component R2 value
Organisational resilience
Planning factor 0.0019
Adaptive capacity factor 0.0015
Overall 0.0012
Table 7-7: Correlation (r) values for resilience components and short-term recovery rate coefficient (short-term
RRC)
Sh
ort
-term
Reco
very
Rate
Co
eff
icie
nt
Org
an
isati
on
al
resi
lien
ce -
pla
nn
ing
facto
r
Org
an
isati
on
al
resi
lien
ce -
ad
ap
tive
cap
acit
y f
acto
r
O
vera
ll
org
an
isati
on
al
resi
lien
ce s
co
res
(%)
Short-term Recovery Rate Coefficient (RRC) 1
Organisational resilience - planning factor
.053 1
Organisational resilience - adaptive capacity factor
.053 .652** 1
Overall organisational resilience scores (%)
.045 .906** .912** 1
**. Correlation is significant at the 0.01 level (2-tailed). *. Correlation is significant at the 0.05 level (2-tailed).
R² = 0,0012
0%
10%
20%
30%
40%
50%
60%
70%
-2,5 -2 -1,5 -1 -0,5 0 0,5 1 1,5 2 2,5
Ove
rall
org
an
isati
on
al
resi
lien
ce s
co
res
(%)
Short-term Recovery Rate Coefficient (Short-term RRC)
Overall organisational resilience scores (%)
Overall organisational resiliencescores (%)

Key elements of sectoral recovery and resilience after the Canterbury earthquakes: A system dynamics approach
Hlekiwe Kachali
247
7.4.5 Direct and indirect earthquake effects
In the disaster literature, several authors (see e.g. (Alesch et al., 2009; Dietch & Corey, 2011;
Holling, 1973; Kroll, 1991; Rose et al., 1997)) have shown how the effects of disaster can cause
organisational disruption and closure, resulting in revenue losses. As shown in Figure 7-3, the
third contributor of recovery being investigated is the direct and indirect effects of the
earthquakes. In Survey 2, organisations were presented with a list of potentially disruptive factors
and asked to detail which factors had caused the most disruption to their operations and to what
degree, as well as what factors contributed to their organisation closing (for any period of time).
The survey response options provided, for factors causing disruption or closure, are in a copy of
Survey 2 contained in appendix L and are presented on their own in appendix G.
From Chapter 5 (Tables 5-16 to 5-19), it is shown to what extent each sector was affected by
disruption to utilities and non-utilities as well as what contributed to organisational closure after
the 22 February 2011 earthquake. Also shown in Tables 5-16 to 5-19 are the factors, for each
sector, that were most disruptive. The individual organisation scores for the level of effect and
for the closure impact factor are correlated against each other, against the recovery rate
coefficient as well as against the individual resilience scores for each organisation. Table 7-9
contains the correlations.
Figures 7-12 to 7-19 show the plots of the direct and indirect effects components against the
short-term recovery rate coefficient (RRC). The strength of this relationship is indicated by the
value of R2. The maximum value for R2 is 1 and the closer the computed R2 value is to 1, the
stronger the relationship between the variable being investigated. In Figure 7-12, the R2 value for
level of effect (non-utility and utility) against short-term RRC is 0.037. This shows a weak
relationship between the two variables. However, the level of effect and the short-term RRC
have a medium strength negative correlation (r=-.259, p<.01) between them (Table 7-8). The
negative correlation means that as the short-term recovery rate coefficient (short-term RRC)
increases, the level of effect decreases. In other words, organisations that reported more damage
or disruption were more likely to suffer revenue losses and vice versa.
The closure impact factor in Figure 7-17 was arrived at by assigning a value of 1 to each reason
for closure and adding all the 1s for each organisation (see Table 5-15 in chapter 5). The R2 value

248 Significant contributors to sectoral and organisational short-term recovery
is 0.0774. The closure impact factor after 22 February 2011 correlates positively with the level of
effect (r=.412, p<.01). Organisations with more reasons leading to closure reported a higher
level of effect from disruptive factors such as to utilities.
Organisations in the study were also asked their operating hours in the period after both the 4
September 2010 and 22 February 2011 earthquakes. The alternatives ranged from closed
permanently to open but operated longer hours (see Table 5-11). In the disaster literature, findings point
to the duration of closure of an organisation being linked to their rate of recovery (Alesch et al.,
2009). Some of the reasons ascribed to this include the non-return of customers or reduced cash
flow after the resumption of organisational operations. The R2 value is 0.0747 for 4 September
2010 and 0.0742 for 22 February 2011. Of interest is the strong negative correlation between the
closure impact factor and organisational operating hours after both the 4 September 2010 (r=-
.509, p<.01) and 22 February 2011 (r=-.594, p<.01) earthquakes. Organisations reporting more
reasons contributing to closure operated shorter hours.
These findings in relation to organisations in Canterbury are similar to those in other disaster
studies such as Chang’s (2010) for the 1995 earthquake in Kobe and Webb et al’s (2002) focused
on the Loma Prieta earthquake and Hurricane Andrew.
The organisational operating hours for after both the 4 September 2010 and 22 February 2011
events show a strong positive correlation (r=.643, p<.01) with each other. After both
earthquakes, the sectors reporting working longer than usual hours (see Table 5-11) were critical
infrastructure and trucking. From case study and interview data, both sectors pointed to an
increase in demand for their goods and services especially after the 22 February 2011 earthquake.
Additionally, for both 4 September 2010 (r=-.251, p<.01) and 22 February 2011 (r=-.227,
p<.01) earthquakes, Table 7-9 shows that organisational operating hours correlate negatively
with the level of effect. Organisations that reported less damage and disruption were more likely
to report a positive revenue change. Also, organisational operating hours exhibit a weak positive
correlation with the recovery rate coefficient: (r=.273, p<.01) for 4 September 2010 and (r=.272,
p<.01) for 22 February 2011 earthquakes.
Of the direct and indirect earthquake effect components, if using the R2 value, change in
customer base accounts for the larger percentage of variance (Figure 7-14). R2 is 0.1799. A
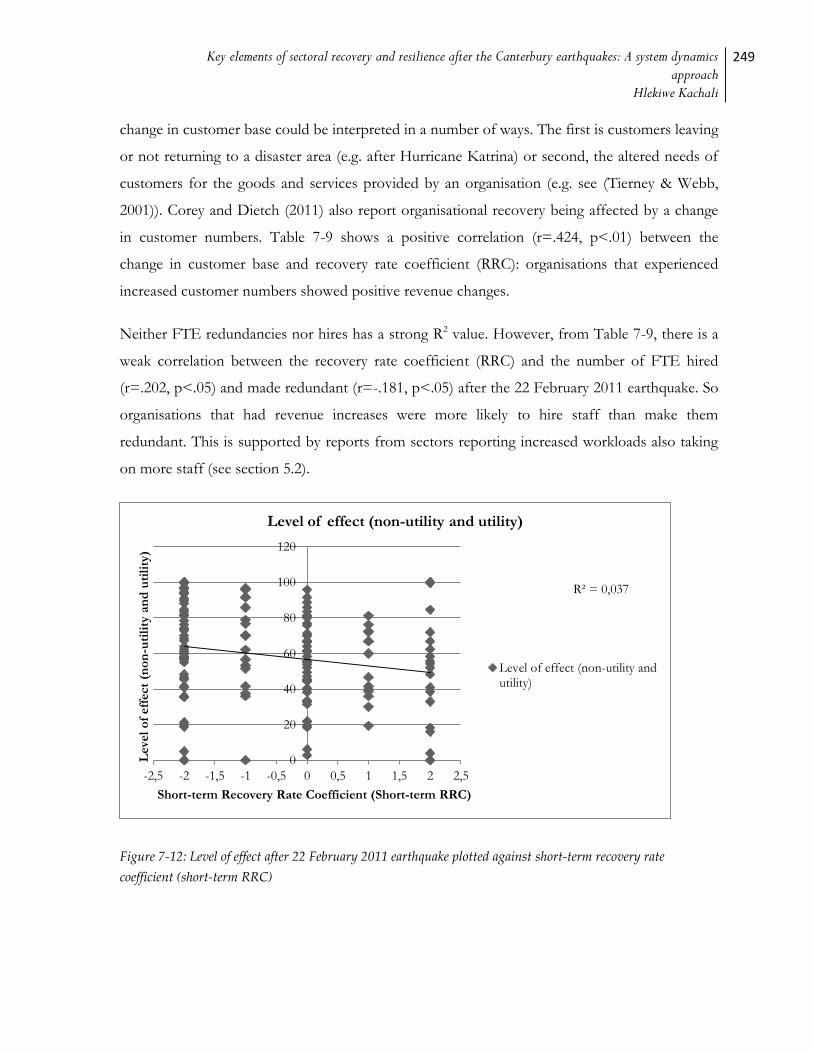
Key elements of sectoral recovery and resilience after the Canterbury earthquakes: A system dynamics approach
Hlekiwe Kachali
249
change in customer base could be interpreted in a number of ways. The first is customers leaving
or not returning to a disaster area (e.g. after Hurricane Katrina) or second, the altered needs of
customers for the goods and services provided by an organisation (e.g. see (Tierney & Webb,
2001)). Corey and Dietch (2011) also report organisational recovery being affected by a change
in customer numbers. Table 7-9 shows a positive correlation (r=.424, p<.01) between the
change in customer base and recovery rate coefficient (RRC): organisations that experienced
increased customer numbers showed positive revenue changes.
Neither FTE redundancies nor hires has a strong R2 value. However, from Table 7-9, there is a
weak correlation between the recovery rate coefficient (RRC) and the number of FTE hired
(r=.202, p<.05) and made redundant (r=-.181, p<.05) after the 22 February 2011 earthquake. So
organisations that had revenue increases were more likely to hire staff than make them
redundant. This is supported by reports from sectors reporting increased workloads also taking
on more staff (see section 5.2).
Figure 7-12: Level of effect after 22 February 2011 earthquake plotted against short-term recovery rate
coefficient (short-term RRC)
R² = 0,037
0
20
40
60
80
100
120
-2,5 -2 -1,5 -1 -0,5 0 0,5 1 1,5 2 2,5
Leve
l o
f eff
ect
(no
n-u
tili
ty a
nd
uti
lity
)
Short-term Recovery Rate Coefficient (Short-term RRC)
Level of effect (non-utility and utility)
Level of effect (non-utility andutility)
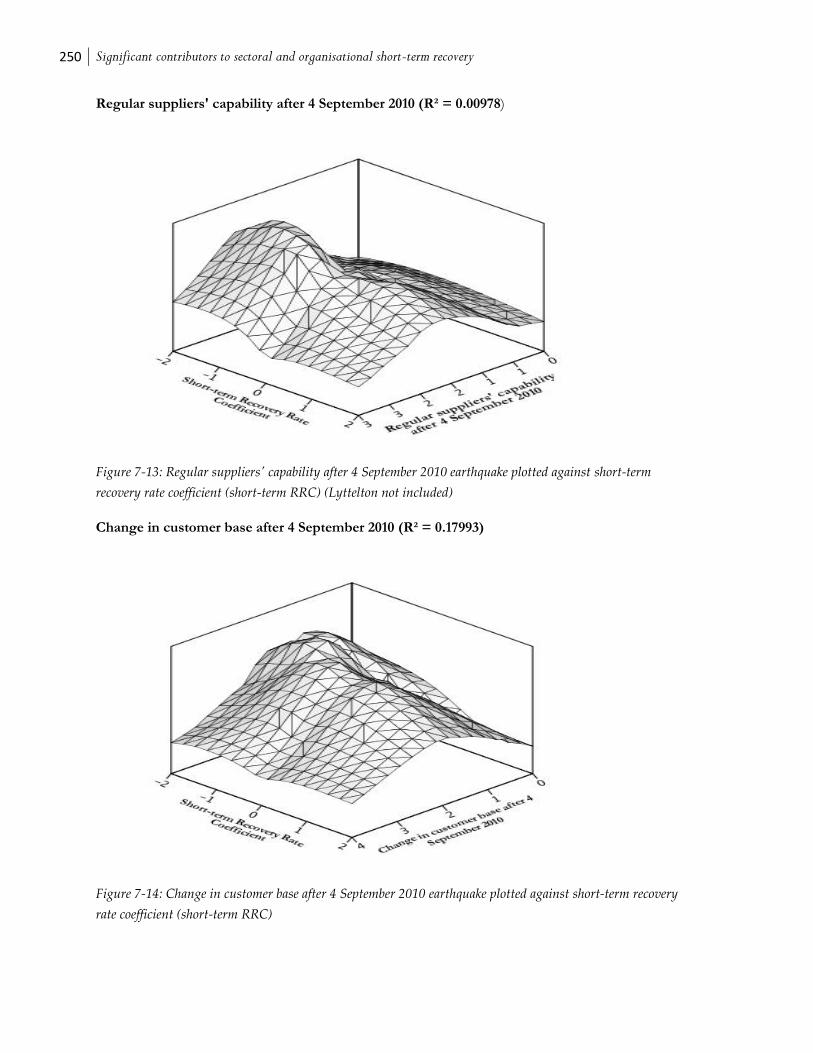
250 Significant contributors to sectoral and organisational short-term recovery
Regular suppliers' capability after 4 September 2010 (R² = 0.00978)
Figure 7-13: Regular suppliers' capability after 4 September 2010 earthquake plotted against short-term
recovery rate coefficient (short-term RRC) (Lyttelton not included)
Change in customer base after 4 September 2010 (R² = 0.17993)
Figure 7-14: Change in customer base after 4 September 2010 earthquake plotted against short-term recovery
rate coefficient (short-term RRC)
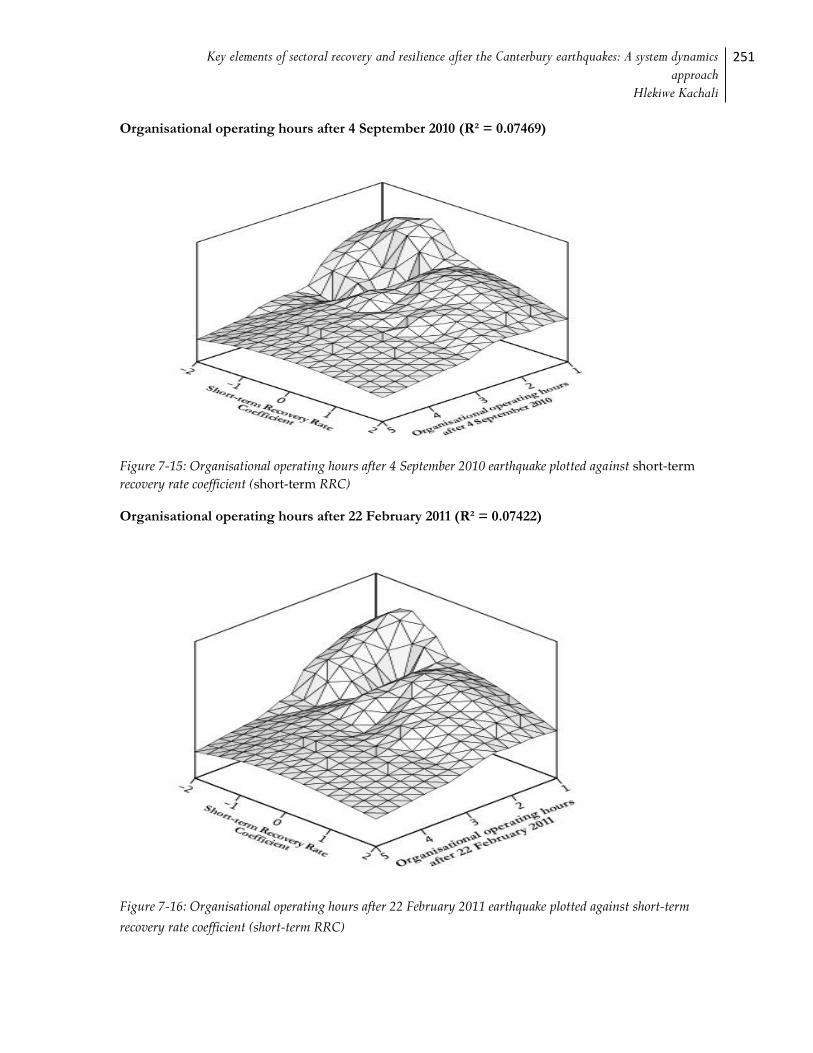
Key elements of sectoral recovery and resilience after the Canterbury earthquakes: A system dynamics approach
Hlekiwe Kachali
251
Organisational operating hours after 4 September 2010 (R² = 0.07469)
Figure 7-15: Organisational operating hours after 4 September 2010 earthquake plotted against short-term
recovery rate coefficient (short-term RRC)
Organisational operating hours after 22 February 2011 (R² = 0.07422)
Figure 7-16: Organisational operating hours after 22 February 2011 earthquake plotted against short-term
recovery rate coefficient (short-term RRC)
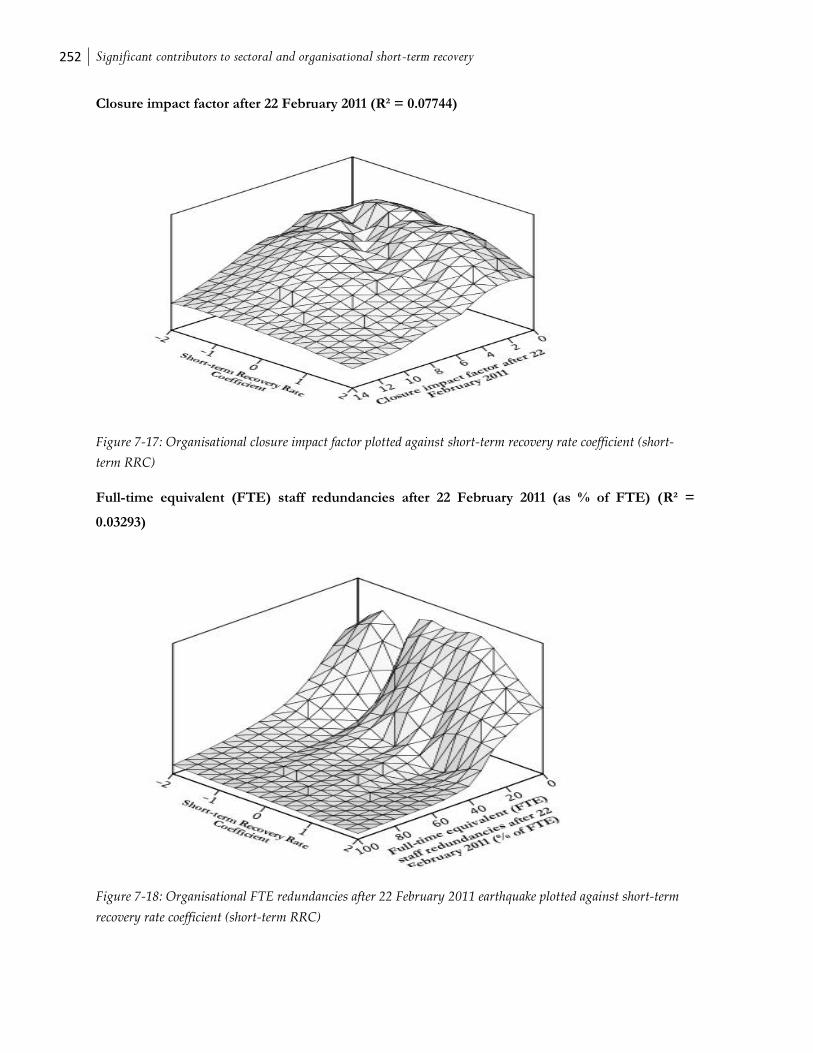
252 Significant contributors to sectoral and organisational short-term recovery
Closure impact factor after 22 February 2011 (R² = 0.07744)
Figure 7-17: Organisational closure impact factor plotted against short-term recovery rate coefficient (short-
term RRC)
Full-time equivalent (FTE) staff redundancies after 22 February 2011 (as % of FTE) (R² =
0.03293)
Figure 7-18: Organisational FTE redundancies after 22 February 2011 earthquake plotted against short-term
recovery rate coefficient (short-term RRC)
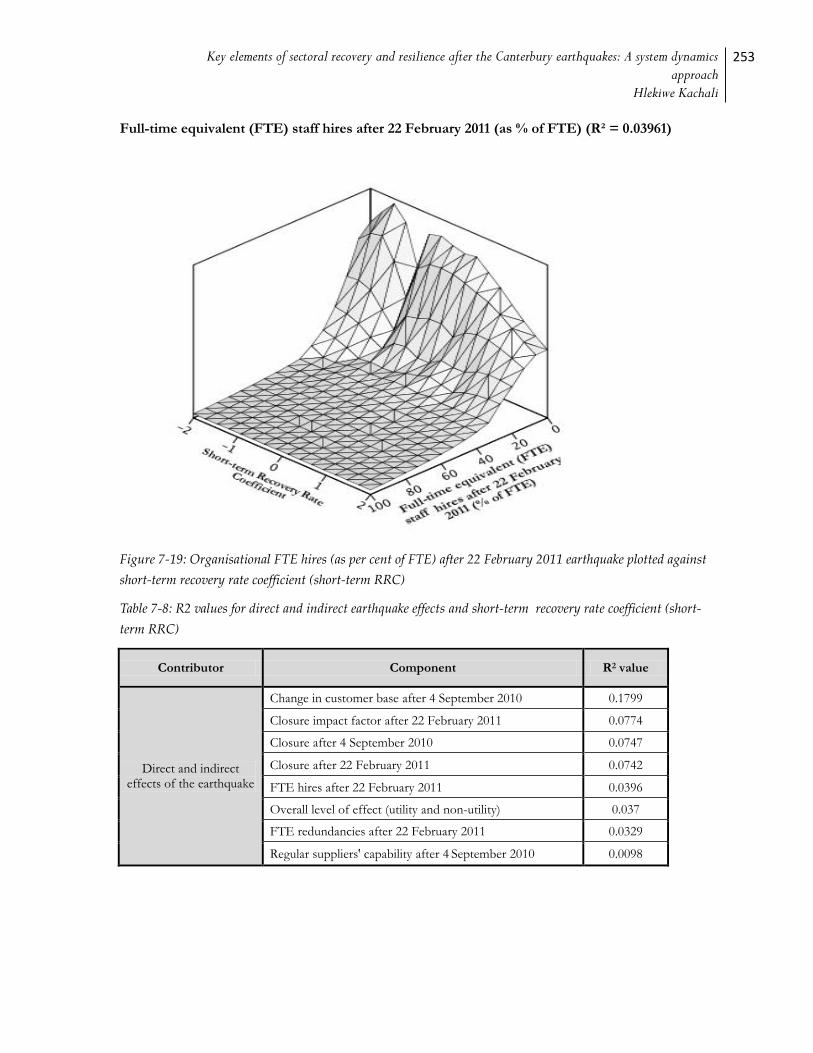
Key elements of sectoral recovery and resilience after the Canterbury earthquakes: A system dynamics approach
Hlekiwe Kachali
253
Full-time equivalent (FTE) staff hires after 22 February 2011 (as % of FTE) (R² = 0.03961)
Figure 7-19: Organisational FTE hires (as per cent of FTE) after 22 February 2011 earthquake plotted against
short-term recovery rate coefficient (short-term RRC)
Table 7-8: R2 values for direct and indirect earthquake effects and short-term recovery rate coefficient (short-
term RRC)
Contributor Component R2 value
Direct and indirect effects of the earthquake
Change in customer base after 4 September 2010 0.1799
Closure impact factor after 22 February 2011 0.0774
Closure after 4 September 2010 0.0747
Closure after 22 February 2011 0.0742
FTE hires after 22 February 2011 0.0396
Overall level of effect (utility and non-utility) 0.037
FTE redundancies after 22 February 2011 0.0329
Regular suppliers' capability after 4 September 2010 0.0098
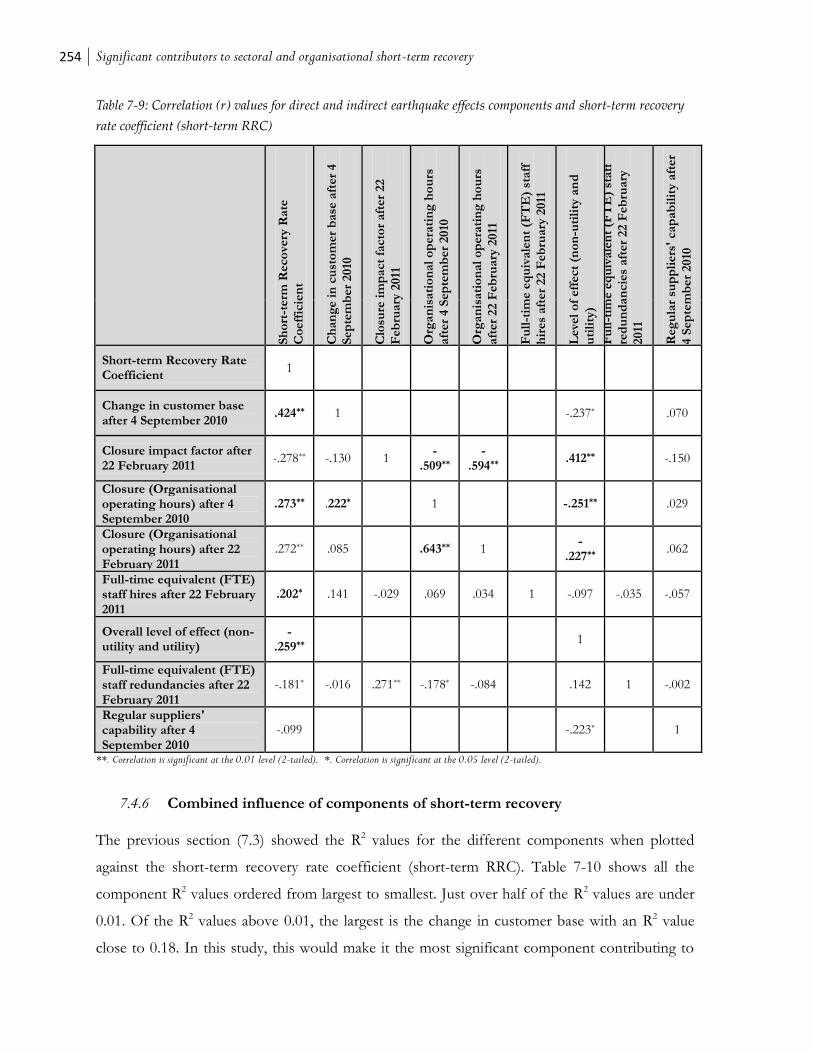
254 Significant contributors to sectoral and organisational short-term recovery
Table 7-9: Correlation (r) values for direct and indirect earthquake effects components and short-term recovery
rate coefficient (short-term RRC)
Sh
ort
-term
Reco
very
Rate
Co
eff
icie
nt
Ch
an
ge i
n c
ust
om
er
base
aft
er
4
Sep
tem
ber
2010
Clo
sure
im
pact
facto
r aft
er
22
Feb
ruary
2011
Org
an
isati
on
al
op
era
tin
g h
ou
rs
aft
er
4 S
ep
tem
ber
2010
Org
an
isati
on
al
op
era
tin
g h
ou
rs
aft
er
22 F
eb
ruary
2011
Fu
ll-t
ime e
qu
ivale
nt
(FT
E)
staff
hir
es
aft
er
22 F
eb
ruary
2011
Level
of
eff
ect
(no
n-u
tili
ty a
nd
uti
lity
)
Fu
ll-t
ime e
qu
ivale
nt
(FT
E)
staff
red
un
dan
cie
s aft
er
22 F
eb
ruary
2011
Reg
ula
r su
pp
liers
' cap
ab
ilit
y a
fter
4 S
ep
tem
ber
2010
Short-term Recovery Rate Coefficient
1
Change in customer base after 4 September 2010
.424** 1 -.237* .070
Closure impact factor after 22 February 2011
-.278** -.130 1 -
.509** -
.594** .412** -.150
Closure (Organisational operating hours) after 4 September 2010
.273** .222* 1 -.251** .029
Closure (Organisational operating hours) after 22 February 2011
.272** .085 .643** 1 -
.227** .062
Full-time equivalent (FTE) staff hires after 22 February 2011
.202* .141 -.029 .069 .034 1 -.097 -.035 -.057
Overall level of effect (non-utility and utility)
-.259**
1
Full-time equivalent (FTE) staff redundancies after 22 February 2011
-.181* -.016 .271** -.178* -.084 .142 1 -.002
Regular suppliers' capability after 4 September 2010
-.099 -.223* 1
**. Correlation is significant at the 0.01 level (2-tailed). *. Correlation is significant at the 0.05 level (2-tailed).
7.4.6 Combined influence of components of short-term recovery
The previous section (7.3) showed the R2 values for the different components when plotted
against the short-term recovery rate coefficient (short-term RRC). Table 7-10 shows all the
component R2 values ordered from largest to smallest. Just over half of the R2 values are under
0.01. Of the R2 values above 0.01, the largest is the change in customer base with an R2 value
close to 0.18. In this study, this would make it the most significant component contributing to
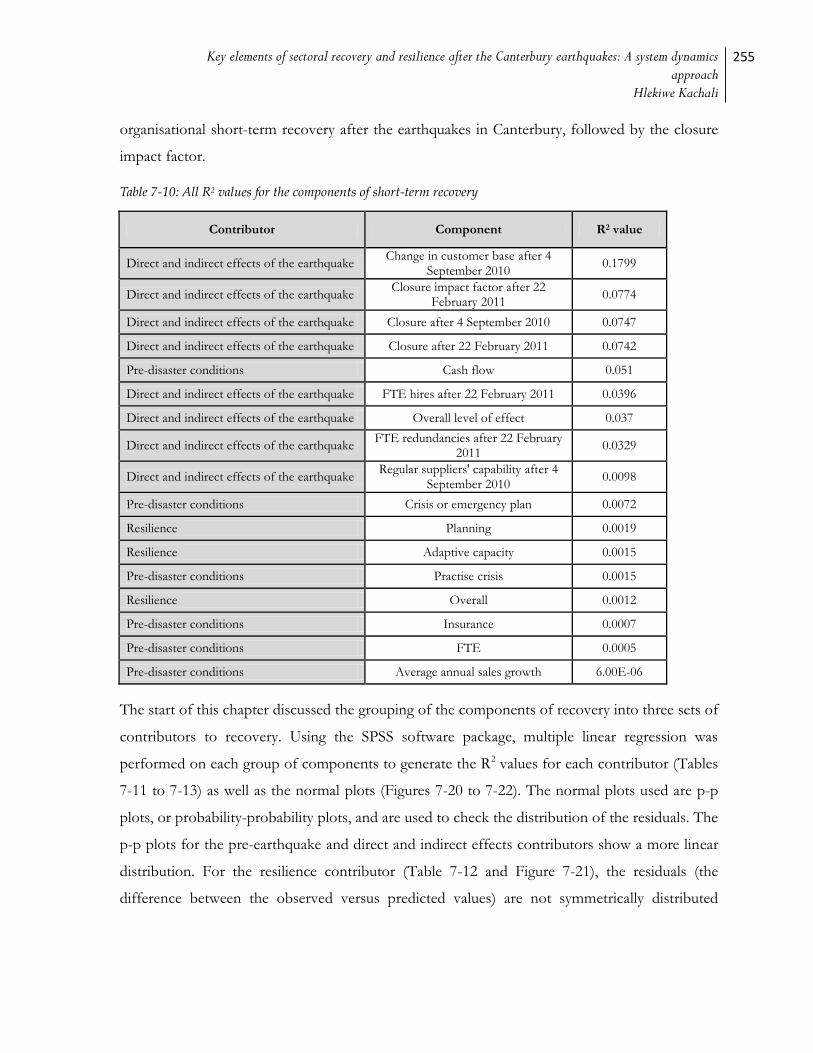
Key elements of sectoral recovery and resilience after the Canterbury earthquakes: A system dynamics approach
Hlekiwe Kachali
255
organisational short-term recovery after the earthquakes in Canterbury, followed by the closure
impact factor.
Table 7-10: All R2 values for the components of short-term recovery
Contributor Component R2 value
Direct and indirect effects of the earthquake Change in customer base after 4
September 2010 0.1799
Direct and indirect effects of the earthquake Closure impact factor after 22
February 2011 0.0774
Direct and indirect effects of the earthquake Closure after 4 September 2010 0.0747
Direct and indirect effects of the earthquake Closure after 22 February 2011 0.0742
Pre-disaster conditions Cash flow 0.051
Direct and indirect effects of the earthquake FTE hires after 22 February 2011 0.0396
Direct and indirect effects of the earthquake Overall level of effect 0.037
Direct and indirect effects of the earthquake FTE redundancies after 22 February
2011 0.0329
Direct and indirect effects of the earthquake Regular suppliers' capability after 4
September 2010 0.0098
Pre-disaster conditions Crisis or emergency plan 0.0072
Resilience Planning 0.0019
Resilience Adaptive capacity 0.0015
Pre-disaster conditions Practise crisis 0.0015
Resilience Overall 0.0012
Pre-disaster conditions Insurance 0.0007
Pre-disaster conditions FTE 0.0005
Pre-disaster conditions Average annual sales growth 6.00E-06
The start of this chapter discussed the grouping of the components of recovery into three sets of
contributors to recovery. Using the SPSS software package, multiple linear regression was
performed on each group of components to generate the R2 values for each contributor (Tables
7-11 to 7-13) as well as the normal plots (Figures 7-20 to 7-22). The normal plots used are p-p
plots, or probability-probability plots, and are used to check the distribution of the residuals. The
p-p plots for the pre-earthquake and direct and indirect effects contributors show a more linear
distribution. For the resilience contributor (Table 7-12 and Figure 7-21), the residuals (the
difference between the observed versus predicted values) are not symmetrically distributed
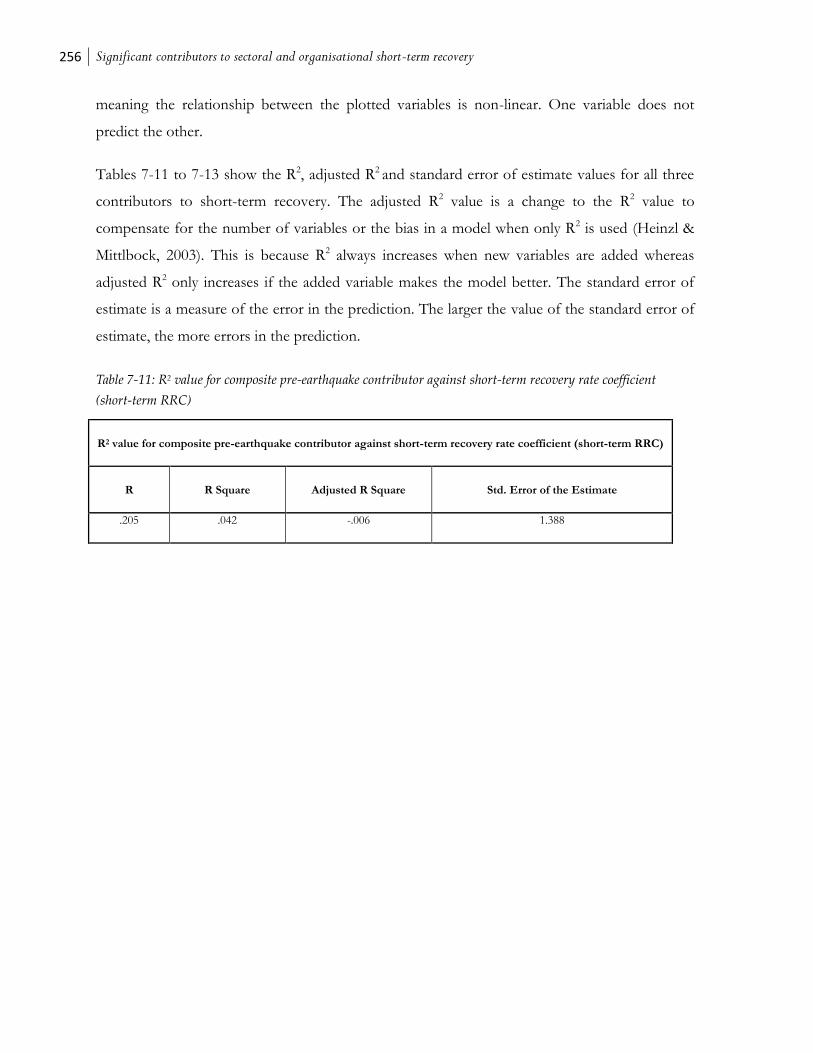
256 Significant contributors to sectoral and organisational short-term recovery
meaning the relationship between the plotted variables is non-linear. One variable does not
predict the other.
Tables 7-11 to 7-13 show the R2, adjusted R2 and standard error of estimate values for all three
contributors to short-term recovery. The adjusted R2 value is a change to the R2 value to
compensate for the number of variables or the bias in a model when only R2 is used (Heinzl &
Mittlbock, 2003). This is because R2 always increases when new variables are added whereas
adjusted R2 only increases if the added variable makes the model better. The standard error of
estimate is a measure of the error in the prediction. The larger the value of the standard error of
estimate, the more errors in the prediction.
Table 7-11: R2 value for composite pre-earthquake contributor against short-term recovery rate coefficient
(short-term RRC)
R2 value for composite pre-earthquake contributor against short-term recovery rate coefficient (short-term RRC)
R R Square Adjusted R Square Std. Error of the Estimate
.205 .042 -.006 1.388
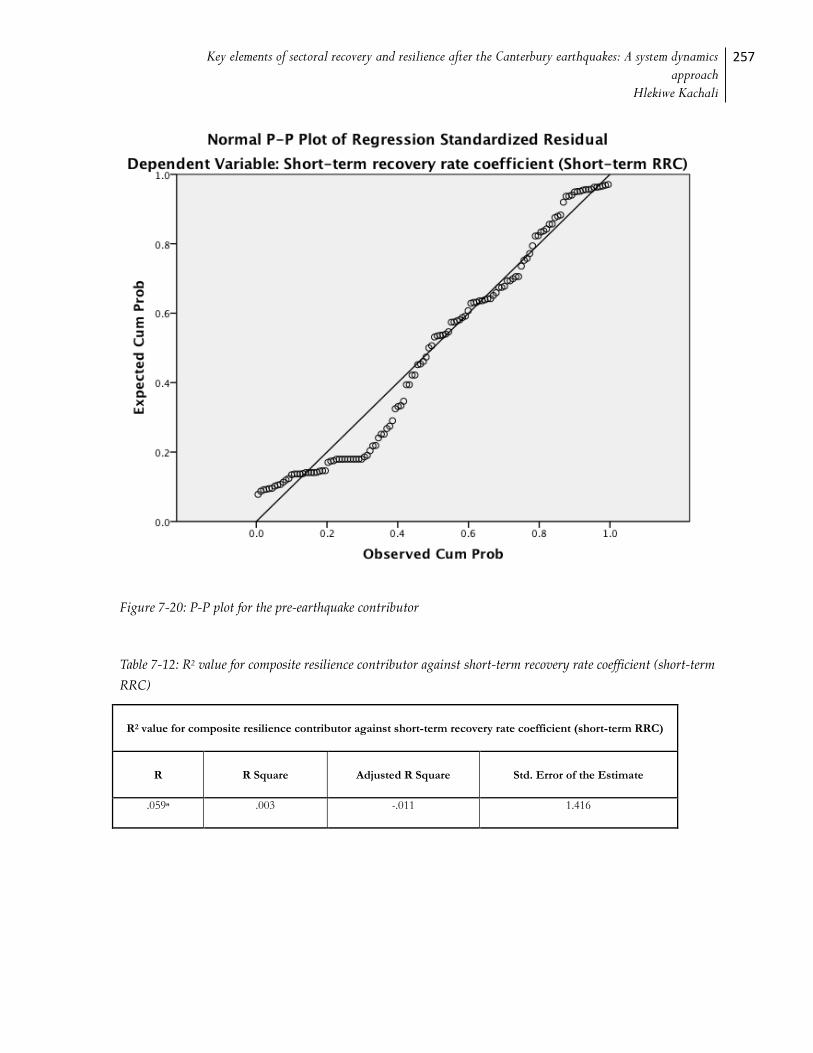
Key elements of sectoral recovery and resilience after the Canterbury earthquakes: A system dynamics approach
Hlekiwe Kachali
257
Figure 7-20: P-P plot for the pre-earthquake contributor
Table 7-12: R2 value for composite resilience contributor against short-term recovery rate coefficient (short-term
RRC)
R2 value for composite resilience contributor against short-term recovery rate coefficient (short-term RRC)
R R Square Adjusted R Square Std. Error of the Estimate
.059a .003 -.011 1.416
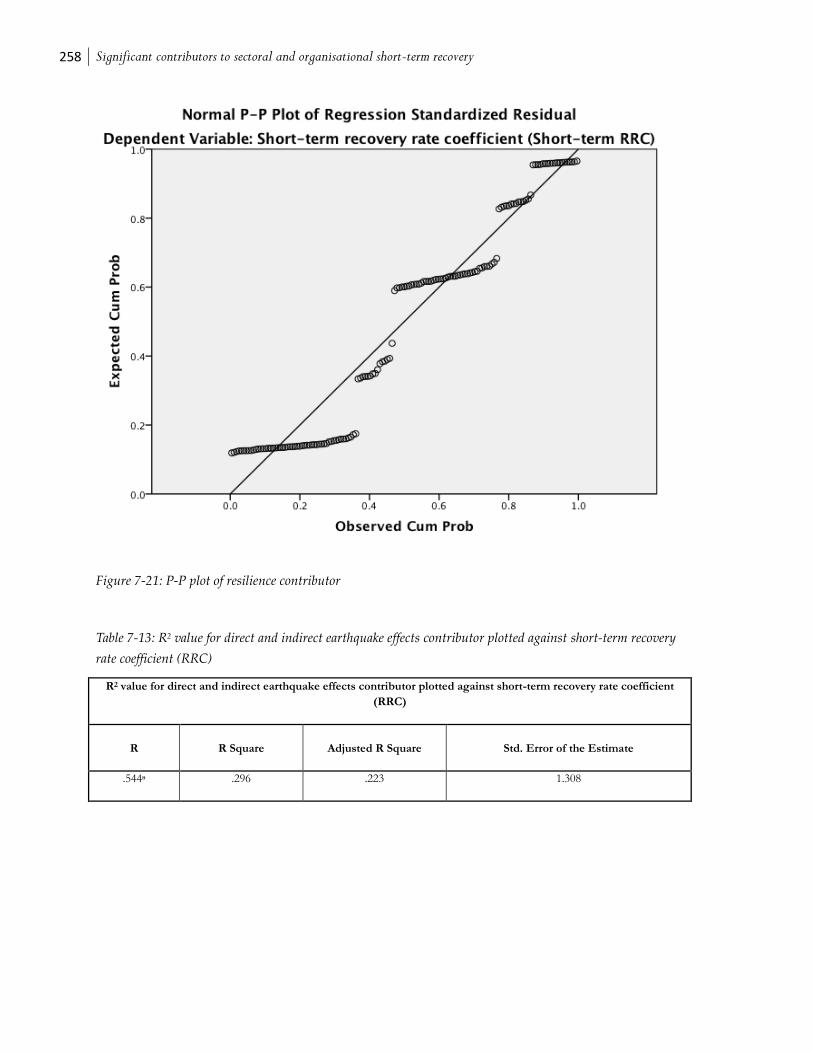
258 Significant contributors to sectoral and organisational short-term recovery
Figure 7-21: P-P plot of resilience contributor
Table 7-13: R2 value for direct and indirect earthquake effects contributor plotted against short-term recovery
rate coefficient (RRC)
R2 value for direct and indirect earthquake effects contributor plotted against short-term recovery rate coefficient
(RRC)
R R Square Adjusted R Square Std. Error of the Estimate
.544a .296 .223 1.308
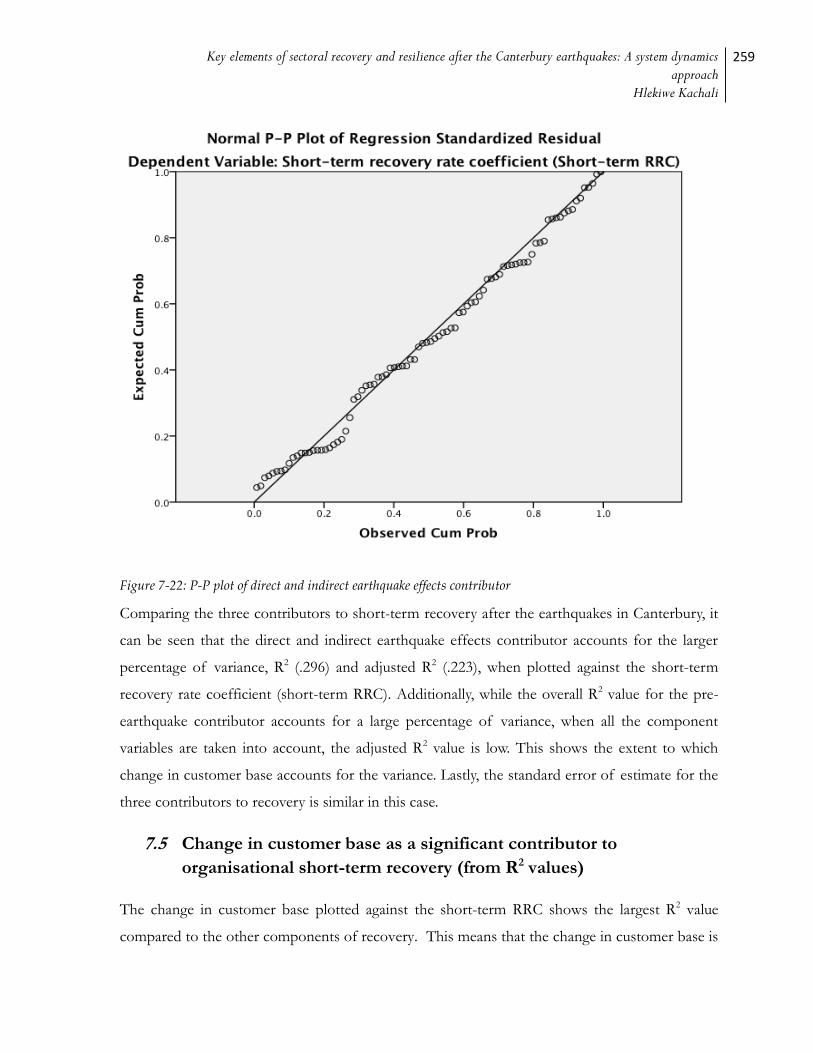
Key elements of sectoral recovery and resilience after the Canterbury earthquakes: A system dynamics approach
Hlekiwe Kachali
259
Figure 7-22: P-P plot of direct and indirect earthquake effects contributor
Comparing the three contributors to short-term recovery after the earthquakes in Canterbury, it
can be seen that the direct and indirect earthquake effects contributor accounts for the larger
percentage of variance, R2 (.296) and adjusted R2 (.223), when plotted against the short-term
recovery rate coefficient (short-term RRC). Additionally, while the overall R2 value for the pre-
earthquake contributor accounts for a large percentage of variance, when all the component
variables are taken into account, the adjusted R2 value is low. This shows the extent to which
change in customer base accounts for the variance. Lastly, the standard error of estimate for the
three contributors to recovery is similar in this case.
7.5 Change in customer base as a significant contributor to
organisational short-term recovery (from R2 values)
The change in customer base plotted against the short-term RRC shows the largest R2 value
compared to the other components of recovery. This means that the change in customer base is
260 Significant contributors to sectoral and organisational short-term recovery
the most significant component contributing to organisational short-term recovery after the
earthquakes in Canterbury. From the biggest challenges information and interview responses
provided by organisations (see chapters 5.4 and 6); there are several elements that led to
organisations facing customer issues after the 4 September 2010 and 22 February 2011
earthquakes. In interviews and from the biggest challenges data, it is clear that these customer
issues were brought about by a number of elements. From organisational descriptions, customer
issues translated in to a decrease in customer numbers, a decrease in how much customers spent
as well as in a reduction in profit margins of certain products. This shows that the elements of
post-disaster organisational recovery are related and influence each other.
Customer issues - decrease in customer numbers: organisations attributed reduced customer
numbers to customers not wanting to access buildings they thought not safe, the perception that
organisations were not operating because of cordons or nearby building damage as well as a
reduction in foot traffic for location specific businesses. Two destination specific businesses
from the Christchurch CBD reported that the distinctive nature of their goods and services were
a help when customers started to spend money again. Alesch et al (2009) also found that
reduced customer numbers after disaster affect an organisation’s recovery. Some FMCG
organisations narrated that a reason for diminished customer numbers was the relocation of
customers. Similarly, Corey and Deitch (1987) write that the population dislocation in the
Greater New Orleans area after Hurricane Katrina affected organisational recovery.
Customer issues - decrease in customer spending: from organisational reports, another
feature of customer issues is customers spending less money post-earthquake. This is in line with
Tierney (2007a) who writes that the uncertain economic conditions after disaster can affect
customer spending especially on goods or services not deemed necessary after disaster. Some
Canterbury hospitality organisations for example, detailed that the customers who did come in
did not spend as much money as they did before the earthquakes. From accounts of building
supplier organisations, the cancellation of pre-earthquake work also acted to decrease customer
spending. This in turn affected organisational revenue, cash flow and ultimately recovery (more
details in section 5.1). For some organisations, difficulties in delivering goods and services also
led to customers spending less.
Key elements of sectoral recovery and resilience after the Canterbury earthquakes: A system dynamics approach
Hlekiwe Kachali
261
Customer issues - decrease in profit margins of products: some FMCG and Lyttelton
organisations (more details in section 5.4) reported that they priced certain products lower than
before the earthquakes in order to entice customers in to their stores as well as to get them to
purchase more products. However, this meant a reduction in profit margins for these
organisations; they also noted that such measures were only sustainable for the short-term.
7.6 Influence of geographic location on organisational short-term
recovery
As three of the sectors were selected for this study based on their geographic location (see
chapter 3), it is worth investigating the influence that geographic location had on organisational
recovery. In Survey 2 organisations were asked whether or not they had relocated after the 4
September 2010 or the 22 February 2011 earthquakes. Eighty-nine per cent of organisations
indicated that they had not relocated after the 4 September 2010 event while 69% did not
relocate after the 22 February 2011 event. From chapter 5.2, 3% and 11% of all organisations
reported closing permanently after the 4 September 2010 and 22 February 2011 earthquakes
respectively. This means that, at the time of sampling for Survey 2, the majority of organisations
were still operational and a large percentage of the sample had not changed location. This
enables the investigation on the extent of geographic location as a contributor to organisational
short-term recovery, measured using the short-term recovery rate coefficient (short-term RRC).
In Survey 2, organisations were asked to provide their physical location at the time of the
earthquake as well as at the time of survey deployment. Investigation of organisational physical
location and their short-term RRC values showed that the geographic location of the
organisation was not a predictor of their change in revenue. For the three sample groups
intentionally sampled for their location, the Christchurch CBD had 80% of organisations with a
short-term RRC of -2 while Kaiapoi Town Centre had 23% and Lyttelton Town Centre had
38%. The CBD and town centres, because of pre-earthquake conditions (see chapters 5.4 and
6.7), suffered the greatest physical damage after the 4 September 2010 and 22 February 2011
earthquakes. None of the trucking organisations (33%) with short-term RRC values of -2 were
located in the CBD or in any of the town centres. The building supplier organisations with
short-term RRC values of -2 (82%) were not located within the four avenues that make up the

262 Significant contributors to sectoral and organisational short-term recovery
Christchurch CBD or in the Kaiapoi or Lyttelton Town Centres. Fifty per cent of ICT
organisations had short-term RRC values of 0 while 43% reported short-term RRC values of +1
or better. Some of these organisations detailed that their organisation’s premises were within the
cordoned off Christchurch CBD.
This demonstrates that for the organisations affected by the Canterbury earthquakes, their
location was only one variable in how they were affected. Their sector, i.e. the goods and
services delivered, contributed to some of the impacts the organisations faced. Furthermore, as
will be shown in chapter 8, there is an interaction of multiple variables in the way an
organisation or sector is affected by disaster.
7.7 Signifiers of sectoral and organisational short-term recovery after
the 2010-2011 Canterbury earthquakes
From the determinants of short-term recovery after the 2010 – 2011 Canterbury earthquakes
and using information from the contributors as well as interview and survey data, it is possible to
discern organisational and environmental features that may magnify or ameliorate the effects of
disaster. These features, positive and negative, have been broadly categorised, do not apply to
every sector and even within sectors do not apply to all organisations. Table 7-14 shows the
features that organisations may take note of in trying to mitigate effects of disaster or in planning
for the extent to which they may be affected. The checked boxes signify the factors that were
important for each sector and contributed to recovery.
From Table 7-14, it is shown that some of the signifiers applied to all the sectors in this study.
These are organisational adaptation, relationship with staff, capability of staff, availability of
different kinds of resources and combined planning between the stakeholders in recovery such
as organisations, local authorities and the community. The importance of combined planning
also shows that in recovery, all stakeholders should be identified and involved (see chapter 9.6.1
and 9.7). Also, relationship and capability of staff aligns with organisations reporting that their
biggest challenge across all three surveys deployed was staff wellbeing. This means that
organisations should invest in their staff pre-disaster.
From Table 7-14, it is evident that for the different sectors, customers issues (discussed
previously in this chapter) manifest via different signifiers; the post-disaster need for goods and

Key elements of sectoral recovery and resilience after the Canterbury earthquakes: A system dynamics approach
Hlekiwe Kachali
263
services, reliance on customer discretionary spending, the location of the organisation’s premises
and the ability of the organisation to deliver goods and services.
Table 7-14: Signifiers of post-disaster short-term recovery for organisations and sectors after the 2010-2011
earthquakes in Canterbury
Bu
ild
ing
Su
pp
liers
Cri
tical
Infr
ast
ructu
re
FM
CG
Ho
spit
ali
ty
ICT
Tru
ck
ing
Ch
rist
ch
urc
h
CB
D
Kaia
po
i T
ow
n
Cen
tre
Lytt
elt
on
To
wn
Cen
tre
Post-disaster need for organisations goods and services √ √ √ √ √ √
Reliance on customer discretionary spending, location of customers
√ √ √ √
Organisational assets in non-disaster resistant building √ √ √
Occupation of buildings in close proximity to non-disaster resistant buildings √ √ √
Little or no alternatives to critical infrastructure √
Diversity (product, location, customers) √
Organisational adaptation √ √ √ √ √ √ √ √ √
Relationship with staff √ √ √ √ √ √ √ √ √
Capability of staff √ √ √ √ √ √ √ √ √
Availability of resources (e.g. financial, skilled labour, inputs for goods and services)
√ √ √ √ √ √ √ √ √
Destination or location specific business √
Mode of delivery for goods and services √ √
Planning for all hazards (involving organisations, local authorities and the community)
√ √ √ √ √ √ √ √ √
However, several crisis management and disaster recovery researchers such as Quarantelli
(1993), Senge (2006), Simonovic (1982b), Mileti (2005), Alesch et al (2009) and Reason et al.
(2006) have written on crises or disaster being complex phenomena with many interacting
agents. From the work of these authors, and from the multiple interacting elements in the
264 Significant contributors to sectoral and organisational short-term recovery
Canterbury context, it is therefore possible to deduce that recovery from disaster should be from
a holistic or integrated, i.e. systemic, perspective of these interconnected agents.
Consequently, the signifiers of recovery identified here should be used in the context of the
organisation or the sector and the systems they belong to. The basic statistical techniques used in
this chapter to highlight elements which affect recovery, while helpful, assume the laws of
additivity and take the signifiers in isolation. From chapter 2, it was shown that cause and effect
are not always linear or on a one-to-one ratio: the signifiers apply in different ways to different
sectors. Also discussed in chapter 2 were the direct and indirect effects of disaster over time. A
holistic, systems approach to investigating disaster recovery is more likely to show direct and
indirect interactions. In light of these considerations and in addition to the information in Table
7-14, chapters 8 and 9 contain analysis on the system behaviours, aids and hindrances to
recovery. The chapters also cover the points in a system where recovery may be influenced.
7.7.1 Time, recovery rate and short-term recovery trajectory
The path recovery takes for different organisations is dependent on a multitude of factors
including location, industry sector, cash flow, type of goods and services the organisation
provides, the overall recovery plan as well as other system effects such as the number of
suppliers and how they each affect the organisation. From the above information, apart from the
different combination of factors that affect the recovery of different organisations and industry
sectors, it can be concluded that one of the factors affecting rate of recovery is time.
Consequently, not only does recovery take a different course depending on organisation and
sector but also the timeline for recovery is not uniform. This is illustrated in Figure 7-23
This research focused on the response and short-term recovery timeframe after disaster. It is
acknowledged that the timespan of recovery extends beyond that. Prior to the earthquakes in
Canterbury, organisations the world over experienced the global financial crisis. Some sectors,
e.g. building suppliers, specifically reported that they were affected by the global financial crisis.
For medium- to long-term recovery, a direction for future work is to determine how much
influence the global financial crisis may have had on organisational recovery after the
earthquakes. Also in relation to time in organisational recovery is the need for business owners
to gauge when they are going to (re)open by also looking at the need for the goods and services
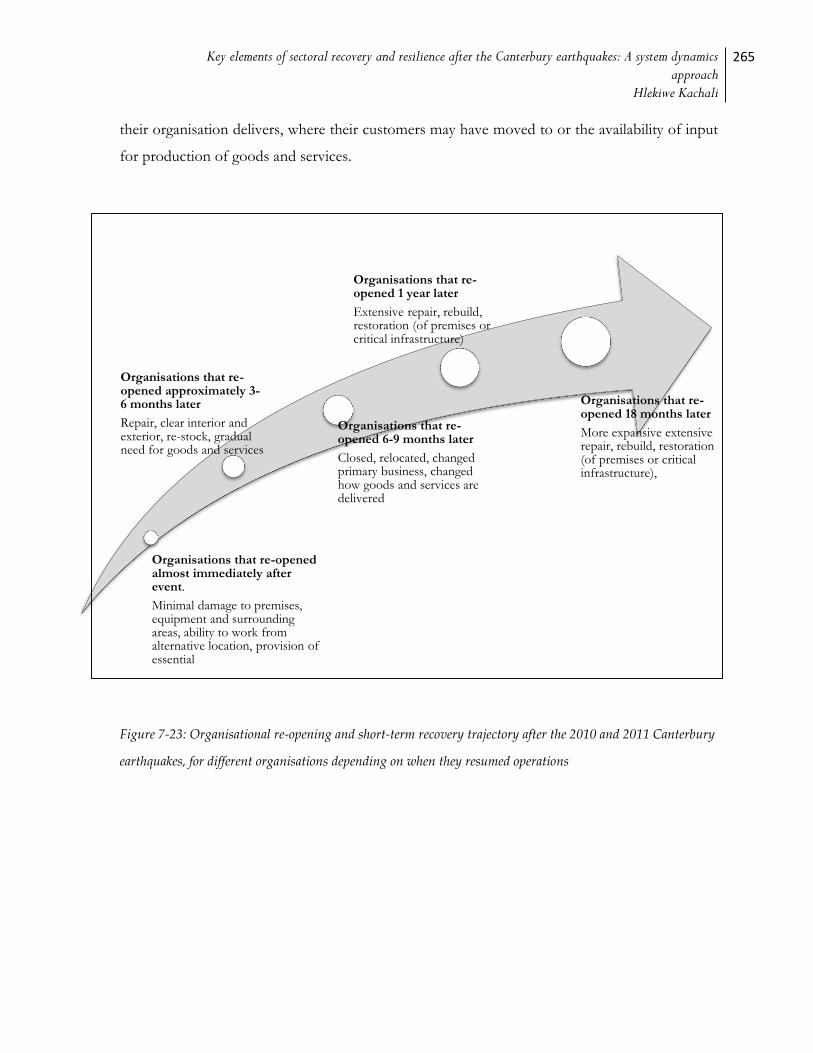
Key elements of sectoral recovery and resilience after the Canterbury earthquakes: A system dynamics approach
Hlekiwe Kachali
265
their organisation delivers, where their customers may have moved to or the availability of input
for production of goods and services.
Figure 7-23: Organisational re-opening and short-term recovery trajectory after the 2010 and 2011 Canterbury
earthquakes, for different organisations depending on when they resumed operations
Organisations that re-opened almost immediately after event.
Minimal damage to premises, equipment and surrounding areas, ability to work from alternative location, provision of essential
Organisations that re-opened approximately 3-6 months later
Repair, clear interior and exterior, re-stock, gradual need for goods and services
Organisations that re-opened 6-9 months later
Closed, relocated, changed primary business, changed how goods and services are delivered
Organisations that re-opened 1 year later
Extensive repair, rebuild, restoration (of premises or critical infrastructure)
Organisations that re-opened 18 months later
More expansive extensive repair, rebuild, restoration (of premises or critical infrastructure),

266 Significant contributors to sectoral and organisational short-term recovery
7.7.2 An important note for crisis managers, emergency managers and recovery
leaders
From the results in this chapter, it is apparent that the chaos of the response and short-term
recovery phases after disaster may show recovery results that are counterintuitive when taken in
the context of long-term recovery. Organisational recovery results in the short-term are not
necessarily an indication of the final organisational recovery trajectory. For instance, building
suppliers showing revenue losses when their products should be in high demand after the
physical damage caused by an earthquake.
However, the results in this chapter are useful for other organisations that may find themselves
in a similar situation regardless of the cause of the crisis or disaster. It is essential that
organisations recognise that there are different parts to the overall recovery process; parts which
call for different skills and types of resources. Additionally, it may be possible to use short-term
recovery results and trends as one of the inputs in an overall recovery strategy.
Specifically for organisations, and pertaining to disasters of a regional nature such as that in
Canterbury, the short-term recovery period may be a time when resources from local authorities
(if at all available) have not been made accessible to organisations. Organisations may need to
make individual plans to keep going while awaiting official aid. It may be that challenges and
trade-offs may have to be made in the response and short-term recovery phase so as not to
compromise longer-term recovery efforts. The accessibility and availability of a large amount of
resources for an extended period after disaster are discussed further in chapters 9 and 10 of this
thesis. Hills (2002) writes that the specific time and [physical] location of a disaster may disguise
the fact that it may take a considerable amount of time to recover and that not all affected by the
disaster will actually recover. For the organisations affected by the earthquakes in Canterbury,
this means that not all of them will survive and not all will recover.
7.8 Chapter summary
From the above discussion, it can be seen that for the different industry sectors and for the
organisations within those sectors, the different contributors to recovery affect the rate of
recovery to differing degrees. From the extent to which the Canterbury region was affected by
the sequence of earthquakes, it has emerged that organisational level characteristics only play a
Key elements of sectoral recovery and resilience after the Canterbury earthquakes: A system dynamics approach
Hlekiwe Kachali
267
certain part in the trajectory of organisational and sectoral recovery. For instance, organisation
size measured by the number of full-time equivalent staff, the existence and practise of
emergency plans and the organisation’s average annual sales growth over five years were found
to not significantly affect short-term recovery.
For all sectors, factors that did affect short-term recovery (positively and/or negatively
depending on sector) include:
wellbeing of staff;
relationship with and capability of staff;
customer issues;
availability of different kinds of resources to enable production and delivery of goods
and services;
organisational adaptation; and
combined planning between the stakeholders in recovery such as organisations, local
authorities and the community.
Furthermore, organisations more affected by environmental factors such as service interruption
to utilities as well as disruption caused by factors such as damage to equipment or machinery
showed more post-earthquake revenue losses than organisations that were less disrupted. As
well, organisations affected to a greater degree also operated fewer hours after the earthquakes.
(see Chapter 9 for specific critical success factors (CSFs) for each sector’s recovery)
For Canterbury, this chapter also showed that the components to short-term recovery (as
defined in this thesis) do not account for all the elements that determine the recovery trajectory
of an organisation or sector. Factors external to the organisation or sectors are involved, for
instance the global financial crisis and to a lesser extent, the geographic location of the
organisation. Environmental elements such as how the sectors interact with each other and with
the wider economy, decisions on recovery (e.g. access to organisational premises) made by the
Recovery Authority and insurance payments should also be factored in.
268 Significant contributors to sectoral and organisational short-term recovery
Furthermore, environmental factors that were not included in the list of contributors and
components to recovery in some cases played a greater role in the recovery of organisations.
Insurance, which most organisations had but which was subject to payment delays is one such
component. For some organisations, this compromised their financial position. For
organisations in and around the CBD, Recovery Authority ambiguity on access to the cordoned
off area did not help recovery as they could not access organisational records and assets.
Showing how these components can interact, the inability for some organisations to access the
cordoned off area and retrieve documents further delayed insurance claims settlement. The
global economic climate was a component that affected building suppliers. However, it is
unclear to what extent this contributed to their revenue losses post-earthquake. For the
Christchurch CBD and the town centres, geographic location is a contributor to their recovery.
In the Canterbury earthquakes context, these locales were subject to proximity to the earthquake
epicentre and also the existence of building stock prone to damage from earthquake shaking.
It should also be noted that due to the subjective nature of any disaster, the more significant
contributors to organisational recovery will likely differ by sector and by disaster. This is
evidenced by the different sectors having dissimilar signifiers of recovery. Additionally, the
measure of recovery used in this chapter is post-disaster revenue changes in the short-term
recovery phase. However, dependent on the purpose of the organisation, i.e. of the system, it
would be prudent to use more than one measure of recovery in combination. These measures
should be relevant to the organisations using them and can be defined by the organisations
themselves.
In chapter 8, system dynamics techniques will be used for the analysis of how different elements,
such as the contributors and signifiers of recovery within a system, interact to affect
organisational recovery.

Key elements of sectoral recovery and resilience after the Canterbury earthquakes: A system dynamics approach
Hlekiwe Kachali
269

270 System dynamics of sectoral and organisational recovery
8 System dynamics of sectoral and organisational recovery
This chapter has the results of the use of system dynamics techniques in the analysis of
organisational and sectoral recovery after the 2010 – 2011 earthquakes in Canterbury. As shown
from the preceding chapter, recovery of an organisation in the aftermath of a disaster event
should be considered within the context of a dynamic architecture that incorporates
interdependencies and downstream effects. The industry and geographic sectors in Canterbury,
in fact in any economy, are interrelated and affect each other’s recovery. The reason for using
the principles of system dynamics is to better understand system behaviour that influences the
recovery of organisations and industry sectors as well as possible points of intervention in their
recovery. Organisational or sectoral recovery is defined here as when an organisation or sector can
function and sustain itself (continually) in its new post-disaster environment. From a systems perspective,
three vital aspects should be kept in mind with this (or any) definition of organisational or
sectoral recovery: (1) recovery is a process and takes time; and (2) the organisation, as a system
and its environment, is dynamic and not static. Ultimately, the organisation’s primary aim is of
production and selling of goods and services. Accordingly, a third aspect (touched on in chapter
6.9 and discussed further in this chapter) is that the organisation or sector in continually
functioning and sustaining itself after disaster, undertakes different activities in order to achieve
this primary aim. For instance, in the response phase, the organisation while not producing and
selling goods and services at pre-disaster capacity, engages in activities to return to this pre-
disaster state; i.e. to recover.
In this chapter, with the use of system dynamics techniques, conceptual models of the system
being investigated are developed to aid in the analysis and identification of the behaviour or
system characteristics that influence organisational and sectoral recovery. A system is an
assemblage or combination of things or parts forming a complex or unitary whole (R. A. Johnson et al., 1964,
p. 367). A system is defined for and has a purpose and is encircled by its environment (D. H.
Meadows & Wright, 2008). In this research the system is comprised of the organisations and
sectors in the study, and the environment consists of any elements they interact with in recovery.
The system dynamics approach can be used in any dynamic system with mutual interaction
between elements, information feedback and circular causality (see chapter 2.2 for more detail).
Each system dynamics model is built around a particular phenomenon: in this case the recovery
Key elements of sectoral recovery and resilience after the Canterbury earthquakes: A system dynamics approach
Hlekiwe Kachali
271
of sectors after the Canterbury earthquakes. The phenomenon being investigated defines the
elements that are included in the model. This is helpful in representing the system and its
environment. Importantly, system dynamics models are not predictive; they are used to explore
the behaviour in complex systems with numerous interactions.
Every disaster contains some element of surprise and is unique. Therefore, the system dynamics
models presented here are representative of the recovery of organisations and sectors as seen
through the eyes of the organisations in this study. This means that factors not shown in the
models are assumed to be constant or that their changes are negligible and do not affect the
system’s behaviour to a great degree. For the purposes of analysis in this thesis, it assumed that
the factors not shown are held constant. This allows for the analysis to focus on the
relationships between the elements of interest. In this case, those factors which have an
influence on and influence the recovery of organisations and sectors. In effect, this is a use of
the ceteris paribus clause used in science, engineering, economics and other disciplines. For
instance, Schlicht and Thompson (1985) in their work on isolation and aggregation in economic
modelling, write that all factors not explicitly considered as variables are assumed to be fixed within an
argument.
Furthermore, also crucial to the analysis in this thesis and closely related to ceteris paribus, is that
it is not the larger, complete, system under investigation. It is only a part of the wider system that
is analysed; a part defined for the purposes of studying organisational and sectoral recovery. As
such, it can be concluded that the analysis done here is only for a partial system. Another way to
look at this is from Sterman’s (2002) work in which he states that any system is the worldview,
or mental model, of the individual who defined it. Having said this; despite the systems in this
thesis being developed with information for the Canterbury earthquake organisational and
sectoral recovery, there are some general lessons that could apply to many other organisations
outside the region. The effects to organisations and sectors have not been ranked. This is
because it is difficult to rank effects due to the multiple interactions within a system and also
because the rankings would differ by sector. However, chapter 9 contains critical success factors
(CSFs) for the recovery of organisations and sectors.
272 System dynamics of sectoral and organisational recovery
Dynamic systems share common characteristics such as positive and negative feedback loops,
delayed feedback, oscillation and amplification. Positive feedback loops are reinforcing whereas
negative feedback loops are self-correcting (or goal seeking). Feedback loops enable the
transmission of information of the state of the system and influence the occurrence being
observed. The various feedback loops in a system are dominant at different times and contribute
to balancing the system. The presence of the feedback loops counterbalancing each other also
leads to the emergent property of resilience. Apart from resilience, hierarchy and self-
organisation are the other features of a system that enable the system to function well.
In a system, positive (reinforcing) feedback loops carry on until offset by a negative feedback
loop or by the unavailability of one of the required resources to keep the positive loop going.
This results in either S-shaped growth where the system reaches equilibrium, i.e. the system goal, or
overshoot and collapse where the system exceeds its capacity to sustain growth and then reverses the
direction of growth and attains equilibrium. In some cases, overshoot and collapse can lead to
the destruction of a system. System dynamicists, e.g. Forrester (1969), Meadows (2008) and
Sterman (2000), have written extensively on such system behaviour.
As stated earlier, the system and its environment affect each other. In this thesis, for the time
horizon under scrutiny, the delays referred to are environmental time delays. These environmental
time delays had an effect on the system (organisations or sectors as systems) and are shown in
the system dynamics diagrams as orange (showing as light grey when printed in black and white)
causal loop arrows.
Lastly, it is usually the case that there are multiple feedbacks loops interacting simultaneously in a
system. This makes observation of interactions and effects more complicated. Therefore, in the
systems analysis process, it is useful to start with a system in equilibrium to which a perturbation
is introduced. This makes it easier to observe which elements are affected and in what way. In
the case of the organisations and sectors in Canterbury, such a disturbance is the earthquakes. As
well, the dynamic modelling allows for adjusting of various system parameters and noting their
effects.
Key elements of sectoral recovery and resilience after the Canterbury earthquakes: A system dynamics approach
Hlekiwe Kachali
273
Systems diagrams
In this work, causal loop diagrams (CLDs), and to a limited extent stock and flow diagrams, are
used to understand the behaviour of the system (see chapter 3 for more detail). In the causal
loop diagrams, negative feedback loops are shown as a B (balancing) and positive feedback loops
are shown as an R (reinforcing). CLDs have arrows from one element to another; the direction
of each arrow shows the direction of effect. The polarity of each arrow denotes the relationship
between the connected elements. Positive polarity shows that the elements change in the same
direction while negative polarity indicates change of the elements in opposite directions.
CLDs are used for qualitative analysis and are used as a foundation for the stock and flow
diagrams in this chapter. Stock and flow diagrams can be quantified and used for simulation. In
this work, stocks and flows were included in the analysis for organisational recovery only. The
quantification is done using information from interviewees as well as from other sources such as
Statistics New Zealand. However, inspection of the resulting graphs suggests that the time
horizon for this research covers the effects in the response and short-term recovery phases after
the earthquakes: phases marked by great uncertainty. The full effects need to be observed at
longer times, e.g. 4 to 10 years, after the earthquakes. Also, more information is required, from
other sources, to be added to the quantified stock and flow diagrams if a more detailed analysis,
leading to policy formulation, is to be done. This extra information is beyond the scope of this
research to fully explore. The quantification and additional analysis of the stock and flow
diagram for organisational recovery are included in appendix J.
Figure 8-1 is a simplified system dynamics causal loop diagram showing the negative feedback
loop for organisational or sectoral recovery. It shows that actual organisational or sectoral output can
be disrupted by external events, in this instance seismic activity. This results in a difference
between the intended organisational or sectoral throughput and the actual organisational or sectoral
throughput. A decrease in actual organisational or sectoral output leads to an increase in the deficit in
organisational or sectoral output, hence the arrow having negative polarity. The information from the
goal of the system, intended organisational or sectoral output, coupled with the state of the system,
actual organisational or sectoral output, leads to knowledge of the gap, deficit in organisational or sectoral
output. This then leads to the development of organisational or sectoral recovery programmes aimed at
274 System dynamics of sectoral and organisational recovery
closing the gap between the organisation’s or sector’s intended and actual throughputs. The
direction of the negative feedback loop B denotes the direction of net effect. The feedback loop
is negative because it acts to reduce changes to the system to achieve a specific goal. Hence, in
Figure 8-1, the power and efficacy of organisational or sectoral recovery measures and programmes
governs the organisation’s or sector’s rate of recovery. Intended organisational or sectoral output is
considered an auxiliary variable.
The CLDs in this study are built primarily using information from survey and interview data
from key participants in the system. Other input data are from government agencies and
documents from various specialised areas (e.g. geology, engineering and economics). The
combination of information from these sources, to generate the CLDs, led to the emergence of
significant information that would have been difficult to visualise and comprehend had the
system elements been observed individually. When elements in a system are considered
individually, there is a possibility of concluding that some elements are more important than
others and also not detecting the interactions between numerous elements. Sterman (1994, p.
305), showing the value in using system dynamics, writes that in dealing with complexity people
generally adopt an event-based, open-loop view of causality, ignore feedback processes, fail to appreciate time delays
between action and response and in the reporting of information, do not understand stocks and flows, and are
insensitive to nonlinearities that may alter the strengths of different feedback loops as a system evolves.

Key elements of sectoral recovery and resilience after the Canterbury earthquakes: A system dynamics approach
Hlekiwe Kachali
275
Figure 8-1: Simplified causal loop diagram (CLD) for sectoral and organisational recovery after the Canterbury
earthquakes
Chapter arrangement
This section of the thesis is arranged as follows. The findings are presented first at the sectoral
level and then at the organisational level. For both the sectoral and organisational levels, the
models are divided into two main parts with respect to the earthquakes and to show the
changing behaviour of the system over time. The first part covers the response phase and the
second part is the short-term recovery phase. The response phase is mainly characterised by
organisational and sectoral activity to prevent further damage after the earthquakes. There is also
a lot of uncertainty in the response phase. The short-term recovery phase is when organisations
and sectors work to return their situation to normal or to the desired recovery goal they have
identified. It is shown in the analysis that the activities in these two time periods after disaster are
considerably different and require different sets of skills and resources. At the sectoral level, only
causal loop diagrams are utilised. In addition, at the organisational level is a stock and flow
diagram depicting organisational recovery. The organisational level stock and flow diagrams are
Actual organisational
or sectoral output
Organisational or sectoralrecovery measures and
programmes
Intendedorganisational orsectoral output
Deficit inorganisational orsectoral output
-
+
+
+
B
Seismic activity
-
276 System dynamics of sectoral and organisational recovery
presented in two parts. Part one represents organisational response and part two is
organisational short-term recovery.
Both types of systems diagrams are accompanied by a description of the interactions between
the agents in the system. Following on from this description of systemic exchanges is an
explanation of the system characteristics that influence recovery. For clarity of presentation, the
sectoral causal loop diagrams for each time period after the earthquakes are presented in three
parts. The first part is an overview of the inter-sectoral effects involving all the sectors in this
study. This is to illustrate the overall sectoral interactions. The second and third parts each depict
only some of the sectors as well as environmental factors that influence their recovery. This is so
that the interactions between the sectors and the environment are magnified for more detailed
analysis. For instance, Sterman (2000) advises against showing all the important loops in a single
complicated diagram as the information to be conveyed may be lost. Lastly, some of the
diagrams have orange coloured causal arrows. This indicates a time delay in the environment
that had a pronounced effect on organisations and sectors.
8.1 Sectoral response phase
Response is the period from the first moments after the shaking stopped to a few weeks after
the earthquakes. For the 4 September 2010 earthquake, organisations reported that this phase
lasted up to four to five weeks after the earthquake. This is except for organisations in Kaiapoi
for whom this period was slightly longer. Organisations further reported that after the 22
February 2011 earthquake, the response phase lasted on average up to 10 weeks after the
earthquake. As most organisations in this study were more affected by the 22 February 2011
earthquake (see chapters 5 and 6), most of the effects described in this section are from the
period after this earthquake. The analysis again shows the dissimilar effects to sectors.
8.1.1 Overview of inter-sectoral effects in the response phase
The sectors interacted with each other in different ways. The causal loop diagram in Figure 8-2
demonstrates the propagation of earthquake effects between the sectors in the response phase.
No environmental factors are shown in Figure 8-2. The clear boxes, e.g. health of building suppliers
sector, represent the sectors in this study. The use of the word health is to illustrate the wellness of
the sector at any point in time. The use of the word health, qualified by descriptive adjectives
Key elements of sectoral recovery and resilience after the Canterbury earthquakes: A system dynamics approach
Hlekiwe Kachali
277
like well or ill, also enables understanding of the state of a stock at a given point in time. The grey
boxes on the causal arrows are the way(s) in which one sector affected another, with effects in
the direction of the causal arrows. Using one of the links in Figure 8-2, health of the critical
infrastructure sector and health of Lyttelton Town Centre as an example, the grey box closure of or
disruption to Tunnel, Port, roads means that the change was in the sector at the tail of the arrow and
the effects were to the sector at the head of the arrow. If the change in the health of the
initiating sector is for ill, i.e. negative, and leads to ill health in the receiving sector also, the
polarity of the arrow is positive. So, the change to the critical infrastructure sector was the
damage and disruption of the Lyttelton Tunnel, Lyttelton Port and roads. Briefly, effects to
Lyttelton Town Centre were that it was difficult to get in to or out of the town centre. As well,
not shown in Figure 8-2 but in other causal loop diagrams are some of the multiplicative effects
of difficulty in accessing Lyttelton Town Centre, for example to the retailers needing supplies.
The causal loop diagrams are a representation of the system and are used to illustrate the more
detailed explanation contained in the text. In the same way, the effects in the grey boxes are also
explained in detail in the text.
The boundary of a system is defined dependent on the scope of analysis and on the information
obtained. It should be noted that the CLDs are constructed using information provided by
organisations in this study, through interviews and surveys. For instance, in the wider system,
there are other organisations, sectors and elements that interact with those in this study but that
have not been included in the CLDs. The details in the CLDs are those which organisations and
sectors explicitly reported as affecting them and which they affected. Consequently, effects from
other organisations and sectors and even some from the earthquakes, e.g. ground deformation,
that were not mentioned by organisations and sectors are considered part of the system’s
environment.
In general, there was diminished capacity in all sectors in the period after the earthquakes. The
different levels of effect were to infrastructure, organisational assets and employees. The
individual sectors were affected to differing degrees by each of these three aspects. For example,
infrastructure damage was more pronounced for hospitality, Christchurch CBD, the town
centres and critical infrastructure. Whereas, FMCG and also critical infrastructure were very
affected by damage to organisational assets, e.g. stock for FMCG and service delivery

278 System dynamics of sectoral and organisational recovery
architecture for critical infrastructure. All sectors reported that staff wellbeing was of primary
concern.
The importance of critical services such as electricity, water, gas and roads, provided by critical
infrastructure whose health was diminished, to other industry sectors became apparent as all
sectors were disrupted by interruption to critical services. There was a gradual resumption of
productivity for the sectors depending to what extent they had been affected and the nature of
goods and services they produced. In essence, some sectors (e.g. critical infrastructure and some
trucking organisations) had to step up while others (e.g. hospitality) had to step down or scale
back operations.
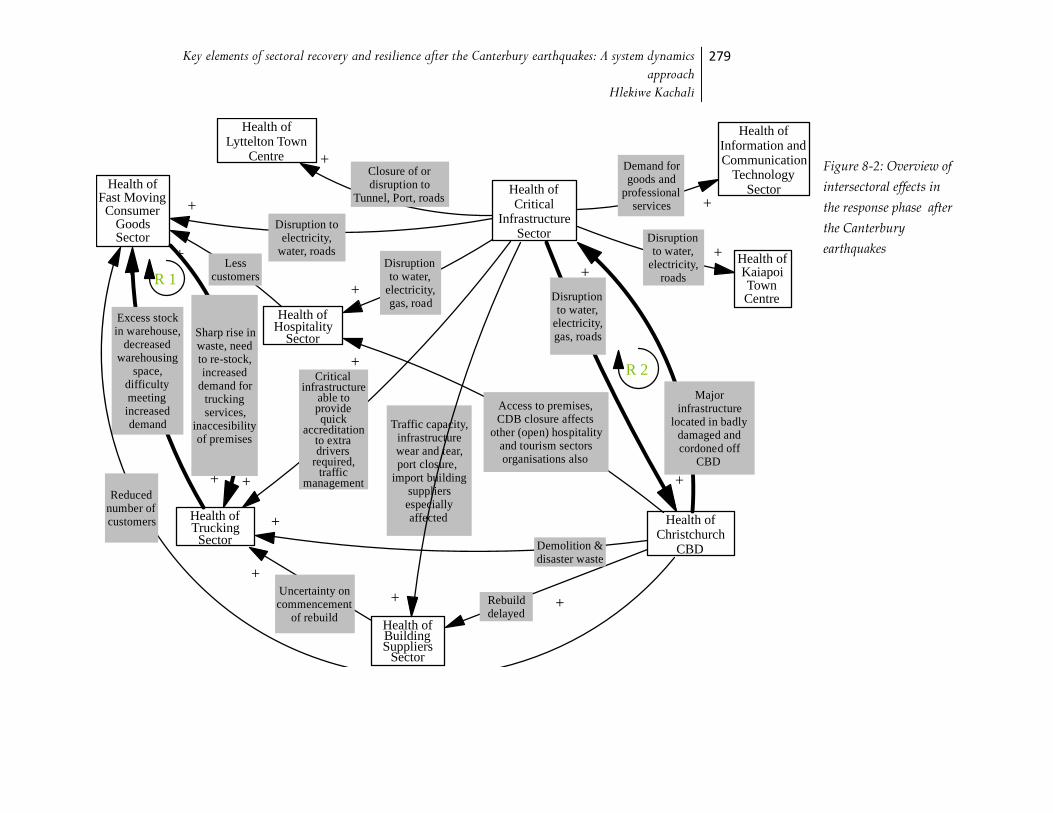
Key elements of sectoral recovery and resilience after the Canterbury earthquakes: A system dynamics approach
Hlekiwe Kachali
279
Figure 8-2: Overview of
intersectoral effects in
the response phase after
the Canterbury
earthquakes
Health ofInformation andCommunication
TechnologySector
Health ofBuildingSuppliers
Sector
Health ofFast MovingConsumer
GoodsSector
Health ofHospitality
Sector
Health ofTrucking
Sector
Health ofCritical
InfrastructureSector
Health ofKaiapoiTownCentre
Health ofChristchurch
CBD
Health ofLyttelton Town
Centre
+
+
++
+
+
+
+
+
+
+
Disruptionto water,
electricity,gas, road
Disruption toelectricity,
water, roads
Sharp rise inwaste, needto re-stock,increased
demand fortruckingservices,
inaccesibilityof premises
Demand forgoods and
professionalservices
+
Access to premises,CDB closure affects
other (open) hospitalityand tourism sectorsorganisations also
Closure of ordisruption to
Tunnel, Port, roads
Traffic capacity,infrastructurewear and tear,port closure,
import buildingsuppliersespeciallyaffected
Criticalinfrastructure
able toprovidequick
accreditationto extradrivers
required,traffic
management
+
Disruptionto water,
electricity,roads+
Majorinfrastructure
located in badlydamaged andcordoned off
CBD
Disruptionto water,
electricity,gas, roads
R 2
R 1
+
Demolition &disaster waste
Rebuilddelayed
Uncertainty oncommencement
of rebuild
Excess stockin warehouse,
decreasedwarehousing
space,difficultymeetingincreaseddemand
++
Reducednumber ofcustomers
Lesscustomers
280 System dynamics of sectoral and organisational recovery
In Figure 8-2 the critical infrastructure sector has interactions with all the other sectors in this
study. This was a result of the interruption to critical services such as electricity, water, roads and
to a lesser extent gas. The consequences of this varied by sector. For instance, one of the
consequences to Lyttelton Town Centre was the closure of the Lyttelton Road Tunnel that
connects it to the rest of greater Christchurch. The closure of the Tunnel affected the movement
of people and goods into and out of the area. As well, the town was affected by the closure of
Lyttelton Port, the main port for import and export in Canterbury. The building suppliers sector
was also affected by closure of the Port and damage to other road infrastructure. Additionally,
both the building suppliers and trucking sectors were affected by increased traffic on the roads
due to reduced road capacity. The health of building suppliers sector also influenced the health of
trucking sector. The uncertainty faced by building suppliers meant that they affected trucking
organisations that worked with them.
The health of the Christchurch CBD has a bearing on the health of the hospitality sector as well as on the
health of the FMCG sector. The hospitality sector organisations whose premises were in the CBD
Red Zone had difficulty accessing their premises. In addition, damage to the CBD affected the
tourism sector which also affected the hospitality sector. The deterioration of the CBD also
meant that there was a relocation of a large group of people who were customers of the FMCG
organisations that served the CBD. Some of the FMCG customers included hospitality
organisations that were closed. Other more detailed consequences are contained in chapters 5 to
7.
In Figure 8-2 are the reinforcing feedback loops R1 and R2 for sectors in this study that showed
especially high levels of interdependence: trucking-FMCG and critical infrastructure-
Christchurch CBD. Reinforcing feedback loops, if left unchecked, continue in the direction of
amplification unless slowed down or counterbalanced. Loop R1 involves health of trucking sector
and health of fast moving consumer goods sector. Fast Moving Consumer Goods (FMCG) organisations
had an increased need for trucking services due to excess stock waste that required disposal. The
excess waste was caused by spoilage of putrescible products resulting from interruption to
electricity and water supplies. Other stock waste was caused by breakage brought on by
collapsed shelving and falling merchandise. This stock breakage and spoilage required a massive
clean-up operation which took some time and resulted in closure of some FMCG organisations,
e.g. supermarkets. As a result of the increased demand for trucking services from FMCG, one
Key elements of sectoral recovery and resilience after the Canterbury earthquakes: A system dynamics approach
Hlekiwe Kachali
281
would expect that the polarity of the trucking-FMCG causal arrow in Figure 8-2 should be
negative. That is, that the increased demand for trucking services which could result in better
health for the sector even as the health of the FMCG sector diminished.
However, this is not the case as closure of supermarkets resulted in trucking organisations not
being able to deliver goods. Truckers reported that this affected them more as the supermarkets
were closed for an extended period even after waste was taken away. This is because
supermarket closure led to an accumulation of undelivered stock in trucking warehouses, which
were at the same time facing the problem of reduced space because of earthquake damage (and
potentially affected more of the trucking sector’s customers, not just supermarkets). This also
caused a backlog of unfulfilled orders for truckers that brought goods into the region. Loop R1
can be counteracted by clearer and timelier communication between the sectors involved,
leading to the re-establishment of the supply-demand equilibrium. For instance, information
from FMCG to trucking on how long closure would be. This information could then be passed
on to manufacturers. As shown in chapter 5, reactions based on incorrect, incomplete or delayed
information can be costly for organisations as they may vary orders or production schedules
based on this information. This may cause excess or insufficient stock. The storage or
production of excess stock also adds to costs.
Loop R2 is that of health of critical infrastructure sector and health of Christchurch CBD. It illustrates the
consequences when infrastructure providers have major assets in built-up areas with a lot of
unreinforced masonry buildings that were badly damaged by the earthquakes and subsequently
condemned for demolition. A lot of the buildings in the Christchurch CBD were badly damaged,
especially after the 22 February 2011 earthquake, which led to the cordoning off of the CBD.
This resulted in limited access for critical infrastructure providers to parts of their networks in
the cordoned off area and also to organisational records for those critical infrastructure
providers with offices in the CBD. This inability to access the physical parts of the infrastructure
affected the rate at which some repairs could be done. In the same loop (R2), organisations in
the CBD area but not within the cordon were affected by interruption to critical services as they
were serviced by parts of critical infrastructure networks within the cordon. These organisations
on the periphery of the cordon were also subjected to slightly extended service interruption
282 System dynamics of sectoral and organisational recovery
times as they waited for critical infrastructure providers to gain access to the cordoned off area,
make repairs and restore service.
For Figure 8-2, the sectoral response phase, both feedback loops are reinforcing. Reinforcing
feedback loops carry on until there is a negative loop to counterbalance them or in the case of
systems involving physical entities, until one of the required resources runs out. Following the
response phase, it is seen that in the short-term recovery phase, these loops are no longer
present. This is because, in both cases, after the initial information delay, equilibrium was
restored as for R1 FMCG organisations could take delivery, trucking could deliver and for R2
critical infrastructure could access the CBD and make repairs even as it took longer for the
repair and restoration of the CBD itself.
8.1.2 Trucking, critical infrastructure, FMCG and Christchurch CBD
Figures 8-3 and 8-4 show the more detailed interactions between health of trucking sector, health of
critical infrastructure sector, health of fast moving consumer goods sector and health of Christchurch CBD.
Figure 8-3 shows the overall interactions and Figure 8-4 better emphasises the loops. Orange
coloured causal arrows are used to show time delays from the environment, which affected
organisational recovery. Both figures contain the environmental elements that affect the
recovery of the sectors shown and that are relevant to the interactions in the models. Some of
these environmental elements include organisations such as local authorities: Christchurch City
Council (CCC), Environment Canterbury (ECan) and other local councils (represented by
hexagons). Elements such as finance also affect organisations. However, they have not been
included here for two main reasons. First, in the response phase when organisations and sectors
were trying to prevent further damage, finance was not the most important aspect. For example,
in some cases, difficulty accessing personnel to assess buildings was more of a problem. Second
is that the size of the regional economy was a buffer for some of the effects of the earthquake
(see chapters 6.7.3 and 6.7.4). Also, in Figures 8-3 and 8-4 is text in black font that is not
enclosed in boxes or hexagons. These elements are non-organisational or non-sectoral parts of
the environment. i.e. they are auxiliary variables. They affect and are affected by the sectors in
this study and, in the diagrams, have been left unenclosed for clarity.
Starting with Figure 8-3 the health of the critical infrastructure sector is affected by the availability of
spare parts and by skilled labour. Both of these factors influence the rate at which repairs can be
Key elements of sectoral recovery and resilience after the Canterbury earthquakes: A system dynamics approach
Hlekiwe Kachali
283
carried out. Health of the critical infrastructure sector has an effect on the revenue levels of the
Christchurch City Council (CCC). This then affects the health of Christchurch CBD as CCC is a
major source of funding for the rebuild of the CBD. This is because CCC own buildings in the
city centre, such as the Town Hall, that were damaged and require extensive repair or rebuilding.
The health of Christchurch CBD affects health of the trucking sector. Some of the reasons for this
include those trucking organisations that had customers in the CBD as well as trucking
organisations that had an increased workload of debris removal after the earthquakes. Both the
trucking and FMCG sectors are affected by excess waste (discussed in the previous section) and
excess stock in warehouses which was caused in part by a shortage of warehousing space. The inadequacy
in warehousing was brought about by earthquake damaged warehousing. Another link in Figure 8-3 is
between Environment Canterbury (ECan - the regional council in the greater Christchurch
region) and health of the critical infrastructure sector. ECan contracts public transport services from
some of the critical infrastructure organisations. In addition, ECan decides when and which
transport services and routes to run. After the earthquakes, services were greatly reduced, partly
due to damaged infrastructure and also a reduced customer base, which affected the critical
infrastructure sector.
In the response phase, land use planning decisions were important for FMCG, critical infrastructure
and Christchurch CBD. The delay in availability of this information was caused in part by the
delay in geotechnical assessment of land in the greater Christchurch region. As discussed in
chapters 5 to 7, a delay in geotechnical inspections contributed to some of the delays in
insurance claim settlements. Land use planning information, related to population resettlement
patterns, was needed by FMCG and critical infrastructure providers for longer term planning of
retail outlets and network structure respectively. Land use planning decisions were also needed
for incorporation in repair, reconstruction and new build decisions. Knowledge of the proneness
of land to liquefaction for instance, was valuable to organisations and insurance companies for
decisions on proceeding with building repairs and new build and even had an effect on the
revision of insurance policies.
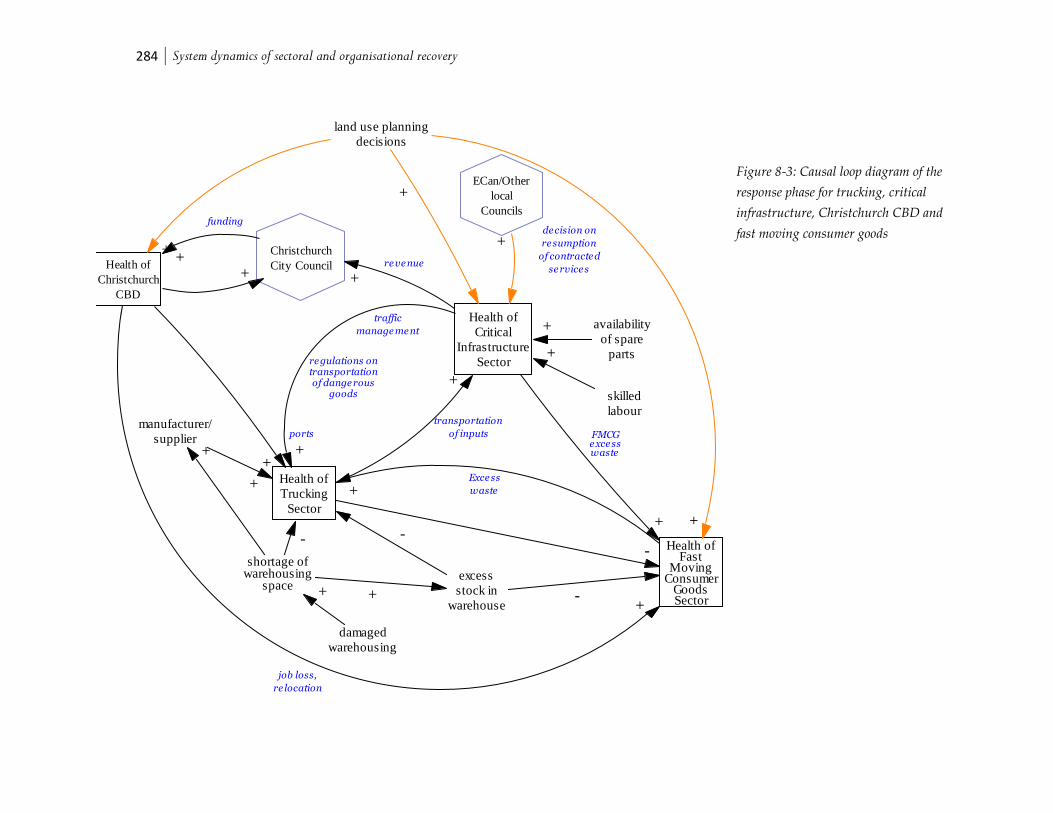
284 System dynamics of sectoral and organisational recovery
Figure 8-3: Causal loop diagram of the
response phase for trucking, critical
infrastructure, Christchurch CBD and
fast moving consumer goods
Health of
Trucking
Sector
Health of
Critical
Infrastructure
Sector
Health ofFast
MovingConsumer
GoodsSector
shortage ofwarehousing
spaceexcess
stock in
warehouse
FMCGe xce sswaste
land use planning
decisions
-
+ -
+
-
+
-
availability
of spare
parts
+
manufacturer/
supplier+
Christchurch
City Council
ECan/Other
local
Councils
+
+
+Health of
Christchurch
CBD
++
job loss,
re location
re gulations ontransportationof dange rous
goods+
ports
skilled
labour
re ve nue
fundingde cision on
re sumption
of contracte d
se rvice s
traffic
manage me nt
damaged
warehousing
+
++
+
+
+
+
transportation
of inputs
+Exce ss
waste
Key elements of sectoral recovery and resilience after the Canterbury earthquakes: A system dynamics approach
Hlekiwe Kachali
285
Figure 8-4 is a version of Figure 8-3 with the feedback loops emphasised. There are five
interacting feedback loops shown in Figure 8-4. As discussed previously, interactions of multiple
feedback loops increases difficulty in observing system effects. This is because it is not easy to
tell what the individual effects are. However, it is still possible to observe the emergent
behaviour of the system. The five feedback loops in Figure 8-4 are:
loop R1 – health of critical infrastructure sector, Christchurch City Council, health of Christchurch
CBD, health of fast moving consumer goods sector, health of trucking sector;
loop R2 - health of critical infrastructure sector, health of fast moving consumer goods sector, health of
trucking sector;
loop R3 – health of trucking sector, health of fast moving consumer goods sector;
loop R4 – health of trucking sector, health of critical infrastructure sector; and
loop R5 – Christchurch City Council, health of Christchurch CBD.
In day-to-day affairs, some loops and resulting interactions may not be noticed or are taken for
granted. This is to mean that they are vital but may be taken for granted. For instance, loop R5,
Christchurch City Council, and health of Christchurch CBD. The Christchurch City Council is
dependent on the Christchurch CBD for some of its revenue, in the form of rates and taxes. A
damaged CBD means that some of these rates and taxes are reduced and in some cases cannot
be collected. Unsurprisingly, critical infrastructure has the most connections of all the sectors in
the figure showing the reliance of business on critical services. It can also be seen from Figure 8-
4 that the sectors affect each other directly and indirectly.
Loop R1 includes critical infrastructure, Christchurch City Council (CCC), Christchurch CBD,
FMCG and trucking. This loop shows how organisations are influenced by and can influence
their environment. The loop contains links not only between the sectors under study but also
other important sectors they relate to. The reduced revenue from critical infrastructure providers
to CCC affects the type of construction projects that can be planned for and built in the
Christchurch CBD. This could possibly also affect the recovery of the CBD in the medium-
term. Also in loop R1 is the link between the CBD and FMCG. As a result of the earthquakes
the number of people in the CBD reduced drastically. This caused a drop in customer numbers

286 System dynamics of sectoral and organisational recovery
for organisations outside the cordon and for those that serviced organisations that used to be in
the Red Zone. FMCG organisations that serviced the CBD, both through hospitality
organisations and through the loss of direct sales to the relocated organisations, reported being
affected. This had knock-on effects for trucking organisations that worked with these FMCG
organisations. Loop R2 has trucking, critical infrastructure and FMCG. The disruption of critical
services resulted in excess waste for the FMCG sector. This meant that FMCG organisations
had more than the usual demand for trucking services. The trucking sector was affected by the
critical infrastructure sector by not being able to meet demand for transport of needed inputs.
Loop R3 is that of the FMCG and trucking sectors and was discussed in section 8.1.1.
However, in Figure 8-4, some of the environmental interactions for this feedback loop are
shown. The shortage of warehousing space affected manufacturers and suppliers who contracted trucking
organisations to deliver goods to the FMCG sector. When the supermarkets were ready to re-
stock, this had to be done gradually as not all their orders could be fulfilled immediately. For a
short while there was a lack of some goods on supermarket shelves as the supply-demand
balance was brought back to normal. The supermarkets however recognised that in this time
period they needed to stock more of goods such as bottled water, chocolate and cigarettes as
these were in higher demand after the earthquakes. This required constant readjusting of orders
by all the members in this loop, which forms part of a supply web.
Loop R4 has the reinforcing feedback loop between the trucking and critical infrastructure
sectors (the causal arrow from health of trucking sector to health of critical infrastructure sector is also part
of loop R2). The trucking organisations also faced increased demand for delivery of ordered
inputs from the critical infrastructure sector. The other causal arrow of loop R4 shows how the
health of the trucking sector was affected by damage to roads, the Lyttelton Port, the Lyttelton
Tunnel and bridges as well as by traffic management after the earthquakes. This led to truckers
incurring increased costs in vehicle maintenance and longer delivery times. Loop R5 interacts
with loop R1 and was discussed briefly in the analysis of loop R1. The Christchurch City Council
funding shortfall affected the health of the Christchurch CBD. However, the rates and taxes from the
CBD are some of the revenue sources for CCC. The manifestation of the loops in Figure 8-4
shows that aside from the preparation individual organisations engage in, they should also
consider that external, environmental, factors would affect their post-disaster recovery and so
must be included in planning. For instance, seismically reinforcing critical infrastructure while

Key elements of sectoral recovery and resilience after the Canterbury earthquakes: A system dynamics approach
Hlekiwe Kachali
287
still situating it in areas where buildings are vulnerable to earthquakes is only one part of the
solution as the infrastructure itself may suffer moderate damage but be inaccessible for repair.
Networks should also be designed with the environment they interact with in mind: first to
minimise damage and second to enable quick restoration.
All the loops in Figure 8-4 are reinforcing. Again, it should be noted that this is the response
phase after the earthquakes. In the case of organisational and sectoral recovery after the
Canterbury earthquakes, except for loop R1, the positive feedback is counterbalanced in the
short-term recovery phase. For loop R2, critical infrastructure services were gradually restored
for use by FMCG and trucking; the excess waste was removed; and FMCG organisations re-
opened and could take delivery of goods. Loop R3 is part of loop R2 and was also discussed in
the overview section. Loop R4 shares links with loop R2.
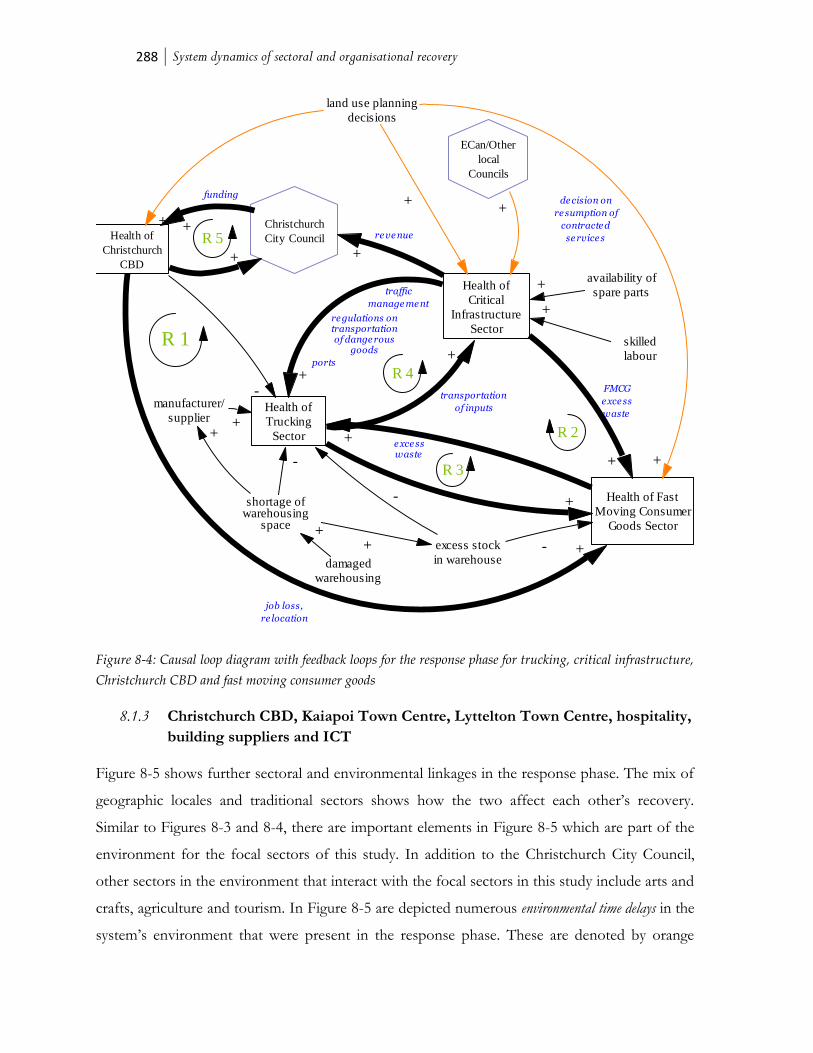
288 System dynamics of sectoral and organisational recovery
Figure 8-4: Causal loop diagram with feedback loops for the response phase for trucking, critical infrastructure,
Christchurch CBD and fast moving consumer goods
8.1.3 Christchurch CBD, Kaiapoi Town Centre, Lyttelton Town Centre, hospitality,
building suppliers and ICT
Figure 8-5 shows further sectoral and environmental linkages in the response phase. The mix of
geographic locales and traditional sectors shows how the two affect each other’s recovery.
Similar to Figures 8-3 and 8-4, there are important elements in Figure 8-5 which are part of the
environment for the focal sectors of this study. In addition to the Christchurch City Council,
other sectors in the environment that interact with the focal sectors in this study include arts and
crafts, agriculture and tourism. In Figure 8-5 are depicted numerous environmental time delays in the
system’s environment that were present in the response phase. These are denoted by orange
Health of
Trucking
Sector
Health of
Critical
Infrastructure
Sector
Health of Fast
Moving Consumer
Goods Sector
shortage ofwarehousing
space
excess stock
in warehouse
FMCG
e xce ss
waste
land use planning
decisions
-
+ -
+
+
+
-
availability of
spare parts+
manufacturer/
supplier
+
Christchurch
City Council
ECan/Other
local
Councils
+
+
+
Health of
Christchurch
CBD
++
job loss,
re location
re gulations ontransportationof dange rous
goods
R 3
+ports
R 1
R 4
skilled
labour
re ve nue
fundingde cision on
re sumption of
contracte d
se rvice s
traffic
manage me nt
damaged
warehousing
+
++
+
+
+
+
transportation
of inputs
R 5
-
R 2e xce sswaste
Key elements of sectoral recovery and resilience after the Canterbury earthquakes: A system dynamics approach
Hlekiwe Kachali
289
causal arrows. As pointed out earlier, the environment of the system is influenced by and
influences the system; the environmental time delays shown are for elements that were
important to organisations in that resources, e.g. information or manpower, were delayed.
Environmental time delays are shortened to time delays. Also, some of the interactions shown
have been discussed in sections 8.1.1 and 8.1.2 and are included here for completion of the
model.
The health of Christchurch CBD affected the health of ICT sector. This is because ICT organisations
had clients whose premises were located in the CBD Red Zone. Additionally, some of the ICT
organisations were themselves located in the CBD prior to the 22 February 2011 earthquake.
They sustained damage to equipment and disruption to operations. However, some ICT
organisations were shielded from the prolonged effects of the earthquakes because of their
customer/revenue base outside Canterbury or New Zealand.
In comparing the geographic locales, the Christchurch CBD has more interactions than either
Kaiapoi Town Centre or Lyttelton Town Centre. Also, the health of Christchurch CBD affects the
health of Kaiapoi Town Centre and health of Lyttelton Town Centre. The organisations in Kaiapoi Town
Centre, like the ones from Lyttelton Town Centre, reported that the possible moratoria on
commercial building and expansion could affect their long-term planning and viability. The
moratoria were part of proposals from some organisations in and around the Christchurch CBD
as a way of hastening recovery. The health of Kaiapoi Town Centre was also influenced by land use
planning decisions after the extensive liquefaction caused by the 4 September 2010 earthquake.
In Figure 8-5, commercial and residential rebuild are shown separately because of different
arrangements. The residential rebuild was managed by a specially appointed project management
construction organisation. The commercial rebuild on the other hand did not have such
arrangements. However, the pool of skilled labour and other resources required for both these
parts of the rebuild had a great deal of overlap. Furthermore, some building supplier, CBD and
town centre organisations in this study reported being affected more by commercial rebuild than by
residential rebuild. For some organisations, this is because the delay in commercial rebuild and the
difficulty finding suitable commercial accommodation affected their operations. The availability
of skilled labour also led to time delays in land use planning decisions as there was a shortage of the
290 System dynamics of sectoral and organisational recovery
necessary geotechnical manpower to carry out inspections in a timely manner. There was also a
shortage of skilled people to conduct building inspections and building demolitions as well as for the
commercial and residential rebuild. The inspection time delays led in part to time delays in insurance
claims being filed and settled. Time delayed insurance claims affected cash flow for some
organisations. The health of building suppliers sector, while affecting the commercial rebuild, was itself
affected by the health of Christchurch CBD and residential rebuild. Building suppliers were also
affected by the global financial crisis which affected their customers in the agricultural sector. Health of
building suppliers also affected health of trucking sector.

Key elements of sectoral recovery and resilience after the Canterbury earthquakes: A system dynamics approach
Hlekiwe Kachali
291
Figure 8-5:
Causal loop
diagram for the
response phase
for Christchurch
CBD, Kaiapoi
Town Centre,
Lyttelton Town
Centre,
hospitality,
building
suppliers and
information and
communication
technology
Health of
Christchurch
CBD
Health ofBuildingSuppliers
Sector
Health of
Hospitality
Sector
Health of
ICT Sector
consumer
discretionary
spending
customer/revenue base
outside Canterbury region or
New Zealand
Health of
Tourism
Sector
Health ofCritical
InfrastructureSector
globalfinancial
crisis
buildinginspection
building
demolition
skilled
labour
commercial
rebuild
-
+
+
+
+
-
+
suburban
sprawl/shopping malls
-
- ++
-
Health of
Trucking
Sector
Health of
Kaiapoi Town
Centre
-
Health of Lyttelton
Town Centre
+
health of
economy
++
land use planning
decisions
insurance
+
cashflow
Christchurch
City Council
residential rebuild
project manager
residential
rebuild
-
+
+
Agricultural
sector
+
-
+
+
+
Health ofArts andCraftsSector
+
+
+
building
code
revision
-
-
R 1
+
+
R 2
-
+
+
+
+
+
++
++
++
R 3
Health ofFast
MovingConsumer
GoodsSector
+
+
+
re pair,re build
and ne wbuild

292 System dynamics of sectoral and organisational recovery
Loop R1 in Figure 8-5 is that of health of Christchurch CBD, health of building suppliers sector and
commercial rebuild. The significant number of damaged buildings in the CBD meant that there was
a substantial amount of building supplies required for rebuild and repair. However, the specifics
of the repair and rebuild were not known and this affected stock forecasting for building
suppliers. This then affected some parts of the commercial rebuild as building suppliers did not
always have the right supplies at the right time. A time delay in commercial rebuild then led to time
delays in repairing the parts of the CBD that could be repaired and influenced the health of
Christchurch CBD.
Loop R2 of Figure 8-5 shows how the health of Lyttelton Town Centre interacts with health of arts and
crafts sector and with health of tourism sector. The closure of the Christchurch CBD led to a drop in
tourist numbers to the greater Christchurch region. This contributed to lower tourist numbers in
Lyttelton also. Fewer tourists, in turn, affected not only hospitality but also the arts and crafts
sector which Lyttelton claims to be the heart of. One solution to break this loop was the use of
alternative ways of reaching arts and crafts customers, for example by using the Lyttelton
Farmers’ Market. Additionally, the promotion of more of the tourist attractions outside the
Christchurch CBD could be used to draw in tourists.
Loop R3 was discussed in section 8.1.2.
8.2 Sectoral short-term recovery phase
From Figure 8-6, it can be seen that some of the effects from the response phase continued into
the short-term recovery phase. Indeed, the effects of other interactions also manifested in this
later phase. In the causal loop diagrams for the short-term recovery phase, the interactions
shown are those that are the most significant for the focal sectors. This means that in some
cases, some sectors are not affecting any other focal sector or are not affected by another focal
sector.
8.2.1 Overview of inter-sectoral effects
Figure 8-6 is related to Figure 8-2 and represents the short-term recovery phase. In the short-
term recovery phase different parts of infrastructure were gradually re-opened. Organisations

Key elements of sectoral recovery and resilience after the Canterbury earthquakes: A system dynamics approach
Hlekiwe Kachali
293
made tentative plans for how operations would proceed while they continually adjusted
themselves to the post-disaster environment. The feedback loops from Figure 8-2 are no longer
present in Figure 8-6.
As in the response phase, illustrated in Figure 8-2, in the short-term recovery phase the
hospitality organisations within the Red Zone were still affected by the inability to access their
premises while those outside the Red Zone were affected by decreased foot traffic. The health of
building suppliers sector was influenced by damage to critical infrastructure as they sought to bring
in building supplies. Health of building suppliers sector was also still influenced by health of Christchurch
CBD as the major part the rebuild had not started. At the same time, the building suppliers were
trying to keep up with demand for specific materials needed by the critical infrastructure sector.
The state of the roads affected trucking organisations that were also affected by the delay in start
of rebuilding and by the volume of waste generated from the Christchurch CBD.
The health of ICT sector was affected by an increase in demand for spare parts and for professional
services required by the critical infrastructure sector. In the short-term recovery phase, both
health of Kaiapoi Town Centre and health of Lyttelton Town Centre were affected by closure of some
roads as well as repair of others. Organisations from the two town centres reported that the
closure or repair of roads made it difficult to get around and for their customers to reach them.
Road closure in Lyttelton affected health of trucking sector.

294 System dynamics of sectoral and organisational recovery
Figure 8-6: Overview of intersectoral effects in the short-term recovery phase after the Canterbury earthquakes
In the high level sectoral interactions in Figure 8-6, the FMCG sector is not present. This is
because they reported that the major causes of disruption to their operations, as shown in
Figure 8-2, were significantly reduced. Also of note, in looking at the interactions between the
focal sectors only in the short-term recovery phase, there are no effects to the Christchurch
CBD partly because it was cordoned off. Also trucking does not (adversely) affect any other
sector although it is affected.
8.2.2 Trucking, critical infrastructure, Christchurch CBD and FMCG
Figure 8-7 is the short-term recovery phase associated with the response shown in Figures 8-3
and 8-4. These interactions involve health of trucking sector, health of critical infrastructure sector, health of
Health ofInformation andCommunication
Technology Sector
Health ofBuildingSuppliers
Sector
Health ofHospitality
SectorHealth ofTruckingSector
Health of
Critical
Infrastructure
Sector
Health ofKaiapoiTownCentre
Health ofChristchurch
CBD
Health ofLyttelton Town
Centre
+
+
+
+
+
+
Continueddemand forgoods andservices
required forrepair and
remediation
+
Road closure
+
State of roadsand ongoing
repair
+
Major partsof
infrastructurelocated in
CBD
+
Volume ofdemolition anddisaster waste
Traffic capacity,infrastructurewear and tear,
continueddemand forgoods and
services requiredfor repair andremediation
Tafficmanagement,state of theroads andincreased
maintenancecosts as a
result
Major part ofrebuild not started
Uncertainty ofcommencingrebuild - noconstructionmaterial totransport
+
Access topremises,
decreased foottraffic
Evans
Pass/Sumner Road
Closure

Key elements of sectoral recovery and resilience after the Canterbury earthquakes: A system dynamics approach
Hlekiwe Kachali
295
Christchurch CBD and health of fast moving consumer goods sector. Also shown are the continued
interactions involving the regional (ECan) and local councils (CCC and others). In the short-
term recovery phase, there is also the addition of the Central City Development Unit (CCDU).
In 2012, the Canterbury Earthquake Recovery Authority (CERA) formed CCDU and appointed
them to lead the recovery and rebuild of the Christchurch CBD.
In the short-term recovery phase, repair to damaged infrastructure and reconstruction of some
of the needed infrastructure was underway. However, land use planning decisions continued to affect
health of critical infrastructure sector, health of fast moving consumer goods sector, health of Christchurch CBD as
well as ECan and other local councils. The continued environmental time delay on release of
land use planning information was more pronounced in this phase. The delayed geotechnical
assessments and information on which land use planning was based were an important part of
the land-zoning issue that would inform what the future population profile of Christchurch
would look like. This was mainly because of the effect to the long-term strategic plans of a lot of
sectors such as the town centres, FMCG and critical infrastructure. Critical infrastructure
organisations were faced with repair to massive parts of their infrastructure and also had to
factor in repairs to infrastructure in areas that could be uninhabited in as little as nine months to
two years. Not knowing which areas would be subsequently settled meant that network
expansion planning was made more difficult.
ECan were also affected by land use planning decisions. This possibly had a bearing on the
renewal of services contracted from the critical infrastructure sector. At the same time damage
to infrastructure such as roads continued to affect the trucking sector who reported that they
faced increased costs from more frequent maintenance and from more time spent on the road
due to reduced road capacity and increased traffic.
Health of critical infrastructure was still affected by both availability of spare parts and skilled labour.
Critical infrastructure organisations still reported not having enough skilled labour to carry out
repair and remediation work44. They also stated that it was not always easy to acquire inputs
needed for repairs. For the Health of trucking sector, the restricted use of critical infrastructure
44 As at July 2012, there were reports in the media of an increase in advertised jobs for the greater Christchurch region. Also,
Immigration New Zealand had created a special visa category for skills required in the earthquake recovery.

296 System dynamics of sectoral and organisational recovery
continued into the medium-term recovery period. This meant a continued adjustment to
trucking schedules as well as incremental costs.
Loop R1 is that of health of Christchurch CBD and Christchurch City Council (CCC). In the short-term
recovery phase, it became clearer how much monetary loss CCC would bear from loss of rates
and taxes from the non-functioning CBD. This is in addition to reduced critical infrastructure
revenue. This influenced funding from CCC towards the rebuild of the CBD which contributes
to health of the Christchurch CBD. Loop R1 can be broken by the (gradual) re-opening and use
of the Christchurch CBD.
Figure 8-7: Causal loop diagram (CLD) of the short-term recovery phase for trucking, critical infrastructure,
Christchurch CBD and fast moving consumer goods
8.2.3 Christchurch CBD, Kaiapoi Town Centre, Lyttelton Town Centre, hospitality,
building suppliers and ICT
Figure 8-8 shows the short-term recovery phase system and environment of Figure 8-5. Two of
the three loops from the response phase are still present. Insurance was still a problem in this
phase. Apart from settlement of insurance policies, there was also a problem with the availability
Health of
Trucking
Sector
Health of
Critical
Infrastructure
Sector
Health of FastMoving
ConsumerGoods Sector
land useplanningdecisions
+
availability of
spare parts+
Christchurch
City Council
ECan/Other
local
councils
+
+
+
Health ofChristchurch
CBD
+
+
job loss,
re location
contractre vie w or
re ne wal withse rvice
provide rs
condition ofinfrastructure ,
ve hiclemainte nance
costs
skilled
labour
re ve nue
fundingCCDU
+
+
+
+
++
R 1
Key elements of sectoral recovery and resilience after the Canterbury earthquakes: A system dynamics approach
Hlekiwe Kachali
297
and affordability of insurance. Insurance still affected cash flow for organisations. Furthermore,
the effects of skilled labour to building inspection, residential rebuild, land use planning decisions and
commercial rebuild were still being felt.
Land use planning decisions influenced residential rebuild. Post-earthquake, the land in greater
Christchurch was assessed and categorised depending on soil vulnerability to earthquakes. This
meant that residential rebuild and repair work was dependent on this information being available.
This continued to affect health of building suppliers sector. Figure 8-8 also contains the interaction
between building code revision and the commercial rebuild and repair. Some parts of the building code
were revised post-earthquake. The code stipulated that buildings be built or retrofitted to greater
seismic strength. This effect on commercial rebuild affected health of Christchurch CBD. Another link
is between building code revision and health of building suppliers sector. Changing building codes might
require the stocking of new building materials and the re-training of qualified tradespeople and
others who work in the construction sector.
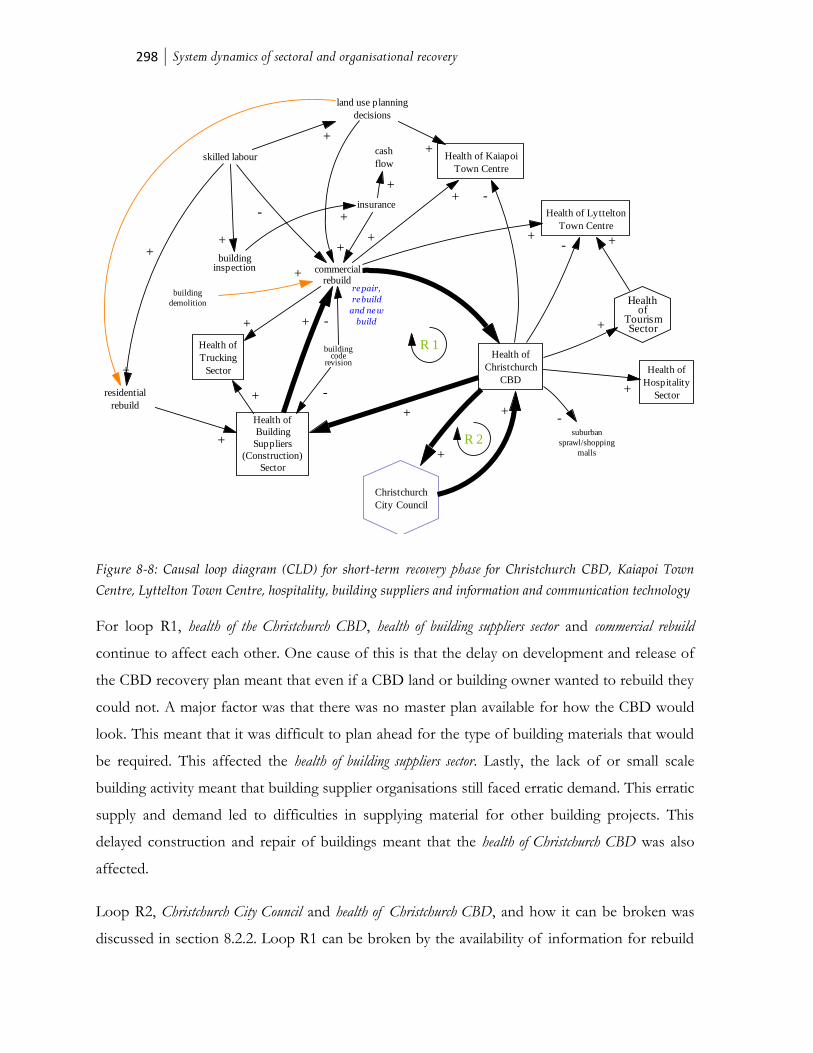
298 System dynamics of sectoral and organisational recovery
Figure 8-8: Causal loop diagram (CLD) for short-term recovery phase for Christchurch CBD, Kaiapoi Town
Centre, Lyttelton Town Centre, hospitality, building suppliers and information and communication technology
For loop R1, health of the Christchurch CBD, health of building suppliers sector and commercial rebuild
continue to affect each other. One cause of this is that the delay on development and release of
the CBD recovery plan meant that even if a CBD land or building owner wanted to rebuild they
could not. A major factor was that there was no master plan available for how the CBD would
look. This meant that it was difficult to plan ahead for the type of building materials that would
be required. This affected the health of building suppliers sector. Lastly, the lack of or small scale
building activity meant that building supplier organisations still faced erratic demand. This erratic
supply and demand led to difficulties in supplying material for other building projects. This
delayed construction and repair of buildings meant that the health of Christchurch CBD was also
affected.
Loop R2, Christchurch City Council and health of Christchurch CBD, and how it can be broken was
discussed in section 8.2.2. Loop R1 can be broken by the availability of information for rebuild
Health of
Christchurch
CBD
Health of
Building
Suppliers
(Construction)
Sector
Health of
Hospitality
Sector
Healthof
TourismSector
buildinginspection
building
demolition
skilled labour
commercialrebuild
+
suburban
sprawl/shopping
malls
-
+
-
Health of
Trucking
Sector
Health of Kaiapoi
Town Centre
-
Health of Lyttelton
Town Centre
land use planning
decisions
insurance
+
cash
flow
Christchurch
City Council
residential
rebuild
++
+
+
+
+
buildingcode
revision
-
-
R 1
+-+
+
+
+
+
+
+
+
+
+
+ +
R 2
re pair,
re build
and ne w
build

Key elements of sectoral recovery and resilience after the Canterbury earthquakes: A system dynamics approach
Hlekiwe Kachali
299
of the CBD. Information on what would be rebuilt or repaired, when this would happen, what
materials would be required and in what quantity. This would help building suppliers to forecast
and positively affect the health of the sector.
Noticeably, Figure 8-8 still has positive (reinforcing) feedback loops R1 and R2. Both R1 and R2
have health of Christchurch CBD as a variable. In the short-term recovery phase, some of the
issues surrounding repair and rebuild of the Christchurch CBD were still unresolved. This is
further illustration of the time extended nature that recovery can take.
8.3 Modelling organisational recovery
Figure 8-9 shows the generalised stock and flow depicting the main interactions that affected
response for individual organisations in Canterbury. Figure 8-9 also shows the main stocks and
flows that were identified for organisational recovery in the response phase. Importantly, the
value of this and other stock and flow models is in uncovering the patterns of behaviour of the
system. This information can be used to identify important elements that affect recovery and in
some cases points of intervention to effect recovery. As mentioned previously, for the purposes
of this thesis, stocks will sometimes be referred to as levels. Levels contain information about
the state or health of the system at any given time. In Figure 8-9, which has greater resolution at
the organisational level, both reinforcing and balancing feedback loops are present.
Analysis of Figure 8-9 shows that the main levels in the recovery of organisations are related to
their three main sources of vulnerability discussed in chapter 7: health of the organisation
(organisational attributes), available built environment (infrastructure they use to deliver goods and
services) and health of the economy (environmental factors). The health of the organisation is related to
the volume of customer or product orders converted into the flow throughput. Contributing to
throughput is customer or product orders and is the number of orders the organisation gets and can
fulfill.
The other flow into health of the organisation is the outshipment of products. Outshipment is dependent
on product sales and contributes to environmental factors such as health of the economy through the
inflow growth of the economy. The level health of the economy, through its outflow decline, is also
influenced by uncertainty. Contributing to the uncertainty that may influence economic decline as

300 System dynamics of sectoral and organisational recovery
people spend less, is the recovery leadership calibre. The recovery leadership calibre has a bearing on the
greater Christchurch recovery plan which all sectoral and organisational recovery plans should ideally
align with.
Available Built Environment influences the disparity in available and needed accommodation, has the
inflow construction, reconstruction and repair and the outflow building stock deconstruction. The inflow
construction, reconstruction and repair is influenced by the disparity in available and needed
accommodation which is affected by the needed rental or commercial accommodation.
In the stock and flow in Figure 8-9, are both reinforcing (R) and balancing (B) feedback loops.
Loop R1 shows the interactions between the health of the organisation, availability of organisational
reserves and organisational throughput. However, throughput is partly reliant on availability of
organisational reserves and on available labour. Throughput and outshipment of goods and services are
inflows for the level health of the organisation. According to interviewed organisations, the pre- and
post-earthquake measures of health of the organisation are usually in terms of sales, revenue and
cash flow. Loop R1 shows that the better the health of the organisation the better the availability of
organisational resources to contribute to throughput. Also the availability of organisational reserves is linked
to the crisis management ability of the organisation and the two form loop R2. Part of the crisis
management and subsequent recovery of an organisation is getting back to their pre-earthquake
levels of throughput (production) or better which requires the prudent use of organisational
reserves.

Key elements of sectoral recovery and resilience after the Canterbury earthquakes: A system dynamics approach
Hlekiwe Kachali
301
Figure 8-9:
Stock and
flow
diagram of
organisatio
nal
recovery in
the
response
phase after
the
Canterbury
earthquakes
Health of the
Organisation
Health of the
Economy
Available Built
Environment
expertinformation/advice
seismic activity
uncertainty
available (capacityof) infrastructure
use of infrastructure orconsumption of
services
available labour
growth decline
insurancepayouts
+
resourceavailability
+
greater Christchurchrecovery plan
+
-
heavy, earthmoving specialised machinery
-
availability oforganisational
reserves
needed rental orcommercial
accommodation
uncertainty abouteconomic,
financial, social,infrastructure,
skills, rebuild plans
construction,reconstruction and
repair
building stockdeconstruction
-
throughput
raw materialavailability
+
+
recoveryleadership calibre
+
-
availability andaccess to
information
++
revised buildingcode
-
regulations e.g. driver licensing
customers
+
-
+
-
-
customer orproduct orders
+
crisis managementability
crisis
networking
organisationalleadership calibre
investment instaff
organisationalresilience
-
+
+
+
+
+
+
+
outshipment
+
+
disparity in availableand needed
+
+ -
R 1
B 1
B 2
B 3
+
-
++
+
+
+R 2
product sales
+

302 System dynamics of sectoral and organisational recovery
Loop B1 also involves resources, the available (capacity of) infrastructure after the earthquakes.
Customers and use of infrastructure or consumption of services complete this loop. The available (capacity of)
infrastructure is further affected by seismic activity. Seismic activity also influences the customers of loop
B1. Loops B2 and B3 are both linked to the level available built environment. Available built
environment influences available (capacity of) infrastructure. Loop B2 of Figure 8-9 shows the
relationship between available built environment and its inflow construction, reconstruction and repair. The
level of available built environment affects the disparity in available and needed accommodation which
influences the inflow construction, reconstruction and repair. However, the rate of construction,
reconstruction and repair is affected by the revised building code. Loop B3 shows the relationship of the
available built environment and its outflow building stock deconstruction. In the response phase, this
outflow is affected by resource availability.
Figure 8-10 shows the systemic interactions in the short-term recovery phase for organisational
recovery. Seismic activity persisted into the short-term recovery phase and still affected
customers, available (capacity of) infrastructure and insurance. It also affected crisis management ability
through crisis. The delay in insurance carries on into this period and influences availability of
organisational reserves as more are used up. Insurance also affects uncertainty which contributes to the
health of the economy outflow decline. Continued seismic activity also affected revised building code which
affected construction, reconstruction and repair.
Unsurprisingly, loops R1, R2 and B1 from the response phase still exist in this later phase. For
loop R1, organisations that reported the strain on the availability of organisational reserves as they
continued to deal with crisis. Availabilty of organisational reserves were used up through increased
costs associated with repair, relocation or payment of overtime wages. Some organisations
reported diverting resources meant for expansion to manage the crisis caused by the
earthquakes.
In the short-term recovery phase, crisis management ability was still as important as in the response
phase. Organisations reported that the type of leadership required in the short-term recovery
phase is consultative as opposed to slightly autocratic in the earlier phase. Also, investment in staff
made crisis management ability even more pronounced. Staff fatigue resulted from the ongoing
earthquakes. This shows that management of staff and their personal situations is important.

Key elements of sectoral recovery and resilience after the Canterbury earthquakes: A system dynamics approach
Hlekiwe Kachali
303
Figure 8-10:
Stock and flow
diagram of
organisational
recovery in the
short-term
recovery phase
after the
Canterbury
earthquakes
Health of the
Organisation
Health of the
Economy
Available Built
Environment
seismic
activity
uncertainty
available (capacity of)
infrastructure
use of
infrastructure
or consumption
of servicesavailablelabour
growth decline
insurancepayouts
+
+
greater
Christchurch
recovery plan
+ -
availability oforganisational
reserves
construction,
reconstruction
and repair
throughput
raw material
availability
+
+
recovery
leadership
calibre
+
-
availability and
access to
information+
revisedbuildingcode
-
customers
+
-
+
-
-
customer or
product orders
+
crisis management
ability
crisis
networking
organisational
leadership calibre
investment instaff
organisational
disaster resilience
-
+
+
+
+
+
+
+
outshipment
+
+
R 1
B 1
+
+
+++
+
R 2+
product
sales
+
-

304 System dynamics of sectoral and organisational recovery
Loop B1 persisted partly as a result of the ongoing seismic activity which sometimes made the
repair or restoration of infrastructure difficult. This affects available (capacity of) infrastructure. One
way of counterbalancing loop B1 is by acting to maintain the condition of assets in the face of
ongoing seismic activity. In addition, the other influcnce on available (capacity of) infrastructure, the
use of infrastructure or consumption of services, also needs to be worked on in parallel. However, critical
infrastructure medium- to longer-term planning is still affected by customers as the decisions on
land use had not been finalised 18 months after the earthquakes.
8.4 System behaviour influencing recovery
As described earlier, the structure of the system is very closely related to its behaviour. From
descriptions of the system in sections 8.1 to 8.3, it is possible to abstract the system behaviour
that influences the recovery of sectors and organisations. In the response phase after the
earthquakes, there was a great deal of perturbation as organisations tried to understand how they
had been affected and what the situation was. It was in this phase also that the initial assessment
of buildings and infrastructure was done and repair work started. In the short-term recovery
phase, many things were still uncertain; there were continuing delays and mismatches in needs
and requirements. This was in addition to the ongoing earthquakes whose effects also had to be
dealt with.
The system behaviours identified as affecting recovery after the Canterbury earthquakes and
detailed below are:
interactions between system elements;
environmental time delays;
mismatches;
uncertainty;
hierarchy and self-organisation; and
resilience.
These specific system attributes are intertwined even if they are presented separately. They will
also be discussed in chapter 9 in the context of aids, hindrances and points of intervention in
recovery.
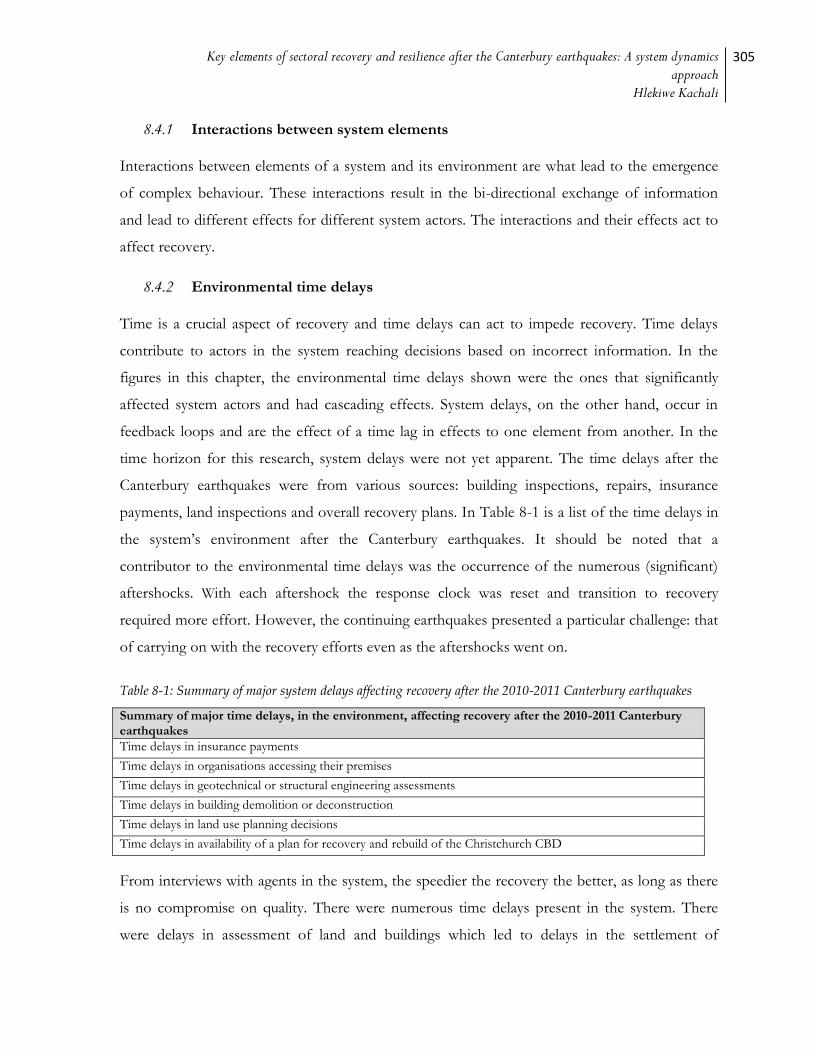
Key elements of sectoral recovery and resilience after the Canterbury earthquakes: A system dynamics approach
Hlekiwe Kachali
305
8.4.1 Interactions between system elements
Interactions between elements of a system and its environment are what lead to the emergence
of complex behaviour. These interactions result in the bi-directional exchange of information
and lead to different effects for different system actors. The interactions and their effects act to
affect recovery.
8.4.2 Environmental time delays
Time is a crucial aspect of recovery and time delays can act to impede recovery. Time delays
contribute to actors in the system reaching decisions based on incorrect information. In the
figures in this chapter, the environmental time delays shown were the ones that significantly
affected system actors and had cascading effects. System delays, on the other hand, occur in
feedback loops and are the effect of a time lag in effects to one element from another. In the
time horizon for this research, system delays were not yet apparent. The time delays after the
Canterbury earthquakes were from various sources: building inspections, repairs, insurance
payments, land inspections and overall recovery plans. In Table 8-1 is a list of the time delays in
the system’s environment after the Canterbury earthquakes. It should be noted that a
contributor to the environmental time delays was the occurrence of the numerous (significant)
aftershocks. With each aftershock the response clock was reset and transition to recovery
required more effort. However, the continuing earthquakes presented a particular challenge: that
of carrying on with the recovery efforts even as the aftershocks went on.
Table 8-1: Summary of major system delays affecting recovery after the 2010-2011 Canterbury earthquakes
Summary of major time delays, in the environment, affecting recovery after the 2010-2011 Canterbury earthquakes
Time delays in insurance payments
Time delays in organisations accessing their premises
Time delays in geotechnical or structural engineering assessments
Time delays in building demolition or deconstruction
Time delays in land use planning decisions
Time delays in availability of a plan for recovery and rebuild of the Christchurch CBD
From interviews with agents in the system, the speedier the recovery the better, as long as there
is no compromise on quality. There were numerous time delays present in the system. There
were delays in assessment of land and buildings which led to delays in the settlement of
306 System dynamics of sectoral and organisational recovery
insurance claims as the assessment information was required for insurance claims. Time delays in
building assessments led to time delays in organisations accessing their premises and retrieving
important organisational records or equipment.
However, some of the time delayed settlement of insurance claims happened even after
assessment and reporting of building and land damage had been done. In some cases, this led to
time delays in building demolition work. The longer it takes for a building to be demolished and
the debris removed from a site, the longer it takes to start construction on that site or repair of
nearby buildings. This affects other organisations in the system that might not be able to access
their premises for instance. For some organisations, time delays in insurance settlements affected
the organisation’s cash flow or other resource reserves. Also, time delays in land use planning
contributed to the difficulty some organisations had in making long-term strategic plans.
The time delay in insurance payments led to consequences including time delays in building
demolition, inability to relocate for some organisations and the inability to effect repairs to
damaged premises. Another related time delay was in insurance loss adjustors sending
information back to affected organisations after assessment. This affected the organisations’
knowledge of what the insurance company would pay out for after policy review.
Additionally, there were time delays in getting geotechnical and structural engineering experts to
inspect land and buildings respectively. Part of the time delay was caused by there not being
enough experts to carry out assessments in a timely manner as well as the delay in receipt of
technical reports after the assessment was completed. This particular time delay was the
equivalent of organisations competing for the same (scarce) resources to aid their recovery. As
shown earlier, resource availability is vital for the recovery of an organisation after disaster. The
engineering assessment of buildings and land is carried out for several reasons; having land and
buildings inspected means that organisations know the extent of damage and what measures
need to be taken such as repair or relocation. In Christchurch if the land or building was deemed
irreparable, this was part of proof required by the insurance company. Another source of delay
in reconstruction and repair was the non-availability of construction works insurance after the 22
February 2011 earthquake. This was mainly because of the ongoing aftershock sequence and
insurance companies re-analysing and re-assessing risks. The system dynamics analysis in chapter
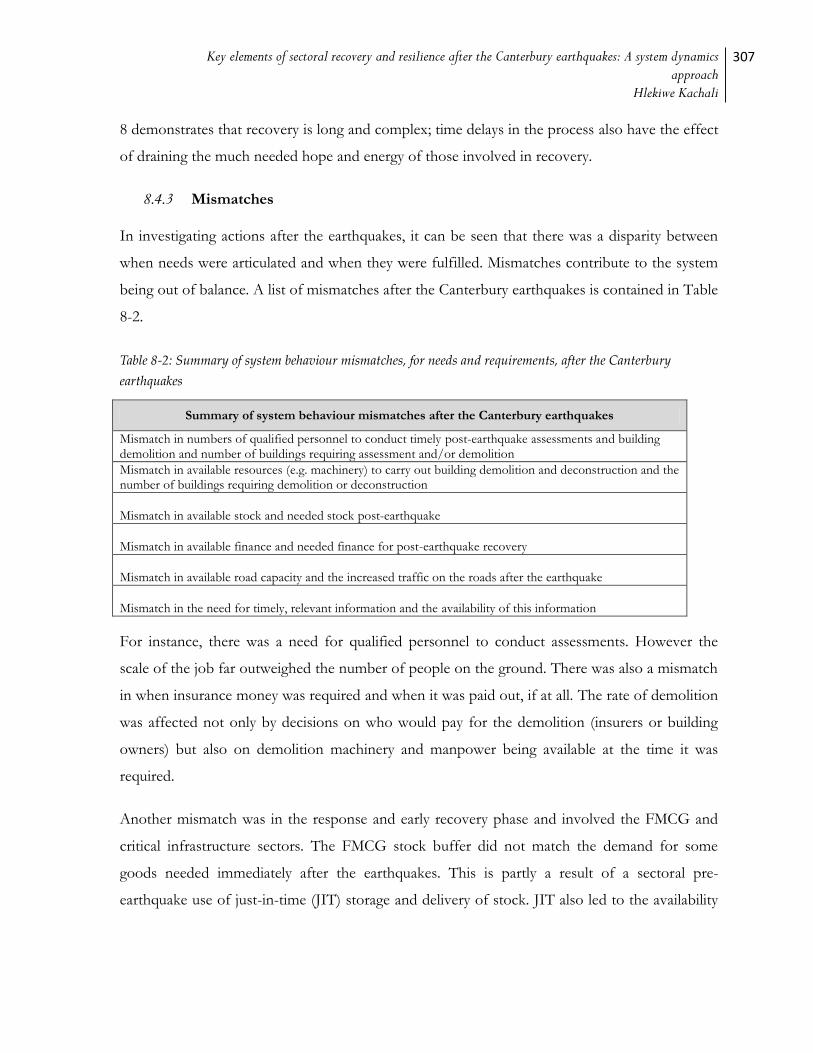
Key elements of sectoral recovery and resilience after the Canterbury earthquakes: A system dynamics approach
Hlekiwe Kachali
307
8 demonstrates that recovery is long and complex; time delays in the process also have the effect
of draining the much needed hope and energy of those involved in recovery.
8.4.3 Mismatches
In investigating actions after the earthquakes, it can be seen that there was a disparity between
when needs were articulated and when they were fulfilled. Mismatches contribute to the system
being out of balance. A list of mismatches after the Canterbury earthquakes is contained in Table
8-2.
Table 8-2: Summary of system behaviour mismatches, for needs and requirements, after the Canterbury
earthquakes
Summary of system behaviour mismatches after the Canterbury earthquakes
Mismatch in numbers of qualified personnel to conduct timely post-earthquake assessments and building demolition and number of buildings requiring assessment and/or demolition
Mismatch in available resources (e.g. machinery) to carry out building demolition and deconstruction and the number of buildings requiring demolition or deconstruction
Mismatch in available stock and needed stock post-earthquake
Mismatch in available finance and needed finance for post-earthquake recovery
Mismatch in available road capacity and the increased traffic on the roads after the earthquake
Mismatch in the need for timely, relevant information and the availability of this information
For instance, there was a need for qualified personnel to conduct assessments. However the
scale of the job far outweighed the number of people on the ground. There was also a mismatch
in when insurance money was required and when it was paid out, if at all. The rate of demolition
was affected not only by decisions on who would pay for the demolition (insurers or building
owners) but also on demolition machinery and manpower being available at the time it was
required.
Another mismatch was in the response and early recovery phase and involved the FMCG and
critical infrastructure sectors. The FMCG stock buffer did not match the demand for some
goods needed immediately after the earthquakes. This is partly a result of a sectoral pre-
earthquake use of just-in-time (JIT) storage and delivery of stock. JIT also led to the availability
308 System dynamics of sectoral and organisational recovery
of spare parts not matching the number of repairs to be carried out by the critical infrastructure
sector.
Damage to and closure of the Lyttelton Port, the Lyttelton Road Tunnel and the Evans
Pass/Sumner Road were a problem mainly for trucking and building supply organisations. At
the time they had a great need for infrastructure, there was a restricted use of this infrastructure.
Additionally, there was an increase in the number of trucking organisations after the
earthquakes. This raised another discrepancy: that of the region’s carrying capacity and the long-
term viability of the sector. The idea of carrying capacity can also be applied to the number of
skilled tradespeople required in the Canterbury area for the rebuild. If the rebuild were to take
place at the same time in different parts of the greater Christchurch region, availability of labour
would be just one of the problems. Another concern would be where to house the labourers
who would come in from out of town (as was part of the plan by recovery authorities) and what
the social implications of so many (mostly) men would be. All these are mismatches.
Other disparities were visible in the system. The recovery of Lyttelton Town Centre affected the
recovery of the arts and crafts sector. Arts and crafts were affected by lower tourist numbers.
However if tourists were to be encouraged to come to the greater Christchurch region,
accommodation hospitality organisations would need to increase the number of guests they
could host (the hospitality sector reported the loss of 70 – 80% of beds after the 22 February
2011 earthquake).
There were also mismatches in the need for and availability of information and communication.
This is related to section 8.4.5. The uncertainty about what the CBD would look like or when it
would be functional again caused affected organisations to make plans that involved not
returning to the CBD in the medium-term. As well, information in the form of revised building
codes should be in step with construction and training. Such a mismatch may lead to delays in
starting construction work and could also lead to work not carried out competently due to newer
requirements.
8.4.4 Uncertainty
There was a lot of uncertainty surrounding many aspects of recovery after the Canterbury
earthquakes. In a disaster situation, it is expected that there will be uncertainty and that some of

Key elements of sectoral recovery and resilience after the Canterbury earthquakes: A system dynamics approach
Hlekiwe Kachali
309
this uncertainty is caused by the lack of information. However, it is imperative that ways of
minimising post-disaster uncertainty should be determined. Uncertainty contributes to lack of
system clarity and cohesion.
As with the delays, there were multiple causes of uncertainty. There was uncertainty about the
overall recovery plan as well as how it would be financed and implemented. This was significant
as it could affect organisational strategic decision making, most especially for organisations that
were in the CBD. This plan was also important for any would be investors in the greater
Christchurch economy.
Consequently, there was also uncertainty because of lack of information. Some actions to
counter this uncertainty include articulation of the recovery plan, especially regarding finance
and implementation. In the absence of concrete and detailed plans, information on where the
planning process had got to and possibly how long it would take to craft the plan would have
been beneficial to organisations and sectors.
Another factor that contributed to uncertainty was lack of detail in the original CBD recovery
plan. Some anchor projects were planned for (e.g. the new Town Hall) but their precise locations
in the CBD had not been decided. This had the effect that landowners did not know if their land
would be part of an anchor project. Additionally, any other buildings to be erected in the CBD
had to be placed in context of these anchor projects.
8.4.5 Hierarchy and self-organisation
The system exhibited self-organisation in reaction to the disruption brought about by the
earthquakes. Self-organisation was possible because the system is made up of smaller units, in
this case the organisation and then the industry sector. This is an example of the hierarchy of
systems; the intermediate level connecting the greater economy to the organisation is the sector.
For instance some ICT organisations acted to stabilise demand and supply difficulties by
negotiating with customers modified delivery schedules as they worked to restart production and
catch-up on lost productivity. The organisations said this worked due to having a good supplier-
customer relationship established prior to the earthquakes. In other cases, competing
organisations collaborated by sharing workspace and equipment.
310 System dynamics of sectoral and organisational recovery
From the actions taken by organisations and sectors to effect recovery after the earthquakes, it is
clear that the system’s tendency to self-organisation is a result of its capacity to learn, diversify
and evolve. The complexity of the Canterbury system also made self-organisation possible. From
the interview data, it seems that self-organisation was also brought about (made possible)
because of the instability caused by the earthquakes. In the absence of the order organisations
and sectors were accustomed to, there was a need to be creative and innovative in order to
survive and recover. Carpenter et al (2001) emphasise that a resilient system need not be stable
in the traditional sense of not changing and Perrings (1998) writes that system actors may
actually desire system states that are not sustainable.
8.4.6 Resilience
In this thesis, the definition of recovery, which can be extended to the overall system, is when an
organisation or sector can function and sustain itself (continually) in its new post-disaster environment while
resilience is defined as the ability to survive crisis and thrive in a world of uncertainty (Seville et al., 2008).
Resilience is an emergent property of the system, enables system survival and contributes to the
achievement of system goals even when the system is faced with challenges. Also, it can be
concluded that resilience and recovery are context dependent, as was shown with the differing
definitions of recovery and resilience in chapter 2. Additionally, every system is defined for a
purpose and is bounded by its environment (D. H. Meadows & Wright, 2008). The environment
being the context within which the system operates. Furthermore, the resilience and recovery of
a system should be managed to achieve the system’s purpose. As such, in the context of the
Canterbury earthquakes, the articulation of what recovery would look like was important (see
sections 9.2.2 and 9.2.3) in shaping organisational and sectoral plans for recovery.
The changing dominance and existence of the feedbacks loops is a major contributor to the
resilience of the system. From analysis of the model of the greater Christchurch system after the
earthquakes, it can be seen that different feedback loops in the system were dominant at
different times. For instance, some feedback loops that were in the response phase did not
manifest in the short-term recovery phase.
Prior to the Canterbury earthquakes, the resilience of the system or parts of it may not have
been immediately evident or even measurable. However, the perturbation resulting from the
earthquakes, where the system’s bounds were tested but not broken demonstrates that the

Key elements of sectoral recovery and resilience after the Canterbury earthquakes: A system dynamics approach
Hlekiwe Kachali
311
system is resilient. Table 8-2 contains interrelated aspects that contributed to organisational and
sectoral resilience after the 2010-2011 Canterbury earthquakes. Some of these aspects include
adaptation, diversity and self-organisation. Apart from the aspect changing dominance of
feedback loops in Table 8-3, the rest of the aspects that contributed to overall system resilience
are comparable to the characteristics of organisational resilience described by organisations in
section 6.5.4. For instance, the ability of organisations to adapt to post-earthquake
circumstances by working from alternative premises contributed to their resilience. The
possibility for organisations to relocate in this way was partly attributable to the localisation of
physical damage caused by the earthquakes as well as the quick restoration or non-interruption
of utilities. This is also to do with system hierarchy. In thinking of Canterbury as one part of a
larger system, Canterbury could still access resources from other parts of the system that are
outside the region.
For some organisations and sectors, diversity of location, customer base and goods and services
contributed to their resilience. However, for organisations with geographically spread customers,
this was dependent on the organisations’ ability to produce goods and services and to get these
goods and services to their customers. For example, some organisations from the ICT sector
that deliver their services online said they were still able to deliver goods and services to
customers. An aspect of resilience that aided this was the organisations being able to
communicate with their customers and inform them of the organisation’s post-earthquake
status. Information and communication being some of the ways in which uncertainty can be
managed. Managing uncertainty, communicating with customers and restarting operations after
the earthquakes all require leadership and self-organisation.

312 System dynamics of sectoral and organisational recovery
Table 8-3: Aspects contributing positively to system resilience after the 2010 - 2011 Canterbury earthquakes
Aspects contributing to system resilience after the 2010 - 2011 Canterbury earthquakes
System aspects Details
Localisation of earthquake damage Differing degrees of damage to different parts of the greater Christchurch area
Changing dominance of feedback loops Different loops dominant at different stages giving rise to changing system behaviour over time
Adaptation Of people, relocation, adjusting mode of delivery of goods and services
Diversity Of people, location, customers, goods and services
Bi-directional information flow between system agents System agents give and receive information
Leadership and self-organisation Leadership within sectors, and self-organisation in the form of partnerships
Hierarchy For instance individual organisations making up sectors
Managing uncertainty (to certain extents) For organisations, ensuring staff not made redundant
Recognition of complexity of recovery task and involvement of multiple stakeholders
Recovery agencies, organisations, community, local authorities
Recognition of limiting factors in recovery Some limiting factors are finance, personnel, machinery
Conversely, there were aspects that when not managed properly led to a decline in resilience for
organisations and sectors. One of these is the lack of relevant information and communication
from recovery authorities as to when certain buildings could be accessed. Another aspect
contributing negatively to organisational and sectoral resilience was the shortage of necessary
skills that contributed to organisations being able to resume operations. Some of these include
engineering skills for land and building assessment. As discussed in other parts of the thesis,
such shortages had cascading effects.
The specific elements of organisational and sectoral disaster resilience are explored in detail in
chapter 10. Again, the aspects listed in Table 8-3 emerged from the system that was examined.
The systems view enables the identification of the different feedback loops in evidence, their
role in recovery as well as in hazard mitigation and planning.
8.5 Chapter summary
This chapter illustrated, through the use of systems thinking, the interactions between system
elements in the response and short-term recovery phases after the Canterbury earthquakes. In
these two periods after the earthquakes, different feedback loops were dominant leading to
differing system behaviour and effects. This emphasises that the structure of a system, the
linkages between system actors, determines its behaviour. This chapter has shown that the
system is influenced by and influences the environment and that system agents are affected

Key elements of sectoral recovery and resilience after the Canterbury earthquakes: A system dynamics approach
Hlekiwe Kachali
313
directly and indirectly by other agents. The examination of the linkages in the system led to the
identification and explanation of specific system attributes that influenced organisational and
sectoral recovery after the earthquakes in Canterbury. These are:
interactions between system elements;
(system) environmental time delays;
mismatches;
uncertainty;
hierarchy and self-organisation; and
resilience.
After listing the system attributes that contribute to recovery, chapter 9 follows on from this
with information on specific elements that helped or hindered recovery after the earthquakes in
Canterbury. As well, points of leverage that can be used to manage the system for recovery are
pointed out.

314 Aids, hindrances and points of intervention in recovery
9 Aids, hindrances and points of intervention in recovery
In this section, the information from chapters 4 to 8 is brought together and employed to
determine the factors that aid or hinder recovery. In addition, possible points of intervention
that can be used to influence system events are identified. All the aids, hindrances and points of
intervention are shown in Figure 9-1 and described in the sections that follow (using the same
headings). It should be noted that in a system, intervention can lead to positive or negative effects
and unintended consequences. The aids and hindrances to recovery as well as the points of
intervention are presented here individually for clarity, however, they are linked. Also, some of
the aids, hindrances and points of intervention that have been discussed in previous chapters will
not be discussed in detail; they are listed here for completeness.
As can be seen in Figure 9-1, some of the aids to recovery are actions that can be undertaken by
organisations prior to or after a disaster event. As well, the points of intervention in recovery
have been grouped into actions organisations can take; infrastructure relied on for organisational
operations and environmental factors.
It should be noted that the aids, hindrances and points of intervention are not listed in rank
order of importance. First, for different organisations and sectors, the rankings of these elements
differ. What is important for individual organisations and sectors is the recognition of which of
these elements affect them, to what extent, and how they can mitigate this. Second, ranking the
importance of elements in a complex system is not easy because of the interactions between
them that lead to this complexity.
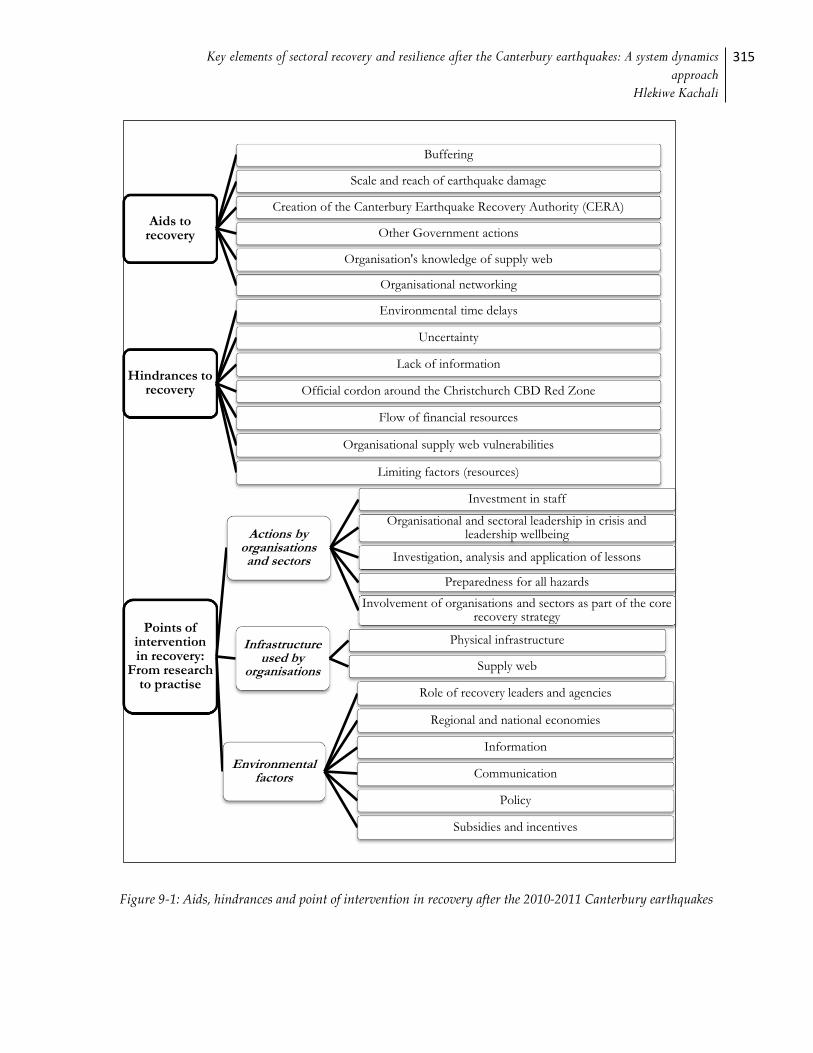
Key elements of sectoral recovery and resilience after the Canterbury earthquakes: A system dynamics approach
Hlekiwe Kachali
315
Figure 9-1: Aids, hindrances and point of intervention in recovery after the 2010-2011 Canterbury earthquakes
Aids to recovery
Buffering
Scale and reach of earthquake damage
Creation of the Canterbury Earthquake Recovery Authority (CERA)
Other Government actions
Organisation's knowledge of supply web
Organisational networking
Hindrances to recovery
Environmental time delays
Uncertainty
Lack of information
Official cordon around the Christchurch CBD Red Zone
Flow of financial resources
Organisational supply web vulnerabilities
Limiting factors (resources)
Points of intervention in recovery:
From research to practise
Actions by organisations and sectors
Investment in staff
Organisational and sectoral leadership in crisis and leadership wellbeing
Investigation, analysis and application of lessons
Preparedness for all hazards
Involvement of organisations and sectors as part of the core recovery strategy
Infrastructure used by
organisations
Physical infrastructure
Supply web
Environmental factors
Role of recovery leaders and agencies
Regional and national economies
Information
Communication
Policy
Subsidies and incentives
316 Aids, hindrances and points of intervention in recovery
9.1 Aids to recovery
9.1.1 Buffering
Buffering here refers to actions or events that shielded organisations and sectors from some of
the effects of the earthquakes, e.g. in giving them more time before they ran out of supplies.
Some organisations and sectors had buffers that assisted in the short-term after the earthquakes.
These buffers took different forms. For all of the sectors, the size of the economy of
Christchurch also acted as a buffer as there was more than one main contributing sector to keep
the Canterbury economy going. Additionally, the localised nature of the Canterbury earthquakes
(discussed in section 9.1.2) made it possible to access available external resources.
The good average annual sales growth for trucking, FMCG and ICT (see chapter 5) helped, i.e.
was a buffer, with cash flow which was necessary after the earthquake to pay for immediate
repairs. FMCG also had small reserves of some stock (helpful in the short-term) both in
warehouses and in the back of the store. These were helpful in meeting short-term demands
when stores re-opened. Some FMCG organisations communicated that they used a just-in-time
(JIT) system for stock delivery and stored little excess goods on their premises. Reasons for this
include the cost of renting more floor space for excess goods and the convenience of having a
distribution centre in Christchurch.
When asked, some critical infrastructure organisations reported having a store of spare parts in
some of their warehouses. However, these spare parts were usually for sections of the network
that in their experience broke down frequently. They did not have many, if any, spare parts for
sections of the network that did not frequently breakdown but that sustained damage in the
earthquakes and required replacement.
After the Canterbury earthquakes, organisations and sectors could plan for an increase in
buffering capacity of major resources. An increased buffering capacity affords organisations time
to re-start operations, where possible, while supply links are restored. The localisation of the
damage in Canterbury meant that organisations could access resources to a certain extent. While
having little excess stock on hand might be economical during business-as-usual, in the event of
a regional disaster, holding more excess stock might prove to be an advantage for the recovery
Key elements of sectoral recovery and resilience after the Canterbury earthquakes: A system dynamics approach
Hlekiwe Kachali
317
of the organisation and the region. The downside of this is the increased storage costs
mentioned and also possible stock damage should a disaster eventuate.
9.1.2 The scale and reach of the earthquake damage
The distribution of the effects of the earthquakes is related to the buffers mentioned in section
9.1.1. The adverse physical damage caused by the earthquakes, to structures, the ground and
infrastructure, was confined to certain parts of the greater Christchurch area. This was a help to
the recovery efforts. For instance, localisation of damage to the Christchurch CBD resulted in
the loss of at least 65% of commercial building stock in the CBD. According to a Christchurch
City Council (CCC) official interviewed, this represented approximately 7-10% of the city’s
overall commercial building stock (Christchurch City Council official, personal communication,
2012). This seemingly low percentage might be because of what was, pre-earthquake, unused
commercial accommodation in Christchurch.
Damage to the Christchurch CBD resulted in the cordoning off of parts of the CBD for more
than 18 months. This localised damage meant that some organisations could relocate to other
parts of greater Christchurch that did not suffer the same level of damage. This is if the
organisations had the means and the possibility to do so. This however raises the question of
how much slack commercial accommodation there was in Christchurch before the earthquakes
and what it was used for.
9.1.3 Creation of the Canterbury Earthquake Recovery Authority (CERA)
The Canterbury Earthquake Recovery Authority (CERA) was created by Central Government to
lead and coordinate recovery efforts for the greater Christchurch area after the 2010-2011
earthquakes. See section 9.6.1. for more detail on CERA as an aid to recovery.
9.1.4 Other Government actions
Apart from the creation of a Recovery Authority, other Government actions such as the
Earthquake Support Subsidy (ESS) and sending cash to Christchurch (electronic sales terminals
were inoperable) were a help. See section 6.8.2 for details.
318 Aids, hindrances and points of intervention in recovery
The ESS acted as a source of funds for organisations, in the short-term after the earthquakes. It
afforded organisations much needed time to analyse how they had been affected by the
earthquakes and what actions to take. Making cash available also enabled much needed trade to
carry on and acted to keep the flow of money going in the economy.
9.1.5 Organisation’s knowledge of supply web
The recovery of the supply web is an integral part of an organisation’s or sector’s recovery. The
supply web enables the delivery of inputs and the shipment of finished product. From the
supply web perspective, there are three main sources of disruption: from the supply side
(suppliers), from the demand side (customers, discretionary, non-discretionary) and from within
the organisation itself. The accounts of supply web disruption from organisations demonstrate
that building redundancy into their supply web was one way that they could have overcome
some of the effects of the earthquakes. For instance, one light manufacturer spoke of having
more than one production line or main warehouse. However, such measures represented
additional oftentimes unjustifiable expenses for organisations. It emerged that a flexible and agile
supply web may have been a better option for instance through product substitution or through
the acquisition of supplies from different vendors as main suppliers worked to come back on
line.
An organisation’s awareness of their position in the supply web, and its characteristics, affects
not only their recovery but also affects organisations that rely on them in different ways.
Inversely, the knowledge of the organisation’s critical suppliers and what might affect them
cannot be overemphasised. This awareness incorporates knowledge of which organisations on
both sides of the web would be most inconvenienced if the focal organisation were disrupted as
well as which of the focal organisation’s supply web partners could most affect them in the case
of a disruption. This knowledge can be used to prioritise customers so as to retain them
especially in long-term recovery.
Some ICT and FMCG organisations spoke of getting in touch with their customers to verify
what the effect of their being unable to deliver would be to these customers. They also worked
out altered delivery schedules in collaboration. The organisations reported that this cooperation
with their customers worked in part because of the trust they had built in the course of their
relationships.
Key elements of sectoral recovery and resilience after the Canterbury earthquakes: A system dynamics approach
Hlekiwe Kachali
319
From interviews, no organisations reported having discussed supply web issues with their supply
partners prior to the earthquakes.
9.1.6 Organisational networking
The organisation’s network means the arrangement of connections, interactions or relationships
that the organisation has with other actors in its system or environment. The interviewed
organisations with more networks (formal and informal) seemed to be doing slightly better in
their recovery efforts than the organisations with fewer networks. These networks were used for
the exchange or pooling of resources and in the response and early recovery periods were vital
for obtaining information. Organisations reported that the usefulness of the information was not
the most important thing in those first few weeks especially after the 22 February 2011
earthquake. That they could get some information was helpful in itself.
Organisations referred to networking as a way of keeping up with information and trends inside
and outside their industry that could aid their recovery. Networking was also used to find what
upcoming work was available in their or connected industry sectors. Informal networks ensured
that they were known to organisations that might require their services which could lead to more
formalised arrangements or as a way to procure or get jobs by word of mouth.
9.2 Hindrances to recovery
There were multiple hindrances to recovery after the earthquakes in Canterbury. As with the aids
to recovery, the hindrances are listed separately but are closely connected.
9.2.1 Delays
Time delays are a crucial aspect of recovery and can act to impede recovery. More details on the
effects of time delays are presented in section 8.4.2.
9.2.2 Uncertainty
After a disaster situation, there will likely be some level of uncertainty. Uncertainty contributes
to lack of system clarity and cohesion. Section 8.4.4 has more detail on the effects of uncertainty
post-disaster.

320 Aids, hindrances and points of intervention in recovery
9.2.3 Lack of information (and communication)
Information and communication are complementary. Communication can be thought of as the
means of delivering or disseminating information. Consequently, good means of communication
does not mean that the information is right or adequate for the intended purpose.
Information is a precious commodity in disaster recovery and the deficiency of it often leads to
uncertainty, misinterpretation or incorrect assumptions as people look to fill the void. The lack
or slow release of information post-earthquakes added to the uncertainty of the plans for
recovery especially for the Christchurch CBD. This affected those organisations that wanted to
return to or invest in the CBD for example. However, even as the lack of information was a
serious issue, there needed to be a balance between speedy decision making and long-term
planning. The period of recovery from disaster is a chance to engage in long-term disaster
preparation and mitigation activities.
The dearth of information was also in the residential land zone planning. It was unknown for
long periods of time which areas would be declared irreparable45. This of course had a bearing
on the post-earthquake planning of organisations in the critical infrastructure, FMCG, Kaiapoi
Town Centre and Lyttelton Town Centre organisations. Just because an organisation’s assets are
undamaged does not mean that their recovery will not be affected by other factors such as
customers moving away from the area.
After disaster, both the means of communication and the content of the information
communicated are vital. Organisations require information in order to make meaningful strategic
plans for instance. Information should be available, relevant and timely. For example, in greater
Christchurch, information on land zoning was delayed and unclear. This meant organisations did
not have the right information on population profiles to use in business and recovery decisions.
Also, the delivery of information, i.e. the means of communication, should suit the situation. In
some cases it may be better to inform using physical mail while in other cases, social media may
suffice.
45 The details of the residential land zone offer can be found in chapter 5.
Key elements of sectoral recovery and resilience after the Canterbury earthquakes: A system dynamics approach
Hlekiwe Kachali
321
In a positive aspect of information and communication, the trucking and FMCG sectors worked
together on supply and demand instability issues. This illustrates the criticality of communication
and collaboration after disaster as well as in peacetime. One of the system effects in this case is
the bullwhip effect (Sterman, 2000) caused by the different elements involved in this loop having
incorrect or inadequate information about stock requirements in the supply web. This can cause
the variability of orders to increase further upstream in the supply web.
9.2.4 Official cordon around Christchurch CBD Red Zone
The cordon around the Christchurch CDB Red Zone was put in place for several reasons such
as the protection of the public from falling masonry after extensive damage to buildings caused
by the 22 February 2011 earthquake. The cordon, while growing progressively smaller, was
maintained while the demolition of buildings was done. In addition, the cordon was used as a
physical control point by the authorities for anyone wanting to access the CBD Red Zone. Any
individual wishing to enter the cordoned off area had to seek official permission and sign
consent papers.
However this procedure did not stop people getting into the cordoned area illegally. This
worried many business owners who were concerned as many of them faced difficulties in their
trying to access the area legally to check on what damage their property had sustained, for
insurance purposes as well as for the retrieval of equipment, information or stock. They
expressed concern at the looting that took place as they had expected that the authorities would
have provided adequate security to stop the wrong people gaining access to the Red Zone. This
prompted some building and business owners to illegally enter the cordoned off area, admittedly
at risk to their own lives, as they felt that their premises and belongings were unsafe. This was a
case of separate decisions made by individuals aimed at achieving their own interests partly due
to a lack of credible information and assurance from those officially tasked with leading the
recovery of the greater Christchurch area (see chapter 6.9 on leadership and trust). The existence
of the cordon was also a source of uncertainty.

322 Aids, hindrances and points of intervention in recovery
9.2.5 Flow of financial resources
Money is one of the crucial attributes in recovery. It enables the carrying out of many other
activities. One way to keep money (and capital) flowing is through the settlement of insurance
claims. Insurance has been discussed in relation to delays and mismatches. Apart from the delay
in insurance payments, organisations reported that the non-settlement and the non-availability of
insurance policies affected them in a number of ways. Some organisations were affected because
banks were not lending money to organisations with no insurance policies; this was especially so
in cases of relocation when organisations could not get new insurance policies for new premises.
Additionally, other organisations could not get contractors to repair premises because some
contractors could not get contract works insurance.
The role the insurance industry played in the Canterbury earthquakes merits special mention as
New Zealand has a high earthquake insurance penetration rate (J. Johnson, 2013). The delay in
paying out insurance claims was a problem for a lot of organisations in Christchurch, especially
the small- to medium-sized organisations. However, some contextual and case study
interviewees stated that another aspect of insurance was the uncertainty of future insurability;
both the availability and affordability of it.
One of the reasons Christchurch got into the insurance situation it was in was because of the
management of expectations. As discussed earlier, the seismic risk for Christchurch was known,
even if the faults that caused the Canterbury earthquakes were not. However, risk managers did
not want to be seen to be pessimistic and may have downplayed the worst case scenario (CEO,
personal correspondence, 2012). The focus was instead on Wellington and the Alpine Fault.
Herein lie lessons for organisations in other parts of New Zealand that there are multiple
hazards that should be considered. Additionally, perhaps there is a need to spread the risk in
other ways and not just through traditional insurance. For Christchurch, and by extension New
Zealand, this requires a rethink of how disaster risk is perceived. However, it should be noted
again that the 22 February 2011 earthquake exceeded by a considerable margin the maximum
credible earthquake assessment.
The Canterbury earthquakes also highlighted some major loopholes and further mismatches in
existing business interruption insurance wording and policy. Some organisations did not get paid
their business interruption insurance because their insurance company deemed that they could

Key elements of sectoral recovery and resilience after the Canterbury earthquakes: A system dynamics approach
Hlekiwe Kachali
323
open the door and trade. However, by law all buildings had to be checked and certified by qualified
personnel before they could be used again. As previously mentioned, there was a shortage of
people with the required skills to carry out these assessments which meant that there were
organisations that were caught in limbo. The insurance issue was further complicated by the
tiered insurance system for disaster. The Earthquake Commission’s (EQC) declarations of
certain earthquakes as events for households and contents were not matched to the definition of
events that commercial insurers used.
9.2.6 Organisational supply web vulnerabilities
The supply web includes any resources the organisation needs to produce goods or deliver
services. This can be employees, raw materials, customers, suppliers, utilities or technology and
highlights anew the many ways in which organisations can be disturbed. A supply web can also
have first and second order ripple effects beyond the affected organisation (Sheffi, 2007). First
order effects are to the customers and suppliers of the organisation, while second order effects
are to customers and suppliers of customers as well as customers and suppliers of suppliers (and
any other entities that can be affected). From the interviews, two aspects are apparent for the
supply web relationship between two (or more) organisations;
on how many levels and to what degree and extent the organisations are connected; and
the criticality to one organisation of the goods and services offered or bought by the
other organisation.
From interviews with the FMCG sector, a third aspect is the number of organisations reliant on
one supplier, for instance the number of retailers dealing with one supplier. This is a feature of
the New Zealand market considering its size and location. If one major producer or supplier was
disrupted, many retailers would also be inconvenienced as that supplier is a single point of
failure.
Supply web vulnerabilities mean that there is also a pre-disaster requirement for organisations to
understand the minimum conditions to maintain core business functions. Minimum
requirements being the least possible requirements for the organisation to function. Also, prior
understanding of the availability of external resources, i.e. from outside the organisation, is
324 Aids, hindrances and points of intervention in recovery
important. This is of course situation, industry sector and business type dependent. The
robustness and resilience of an organisation’s supply web are only some facets of this. Also of
value is recognition of the critical links in the supply web as well as understanding how these
links being disrupted would affect the members of the web.
9.2.7 Limiting factors (resources)
In every system there are limiting factors. In the presence of all other resources, limiting factors
act to slow down the functioning of a system or its subsystems. For recovery, this is not always a
good thing. In greater Christchurch, depending on which part of the system is under scrutiny,
there were several such factors. They include finance, skilled labour, infrastructure availability
and recovery plans, among others. For instance, the lack of a somewhat detailed recovery plan
resulted in difficulty for organisations and sectors, e.g. building suppliers, in forecasting demand.
This then affected the supply side also.
9.3 Points of intervention in recovery: From research to practise
From the analysis above, there are points of intervention in the system where action can be
taken in order to alter the trajectory and influence the system. Meadows (2008) calls these leverage
points. The identification of these points in the system is one of the ways in which this research
can make a practical contribution for the benefit of policymakers, organisations and sectors. This
is in addition to clarifying why the system behaves the way it does. It should be noted that the
system can be influenced in a positive or negative direction depending on the motives of the
intervener.
The aids and hindrances to recovery as well as the discussion in chapter 7 shows that from an
organisational and sectoral perspective, there are three main aspects that interact and lead to
different degrees of vulnerability. These three aspects are: the organisational characteristics,
infrastructure and frameworks used by organisations to deliver goods and services, and
ecological factors which are outside the control of the organisation. In conjunction with analysis
from chapters 5, 6 and 8, these are the aspects that will be used in discussing points of
intervention. In this chapter, the points of intervention in recovery have been grouped into:
actions by organisations and sectors, infrastructure used by organisations and environmental
factors.
Key elements of sectoral recovery and resilience after the Canterbury earthquakes: A system dynamics approach
Hlekiwe Kachali
325
9.4 Actions by organisations and sectors
The decisions made by an organisation in the immediate aftermath of disaster can influence not
only their long-term recovery but that of other organisations. Corey and Deitch (2011) came to
similar conclusions when they investigated organisational recovery after Hurricane Katrina.
9.4.1 Investment in staff
The realisation that staff are crucial to the organisation and its recovery after disaster should
translate into organisations investing more in their staff, for example through training,
counselling, the enablement of employees to balance family and work demands. This investment
needs to be done both before and after a disaster event.
For instance, information from organisations shows that the ongoing earthquakes in Canterbury
took their toll on staff and their families. Organisations reported that on return from the
Christmas and New Year break 2011 - 2012, employees seemed more tired than before they
went on break. This is likely because of additional earthquakes and also from other earthquake
effects such as filing insurance claims and dealing with tradespeople. These activities dragged on
from one month to another in a seemingly endless cycle and took their toll on people’s reserves.
The multiple earthquakes worked to reset the clock (physically and emotionally) for many people
and for some, affected their performance at work. Some organisations reported that actions such
as making sure staff took some time off were helpful.
9.4.2 Organisational or sectoral leadership in crisis and leadership wellbeing
Another element necessary for successful recovery is leadership. This is touched on in chapter 6.
Staw et al. (1981) observe that in situations where the organisation faces an external threat (e.g. an
earthquake) people in an organisation will look to others in the organisation in positions of
leadership for direction. From the definition of organisational crisis given in chapter 2, it can be
concluded that leadership is needed for all crises.
The case study organisations all narrated the importance of having a thoughtful, decisive, goal
oriented and clear communicator as one to lead a crisis. This is the person or persons that
initially assess the altered post-disaster environment before the organisation can open its doors
326 Aids, hindrances and points of intervention in recovery
again. This means there needs to be an awareness of what has transpired and what is yet to
unfold. Another aspect of leadership is to plan for and implement the targeted and effective46
use of resources in the response and recovery phase so that available resources are put to the
best use during response and recovery. Specific to the greater Christchurch region, in the
presence of other resources (financial, physical and geotechnical engineering knowledge),
persistent earthquakes should only affect the decision making for so long.
However, the interviewer observed that the wellbeing of the small business owner and of the
people in organisations leading the recovery is something that needs to be explored further.
People leading the recovery effort were themselves affected by the earthquakes. This may or may
not have had a bearing on how they led. Specific to the small business owner is that they are the
business and the business is them. Small business owners should look into possible succession
plans for crisis times as they have to manage their personal as well as professional lives with little
or no outside help.
9.4.3 Investigation, analysis and application of lessons
Recovery starts before or immediately after an event in the measures taken by organisations to
prepare for and mitigate against the outcomes of disaster. At the time of interviewing (March to
April 2012), most of the organisations had not reviewed decisions and actions that were taken in
the response and early recovery phase after each earthquake. As is discussed in section 5.5,
organisations may overestimate how well they performed both during and after the response and
very early short-term recovery phases post 4 September 2010. This may have affected analysis of
their response, in how well they coped, as well as subsequent preparation for future disaster
response. Paton et al (1998) write that this magnification of the organisation’s capabilities after
surviving one disaster may have an effect on how well the organisation prepares for future
events by underestimating risk and by constraining thinking. Mileti and O’Brien (1993) refer to
this as normalisation bias.
It would be helpful for organisations to have an organisation wide discussion of response and
recovery actions and decisions, not for the purposes of finger pointing or individual blame but
to identify best practise that can inform corporate strategy as well as possibly reducing or
46 Effective here means that the planned and eventual outcomes are the same.
Key elements of sectoral recovery and resilience after the Canterbury earthquakes: A system dynamics approach
Hlekiwe Kachali
327
counteracting future crises or disasters. Some of the ways in which organisations can do this is
by enquiring if the organisation’s existing (institutional) capabilities are adequate for the handling
of future challenges or if there is a need to modify and add to these capabilities. For instance, for
the building suppliers sector, will the sector have the resources to deal with the requirements of
rebuild when it takes off on a large scale?
For all sectors, some of the lessons learnt can be applied as soon as is possible in the recovery
process. For example, there should be an emphasis on building back with improved methods
and technologies. It appears that experiencing losses in the earthquake had a positive effect on
the preparedness levels of some organisations in this study. The two items on the preparedness
checklist that showed the greatest improvement following the earthquakes were bracing of
shelves and equipment, as well as having the organisation’s premises structurally assessed.
9.4.4 Preparedness for all hazards
Crisis preparedness is linked to the analysis and use of lessons from prior crises. In crisis
preparedness, most of the organisations spoken to did not have documented crisis, emergency
or business continuity plans over and above fire evacuation maps and fire extinguishers.
Additionally, some organisations reported also not having back-ups of important organisational
information. And yet the large majority were able to adapt to the turbulent circumstances,
recognising in the process what they had to do to carry on in the short- and long-term. This is
good but adaptability is only one of the elements in the successful recovery of a firm.
Preparedness and planning should be ongoing; these activities do not end with the production of
a written report. Organisations observed that in hindsight, pre-existing crisis plans and the
rehearsal of these plans (table top and enacted) are good starting points for how to manage in
crisis. Enacting plans not only ensures that the people who use these plans know of their
existence but also that they know what is contained in the plans. Organisations further noted
that as every crisis is different, crisis, emergency, business continuity or recovery plans should
contain enough detail to act as a guide but not too much detail that there is little room to adjust.
There are also other aspects to disaster preparedness. One crucial part to incorporate into the
design of disaster planning is the behaviour of people in the organisation in reaction to a
disaster. For instance, after the earthquakes, one organisation noted that they had good
328 Aids, hindrances and points of intervention in recovery
evacuation plans but no mention of re-entry plans which is one part required for business
continuity in their case.
Other preparedness measures include the organisational development of robust back-up
practices for all important documentation. This is to mean more than one extra copy of any vital
information as well as storage in different formats and locations. Back-up can also be for
machinery or premises by having mutual aid agreements with other organisations. Preparedness
can also involve organisations investing in new building technologies for damage avoidance to
mitigate against damage and disruption.
Preparedness includes the organisations incorporating disaster resilience into their strategy. For
most organisations the expenditure on crisis preparedness needs to be balanced with the value of
those plans both before and after disaster. As there was concurrence on the value of resilience
and its attendant benefits to organisations, there is a business case to be made for resilience.
Organisations should look into investing in those actions that would make them resilient such as
succession planning, having good leaders, well trained staff as well as emergency and recovery
plans. Chapter 10 touches on this by analysing how organisations can embed disaster resilience
and make a business case for the same.
A relatively high proportion of organisations engaged in some measures geared towards life-
safety, such as having a first aid kit and fire extinguisher available on their premises.
Organisations however reported that they were not prepared for large events such as the
Canterbury earthquakes. This is a demonstration of organisations being prepared for events they
thought would happen to them and not a broader range and scale of hazards. Rather,
organisations should engage in planning from an all-hazards perspective as it is not possible to
plan for every single possibility. Generic plans have the advantage of being applicable to many
different hazards and scenarios. For the organisation, such plans also save them resources as
they spend considerably less time and money developing all-hazard plans than specific hazard
plans.
In risk management exists the principle of consistent crudeness (Elms, 1985) which organisations can
use as a heuristic for disaster preparation. Using this principle, the amount of effort or energy
put into any one part of disaster readiness should be commensurate with that in other parts of
Key elements of sectoral recovery and resilience after the Canterbury earthquakes: A system dynamics approach
Hlekiwe Kachali
329
the readiness strategy or plans. This is because disproportionate attention to any one part could
equal a poor utilisation of resources if there are weaknesses in other parts.
9.4.5 Involvement of organisations and sectors as part of the core recovery strategy
Results from this study have brought to light that organisations and sectors can engage in
recovery in various ways: as employers, as stakeholders in the community and as an aid to each
other’s recovery. In this way, they can be used as leverage points in recovery. From the actions
that organisations took to aid employees, and also collectively because of the number of
employees they have, organisations are an integral part of any disaster response strategy. First,
organisations have access to a large number of people at the same time. They also usually have
resources available to employees that can help the community at large. Apart from their being
monetary contributors to the recovery effort they can be used in response, recovery and
mitigation phases to reach communities and help the authorities collect critical information e.g.
by collecting information on the state of employees houses and sending this into a central
recovery database. This could work in conjunction with the Red Cross and other organisations
and act to inform decisions about where help is most needed and what actions need to be taken.
This approach is not without its drawbacks. First the location of the disaster would play a major
role. In the case of Christchurch, the nature of the disaster and the availability of technology
meant that a lot of employers embarked on ascertaining the wellbeing of employees and families.
This method might not be applicable in a less developed country or in a larger disaster or
catastrophe. Also, there would have to be guarantees of privacy for the information provided.
After the earthquakes, employees were more willing to give out certain types of personal
information though, such as private or unlisted telephone numbers and other data that could be
used for recovery purposes. For employers in Christchurch, this was information they were
already collecting anyway from their employees to help them decide what kind of assistance they
could provide to employees. For example, one organisation booked holiday homes in Hanmer
Springs, an area close to Christchurch. All the employees and families who were still in
Christchurch were strongly encouraged to use it on a rotational basis. Despite this, the recovery
authorities would still have to be aware of those who are unemployed and have no access to
communication facilities.
330 Aids, hindrances and points of intervention in recovery
Organisations also found value in sharing best practice on how to manage employee stress or on
parts of recovery strategies employed (inter- and intra-sectorally) by other organisations within
and outside their sector. This is an example of pooling the knowledge of a few into the work of
many others and saving resources such as time and money. After all, the different organisations
and sectors are to various extents dependent on each other for recovery. However, for the long-
term recovery strategy of the greater Christchurch area, organisations reported that they were
not consulted on what they thought or were not asked to sit at the table especially considering the
interests (financial, human, etc.) they had in the recovery of the area. This is the under- or non-
utilisation of resources.
9.5 Infrastructure used by organisations
From the effects of the earthquakes, two things are important for organisations to look for; the
causes of disruption and the effects of disruption. This should also be applied to structures
organisations rely on for delivery of goods and services.
9.5.1 Physical infrastructure
This is infrastructure organisations are dependent on to produce and deliver their goods and
services. This includes but is not limited to roads, bridges, plant, machinery, communications
apparatus (computers, telephones, and radios), water and electricity. The organisation’s inability
to access or use this infrastructure can cause disruption to operations. In the greater
Christchurch context the extensive building damage was limited to specific areas and the
restoration of critical services such as electricity and roads was relatively quick. The quick
restoration of essential services is a leverage point in recovery. Additionally, the arrangement of
the rubbish transfer stations, in Christchurch, enabled the removal of debris from building and
demolition sites allowing organisations that could, to re-enter premises and in some cases
resume operations. The presence of debris can cause disruption by limiting access to
infrastructure.
9.5.2 Supply web
The supply web forms part of the organisation’s network. After disaster, a functioning supply
web is another leverage in recovery. This may enable an organisation to restart operations
quicker. This is discussed further in section 9.1.5.
Key elements of sectoral recovery and resilience after the Canterbury earthquakes: A system dynamics approach
Hlekiwe Kachali
331
9.6 Environmental factors
In any disaster, but especially on a regional or wider scale, organisations are affected by agents in
their environment. As elements in larger systems, organisations operate in an environment
where the actions they take and the results of those actions are sometimes dependent on the
actions and decisions of others such as customers, suppliers, competitors or the authorities.
Therefore, there are points in the organisation’s or sector’s environment that can be used to
effect recovery.
9.6.1 Role of recovery leaders and agencies
The significance of the people and the agencies leading overall recovery efforts cannot be
overestimated as a leverage point in recovery. A competent, inspired and inspiring leadership to
set the recovery goals and come up with an overall recovery strategy gives vision and hope to all
interested parties. This also ensures that all agents involved with the recovery, to whatever
extent, can align their plans with the greater recovery strategy. However, apart from the effort
put into aligning stakeholders towards the same goal, the goal has to be the right one, as defined
by the stakeholders (see section 8.4.5).
Interviewees spoke of the silos between the main organisations or authorities working towards
or leading the recovery. These were the Canterbury Earthquake Recovery Authority (CERA), the
Christchurch City Council (CCC) as well as other government agencies. The silos contributed to
the authorities not sharing valuable information with each other about the recovery strategy.
Often, one agency did not know what the other was planning which led to different groups
being given conflicting information. It also caused confusion about who really was in charge of
recovery for greater Christchurch.
In all, organisations identified the stakeholders in recovery after the earthquakes as CERA, local
authorities, communities and organisations (the business community). Even after the link
between business and community was identified (see section 6.6), organisations reported that
they still did not work with the other recovery stakeholders in a way that was more beneficial.
This shows that in managing after disaster, it is not necessarily a command-and-control
332 Aids, hindrances and points of intervention in recovery
approach47 that is required. What should be emphasised is the coordination between different
stakeholders.
From the contextual interviews and case studies, some respondents expressed dissatisfaction at
the structure of CERA. The setting up of a Recovery Authority to lead the work was welcomed
but the direct report of its Chief Executive to a government minister was not. Interviewees felt
that reporting to an independent board would have given the Recovery Authority more
autonomy and that it would have engaged better with the community and with organisations.
Some of the reasons for this were that the way Central Government functions, and by extension
CERA, was not the best way to guide such a massive and sensitive project. It was felt that
reporting to a government minister disempowered the organisation and by extension the people
of Christchurch in what was for them a very personal recovery. It remains to be seen whether
the setup of CERA was the best alternative for recovery after the Canterbury earthquakes.
9.6.2 Regional and national economies
After disaster, one goal of a Recovery Authority should be to encourage the creation of
conditions conducive to successful recovery. In this way, a regional or national economy can be
used to leverage recovery. For instance, the creation of a special category visa for personnel with
skills required for the Canterbury earthquake rebuild was one such point of intervention.
9.6.3 Information
Organisations require information in order to make meaningful strategic plans for instance.
After disaster, the content of information communicated is essential. See section 9.2.3 for more
detail.
9.6.4 Communication
Information and communication are complementary. The dissemination of information relies on
the means of communication. The importance of this after disaster is discussed in section 9.2.3.
47 A command and control approach may be required in the immediate response.
Key elements of sectoral recovery and resilience after the Canterbury earthquakes: A system dynamics approach
Hlekiwe Kachali
333
9.6.5 Policy
Policy is another tool that can be used to influence how the system behaves. However, the
direction of influence is not always as intended. For example, it was recognised that
transportation of disaster debris to pre-earthquake transfer stations led to delays in carrying out
demolition on demolition sites. Organisations involved in debris removal were then allowed to
sort waste on the demolition site or from temporary transfer stations in order to hasten
demolition and access to sites. In some cases, this led to some organisations removing financially
valuable parts of the debris, leaving the not so valuable parts to be cleared up by someone else,
in this instance the taxpayer. This behaviour affected the organisations that sorted all their waste
as they had a smaller profit margin than the rogue waste removal organisations. The actions to
stop these rogue businesses were seen as ineffective. For laws to work, they must be seen to be
fair.
A case where policy did not work so well is with CBD Red Zone cordon. The cordon was set up
to keep people out of the damaged CBD area and safe. Organisations whose premises were in
this zone required access in order to retrieve stock and documents as well as for insurance
purposes. However, there was a consistency problem in that some people were let into the Red
Zone while others were not. There was a lack of communication between CDEM and CERA
and organisations needing to access the Red Zone. In addition, there was no proper explanation
or information for why this was so or when organisations could access their premises.
Organisations reported that this led to corruption in who got into the zone and who was
excluded. This was in addition to the looting that had taken place in some parts of the cordoned
off area.
Policy can also be used as input into the building code for seismic limits for new buildings or for
the reinforcement of older building stock. Other possible policy measures proposed after the
Canterbury earthquakes were moratoria on new hospitality or retail licenses for a period of five
to 10 years as a way of assisting the struggling hospitality and retail sectors. This is very similar to
offering subsidies to organisations and has some of the same disadvantages. It can be argued
that if some of these organisations were not doing well prior to the earthquakes then they should
not be assisted in this way after the earthquakes. Instead, conditions such as increasing tourist or
334 Aids, hindrances and points of intervention in recovery
customer numbers should be created that encourage these organisations to flourish. The
moratoria in and of themselves may stop start-ups but will not bring much needed customers to
existing establishments. Alternatively, the timescale for the moratoria needs to be considered
carefully if it is to be part of the overall recovery strategy.
9.6.6 Subsidies and incentives
The Earthquake Support Subsidy (ESS) provided by the Central Government was welcomed by
just about everyone affected by and involved in the recovery of greater Christchurch. Other
incentives mentioned in interviews included lower land rates for building owners wanting to re-
invest in the Christchurch CBD.
However, some interviewees felt that in place of subsidies or incentives should be the creation
of conditions that attract the return or setup of organisations and people to an area like
Christchurch’s CBD. These could be to do with the architecture of the buildings or the activities
that people could engage in.
9.7 Critical success factors for organisational and sectoral recovery after
the 2010-2011 Canterbury earthquakes
In summary, the management of the recovery process after disaster can be compared to that of
managing a project in the business sphere. Therefore, the project management principle of critical
success factors (CSFs) (Rockhart & Bullen, 1981) is pertinent to disaster response and recovery.
CSFs are factors essential for a project to achieve its aims. In disaster response and recovery,
CSFs are those actions that must work out well or elements that must be present if the recovery
efforts are to succeed.
There are numerous CSFs in recovery from disaster. In chapters 4 to 7 of this thesis, the
differential effects of disaster for different sectors are shown. Consequently, it stands to reason
that the CSFs for the sectors in this study may differ by sector while others may be similar. For
instance, just after the earthquakes, the critical infrastructure sector was in need of spare parts
for repair while the building suppliers sector was in need of information required for forecasting.
However, for both sectors the CSF of leadership is important. Table 9-1 shows the CSFs that
have been identified for the recovery of the sectors in this study. The CSFs with the √ sign are
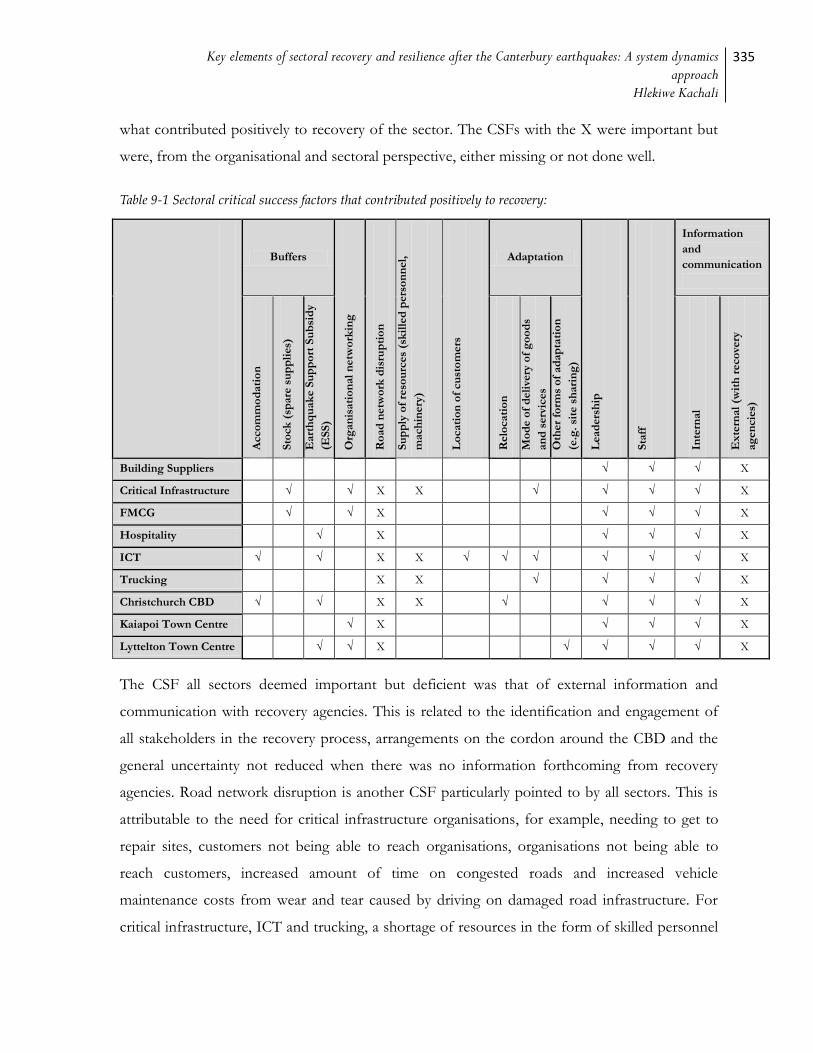
Key elements of sectoral recovery and resilience after the Canterbury earthquakes: A system dynamics approach
Hlekiwe Kachali
335
what contributed positively to recovery of the sector. The CSFs with the X were important but
were, from the organisational and sectoral perspective, either missing or not done well.
Table 9-1 Sectoral critical success factors that contributed positively to recovery:
Buffers
Org
an
isati
on
al
netw
ork
ing
Ro
ad
netw
ork
dis
rup
tio
n
Su
pp
ly o
f re
sou
rces
(sk
ille
d p
ers
on
nel,
mach
inery
)
Lo
cati
on
of
cu
sto
mers
Adaptation
Lead
ers
hip
Sta
ff
Information
and
communication
Acco
mm
od
ati
on
Sto
ck
(sp
are
su
pp
lies)
Eart
hq
uak
e S
up
po
rt S
ub
sid
y
(ES
S)
Relo
cati
on
Mo
de o
f d
eli
very
of
go
od
s
an
d s
erv
ices
Oth
er
form
s o
f ad
ap
tati
on
(e.g
. si
te s
hari
ng
)
Inte
rnal
Ex
tern
al
(wit
h r
eco
very
ag
en
cie
s)
Building Suppliers √ √ √ X
Critical Infrastructure √ √ X X √ √ √ √ X
FMCG √ √ X √ √ √ X
Hospitality √ X √ √ √ X
ICT √ √ X X √ √ √ √ √ √ X
Trucking X X √ √ √ √ X
Christchurch CBD √ √ X X √ √ √ √ X
Kaiapoi Town Centre √ X √ √ √ X
Lyttelton Town Centre √ √ X √ √ √ √ X
The CSF all sectors deemed important but deficient was that of external information and
communication with recovery agencies. This is related to the identification and engagement of
all stakeholders in the recovery process, arrangements on the cordon around the CBD and the
general uncertainty not reduced when there was no information forthcoming from recovery
agencies. Road network disruption is another CSF particularly pointed to by all sectors. This is
attributable to the need for critical infrastructure organisations, for example, needing to get to
repair sites, customers not being able to reach organisations, organisations not being able to
reach customers, increased amount of time on congested roads and increased vehicle
maintenance costs from wear and tear caused by driving on damaged road infrastructure. For
critical infrastructure, ICT and trucking, a shortage of resources in the form of skilled personnel

336 Aids, hindrances and points of intervention in recovery
to carry out work affected the sectors. Trucking and Christchurch CBD were affected by
availability of specialist machinery for building demolition and deconstruction.
In this study, CSFs are applicable to both organisations and sectors. To gain the most out of
CSFs, organisations and sectors need to identify, at the earliest opportunity, those activities
crucial to the success of their recovery and then carry them out. It should be noted that some
CSFs might not be immediately apparent in the aftermath of disaster and that these CSFs change
the further in time from the disaster event. For instance, from the project management literature,
Pinto and Prescott (1988) write that the different stages of the project life cycle have different
CSFs. For organisational and sectoral recovery after the Canterbury earthquake sequence, this is
demonstrated in the different feedback loops dominant at different points in the system’s time
horizon.
9.8 Chapter summary
In this chapter, the use of system dynamics has enabled the identification of the aids and
hindrances to recovery as well as points of intervention in the system. This was done by
observing the effects of the interactions between system actors. Knowing the possible sources
that have an influence on recovery and at what point in the recovery timeline will better inform
policy decisions, lead to the improvement of loss estimation after disaster and increase overall
organisational and sectoral resilience. Recovery research should therefore give more priority to
what organisations and sectors require for a successful, long-term recovery and reconstruction.
Essentially, it is not easy to place the aids, hindrances and point of intervention in recovery in
rank order. This is because, as has been pointed out previously, each sector was affected
differentially and also every disaster is different. Additionally, from the systems perspective,
different feedback loops are dominant at different times and act to influence the system in
different ways. Elms (1985) in his principle of consistent crudeness cautions against
concentrating on one element to the detriment of other elements which are part of the system.
After a disaster event, the list of aids, hindrances and points of intervention can be used as a
starting checklist for how the organisations and sectors have been affected, what is required for
their recovery and the importance of each of these requirements at the different points in time
Key elements of sectoral recovery and resilience after the Canterbury earthquakes: A system dynamics approach
Hlekiwe Kachali
337
after the disaster event. These can be used in conjunction with the signifiers of recovery and the
critical success factors for preparation before a disaster and for recovery after.
Based on the contextual interview and case study data (chapters 4 and 6), survey data (chapter 5)
the signifiers of recovery (chapter 7) and the systems analysis (chapters 8 and 9), it is possible to
classify tier 1 and tier 2 influences that affected the recovery of Canterbury organisations. Tier 1
indicates that these influences had greater import than tier 2. It is also important to remember
that the Canterbury earthquake sequence was a regional disaster. Therefore, the more influential
elements in this disaster may not be the same in a disaster in a different place or of a different
scale. These tiers can also be used as information by organisations and recovery agencies outside
the Canterbury region to help them prepare for and manage disaster.
Tier 1 influences:
Staff capability and wellbeing;
Availability of resources (skilled workers, machinery, finance, stock, utilities);
Demand for organisation’s or sector’s good and services;
Uncertainty, information and communication;
Leadership;
Location of customer base;
Mode of delivery for organisation’s goods and services; and
Localisation of earthquake damage;
Tier 2 influences:
Organisational level characteristics e.g. preparedness and documented crisis plans ; and
Organisational location.
In chapter 10, organisational and sectoral disaster resilience will be explored. Specifically, what
aspects contributed to organisational and sectoral disaster resilience after the 2010 – 2011
earthquakes in Canterbury.
338 Sectoral and organisational disaster resilience
10 Sectoral and organisational disaster resilience
In chapters 6 and 8, it was demonstrated that there are three broad categories whose
elements combine to varying degrees making organisations susceptible to disaster. These are
the organisation’s internal characteristics (e.g. type of goods and services delivered,
preparedness and planning), the physical systems involved in the delivery of the
organisation’s goods and services (e.g. roads and equipment) and the organisation’s
environment (e.g. community hazard mitigation). In addition, the extent to which an event
causes disruption is dependent on the scale of the event: whether it is an emergency, crisis,
disaster or catastrophe. In the disaster literature, Quarantelli (2006) writes about the
magnitude of an event leading to its classification in one of the categories.
Consequently, for the regional disaster that organisations in Canterbury found themselves
dealing with, this work puts forward the thesis that there are at least two interconnected
levels of resilience. The first is the business-as-usual (or pre-disaster) resilience of the individual
organisation and to a degree that of its sector. This is related to the organisation’s
characteristics such as finance, location and type of goods and services. The second level of
resilience is to do with the environmental factors emergent after the Canterbury earthquakes
and necessitates the development by organisations of their disaster resilience. The connection
between the two levels of resilience is depicted in Figure 2-6 in chapter 2.
The reason for the distinction between these interconnected levels of resilience is to do with
the scale of an event. Business-as-usual resilience is when the organisation is affected but
little or none of its environment is similarly affected. Disaster resilience is when not just the
organisation is affected but also its environment such as suppliers, customers and the
community. The interaction of these two levels of resilience typifies the hierarchy of systems
within systems. Authors such as Paton and Johnston (2006), Tierney (2008), Manyena (2006),
Chang (2004), Alesch and Holly (2002), Whitman et al (2011) as well as Kachali et al
(2012)detail how the concept of disaster resilience has gained prominence and is vital for
recovery after disaster.
In addition to business-as-usual organisational resilience, organisational disaster resilience
was also required for organisations affected by the Canterbury series of earthquakes. For
instance, some organisations from the critical infrastructure sector pointed to their being well
prepared to handle crises that are part of their business-as-usual but that this preparation

Key elements of sectoral recovery and resilience after the Canterbury earthquakes: A system dynamics approach
Hlekiwe Kachali
339
(and resources) was not always adequate for the work needing to be done after the
earthquakes (see chapter 6 for details). In the FMCG sector, organisations narrated being
affected because the populations they served were affected. For some FMCG organisations
this was in the form of the community moving away leading to reduced custom while for
other FMCG organisations this took the form of increased customer numbers. And yet, this
was only one element that affected FMCG organisations in their recovery after the
earthquakes. From chapter 8, it is shown that there were many more interactions, such as
product supply disruption, that had a bearing on FMCG recovery. Consequently, after the
Canterbury earthquakes, it was evidenced that disaster resilience incorporates many more
facets than business-as-usual organisational resilience in the breadth of agents both affected
and involved.
A further representation of the need for organisational disaster resilience is staff wellbeing
and its link to external organisational elements such as the wellness of staff family, friends
and community. The wellbeing of the community is also connected to hazard mitigation
decisions made by the community and which affect the recovery of organisations post-
disaster. For instance, the decision made by elected officials to under-insure public buildings
partly contributed to how organisations from the Christchurch CBD and town centres in the
study were affected. Also, the unreinforced masonry (URM) buildings in the CBD and town
centres were especially vulnerable to earthquake shaking which led to extensive damage and
extended periods of closure for these areas.
Another agent involved was New Zealand’s Central Government which created a ministerial
position as well as an agency (Canterbury Earthquake Recovery Authority - CERA) especially
dedicated to the recovery of the region after the damage caused by the 22 February 2011
event. Therefore, in a regional disaster, organisational disaster resilience plays a larger role
than business-as-usual organisational resilience. Importantly, for both levels of resilience,
baseline indicators are required for measurement and monitoring especially across time.
As illustrated in chapter 5, one part of each survey deployed for this study contained items
from the Benchmark Resilience Tool48 (BRT-53 or BRT-13) as a measure of organisational
resilience. Using computations from these items after Surveys 1 and 2, the BRT
48 BRT-13 is the short-form version of the BRT-53. See (Z.R. Whitman et al., 2013) for development of BRT-13. In this thesis,
BRT is the umbrella name for both BRT-13 and BRT-53.

340 Sectoral and organisational disaster resilience
organisational resilience indicators which were more prominent for each sector are presented
in this section. Also, participants in contextual interviews and case studies were asked to
describe resilience (see chapter 6.5.4). The more prominent indicators of disaster resilience
deduced from the interviews and case studies are also presented here. The two sets of
resilience indicators, from the BRT-53 and BRT-13 as well as from interviews and case
studies, are contrasted. This section also contains discussion on the relationship between
recovery after disaster and the organisation’s or sector’s level of disaster resilience.
10.1 Sectoral disaster resilience indicators - using the Benchmark
Resilience Tool (BRT-53 and BRT-13)
The Benchmark Resilience Tool (BRT-53) (Lee, Vargo, & Seville, 2013; McManus, 2008;
Stephenson, 2010) was developed to be used by organisations to measure their resilience. For
example, many of the items in the BRT address how respondent organisations run their day-
to-day business, preparedness measures they may have engaged in and how they would
respond in a crisis. The organisations in this study used the BRT while in the midst of a crisis
at a regional scale and the BRT does not specifically ask about organisational actions in a
regional disaster. However, even in a regional disaster, some of the responses to the BRT
yield possible understanding into what is required for organisations and sectors to be disaster
resilient. Appendix F contains the complete tables for BRT sectoral resilience scores and for
the items contained in the BRT.
As this research sampled the same group of respondent organisations multiple times, it can
be likened to a longitudinal study. The same questions from the BRT were asked of
respondents at three different points in the course of the research. Additionally, the effects
of the 4 September 2010 and 22 February 2011 earthquakes are considered in analysis. For
instance, it is likely that the BRT organisational resilience scores after the 22 February 2011
earthquake are a result of organisations being more affected by environmental factors than
by those inside the organisation (see chapters 5 for BRT scores and chapter 8 for
environmental factors).
Diggle (2002) writes that a fundamental advantage of longitudinal studies is in how they
effectively measure changes over time in the same variables. Also, because of the
involvement of multiple respondents in the study, the findings can be generalised. Diggle
also points out that in some studies, the period, or calendar date is also essential in analysis.
Harter et al (2006), in their study on the administration of surveys amidst disaster,
Key elements of sectoral recovery and resilience after the Canterbury earthquakes: A system dynamics approach
Hlekiwe Kachali
341
demonstrate how a disaster event can affect respondents as well as survey results. Anderson
(1969) shows how organisations undergo periods of adjustment post-disaster that affect how
they function. In the case of organisations in Canterbury, the effects of the earthquakes most
likely had a bearing on how they responded to survey questions.
It has been demonstrated how the sectors in this study were affected variably after the
Canterbury earthquakes. It follows that the sectors in this study had different sets of
individual BRT indicators that were more meaningful for them. Table 10-1 shows the
differences in sectoral resilience indicator scores between Survey 1 (deployed after 4
September 2010) and Survey 249 (deployed after 22 February 2011). For each sector the three
largest differences (decreases) in sectoral resilience indicator scores are shown in bold font.
The organisational resilience scores from Survey 1 are comparable to those from Survey 3.
As well, the sample set in Survey 3 is smaller than in both Surveys 1 and 2. For these reasons,
it was deemed sufficient to use BRT organisational resilience scores for Surveys 1 and 2.
The current design of the BRT uses the concept of the higher the overall organisational resilience
score, the more resilient the organisation. This is the same for the organisational resilience individual
indicator scores. Therefore, the difference in the BRT organisational resilience score
achieved by the organisation can be compared to the highest possible score as a means of
evaluating performance. The results can thereafter be used to improve resilience. Similarly, in
existing organisational practices, the balanced scorecard (BSC) developed and popularised by
Kaplan and Norton (1992, 1996b) is used to set organisational priorities such as staff or
customer satisfaction and the targets for those priorities. At the end of the measurement
period, the target and the actual values are compared as a means of checking how well the
organisation performed. The differences in scores are used to set improvement measures. In
the same way, the Australian Bureau of Statistics (ABS) (2012) runs the annual Business
Longitudinal Study (BLS) for employer organisations. The annual BLS measures the impact
of different business characteristics (e.g. industry sector, exports and employment details)
and uses this change in metrics to track the performance (e.g. profit, revenue and sales) of
businesses. From a systems point of view (see chapter 8), the negative feedback loop
depicting disaster recovery shows how organisations can use the differences between their
actual and intended targets to draw up organisational improvement measures.
49 Lyttelton organisations did not take part in Survey 1; the prominent indicators for those organisations were calculated
using Survey 2 and Survey 3 data.

342 Sectoral and organisational disaster resilience
In the same way, in this study the difference in sectoral indicator scores between the two
surveys shows which of the indicators of resilience the respondents were more affected by or
were more sensitive to in the case of a regional disaster. Kaplan and Norton (1996a) as well
as Davenport and Stoddard (1994) advise that it is more useful for organisations to
concentrate on diligently pursuing a few aspects and doing those well as opposed to working
on a broad suite of organisational improvement measures and not doing them well. This is
the fundamental reason for this study highlighting the three sectoral resilience indicators that
showed the largest differences between surveys 1 and 2. Furthermore, three indicators linked
to the organisation’s strategic goals are a more manageable objective that individuals in the
organisation can focus on at one time as opposed to 13 indicators.
Table 10-1: Percentage differences in Benchmark Resilience Tool (BRT) sectoral resilience indicator
percentage scores between Surveys 1 and 2*
Percentage differences* in Benchmark Resilience Tool (BRT) sectoral resilience indicator percentage scores between Surveys 1 and 2 (all values are in percentage % )
Pla
nn
ing
Str
ate
gie
s
Part
icip
ati
ng
in E
xerc
ises
Ex
tern
al
Reso
urc
es
Reco
very
Pri
ori
ties
Pro
acti
ve
po
stu
re
Lead
ers
hip
Sta
ff
Invo
lvem
en
t
Sit
uati
on
Mo
nit
ori
ng
&
Rep
ort
ing
Min
imis
ati
on
of
silo
s
Inte
rnal
Reso
urc
es
Decis
ion
Mak
ing
Inn
ova
tio
n &
Cre
ati
vity
Info
rmati
on
&
Kn
ow
led
ge
P1 P2 P3 P4 P5 A1 A2 A3 A4 A5 A6 A7 A8
Building Suppliers 8 2 -3 14 20 25 29 6 18 18 16 9 6
Critical Infrastructure 28 37 36 32 28 27 35 29 24 32 27 23 24
FMCG 19 16 16 25 25 28 32 28 28 34 41 25 19
Hospitality 28 21 10 23 5 37 25 25 33 26 30 22 16
ICT 15 10 3 0 5 24 28 19 33 26 22 23 9
Trucking 21 13 13 14 20 32 30 20 23 25 29 27 17
Christchurch CBD 13 14 22 15 12 24 31 15 22 24 27 16 11
Kaiapoi Town Centre 13 19 8 3 6 16 18 13 25 22 22 22 4
Lyttelton Town Centre 15 13 25 15 16 12 9 27 13 23 10 28 -5
Entire Sample Group50 19 17 14 14 14 28 27 21 28 27 27 23 13
*All positive numbers, i.e. positive percentages, indicate a decrease between Surveys 1 and 2 while negative values indicate an increase from Survey 1 to Survey 2
50 As these results are using Survey 1 and Survey 2 results, the Lyttelton sample is not included as they did not take part in
Survey 1.
Key elements of sectoral recovery and resilience after the Canterbury earthquakes: A system dynamics approach
Hlekiwe Kachali
343
Therefore, the prominent indicators highlighted in Table 10-1 may serve as an aid in
development of disaster resilience measures for the organisations and sectors in this study.
Also, as the indicators of resilience are interconnected, work on some of them may lead to
some improvement in others. Also, from chapter 8 and manifested in the difference in
organisational resilience scores between Surveys 1 and 2 is the concept that resilience
advancement is context dependent and is a continuous process.
The analysis that follows in this chapter is based on information from the qualitative data
provided by organisations; the organisations were not specifically queried on their
interpretation of the items and indicators contained in the BRT-53. This information was
obtained from organisations while pursuing other lines of questioning to do with disaster
recovery. This is another reason for discussing only three indicators per sector. The detailed
explanation for all the indicators requires a thorough investigation in which they are the
focus. Consequently, each organisation and sector may have distinct explanations for how
the indicators relate to them. This is an area that could be pursued further in future research
coupled with follow on surveys of earthquake affected organisations at four, eight and 10
year intervals from the 4 September 2010 earthquake.
10.1.1 Sectoral indicator score differences - overview
When broken down by sector, the BRT indicators: planning strategies, recovery priorities,
and information and knowledge did not feature at all for organisational resilience indicators
that stood out in disaster. Analysis of the items (questions) that form the BRT indicators (see
appendix F for a list of the BRT-53 indicators) shows that some of them may not necessarily
apply in the context of a disaster.
Organisations reported that after the earthquakes, they tried to understand the situation, how
they had been affected and that uncertainty was the norm and not the exception. One of the
items making up the planning strategies indicator asks about planning strategies carefully before
taking action. Carefully, in this instance, to mean cautiously or after thorough assessment.
However, in the immediate aftermath of a disaster, a lot of instinct and adaptation is called
for and is partly dependent on availability of information and resources. Post-disaster,
information and resources are not always readily available and some decisions have to be
made on the spot with whatever information is at hand. In disaster, it is not always possible
to completely assess a situation before reaching a decision.
344 Sectoral and organisational disaster resilience
The information and knowledge indicator is also not one of the three prominent indicators
for any of the sectors. Survey and interview respondents stated that one of the most
important elements in recovering from disaster is information that is credible, timely and
relevant to the situation. One of the items from the information and knowledge indicator
asks about readily obtaining expert assistance when there is a problem. The supply of expert
assistance, e.g. geotechnical and structural engineers, was not in step with the increase in
demand especially after the 22 February 2011 earthquake. Additionally, with the huge
uncertainty caused by the earthquakes as well as other interacting factors, in the response and
early recovery phases it was not easy for organisations to tell what the problem actually was
let alone get expert assistance.
Furthermore, one of the recovery priorities indicator items is we understand the minimum level of
resources our organisation needs to operate. All organisations interviewed expressed that they knew
what minimum resources their organisation needed to operate during business-as-usual.
However, their operational needs after the earthquakes differed from business-as-usual and it
was not always immediately apparent what the requirements were as they adapted to a
changing situation. As demonstrated in chapters 6 and 8, base requirements to keep the
organisation operational are different in a regional disaster and at different times after the
disaster event. As well, keeping the organisation operational in the response phase in efforts
to minimise further damage differs from the short-term phase when resumption of
productivity may be the focus.
As stated earlier, any future study of the BRT, for disaster, needs to incorporate detailed
scrutiny of both the questions and the indicators. There are two main reasons for this. The
first reason is that there are indicators, e.g. planning strategies, which after the earthquakes
were not among the most prominent for any sector. Further investigation may reveal which
indicators are applicable in a disaster context. Additionally, analysis of all items in the BRT-
53 showed that even for indicators that were outstanding for some sectors, not all the
questions applied in disaster. More extensive and detailed research of the indicators and
items in the BRT is required and recommended as a future research strand.
10.1.2 Building suppliers
Apart from staff involvement and leadership, proactive posture was one of the indicators
with a more significant difference for building suppliers. In fact, this was the only sector
where this indicator was prominent. One of the sector’s biggest challenges after the
Key elements of sectoral recovery and resilience after the Canterbury earthquakes: A system dynamics approach
Hlekiwe Kachali
345
earthquakes was the inability to forecast demand as the rebuilding boom that was expected
to occur did not. One of the other effects of the earthquakes was that work that had been
scheduled pre-earthquake, for example home renovations, was put on hold or cancelled
because of earthquake damage and insurance wrangles. Some of the building suppliers
expressed that they had taken a wait and see approach for when their sales and revenue
would pick up.
10.1.3 Critical infrastructure
Two of three noteworthy indicators for critical infrastructure were to do with planning:
participating in exercises and external resources. As discussed earlier, this was the only sector
where all organisations had pre-earthquake crisis or emergency plans. Organisations in this
sector also believed that not only should these plans be documented but that they should
also be tested. Critical infrastructure organisations reported regular practise drills as part of
their business-as-usual and that this helped in the response phase. Despite planning and
rehearsing their plans locally, critical infrastructure organisations reported that the scale and
urgency of the task required the use of staff from offices outside Christchurch as well as
contractors from other organisations.
Critical infrastructure organisations also had to work with many other organisations in the
response phase. Some of these organisations were parts suppliers who at times did not have
required stock on hand. This affected critical infrastructure’s perception of external
resources. The third prominent indicator was staff involvement. Of all the sectors, staff from
the critical infrastructure sector worked the longest hours restoring and repairing time critical
services after the earthquakes. The sector reported that one of their biggest challenges was
managing staff work times and workloads in addition to ensuring people had enough rest
between jobs and that they got the chance to look into personal matters.
10.1.4 FMCG
The three outstanding indicators for FMCG were staff involvement, internal resources and
decision making. FMCG organisations reported that they required more staff after the
earthquakes for the large clean-up work that resulted from damaged shelving and stock loss.
Organisations also reported that they did not have adequate stocks on hand for some goods
such as bottled water which were in higher demand after the earthquakes. The decision
making indicator can be attributed to resolving what product mix was right after the
346 Sectoral and organisational disaster resilience
earthquakes as some products were more in demand than others. In reaching some of these
stocking decisions they worked with supplier partners to adjust stock levels and supply
schedules. Some of the producer FMCG organisations said they had to consult their head
offices about whether adequate stock was available in New Zealand before they could make
decisions on what they were able to supply.
10.1.5 Hospitality
All the stand out indicators for the hospitality sector were to do with adaptation: leadership,
minimisation of silos and decision making. At the time of writing (July 2012), some of these
organisations were still closed as a result of the 22 February 2011 earthquake. The closed
organisations were located in the CBD Red Zone prior to the earthquake. In interviews,
owners and managers spoke of how they shepherded staff off organisational premises,
mainly after the 22 February 2011 earthquake, and the close relationship they had with their
staff before and after the earthquakes. From this account of leadership in the hospitality
sector, it is unclear why there was a significant difference in leadership indicator scores
between Surveys 1 and 2.
The other prominent indicators were decision making and minimisation of silos. Some
hospitality organisations reported that they felt decisions to do with re-opening were
dependent on many other factors they had no control over such as the cordon around the
Red Zone, insurance payments and building renovations. Also, respondents reported that the
size of the organisations and crossover of tasks in this industry acted to minimise silos.
However, that this indicator had one of the larger score differences between Surveys 1 and 2
hints at a different scenario. It is also possible that the items did not apply to the respondent
organisations.
10.1.6 ICT
Leadership was a prominent indicator for the ICT sector. Interviewed ICT organisations
emphasised that leadership came not just from the people in leadership roles before the
earthquakes but also from among other staff. Another prominent indicator was minimisation
of silos. From interviews, one attribute of the ICT sector is the ability individuals have of
working on their own for long periods of time on unique projects or in specialised areas. It
was noted that this could lead to silos in organisations. After the earthquakes, there was a
need for staff to work in groups on some new post-earthquake tasks or in close proximity
for extended periods. Organisations reported that this was not always easy. On the other
Key elements of sectoral recovery and resilience after the Canterbury earthquakes: A system dynamics approach
Hlekiwe Kachali
347
hand, individuals being able to work on their own for long periods, to achieve organisational
aims, is aided by devolved decision making and autonomy. Devolved decision making was
the third indicator for ICT which had a significant difference between Surveys 1 and 2.
10.1.7 Trucking
Staff involvement was one of the indicators for the trucking sector that showed a larger
difference between Surveys 1 and 2. Some of the trucking sector, mainly debris removal and
construction, recognised the opportunity presented to them after the earthquakes. They also
realised that the task was enormous and would require skilled manpower which was in short
supply even before the earthquakes. However, some organisations spoke of their drivers
leaving for other organisations that paid slightly better after the earthquakes. This was as the
competition for demolition and debris removal contract work increased.
Leadership and internal resources were the other prominent indicators for trucking
organisations. Apart from not having enough manpower, some truckers reported not having
enough machinery and equipment (internal resources) for the work needed to be done after
the earthquakes. Some of the machinery and equipment required was specific to work that
was being done because of the earthquakes.
10.1.8 Christchurch CBD
Prominent indicators for Christchurch CBD were internal resources, leadership and decision
making. Christchurch CBD organisations said it was difficult to make major decisions
affecting their organisations immediately after the 22 February 2011 earthquake. This was
because it was difficult to access organisational premises, records and stock that were in the
CBD Red Zone. Lack of access to records meant that they could not access their customer
databases or collect evidence for insurance. Apart from not accessing stock and hence not
being able to trade, another of the CBD’s biggest challenges was cash flow, which constitutes
internal resources. In cases where organisations could not access premises for long periods
of time, this meant that even if they could relocate, they may not have been able to afford
new stock.
10.1.9 Kaiapoi Town Centre
In Kaiapoi the indicators showing a wider gap between Surveys 1 and 2 were to do with
minimising silos, being innovative and creative as well as on internal resources and devolved
348 Sectoral and organisational disaster resilience
decision making. After the 22 February 2011 earthquake some of the respondents from
Kaiapoi expressed that the community felt they had been abandoned as attention shifted to
Christchurch. They equated this shift in attention to a shift in resources, by the authorities, as
the problems in Christchurch were more visible. Respondents spoke of the need to work
towards new and innovative ways of using the resources they had to get the town back on its
feet again.
Respondents also spoke of the strong community spirit that existed before the earthquakes
needing to be even stronger as they made plans to rebuild their town. However the drop in
the minimisation of silos indicator score shows that they may not have been working so well
together anymore. Lastly, they felt disempowered by some of the decisions made by the
Recovery Authority (CERA) about issues such as land zoning, that they were no longer in
control and were not consulted on their future. This may also have contributed to
minimisation of silos coming to the fore.
10.1.10 Lyttelton Town Centre
The Lyttelton Town Centre organisations were the only group for whom situation
monitoring and awareness was one of the indicators with a larger percentage difference
between sampling times. The other two indicators were external resources and innovation
and creativity. Organisations in Lyttelton also reported that they felt side lined by all the
attention Christchurch had drawn. Further to this was the feeling that some recovery
solutions proposed for Christchurch (e.g. moratoria on commercial expansion outside the
CBD) would not be in the interests of Lyttelton and would divert resources to the
Christchurch CBD. The respondents from Lyttelton reported that it was important for them
to keep track of activities going on outside the town that might affect recovery.
Community based associations in Lyttelton were very active in leading recovery initiatives
after the 22 February 2011 earthquake. The town acted faster in certain ways than
Christchurch CBD, for instance in demolishing buildings. However, amidst all this activity,
some organisations in the town felt that it was only a few people speaking louder than others
and that not all opinions were being heard. This led to the feeling that it was not always
majority ideas about the best innovative and creative ideas to implement in recovery.
Key elements of sectoral recovery and resilience after the Canterbury earthquakes: A system dynamics approach
Hlekiwe Kachali
349
10.2 Sectoral disaster resilience indicators - using information from
impact data, contextual interviews and case studies
An alternative and additional way (to using the BRT) of arriving at the more important
organisational disaster resilience indicators is to use the qualitative data provided by the
disaster affected organisations. This includes information from contextual interviews, case
studies and qualitative responses from the survey questionnaires (see section 6.5.4). One
advantage of this is that these responses are a way in which the BRT can be continually
improved by the addition of new information pertinent to disaster resilience. This is because
respondents did not merely show a level of agreement with statements on business-as-usual
organisational resilience. Instead, after experiencing disaster, they stated what relates to
disaster resilience as they see it. Additionally, the BRT was developed during non-crisis times;
questions used during business-as-usual may not be suitable after disaster.
From the contextual interviews and case studies, the most prominent indicators of
organisational disaster resilience turned out to be ones to do with specific areas of
organisational performance after the earthquakes. As described above, organisations depicted
recovery as first returning to their pre-earthquake performance levels, exceeding those levels
and the time taken to achieve this. Consequently, organisations reported that for them, the
fundamental indicators of disaster resilience are those listed in Figure 10-1. They include
evaluating post-earthquake revenue, staff and customer retention levels; the time taken to
return to pre-earthquake levels of these components; as well as leadership and organisational
adaptability.
Two case study respondents, one from the ICT sector and the other from the building
suppliers sector emphasised that for them an additional mark of the organisation’s disaster
resilience was to what extent the organisation’s safety procedures worked and were followed
just after the earthquakes struck and with each major aftershock. Of all the case study
organisations, these two placed a lot of emphasis on occupational health and safety. The ICT
organisation is specialised in light manufacturing while the building supplier works with steel.
The indicators given in Figure 10-1 are in accord with findings from the organisational and
disaster literature. For instance, Knight and Pretty (1996), in evaluating pre- and post-disaster
organisational performance, demonstrate that effective crisis management can minimise
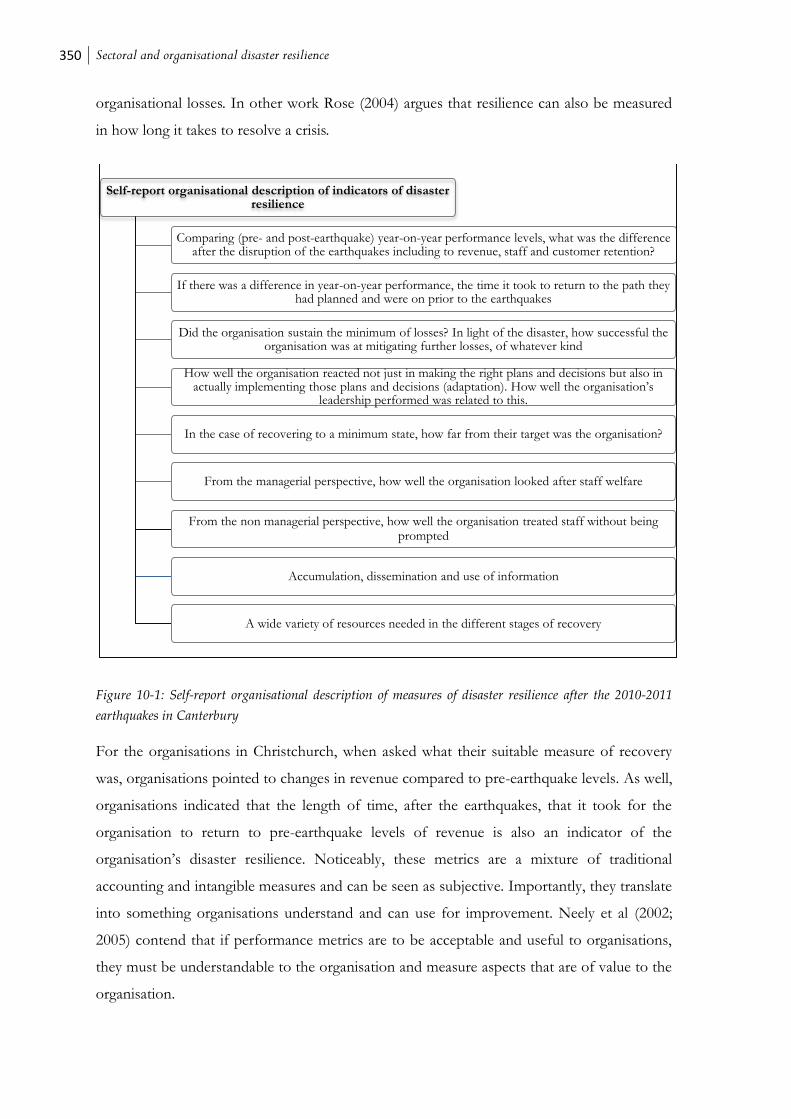
350 Sectoral and organisational disaster resilience
organisational losses. In other work Rose (2004) argues that resilience can also be measured
in how long it takes to resolve a crisis.
Figure 10-1: Self-report organisational description of measures of disaster resilience after the 2010-2011
earthquakes in Canterbury
For the organisations in Christchurch, when asked what their suitable measure of recovery
was, organisations pointed to changes in revenue compared to pre-earthquake levels. As well,
organisations indicated that the length of time, after the earthquakes, that it took for the
organisation to return to pre-earthquake levels of revenue is also an indicator of the
organisation’s disaster resilience. Noticeably, these metrics are a mixture of traditional
accounting and intangible measures and can be seen as subjective. Importantly, they translate
into something organisations understand and can use for improvement. Neely et al (2002;
2005) contend that if performance metrics are to be acceptable and useful to organisations,
they must be understandable to the organisation and measure aspects that are of value to the
organisation.
Self-report organisational description of indicators of disaster resilience
Comparing (pre- and post-earthquake) year-on-year performance levels, what was the difference after the disruption of the earthquakes including to revenue, staff and customer retention?
If there was a difference in year-on-year performance, the time it took to return to the path they had planned and were on prior to the earthquakes
Did the organisation sustain the minimum of losses? In light of the disaster, how successful the organisation was at mitigating further losses, of whatever kind
How well the organisation reacted not just in making the right plans and decisions but also in actually implementing those plans and decisions (adaptation). How well the organisation’s
leadership performed was related to this.
In the case of recovering to a minimum state, how far from their target was the organisation?
From the managerial perspective, how well the organisation looked after staff welfare
From the non managerial perspective, how well the organisation treated staff without being prompted
Accumulation, dissemination and use of information
A wide variety of resources needed in the different stages of recovery
Key elements of sectoral recovery and resilience after the Canterbury earthquakes: A system dynamics approach
Hlekiwe Kachali
351
10.3 Contrast of similar indicators of disaster resilience from
quantitative data (using the Benchmark Resilience Tool - BRT)
and from qualitative data (using interview responses)
Following its use after the Canterbury earthquakes, it is highlighted that the Benchmark
Resilience Tool (BRT-53) in its present form does not adequately capture some of the
aspects of organisational resilience that are present in or after disaster (more discussion on
this later in this chapter). For instance, in interviews organisations provided their indicators
of organisational disaster resilience. However, in the BRT-53, these indicators are not
explicitly asked in the way described by organisations. Therefore, it is important to ascertain
the differences between indicators of organisational disaster resilience provided by
organisations and indicators currently contained in the BRT-53. Some of the distinctions
from this analysis will be used in proposing modifications to the existing Benchmark
Resilience Tool (BRT-53) for better capture of organisational disaster resilience attributes.
The indicators proposed by organisations have been categorised into four main areas for the
purposes of comparison. Also, for ease of comparison, the BRT-53 indicator naming
convention (see appendix F) is used here and additional explanation of what the
organisations meant is provided:
Staff (welfare/wellbeing and involvement);
Leadership (ability to delegate and devolved decision making);
Resources (more the availability and acquisition of resources from within and
from without when they are needed and in the quantities required); and
Information and knowledge (however, not coupled as in the BRT).
Staff involvement: staff are an important component in organisational recovery after
disaster. Fallara (2003) states that disaster recovery is a task that requires the assistance and
co-operation of all staff in an organisation. In all interviews after the Canterbury earthquakes,
respondents linked the employee’s welfare to that of their family and community (more
explanation on this is in chapter 6). Several interviewees spoke of employees’ work
performance being affected by the state of their family, friends and community. These are
aspects not captured in the BRT.
Leaders’ ability to delegate and devolved decision making: this arose from respondents
realising that in disaster, decisions might have to be made in a hurry. Several respondents
352 Sectoral and organisational disaster resilience
spoke of indecision being a hindrance in response and recovery. Depending on what needed
to be done, this meant that anyone in the organisation could find themselves having to make
important decisions without conferring with management or other organisational hierarchy.
This sometimes involved making decisions in areas traditionally not the employee’s purview.
Respondents felt that this kind of devolved decision making required the element of trust.
Leaders needed to trust their staff to make decisions to the best of their ability under the
circumstances and also staff needed to trust that there would be no adverse consequences
afterwards. Turner (1976) and Smith (1990), in work on how organisational crises develop
(see chapter 2), show that how a crisis is handled could lead to the escalation of that crisis.
Also related to decision making is the leaders’ ability to delegate. This is an aspect not
sufficiently accounted for in the BRT. Leaders’ ability to delegate ensures that more is
accomplished as the workload is carried by more than just a few people. After the
Canterbury earthquakes, it also reinforced trust within the organisation and made people feel
that they were part of the solution. Kay and Goldspink (2012) in their investigation on CEO
views of organisational resilience found that trust was one of the central tenets in
organisational resilience.
Organisations affected by the Canterbury earthquakes further related that apart from
showing trust, delegation also meant that leaders acknowledged their limitations; that they
did not know everything that was going on and had to rely on other people for some things
to get done. Delegation also ensures there is less chance of individuals overworking which
may make them increasingly inefficient in the long run. Another important aspect of
leadership was knowing the right balance between autocracy and consultation in decision
making in the response phase after the earthquakes.
It was often mentioned that some of those who emerged to lead after the earthquakes did
not have leadership functional roles prior to the earthquakes. For both emergent leaders and
those in traditional leadership roles, respondents spoke of the necessity of caring leaders as
well as of inspired and inspiring leadership. Furthermore, it appears that those in leadership
positions looked after the welfare of other members of staff but it was not clear who looked
into their welfare. This is another facet that needs to be captured in the BRT.
Resources: in this research, this refers to two main sets of resources: those that the
organisation would not necessarily require in business-as-usual, e.g. geotechnical engineering
skills, and (sufficient) resources to maintain the organisation through vastly turbulent times.
Key elements of sectoral recovery and resilience after the Canterbury earthquakes: A system dynamics approach
Hlekiwe Kachali
353
These characteristics need to be considered in organisational disaster resilience and are not
definitively incorporated in the BRT.
From responses in interviews, organisations need to be able to sustain extended periods of
underperformance (if measured using revenue and sales) in the aftermath of disaster as the
system moves to some kind of equilibrium. However, the organisation should still be able to
rebound after this and start to be profitable again. An example from this study would be the
building suppliers sector, many of whom reported revenue losses in the three consecutive
periods they were asked about. This kind of prolonged revenue loss requires large resources
to get through. Alesch et al (2009) showed how organisations can be affected in the long-
term by disaster and that adequate resources are required to get through this period.
However, Comfort et al (2004) caution that vast amount of resources are not the only factor
in surviving disaster. They cite the need for coordination and communication also. These are
aspects that have been discussed in this thesis, especially on the efficient and effective use of
resources (see section 9.4.4).
Information and knowledge: according to respondents, in disaster situations having
knowledge of how or what to do is not the same as having information. In addition, many
people likened knowledge to the tacit kind. They thought of information as what had been
distilled from all the noise that was present after the earthquakes and was useful to them. This
is the reason for information and knowledge not needing to be coupled, as in the BRT, and
should be accorded individual attention. Additionally, organisations reported that after the
earthquakes, new roles and new tasks were defined; this required that the pre-earthquake
channels of communication be modified. Especially tied to information were the notions of
human and social capital. To get information, respondents said they had to know the right
people to speak to. In many cases, networks formed prior to disaster were very useful.
Respondents said it was not enough to form bonds between organisations; it was between
the people in the different organisations that decisions were made. This is not explicit in the
BRT.
10.4 Evolution of the Benchmark Resilience Tool (BRT-53)
The Benchmark Resilience Tool (BRT), like all tools that measure changing concepts, is a
living tool that requires ongoing development. This is to keep up with evolving trends in
organisations and in the environment around them and to make the information obtained
354 Sectoral and organisational disaster resilience
from the tool more useful to them. Using the BRT in disaster enabled the identification of
some indicators necessary for organisational disaster resilience.
Apart from the differences in indicator description given in section 10.3, there are other
aspects, picked up during the course of the research, that should be considered in the
continual improvement of the BRT. Some of these aspects include the length of the BRT-53
and the phrasing of the items. Some respondents spoke of some of the questions in the BRT
as not being suitable to their organisation or to the disaster situation. For example, it was
difficult for smaller organisations to answer questions about organisational departments. In
small- to medium-sized enterprises (SMEs), not all functions are separate processes. Other
ways of improving the BRT as a survey instrument include reversing some of the items. Past
studies on survey design show that reversing some of the items in a survey allows for more
variance in responses (Alwin & Krosnick, 1991).
This section contains outcomes that are analysed and presented as part of this research’s
contribution to the betterment of the BRT. It should be emphasised that this study focuses
on how the BRT can be improved mainly for the purposes of disaster resilience.
Improvements to do with a version of the BRT for different sectors and for different size
organisations as well as to do with reversing the items in the BRT are recommended as
future work. This is because all the improvements discussed require thorough research and
testing which is beyond the scope of this thesis. In summary, what should be included or
thought of in the context of regional disasters for the BRT:
The extent of staff wellbeing. The employee, their family, their community;
Staff wellbeing, both of the leaders and the led;
Community wellbeing, which partly speaks to the BRT indicator external resources but
also emphasises human and social capital;
Networking, to more explicitly include items on individuals within organisations
being the link to cooperation and collaboration inside and outside the organisation
and sector;
Location of organisations as pertains to hazards. This is with the awareness that
organisations can be affected by other disasters that occur far from where they are;
In asking about preparedness and planning, that this is general enough to cover the
broadest range of hazards but must not be agent (hazard) specific;
Key elements of sectoral recovery and resilience after the Canterbury earthquakes: A system dynamics approach
Hlekiwe Kachali
355
More consideration of the organisation’s sector and the goods and services delivered,
how they are delivered, where customers are located;
Pre-disaster situation of the sector or organisation (including community hazard
planning and preparedness);
The extent of disaster. The organisation’s level of resilience alone is not enough as
this interacts with the higher level of disaster resilience which involves many other
actors;
Size of the organisation. Some of the items in the tool are more suited to larger
organisations. This raises the possibility of having different versions of the BRT in
order to suit different size organisations. This can be extended to versions of the
BRT-53 suited to different sectors. However, this might raise issues of cross
comparing being difficult within and outside sectors;
Minimum level of resources for different stages in the response and recovery
process;
The measures of excellence or performance require modification. For those
organisations that are not-for-profits or government departments, a measure of
recovery that is suitable for their organisation. A proposal of this thesis is that in
addition to assigning a measure as is currently done in the BRT, organisations should
be queried on how they measure doing well and that measure should subsequently be
used to track their progress on either side of the time period in which they were
queried. This helps to translate the message that one part of being resilient is for the
organisation to do well whatever it is they do and that traditional measures of
excellence might not after all suffice. It can be argued that an organisation’s version
or definition of resilience involves what they would like to achieve; there is no one-
size-fits-all of organisational resilience. This also means that there is a relationship
between the organisation’s level of resilience and their management techniques.
Further, combining organisational self-report performance indicators with those in
the BRT asking about traditional indicators such as sales growth ensures that there is
some compatibility in results from different organisations; and
Another version of the BRT for disaster situations or an organisational disaster resilience
module to be added to the BRT, taking care that the questionnaire is not time
expensive for respondents (see section 10.4.2 on length of the BRT questionnaire
and some disadvantages when the full suite of items is deployed).
356 Sectoral and organisational disaster resilience
10.4.1 Proposed supplementary organisational disaster resilience module for the
Benchmark Resilience Tool (BRT)
Bringing together several elements in this and in preceding chapters of this thesis: the
quantitative information gleaned from the results of the BRT; the self-report disaster
resilience indicators (section 10.2 and Figure 10-1) from the qualitative interviews with
organisations; the signifiers of recovery (chapter 7); influential system behaviour (chapter 8);
the critical success factors for sectoral recovery (chapter 9) and the possibility to continually
improve the BRT; this section contains some possible items for inclusion in the BRT-53.
These items are to help organisations identify possible areas of improvement for their
disaster resilience. Some of the items are modified forms of existing items in the BRT-53. As
with all survey research and design, the proposed items need to be tested before deployment
as part of the BRT-53 or as a separate survey.
Organisations highlighted the importance of staff in the recovery of the organisation. These
first three questions address the notion that a disaster would not be just one more reason for
staff to leave the organisation:
What is your level of satisfaction at work?;
Please state possible reason(s) you may have for leaving this organisation;
Is there an issue at home, in your neighbourhood or in your community that
affects your ability to do your job?;
Specific to small organisations:
What percentage of your personal wealth is invested in the organisation?;
Do you use personal resources for business purposes or vice versa?;
All other items:
The training provided by the organisation is relevant to the work I do;
Individuals in this organisation interact with others belonging to organisations we
need to cooperate and collaborate with;
Our organisation engages with the community;
Our organisation works with the community in hazard preparation and planning;
Our organisation has identified what resources it can provide or contribute to
staff in the case of a regional disaster;

Key elements of sectoral recovery and resilience after the Canterbury earthquakes: A system dynamics approach
Hlekiwe Kachali
357
Our organisation is aware of local hazards that would lead to disruption of
operations;
Our organisation has prepared for these local hazards;
Our organisation has also prepared and planned for a broad range of hazards;
Our organisation’s hazard plans are adaptable to different situations;
Our organisation regularly simulates disaster scenarios;
Our organisation has identified factors that may cause disruption to the supply
and demand sides of the supply web;
Our organisation has identified the requirement, to consumers affected by a
regional disaster, of our goods and services;
Our organisation would be able to obtain financial and other resources in the
case of prolonged effects of a regional disaster affecting other organisations in
the same area;
Our organisation knows that different resources and skills are required for
different phases before and after a disaster;
Our organisation understands the minimum level of resources required for the
different phases before and after a disaster;
What key performance indicators (KPIs) does your organisation use to monitor
performance?; and
Using those key performance indicators (KPIs) how has your organisation
performed in each of the last 5 years?
10.4.2 Benchmark Resilience Tool-53 (BRT-53) and Benchmark Resilience Tool-
13 (BRT-13)
Other advancements to the BRT contributed by this research include the development and
validation of a short-form of the BRT. The 13 indicators in the BRT combine to give an
organisation’s resilience score: the causal direction is from the indicators of organisational
resilience to the latent construct of resilience. It is a latent construct because it cannot be
measured directly but is instead measured using an aggregation of multiple items. The causal
direction from the indicators to the latent construct suggests that the BRT-53 is a formative
model (Jarvis, MacKenzie, & Podsakoff, 2003). Furthermore, original development of the
BRT-53 involved grouping the items into indicators using measures of internal consistency
and not on their unidimensional ability to measure resilience (see (Stephenson, 2010)).
358 Sectoral and organisational disaster resilience
Hinkin (1998) states that the reliability of a measure should be assessed after
unidimensionality has been established. Unidimensionality as defined by Hattie (1985) is the
existence of a single trait or construct underlying a set of measures. Unidimensionality for a
scale ensures that all the items in the scale are measuring the same construct (in this case
organisational resilience). Internal consistency is a measure of the strength of the correlation
between different items. High measures of internal reliability are not sufficiently justified in
the literature (Gerbing & Anderson, 1988) as a grouping mechanism when unidimensionality
is not achieved. Furthermore, Boyle (1991) writes that a high measure of internal item
consistency may also suggest a high level of item redundancy. In essence, this means that the
same information is asked for in different items which need not be the case.
Consequently, using internal consistency to group the items may not be the most robust for a
formative model such as the BRT. Reasons for this include that if the items are not
unidimensional, it is unclear how the items affect each other. This is because the effects may
be due to a different construct and not the one being measured. Additionally, grouping the
items because they showed a high internal consistency may lead to low item variance, i.e.
highly similar results across items which may be measuring different constructs. This is
evidenced by the similarity in scores across sectors in each individual survey (see chapter 5).
Lastly, these items contained in the BRT were not defined as unique factors, but were among
many other items that showed high reliabilities as well. Using measures of internal
consistency to group items means that some items which did not correlate highly were
discarded and could be a required part in the formation of the latent construct of resilience.
In a formative model such as the BRT, high correlations are not necessarily required between
items. For example, while an organisation may have arrangements with other organisations
for emergency supplies in the event of a crisis, it does not necessarily have to have
arrangements with the community for assistance in recovering post-disaster. Both of these
factors would contribute to that organisation’s access to external resources; however, they do
not necessarily have to be correlated.
The high internal consistency of the items in the BRT contributed to the development of a
shorter version of the tool. The complete version of the BRT (called the BRT-53) contains
53 questions. When combined with questions investigating other phenomena, such as
impacts of the earthquakes, requires a lot of time from respondents. This was the case when
Survey 2 of this study was developed and deployed. As a result of the high internal
consistency of the items and respondent survey fatigue or non-participation, a shorter
Key elements of sectoral recovery and resilience after the Canterbury earthquakes: A system dynamics approach
Hlekiwe Kachali
359
version of the BRT was developed, tested and validated. The shorter version of the tool is
called the BRT-13 and has a single item representing each indicator (see (Z.R. Whitman et
al., 2013)). It was found that the use of BRT-13 could accurately reproduce results when used
in place of the full complement of questions contained in the BRT-53. A shorter
questionnaire makes organisations more amenable to deploying it in their organisations and
can only aid in further development of the concept of organisational resilience. This is one of
the improvements to the BRT that this research has contributed.
10.4.3 REAG and Resilient Organisations: BRT model comparison
In other work, the developers of the BRT-53 (Resilient Organisations Research Programme -
ResOrgs) collaborated with the Resilience Expert Advisory Group (REAG) of Australia. The
REAG and ResOrgs originally had separate but similar sets of indicators. However, the
REAG had a 3-factor model; leadership and culture, change ready and networks. Resilient
Organisations on the other hand, had the 2-factor model made up of the planning and
adaptive capacity.
REAG and Resilient Organisations worked together to align their indicators of resilience
using a common language. The alignment resulted in the adoption of the REAG’s 3-factor
model and some modification to the items. This means that the Resilient Organisations
indicators were re-arranged to fit the REAG model. The alignment resulted in the retention
of the Resilient Organisation’s 13 indicator model, grouped under the REAG’s 3 factors.
For the purposes of the BRT, while this collaboration resulted in some improvements to
indicator names and item wording, as well as the addition of some new items to close
identified gaps, the underlying structure of the BRT remained the same. Table 10-2 shows a
comparison of the factor and organisational resilience scores using the 3-factor REAG and
2-factor Resilient Organisations models for results after Survey 1. The comparisons of the
two models for Surveys 2 and 3 are contained in appendix F.
From the results in Table 10-2, there is no difference in the organisational resilience scores
using either of the models. There is also very little difference in the scores for the individual
factors and indicators. Part of the reason for this was discussed in sections 5.5 and 10.4.2 and
has to do with the use of measures of internal consistency to group the items in the BRT.
This way of grouping items in a formative scale may lead to low item variance and
homogeneity of scores for different organisations.
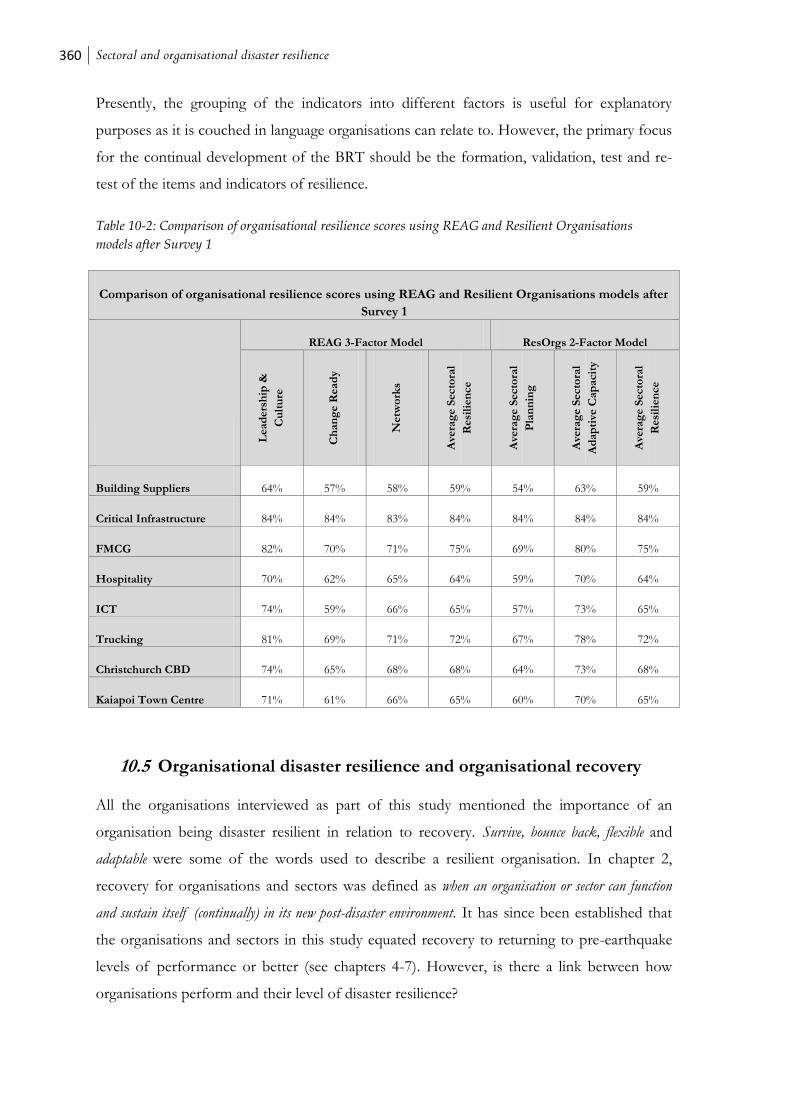
360 Sectoral and organisational disaster resilience
Presently, the grouping of the indicators into different factors is useful for explanatory
purposes as it is couched in language organisations can relate to. However, the primary focus
for the continual development of the BRT should be the formation, validation, test and re-
test of the items and indicators of resilience.
Table 10-2: Comparison of organisational resilience scores using REAG and Resilient Organisations
models after Survey 1
Comparison of organisational resilience scores using REAG and Resilient Organisations models after
Survey 1
REAG 3-Factor Model ResOrgs 2-Factor Model
Lead
ers
hip
&
Cu
ltu
re
Ch
an
ge R
ead
y
Netw
ork
s
Ave
rag
e S
ecto
ral
Resi
lien
ce
Ave
rag
e S
ecto
ral
Pla
nn
ing
Ave
rag
e S
ecto
ral
Ad
ap
tive
Cap
acit
y
Ave
rag
e S
ecto
ral
Resi
lien
ce
Building Suppliers 64% 57% 58% 59% 54% 63% 59%
Critical Infrastructure 84% 84% 83% 84% 84% 84% 84%
FMCG 82% 70% 71% 75% 69% 80% 75%
Hospitality 70% 62% 65% 64% 59% 70% 64%
ICT 74% 59% 66% 65% 57% 73% 65%
Trucking 81% 69% 71% 72% 67% 78% 72%
Christchurch CBD 74% 65% 68% 68% 64% 73% 68%
Kaiapoi Town Centre 71% 61% 66% 65% 60% 70% 65%
10.5 Organisational disaster resilience and organisational recovery
All the organisations interviewed as part of this study mentioned the importance of an
organisation being disaster resilient in relation to recovery. Survive, bounce back, flexible and
adaptable were some of the words used to describe a resilient organisation. In chapter 2,
recovery for organisations and sectors was defined as when an organisation or sector can function
and sustain itself (continually) in its new post-disaster environment. It has since been established that
the organisations and sectors in this study equated recovery to returning to pre-earthquake
levels of performance or better (see chapters 4-7). However, is there a link between how
organisations perform and their level of disaster resilience?
Key elements of sectoral recovery and resilience after the Canterbury earthquakes: A system dynamics approach
Hlekiwe Kachali
361
Organisations explained that one of their fundamental measures of recovery was change in
revenue. From Survey 1 and Survey 2 deployed after the 4 September 2010 and 22 February
2011 earthquakes respectively, there was no significant statistical correlation found between
the organisations’ level of resilience (using BRT-53 scores) and their revenue (see chapter 7
for more detail).
Keeping in mind the time horizon (response and short-term recovery phases) for data
collection, analysis of all the survey data shows that the organisation’s BRT-53 resilience
score was not a predictor of the direction of revenue change for organisations after the
Canterbury earthquakes. For instance, using the case study information for a more detailed
analysis, an organisation from Kaiapoi had a resilience score of 50% (out of a hundred) and
showed a decrease in revenue in all three periods asked about in the study. On the other
hand, a trucking organisation with a 33% resilience score exhibited revenue increases in all
three periods. This again highlights that in the response and short-term recovery phase of a
disaster, the indicators of resilience are different from those in peacetime. Correlations, at the
sectoral level, between the recovery rate coefficient (RRC) and organisational resilience score,
measured using the BRT-53, yielded no significant correlations except for the FMCG (r=-
.580, p<.05) and trucking sectors (r=-.692, p<.05).
Consequently, it is worth investigating the link between an organisation’s disaster resilience
and its performance using some of the indicators described by the respondents (Figure 10-1).
For this, it is important to recall that the fundamental definition of organisational resilience is
that not only did the organisation get through the disaster or crisis, but that they eventually
came out of it well. Authors such as Alpaslan and Mitroff (2004), Hamel and Valikangas
(2003) as well as Seville et al (2008) agree with this view. The organisations in this study have
shown a level of resilience by going through an acute phase in their existence and still
carrying on. For instance, most of the case study organisations had RRC values of -2 after
Survey 2. Nonetheless, none of them at the time of writing had ceased trading. However
there are different levels to how the organisations performed after the earthquakes. Some of
the organisations bounced back to where they were prior to the earthquakes, such as a lot of
the ICT sector. Others managed to bounce forward even and are from different sectors:
trucking, ICT and building suppliers.
362 Sectoral and organisational disaster resilience
10.5.1 Linking disaster resilience and recovery
The organisations in the study experienced a great deal of turbulence after the earthquakes
but persevered and showed resilience51. Using the indicators of disaster resilience as given by
organisations (section 6.5.4 and Figure 10-1), it can therefore be demonstrated that there is a
link between an organisation’s disaster resilience and its recovery after disaster. In addition,
organisational disaster resilience has multiple aspects to it. What is also evident is that the
measures for organisational disaster resilience should align with the short- to long-term
strategy adopted by the organisation post-disaster. This is partly connected to the need for
different resources and skills in the various stages after a disaster event. Organisational
disaster resilience measures should also be in line with the extent of the disaster and some of
the organisational pre-disaster conditions such as sector or economic conditions. This would
make the measures more usable to organisations.
For instance, in asking about staff wellbeing after disaster, their situations away from work
should also be asked about. It should be left to the employee to decide whether to give this
information to their employer. Examples of the scale of a disaster are the localisation of
damage after the 22 February 2011 earthquake and the quick restoration or non-disruption of
service that enabled organisations that could to relocate to other areas of the greater
Christchurch region. In addition, some of the sectoral pre-existing conditions played a part.
For instance, some of the ICT industry was growing prior to the earthquake and some of the
organisations report that their cash flow was good which acted as a buffer for much needed
resources after the earthquakes. However, this buffer was not so large that it could sustain
the organisations involved for extended periods of time. The organisations did not define
what extended meant but it can be concluded that loss of revenue, unless by prior planning, is
never good for the organisation.
Some organisations had alternate premises they found to work from after the earthquakes.
Not all of them were planned for this purpose pre-earthquake, for instance, employees’
homes. This showed quick thinking, ability for adaptation and was helped by the localisation
of earthquake damage and availability of critical services. Other organisations consolidated
branches, those branches affected by the earthquakes and those not so or not at all affected
were merged. This shows an effective and efficient use of resources which become even
more valuable after disaster and could allow the organisation a competitive edge.
51 The hospitality organisation that was closed at the time of writing (July 2012) reported that they intended to re-open.
Key elements of sectoral recovery and resilience after the Canterbury earthquakes: A system dynamics approach
Hlekiwe Kachali
363
10.5.2 Leading versus lagging indicators of organisational disaster resilience
The indicators in Figure 10-1 were reported by organisations after their earthquake
experiences: they are lagging indicators. Lagging indicators come after an event has occurred
and are useful in confirming the occurrence of trends. The organisational self-report
indicators of disaster resilience used in section 10.5.1 on the link between disaster resilience
and recovery are lagging. Leading indicators on the other hand can be used to signal or
predict future events. Therefore, there is a need for the identification of the leading
indicators of disaster resilience if they are to be of use to organisations in future disaster
situations. Using the lagging indicators of organisational resilience reported by the
organisations, it is possible to determine leading indicators of organisational resilience for use
in future. These are contained in Figure 10-2. In the figure, indicators in bold are new
compared to those contained in the BRT-53 while those not in bold are similar to some in
the BRT-53.

364 Sectoral and organisational disaster resilience
*Indicators in bold are new compared to those contained in the BRT-53 while those not in bold are similar to some in the BRT-53
Figure 10-2: Proposed leading indicators of organisational disaster resilience identified from the
organisational self-report lagging disaster resilience indicators
10.6 Sectoral disaster resilience
The definition of industry sector for this thesis is of a group of organisations that operate in
the same segment of the economy or share a similar business type. Furthermore, according
to Porter (2000), organisations from the same sector and in the same location form a cluster.
Porter goes on to demonstrate that the health of the individual organisations is linked to that
of the cluster. The organisations interviewed for this thesis reported that their performance
and existence in Canterbury was tied to that of their sector. As industry sectors are the
building blocks of the economy, this makes sectoral disaster resilience even more important.
Proposed leading indicators of organisational disaster resilience*
Extent of financial reserves and value of organisational assets
The organisation's ability to obtain financing and other resources in the case of a regional disaster
Reliability of supply web
Recognition of skills and resources needed for different stages of the disaster recovery cycle
Trends for staff satisfaction, customer satisfaction and leadership performance
Relevant staff training and staff capability
Level of organisational engagement with community in hazard mitigation and planning
Community preparedness for hazard mitigation, response and recovery
Trends for usability, applicability and efficacy of organisational processes and performance
Accumulation, dissemination and use of relevant information
Trends in organisational innovation from conception to end product
Key elements of sectoral recovery and resilience after the Canterbury earthquakes: A system dynamics approach
Hlekiwe Kachali
365
Additionally, the different ways in which sectors were affected after the earthquakes in
Canterbury demonstrates that industry sector is definitely one of the determinants of
recovery after disaster. Level of effect is also dependent on the kind of disaster (e.g.
earthquake, flood) and on other factors such as the economy. Consequently, some of the
measures for organisational disaster resilience can be applied at the sector level. Alternately, it
is possible to analyse the disaster resilience of a sector from the disaster resilience of the
organisations within it.
For instance, the level of disruption to the sector after the earthquakes, how long before the
sector got going after the earthquakes and the level of sectoral losses compared to pre-
earthquake. After the Canterbury earthquakes, FMCG organisations were greatly disrupted
but most managed to re-open within a few hours to a few days after the earthquakes. This
enabled the minimisation of initial losses while still ensuring that customers were served.
Similarly, the critical infrastructure organisations also mobilised themselves quickly to carry
out repair and restoration.
Discussing disaster resilience at the sectoral level enables the organisations in the sector to
have a common language on the subject. This could enable knowledge sharing and sectoral
minimum disaster resilience standards. For example, organisations got together after the
earthquakes to share best practise. This meant that resources were saved as not all
organisations tried every alternative for themselves. It is not known how long into the
recovery phase this cooperation will last. Regardless, in the event of another crisis of the
same or different magnitude, these links already exist and organisations know who to call on.
Another aspect crucial in sectoral disaster resilience is that of collaboration within and
between sectors. All the geographic sectors in the sample had groups of organisations that
collaborated with each other to ensure that as many of them as possible got back on their
feet. They reported that this was important because a certain level of competition was
healthy and encouraged competitors to do better. They also added that choice was good for
the customer. One Kaiapoi organisation reported that working with another organisation
from Kaiapoi Town Centre enabled them to buy goods in bulk which they could not have
been able to do on their own. In the trucking sector, such was the scale of the demand for
their services that they worked together in some cases even pooling equipment. They also
worked to share the workload. Two of the respondents say they recognised that the job was
366 Sectoral and organisational disaster resilience
extensive and that there was enough work for everyone. Intra- and inter-sectoral
collaboration is a way of ensuring the recovery and survival of the sector post-disaster.
10.7 Chapter summary
Some of the collective wealth of the Canterbury region was depleted when buildings and
other infrastructure were damaged in the 2010-2011 earthquakes. It will take massive
resources, financial, physical, mental and human to replace this loss. Seemingly, some kind of
economic benefit can develop from a disaster when individual businesses and sectors make
new and sometimes better decisions while in the recovery phase. Some of these decisions
include seismically retrofitting organisational premises, diversifying delivery of goods and
services, adding to or improving existing product lines and identifying how they can better
prepare for before and after a disaster. Consequently, this chapter demonstrates that the
organisation’s business-as-usual resilience is only one part of the larger resilience picture.
Organisations also need to be disaster resilient.
This chapter proposes some ways of measuring organisational disaster resilience in addition
to measuring business-as-usual resilience. While lagging indicators of disaster resilience, e.g.
leadership performance and minimisation of staff, customer and financial losses, are useful
for post-disaster analysis, in order to mitigate future crises and disasters, organisations
require leading indicators of disaster resilience. Some of these leading indicators include:
the organisation’s access to a wide and considerable range of resources for prolonged
periods of adversity;
a reliable supply web;
pre-disaster engagement with other stakeholders such as the community and recovery
authorities;
accumulation and utilisation of relevant information;
utility and demand of organisation’s goods and services in disaster,
staff capability (at all levels); and
comprehension of the requirements in the different phases after disaster.
The extent of the Canterbury series of earthquakes was regional. It has been shown that
resilience is context dependent and needs to be worked on constantly, especially in dynamic
circumstances. This also means that organisations and sectors need to adopt an all hazards
approach in assessing risk as no two disasters are alike.

Key elements of sectoral recovery and resilience after the Canterbury earthquakes: A system dynamics approach
Hlekiwe Kachali
367
The next, and final, chapter has the summary and conclusions of this research and some
suggestions for future work.

368 Summary and conclusions
11 Summary and conclusions
The Canterbury series of earthquakes re-affirms the notion that each disaster is unique and has
its own set of recovery challenges. The 4 September 2010 and 22 February 2011 earthquakes in
Canterbury are the manifestation of no two disasters being alike. This shows that the scale of a
disaster should be a consideration in disaster planning, analysis and recovery. Additionally, as
unique a phenomenon as the Canterbury earthquakes are, there are lessons that can be extracted
and used by other organisations, sectors and policy planners that can help them plan for and deal
with disaster. As stated earlier, the frame of reference for this thesis is from the bodies of work
on organisations, crisis management and disaster recovery. This framework, underpinned by the
use of system dynamics analysis and grounded theory, addresses gaps in the literature on:
some of the determinants of recovery, prosperity or failure for organisations and
industry sectors after a major hazard event;
some of the aspects that are important in organisations in the immediate response and
early recovery phase of disaster;
the key characteristics of disaster resilience for organisations and industry sectors as well
as the interlinked nature of organisational and sectoral recovery; and
the development of a systems dynamics recovery framework for organisations and
industry sectors.
The timeframe for this research was concentrated in the two phases following a disaster event:
the response phase and the short-term recovery phase.
11.1 Research findings
In this thesis, it has been shown that different sectors are affected to varying degrees by the
earthquakes. Even within the same sector, organisations are affected dissimilarly. Furthermore,
as shown in chapter 7, there are three broad areas that contribute to organisational and sectoral
vulnerabilities. These are: organisational level attributes, infrastructure used to deliver goods and
services and external environmental factors. The environment being the context in which the
organisation or the sector operates. Distinct combinations of these factors lead to differential
Key elements of sectoral recovery and resilience after the Canterbury earthquakes: A system dynamics approach
Hlekiwe Kachali
369
effects for organisations and sectors which in turn results in sectorally unique individual
signifiers of recovery that have been identified in this work.
This means that in a disaster of a regional nature, the organisation’s characteristics are only one
part of how an organisation can be affected: organisational level attributes include the size of the
organisation and its financial position. Environmental attributes, encompassing conditions and
actions before, immediately after and in the short-term after disaster, all play a crucial role in
understanding organisational and sectoral recovery. Some environmental attributes are the pre-
disaster economic health of the affected region, the post-disaster demand for the organisation’s
goods and services and also interactions with other sectors or organisations.
Organisational location is another feature that can affect recovery; spatial analysis has shown the
effects when organisations in built up areas such as Central Business Districts (CBDs) are
affected by disaster and how this affects neighbouring organisations. Additionally, the
infrastructure organisations rely on to distribute goods and services is susceptible to disaster,
which in turn influences recovery. The infrastructure includes roads, information and
communication technology as well as machinery.
Similarly, organisations and sectors follow different recovery trajectories dependent on the
combination of the three broad areas of vulnerability identified. Elements that influence the
recovery of sectors and organisations include leadership, staff, level of damage to assets,
resource availability and post-disaster requirements for the organisation’s goods and services.
Other contributing elements are organisational size, diversity of product or market, type of
goods and services delivered and favourable ecological conditions such as repaired
infrastructure. Adaptability, availability of the right information as well as human and social
capital have also been shown to be crucial in recovery. In Canterbury a Central Government
employment subsidy was a major element in the recovery of organisations.
Conversely, there are factors that hinder recovery. Findings from this research point to the
persistence and amplification of pre-disaster sectoral trends, e.g. skills shortage, which can affect
recovery. After a regional disaster such as occurred in Canterbury, quick recovery of
organisational and sectoral operations requires a large amount of resources, some of which the
organisation does not have on hand. Specifically, finance for recovery may be difficult to obtain.

370 Summary and conclusions
Other hindrances to recovery include delays in insurance payments, a shortage of skilled labour
and equipment, as well as uncertain operating conditions. Uncertain conditions can be brought
about by lack of information in general, or lack of relevant information in particular. Post-
disaster, if there is a lack of information from credible sources such as experts and recovery
agencies, information from other sources will fill the vacuum and this can be detrimental to
recovery efforts. A logical use of information and communication is an aid in recovery. A further
drawback in recovery is the mismatching of recovery needs and requirements, e.g. finance and
manpower, and when these can be made available and delivered.
Preparedness and planning at the organisational level alone proved to not be enough in shielding
organisations from the effects of disaster. After the earthquakes in Canterbury, organisational
pre-disaster preparedness did not turn out to be the most important factor in recovery.
However, for some sectors, the existence of prior plans was helpful to a limited extent, especially
practised plans. It emerged that prior practising of emergency plans is helpful in so far as
defining actions that may be required in the response phase after a disaster. However, even for
organisations with documented and practised emergency plans, decisions made by agents in the
organisational system’s environment also added to disaster effects. For instance, community or
local authority decisions on seismic retrofitting of unreinforced masonry buildings in the CBD
and town centres.
After the Canterbury earthquakes, there was also evidence of temporal effects occurring in the
different phases after a disaster event. Effects in the response phase are not the same as in the
short-term recovery phase. The different phases require different ways of thinking, different
skillsets and different resources. An understanding of this is of assistance in the allocation of
organisational or sectoral resources for recovery. Specifically from the systems point of view,
there are a lot of reinforcing feedback loops between sectors in the response phase which is
characterised by immense uncertainty. In the short-term recovery phase, some of the reinforcing
feedback loops are broken as organisations and sectors adjust and make recovery decisions
based on the information at hand.
Another finding in this work is that there are multiple stakeholders in recovery (see chapters 6
and 9). For Canterbury, stakeholders whose actions affect each other include the Recovery
Authority, the social community, the business community and local authorities. The post-

Key elements of sectoral recovery and resilience after the Canterbury earthquakes: A system dynamics approach
Hlekiwe Kachali
371
disaster recovery of organisations and sectors depends on the individual choices they make and
also on decisions made by the communities they are part of. Crucially, the Recovery Authority
can influence but cannot determine whether organisations and sectors recover. In such a system,
the perception that organisations, sectors and the community have of clear recovery leadership is
essential. As such, the Recovery Authority can help to create conditions conducive to aiding
organisational and sectoral recovery. One way of achieving this is through the issuing of a clear
statement of the transition from response to short-term recovery to help define the recovery
actions taken by organisations and sectors. Furthermore, there are points of intervention at
which recovery can be effected. The use of policy to achieve recovery aims has been identified as
one way to leverage specific points in the system to aid in recovery. Other points of leverage,
such as clear communication between stakeholders, should also be used to improve and
optimise the functioning of the system.
Finally, this thesis also adds to the body of knowledge on disaster resilience. Organisational
disaster resilience is a growing field and our incremental understanding of it and its crucial
aspects is important. It has been shown that business-as-usual organisational resilience and
organisational disaster resilience are interconnected parts of the overall resilience frame.
Organisational disaster resilience involves many more agents and is associated with the scale or
extent of a disaster.
This thesis has furthered the discussion on possible metrics that organisations and sectors can
use in the development of indicators of disaster resilience. The measures of disaster resilience
provided by respondents from disaster affected organisations in this study are one part of this
subject area. Some of these measures are staff wellbeing which is linked to family and
community wellbeing, leadership ability to delegate to achieve organisational recovery aims,
organisational adeptness at working with external agents, availability and access to a wide range
of resources as well as the use of information and communication in ways that are beneficial to
organisational recovery.
11.2 Research recommendations
Demonstrably, aggregated reporting of the effects of disaster, at national or regional levels, may
conceal the effects to individual sectors and make it difficult to formulate effective recovery
372 Summary and conclusions
programmes. As such, the effects of disaster should be reported for individual sectors and
recovery plans should consider the differential effects. Additionally, from the breadth of agents
listed as influencing recovery, it is advantageous for organisations and sectors to adopt systemic
thinking to assess how they would be affected by a broad range of hazards. Understanding and
working with the structure of a system can be used to influence the behaviour of the system.
In recovery for organisations and sectors, adequate support for staff is necessary as they are a
vital part of recovery efforts. This is for both before and after a disaster event. Support for staff
can also be through work with the community that organisations exist in. Furthermore, after the
experience of the multiple earthquakes in Canterbury, organisations should review the insurance
of their assets, understand the provisions of their insurance policy and ensure appropriate cover.
Organisations, sectors and recovery authorities should aim to reduce or eliminate uncertainty in
order to aid recovery. There should be an effort made to identify needs and requirements and
the timely provision and delivery of these. Similarly, finance is important for recovery. It is
crucial to create conditions that keep money flowing in the economy. Additionally, prior
recognition of what resources will be needed in response and recovery after disaster should be
identified before the eventuation of a disaster.
Recovery from disaster cannot and should not be separated from disaster preparedness and
mitigation. In addition to the existence of documented emergency and business continuity plans,
enactment of these plans is essential. As part of recovery, organisations should aim to objectively
analyse their actions in response and recovery and incorporate these into future preparedness
and planning activities. It is important that these activities are incorporated into plans that are
general enough to be applied in multiple hazards situations. The incorporation of systems
thinking is necessary in all hazard planning, preparation and mitigation activities.
It is of value for organisations and sectors to recognise that the time periods after disaster, i.e.
response and short-term recovery, are different and require different ways of thinking, skillsets
and resources. Existing organisational analysis methods can be employed to help with the
identification of an organisation’s more important elements in recovery. This is one way to make
use of the wealth of knowledge in the wider organisational literature for post-disaster recovery.
Again, these traditional organisational analysis tools should be used in combination with systems
Key elements of sectoral recovery and resilience after the Canterbury earthquakes: A system dynamics approach
Hlekiwe Kachali
373
thinking. Systems thinking and analysis should also be used to recognise potential feedback
loops to counteract the reinforcing feedback loops present in the response phase characterised
by uncertainty.
Another recommendation in this work is that the stakeholders in the recovery effort should be
identified and engaged early in the process. From the experience in Canterbury, the setup and
reporting structure of the Recovery Authority also needs to be considered as this may affect
engagement with other stakeholders. It is important that the Recovery Authority works with
other stakeholders in cooperation to maximise recovery efforts. Successful recovery requires that
stakeholders work towards similar goals. Therefore, articulating clearly the overall recovery
goal(s) for all stakeholders to align with can be of benefit. For the actual recovery process, the
order of planning and execution of the recovery strategy is equally vital. This should incorporate
the balance between measures in the response phase with those in the short-term recovery
phase. It is important to note that many of the decisions made and actions carried out in
recovery can be highly contested at the time. This, however, should not stop the crafting of a
recovery plan with involvement of stakeholders.
In addition, post-disaster recovery policy should be formulated and targeted at specific problems
while also considering the long-term and wider implications. Policy should also be enacted with
the overall goal in mind. As well, in the New Zealand context, the Recovery Manager’s role as
defined by the Ministry of Civil Defence and Emergency Management (MCDEM) should be
effectively utilised during the response phase. This would allow for an assessment of short-,
medium and long-term impacts of decisions made during this initial phase after a disaster. This
may help when making the transition from response to recovery as well as in balancing response
and recovery plans.
While preparedness and business continuity plans may contribute to organisational and sectoral
survival in the short-term after disaster, there is as yet no rehearsed plan for long-term recovery
before an event has occurred. Consequently, disaster resilience is key. The monitoring and
measuring of organisational and sectoral disaster resilience cannot be overemphasised. However,
any such metrics should be understandable and usable by organisations and sectors and aid in
decision making.
374 Summary and conclusions
11.3 Future work
The findings in this thesis are only the start of the documentation into how different industry
sectors are affected by disaster. Future research is needed to identify what other actions
organisations can engage in to prevent or mitigate the effects of disaster. The concept of viewing
organisations and sectors as self-organising systems within the context of larger systems provides
a foundation for further elaboration, discussion and development. The next steps:
11.3.1 Continual improvement of the Benchmark Resilience Tool BRT-53
The BRT-53, like any other tool, requires continuous improvement. Some of the possible
enhancements include reversing some of the questions in BRT-53 to achieve better variance
among respondents; develop different versions of the BRT-53 for organisations with different
characteristics such as sector, size as well as for-profits and not-for-profits; and also develop a
BRT-53 version or a module within the BRT-53 specifically for organisational disaster resilience.
Another research strand involving the BRT-53 is the detailed explanation for all the sectoral
indicator scores after disaster as each organisation and sector may have distinct explanations for
how the indicators relate to them.
11.3.2 Survivor bias
One aspect of this research is that the organisations followed are those that could be contacted
during the course of the study. Consequently, there is a possibility of survivor bias. An area to be
explored further is to track organisations that reported permanent closure or those that intended
to re-open at the time of writing (October 2012). Therefore, future research should incorporate
investigation of organisational and sectoral recovery trajectories at longer times from the
occurrence of the disaster event and using multiple indicators (financial and non-financial) of
organisational recovery.
Apart from tracking organisations that closed, the progress of the recovery process (four, eight
and 10 years from the 4 September 2010 earthquakes) for all the organisations involved in the
study is also important. This can also enable investigation, in the long-term, of how factors such
as the global financial crisis may have had an effect on sectoral medium- to longer-term
recovery.
Key elements of sectoral recovery and resilience after the Canterbury earthquakes: A system dynamics approach
Hlekiwe Kachali
375
11.3.3 Comparison of recovery processes for different disasters
Comparing the recovery process in Christchurch to that after other disasters enables the learning
of what worked in different contexts and how this affected organisational and sectoral recovery.
The findings can be used to deduce if there are any similarities across disasters and if these
similarities can be used to contribute to the development of pre-disaster indicators.
11.3.4 Investigate the interaction of employee, community and organisational
disaster resilience
In this thesis, a crucial finding is that the recovery of organisations and sectors is dependent on
the recovery of staff. However, staff recovery is closely linked to the wellbeing of their families
and communities. The investigation of the interaction between employee, community and
organisational disaster recovery and resilience is one area that merits further attention.
11.3.5 Quantification of the system dynamics models
Lastly, an area requiring further enquiry is the completion and detailed analysis of the quantified
system dynamics diagrams. Quantification of system dynamics models can also help to
determine the effects to the system when certain parameters are modified. The quantified
models can then be used to determine future recovery trajectories which can be compared with
real world scenarios. The results from the quantification and analysis can also be used as input in
policy formulation and disaster recovery planning.

376 References
12 References Ackoff, R.L. (1981). The Art and Science of Mess Management. Interfaces, 20-26. Ackoff, R.L. (2004). Transforming the Systems Movement. Aldrich, D.P. (2008). The Crucial Role of Civil Society in Disaster Recovery and Japan’s
Preparedness for Emergencies. Japan aktuell, 3, 81-96. Aldrich, H.E., & Pfeffer, J. (1976). Environments of organizations. Annual review of sociology, 2, 79-
105. Alesch, D.J., Arendt, L.A., & Holly, J.N. (2009). Managing for long-term community recovery in the
aftermath of disaster: Public Entity Risk Institute. Alesch, D.J., & Holly, J.N. (1996). How to survive the next natural disaster: Lessons for small business
from Northridge victims and survivors. Alesch, D.J., & Holly, J.N. (1998). Small business failure, survival, and recovery: lessons from the January
1994 Northridge Earthquake. Paper presented at the Paper presented at the NEHRP Conference and Workshop on Research on the Northridge, California Earthquake of January 17, 1994.
Alesch, D.J., & Holly, J.N. (2002). Robustness and Resiliency, Ruin and Recovery. Alesch, D.J., Holly, J.N., Mittler, E., & Nagy, R. (2001). Organizations at risk: What happens when
small businesses and not-for-profits encounter natural disasters: Public Entity Risk Institute PERI. Alexander, D.E. (1981). Disaster in Southern Italy: November 1980. Geographical Magazine, 53(9),
553-561. Allen, R., & Toder, F. (2004). A model of organizational recovery. Journal of Emergency
Management, 2(1), 41. Alpaslan, M.C., & Mitroff, I.I. (2004). Bounded Morality: The Relationship Between Ethical
Orientation and Crisis Management, Before and After 9/11. Current Topics in Management, 6, 13-43.
Alwin, D.F., & Krosnick, J.A. (1991). The reliability of survey attitude measurement. Sociological Methods & Research, 20(1), 139-181.
Anderson, W.A. (1969). Disaster and Organizational Change. a Study of the Long-term Consequences in Anchorage of the 1964 Alaska Earthquake: DTIC Document.
AS/NZS ISO 31000:2009. Risk management – Principles and guidelines. Asbjornslett, B.E. (1999). Assess the vulnerability of your production system. Production Planning
& Control, 10(3), 219-229. Asuero, A.G., Sayago, A., & Gonzalez, A.G. (2006). The correlation coefficient: An overview.
Critical reviews in analytical chemistry, 36(1), 41-59. Australian Bureau of Statistics (Producer). (2012, 9 July 2012). Business Longitudinal Survey
(BLS). Retrieved from http://www.abs.gov.au/websitedbs/D3310114.nsf/home/home?opendocument#from-banner=GT
Avery, R.B., Bostic, R.W., & Samolyk, K.A. (1998). The role of personal wealth in small business finance. Journal of Banking & Finance, 22(6-8), 1019-1061.
Bak, P., Tang, C., & Wiesenfeld, K. (1988). Self-organized criticality. Physical review A, 38(1), 364-374.
Barksdale, D. (1998). Disaster recovery response to Tropical Storm Alberto. Disaster Management Programs for Historic Sites, San Francisco and Albury: Association for Preservation Technology (Western Chapter) and The Johnstone Centre, Charles Sturt University, 133-138.

Key elements of sectoral recovery and resilience after the Canterbury earthquakes: A system dynamics approach
Hlekiwe Kachali
377
Bateson, G. (1972). Steps to an Ecology of Mind: University of Chicago Press. Beavan, J., Fielding, E., Motagh, M., Samsonov, S., & Donnelly, N. (2011). Fault location and
slip distribution of the 22 February 2011 MW 6.2 Christchurch, New Zealand, earthquake from geodetic data. Seismological Research Letters, 82(6), 789-799.
Beaver, W.H., & Demski, J.S. (1974). The nature of financial accounting objectives: A summary and synthesis. Journal of Accounting Research, 170-187.
Beer, S. (1989). Viable system model. Viable Systems Model, Wiley, Chicester. Belegundu, A.D., & Chandrupatla, T.R. (1999). Optimization concepts and applications in engineering:
Prentice Hall Upper Saddle River, NJ. Bell, M.A. (2002). The Five Principles of Organizational Resilience. Gartner Research.[Online]. Bengtsson, M., & Kock, S. (2000). Coopetition in Business Networks - to Cooperate and Compete
Simultaneously. Industrial marketing management, 29(5), 411-426. Berger, A., & Udell, G. (1998). The economics of small business finance: The roles of private
equity and debt markets in the financial growth cycle. Berke, P.R., Kartez, J., & Wenger, D. (1993). Recovery after disaster: achieving sustainable
development, mitigation and equity. Disasters, 17(2), 93-109. Berkes, F. (2007). Understanding uncertainty and reducing vulnerability: lessons from resilience
thinking. Natural Hazards, 41(2), 283-295. Bhamidipati, K. (Producer). (2010, 31 December 2010). Would You Build a House Without a
Blueprint? Managing the Requirements and Design Phases of Your Application Projects. Retrieved from http://sapinsider.wispubs.com/Article/Would-You-Build-a-House-Without-a-Blueprint--Managing-the-Requirements-and-Design-Phases-of-Your-Application-Projects/5458
Birkland, T.A., Herabat, N.Y.P., Little, R.G., & Wallace, W. (2005). Impact of the Boxing Day Tsunami on Tourism in Thailand.
Blaikie, P.M. (1994). At risk: natural hazards, people's vulnerability, and disasters: Psychology Press. Boisot, M., & Child, J. (1999). Organizations as adaptive systems in complex environments: The
case of China. Organization Science, 10(3), 237-252. Bolin, R.C. (1994). Household and community recovery after earthquakes: Institute of Behavioral
Science, University of Colorado Boulder, CO. Bolin, R.C., & Stanford, L. (1991). Shelter, housing and recovery: A comparison of US disasters.
Disasters, 15(1), 24-34. Bolin, R.C., & Stanford, L. (1998). The Northridge earthquake: Vulnerability and disaster: Routledge. Borgatti, S. (2004). Introduction to grounded theory, Analytic technologies. Box, G.E.P., & Draper, N.R. (1987). Empirical model-building and response surfaces: John Wiley &
Sons. Boyle, G.J. (1991). Does item homogeneity indicate internal consistency or item redundancy in
psychometric scales? Personality and individual differences, 12(3), 291-294. Bradley, B.A. (2012). Ground Motion and Seismicity Aspects of the 4 September 2010 Darfield
and 22 February 2011 Christchurch Earthquakes. Brewer, N.T., Weinstein, N.D., Cuite, C.L., & Herrington, J.E. (2004). Risk perceptions and their
relation to risk behavior. Annals of Behavioral Medicine, 27(2), 125-130. Bruneau, M., Chang, S.E., Eguchi, R.T., Lee, G.C., O'Rourke, T.D., Reinhorn, A.M., . . . von
Winterfeldt, D. (2003). A framework to quantitatively assess and enhance the seismic resilience of communities. Earthquake Spectra, 19, 733.
378 References
Bruns, W. (1998). Profit as a performance measure: powerful concept, insufficient measure. Paper presented at the Theory and Practice: the First International Conference on Performance Measurement, Cambridge.
Buchanan, B. (Producer). (2011, 9th June 2012). Christchurch earthquake redraws retail property map. [Article] Retrieved from http://www.tower.co.nz/investments/news/property/2011/christchurch-earthquake-redraws-retail-property-map
Bunge, M. (1985). Treatise on Basic Philosophy: Epistemology and Methodology III: Philosophy of Science and Technology, Pt I-Formal and Physical Sciences (Vol. 7): Reidel.
Campbell, DT, & Fiske, DW. (1998). Convergent and discriminant validation by the multitrait-multimethods matrix. Personality, 56, 162.
Canis, B. (2011). The Motor Vehicle Supply Chain: Effects of the Japanese Earthquake and Tsunami. Congressional Research Service.
Cannon, M.D., & Edmondson, A.C. (2005). Failing to Learn and Learning to Fail (Intelligently): How Great Organizations Put Failure to Work to Innovate and Improve. Long range planning, 38(3), 299-319.
Canterbury Economic Development Co. Ltd. (2009). Canterbury Regional Economic Development Strategy (CREDS) 2005 – 2015. Christchurch.
Canterbury Engineering Lifelines Group. (1997). Risks and Realities: A Multidisciplinary Approach to the Vulnerability of Lifelines to Natural Hazards
Canterbury Engineering Lifelines Group (2011). [Costs Saved After Seismic Reinforcement of Major Assets].
Careers New Zealand. (2011a). Residential building sector struggles in 2011. Careers New Zealand. (2011b). Recession affects demand for staff in some areas of hospitality. Carpenter, S.R., Walker, B., Anderies, J.M., & Abel, N. (2001). From metaphor to measurement:
resilience of what to what? Ecosystems, 4(8), 765-781. Carroll, A.B. (1991). The pyramid of corporate social responsibility: toward the moral
management of organizational stakeholders. Business horizons, 34(4), 39-48. Carroll, J.S., & Fahlbruch, B. The gift of failure: New approaches to analyzing and learning from
events and near-misses.î Honoring the contributions of Bernhard Wilpert. Safety Science, 49(1), 1-4.
Central City Business Association (Producer). (2011, 9 July 2012). Christchurch Central City. Retrieved from http://www.christchurchcity.org.nz/index.php
Chakravarthy, B.S. (1986). Measuring strategic performance. Strategic Management Journal, 7(5), 437-458.
Chamlee-Wright, E., & Storr, V. (2008). The Entrepreneur’s Role in Post-Disaster Community Recovery: Implications for Post-Disaster Recovery Policy. Mercatus Policy Series.
Chang-Richards, A.Y., Seville, E.P., Wilkinson, S., & Brunsdon, D. (2012). Resourcing Issues in Past Disaster Recoveries: Some Perspectives.
Chang, S.E. (1983). Disasters and Fiscal Policy: Hurricane Impact on Municipal Revenue. Urban Affairs Review, 18(4), 511-523.
Chang, S.E. (2010). Urban disaster recovery: a measurement framework and its application to the 1995 Kobe earthquake. Disasters, 34(2), 303-327.
Chang, S.E., & Falit-Baiamonte, A. (2002). Disaster vulnerability of businesses in the 2001 Nisqually earthquake. Global Environmental Change Part B: Environmental Hazards, 4(2), 59-71.
Chang, S.E., & Miles, S.B. (2004). 10 The Dynamics of Recovery: A Framework. Modeling spatial and economic impacts of disasters, 181.

Key elements of sectoral recovery and resilience after the Canterbury earthquakes: A system dynamics approach
Hlekiwe Kachali
379
Chang, S.E., & Nojima, N. (2001). Measuring post-disaster transportation system performance: the 1995 Kobe earthquake in comparative perspective. Transportation research part A: policy and practice, 35(6), 475-494.
Chang, S.E., Rose, A., Shinozuka, M., Svekla, W.D., & Tierney, K.J. (2000). Modeling earthquake impact on urban lifeline systems: advances and integration.
Chang, S.E., & Shinozuka, M. (2004). Measuring improvements in the disaster resilience of communities. Earthquake Spectra, 20(3), 739-755.
Chang, S.E., Svekla, W.D., & Shinozuka, M. (2002). Linking infrastructure and urban economy: simulation of water-disruption impacts in earthquakes. Environment and Planning B, 29(2), 281-302.
Charmaz, K. (2003). Qualitative interviewing and grounded theory analysis. Inside interviewing: New lenses, new concerns, 311-330.
Checkland, P.B., & Haynes, M.G. (1994). Varieties of systems thinking: the case of soft systems
methodology. System Dynamics Review, 10(2‐3), 189-197.
Choi, TY, Dooley, KJ, & Rungtusanatham, M. (2001). Supply networks and complex adaptive systems: control versus emergence. Journal of Operations Management, 19(3), 351-366.
Christopher, M. (2000). The Agile Supply Chain: Competing in Volatile Markets. Industrial marketing management, 29(1), 37-44.
Christopher, M., & Peck, H. (2004). Building the resilient supply chain. International Journal of Logistics Management, The, 15(2), 1-14.
Christopher, M., & Rutherford, C. (2004). Creating supply chain resilience through agile six sigma. Critical Eye, 24ñ28.
Churchman, C.W. (1979). The systems approach and its enemies: Basic Books New York. Clarke, L.B. (1991). Acceptable risk?: Making decisions in a toxic environment: Univ of California Press. Clarke, L.B. (2001). Mission improbable: Using fantasy documents to tame disaster: University of Chicago
Press. Coburn, A.W., Spence, R.J., & Pomonis, A. (1991). Vulnerability and risk assessment.
UNDP/UNDRO Training Module. Collins, J. (2001). Good to Great. Retrieved 13 January 2011, 2011, from
http://www.jimcollins.com/article_topics/articles/good-to-great.html Comerio, M.C. (1997). Housing issues after disasters. Journal of Contingencies and crisis management,
5(3), 166-178. Comerio, M.C. (2011). Observations from Mary Comerio. Comfort, L.K. (1999). Shared risk: Complex systems in seismic response: Pergamon. Comfort, L.K. (2005). Risk, security, and disaster management. Political Science, 8. Comfort, L.K., Ko, K., & Zagorecki, A. (2004). Coordination in rapidly evolving disaster
response systems. American Behavioral Scientist, 48(3), 295. Comfort, L.K., Sungu, Y., Johnson, D., & Dunn, M. (2001). Complex systems in crisis:
anticipation and resilience in dynamic environments. Journal of Contingencies and crisis management, 9(3), 144-158.
Comfort, L.K., Wisner, B., Cutter, S., Pulwarty, R., Hewitt, K., Oliver-Smith, A., . . . Krimgold, F. (1999a). Reframing disaster policy: the global evolution of vulnerable communities. Environmental Hazards, 1(1), 39-44.
Comfort, L.K., Wisner, B., Cutter, S.L., Pulwarty, R., Hewitt, K., Oliver-Smith, A., . . . Krimgold, F. (1999b). Reframing disaster policy: the global evolution of vulnerable communities. Environmental Hazards, 1(1), 39-44.
380 References
Cook, R. (1998). How complex systems fail. Cognitive Technologies Laboratory, University of Chicago. Chicago IL.
Coopers & Lybrand. (1997). Liability and Insurance - Infrastructure and Assurance: President's Commission on Critical Infrastructure Protection (PCCIP).
Corey, C.M., & Deitch, E.A. (2011). Factors affecting business recovery immediately after Hurricane Katrina. Journal of Contingencies and crisis management, 19(3), 169-181.
Cornell, J.A., & Berger, R.D. (1987). Factors that influence the value of the coefficient of determination in simple linear and nonlinear regression models. Phytopathology, 77(1), 63.
Couto, R.A. (1989). Economics, Experts, and Risk: Lessons from the Catastrophe at Aberfan. Political Psychology, 10(2), 309-324.
Coyle, R.G. (1977). Management System Dynamics (Vol. 6): Wiley New York. Craighead, C.W., Blackhurst, J., Rungtusanatham, M.J., & Handfield, R.B. (2007). The severity of
supply chain disruptions: design characteristics and mitigation capabilities. Decision Sciences, 38(1), 131-156.
Cruz, A.M., & Steinberg, L.J. (2005). Industry preparedness for earthquakes and earthquake-triggered hazmat accidents in the 1999 Kocaeli earthquake. Earthquake Spectra, 21, 285.
Cutcliffe, J.R. (2000). Methodological issues in grounded theory. Journal of advanced nursing, 31(6), 1476-1484.
Daellenbach, H.G. (1994). Systems and decision making: a management science approach: Wiley New York.
Dahlhamer, J.M., & Reshaur, L. (1996). Businesses and the 1994 Northridge earthquake: An analysis of pre-and post-disaster preparedness.
Dahlhamer, J.M., & Tierney, K.J. (1996). Winners and losers: predicting business disaster recovery outcomes following the Northridge earthquake.
Dahlhamer, J.M., & Tierney, K.J. (1998). Rebounding from disruptive events: Business recovery following the Northridge earthquake. Sociological Spectrum, 18(2), 121-141.
Dantas, A., Seville, E.P., & Nicholson, A. (2006). Information sharing during disaster: Can we do better?
Davenport, T.H., & Stoddard, D.B. (1994). Reengineering: business change of mythic proportions? MIS quarterly, 121-127.
Dawson, S. (1992). Analysing Organisations: Macmillan. Denzin, N. (2009). The research act: A theoretical introduction to sociological methods: Aldine De Gruyter. Dervitsiotis, K.N. (2003). The pursuit of sustainable business excellence: Guiding
transformation for effective organizational change. Total Quality Management & Business Excellence, 14(3), 251-267.
Dervitsiotis, K.N. (2004). Navigating in Turbulent Environmental Conditions for Sustainable Business Excellence. Total Quality Management & Business Excellence, 15(5), 807-827.
Dietch, E.A., & Corey, C.M. (2011). Predicting long-term business recovery four years after Hurricane Katrina. Management Research Review, 34(3), 311-324.
Dietz, T., Dolsak, N., Ostrom, E., & Stern, P.C. (2002). The drama of the commons. The drama of the commons, 3ñ35.
Diggle, P. (2002). Analysis of longitudinal data (Vol. 25): Oxford University Press, USA. Dodge, H.R., Fullerton, S., & Robbins, J.E. (1994). Stage of the organizational life cycle and
competition as mediators of problem perception for small businesses. Strategic Management Journal, 15(2), 121-134.
Dooley, K.J. (1997). A complex adaptive systems model of organization change. Nonlinear Dynamics, Psychology, and Life Sciences, 1(1), 69-97.
Key elements of sectoral recovery and resilience after the Canterbury earthquakes: A system dynamics approach
Hlekiwe Kachali
381
Dovers, S.R., & Handmer, J.W. (1992). Uncertainty, sustainability and change. Global Environmental Change, 2(4), 262-276.
Durkin, M.E. (1984). The economic recovery of small businesses after earthquakes: The Coalinga experience: Vigyan Bhavan (Government House).
Dynes, R.R. (1974). Organized behavior in disaster: Disaster Research Center, Ohio State University.
Dyson, K. (1983). The cultural, ideological and structural context. Industrial Crisis; A Comparative Study of the State and Industry, Oxford, 26-66.
Earthquake Commission. (2011). EQC's earthquake liability revised upwards - Finance Minister Bill English. Christchurch: Earthquake Commission Retrieved from http://canterbury.eqc.govt.nz/news/release/2011/08/eqcs-earthquake-liability-revised-upwards-finance-minister-bill-english.
Eden, C., & Ackermann, F. (2001). Strategic options development and analysis: The principles. Edmunds, R., Feldman, J.A., Hicks, B.J., & Mullineux, G. (2010). Constraint-based modelling
and optimization to support the design of complex multi-domain engineering problems. Engineering with Computers, 1-18.
Eidinger, J., Tang, A., & O'Rourke, T. (2010). Report of the 4 September 2010 Mw 7.1 Canterbury (Darfield), New Zealand Earthquake (pp. 1-49).
Eisenhardt, K.M. (1989). Building theories from case study research. Academy of Management Review, 532-550.
Eisenhardt, K.M., & Graebner, M.E. (2007). Theory building from cases: Opportunities and challenges. Academy of Management Journal, 50(1), 25.
Elms, D.G. (1985). The principle of consistent crudeness. Elms, D.G. (1998). System health approaches for risk management and design. Structural Safety
and Reliability: Proc. ICOSSAR, 97, 271-277. Elms, D.G., Dewhirst, R., McCahon, I., & Kachali, H. (2012). Grey District Readiness for a
Major Catastrophic Event. Evan, W.M. (1965). The Organisation Set: Toward a Theory of Interorganisational Relations.
Management Science, 11(10), 217-230. Evan, W.M. (1978). Interorganizational relations: selected readings: Univ of Pennsylvania Pr. Evan, W.M., & Black, G. (1967). Innovation in business organizations: some factors associated
with success or failure of staff proposals. Journal of business, 40(4), 519-530. Exner, O., & Zvara, K. (1999). Coefficient of determination in some atypical situations: use in
chemical correlation analysis. Journal of physical organic chemistry, 12(2), 151-156. Fallara, P. (2003). Disaster recovery planning. Potentials, IEEE, 22(5), 42-44. Faulkner, B. (2003). Towards a framework for tourism disaster management. Progressing Tourism
Research. Clevedon, S, 244-268. Ferrier, W.J., Smith, K.G., & Grimm, C.M. (1999). The role of competitive action in market
share erosion and industry dethronement: A study of industry leaders and challengers. Academy of Management Journal, 42(4), 372-388.
Fiksel, J. (2006). Sustainability and resilience: toward a systems approach. Sustainability: Science Practice and Policy, 2(2), 14-21.
Finch, P. (2004). Supply Chain Risk Management. Supply Chain Management: An International Journal, 9(2), 183-196.
Fink, S.L., Beak, J., & Taddeo, K. (1971). Organizational crisis and change. The Journal of Applied Behavioral Science, 7(1), 15.

382 References
Flood, R.L., & Romm, N.R.A. (1996). Critical systems thinking: current research and practice: Springer. Folke, C., Carpenter, S.R., Elmqvist, T., Gunderson, L., Holling, C.S., & Walker, B. (2002).
Resilience and sustainable development: building adaptive capacity in a world of transformations. AMBIO: A journal of the human environment, 31(5), 437-440.
Folke, C., Carpenter, S.R., Walker, B., Scheffer, M., Elmqvist, T., Gunderson, L., & Holling, C.S. (2004). Regime shifts, resilience, and biodiversity in ecosystem management. Annual Review of Ecology, Evolution, and Systematics, 35, 557-581.
Forrester, J.W. (1969). Urban dynamics. Forrester, J.W. (1994). System dynamics, systems thinking, and soft OR. System Dynamics Review,
10(2‐3), 245-256.
Foster, H.D. (1997). The Ozymandias Principles: Thirty-one strategies for surviving change: Southdowne Press.
Foster, S.P., & Dye, K. (2005). Building continuity into strategy. Journal of Corporate Real Estate, 7(2), 105-119.
Freudenberg, M. (2003). Composite indicators of country performance: a critical assessment: OECD Publishing.
Furlong, S.R., & Scheberle, D. (1998). Earthquake Recovery. The American Review of Public Administration, 28(4), 367.
Galbraith, C.S., & Stiles, C.H. (2006). Disasters and entrepreneurship: A short review. Developmental Entrepreneurship: Adversity, Risk, and Isolation, 5, 147-166.
Geonet. (2010). Earthquake, http://www.geonet.org.nz/earthquake/index.html. GeoNet. (2011). M 6.3, Christchurch, February 22 2011. Christchurch. Gerbing, D.W., & Anderson, J.C. (1988). An updated paradigm for scale development
incorporating unidimensionality and its assessment. Journal of marketing research, 186-192. Gharajedaghi, J. (1999). Systems thinking: Managing chaos and complexity: A platform for designing
business architecture: Elsevier. Giovinazzi, S., & Wilson, T. (2012). “Recovery of Lifelines” following the 22nd February 2011
Christchurch Earthquake: successes and issues. NZSEE. Gladwell, M. (2000). The tipping point: How little things can make a big difference: Little, Brown and
Company. Glaser, B.G., & Strauss, A.L. (1967). The discovery of grounded theory: Strategies for qualitative research:
Aldine de Gruyter. Godschalk, D.R. (2003). Urban hazard mitigation: Creating resilient cities. Natural Hazards
Review, 4, 136. Godschalk, D.R., & Brower, D.J. (1985). Mitigation strategies and integrated emergency
management. Public Administration Review, 45, 64-71. Goldratt, E.M., & Cox, J. (1989). The goal: Gower. Gordon, P., Richardson, H.W., & Davis, B. (1998). Transport-related impacts of the Northridge
earthquake. Journal of Transportation and Statistics, 1(2), 21-36. Graham, A.K. (2001). Challenge your balanced scorecard. Credit Union Executive Journal, 41(3), 22-
27. Gunasekaran, A., Love, P.E.D., Rahimi, F., & Miele, R. (2001). A model for investment
justification in information technology projects. International Journal of Information Management, 21(5), 349-364.
Guthrie, J.P. (2001). High-involvement work practices, turnover, and productivity: Evidence from New Zealand. Academy of management Journal, 180-190.
Haas, J.E., Kates, R.W., & Bowden, M.J. (1977). Reconstruction following disaster.
Key elements of sectoral recovery and resilience after the Canterbury earthquakes: A system dynamics approach
Hlekiwe Kachali
383
Hall, A.D. (1962). A methodology for systems engineering. Hamel, G., & Prahalad, C.K. (1996). Competing for the Future: Harvard Business Press. Hamel, G., & Välikangas, L. (2003). The Quest for Resilience. Harvard Business Review, 81(9), 52-
65. Hammer, M., Champy, J., Daniels, A.C., James, P.O.S., & Hughes, A.M. (1994). Reengineering the
corporation: Harper Business New York. Handler, W.C., & Kram, K.E. (2004). Succession in family firms: The problem of resistance.
Family Business Review, 1(4), 361-381. Handmer, J.W., & Dovers, S.R. (1996). A typology of resilience: rethinking institutions for
sustainable development. Organization & Environment, 9(4), 482. Harland, C.M. (1996). Supply chain management: relationships, chains and networks. British
Journal of management, 7, S63-S80. Harter, R., Petty, J., & Kelly, J. (2006). Conducting Surveys when Disaster Strikes. Haviland, W.A., Walrath, D., & El Prins, H. (2007). Cultural Anthropology The Human Challenge:
Thomson Learning. Heinrich, H.W., Petersen, D., & Roos, N. (1950). Industrial accident prevention: McGraw-Hill New
York. Heinzl, H., & Mittlbock, M. (2003). Pseudo R-squared measures for Poisson regression models
with over-or underdispersion. Computational statistics & data analysis, 44(1), 253-271. Helmreich, R.L., Klinect, J.R., & Wilhelm, J.A. (1999). Models of threat, error, and CRM in flight
operations. Hewitt, K. (1997). Regions of risk: A geographical introduction to disasters: Longman Harlow. Hills, A. (2002). Seduced by recovery: The consequences of misunderstanding disaster. Journal of
Contingencies and Crisis Management, 6(3), 162-170. Holland, J.H. (1992). Complex adaptive systems. Daedalus, 121(1), 17-30. Holling, C.S. (1973). Resilience and stability of ecological systems. Annual review of ecology and
systematics, 4, 1-23. Hollnagel, E., Woods, D.D., & Leveson, N.G. (2006). Resilience engineering: Concepts and precepts:
Ashgate Pub Co. Hopkins, A. (2007). The Problem of Defining High Reliability Organisations. National Reseatch
Centre for OHS Regulation-Working Paper, 51, 1-15. Horne, J.F., & Orr, J.E. (1998). Assessing behaviors that create resilient organizations.
Employment Relations Today, 24, 29-40. Hummel, R., Ahlers, D., Science, Belfer Center for, & Affairs, International. (2007). Lessons from
Katrina: How a Community Can Spearhead Successful Disaster Recovery: The Broadmoor Project, Belfer Center for Science and International Affairs, John F. Kennedy School of Government, Harvard University.
Hunton, J.E., Libby, R., & Mazza, C.L. (2006). Financial reporting transparency and earnings management. Accounting Review, 135-157.
Isaac, A. (1997). The Cave Creek incident: a REASONed explanation. The Australasian Journal of Disaster and Trauma Studies, 3.
Jacques, R. (1996). Manufacturing the employee: Management knowledge from the 19th to 21st centuries: Sage Publications Ltd.
Jaeger, P.T., Shneiderman, B., Fleischmann, K.R., Preece, J., Qu, Y., & Fei Wu, P. (2007). Community response grids: E-government, social networks, and effective emergency management. Telecommunications Policy, 31(10-11), 592-604.
384 References
Jarvis, C.B., MacKenzie, S.B., & Podsakoff, P.M. (2003). A critical review of construct indicators and measurement model misspecification in marketing and consumer research. Journal of consumer research, 30(2), 199-218.
Jensen, A.R. (1980). Bias in mental testing. Jick, T.D. (1979). Mixing qualitative and quantitative methods: Triangulation in action.
Administrative Science Quarterly, 602-611. Johannessen, J.A. (1998). Organisations as social systems: the search for a systemic theory of
organisational innovation processes. Kybernetes, 27(4), 359-387. Johnson, J. (2013). Safeguarding New Zealand’s Economy and Communities – Insurance
Industry Opportunities and Challenges. http://icnz.org.nz/safeguarding-new-zealands-economy-and-communities-insurance-industry-opportunities-and-challenges/
Johnson, R.A., Kast, F.E., & Rosenzweig, J.E. (1964). Systems theory and management. Management Science, 10(2), 367-384.
Jolly, A. (Ed.). (2003). Managing Business Risk: A practical guide to protecting your business. Kachali, H., Stevenson, J.R., Whitman, Z.R., Seville, E.P., Vargo, J.J., & Wilson, T.M. (2012).
Organisational Resilience and Recovery for Canterbury Organisations after the 4 September 2010 Earthquake. Australasian Journal of Disaster and Trauma Studies, 2012(1), 11-19.
Kaiapoi Promotion Association Inc (Producer). (2012, 9 July 2012). Brief history. Retrieved from http://www.kaiapoi.org.nz/brief-history.html
Kanji, G.K. (1998). Measurement of business excellence. Total Quality Management & Business Excellence, 9(7), 633-643.
Kanji, G.K., & Moura e Sa, P. (2001). Measuring leadership excellence. Total Quality Management & Business Excellence, 12(6), 701-718.
Kanji, G.K., & Wallace, W. (2000). Business excellence through customer satisfaction. Total Quality Management & Business Excellence, 11(7), 979-998.
Kaplan, R.S., & Garrick, B.J. (1981). On the quantitative definition of risk. Risk analysis, 1(1), 11-27.
Kaplan, R.S., & Norton, D.P. (1992). The balanced scorecard-measures that drive performance. Harvard Business Review, 70(1), 71-79.
Kaplan, R.S., & Norton, D.P. (1996a). Using the balanced scorecard as a strategic management system. Harvard Business Review, 74(1), 75-85.
Kaplan, R.S., & Norton, D.P. (1996b). The balanced scorecard: Translating strategy into action: Harvard Business Press.
Kaplan, R.S., & Norton, D.P. (2004b). Measuring the strategic readiness of intangible assets. Harvard Business Review, 82(2), 52-63.
Kates, R.W., & Pijawka, D. (1977). From rubble to monument: the pace of reconstruction. Reconstruction Following Disaster, 1–23.
Kay, R., & Goldspink, C. (2012). Research paper 1: CEO perspectives on organisational resilience.
Kelly, D., & Amburgey, T.L. (1991). Organizational inertia and momentum: A dynamic model of strategic change. Academy of Management Journal, 34(3), 591-612.
Kelly, K. (1995). Out of control: Addison-Wesley Reading, Mass. Khatri, N., & D'Netto, B. (1995). Perceived uncertainty and performance: the causal direction: Nanyang
Technological University, School of Accountancy and Business. Kim, D.H. (1996). The link between individual and organizational learning. How Organizations
Learn–Managing the Search for Knowledge, 29-50.

Key elements of sectoral recovery and resilience after the Canterbury earthquakes: A system dynamics approach
Hlekiwe Kachali
385
Kleindorfer, P.R., & Saad, G.H. (2005). Managing disruption risks in supply chains. Production and Operations Management, 14(1), 53-68.
Knight, R.F., & Pretty, D.J. (1996). The impact of catastrophes on shareholder value: Templeton College.
Kondrasuk, J.N. (2004). The effects of 9/11 and terrorism on human resource management: Recovery, reconsideration, and renewal. Employee Responsibilities and Rights Journal, 16(1), 25-35.
Korsching, P.F., & Allen, J.C. (2004). Locality based entrepreneurship: A strategy for community economic vitality. Community Development Journal, 39(4), 385.
Kroll, C.A. (1991). Economic impacts of the Loma Prieta earthquake: A focus on small business: Center for Real Estate and Urban Economics, University of California, Berkeley.
Kroll, C.A., Landis, J.D., Shen, Q., & Stryker, S. (1991). Economic impacts of the Loma Prieta Earthquake: a focus on small businesses. In U. C. T. C. a. t. C. f. R. E. a. U. Economics (Ed.). Berkeley, CA: University of California at Berkeley.
Kruse, C. (1993). Disaster plan stands test of hurricane. Personnel Journal, 72(6), 36-36. Kunreuther, H. (1996). Mitigating disaster losses through insurance. Journal of risk and Uncertainty,
12(2), 171-187. Kunreuther, H. (2006). Has the time come for comprehensive natural disaster insurance? On
Risk and Disaster: Lessons from Hurricane Katrina, 175, 175. Kunreuther, H. (2008). Reducing losses from catastrophic risks through long-term insurance and
mitigation. Social Research: An International Quarterly, 75(3), 905-930. Kunreuther, H., & Fiore, E.S. (1966). The Alaskan earthquake: A case study in the economics of
disaster: DTIC Document. Kvale, S. (1996). InterViews. An introduction to qualitative research writing: Sage Publications,
Thousand Oaks, CA. Kvalseth, T.O. (1985). Cautionary note about R2. American Statistician, 279-285. La Porte, T.R., & Consolini, P.M. (1991). Working in practice but not in theory: theoretical
challenges of" high-reliability organizations". Journal of Public Administration Research and Theory, 1(1), 19.
Lambert, D.M., & Cooper, M.C. (2000). Issues in supply chain management. Industrial marketing management, 29(1), 65-83.
Lansing, J.S. (2003). Complex adaptive systems. Annual Review of Anthropology, 32, 183-204. Laplante, P. A. (2007). What every engineer should know about software engineering: CRC Press. Lebel, L., Anderies, J.M., Campbell, B., Folke, C., Hatfield-Dodds, S., Hughes, T.P., & Wilson, J.
(2006). Governance and the capacity to manage resilience in regional social-ecological systems. Ecology and Society, 11(1), 19.
Lee, A.V., Vargo, J.J., & Seville, E.P. (2013). Developing a Tool to Measure and Compare Organizations’ Resilience. Natural Hazards Review, 14(1), 29-41.
Lee Rodgers, J., & Nicewander, W.A. (1988). Thirteen ways to look at the correlation coefficient. The American Statistician, 42(1), 59-66.
Lengnick-Hall, C.A., & Beck, T.E. (2005). Adaptive fit versus robust transformation: How organizations respond to environmental change. Journal of Management, 31(5), 738.
Levers, J., & Bhatia, S. (2011). Recovery as a Catalyst for Reducing Risk International Recovery Platform Global Assessment Report 2011: International Recovery Platform.
Leveson, N.G. (1986). Software safety: Why, what, and how. ACM Computing Surveys (CSUR), 18(2), 163.

386 References
Leveson, N.G. (2002). System safety engineering: Back to the future. Massachusetts Institute of Technology.
Leveson, N.G. (2010). Applying systems thinking to analyze and learn from events. Safety Science. Leveson, N.G., Dulac, N., Marais, K., & Carroll, J. (2009). Moving beyond normal accidents and
high reliability organizations: a systems approach to safety in complex systems. Organization Studies, 30(2-3), 227-249.
Levin, S.A. (1998). Ecosystems and the biosphere as complex adaptive systems. Ecosystems, 1(5), 431-436.
Lindgreen, A., & Swaen, V. (2010). Corporate social responsibility. International Journal of Management Reviews, 12(1), 1-7.
Maguire, B. (2007). Disasters and communities: understanding social resilience. Australian Journal of Emergency Management, 22(2), 16-20.
Majumder, S. (2005). Sri Lanka's tourism beset by problems, BBC. Retrieved from http://news.bbc.co.uk/2/hi/south_asia/4360771.stm
Malotaux, N. (2008). Recognizing and Understanding Human Behavior to Improve Systems Engineering Results. In N. R. Malotaux-Consultancy (Ed.).
Manson, S.M. (2001). Simplifying complexity: a review of complexity theory. Geoforum, 32(3), 405-414.
Manyena, S.B. (2006). The concept of resilience revisited. Disasters, 30(4), 434-450. Markides, C.C., & Williamson, P.J. (1994). Related diversification, core competences and
corporate performance. Strategic Management Journal, 15(S2), 149-165. Martin, P.Y., & Turner, B.A. (1986). Grounded theory and organizational research. The Journal of
Applied Behavioral Science, 22(2), 141-157. Maslow, A.H. (1954). Motivation and Personality. New York: Haper & Brothers. Mayunga, J.S. (2007). Understanding and applying the concept of community disaster resilience:
A capital-based approach. Summer Academy for Social Vulnerability and Resilience Building, 1-16.
McManus, S.T. (2008). Organisational Resilience in New Zealand. McManus, S.T., Seville, E.P., Vargo, J.J., & Brunsdon, D. (2008). Facilitated process for
improving organizational resilience. Natural Hazards Review, 9(2), 81-90. Meadows, D.H., & Wright, D. (2008). Thinking in systems: A primer: Chelsea Green Publishing. Meadows, L.M., & Morse, J.M. (2001). Constructing evidence within the qualitative project. The
nature of qualitative evidence, 187-200. Merton, R.K. (1967). On theoretical sociology: five essays, old and new: Free Press New York. Mileti, D.S. (2005). Disasters by design. Economics and the wind, 1. Mileti, D.S., & O'Brien, P. (1993). Public response to aftershock warnings. US Geological Survey
Professional Paper, 1553, 31-42. Mileti, D.S., & Sorensen, J.H. (1987). Natural hazards and precautionary behavior. Taking care:
Understanding and encouraging self-protective behavior, 189-207. Miller, M., Paton, D., & Johnston, D.M. (1999). Community vulnerability to volcanic hazard
consequences. Disaster Prevention and Management, 8(4), 255-260. Mills, C.W. (1959). The sociological imagination: Oxford University Press, USA. Minitab Inc. (2012). Minitab 16 assistant white paper. Mitleton-Kelly, E. (2003). Ten principles of complexity and enabling infrastructures. Complex
systems and evolutionary perspectives on organisations: The application of complexity theory to organisations, 23ñ50.
Mitroff, I.I. (2004). Think like a sociopath, act like a saint. Journal of Business Strategy, 25(5), 42-53.
Key elements of sectoral recovery and resilience after the Canterbury earthquakes: A system dynamics approach
Hlekiwe Kachali
387
Mitroff, I.I. (2005). Why some companies emerge stronger and better from a crisis: 7 essential lessons for surviving disaster: Amacom Books.
Mitroff, I.I., Alpaslan, M.C., & Green, S.E. (2004). Crises as Ill Structured Messes. International Studies Review, 6(1), 165-194.
Mitroff, I.I., Shrivastava, P., & Udwadia, F.E. (1987). Effective crisis management. The Academy of Management Executive (1987-1989), 1(4), 283-292.
Mount, J., Zinger, J.T., & Forsyth, G.R. (1993). Organizing for development in the small business. Long range planning, 26(5), 111-120.
Munich Re. (1999). A Year, a Century, and a Millennium of Natural Catastrophes are all nearing their End. Press release of December, 20, 1999.
Munich Re (Producer). (2012). Munich Re posts €0.71bn profit for challenging year 2011 - Stable dividend. Retrieved from http://www.munichre.com/en/media_relations/press_releases/2012/2012_02_02_press_release.aspx
Nakagawa, Y., & Shaw, R. (2004). Social capital: A missing link to disaster recovery. International Journal of Mass Emergencies and Disasters, 22(1), 5-34.
Nardo, M., Saisana, M., Saltelli, A., Tarantola, S., Hoffman, A., & Giovannini, E. (2005). Handbook on constructing composite indicators: methodology and user guide: OECD Publishing.
National Road Carriers Inc (Producer). (2012, 9 July 2012). Retrieved from http://www.transport.org.nz/Section?Action=View&Section_id=45
Neely, A.D., Adams, C., & Kennerley, M. (2002). The Performance Prism: The scorecard for measuring and managing business success: Financial Times/Prentice Hall London, UK.
Neely, A.D., Gregory, M., & Platts, K. (2005). Performance measurement system design: a literature review and research agenda. International Journal of Operations & Production Management, 25(12), 1228-1263.
Nemet, G.F. (2009). Demand-pull, technology-push, and government-led incentives for non-incremental technical change. Research Policy, 38(5), 700-709.
New Zealand Department of Treasury. (2002). Low wage jobs and pathways to better outcomes. Retrieved 9 July 2012, from http://www.treasury.govt.nz/publications/research-policy/wp/2002/02-29/24.htm
New Zealand Historic Places Trust. (2009). Lyttelton Township Historic Area.
New Zealand Historic Places Trust. (2012). Canterbury Region, Pekenga – Ngā Pakihi
Whakatikatika o Waitaha. New Zealand Information and Communication Technologies Group. (2010). NZICT sets the
direction for the ICT and hi-tech sector. New Zealand Institute of Economic Research. (2010). Slowing recovery. New Zealand Ministry for the Environment. (2012). Transport in New Zealand. New Zealand Ministry of Civil Defence and Emergency Management. (2012). Lifeline utilities.
Retrieved from http://www.civildefence.govt.nz/memwebsite.nsf/srch/75BCEDA70F3B890FCC257A55000EF953?OpenDocument.
New Zealand Ministry of Civil Defence and Emergency Management. (2012b). CDEM & the role of Fast Moving Consumer Goods in a resilient New Zealand.
New Zealand Transport Agency. (2012b). Road user charges.
388 References
Newlove, L., Stern, E., & Svedin, L. (2003). Auckland unplugged: coping with critical infrastructure failure: Lexington Books.
Nigg, J.M., & Tierney, K.J. (1990). Explaining differential outcomes in the small business disaster loan application process.
Nordhaus, W.D. (1973). World dynamics: measurement without data. The Economic Journal, 83(332), 1156-1183.
Norwood, A.E., & Ursano, R.J. (1997). Psychiatric intervention in post-disaster recovery. Directions in Psychiatry, 17, 247-262.
Nystrom, P.C., & Starbuck, W.H. (1981). Handbook of Organizational Design: Remodeling organizations and their environments: Oxford University Press.
O'Brien, G., O'Keefe, P., Gadema, Z., & Swords, J. (2010). Approaching disaster management through social learning. Disaster Prevention and Management, 19(4), 498-508.
OED. (Ed.) (2010) Oxford English Dictionary. Okuyama, Y. (2003). Economics of natural disasters: A critical review. Research Paper, 12. Olshansky, R.B. (2006). Planning after hurricane Katrina. Journal of the American Planning
Association, 72(2), 147-153. Olshansky, R.B., & Johnson, L.A. (2012). Clear as Mud: Planning for the Rebuilding of New
Orleans. Publius: The Journal of Federalism. Olshansky, R.B., Johnson, L.A., & Topping, K.C. (2006). Rebuilding communities following
disaster: Lessons from Kobe and Los Angeles. Built Environment, 32(4), 354-374. Ota, T., Maki, N., & Hayashi, H. (2009). Evaluating Planning Process of the Kobe Recovery
Plan Based on Project Management Framework. Journal ref: Journal of Disaster Research, 4(3), 271-281.
Palen, L., & Liu, S.B. (2007). Citizen communications in crisis: anticipating a future of ICT-supported public participation.
Pascale, R.T., & Athos, A.G. (1981). The art of Japanese management. Business Horizons, 24(6), 83-85.
Pasmore, W.A. (1994). Creating strategic change: Designing the flexible, high-performing organization: John Wiley & Sons Inc.
Pathak, S.D., Day, J.M., Nair, A., Sawaya, W.J., & Kristal, M.M. (2007). Complexity and Adaptivity in Supply Networks: Building Supply Network Theory Using a Complex Adaptive Systems Perspective*. Decision Sciences, 38(4), 547-580.
Paton, D. (2006). Disaster Resilience: Integrating individual, community, institutional and environmental perspectives. Disaster resilience: An integrated approach, 320.
Paton, D. (2007). Measuring and monitoring resilience in Auckland (Vol. 2007/18). Wellington: GNS Science.
Paton, D., & Johnston, D.M. (2006). Disaster resilience: an integrated approach: Charles C. Thomas Publisher.
Paton, D., Johnston, D.M., & Houghton, B.F. (1998). Organisational Response to a Volcanic Eruption. Disaster Prevention and Management, 7(1), 5-13.
Pearson, C.M., & Clair, J.A. (1998). Reframing crisis management. Academy of Management review, 23(1), 59-76.
Pearson, C.M., & Mitroff, I.I. (1993). From crisis prone to crisis prepared: A framework for crisis management. The Executive, 7(1), 48-59.
Pentland, B.T., & Reuter, H.H. (1994). Organizational routines as grammars of action. Administrative Science Quarterly, 39(3).
Perrings, C. (1998). Resilience in the dynamics of economy-environment systems. Environmental and Resource Economics, 11(3), 503-520.
Key elements of sectoral recovery and resilience after the Canterbury earthquakes: A system dynamics approach
Hlekiwe Kachali
389
Perrow, C. (1984). Normal accidents. Perrow, C. (1986). The habit of courting disaster, The Nation, pp. 329-356. Perrow, C. (1994). The limits of safety: the enhancement of a theory of accidents. Journal of
Contingencies and crisis management, 2(4), 212-220. Perrow, C. (1999). Normal accidents: Living with high-risk technologies: Princeton Univ Pr. Perz, S.G. (2007). Grand theory and context-specificity in the study of forest dynamics: forest
transition theory and other directions. The Professional Geographer, 59(1), 105-114. Petak, W. (2002). Earthquake resilience through mitigation: a system approach. International
Institute for Applied Systems Analysis, Laxenburg, Austria. Peters, T., & Waterman, R. (1982). In search of excellence: Lessons from Americaís best-run
corporations: New York: Harper and Row. Pidgeon, N.F., & Harwood, K. (1996). Handbook of Qualitative research: Methods for
Psychology and the Social Sciences Grounded Theory: practical Implementation. Leicester: British Psychological Society, Brooks.
Pinto, J.K., & Prescott, J.E. (1988). Variations in critical success factors over the stages in the project life cycle. Journal of management, 14(1), 5-18.
Popp, A. (2006). The effects of natural disasters on long run growth. Major Themes in Economics, 1, 61-81.
Porter, M.E. (1998). Competitive Advantage: Creating and Sustaining Superior Performance: The Free Press.
Porter, M.E. (2000). Location, competition, and economic development: Local clusters in a global economy. Economic development quarterly, 14(1), 15-34.
Powell, F., & Harding, A. (2009). Business Recovery and the Rebuilding of Commercial Property.
Powell, T.C. (1991). Shaken, but alive: organizational behavior in the wake of catastrophic events. Organization & Environment, 5(4), 271-291.
Pretty, D.J., & Knight, R.F. (2002). Risks that matter. In O. Metrica (Ed.). Prud'homme, A.M.G. (2008). Business continuity in the supply chain: Planning for disruptive
events. Pugsley, A.G. (1973). The prediction of proneness to structural accidents. The structural engineer,
51(6), 195-196. Quarantelli, E.L. (1982a). Sheltering and housing after major community disasters: case studies
and general observations. Quarantelli, E.L. (1982b). What is a disaster? An agent specific or an all disaster spectrum
approach to socio-behavioral aspects of earthquakes? Quarantelli, E.L. (1986). Organizational Behavior in Disasters and Implications for Disaster
Planning. Volume 1, Number 2: DTIC Document. Quarantelli, E.L. (1988). Disaster crisis management: A summary of research findings. Journal of
Management Studies, 25(4), 373-385. Quarantelli, E.L. (1999). The disaster recovery process: What we know and do not know from
research. Quarantelli, E.L. (2006). Catastrophes are different from disasters: Some implications for crisis
planning and managing drawn from Katrina. Understanding Katrina: Perspectives from the social sciences.
REAG. (2011). Organisational Resilience Position Paper for Critical Infrastructure: Australian Resilience Expert Advisory Group.

390 References
Reason, J. (1998). Achieving a safe culture: Theory and practice. Work & Stress, 12(3), 293-306. Reason, J. (2000). Human error: Models and management. Bmj, 320(7237), 768. Reason, J., Hollnagel, E., & Paries, J. (2006). Revisiting the Swiss Cheese Model of Accidents.
Journal of Clinical Engineering, 27, 110-115. Resilience Alliance. (2012). Resilience. Retrieved 19th February, 2012, from
http://www.resalliance.org/index.php/resilience Resilient Organisations. (2010a). Benchmark Resilience Tool. Resilient Organisations. (2010b). Organisational Resilience Measurement Tool. Resilient Organisations (Producer). (2011). Strategic Objectives. Retrieved from
http://www.resorgs.org.nz/ Reynolds, M., & Holwell, S. (2010). Introducing systems approaches. Systems Approaches to
Managing Change: A Practical Guide, 1-23. Richards, L., & Morse, J. (2007). README FIRST for a User’s Guide to Qualitative Research:
Sage Publishers. Richardson, G.P., & Pugh III, A.I. (1981). Introduction to system dynamics modeling with DYNAMO:
Productivity Press Inc. Richmond, B. (1994). System Dynamics/systems thinking: Let's just get on with it. Roberts, K.H. (1990). Some characteristics of one type of high reliability organization.
Organization Science, 1(2), 160-176. Robson, C. (2002). Real world research: A resource for social scientists and practitioner-researchers: Wiley-
Blackwell. Rockhart, J.F., & Bullen, C.V. (1981). A primer on critical success factors. Romano, C.A. (1989). Research strategies for small business: a case study approach. International
Small Business Journal, 7(4), 35. Rose, A. (2004). Defining and measuring economic resilience to disasters. Disaster Prevention and
Management, 13(4), 307-314. Rose, A., Benavides, J., Chang, S.E., Szczesniak, P., & Lim, D. (1997). The regional economic
impact of an earthquake: Direct and indirect effects of electricity lifeline disruptions. Journal of Regional Science, 37(3), 437-458.
Rose, A., & Lim, D. (2002). Business interruption losses from natural hazards: conceptual and methodological issues in the case of the Northridge earthquake. Global Environmental Change Part B: Environmental Hazards, 4(1), 1-14.
Rubin, C.B. (2009). Long Term Recovery from Disasters - The Neglected Component of Emergency Management. Journal of Homeland Security and Emergency Management, 6(1), 46.
Rubin, C.B., & Barbee, D.G. (1985). Disaster recovery and hazard mitigation: Bridging the intergovernmental gap. Public Administration Review, 45, 57-63.
Rummler, G.A., & Brache, A.P. (1990). Improving performance: Jossey-Bass San Francisco. Runyan, R.C. (2006). Small Business in the Face of Crisis: Identifying Barriers to Recovery from
a Natural Disaster1. Journal of Contingencies and crisis management, 14(1), 12-26. Sanchez, J.I., Korbin, W.P., & Viscarra, D.M. (1995). Corporate support in the aftermath of a
natural disaster: Effects on employee strains. Academy of Management Journal, 504-521. Sato, K., & Hoshino, Y. (1984). The Anatomy of Japanese business: ME Sharpe Inc. Schlicht, E., & Thompson, J.J. (1985). Isolation and aggregation in economics: Springer. Senge, P.M. (1998). The practice of innovation. Leader to leader, 1998(9), 16-22. Senge, P.M. (2006). The fifth discipline: The art and practice of the learning organization: Broadway
Business. Senge, P.M., Scharmer, C.O., & Flowers, B.S. (2005). Presence: Exploring profound change in people,
organizations, and society: Broadway Business.

Key elements of sectoral recovery and resilience after the Canterbury earthquakes: A system dynamics approach
Hlekiwe Kachali
391
Senge, P.M., & Sterman, J.D. (1992). Systems thinking and organizational learning: Acting locally and thinking globally in the organization of the future. European Journal of Operational Research, 59(1), 137-150.
Seville, E.P., Brunsdon, D., Dantas, A., Le Masurier, J., Wilkinson, S., & Vargo, J.J. (2008). Organisational resilience: Researching the reality of New Zealand organisations. Journal of Business Continuity & Emergency Planning, 2(2), 258-266.
Sheffi, Y. (2007). The resilient enterprise: Overcoming vulnerability for competitive advantage. MIT Press Books, 1.
Sheffi, Y., & Rice, J.B. (2005). A supply chain view of the resilient enterprise. MIT Sloan Management Review, 47(1), 41.
Shrivastava, P. (1994). The evolution of research on technological crises in the US. Journal of Contingencies and crisis management, 2(1), 10-20.
Shrivastava, P., Mitroff, I.I., Miller, D., & Miclani, A. (1988). Understanding Industrial Crises. Journal of Management Studies, 25(4), 285-303.
Simon, H.A. (1991). Bounded rationality and organizational learning. Organization Science, 2(1), 125-134.
Sirkin, H.L., Hemerling, J.W., & Bhattacharya, A.K. (2008). Globality: Competing with everyone from everywhere for everything: Business Plus.
Skinner, Q. (1990). The return of grand theory in the human sciences: Cambridge Univ Pr. Smith, D, & Sipika, C. (1993). Back from the brink--post-crisis management. Long range planning,
26(1), 28-38. Smith, D. (1990). Beyond contingency planning: towards a model of crisis management.
Organization & Environment, 4(4), 263. Smith, G.P., & Wenger, D. (Eds.). (2007). Sustainable Disaster Recovery: Operationalizing an Existing
Agenda: NY: Springer. Smith, S.D. (2004). Inter-agency collaboration and consequence management: an all-hazard
approach to emergency incident response: Fairfax, Virginia: Public Entity Risk Institute. Sneppen, K., Bak, P., Flyvbjerg, H., & Jensen, M.H. (1995). Evolution as a self-organized critical
phenomenon. Proceedings of the National Academy of Sciences of the United States of America, 92(11), 5209.
Sommerville, I. (Producer). (2000). Requirements Engineering - An Overview. Spathis, C.T. (2002). Detecting false financial statements using published data: some evidence
from Greece. Managerial Auditing Journal, 17(4), 179-191. Spittal, M.J., McClure, J., Siegert, R.J., & Walkey, F.H. (2005). Optimistic bias in relation to
preparedness for earthquakes. Australasian Journal of Disaster and Trauma Studies, 1, 1-10. Spittal, M.J., McClure, J., Siegert, R.J., & Walkey, F.H. (2008). Predictors of two types of
earthquake preparation. Environment and Behavior, 40(6), 798-817. Stacey, R.D. (1995). The science of complexity: An alternative perspective for strategic change
processes. Strategic Management Journal, 16(6), 477-495. Starr, R., Newfrock, J., & Delurey, M. (2003). Enterprise resilience: managing risk in the
networked economy. Strategy and Business, 70-79. Statistics New Zealand. (2011a). Business Demography Statistics. Statistics New Zealand. (2011d). Electronic Card Transactions: July 2011. Statistics New Zealand. (2012d). Electronic Card Transactions: February 2012. Statistics New Zealand. (2012e). New Zealand Business Demography Statistics: At February 2012. New
Zealand: Retrieved from
392 References
http://www.stats.govt.nz/browse_for_stats/businesses/business_characteristics/BusinessDemographyStatistics_HOTPFeb12/Commentary.aspx.
Staw, B.M., Sandelands, L.E., & Dutton, J.E. (1981). Threat Rigidity Effects in Organizational Behavior: A Multilevel Analysis. Administrative Science Quarterly, 501-524.
Stephenson, A.V. (2010). Benchmarking The Resilience Of Organisations. (Doctor of Philosophy), University of Canterbury, Christchurch.
Sterman, J.D. (1984). Appropriate summary statistics for evaluating the historical fit of system dynamics models. Dynamica, 10(2), 51-66.
Sterman, J.D. (1989). Modeling Managerial Behavior: Misperceptions of Feedback in a Dynamic Decision Making Experiment. Management science, 321-339.
Sterman, J.D. (1994). Learning in and about complex systems. System Dynamics Review, 10(2-3), 291-330.
Sterman, J.D. (2000). Business dynamics: Systems thinking and modeling for a complex world: Irwin/McGraw-Hill.
Sterman, J.D. (2002). All models are wrong: reflections on becoming a systems scientist. System Dynamics Review, 18(4), 501-531.
Stern, E. (1997). Crisis and learning: A conceptual balance sheet. Journal of Contingencies and crisis management, 5(2), 69-86.
Stern, E., & Sundelius, B. (2002). Crisis management Europe: An integrated regional research and training program. International Studies Perspectives, 3(1), 71-88.
Stevens, G.C. (1989). Integrating the Supply Chain. International Journal of Physical Distribution & Logistics Management, 19(8), 3-8.
Strauss, A.L., & Corbin, J. (1990). Basics of qualitative research: Grounded theory procedures and techniques (Vol. 15): Sage Newbury Park, CA.
Strauss, A.L., & Corbin, J. (1998). Basics of qualitative research: Procedures and techniques for developing grounded theory. Thousand Oaks, CA: Sage.
Suddaby, R. (2006). From the editors: What grounded theory is not. The Academy of Management Journal Archive, 49(4), 633-642.
Sutcliffe, K.M., & Vogus, T.J. (2003). Organizing for resilience. Positive organizational scholarship: Foundations of a new discipline, 94-110.
Swiss Re. (2011). Sigma – preliminary estimates for 2011: natural catastrophes and man-made disasters caused economic losses of USD 350 billion and cost insurers USD 108 billion.
Tabachnick, B.G., Fidell, L.S., & Osterlind, S.J. (2001). Using multivariate statistics: Pearson. Taleb, N.N. (2007). The black swan: The impact of the highly improbable: Random House Trade
Paperbacks. Thain, D.H., & Goldthorpe, R.C. (1989). Turnaround management: causes of decline. Business
Quarterly, 54(1), 55-62. The Greater Christchurch Urban Development Strategy. (2012). The Greater Christchurch Urban
Development Strategy. Retrieved from http://www.greaterchristchurch.org.nz/. Thomke, S., Von Hippel, E., & Franke, R. (1998). Modes of experimentation: an innovation
process--and competitive--variable. Research Policy, 27(3), 315-332. Tierney, K.J. (1993a). Business vulnerability and disruption: Data from the 1993 Midwest floods. Tierney, K.J. (1993b). Disaster preparedness and response: Research findings and guidance from
the social science literature. Tierney, K.J. (1997). Business impacts of the Northridge earthquake. Journal of Contingencies and
crisis management, 5(2), 87-97.

Key elements of sectoral recovery and resilience after the Canterbury earthquakes: A system dynamics approach
Hlekiwe Kachali
393
Tierney, K.J. (2003). Conceptualizing and Measuring Organizational and Community Resilience: Lessons from the Emergency Response Following the September 11, 2001 Attack on the World Trade Center: University of Delaware Disaster Research Center.
Tierney, K.J. (2007a). Businesses and Disasters: Vulnerability, Impacts, and Recovery Handbooks of Disaster Research (pp. 275-296).
Tierney, K.J. (2007b). Businesses and Disasters: Vulnerability, Impacts, and Recovery. Handbook of Disaster Research, 275-296.
Tierney, K.J. (2008). Structure and Process in the Study Of Disaster Resilience. Tierney, K.J. (2009). Disaster response: Research findings and their implications for resilience
measures. CARRI Research Report, 6. Tierney, K.J., & Dahlhamer, J.M. (1997). Business disruption, preparedness and recovery:
Lessons from the Northridge earthquake. Tierney, K.J., & Nigg, J.M. (1995). Business vulnerability to disaster-related lifeline disruption. Tierney, K.J., & Webb, G.R. (2001). Business Vulnerability to Earthquakes and Other Disasters. Tonkin & Taylor. (2011). Darfield Earthquake Recovery Geotechnical Factual Report Kaiapoi
North. Turner, B.A. (1976). The organizational and interorganizational development of disasters.
Administrative Science Quarterly, 21(3), 378-397. Turner, B.A. (1981). Some practical aspects of qualitative data analysis: one way of organising
the cognitive processes associated with the generation of grounded theory. Quality & Quantity, 15(3), 225-247.
Turner, B.A. (1983). The use of grounded theory for the qualitative analysis of organizational behaviour. Journal of Management Studies, 20(3), 333-348.
Tyhurst, J.S. (1951). Individual reactions to community disaster. American Journal of Psychiatry, 107(764-769), 265.
UNISDR. (2005). Hyogo Framework for Action 2005-2015: Building the Resilience of Nations and Communities to Disasters.
UNISDR. (2009a). from http://www.unisdr.org/eng/terminology/terminology-2009-eng.html UNISDR (Producer). (2009b). UNISDR Terminology on Disaster Risk Reduction. [Definition]
Retrieved from http://www.unisdr.org/we/inform/terminology#letter-r Walker, B., Holling, C.S., Carpenter, S.R., & Kinzig, A. (2004). Resilience, Adaptability and
Transformability in Social--ecological Systems. Ecology and society, 9(2), 5. Walker, B., & Meyers, J.A. (2004). Thresholds in ecological and socialecological systems: a
developing database. Ecology and society, 9(2), 3. Webb, G.R., Tierney, K.J., & Dahlhamer, J.M. (2002). Predicting long-term business recovery
from disaster: a comparison of the Loma Prieta earthquake and Hurricane Andrew. Global Environmental Change Part B: Environmental Hazards, 4(2-3), 45-58.
Weick, K.E. (1987). Organizational culture as a source of high-reliability. California management review, 29(2).
Weihs, C. (1993). Multivariate exploratory data analysis and graphics: A tutorial. Journal of chemometrics, 7(5), 305-340.
Weinstein, N.D. (1980). Unrealistic optimism about future life events. Journal of personality and social psychology, 39(5), 806.
West, C.T., & Lenze, D.G. (1994). Modeling the regional impact of natural disaster and recovery: a general framework and an application to Hurricane Andrew. International Regional Science Review, 17(2), 121.

394 References
Whitman, Z.R, Stevenson, J.R., Kachali, H., Seville, E.P., Vargo, J.J., & Wilson, T.M. (2014). Organisational Resilience Following the 4 September 2010 Darfield Earthquake. Disasters, 38(1).
Whitman, Z.R., Kachali, H., Roger, D., Seville, E.P., & Vargo, J.J. (2013). Development and Validation of a Short-Form for the Benchmark Resilience Tool (BRT-53). Measuring Business Excellence, 17(3).
Whitman, Z.R., Wilson, T.M., Stevenson, J.R., Kachali, H., Seville, E.P., & Vargo, J.J. (2011). Rural organisational impact and resilience analysis to natural hazards.
Wildavsky, A.B. (1988). Searching for safety: Transaction publishers. von Bertalanffy, L. (1950). An outline of general system theory. British Journal for the Philosophy of
Science, 1(2), 134-165. von Bertalanffy, L. (1972). The history and status of general systems theory. Academy of
Management Journal, 407-426. Wu, J.Y., & Lindell, M.K. (2004). Housing Reconstruction After Two Major Earthquakes: The
1994 Northridge Earthquake in the United States and the 1999 Chi‚ÄêChi Earthquake in Taiwan. Disasters, 28(1), 63-81.
Yin, R.K. (1989). Case study research: Sage Publ. Zellner, A. (1980). Information Sources for Modeling the National Economy: Comment. Journal
of the American Statistical Association, 75(371), 567-569. Zolin, R., & Kropp, F. (2007). How surviving businesses respond during and after a major
disaster. Journal of Business Continuity & Emergency Planning, 1(2), 183-199.

Key elements of sectoral recovery and resilience after the Canterbury earthquakes: A system dynamics approach
Hlekiwe Kachali
395
13 Appendices
The complete documents for each appendix are contained in the CD that comes with this work.
13.1.1 Appendix A – Informed interview consent form
13.1.2 Appendix B - Contextual interview guide
13.1.3 Appendix C - Survey 1 results extra tables
13.1.4 Appendix D – Survey 2 results extra tables
13.1.5 Appendix E – Survey 3 results extra tables
13.1.6 Appendix F – Organisational resilience sectoral indicator scores
13.1.7 Appendix G – Questions for level of impact and Closure Impact Factor
13.1.8 Appendix H – Case Study Interview Guide
13.1.9 Appendix I – Additional analysis by organisational size - using full-time equivalent
(FTE) staff count
13.1.10 Appendix J – Additional Analysis - System Dynamics Quantified Stock and Flow of
Organisational Recovery
13.1.11 Appendix K – Survey 1 Questionnaire
13.1.12 Appendix L – Survey 2 Questionnaire
13.1.13 Appendix M - Survey 3 Questionnaire
13.1.14 Appendix N – Alternative techniques for arriving at the significant contributors to
recovery
13.1.15 Appendix O - List of additional publications produced during the course of
this research