key features - testequity · key features • see through the ... with powerful troubleshooting...
TRANSCRIPT

Key Features
• See through the complexity of LTE and LTE-Advanced signals with powerful troubleshooting tools
• Carrier aggregation with up to 5 component carriers for LTE-Advanced
• Enhanced uplink with clustered SC-FDMA for LTE-Advanced
• Analyze UL and DL, using color-coded displays for easy channel identifi cation
• Time and frequency-selective analysis by carrier, symbol, or RB
• Examine performance of users, channels, or signals with up to 4X4 MIMO (for LTE)
• Use 20:20 insight to simultaneously view 20 LTE measurement displays with 20 markers each
LTE-Advanced (89601B/BN-BHH) &
LTE (89601B/BN-BHE) TDD Modulation Analysis
LTE-Advanced (89601B/BN-BHG) &
LTE (89601B/BN-BHD) FDD Modulation Analysis
89600B VSA Software
Technical Overview

2
The 89600B software has the capabil-
ity to analyze LTE-Advanced as well
as LTE signals in both FDD and TDD
formats. Depending upon your re-
quirements, each of the four available
options provide comprehensive LTE/
LTE-Advanced modulation analysis
with powerful troubleshooting tools
to characterize signals and identify
errors and their causes.
Analyze both downlink (DL) and
uplink (UL) signals, for all bandwidths,
modulation formats and sequences.
Perform up to 4x4 DL MIMO analysis
with supported platforms. Keep
abreast of current developments with
advanced capabilities such as carrier
aggregation and beamforming.
Take advantage of the powerful
measurements and displays, color-
coded by user and channel, for quick
and easy visual identifi cation. Perform
measurements on the entire signal or
on individual channels. Use the 20:20
GUI to view up to 20 displays simulta-
neously, each with up to 20 markers.
New cumulative history and digital
persistence displays fi nd and isolate
rare events, to make subtle problems
easy to spot.
LTE-Advanced is just one of over
70 signal standards and modulation
types for which the 89600B vector
signal analysis (VSA) software cre-
ates a window into what’s happening
inside your complex wireless devices.
Our 89600B tools provide views of
virtually every facet of a problem,
helping you see the “why?” behind
signal problems. Whether you’re
working with emerging or established
standards, Agilent’s industry-leading
89600B VSA software helps you see
through the complexity.
LTE
Third-generation (3G) wireless
systems, based on W-CDMA, are
now being deployed all over the
world. W-CDMA maintains a mid-
term competitive edge by providing
high speed packet access (HSPA) in
both downlink and uplink modes. To
ensure the competitiveness of 3G
systems into the future, a long term
evolution (LTE) of the 3rd Generation
Partnership Project (3GPP) access
technology was specifi ed in Release
8 of the 3GPP standard. The LTE
specifi cation provides a framework
for increasing capacity, improving
spectrum effi ciency, improving cover-
age, and reducing latency compared
with current HSPA implementa-
tions. In addition, transmission with
multiple input and multiple output
(MIMO) antennas is supported
for greater throughput, as well as
enhanced capacity or range. To
support transmission in both the
paired and unpaired spectrum, the
LTE air interface supports both
frequency division duplex (FDD) and
time division duplex (TDD) modes.
LTE-Advanced takes throughput to
the next level with the capability of
having up to fi ve component carri-
ers1 spaced up to 100 MHz apart.
Option BHG (LTE-Advanced FDD) and
Option BHH (LTE-Advanced TDD)
provide UL/DL carrier aggregation in
both contiguous and non-contiguous
bandwidths. Both options also sup-
port up to 4X4 MIMO.
Try before you buy!
Download the 89600B software and use it free for 14 days to make measurements with your analysis hardware, or use our recorded demo signals which are available by selecting File > Recall > Recall Demo> LTE > or File > Recall > Recall Demo > LTE-A > on the software toolbar. Request your free trial license today:
www.agilent.com/find/89600B_trial
Technical Overview
1. All the component carriers need to be
contained within the analysis bandwidth of
the hardware being used.
Table of Contents
Technical Overview .......................................................................................2
Analysis and Troubleshooting ....................................................................3
Software Features ..........................................................................................6
Key Specifi cations ........................................................................................12
Additional Resources ..................................................................................15

3
Figure 1. Confi gure your setup using presets, a supplied E-UTRA test model, or using the
LTE allocation editor, which allows detailed manual setup.
Figure 2. Fully characterize up to 5 component carriers – simultaneously. Set up the
measurement parameters and view different measurements on each.
Analysis and Troubleshooting1
Easy set-up
Use a standard preset, or use one
of the provided E-UTRA test models
to easily confi gure your VSA. Adjust
virtually any parameter manually to
modify standard-compliant analysis
setup to deal with early system devel-
opment. A graphical user allocation
map lets you select which channels
to include in measurements and
displays. To simplify data set-up and
interpretation, there is consistent
color-coding by user and channel or
signals throughout confi guration and
measurement displays.
Time or frequency-selective analysis (on each component carrier for LTE-Advanced)
Look at your signal’s error by carrier,
symbol, or RB. Sharpen your view by
highlighting only a portion of the time,
frequency, or RB error information
available. Just double-click on the
display annotation or use the x-axis
expand select tool to mark the area of
interest.
1. Unless noted, all measurements shown are available for both LTE TDD and FDD. The actual display contents may vary per format.

4
Figure 3. Choose any combination of users, control channels, or synchronization signals for inclusion
in measurements and displays. To learn more about the Profi le tab, Dynamic Help links you to
comprehensive help text, including information on each of the channels and signals listed. The frame
summary table shows the color-coding used throughout each display.
Figure 4. Decode UL and DL control channel information for each frame.
Zero in to analyze select channels and signals
Go to the Profi le tab and choose
which elements to include in your er-
ror analysis: you can select/de-select
users, signals, or channels, allowing
you to focus on the behavior you
want to investigate.
Decode UL and DL
Tables provide decoded UL and DL
information from control channels.
Decoded information for each frame
is displayed following the same
channel color-coding displayed in
the frame summary trace and
used throughout.

5
Figure 5. Use the LTE-Advanced option for complete characterization of the LTE-Ad-
vanced FDD uplink clustered SC-FDMA signal.
Figure 6. Beam-forming diagrams show the expected radiation pattern for 2 users.
Enhanced uplink analysis
The 89600B VSA with LTE-Advanced
options enables enhanced uplink
analysis capability with clustered
SC-FDMA, giving you the ability to
add multiple clusters on the same
slot. Also available are simultaneous
PUCCH and PUSCH analysis.
Explore antenna beam performance (TDD only)
Use the antenna beam pattern display
to show the expected antenna radia-
tion pattern, derived from actual mea-
surement of the transmitter signals.
Multiple patterns, one for each user,
can be plotted to show the relative
position of beams.
Choosing between 89600B VSA software and X-Series measurement applications
89600B VSA is the industry-leading measurement software for evaluating and troubleshooting wireless
signals in R&D. PC-based, supporting numerous measurement platforms, the 89600B provides the
fl exibility and sophisticated measurement tools essential to fi nding and fi xing signal problems.
X-Series advanced measurement applications provide embedded format-specifi c, one-button
measurements for X-Series analyzers. With fast measurement speed, pass/fail testing and simplicity
of operation, these applications are ideally suited for design verifi cation and manufacturing.
www.agilent.com/find/X-Series_apps

6
Feature Description
LTE LTE-Advanced
Standards supported Option BHD demodulates LTE frame type 1 FDD signals; Option BHE demodulates LTE frame type 2 TDD signals.
Options BHG and BHH demodulate carrier aggregated LTE-A frame type 1 FDD signals and LTE-A frame type 2 TDD signals, respectively, with each component carrier conforming to the following standards
The demodulators support signals that are compliant with the following 3GPP technical specifi cations
36.201 V9.1.0 (March 2010)36.211 V9.1.0 (March 2010)36.212 V9.3.0 (March 2010)36.213 V9.2.0 (June 2010)36.214 V9.2.0 (June 2010)
36.201 V10.0.0 (Dec 2010)36.211 V10.0.0 (Dec 2010)36.212 V10.0.0 (Dec 2010)36.213 V10.0.0 (Dec 2010)36.214 V10.0.0 (Dec 2010)
EVM calculations and conformance testing are compatible with these specifi cations
36.101 V9.4.0 (June 2010)36.104 V9.4.0 (June 2010)36.141 V9.4.0 (June 2010)36.521-1 V9.1.0 (June 2010)
36.101 V10.1.0 (Dec 2010)36.104 V10.1.0 (Dec 2010)36.141 V10.1.0 (Dec 2010)
Physical channel decoding 36.331 V9.3.0 (June 2010) 36.331 V10.0.0 (Dec 2010)
Common setup parameters(LTE-Advanced only)
Access the common setup parameters for multiple component carriers, available for both Option BHG and BHH
Number of component carriers Up to fi ve
Frequency of each carrier Confi gurable individually
Format setup parameters Access basic demod confi guration parameters; all parameters available to BHD, BHE, BHH (per CC), BHG (per CC), BHD and BHE unless otherwise noted; All CC to be FDD or all to be TDD for LTE-Advanced options (BHG, BHH)
Duplex mode FDD (Option BHD/BHG); TDD (Option BHE/BHH)
TDD parameters (BHG/BHH only) UL/DL confi guration; Dw/GP/Up length. All component carriers need to be either UL or DL.
Direction Downlink, uplink
Bandwidth 1.4 MHz, 3 MHz, 5 MHz, 10 MHz, 15 MHz, 20 MHz
Sync type P-SS or RS
Cell ID Auto-detected, or manually set
RS-PRS 3GPP or custom
Pre-set to standard Sets the demodulator to the specifi ed bandwidth and sets the Demod Properties dialog box parameters for the current direction (Uplink or Downlink) to the default values
Downlink format parameters
Number of Tx antennas 1, 2, or 4
Ref Tx antenna Port 0-3
Number of RX channels 1-4
Ref Input channel 1 (Rx0) to 4 (Rx3)
PS-SS/S-SS antenna port Port 0-3; all
Ant. Det. Threshold Sets the threshold for Tx antenna port signal detection
Include inactive antenna paths Yes, no
MIMO decoding 3GPP MIMO decoding; none
PDSCH cell specifi c ratio p_B/p_A=1; P_B=0; P_B=1; P_B=2; P_B=3
Uplink format parameters
Half subcarrier shift Yes, no
PUSCH DFT swap Yes, no
Software FeaturesOptions BHG, BHH, BHD and BHE include all of the following features. Please note that for the LTE-Advanced options, the specifi cations below are for individual component carriers. The user may have up to 5 component carriers.

7
Profi le setup parameters Allows you to specify user channel allocations as well as which channels are shown on traces and used in the EVM and EVM Pk data results on the Error Summary trace
RB auto-detect Yes, no
RB auto-detect mode Power-based; decoded PDCCH
Expected num. of users (downlink)
Specifi es the number of user allocations to show in the Composite Include list
Auto-detect power levels (downlink)
Detects the relative PDSCH power level for each user allocation (PA).
Composite include Determine which channels and signals are shown on traces and included in the EVM and EVM Pk data results on the Error Summary trace
Non-allocated Include non-allocated channels in displays and measurements
Edit user-mapping Open LTE allocation editor where user allocations are set up
Include all Downlink only
Exclude all Downlink only
Edit control parameters Launches downlink control channel properties dialog menus; downlink only
Copy auto to manual Copies auto-detected allocations to manual defi nitions in the LTE Allocation Editor
User allocation map Shows the manually-specifi ed user allocations defi ned with the LTE Allocation Editor and allows you to select which user channels to show on the traces and include in calculations; downlink only
Time setup parameters Sets time data parameters used for demodulation; graphical timing diagram provided for ease in visualization
Result length Determines how many slots will be available for demodulation
Measurement offset Specifi es offset from the start of the result length to the beginning of measurement interval (the data sent to the demodulator); in slots + symbol-times
Measurement interval Determines how much data after the measurement offset is sent to the demodulator; in slots+ symbol times
Analysis start boundary Specifi es the alignment boundary of the result length time data; frame, half-frame, sub-frame, slot
8
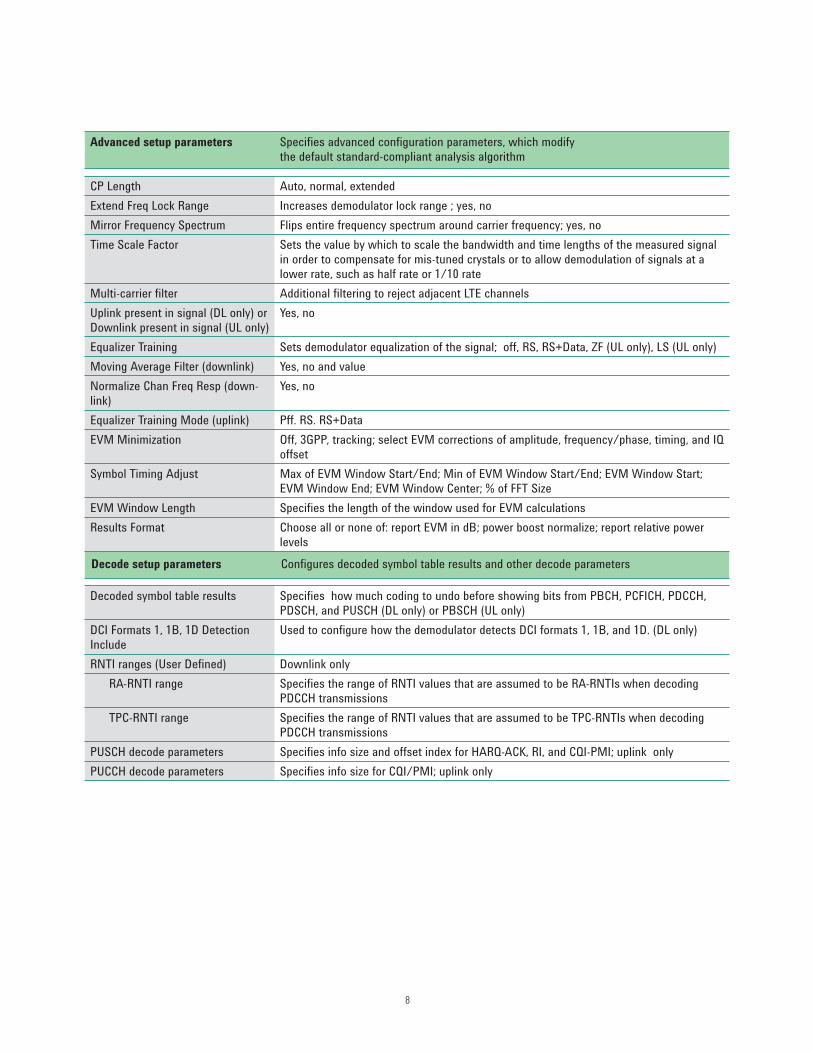
Advanced setup parameters Specifi es advanced confi guration parameters, which modify the default standard-compliant analysis algorithm
CP Length Auto, normal, extended
Extend Freq Lock Range Increases demodulator lock range ; yes, no
Mirror Frequency Spectrum Flips entire frequency spectrum around carrier frequency; yes, no
Time Scale Factor Sets the value by which to scale the bandwidth and time lengths of the measured signal in order to compensate for mis-tuned crystals or to allow demodulation of signals at a lower rate, such as half rate or 1/10 rate
Multi-carrier fi lter Additional fi ltering to reject adjacent LTE channels
Uplink present in signal (DL only) or Downlink present in signal (UL only)
Yes, no
Equalizer Training Sets demodulator equalization of the signal; off, RS, RS+Data, ZF (UL only), LS (UL only)
Moving Average Filter (downlink) Yes, no and value
Normalize Chan Freq Resp (down-link)
Yes, no
Equalizer Training Mode (uplink) Pff. RS. RS+Data
EVM Minimization Off, 3GPP, tracking; select EVM corrections of amplitude, frequency/phase, timing, and IQ offset
Symbol Timing Adjust Max of EVM Window Start/End; Min of EVM Window Start/End; EVM Window Start; EVM Window End; EVM Window Center; % of FFT Size
EVM Window Length Specifi es the length of the window used for EVM calculations
Results Format Choose all or none of: report EVM in dB; power boost normalize; report relative power levels
Decode setup parameters Confi gures decoded symbol table results and other decode parameters
Decoded symbol table results Specifi es how much coding to undo before showing bits from PBCH, PCFICH, PDCCH, PDSCH, and PUSCH (DL only) or PBSCH (UL only)
DCI Formats 1, 1B, 1D Detection Include
Used to confi gure how the demodulator detects DCI formats 1, 1B, and 1D. (DL only)
RNTI ranges (User Defi ned) Downlink only
RA-RNTI range Specifi es the range of RNTI values that are assumed to be RA-RNTIs when decoding PDCCH transmissions
TPC-RNTI range Specifi es the range of RNTI values that are assumed to be TPC-RNTIs when decoding PDCCH transmissions
PUSCH decode parameters Specifi es info size and offset index for HARQ-ACK, RI, and CQI-PMI; uplink only
PUCCH decode parameters Specifi es info size for CQI/PMI; uplink only
9
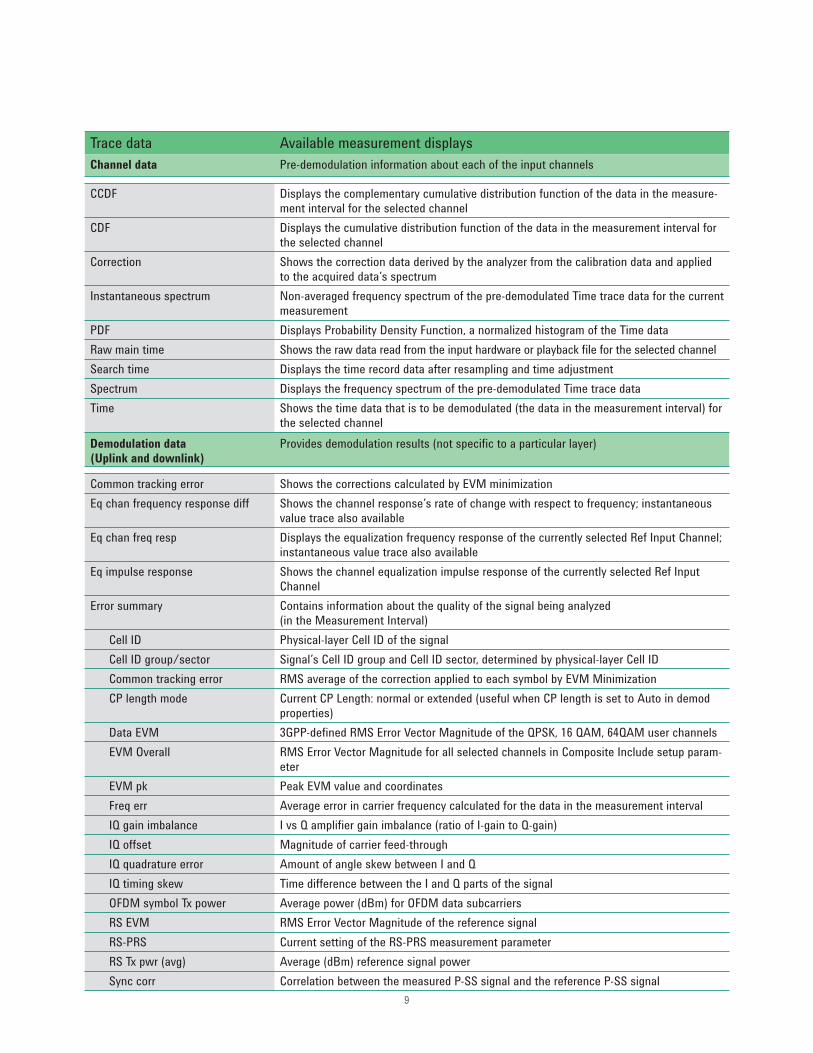
Trace data Available measurement displays
Channel data Pre-demodulation information about each of the input channels
CCDF Displays the complementary cumulative distribution function of the data in the measure-ment interval for the selected channel
CDF Displays the cumulative distribution function of the data in the measurement interval for the selected channel
Correction Shows the correction data derived by the analyzer from the calibration data and applied to the acquired data’s spectrum
Instantaneous spectrum Non-averaged frequency spectrum of the pre-demodulated Time trace data for the current measurement
PDF Displays Probability Density Function, a normalized histogram of the Time data
Raw main time Shows the raw data read from the input hardware or playback fi le for the selected channel
Search time Displays the time record data after resampling and time adjustment
Spectrum Displays the frequency spectrum of the pre-demodulated Time trace data
Time Shows the time data that is to be demodulated (the data in the measurement interval) for the selected channel
Demodulation data (Uplink and downlink)
Provides demodulation results (not specifi c to a particular layer)
Common tracking error Shows the corrections calculated by EVM minimization
Eq chan frequency response diff Shows the channel response’s rate of change with respect to frequency; instantaneous value trace also available
Eq chan freq resp Displays the equalization frequency response of the currently selected Ref Input Channel; instantaneous value trace also available
Eq impulse response Shows the channel equalization impulse response of the currently selected Ref Input Channel
Error summary Contains information about the quality of the signal being analyzed (in the Measurement Interval)
Cell ID Physical-layer Cell ID of the signal
Cell ID group/sector Signal’s Cell ID group and Cell ID sector, determined by physical-layer Cell ID
Common tracking error RMS average of the correction applied to each symbol by EVM Minimization
CP length mode Current CP Length: normal or extended (useful when CP length is set to Auto in demod properties)
Data EVM 3GPP-defi ned RMS Error Vector Magnitude of the QPSK, 16 QAM, 64QAM user channels
EVM Overall RMS Error Vector Magnitude for all selected channels in Composite Include setup param-eter
EVM pk Peak EVM value and coordinates
Freq err Average error in carrier frequency calculated for the data in the measurement interval
IQ gain imbalance I vs Q amplifi er gain imbalance (ratio of I-gain to Q-gain)
IQ offset Magnitude of carrier feed-through
IQ quadrature error Amount of angle skew between I and Q
IQ timing skew Time difference between the I and Q parts of the signal
OFDM symbol Tx power Average power (dBm) for OFDM data subcarriers
RS EVM RMS Error Vector Magnitude of the reference signal
RS-PRS Current setting of the RS-PRS measurement parameter
RS Tx pwr (avg) Average (dBm) reference signal power
Sync corr Correlation between the measured P-SS signal and the reference P-SS signal
10
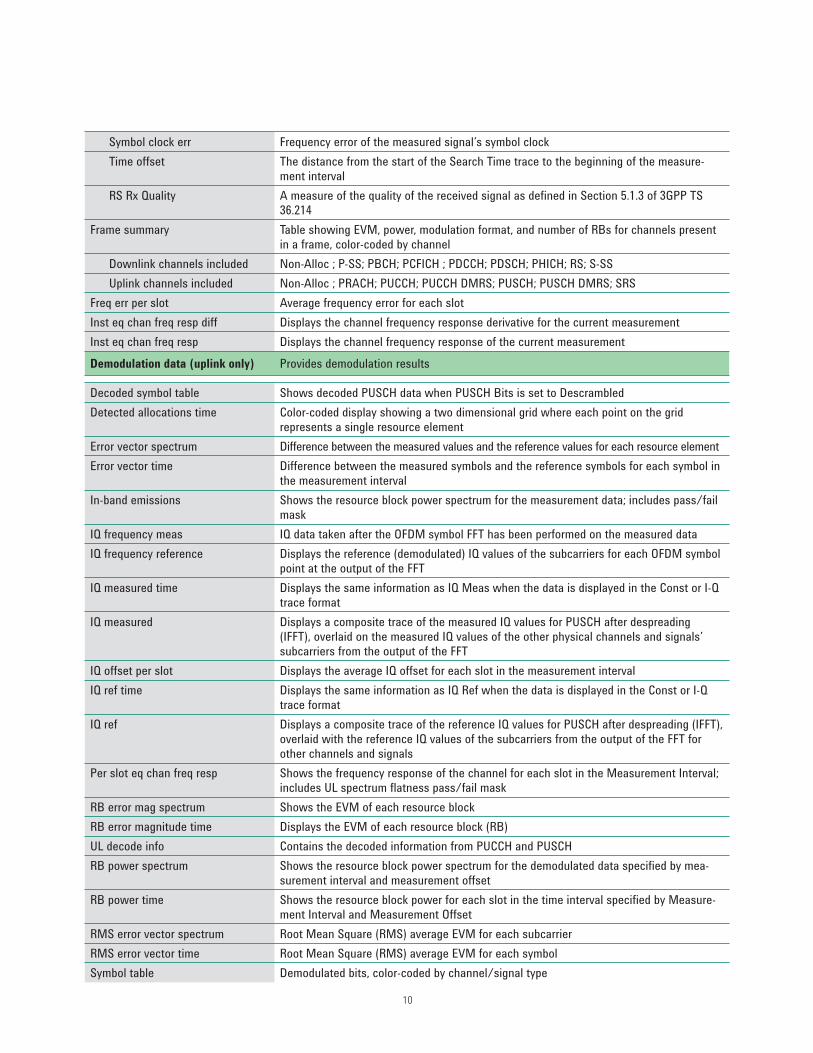
Symbol clock err Frequency error of the measured signal’s symbol clock
Time offset The distance from the start of the Search Time trace to the beginning of the measure-ment interval
RS Rx Quality A measure of the quality of the received signal as defi ned in Section 5.1.3 of 3GPP TS 36.214
Frame summary Table showing EVM, power, modulation format, and number of RBs for channels present in a frame, color-coded by channel
Downlink channels included Non-Alloc ; P-SS; PBCH; PCFICH ; PDCCH; PDSCH; PHICH; RS; S-SS
Uplink channels included Non-Alloc ; PRACH; PUCCH; PUCCH DMRS; PUSCH; PUSCH DMRS; SRS
Freq err per slot Average frequency error for each slot
Inst eq chan freq resp diff Displays the channel frequency response derivative for the current measurement
Inst eq chan freq resp Displays the channel frequency response of the current measurement
Demodulation data (uplink only) Provides demodulation results
Decoded symbol table Shows decoded PUSCH data when PUSCH Bits is set to Descrambled
Detected allocations time Color-coded display showing a two dimensional grid where each point on the grid represents a single resource element
Error vector spectrum Difference between the measured values and the reference values for each resource element
Error vector time Difference between the measured symbols and the reference symbols for each symbol in the measurement interval
In-band emissions Shows the resource block power spectrum for the measurement data; includes pass/fail mask
IQ frequency meas IQ data taken after the OFDM symbol FFT has been performed on the measured data
IQ frequency reference Displays the reference (demodulated) IQ values of the subcarriers for each OFDM symbol point at the output of the FFT
IQ measured time Displays the same information as IQ Meas when the data is displayed in the Const or I-Q trace format
IQ measured Displays a composite trace of the measured IQ values for PUSCH after despreading (IFFT), overlaid on the measured IQ values of the other physical channels and signals’ subcarriers from the output of the FFT
IQ offset per slot Displays the average IQ offset for each slot in the measurement interval
IQ ref time Displays the same information as IQ Ref when the data is displayed in the Const or I-Q trace format
IQ ref Displays a composite trace of the reference IQ values for PUSCH after despreading (IFFT), overlaid with the reference IQ values of the subcarriers from the output of the FFT for other channels and signals
Per slot eq chan freq resp Shows the frequency response of the channel for each slot in the Measurement Interval; includes UL spectrum fl atness pass/fail mask
RB error mag spectrum Shows the EVM of each resource block
RB error magnitude time Displays the EVM of each resource block (RB)
UL decode info Contains the decoded information from PUCCH and PUSCH
RB power spectrum Shows the resource block power spectrum for the demodulated data specifi ed by mea-surement interval and measurement offset
RB power time Shows the resource block power for each slot in the time interval specifi ed by Measure-ment Interval and Measurement Offset
RMS error vector spectrum Root Mean Square (RMS) average EVM for each subcarrier
RMS error vector time Root Mean Square (RMS) average EVM for each symbol
Symbol table Demodulated bits, color-coded by channel/signal type

11
Demodulation data (downlink only)
Provides demodulation results
Antenna beam pattern IQ diagram depicting beam-forming pattern (Opt BHD/BHG only)
CW0/1 decoded symbol table Shows the decoded bits for the physical layer channels PBCH, PDSCH, PCFICH, and PDCCH for codeword 0/1
DL Decode info Contains the decoded information from PBCH, PDCCH, PHICH, and PCFICH
UE-specifi c RS weights Shows the subcarrier locations and weights for all UE-specifi c Reference Signal resource elements present in the measurement data
Layer data (downlink only) Contains downlink demodulation results that are specifi c to a particular layer
Detected allocations time Color-coded display showing a two dimensional grid where each point on the grid repre-sents a single resource element of the selected layer
Error vector spectrum Difference between the measured values and the reference values for each resource element in a layer
Error vector time Difference between the measured symbols and the reference symbols for each symbol in the measurement interval
IQ measured time Displays the same information as IQ meas when the data is displayed in the Const or I-Q trace format
IQ meas Displays the measured IQ values of the subcarriers from the output of the FFT (frequency domain) for the selected layer
IQ ref time Displays the same information as IQ Ref when the data is displayed in the Const or I-Q trace format
RB error mag spectrum Displays the EVM of each resource block (RB) in the selected layer
RB error mag time Displays the EVM of each resource block (RB) in the selected layer
RB power spectrum Shows the resource block power spectrum for the demodulated data specifi ed by mea-surement interval and measurement off for the selected layer
RB power time Shows the resource block power for each slot in the time interval specifi ed by measure-ment interval and measurement offset in the selected layer
RMS error vector spectrum Root Mean Square (RMS) average EVM for each subcarrier
RMS error vector time Root Mean Square (RMS) average EVM for each symbol
Symbol table Demodulated bits, color-coded by channel/signal type
MIMO data (for rel 8 of 3GPP only) Downlink only
Common tracking error Shows the common tracking error data for all Rx/Tx antenna paths
Eq chan freq resp difference Displays the slope of the channel frequency response for all four antenna ports
Eq chan freq resp Displays the channel frequency response for all four antenna ports
Eq cond number Displays the MIMO condition number for each subcarrier
Eq impulse response Displays the equalizer impulse response for all four antenna ports
Info table Provides the following metrics for each Tx/Rx pair, color coded by path
RS power Average (RMS) RS signal power
RS EVM Average (RMS) RS EVM
RS CTE Average (RMS) RS Common Tracking Error
RS timing RS timing error
RS symbol clock Average RS symbol clock error
RS frequency RS frequency shift error
12
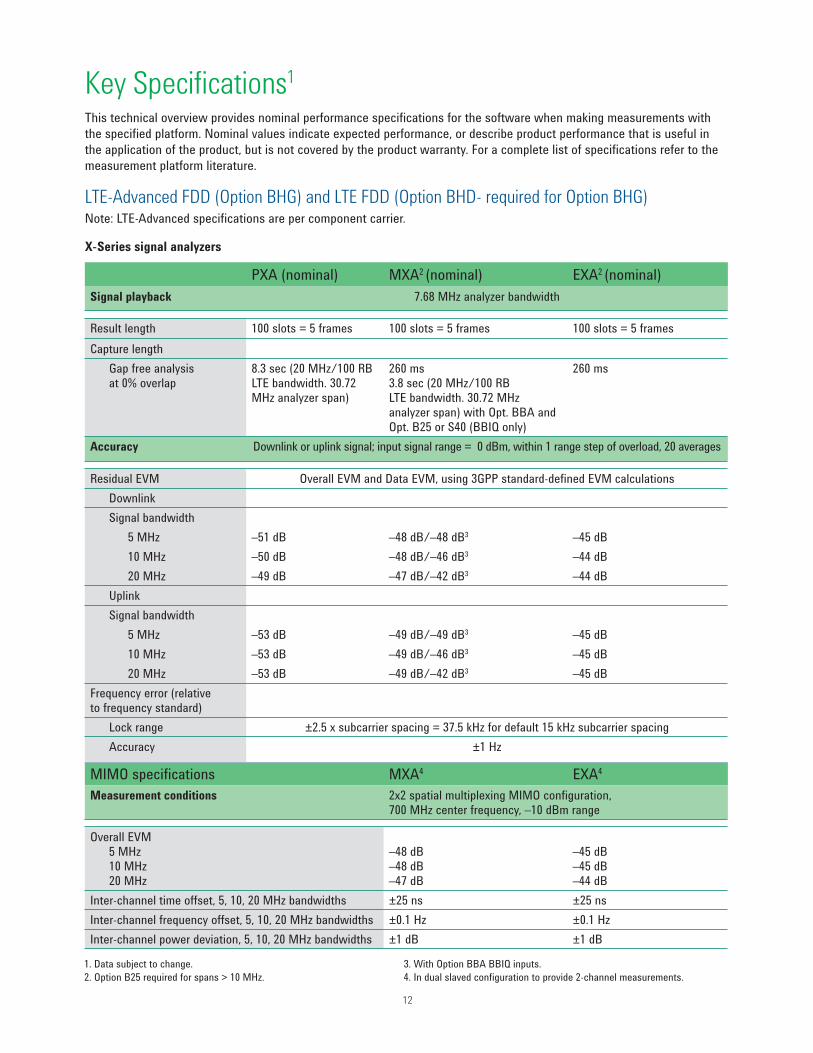
PXA (nominal) MXA2 (nominal) EXA2 (nominal)
Signal playback 7.68 MHz analyzer bandwidth
Result length 100 slots = 5 frames 100 slots = 5 frames 100 slots = 5 frames
Capture length
Gap free analysis at 0% overlap
8.3 sec (20 MHz/100 RBLTE bandwidth. 30.72 MHz analyzer span)
260 ms3.8 sec (20 MHz/100 RBLTE bandwidth. 30.72 MHzanalyzer span) with Opt. BBA and Opt. B25 or S40 (BBIQ only)
260 ms
Accuracy Downlink or uplink signal; input signal range = 0 dBm, within 1 range step of overload, 20 averages
Residual EVM Overall EVM and Data EVM, using 3GPP standard-defi ned EVM calculations
Downlink
Signal bandwidth
5 MHz –51 dB –48 dB/–48 dB3 –45 dB
10 MHz –50 dB –48 dB/–46 dB3 –44 dB
20 MHz –49 dB –47 dB/–42 dB3 –44 dB
Uplink
Signal bandwidth
5 MHz –53 dB –49 dB/–49 dB3 –45 dB
10 MHz –53 dB –49 dB/–46 dB3 –45 dB
20 MHz –53 dB –49 dB/–42 dB3 –45 dB
Frequency error (relative to frequency standard)
Lock range ±2.5 x subcarrier spacing = 37.5 kHz for default 15 kHz subcarrier spacing
Accuracy ±1 Hz
MIMO specifi cations MXA4 EXA4
Measurement conditions 2x2 spatial multiplexing MIMO confi guration, 700 MHz center frequency, –10 dBm range
Overall EVM 5 MHz 10 MHz 20 MHz
–48 dB–48 dB–47 dB
–45 dB–45 dB–44 dB
Inter-channel time offset, 5, 10, 20 MHz bandwidths ±25 ns ±25 ns
Inter-channel frequency offset, 5, 10, 20 MHz bandwidths ±0.1 Hz ±0.1 Hz
Inter-channel power deviation, 5, 10, 20 MHz bandwidths ±1 dB ±1 dB
1. Data subject to change.
2. Option B25 required for spans > 10 MHz.
3. With Option BBA BBIQ inputs.
4. In dual slaved confi guration to provide 2-channel measurements.
Key Specifi cations1
This technical overview provides nominal performance specifi cations for the software when making measurements with
the specifi ed platform. Nominal values indicate expected performance, or describe product performance that is useful in
the application of the product, but is not covered by the product warranty. For a complete list of specifi cations refer to the
measurement platform literature.
X-Series signal analyzers
LTE-Advanced FDD (Option BHG) and LTE FDD (Option BHD- required for Option BHG)Note: LTE-Advanced specifi cations are per component carrier.
13
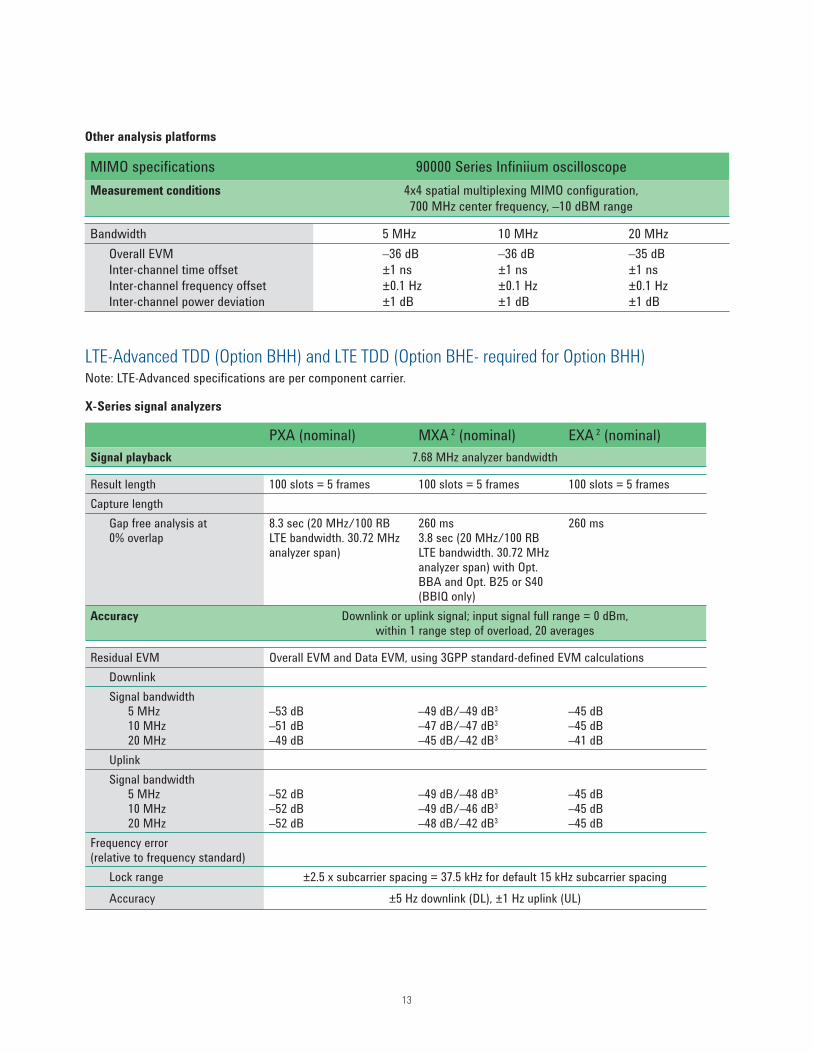
MIMO specifi cations 90000 Series Infi niium oscilloscope
Measurement conditions 4x4 spatial multiplexing MIMO confi guration,
700 MHz center frequency, –10 dBM range
Bandwidth 5 MHz 10 MHz 20 MHz
Overall EVM
Inter-channel time offset
Inter-channel frequency offset
Inter-channel power deviation
–36 dB –36 dB –35 dB
±1 ns ±1 ns ±1 ns
±0.1 Hz ±0.1 Hz ±0.1 Hz
±1 dB ±1 dB ±1 dB
Other analysis platforms
LTE-Advanced TDD (Option BHH) and LTE TDD (Option BHE- required for Option BHH)Note: LTE-Advanced specifi cations are per component carrier.
PXA (nominal) MXA 2 (nominal) EXA 2 (nominal)
Signal playback 7.68 MHz analyzer bandwidth
Result length 100 slots = 5 frames 100 slots = 5 frames 100 slots = 5 frames
Capture length
Gap free analysis at 0% overlap
8.3 sec (20 MHz/100 RBLTE bandwidth. 30.72 MHz analyzer span)
260 ms3.8 sec (20 MHz/100 RB LTE bandwidth. 30.72 MHz analyzer span) with Opt. BBA and Opt. B25 or S40 (BBIQ only)
260 ms
Accuracy Downlink or uplink signal; input signal full range = 0 dBm, within 1 range step of overload, 20 averages
Residual EVM Overall EVM and Data EVM, using 3GPP standard-defi ned EVM calculations
Downlink
Signal bandwidth 5 MHz 10 MHz 20 MHz
–53 dB–51 dB–49 dB
–49 dB/–49 dB3
–47 dB/–47 dB3
–45 dB/–42 dB3
–45 dB–45 dB–41 dB
Uplink
Signal bandwidth 5 MHz 10 MHz 20 MHz
–52 dB–52 dB–52 dB
–49 dB/–48 dB3
–49 dB/–46 dB3
–48 dB/–42 dB3
–45 dB–45 dB–45 dB
Frequency error (relative to frequency standard)
Lock range ±2.5 x subcarrier spacing = 37.5 kHz for default 15 kHz subcarrier spacing
Accuracy ±5 Hz downlink (DL), ±1 Hz uplink (UL)
X-Series signal analyzers
14
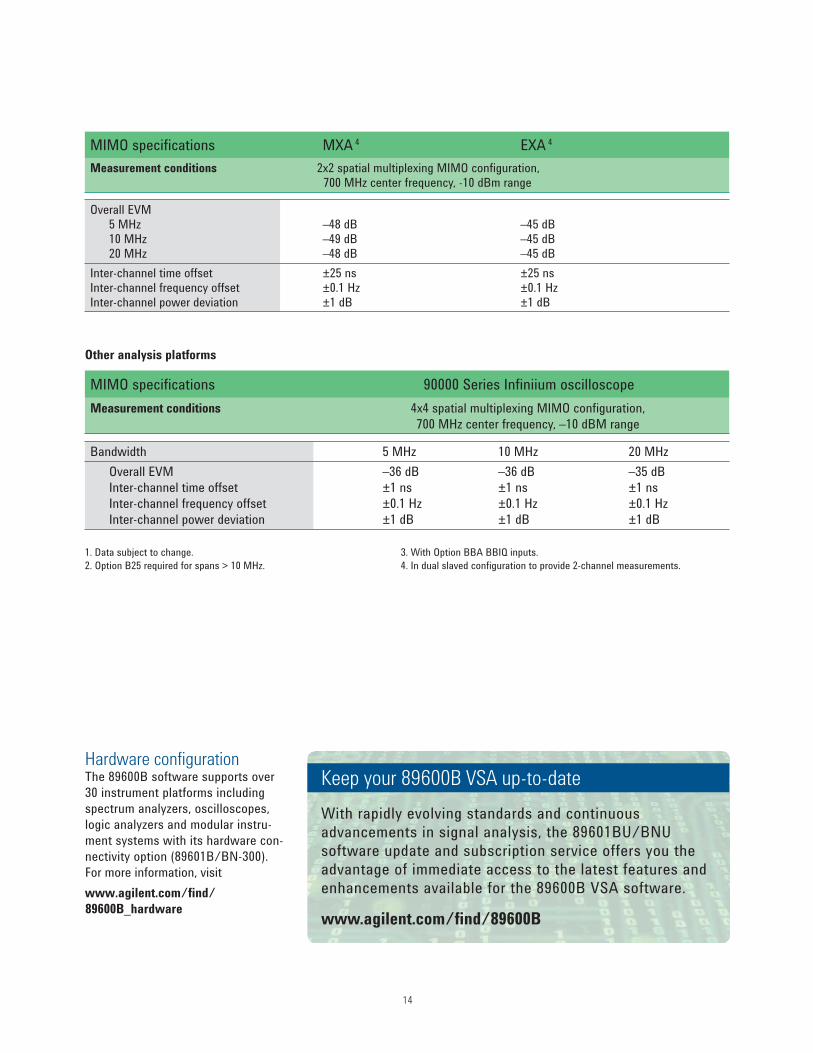
MIMO specifi cations 90000 Series Infi niium oscilloscope
Measurement conditions 4x4 spatial multiplexing MIMO confi guration,
700 MHz center frequency, –10 dBM range
Bandwidth 5 MHz 10 MHz 20 MHz
Overall EVM
Inter-channel time offset
Inter-channel frequency offset
Inter-channel power deviation
–36 dB –36 dB –35 dB
±1 ns ±1 ns ±1 ns
±0.1 Hz ±0.1 Hz ±0.1 Hz
±1 dB ±1 dB ±1 dB
Other analysis platforms
1. Data subject to change.
2. Option B25 required for spans > 10 MHz.
3. With Option BBA BBIQ inputs.
4. In dual slaved confi guration to provide 2-channel measurements.
MIMO specifi cations MXA 4 EXA 4
Measurement conditions 2x2 spatial multiplexing MIMO confi guration, 700 MHz center frequency, -10 dBm range
Overall EVM 5 MHz 10 MHz 20 MHz
–48 dB –49 dB –48 dB
–45 dB–45 dB–45 dB
Inter-channel time offsetInter-channel frequency offsetInter-channel power deviation
±25 ns ±0.1 Hz ±1 dB
±25 ns±0.1 Hz±1 dB
Keep your 89600B VSA up-to-date
With rapidly evolving standards and continuous advancements in signal analysis, the 89601BU/BNU software update and subscription service offers you the advantage of immediate access to the latest features andenhancements available for the 89600B VSA software.
www.agilent.com/find/89600B
Hardware confi gurationThe 89600B software supports over
30 instrument platforms including
spectrum analyzers, oscilloscopes,
logic analyzers and modular instru-
ment systems with its hardware con-
nectivity option (89601B/BN-300).
For more information, visit
(www.agilent.com/fi nd/
89600B_hardware)

www.agilent.comwww.agilent.com/find/89600B
Literature
89600B Vector Signal Analysis Software,
Brochure, literature number 5990-
6553EN
89600B Vector Signal Analysis Software,
Confi guration Guide, literature number
5990-6386EN
89600B Opt 200 Basic VSA and Opt
300 Hardware Connectivity, Technical
Overview, literature number 5990-
6405EN
Agilent 89600B VSA Option BHD & Opt
BHE 3GPP LTE Modulation Analysis,
Demo Guide, literature number 5990-
6822EN
Agilent 3GPP Long Term Evolution:
System Overview, Product Development,
and Test Challenges, Application Note,
literature number 5989-8139EN
Web
www.agilent.com/find/89600B
www.agilent.com/find/LTE
www.agilent.com/LTE-Advanced
Additional Resources
You can upgrade!
All 89600B options
can be added
after your initial
purchase and
are license-key
enabled. For more information
please refer to
www.agilent.com/find/89600B_upgrades
For more information on Agilent Technolo-gies’ products, applications or services, please contact your local Agilent office.
The complete list is available at:
www.agilent.com/find/contactus
AmericasCanada (877) 894 4414 Brazil (11) 4197 3500Mexico 01800 5064 800 United States (800) 829 4444
Asia PacificAustralia 1 800 629 485China 800 810 0189Hong Kong 800 938 693India 1 800 112 929Japan 0120 (421) 345Korea 080 769 0800Malaysia 1 800 888 848Singapore 1 800 375 8100Taiwan 0800 047 866Other AP Countries (65) 375 8100
Europe & Middle EastBelgium 32 (0) 2 404 93 40 Denmark 45 70 13 15 15Finland 358 (0) 10 855 2100France 0825 010 700* *0.125 €/minute
Germany 49 (0) 7031 464 6333 Ireland 1890 924 204Israel 972-3-9288-504/544Italy 39 02 92 60 8484Netherlands 31 (0) 20 547 2111Spain 34 (91) 631 3300Sweden 0200-88 22 55United Kingdom 44 (0) 131 452 0200
For other unlisted Countries: www.agilent.com/find/contactusRevised: June 8, 2011
Product specifications and descriptions in this document subject to change without notice.
© Agilent Technologies, Inc. 2011Published in USA, July 1, 20115990-6406EN
Agilent Advantage Services is committed
to your success throughout your equip-
ment’s lifetime. To keep you competitve,
we continually invest in tools and
processes that speed up calibration and
repair and reduce your cost of ownership.
You can also use Infoline Web Services
to manage equipment and services more
effectively. By sharing our measurement
and service expertise, we help you create
the products that change our world.
www.agilent.com/quality
Agilent Email Updates
www.agilent.com/find/emailupdates
Get the latest information on the
products and applications you select.
www.lxistandard.org
LAN eXtensions for Instruments puts
the power of Ethernet and the Web
inside your test systems. Agilent is a
founding member of the LXI consortium.
Agilent Channel Partners
www.agilent.com/find/channelpartners
Get the best of both worlds: Agilent’s
measurement expertise and product
breadth, combined with channel
partner convenience.