key financial metrics and ratios - north carolina world
TRANSCRIPT
1
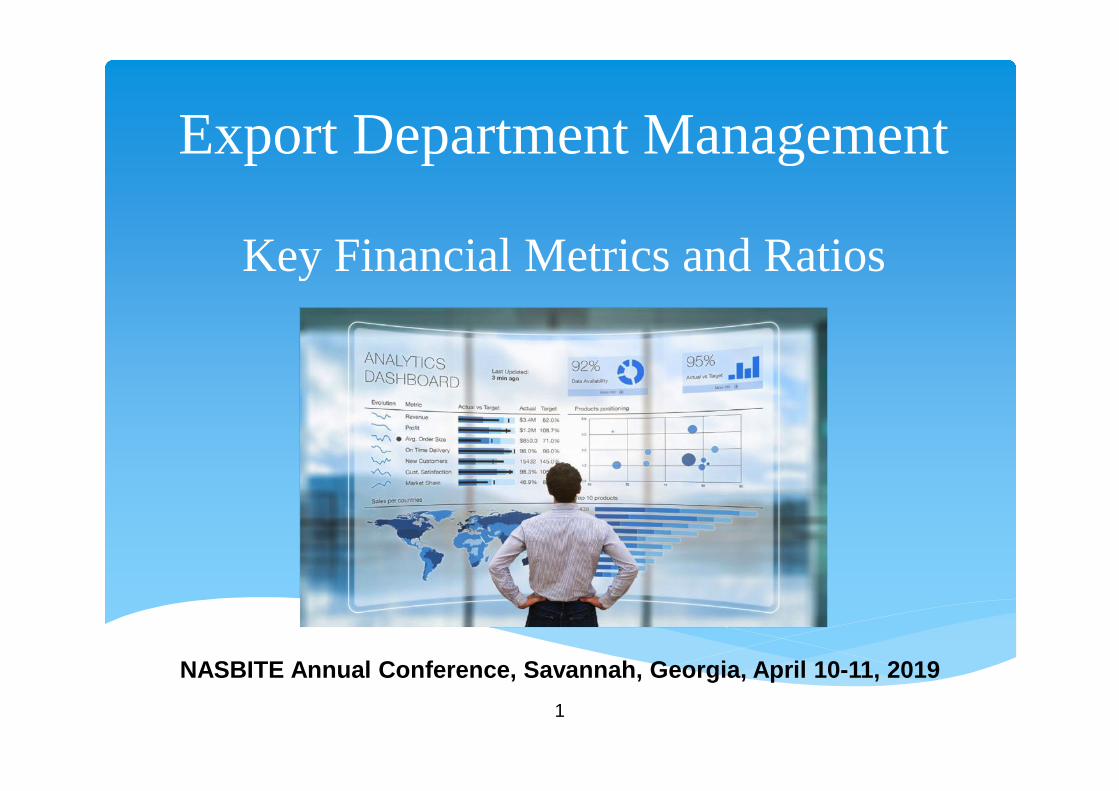
Export Department Management
Key Financial Metrics and Ratios
NASBITE Annual Conference, Savannah, Georgia, April 10-11, 2019
2
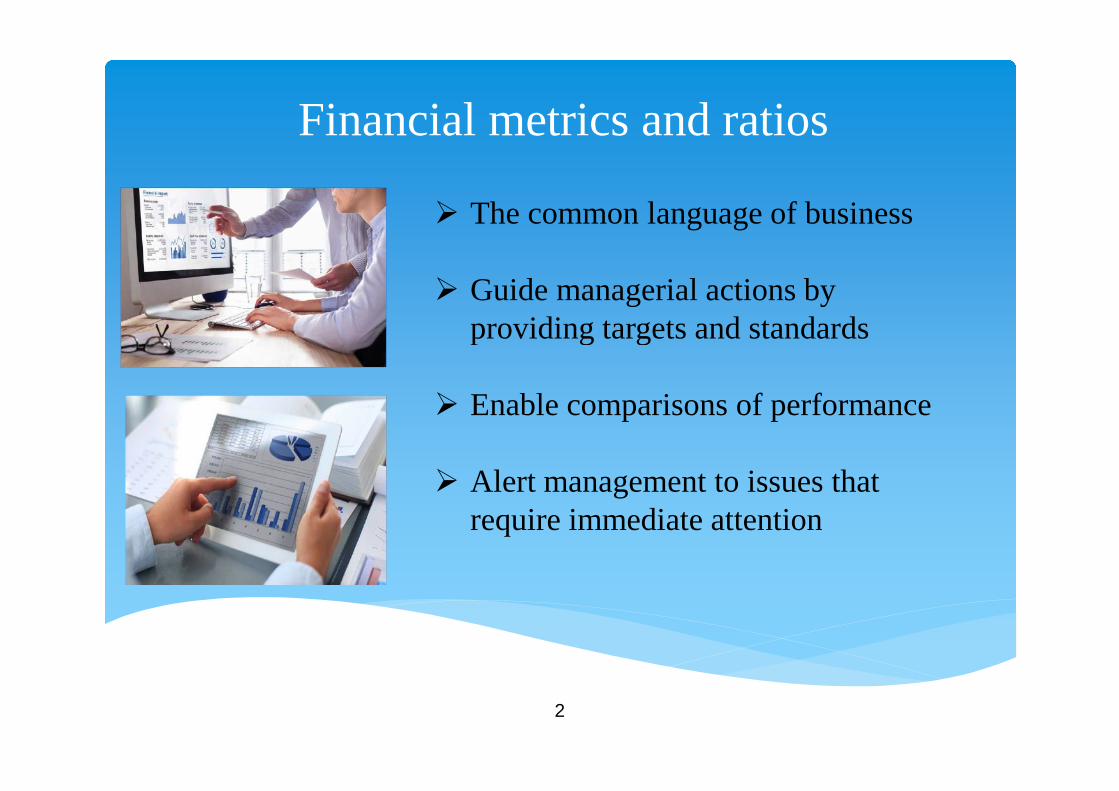
Financial metrics and ratios
The common language of business
Guide managerial actions byproviding targets and standards
Enable comparisons of performance
Alert management to issues thatrequire immediate attention
3
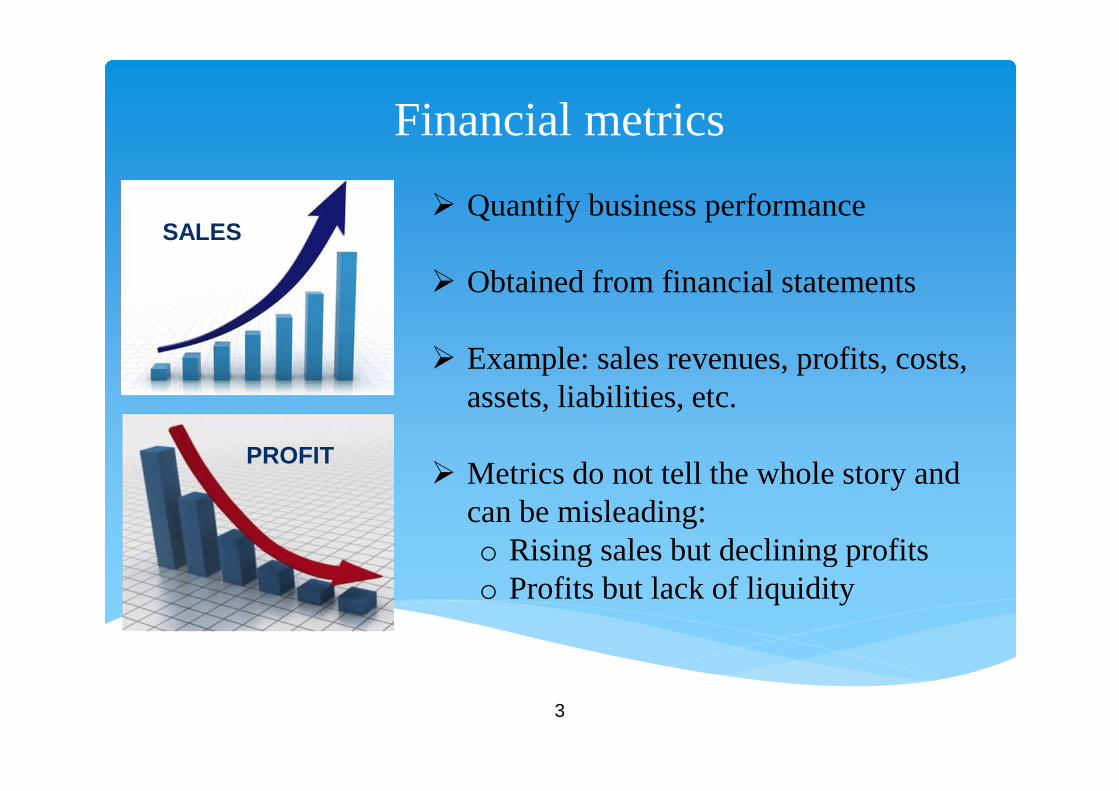
Financial metrics
Quantify business performance
Obtained from financial statements
Example: sales revenues, profits, costs,assets, liabilities, etc.
Metrics do not tell the whole story andcan be misleading:o Rising sales but declining profitso Profits but lack of liquidity
SALES
PROFIT
4
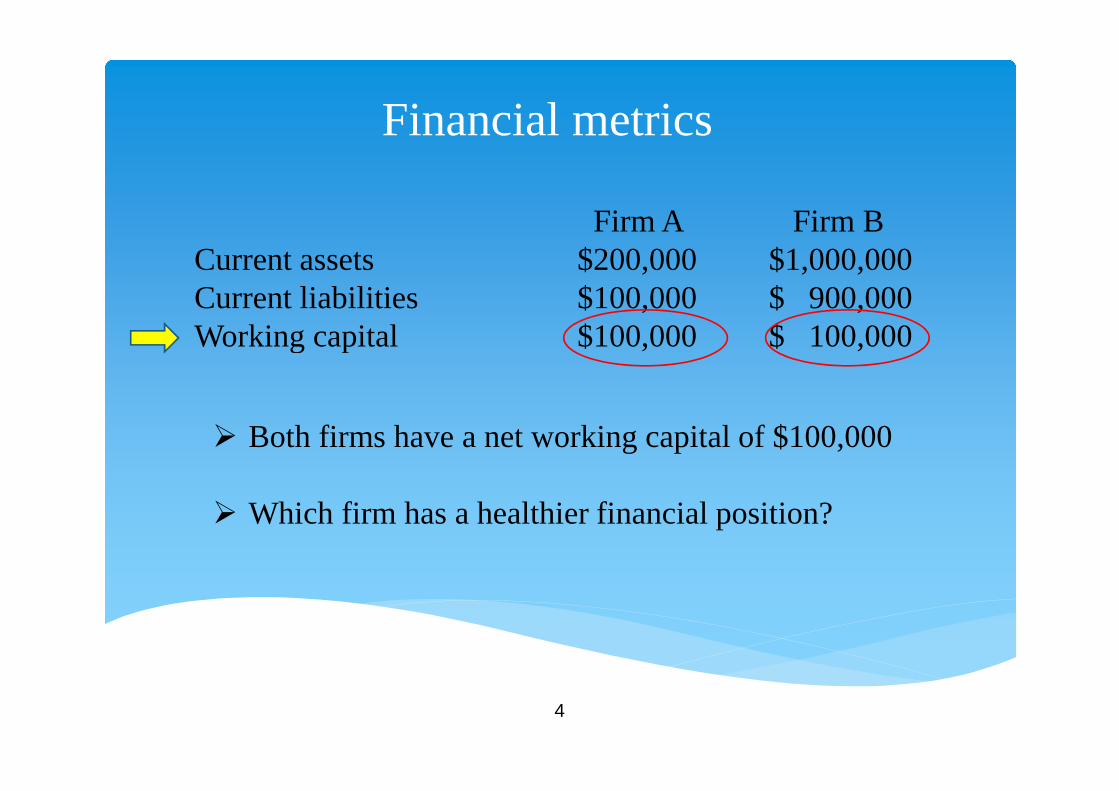
Financial metrics
Firm A Firm BCurrent assets $200,000 $1,000,000Current liabilities $100,000 $ 900,000Working capital $100,000 $ 100,000
Both firms have a net working capital of $100,000
Which firm has a healthier financial position?
5
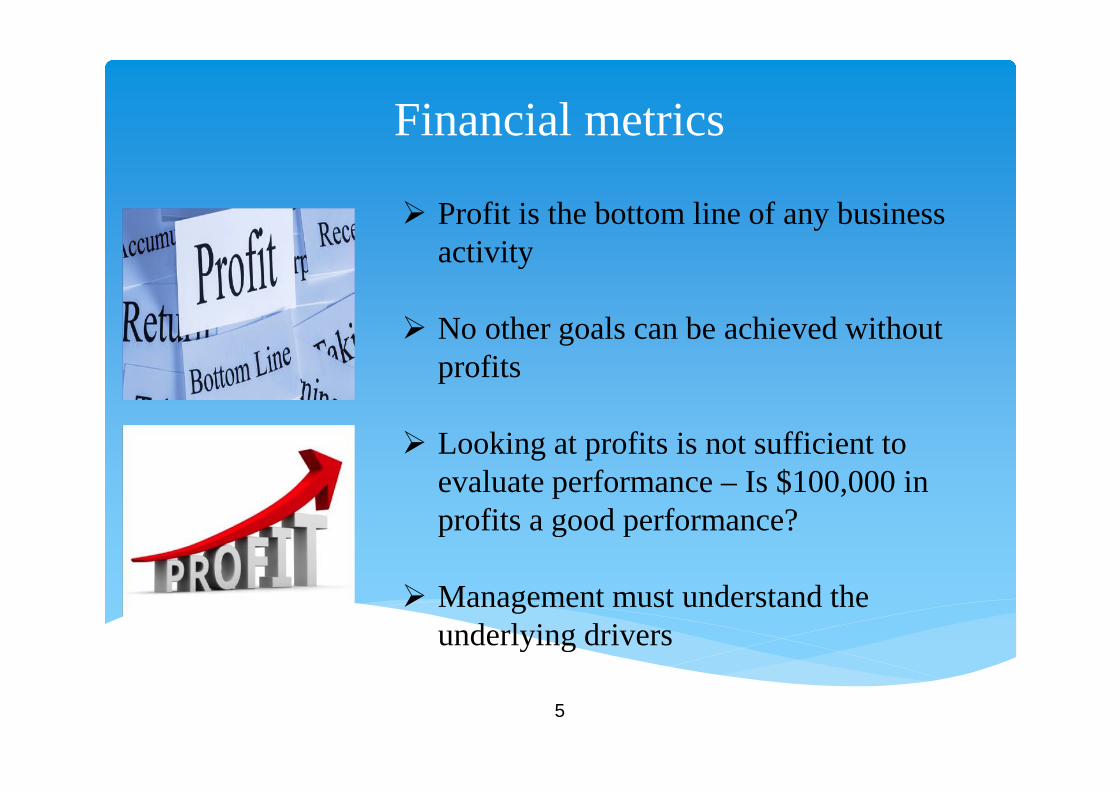
Financial metrics
Profit is the bottom line of any businessactivity
No other goals can be achieved withoutprofits
Looking at profits is not sufficient toevaluate performance – Is $100,000 inprofits a good performance?
Management must understand theunderlying drivers
6
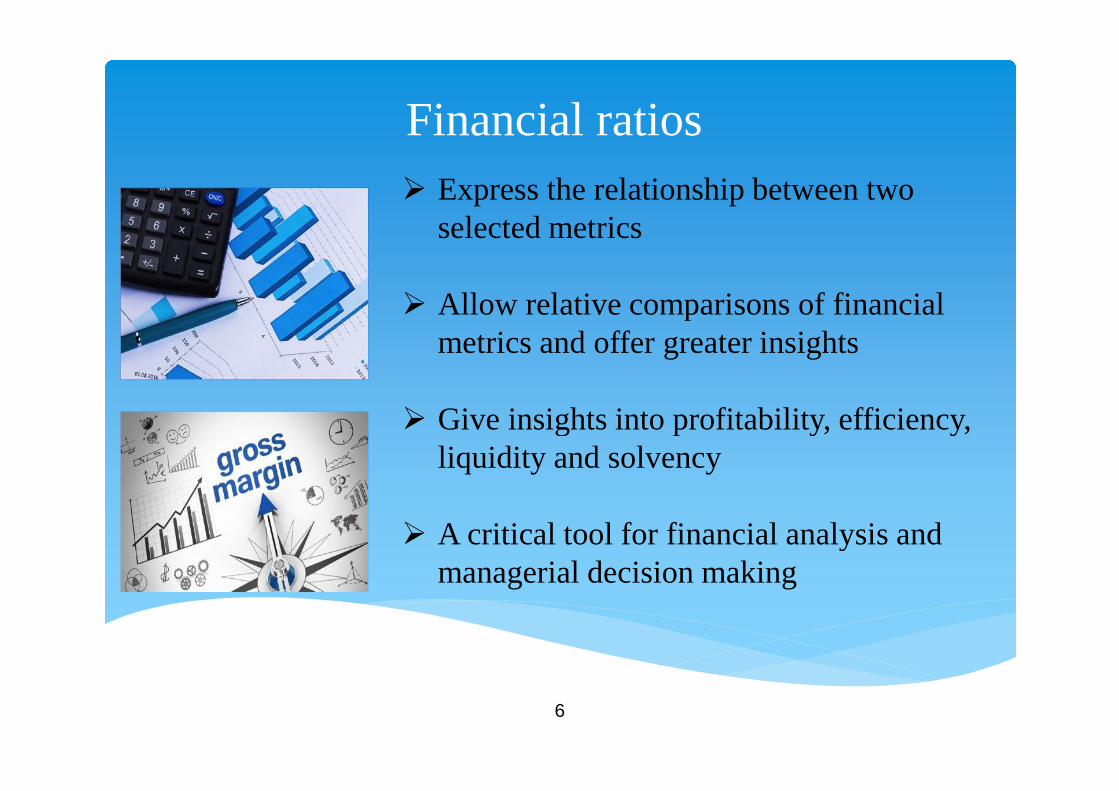
Financial ratios
Express the relationship between twoselected metrics
Allow relative comparisons of financialmetrics and offer greater insights
Give insights into profitability, efficiency,liquidity and solvency
A critical tool for financial analysis andmanagerial decision making
7
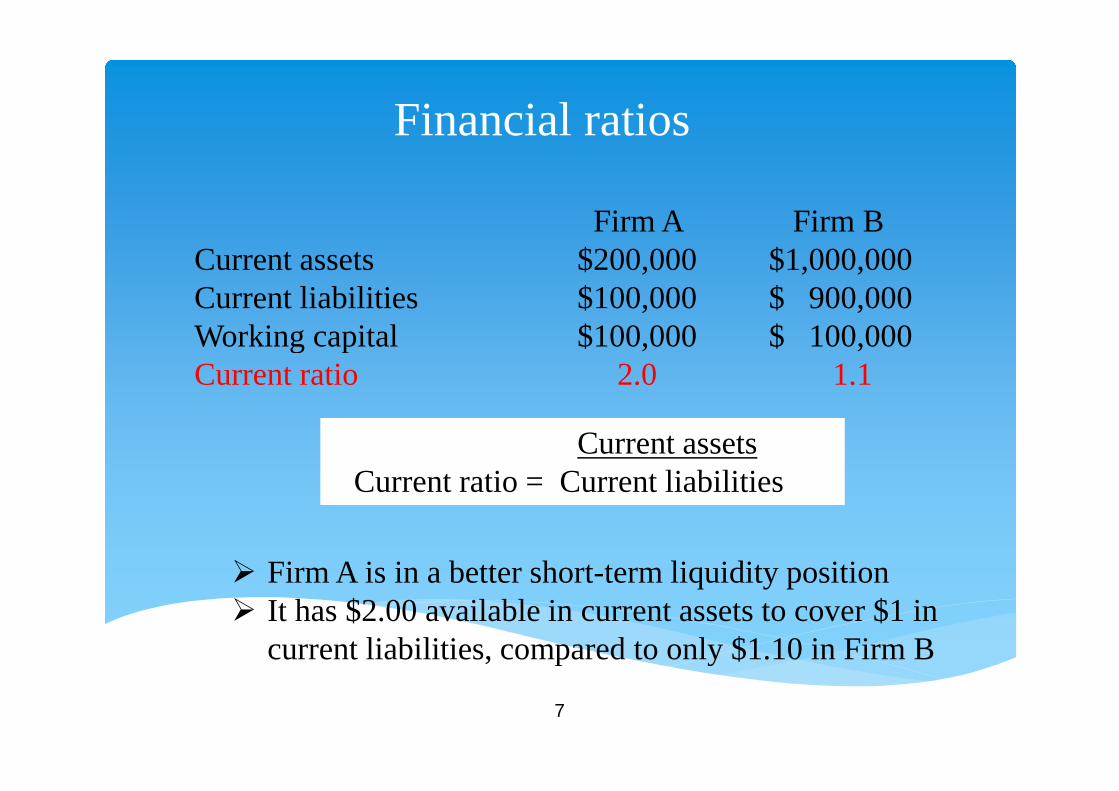
Financial ratios
Firm A Firm BCurrent assets $200,000 $1,000,000Current liabilities $100,000 $ 900,000Working capital $100,000 $ 100,000Current ratio 2.0 1.1
Current assetsCurrent ratio = Current liabilities
Firm A is in a better short-term liquidity position It has $2.00 available in current assets to cover $1 in
current liabilities, compared to only $1.10 in Firm B
8
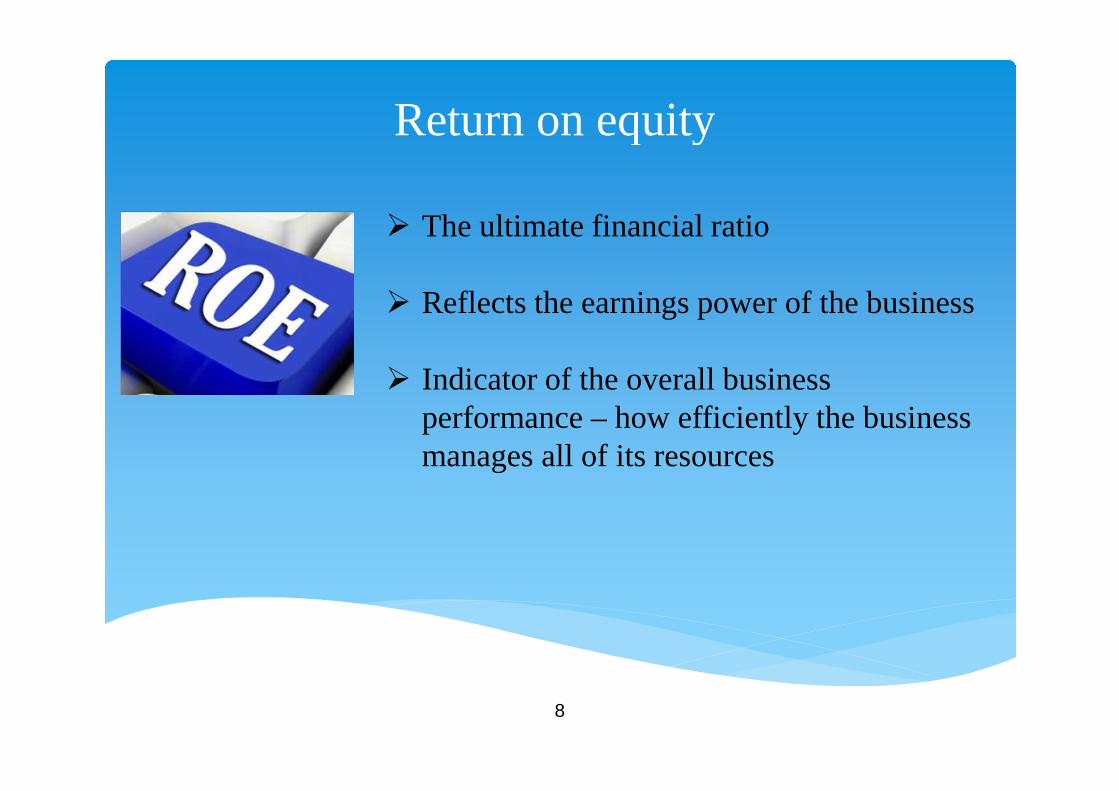
Return on equity
The ultimate financial ratio
Reflects the earnings power of the business
Indicator of the overall businessperformance – how efficiently the businessmanages all of its resources
9
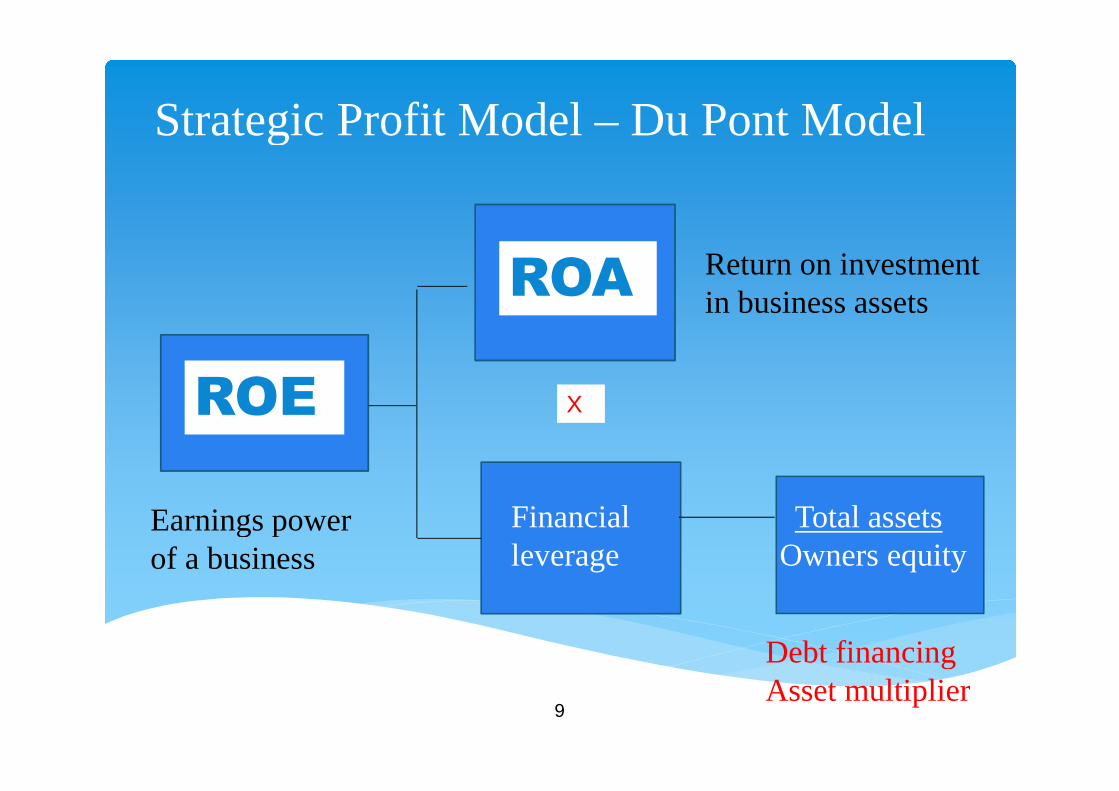
Strategic Profit Model – Du Pont Model
Financialleverage
X
Total assetsOwners equity
Debt financingAsset multiplier
Earnings powerof a business
Return on investmentin business assets
ROA
ROE
10
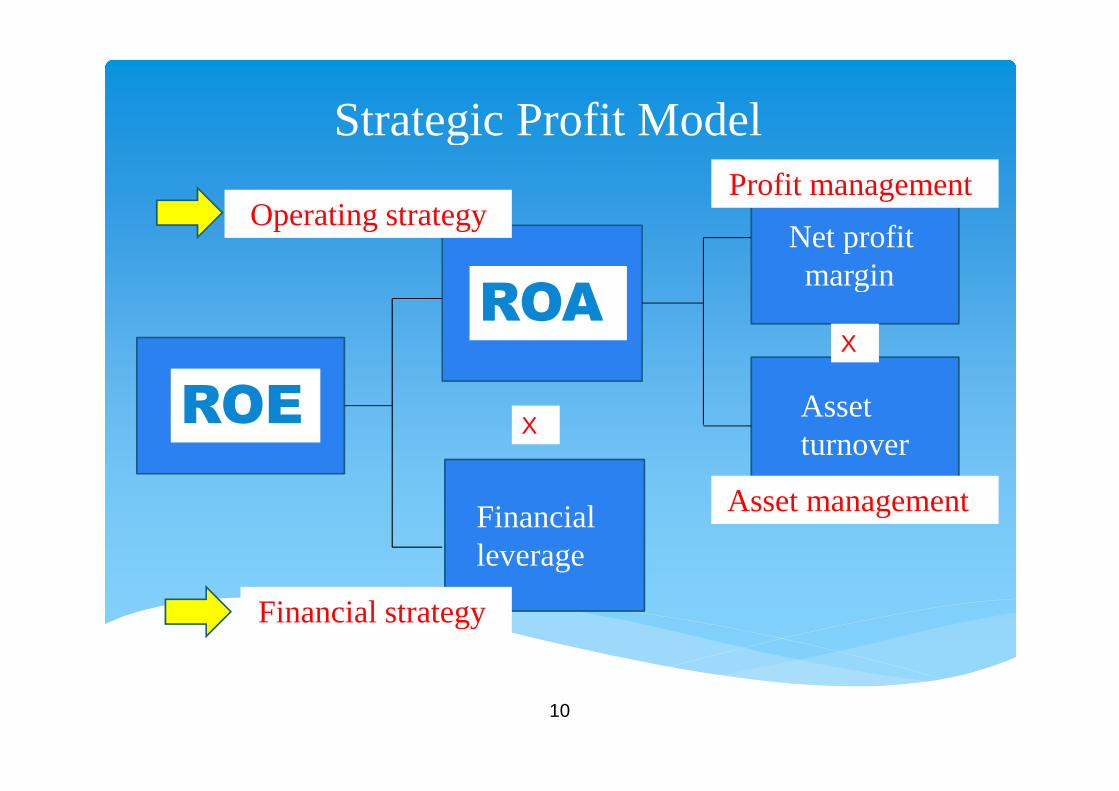
Strategic Profit Model
Financialleverage
Assetturnover
Net profitmargin
Profit management
Asset management
X
X
Financial strategy
Operating strategy
ROE
ROA
11
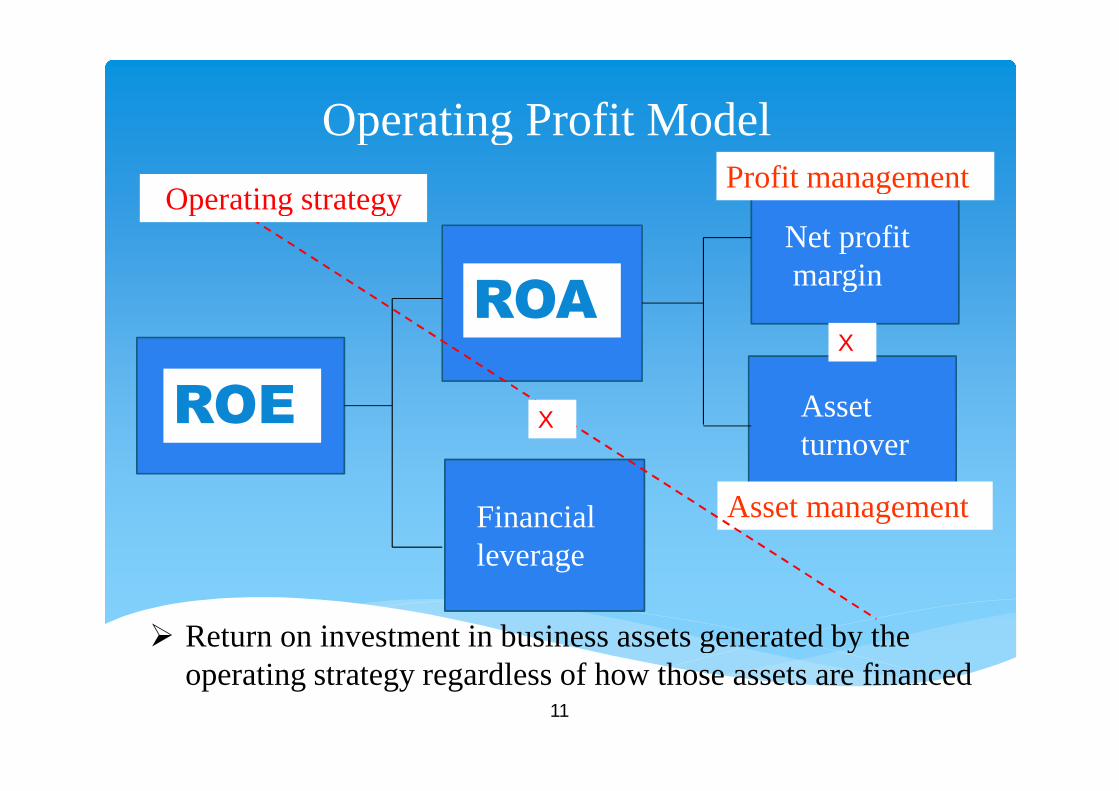
Operating Profit Model
Financialleverage
Assetturnover
Net profitmargin
Profit management
Asset management
X
X
Operating strategy
Return on investment in business assets generated by theoperating strategy regardless of how those assets are financed
ROE
ROA
12
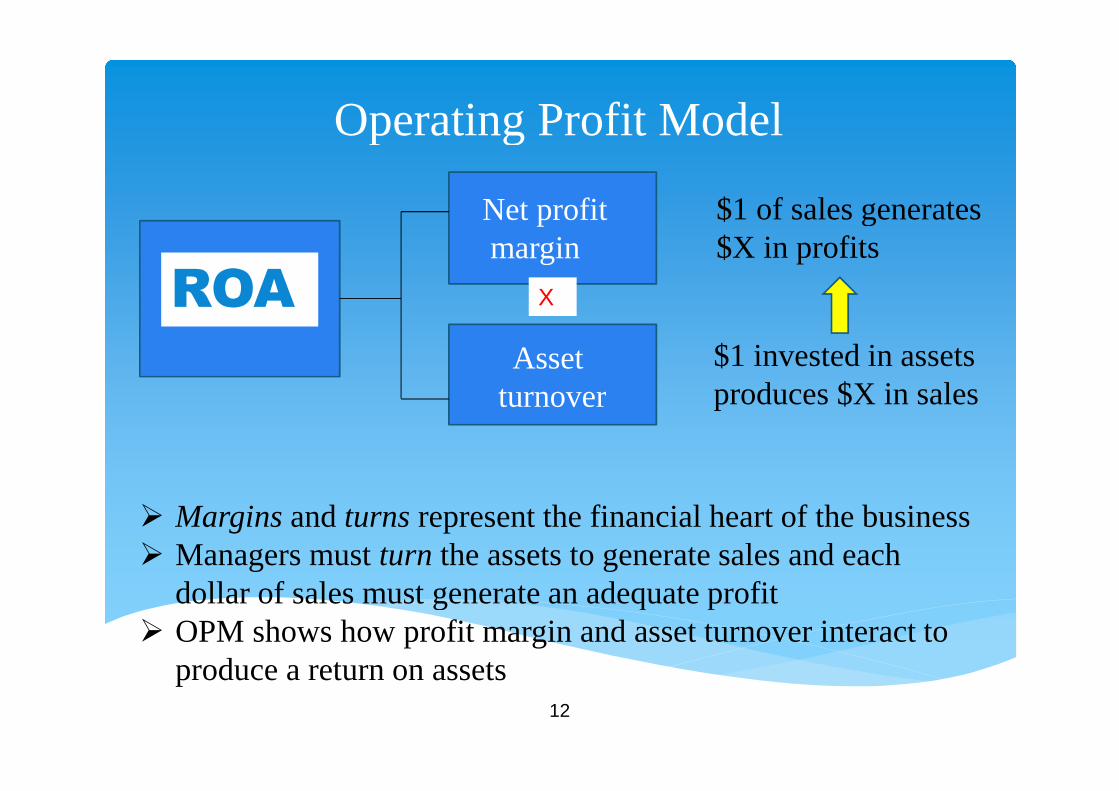
Operating Profit Model
Assetturnover
Net profitmargin
X
Margins and turns represent the financial heart of the business Managers must turn the assets to generate sales and each
dollar of sales must generate an adequate profit OPM shows how profit margin and asset turnover interact to
produce a return on assets
$1 invested in assetsproduces $X in sales
$1 of sales generates$X in profits
ROA
13
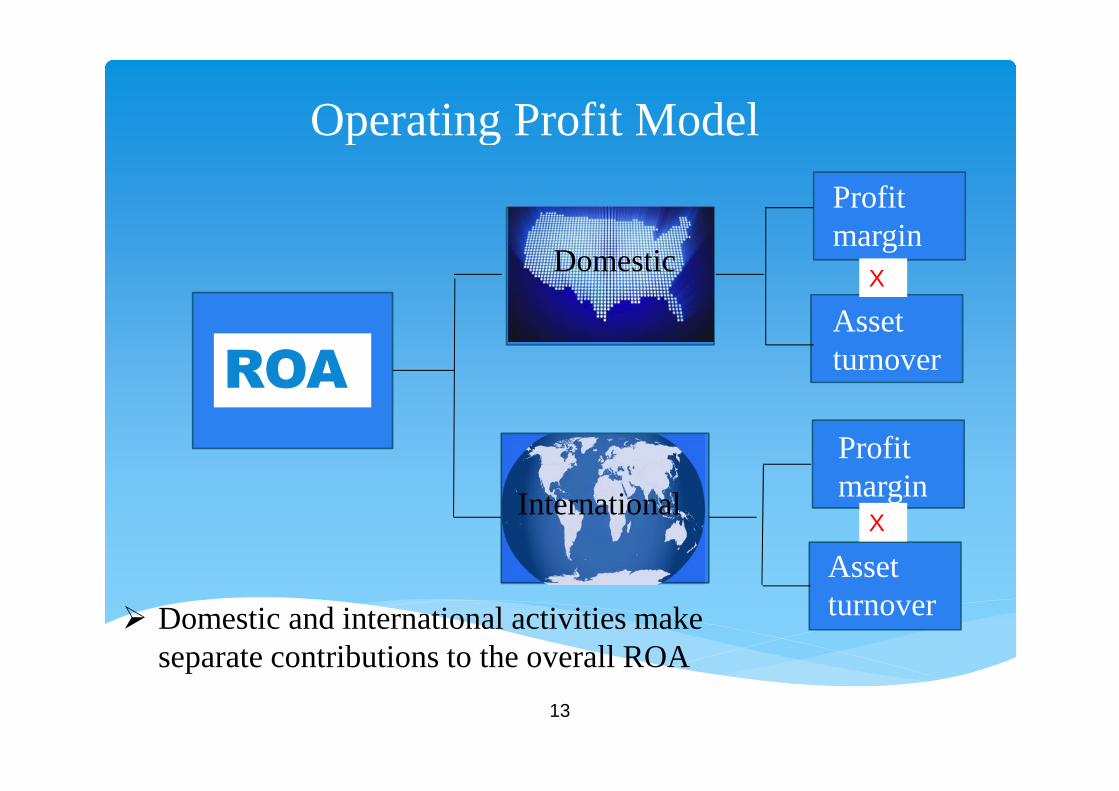
Operating Profit Model
Domestic
International
Profitmargin
Profitmargin
Assetturnover
Assetturnover
X
X
Domestic and international activities makeseparate contributions to the overall ROA
ROA
14
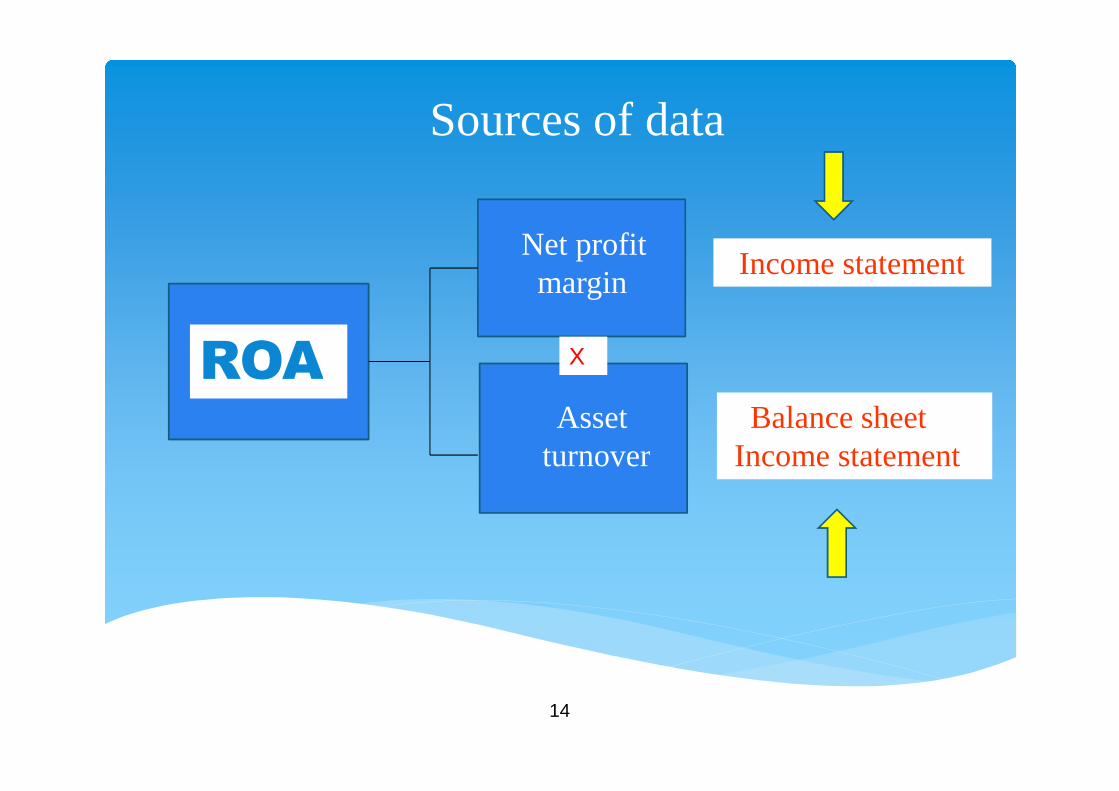
Sources of data
Assetturnover
Net profitmargin
Income statement
Balance sheetIncome statement
XROA
15
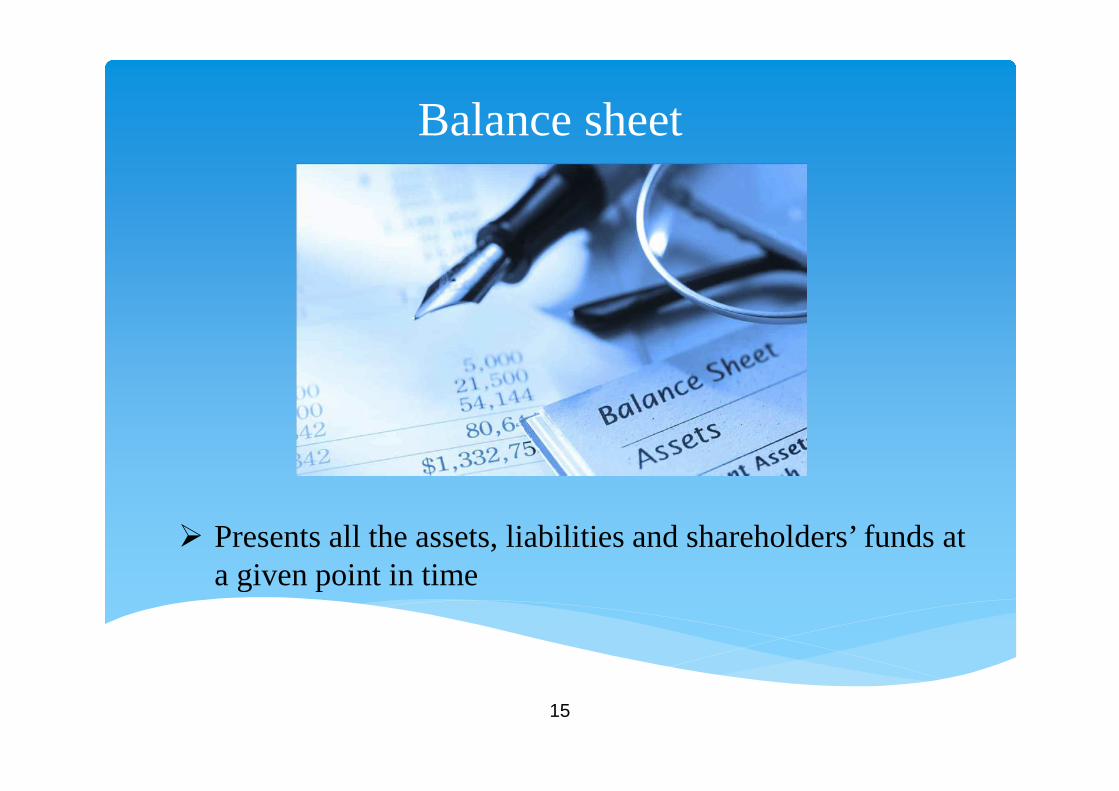
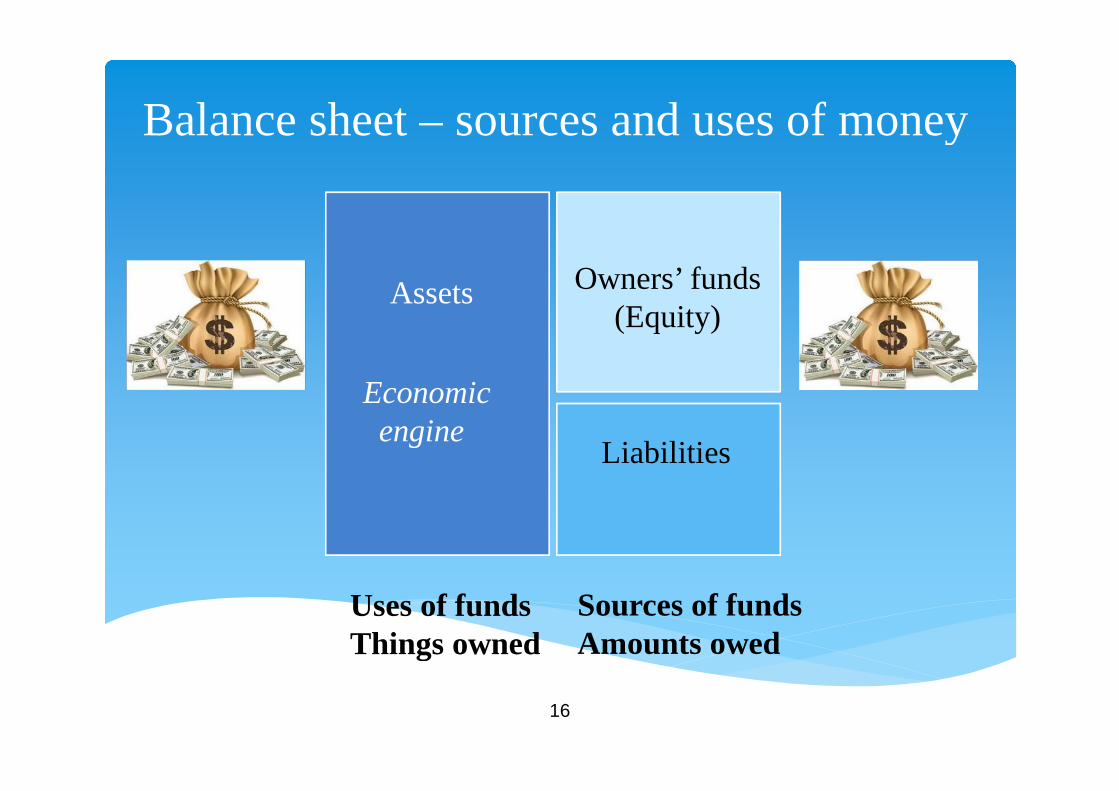
Balance sheet
Presents all the assets, liabilities and shareholders’ funds ata given point in time
16
Balance sheet – sources and uses of money
Assets Owners’ funds(Equity)
Liabilities
Sources of fundsAmounts owed
Uses of fundsThings owned
Economicengine
17
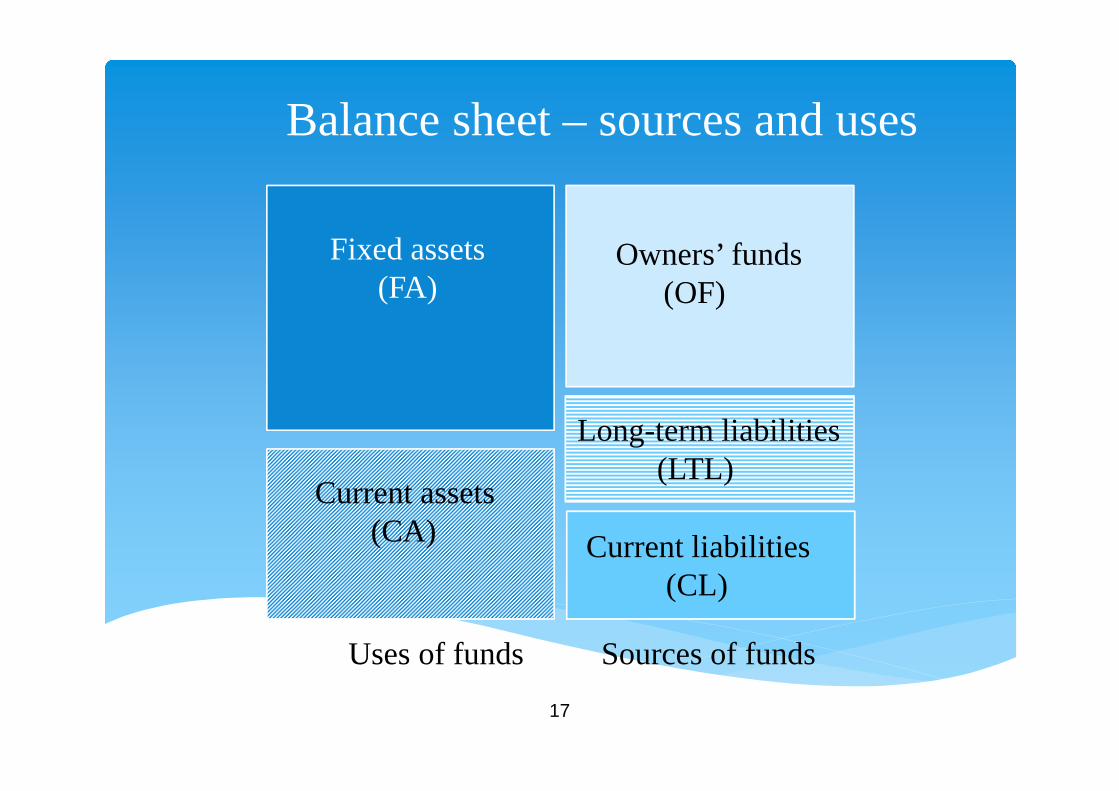
Balance sheet – sources and uses
Fixed assets(FA)
Owners’ funds(OF)
Long-term liabilities(LTL)
Sources of fundsUses of funds
Current liabilities(CL)
Current assets(CA)
18
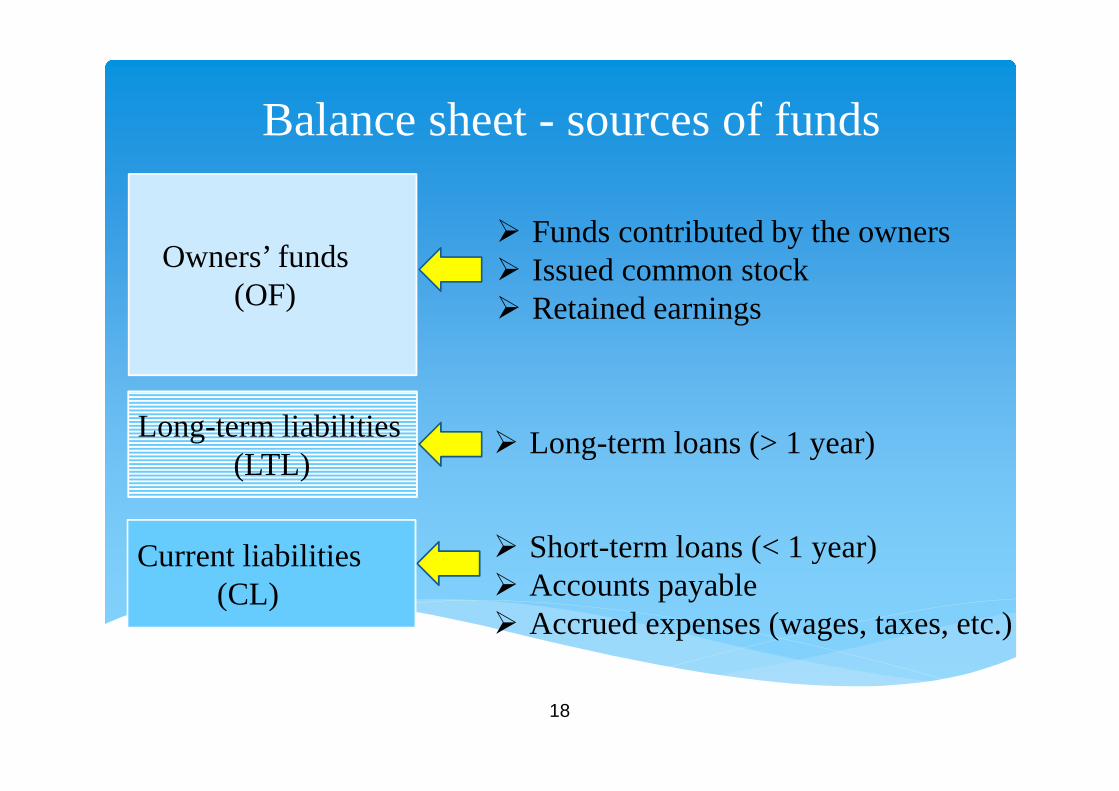
Balance sheet - sources of funds
Funds contributed by the owners Issued common stock Retained earnings
Long-term loans (> 1 year)
Short-term loans (< 1 year) Accounts payable Accrued expenses (wages, taxes, etc.)
Owners’ funds(OF)
Long-term liabilities(LTL)
Current liabilities(CL)
19
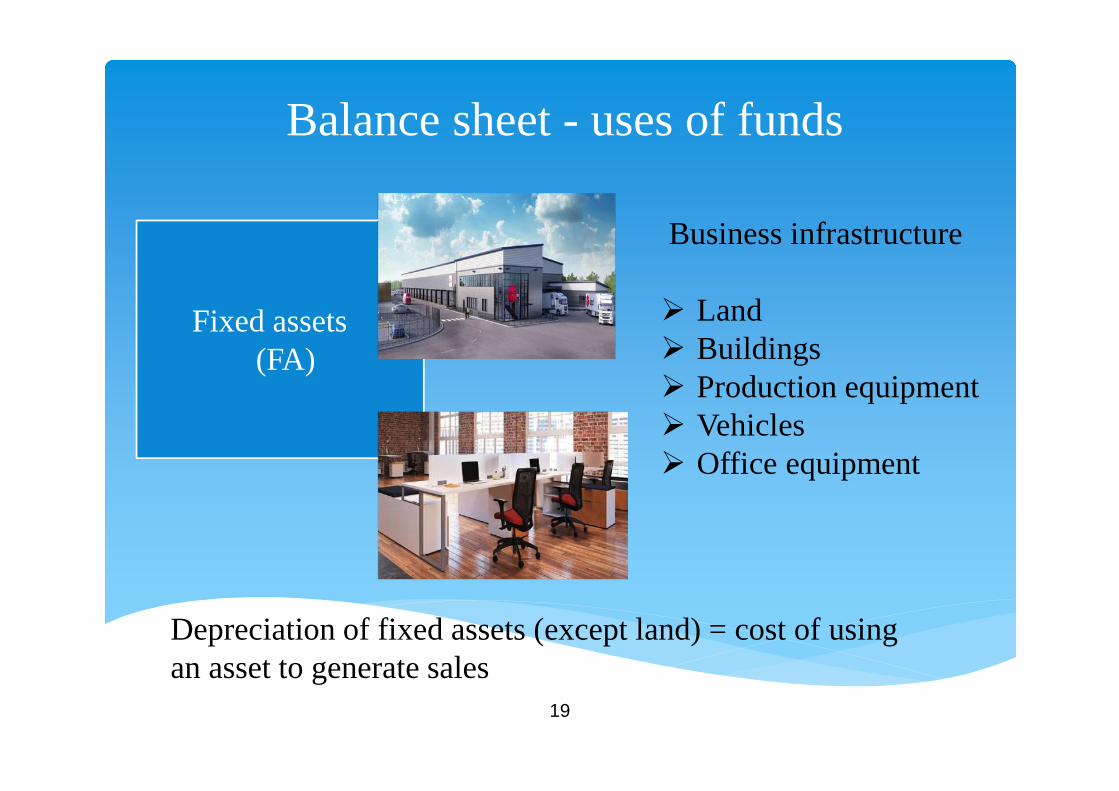
Balance sheet - uses of funds
Fixed assets(FA)
Business infrastructure
Land Buildings Production equipment Vehicles Office equipment
Depreciation of fixed assets (except land) = cost of usingan asset to generate sales
20
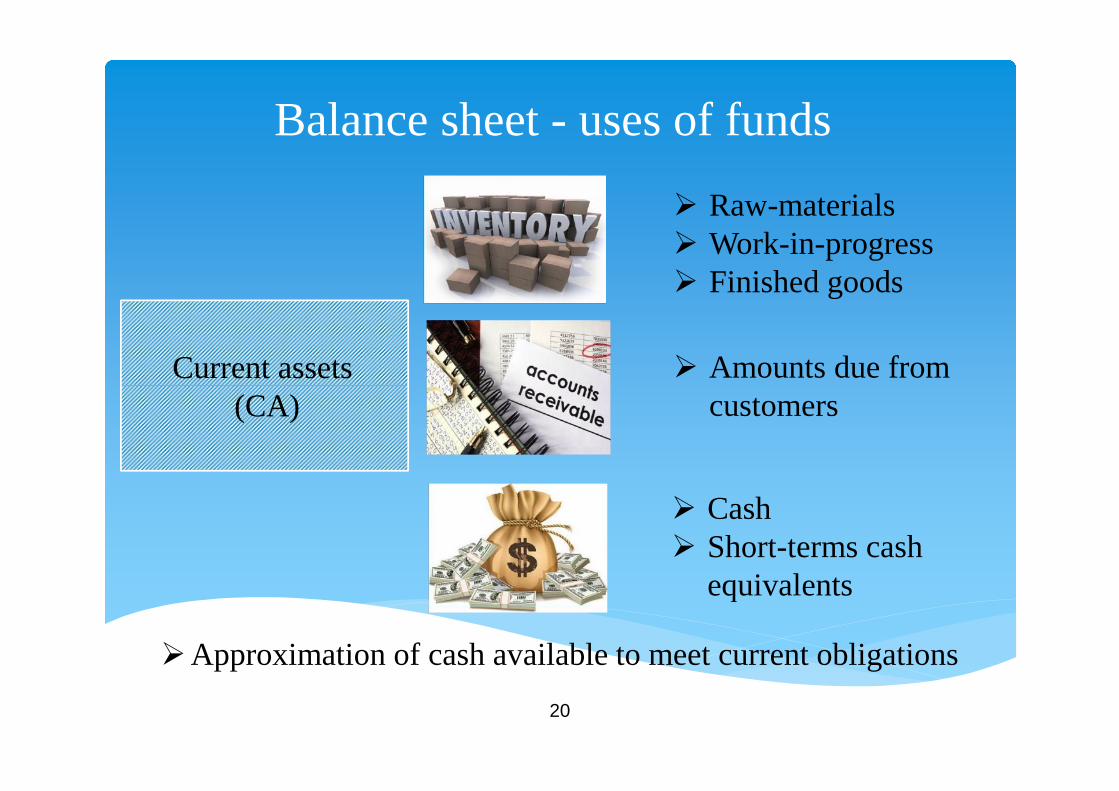
Balance sheet - uses of funds
Current assets(CA)
Raw-materials Work-in-progress Finished goods
Amounts due fromcustomers
Cash Short-terms cash
equivalents
Approximation of cash available to meet current obligations
21
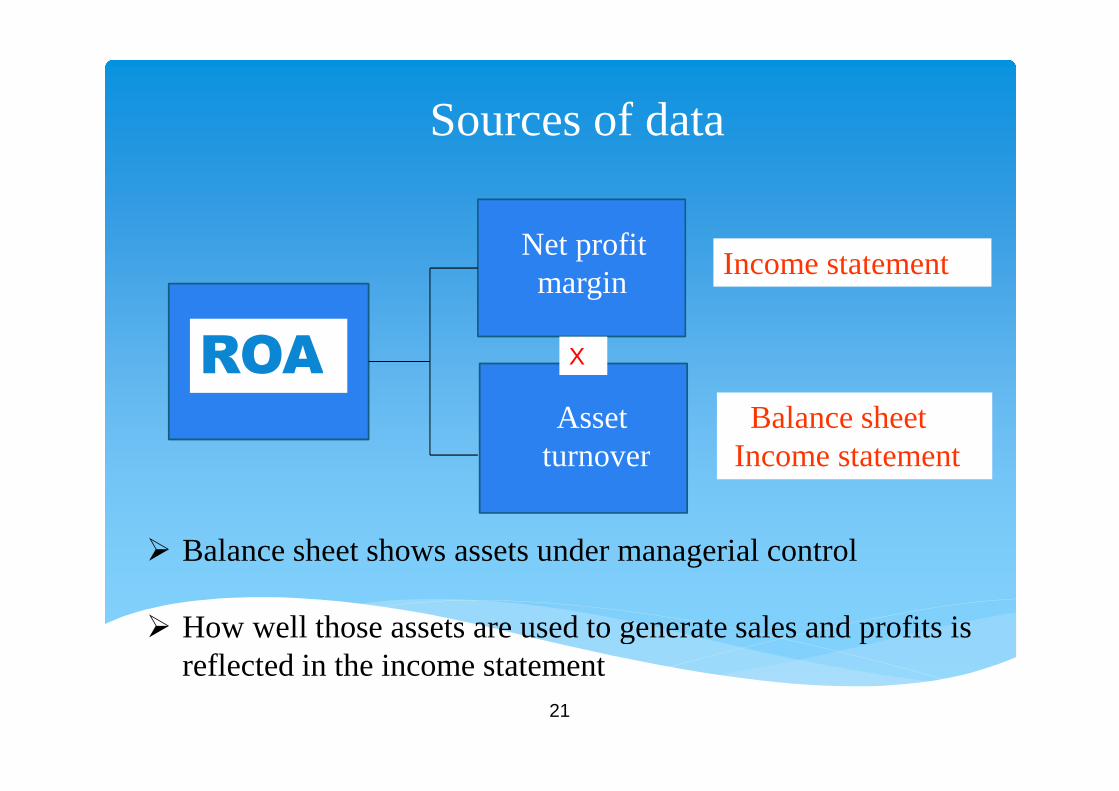
Sources of data
Assetturnover
Net profitmargin
Income statement
Balance sheetIncome statement
X
Balance sheet shows assets under managerial control
How well those assets are used to generate sales and profits isreflected in the income statement
ROA
22
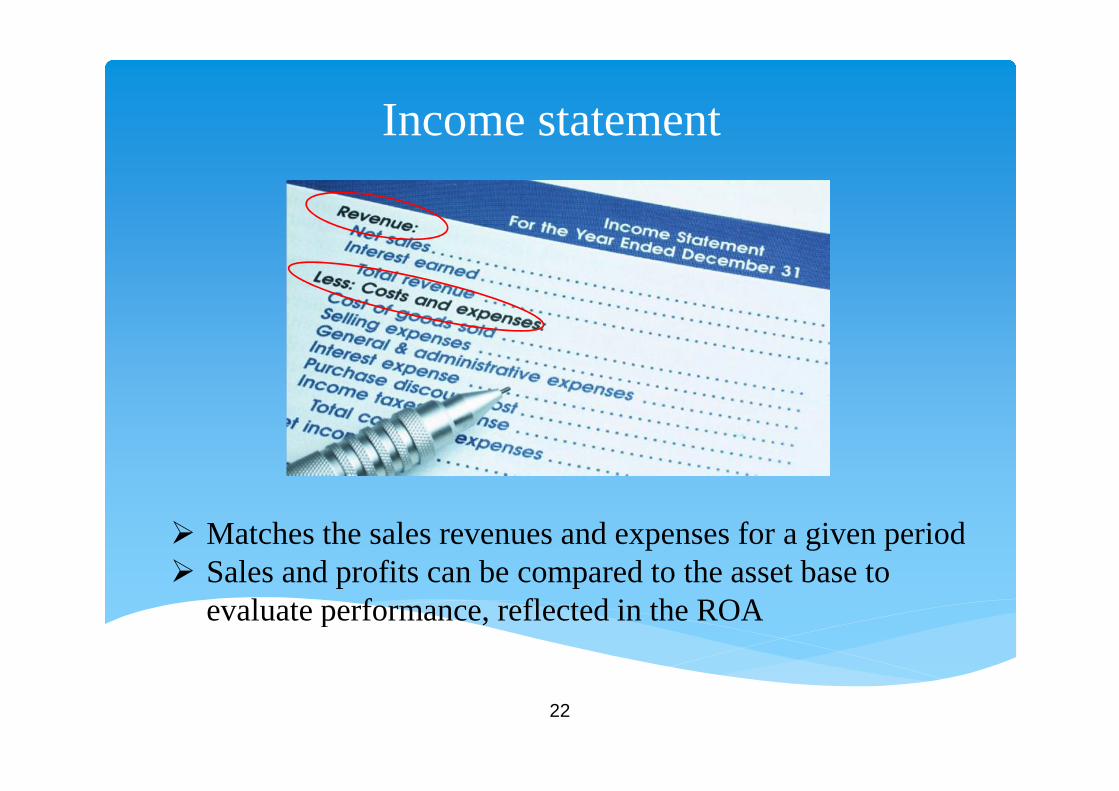
Income statement
Matches the sales revenues and expenses for a given period Sales and profits can be compared to the asset base to
evaluate performance, reflected in the ROA
23
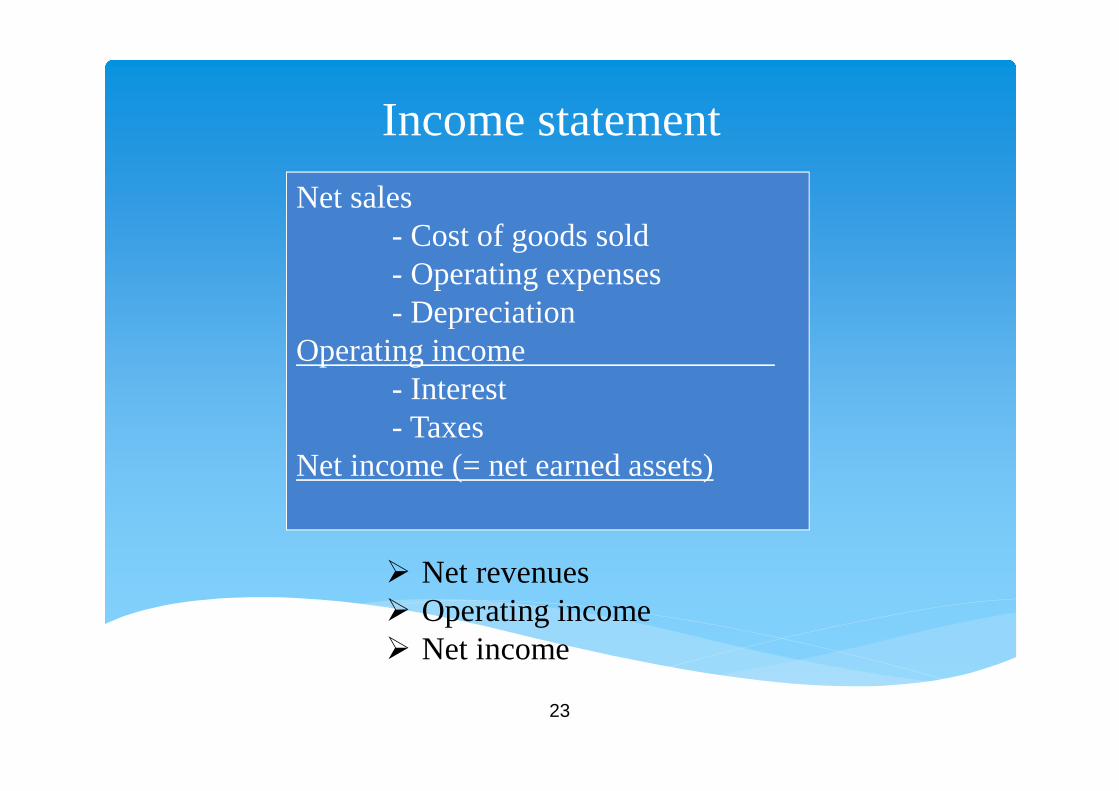
Income statement
Net sales- Cost of goods sold- Operating expenses- Depreciation
Operating income- Interest- Taxes
Net income (= net earned assets)
Net revenues Operating income Net income
24
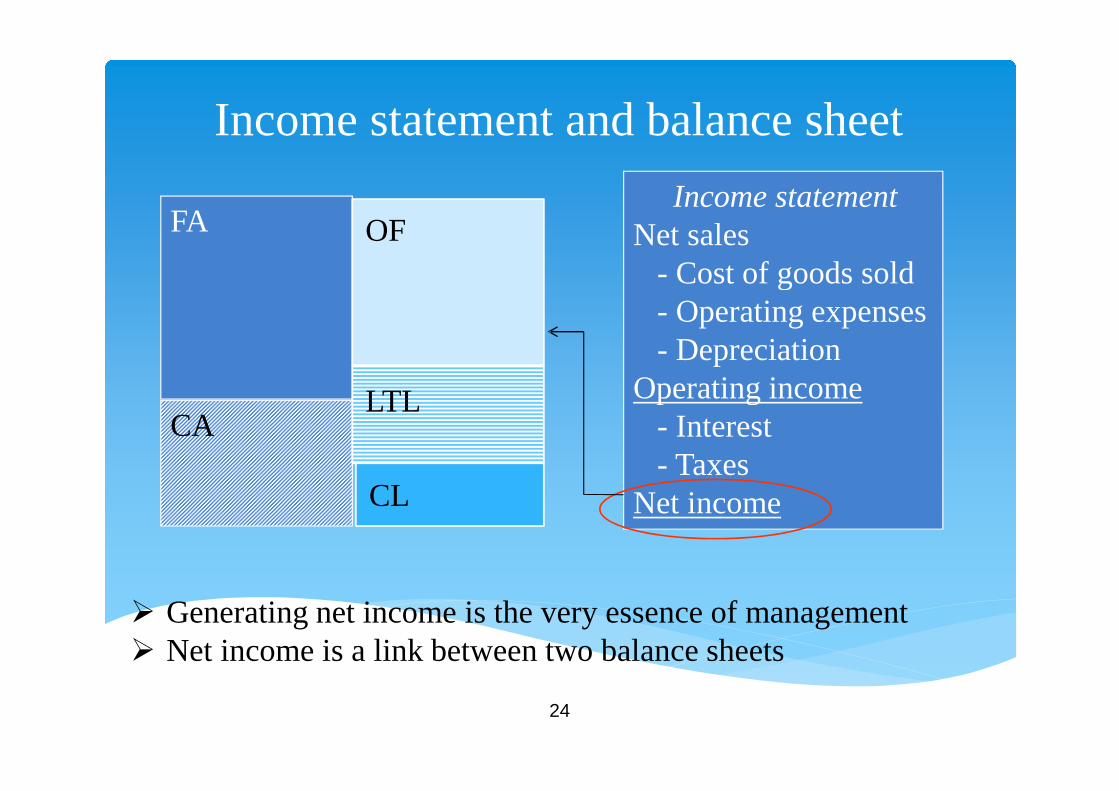
Income statement and balance sheet
Income statementNet sales
- Cost of goods sold- Operating expenses- Depreciation
Operating income- Interest- Taxes
Net income
FA
CA
OF
LTL
CL
Generating net income is the very essence of management Net income is a link between two balance sheets
25
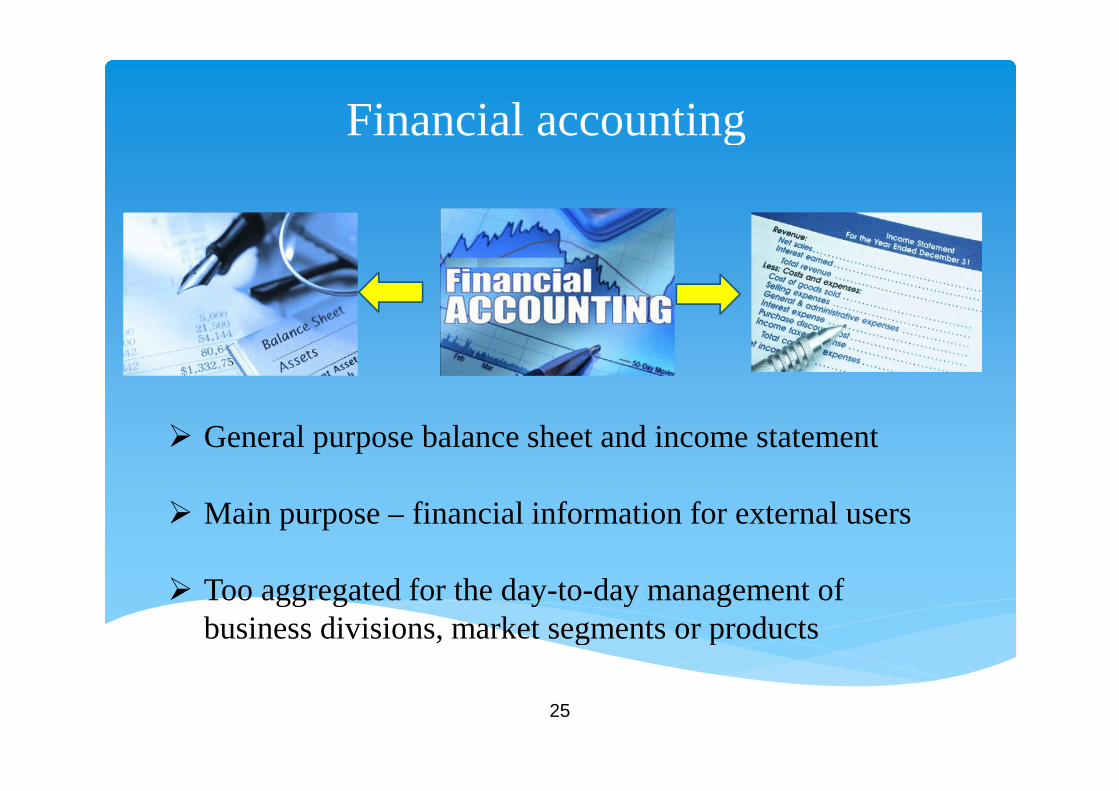
Financial accounting
General purpose balance sheet and income statement
Main purpose – financial information for external users
Too aggregated for the day-to-day management ofbusiness divisions, market segments or products
26
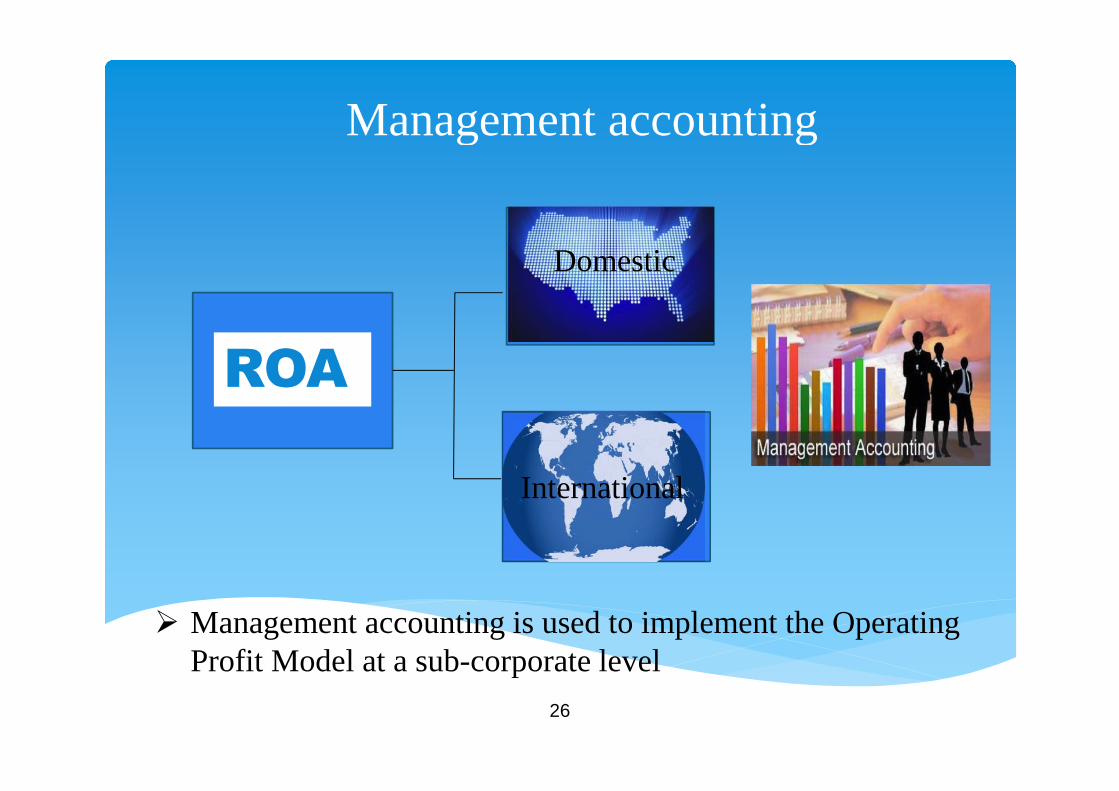
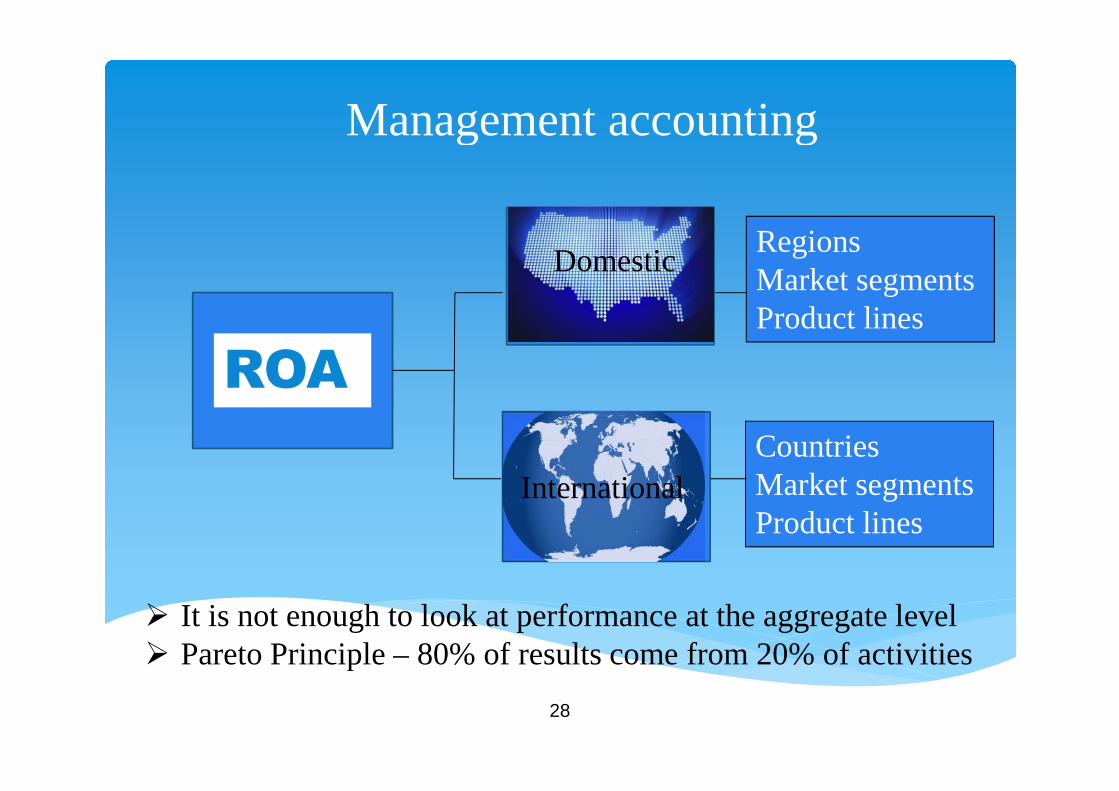
Management accounting
Domestic
International
Management accounting is used to implement the OperatingProfit Model at a sub-corporate level
ROA
27
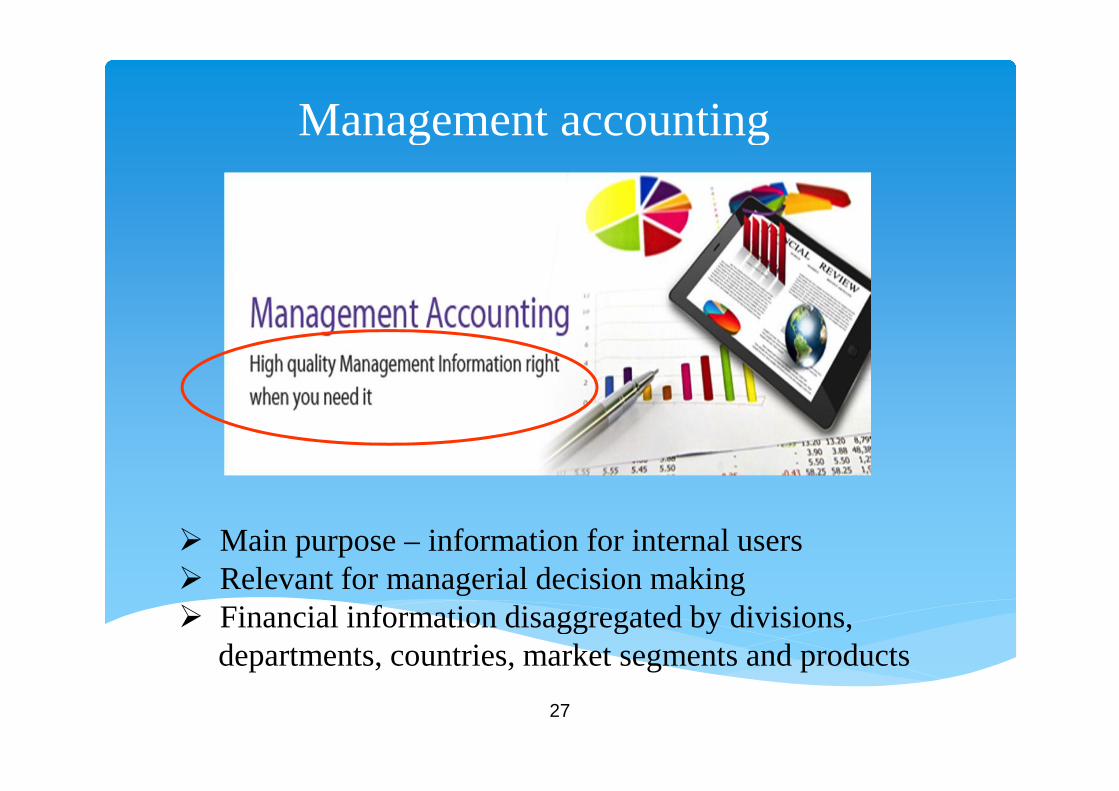
Management accounting
Main purpose – information for internal users Relevant for managerial decision making Financial information disaggregated by divisions,
departments, countries, market segments and products
28
Management accounting
Domestic
International
It is not enough to look at performance at the aggregate level Pareto Principle – 80% of results come from 20% of activities
CountriesMarket segmentsProduct lines
RegionsMarket segmentsProduct lines
ROA
29
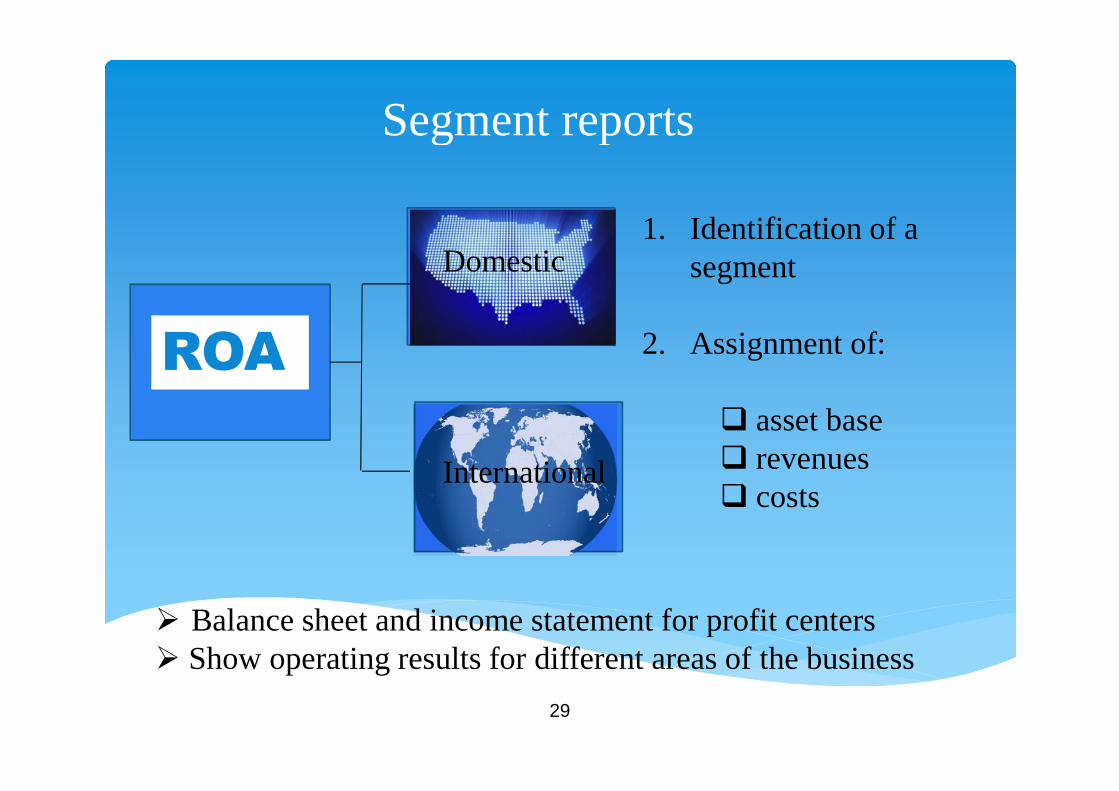
Segment reports
Domestic
International
Balance sheet and income statement for profit centers Show operating results for different areas of the business
1. Identification of asegment
2. Assignment of:
asset base revenues costs
ROA
30
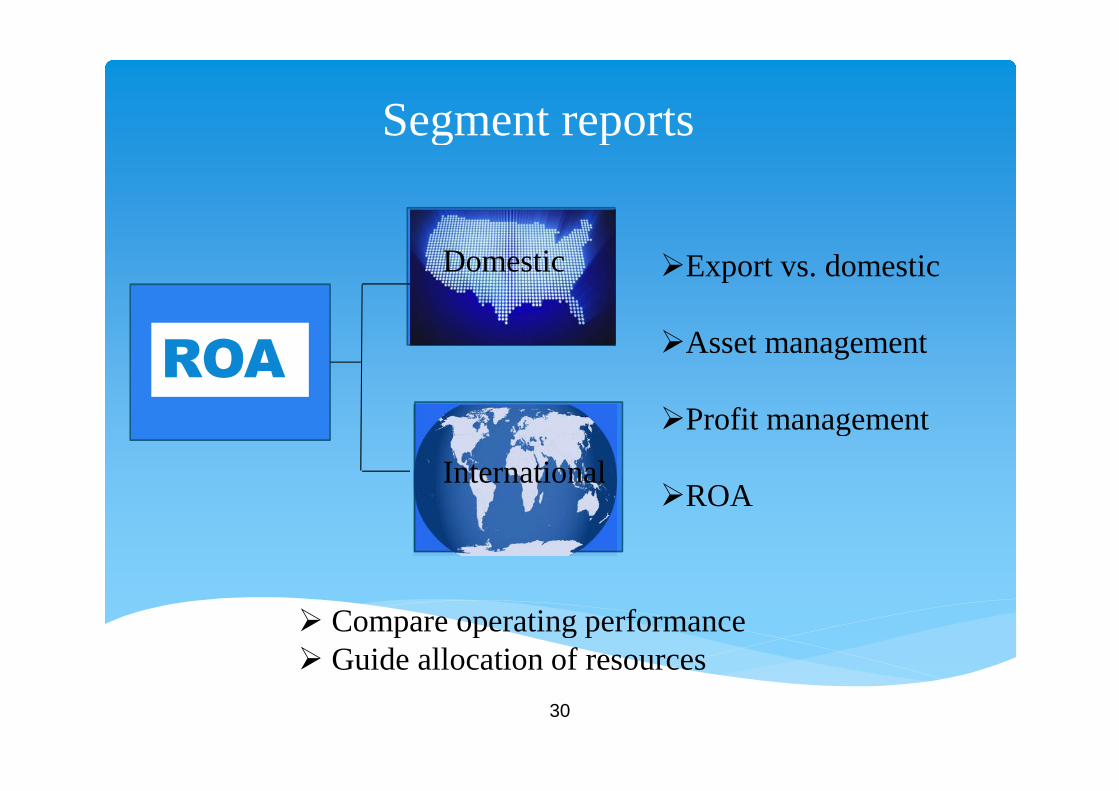
Segment reports
Domestic
International
Compare operating performance Guide allocation of resources
Export vs. domestic
Asset management
Profit management
ROA
ROA
31
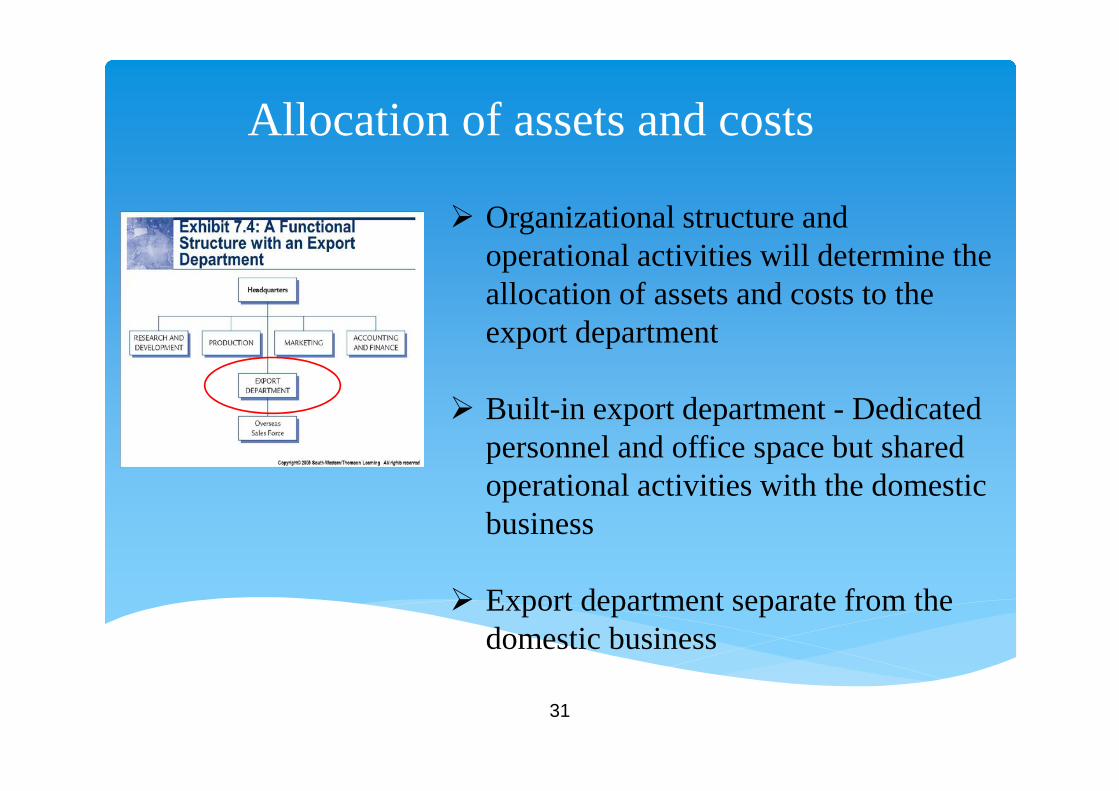
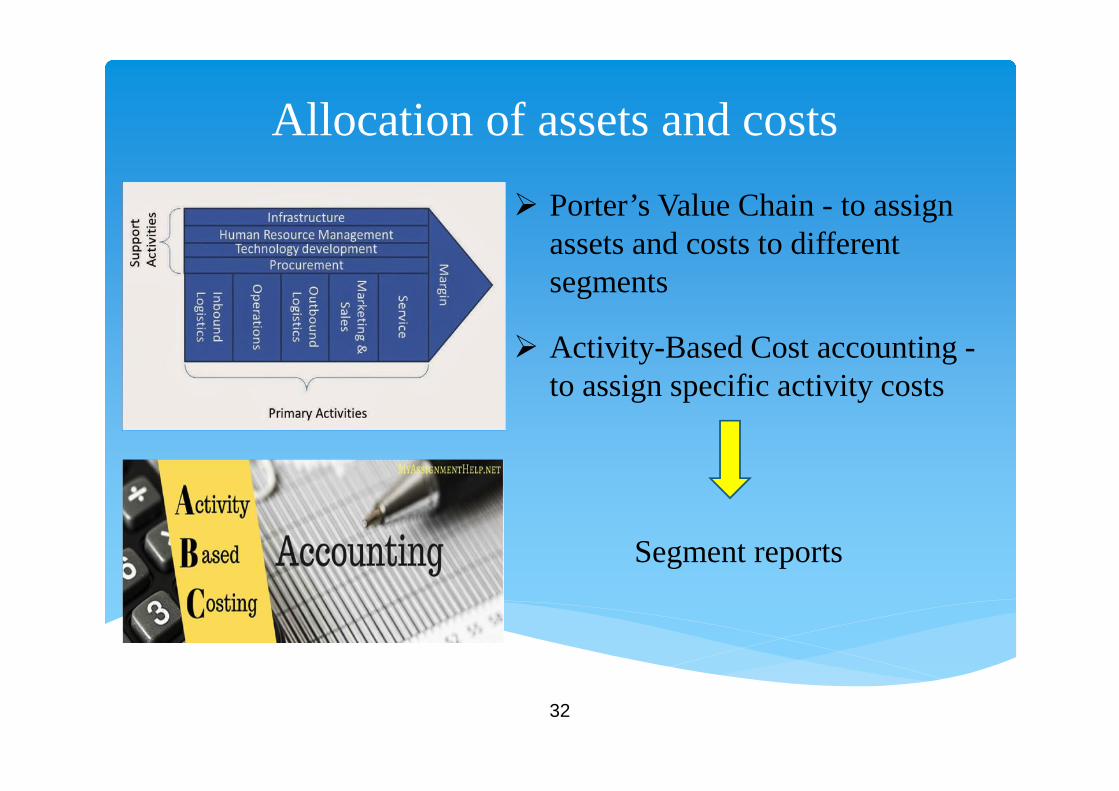
Allocation of assets and costs
Organizational structure andoperational activities will determine theallocation of assets and costs to theexport department
Built-in export department - Dedicatedpersonnel and office space but sharedoperational activities with the domesticbusiness
Export department separate from thedomestic business
32
Allocation of assets and costs
Porter’s Value Chain - to assignassets and costs to differentsegments
Activity-Based Cost accounting -to assign specific activity costs
Segment reports
33
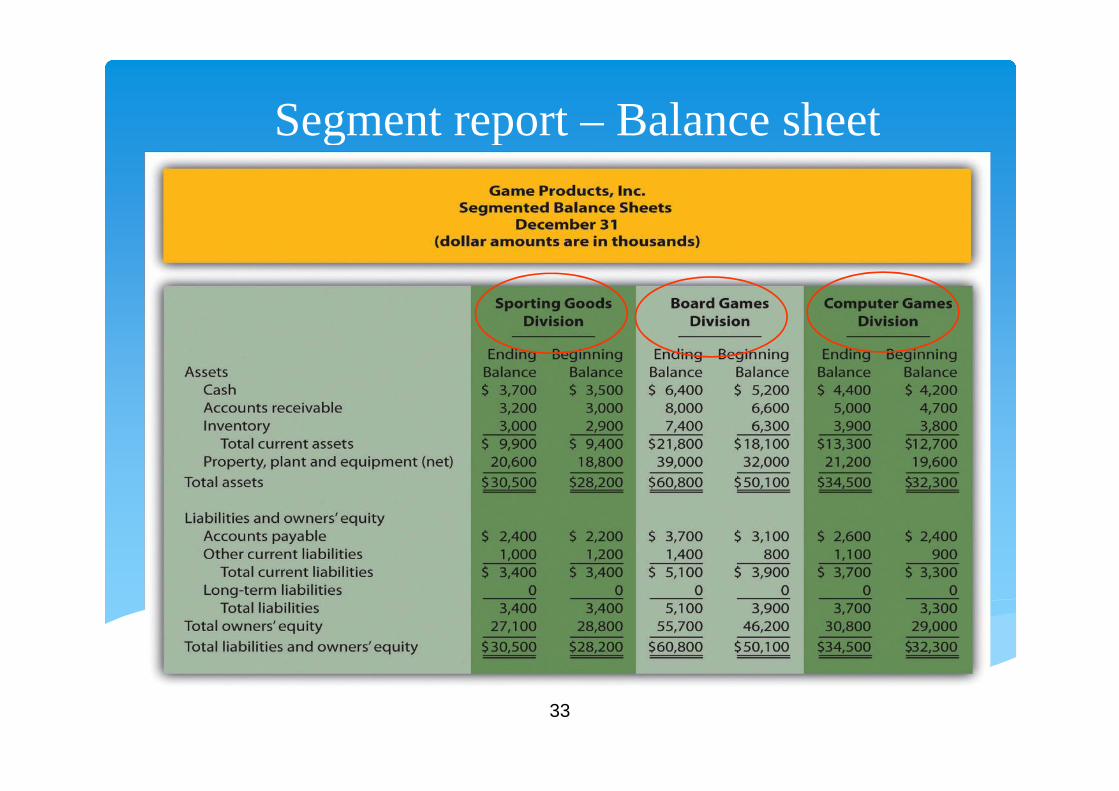
Segment report – Balance sheet
34
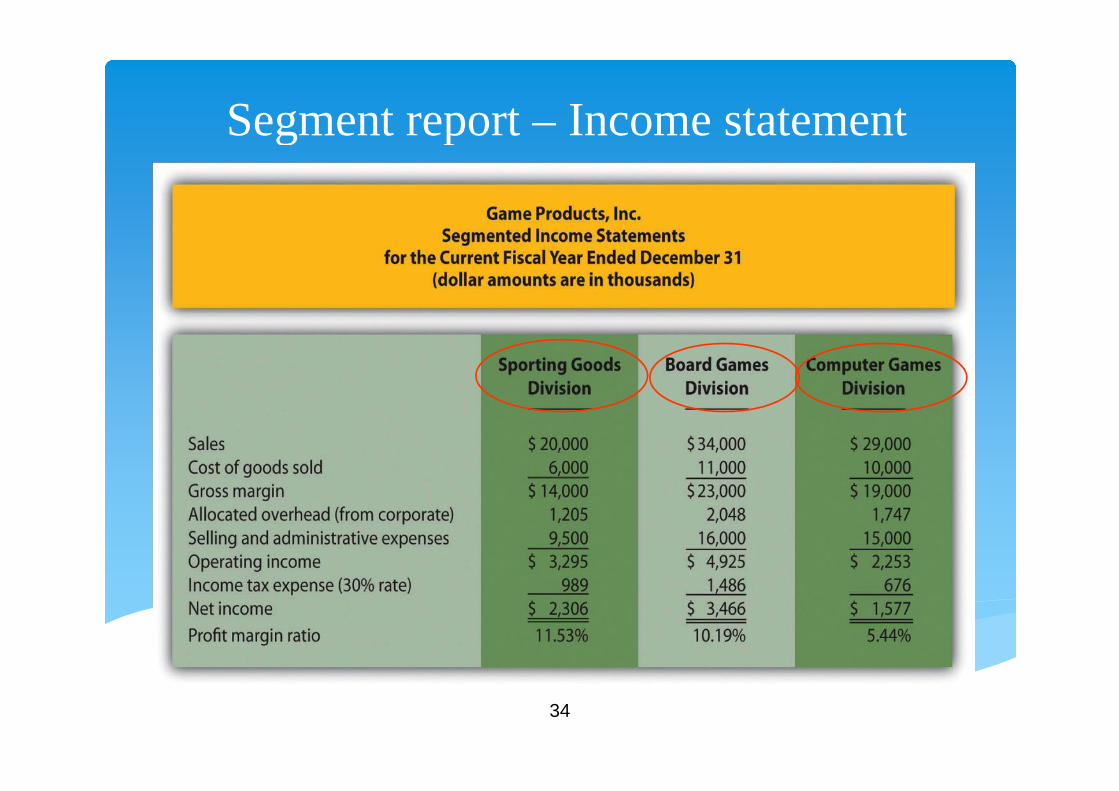
Segment report – Income statement
35
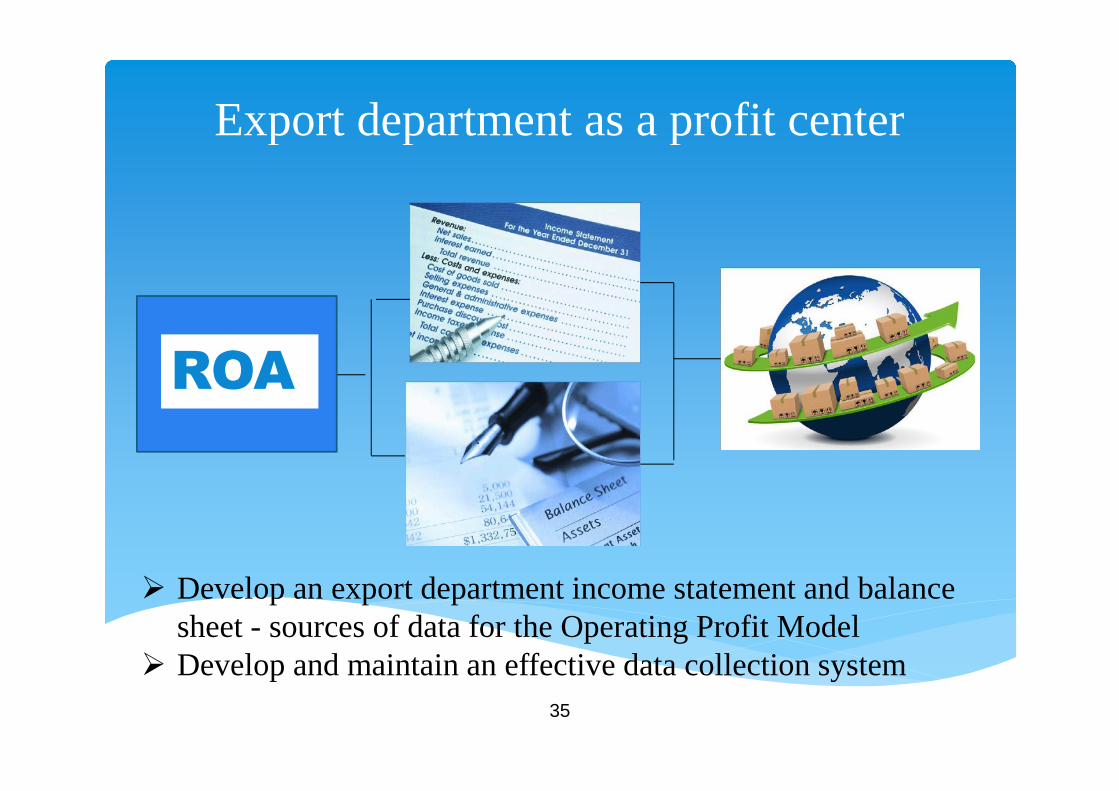
Export department as a profit center
Develop an export department income statement and balancesheet - sources of data for the Operating Profit Model
Develop and maintain an effective data collection system
ROA
36
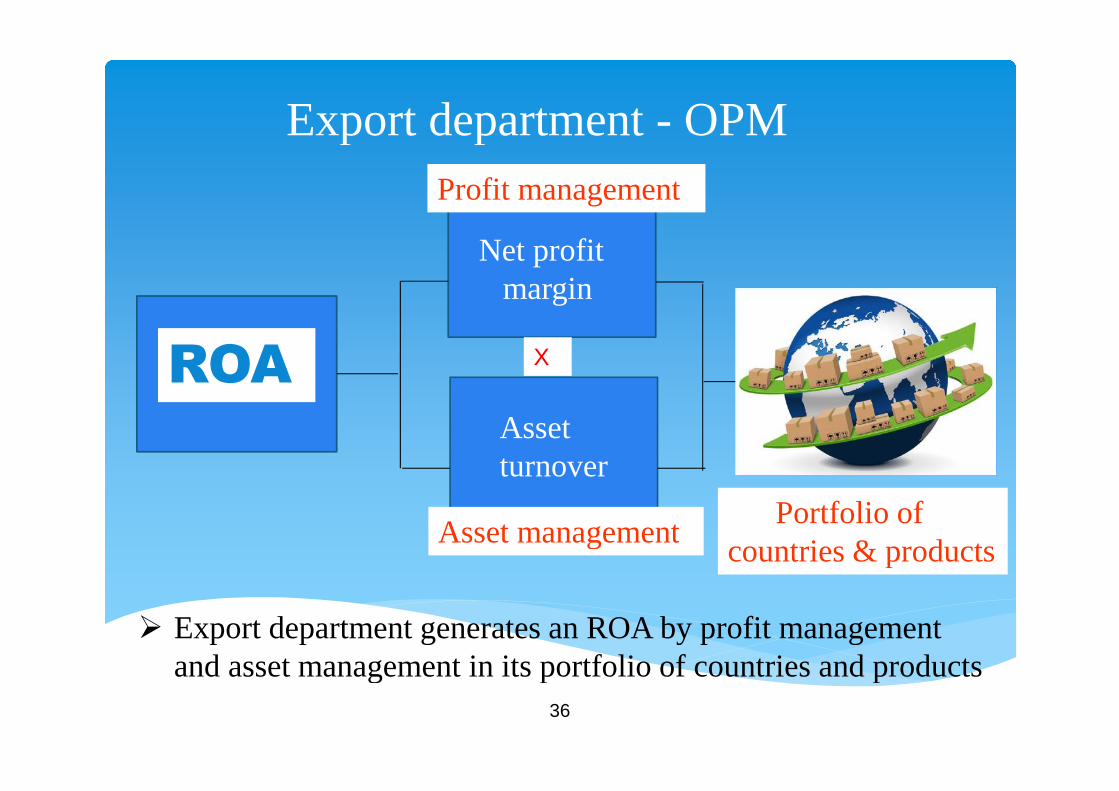
Export department - OPM
Assetturnover
X
Portfolio ofcountries & products
Profit management
Asset management
Net profitmargin
Export department generates an ROA by profit managementand asset management in its portfolio of countries and products
ROA
37
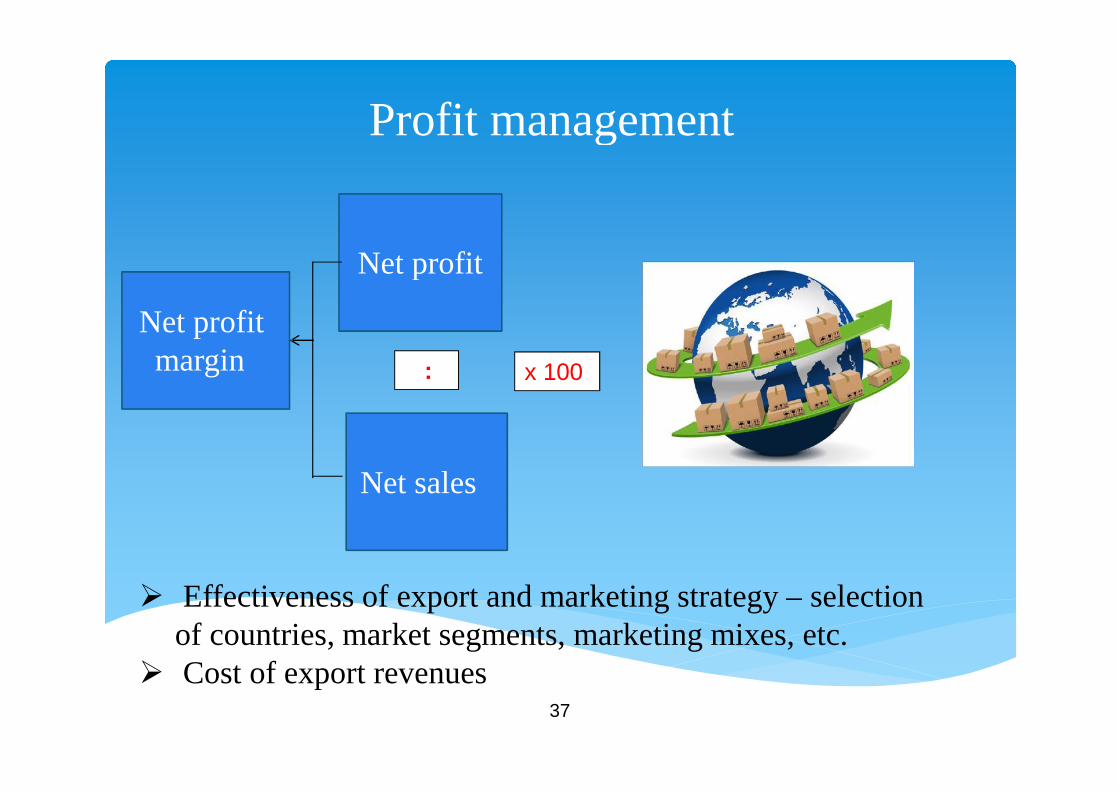
Profit management
Net sales
Net profit
:
Net profitmargin
Effectiveness of export and marketing strategy – selectionof countries, market segments, marketing mixes, etc.
Cost of export revenues
x 100
38
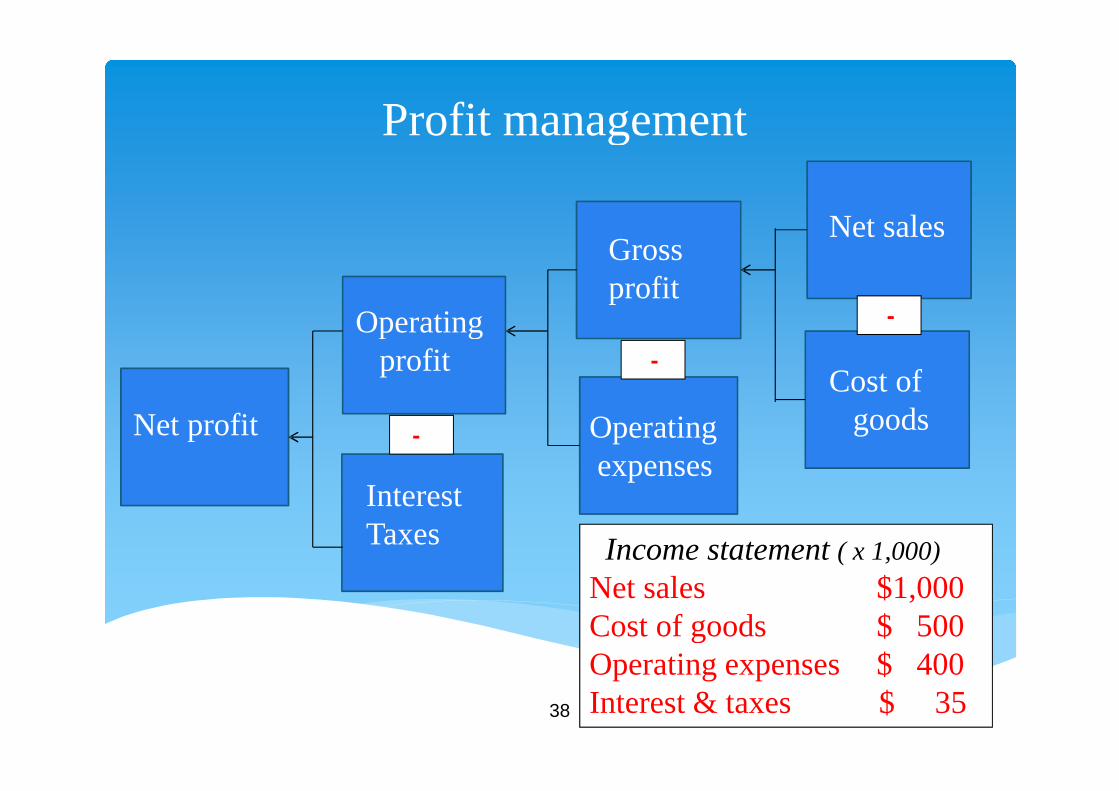
Profit management
InterestTaxes
Operatingprofit
Operatingexpenses
Grossprofit
Net sales
Cost ofgoods
-
-
-
Net profit
Income statement ( x 1,000)
Net sales $1,000Cost of goods $ 500Operating expenses $ 400Interest & taxes $ 35
39
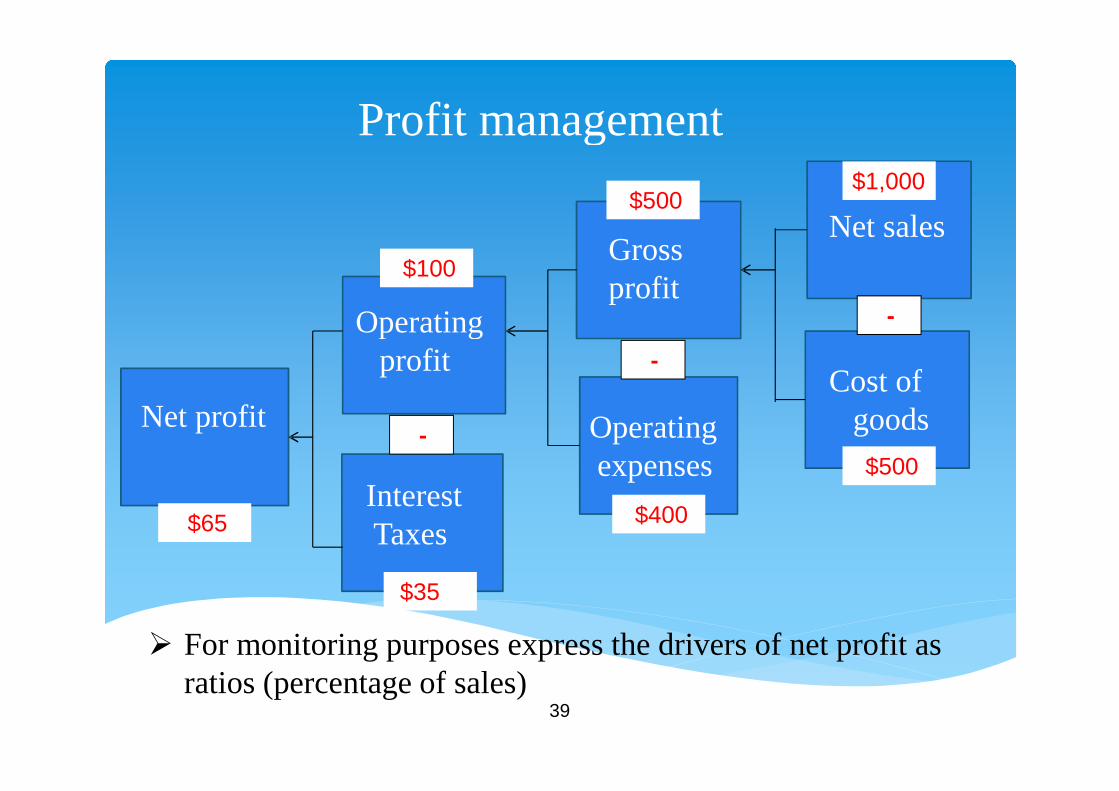
Profit management
Operatingprofit
Operatingexpenses
Grossprofit
Net sales
Cost ofgoods
-
-
-
$1,000
$500
$500
$400
$100
$35
$65
Net profit
InterestTaxes
For monitoring purposes express the drivers of net profit asratios (percentage of sales)
40
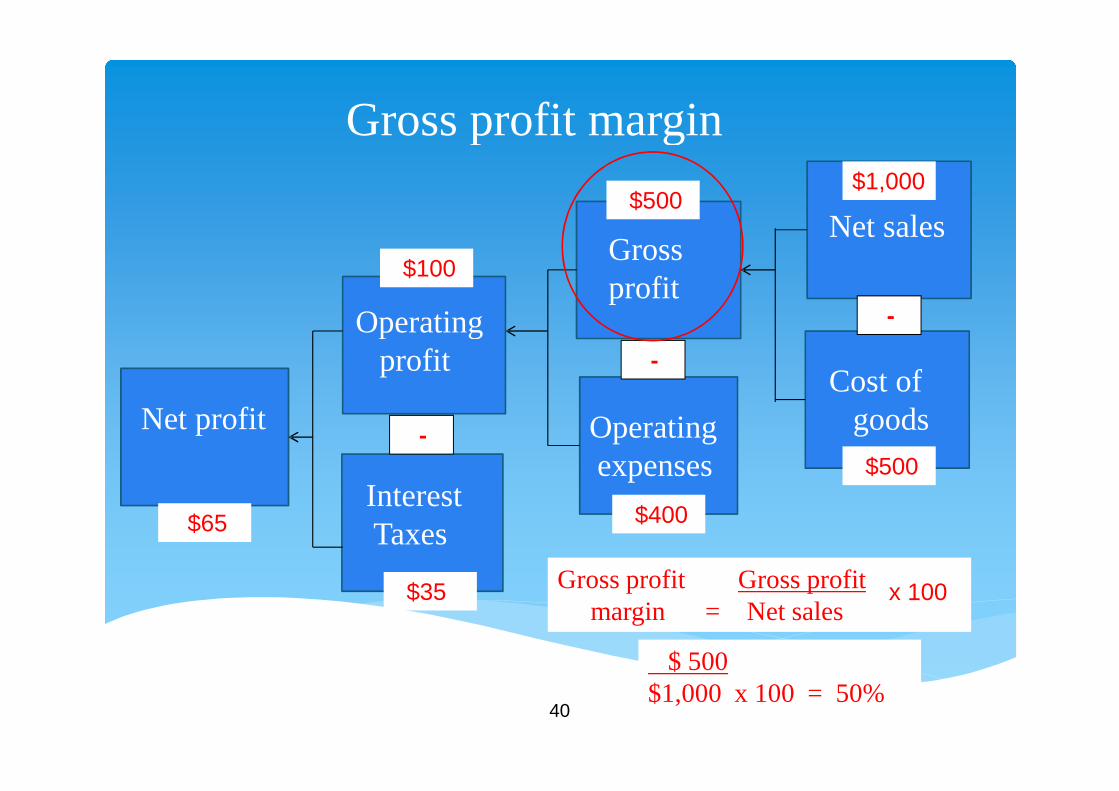
Gross profit margin
Operatingprofit
Operatingexpenses
Grossprofit
Net sales
Cost ofgoods
-
-
-
$1,000
$500
$500
$400
$100
$35
$65
Gross profit Gross profitmargin = Net sales
$ 500$1,000 x 100 = 50%
Net profit
x 100
InterestTaxes
41
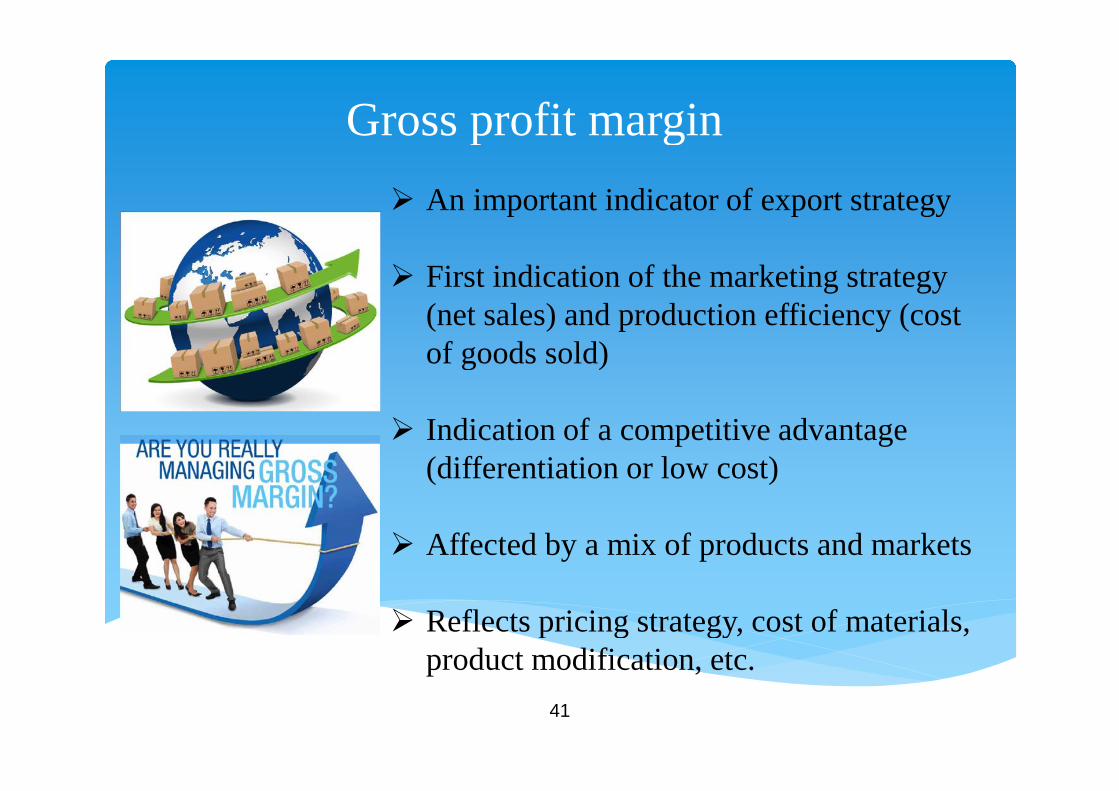
Gross profit margin
An important indicator of export strategy
First indication of the marketing strategy(net sales) and production efficiency (costof goods sold)
Indication of a competitive advantage(differentiation or low cost)
Affected by a mix of products and markets
Reflects pricing strategy, cost of materials,product modification, etc.
42
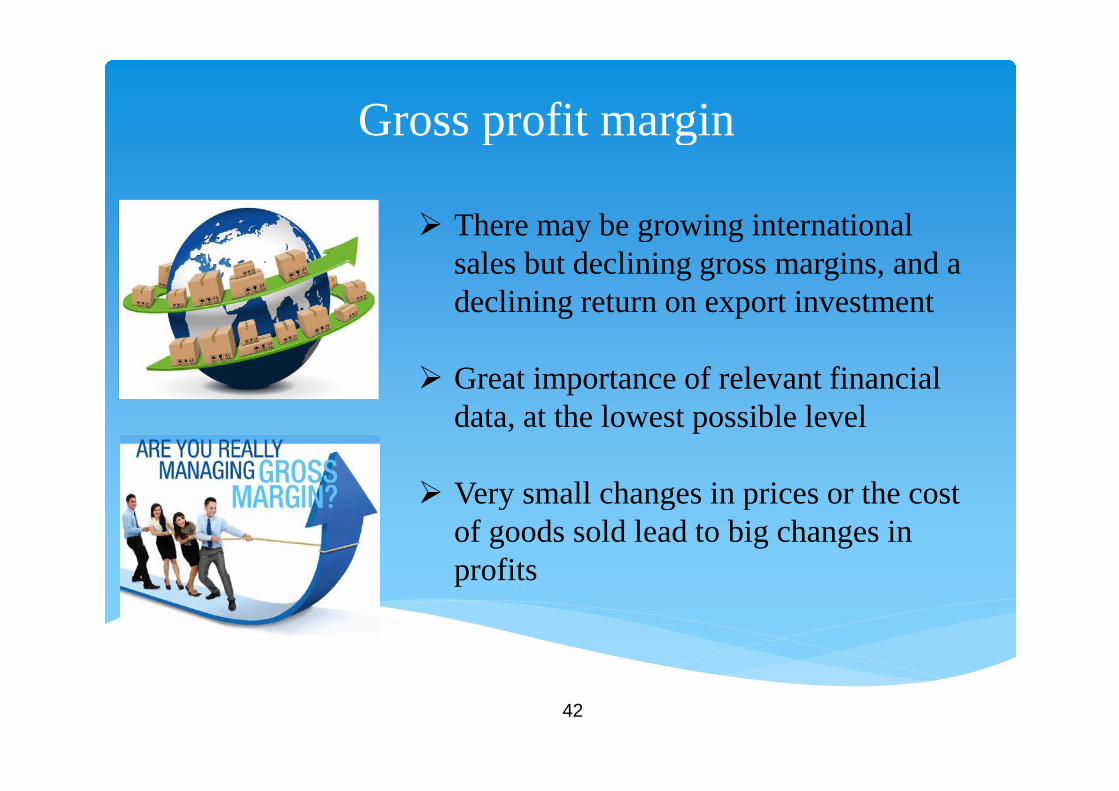
Gross profit margin
There may be growing internationalsales but declining gross margins, and adeclining return on export investment
Great importance of relevant financialdata, at the lowest possible level
Very small changes in prices or the costof goods sold lead to big changes inprofits
43
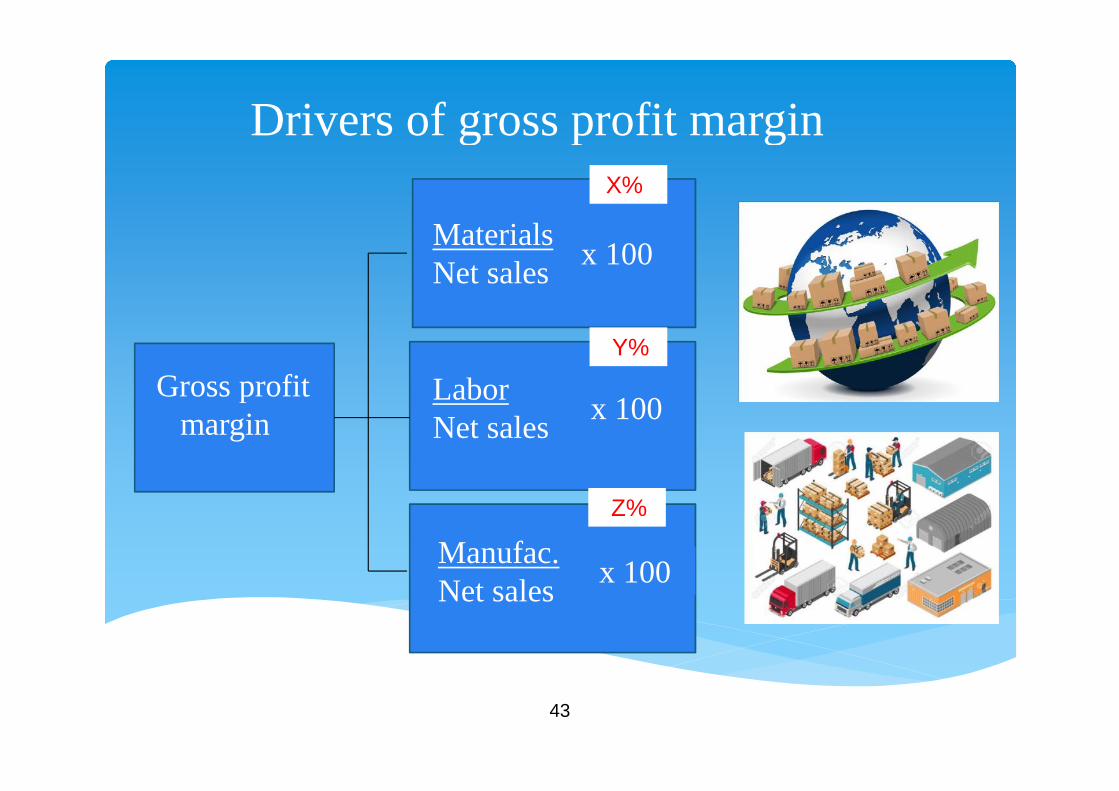
Drivers of gross profit margin
MaterialsNet sales
Gross profitmargin
LaborNet sales
X%
Y%
Z%
Manufac.Net sales
x 100
x 100
x 100
44
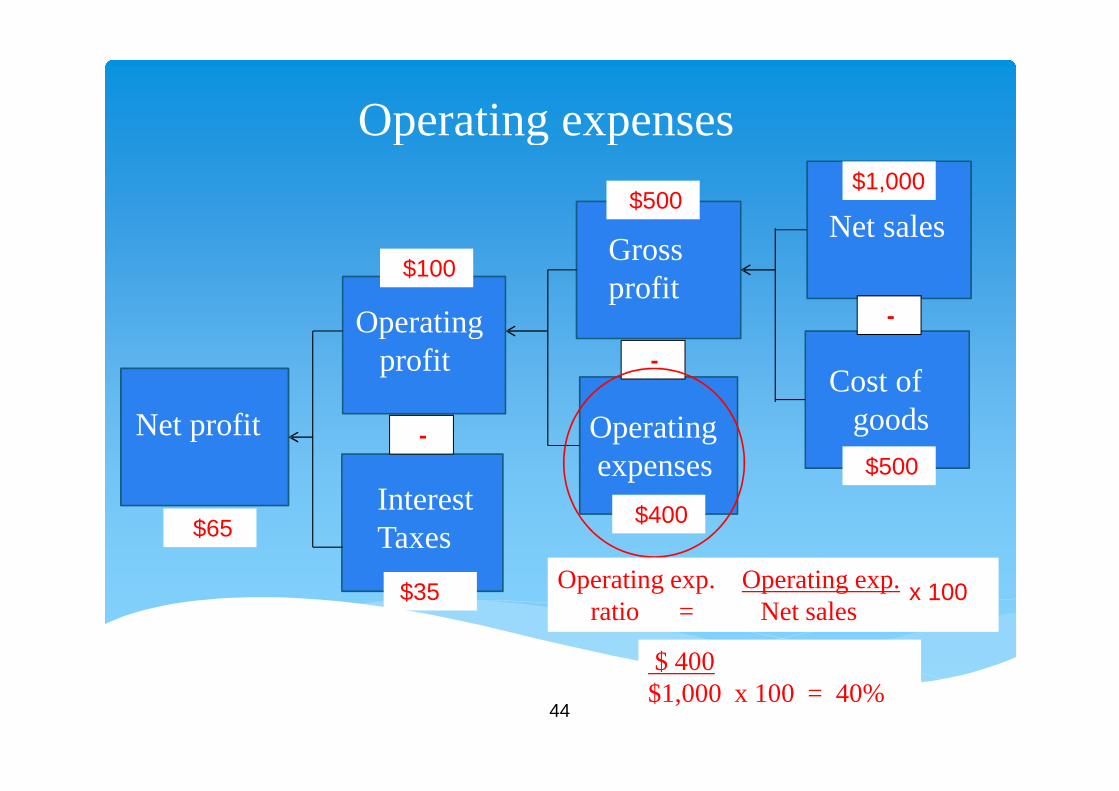
Operating expenses
Net profit
InterestTaxes
Operatingprofit
Operatingexpenses
Grossprofit
Net sales
Cost ofgoods
-
-
-
$1,000
$500
$500
$400
$100
$35
$65
Operating exp. Operating exp.ratio = Net sales
$ 400$1,000 x 100 = 40%
x 100
45
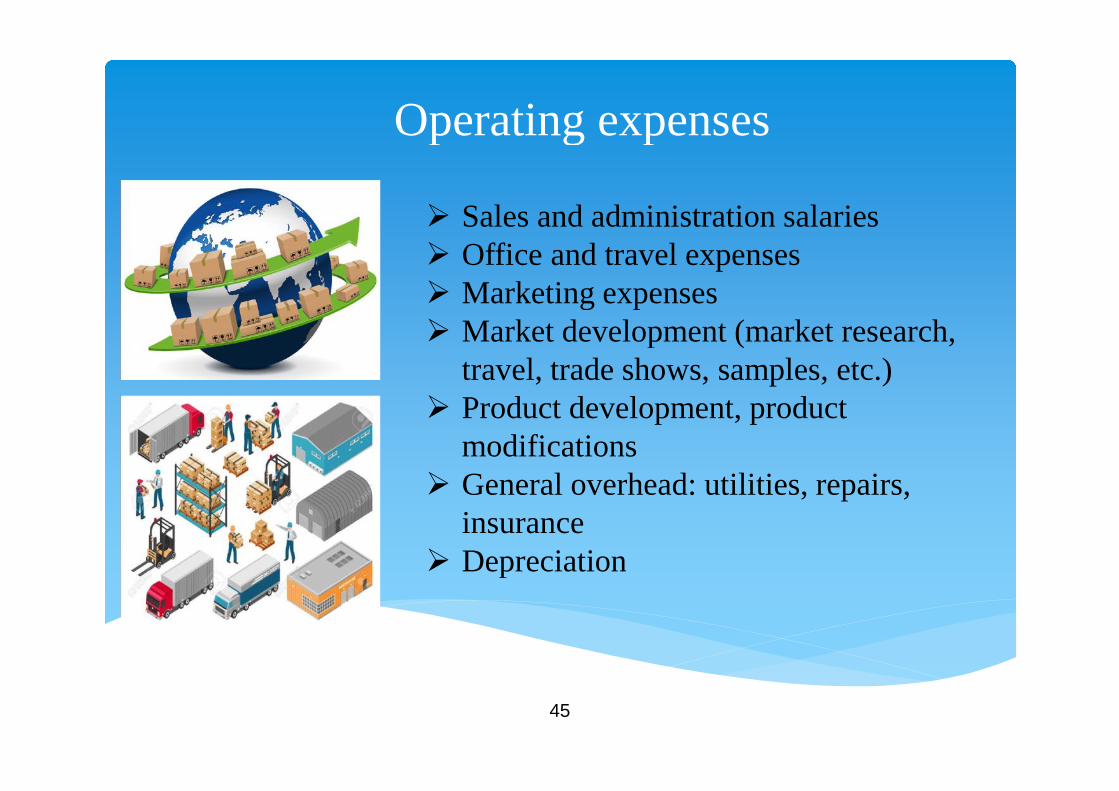
Operating expenses
Sales and administration salaries Office and travel expenses Marketing expenses Market development (market research,
travel, trade shows, samples, etc.) Product development, product
modifications General overhead: utilities, repairs,
insurance Depreciation
46
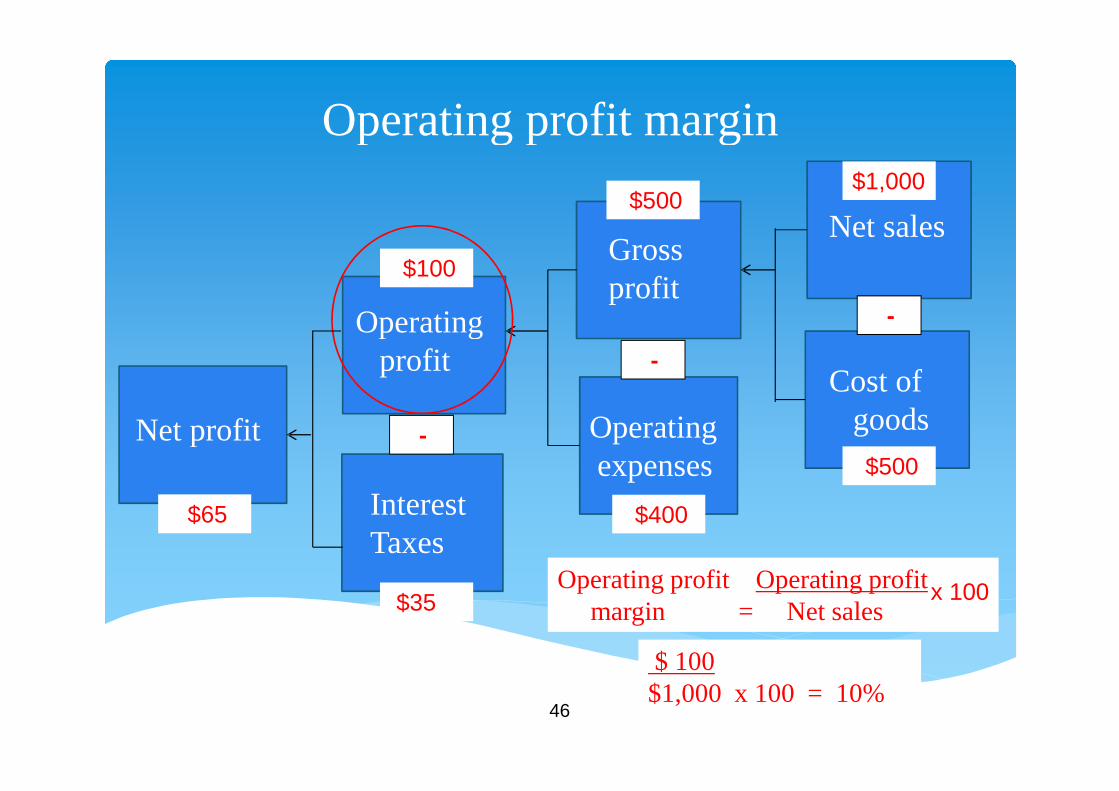
Operating profit margin
Net profit
InterestTaxes
Operatingprofit
Operatingexpenses
Grossprofit
Net sales
Cost ofgoods
-
-
-
$1,000
$500
$500
$400
$100
$35
$65
Operating profit Operating profitmargin = Net sales
$ 100$1,000 x 100 = 10%
x 100
47
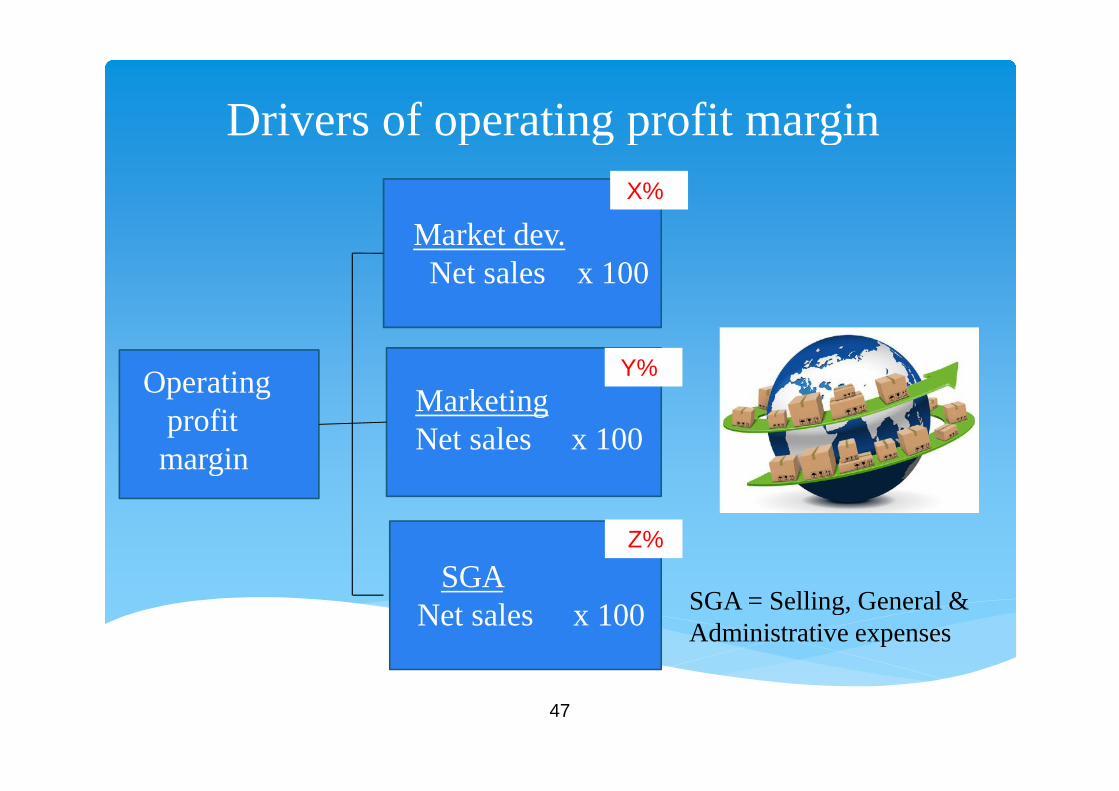
Drivers of operating profit margin
MarketingNet sales x 100
Operatingprofitmargin
SGANet sales x 100
Market dev.Net sales x 100
X%
Y%
Z%
SGA = Selling, General &Administrative expenses
48
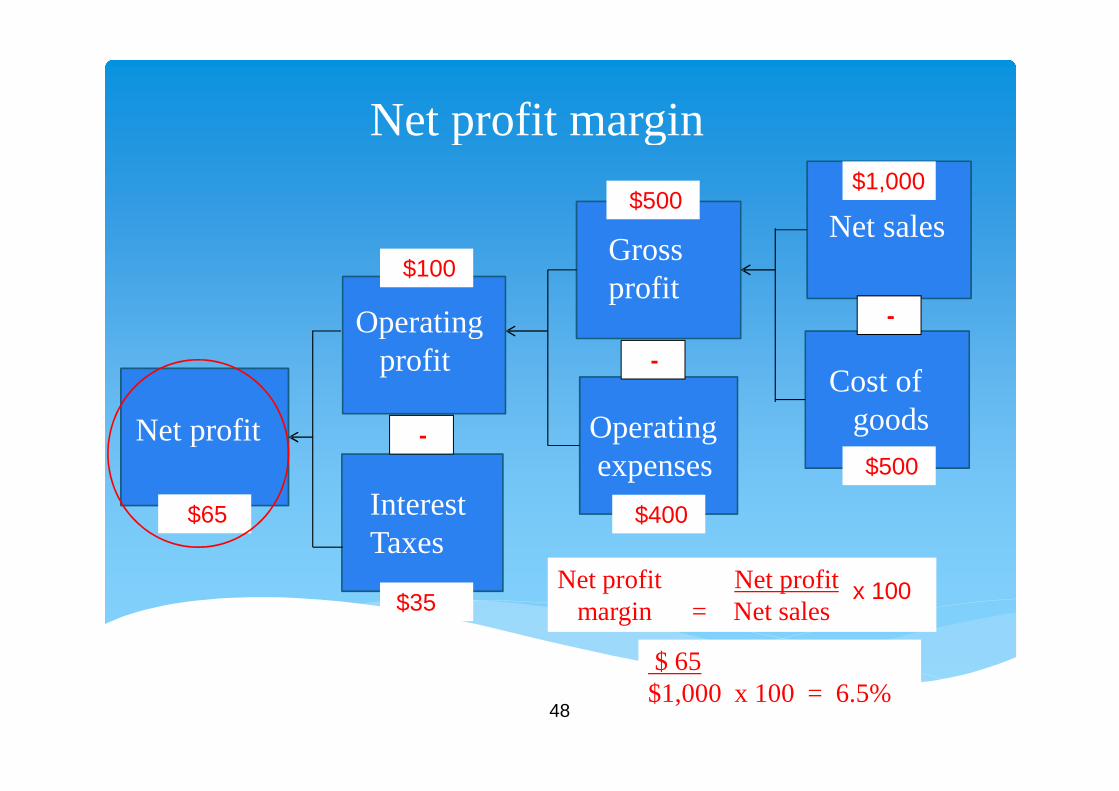
Net profit margin
Net profit
InterestTaxes
Operatingprofit
Operatingexpenses
Grossprofit
Net sales
Cost ofgoods
-
-
-
$1,000
$500
$500
$400
$100
$35
$65
Net profit Net profitmargin = Net sales
$ 65$1,000 x 100 = 6.5%
x 100
49
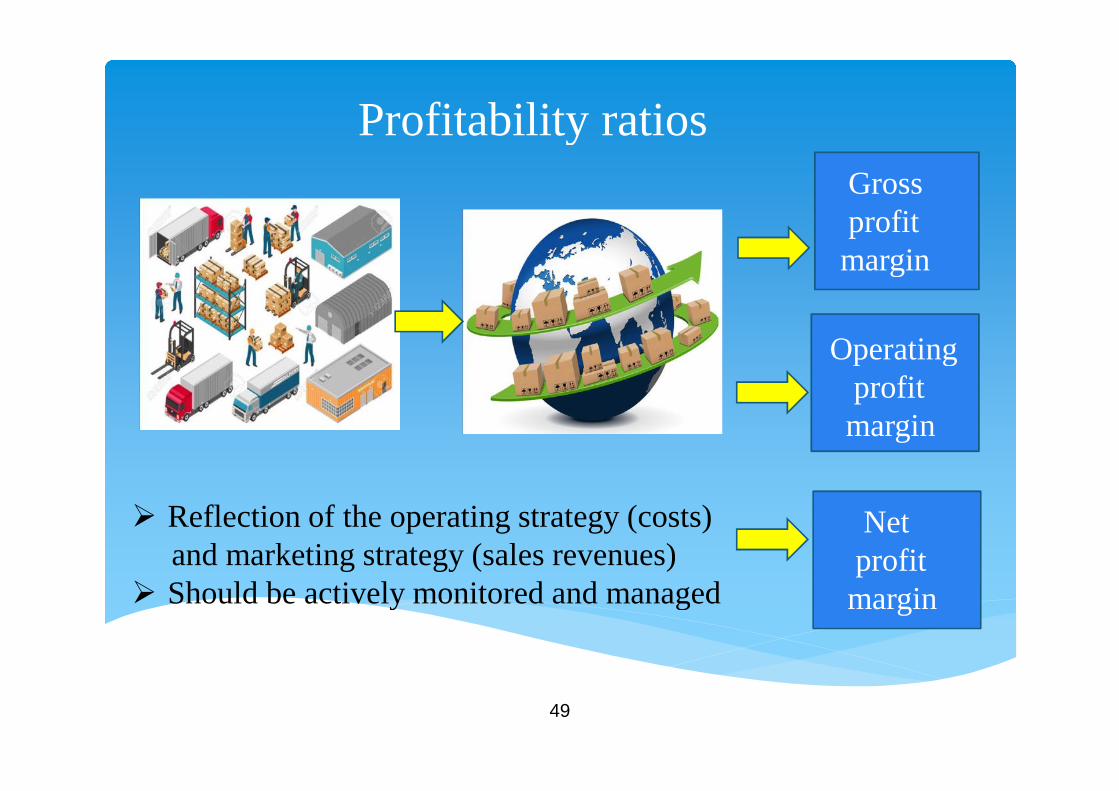
Profitability ratios
Operatingprofitmargin
Grossprofitmargin
Reflection of the operating strategy (costs)and marketing strategy (sales revenues)
Should be actively monitored and managed
Netprofitmargin
50
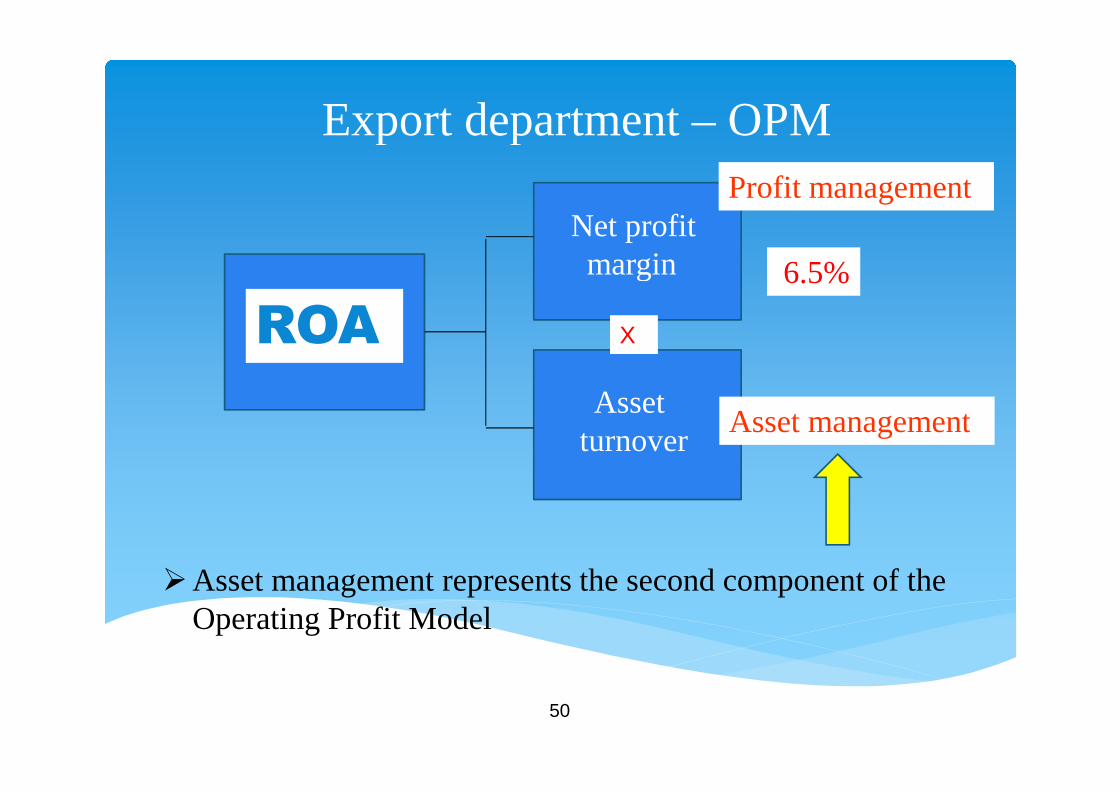
Export department – OPM
Assetturnover
Asset management
X
Profit management
6.5%
Net profitmargin
Asset management represents the second component of theOperating Profit Model
ROA
51
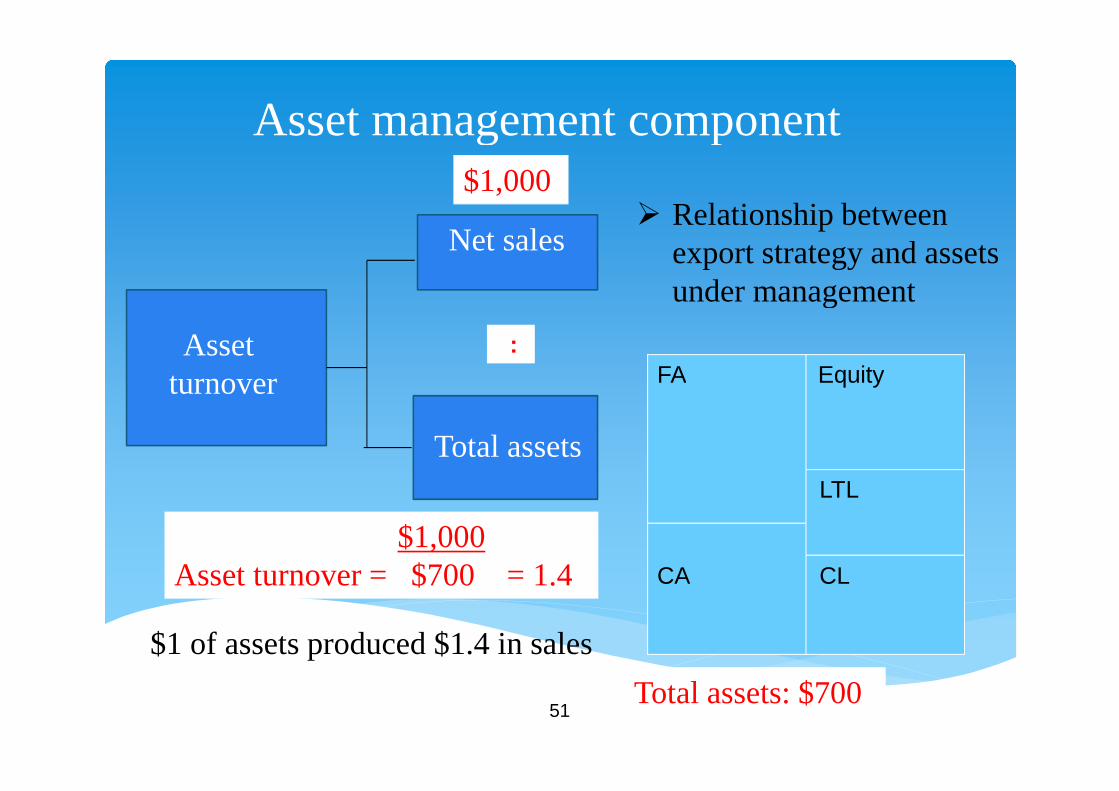
Asset management component
Assetturnover
Total assets
Net sales
:
$1,000
FA Equity
LTL
CA CL
Total assets: $700
$1,000Asset turnover = $700 = 1.4
$1 of assets produced $1.4 in sales
Relationship betweenexport strategy and assetsunder management
52
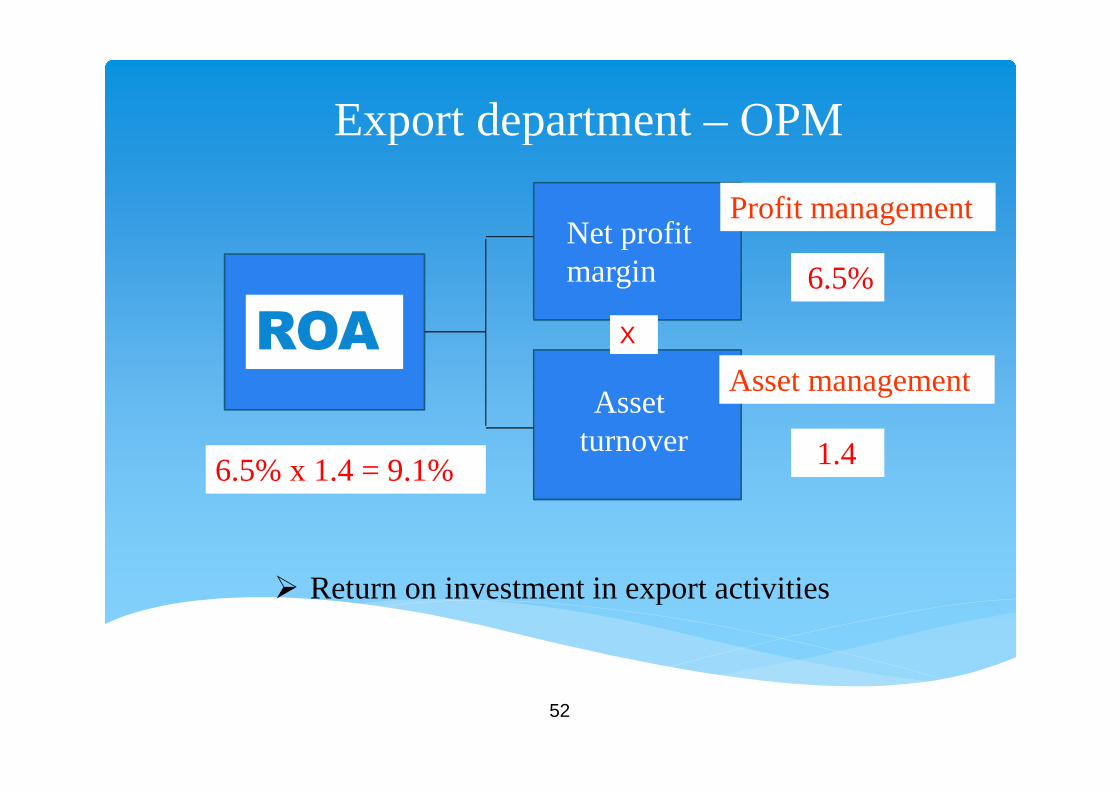
Export department – OPM
Assetturnover
Net profitmargin
Asset management
X
Return on investment in export activities
Profit management
6.5%
1.46.5% x 1.4 = 9.1%
ROA
53
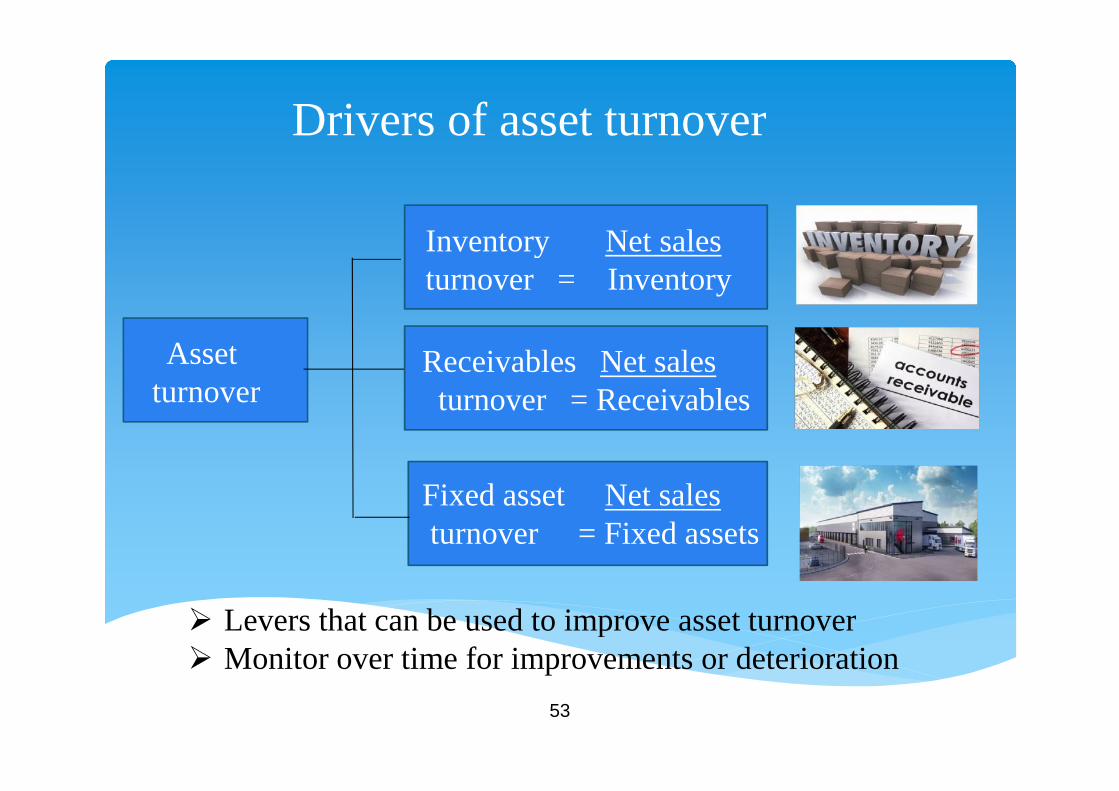
Drivers of asset turnover
Assetturnover
Fixed asset Net salesturnover = Fixed assets
Inventory Net salesturnover = Inventory
Receivables Net salesturnover = Receivables
Levers that can be used to improve asset turnover Monitor over time for improvements or deterioration
54
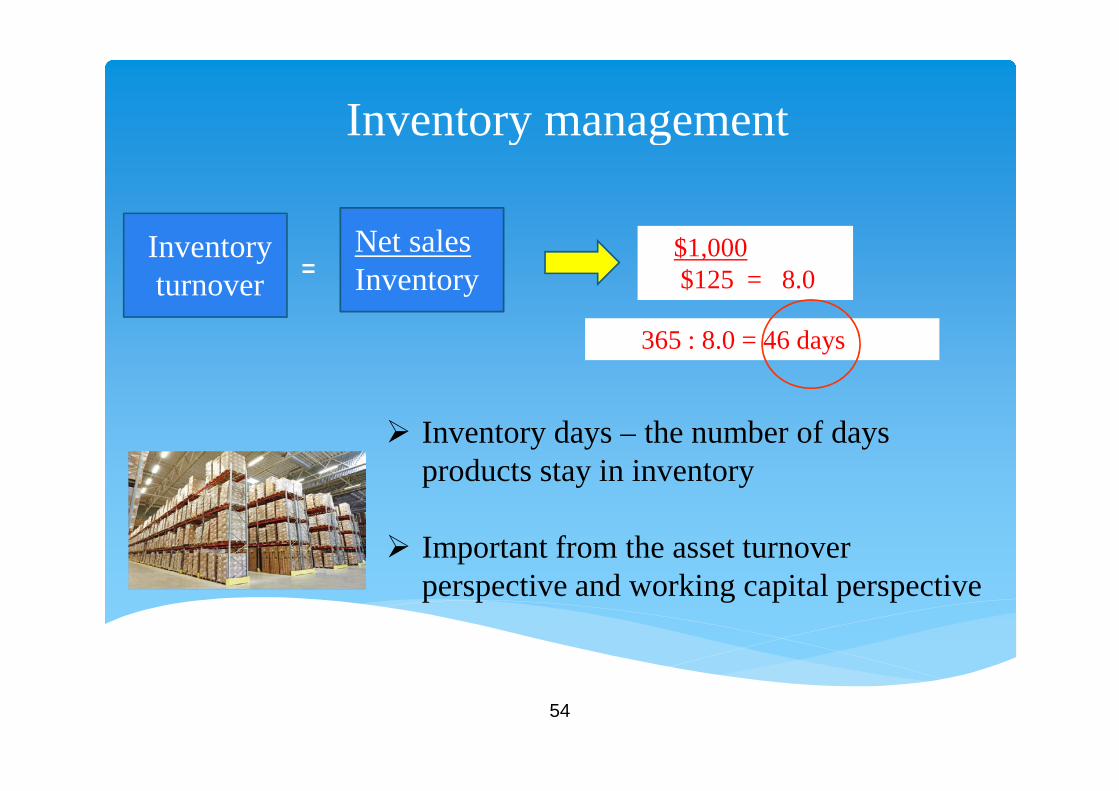
Inventory management
Net salesInventory
$1,000$125 = 8.0
Inventory days – the number of daysproducts stay in inventory
Important from the asset turnoverperspective and working capital perspective
365 : 8.0 = 46 days
Inventoryturnover
=
55
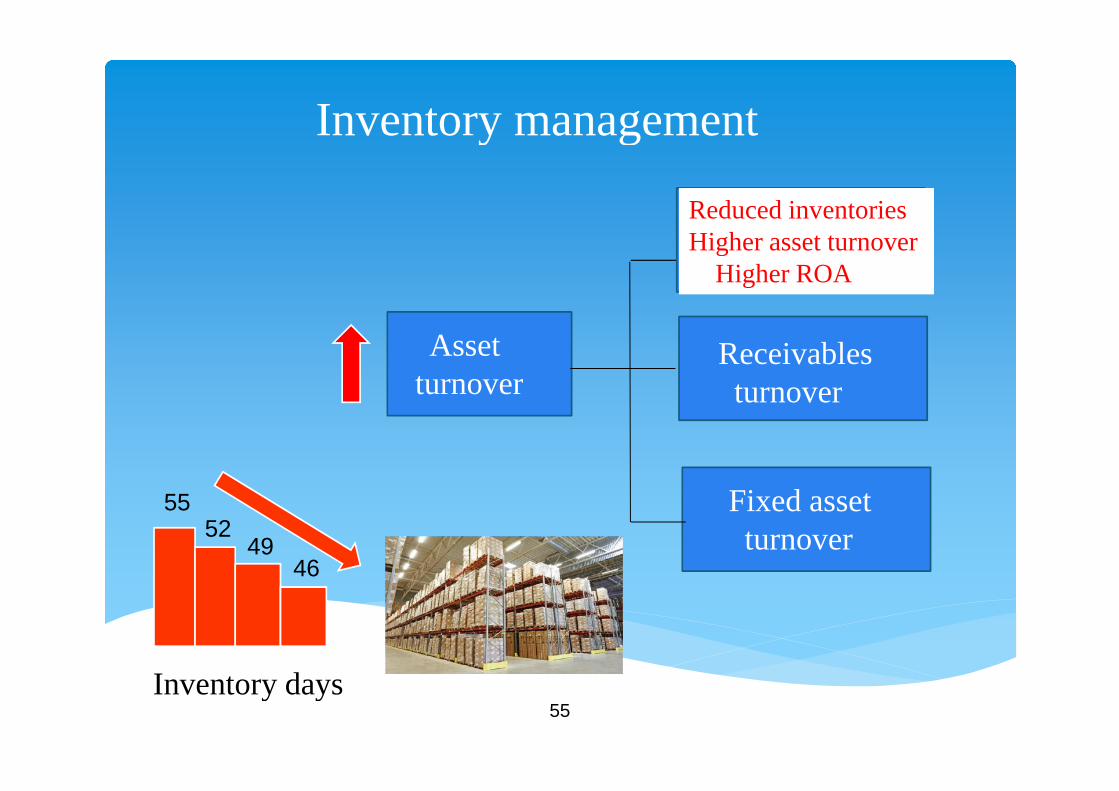
Inventory management
Assetturnover
5552
4946
Inventory days
Reduced inventoriesHigher asset turnover
Higher ROA
Receivablesturnover
Fixed assetturnover
56
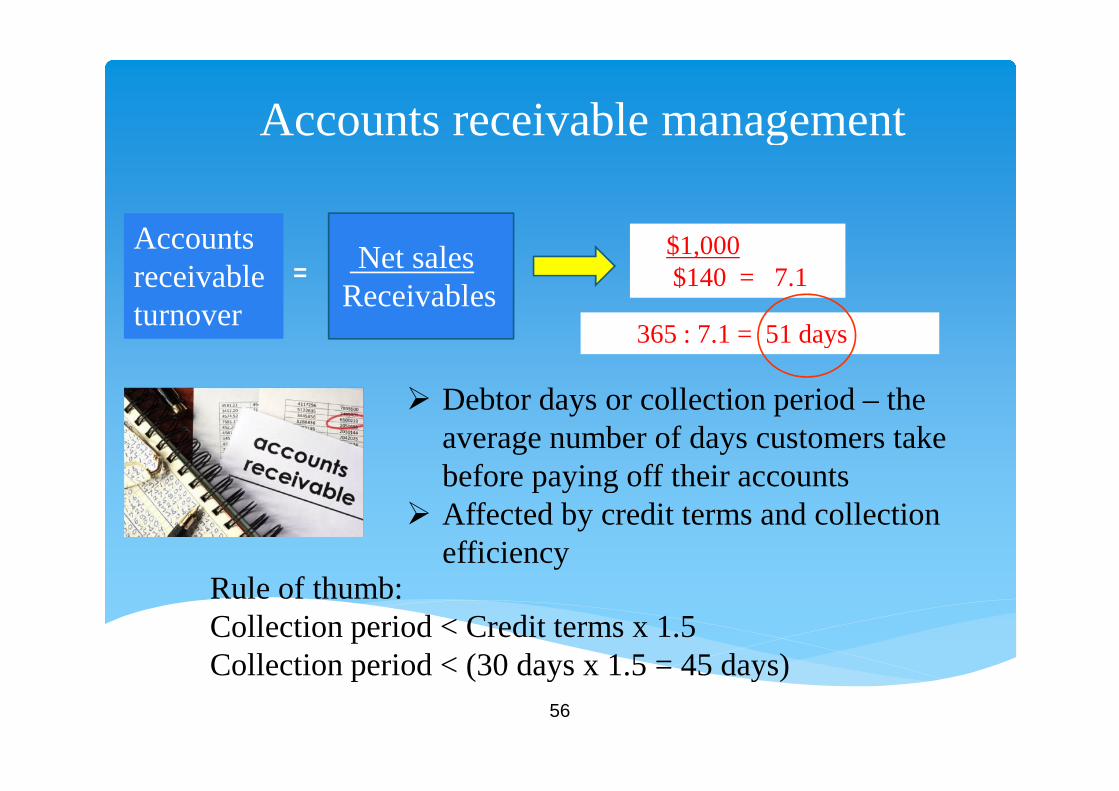
Accounts receivable management
Net salesReceivables
$1,000$140 = 7.1
Debtor days or collection period – theaverage number of days customers takebefore paying off their accounts
Affected by credit terms and collectionefficiency
365 : 7.1 = 51 days
Accountsreceivableturnover
=
Rule of thumb:Collection period < Credit terms x 1.5Collection period < (30 days x 1.5 = 45 days)
57
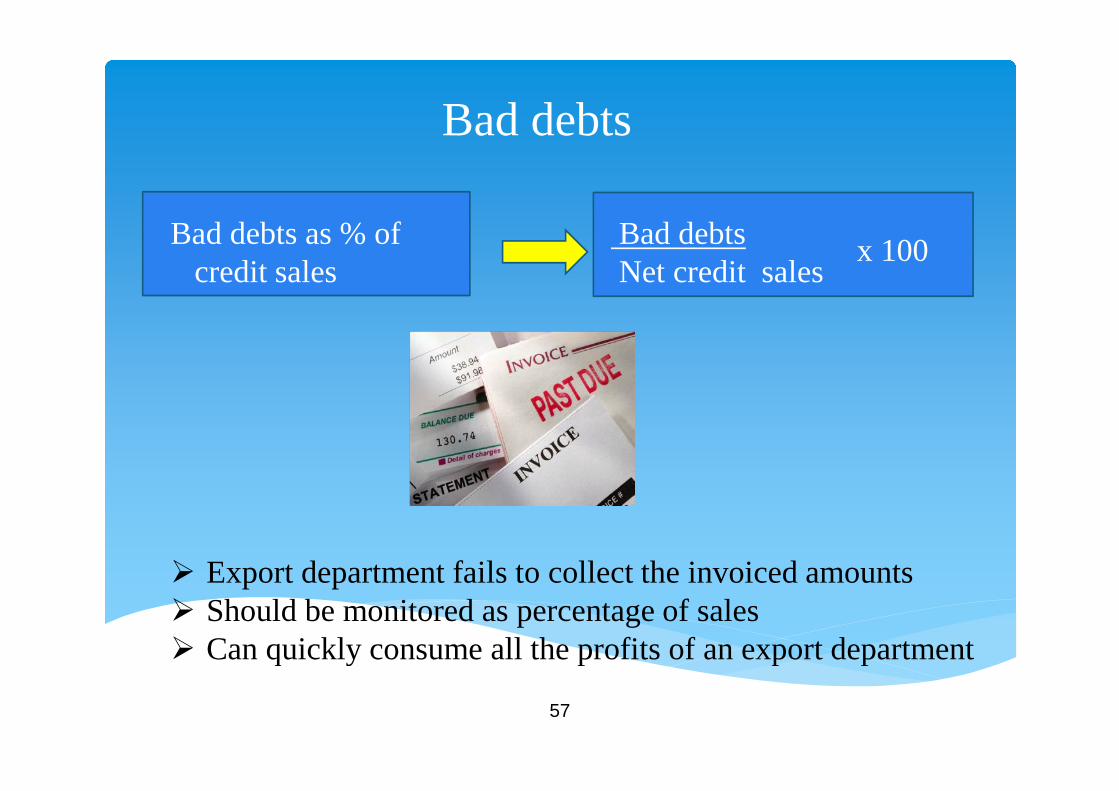
Bad debts
Bad debtsNet credit sales
Bad debts as % ofcredit sales
Export department fails to collect the invoiced amounts Should be monitored as percentage of sales Can quickly consume all the profits of an export department
x 100
58
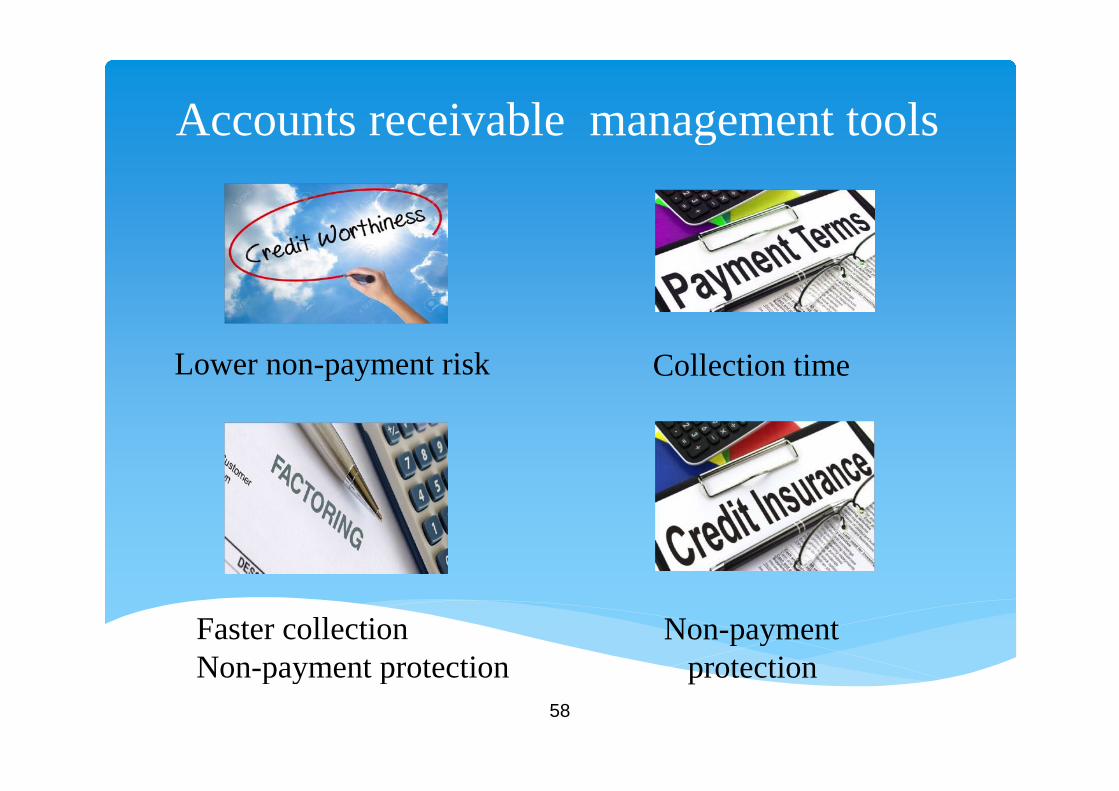
Accounts receivable management tools
Collection time
Non-paymentprotection
Lower non-payment risk
Faster collectionNon-payment protection
59
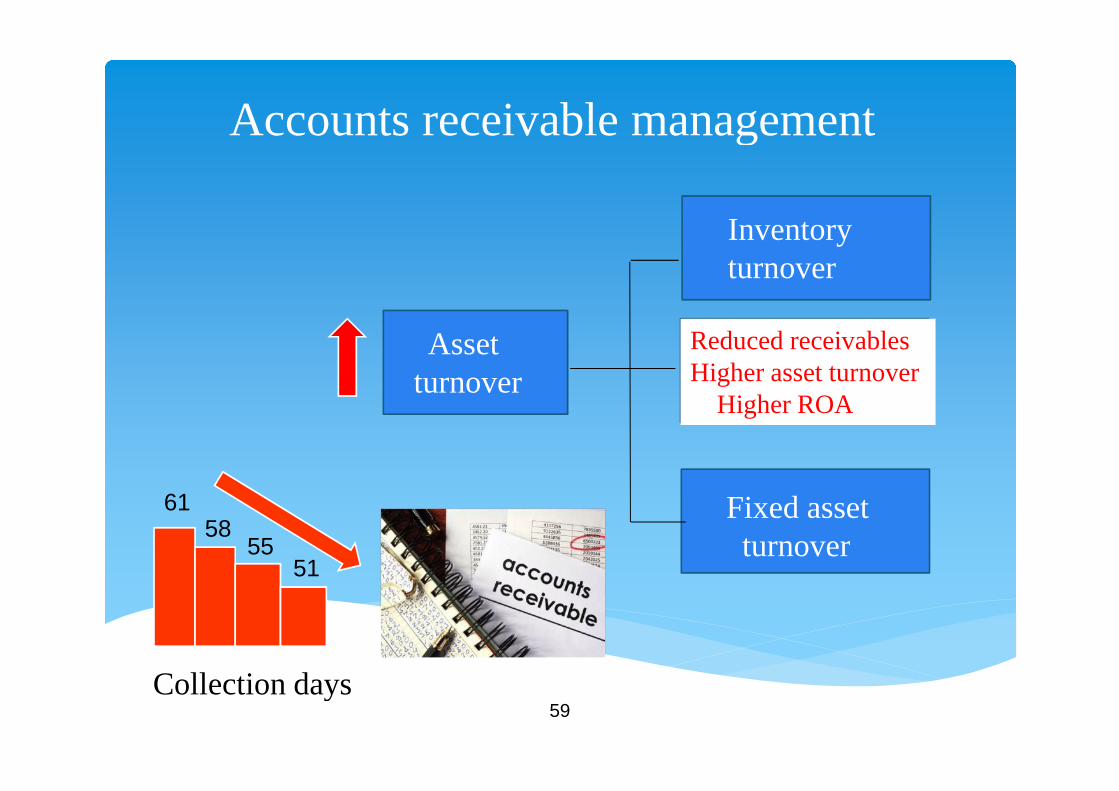
Accounts receivable management
Assetturnover
Reduced receivablesHigher asset turnover
Higher ROA
6158
5551
Collection days
Fixed assetturnover
Inventoryturnover
60
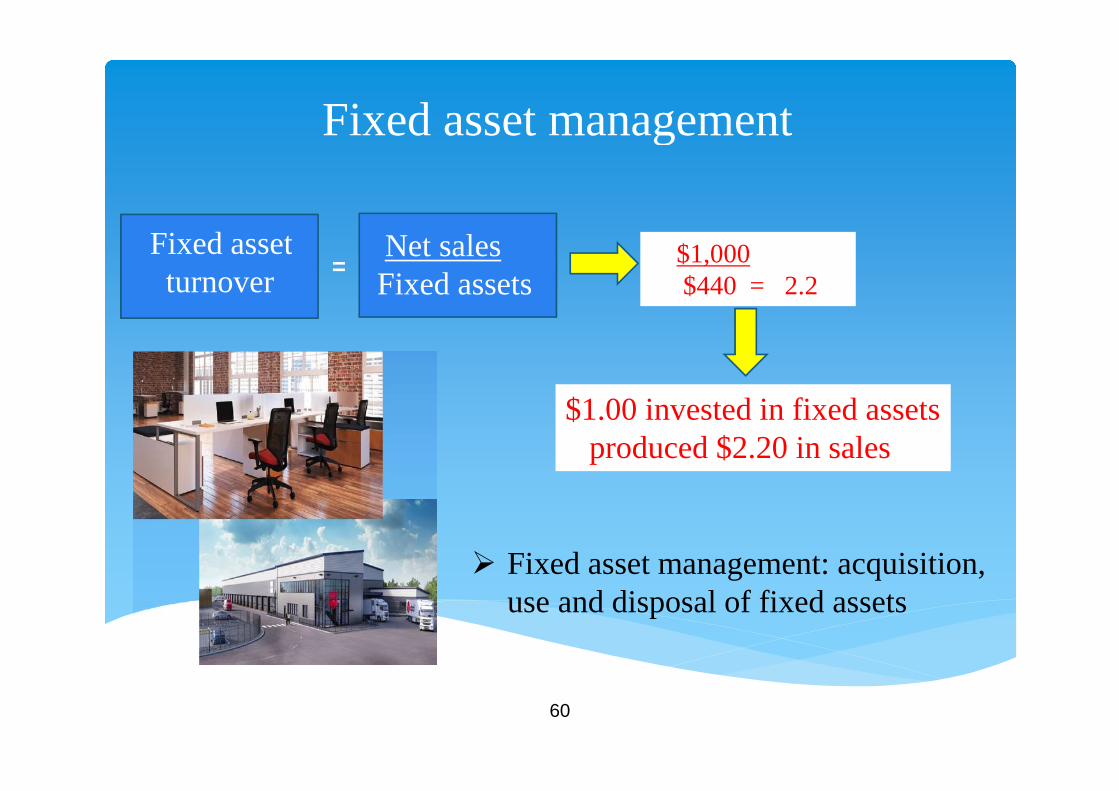
Fixed asset management
Net salesFixed assets
$1,000$440 = 2.2
$1.00 invested in fixed assetsproduced $2.20 in sales
Fixed assetturnover
=
Fixed asset management: acquisition,use and disposal of fixed assets

61
Fixed asset management
Assetturnover
Increased efficiencyHigher asset turnover
Higher ROA2.1
$X of sales produced by$1.00 of fixed assets
Inventoryturnover
2.22.5
1.8
Receivablesturnover
62
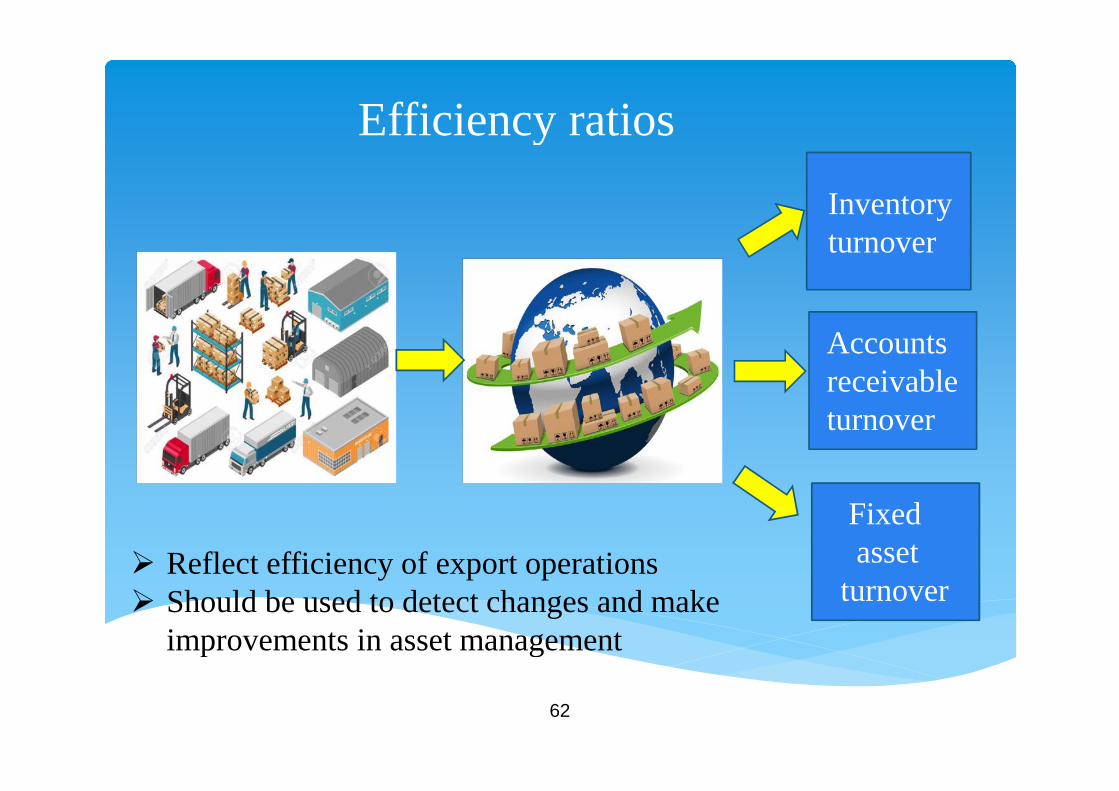
Efficiency ratios
Accountsreceivableturnover
Inventoryturnover
Fixedasset
turnover Reflect efficiency of export operations Should be used to detect changes and make
improvements in asset management
63
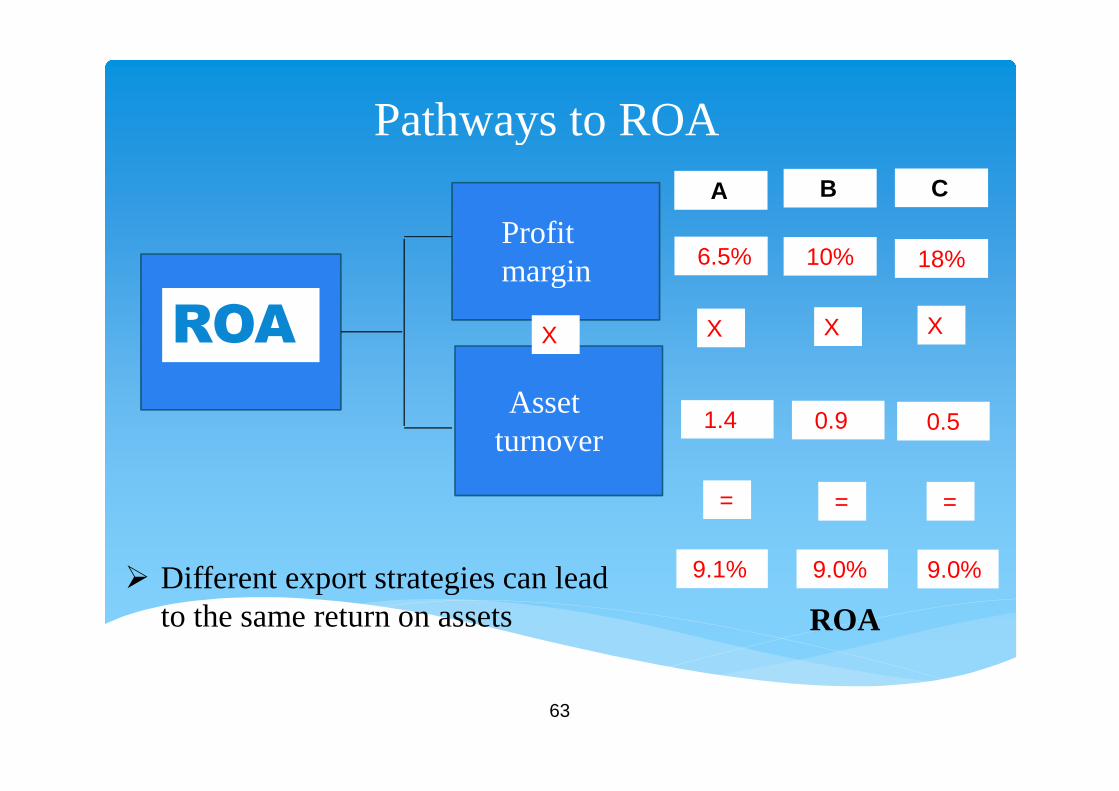
Pathways to ROA
Assetturnover
Profitmargin
X
6.5%
1.4
9.1%
10% 18%
X X X
0.9 0.5
= = =
9.0% 9.0%
A B C
Different export strategies can leadto the same return on assets ROA
ROA
64
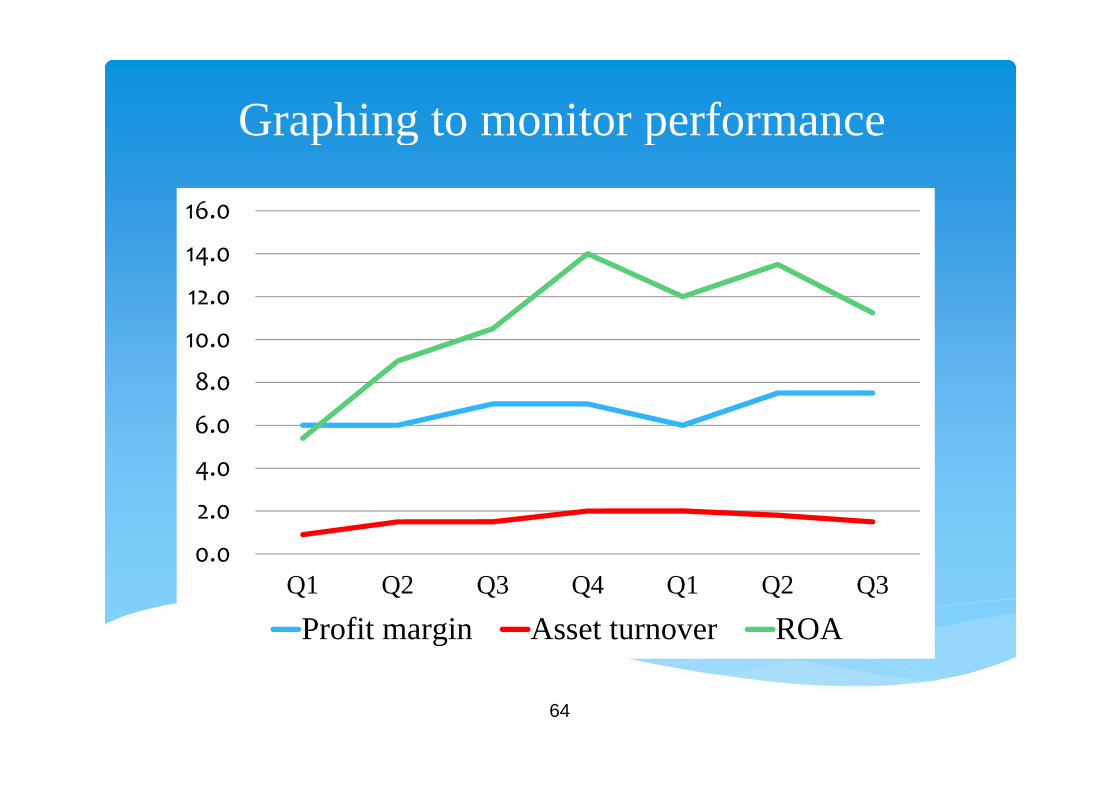
Graphing to monitor performance
0.0
2.0
4.0
6.0
8.0
10.0
12.0
14.0
16.0
Q1 Q2 Q3 Q4 Q1 Q2 Q3
Profit margin Asset turnover ROA
65
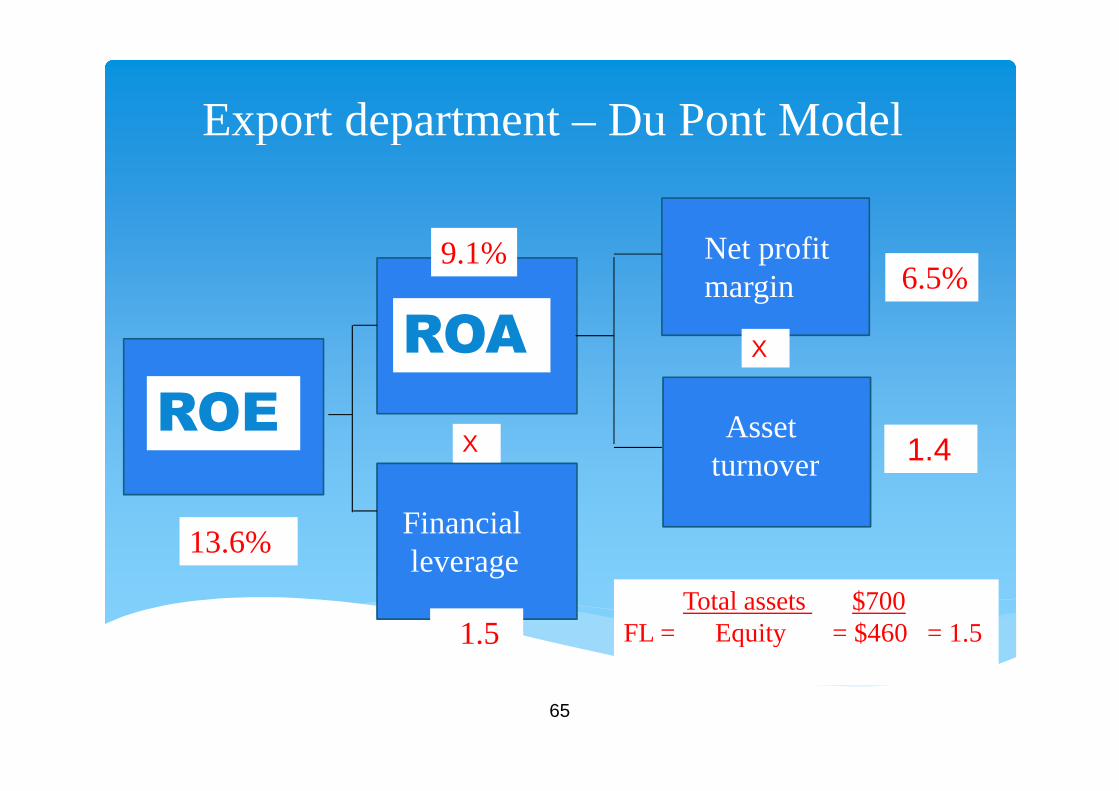
Export department – Du Pont Model
Assetturnover
Net profitmargin
X
6.5%
1.4
9.1%
Financialleverage
X
Total assets $700FL = Equity = $460 = 1.51.5
13.6%
ROE
ROA
66
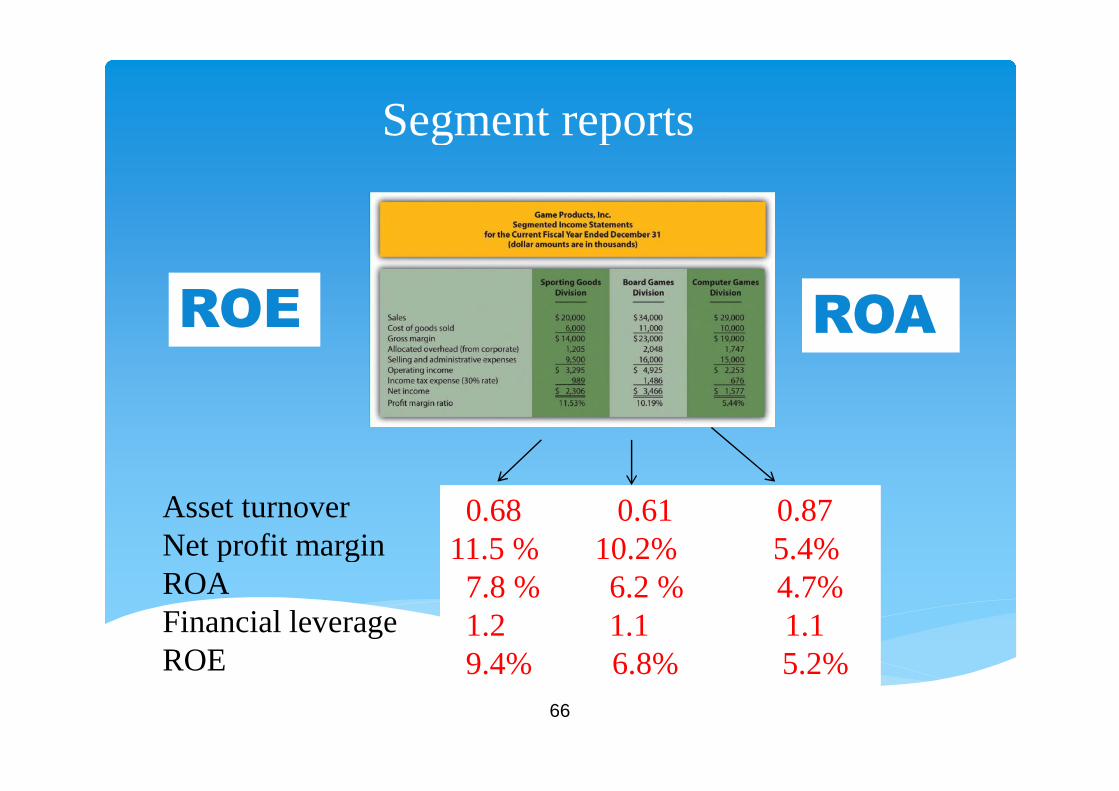
Segment reports
0.68 0.61 0.8711.5 % 10.2% 5.4%7.8 % 6.2 % 4.7%1.2 1.1 1.19.4% 6.8% 5.2%
Asset turnoverNet profit marginROAFinancial leverageROE
ROE ROA
67
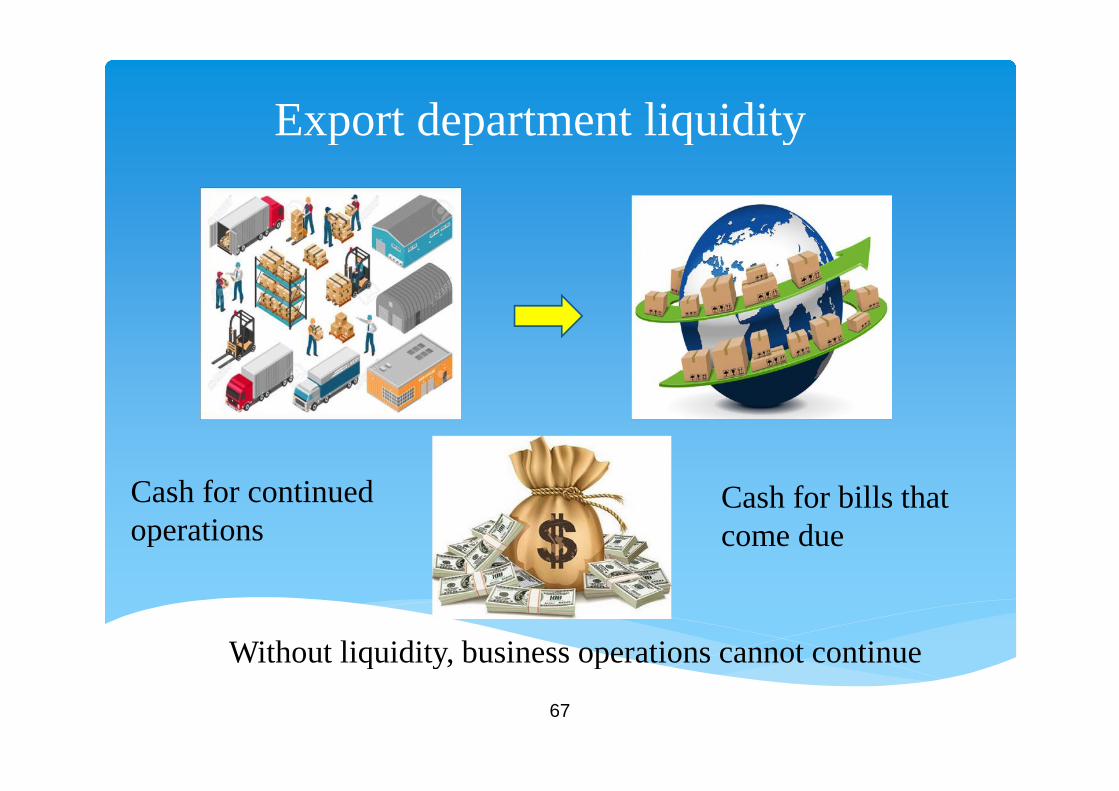
Export department liquidity
Cash for continuedoperations
Cash for bills thatcome due
Without liquidity, business operations cannot continue
68
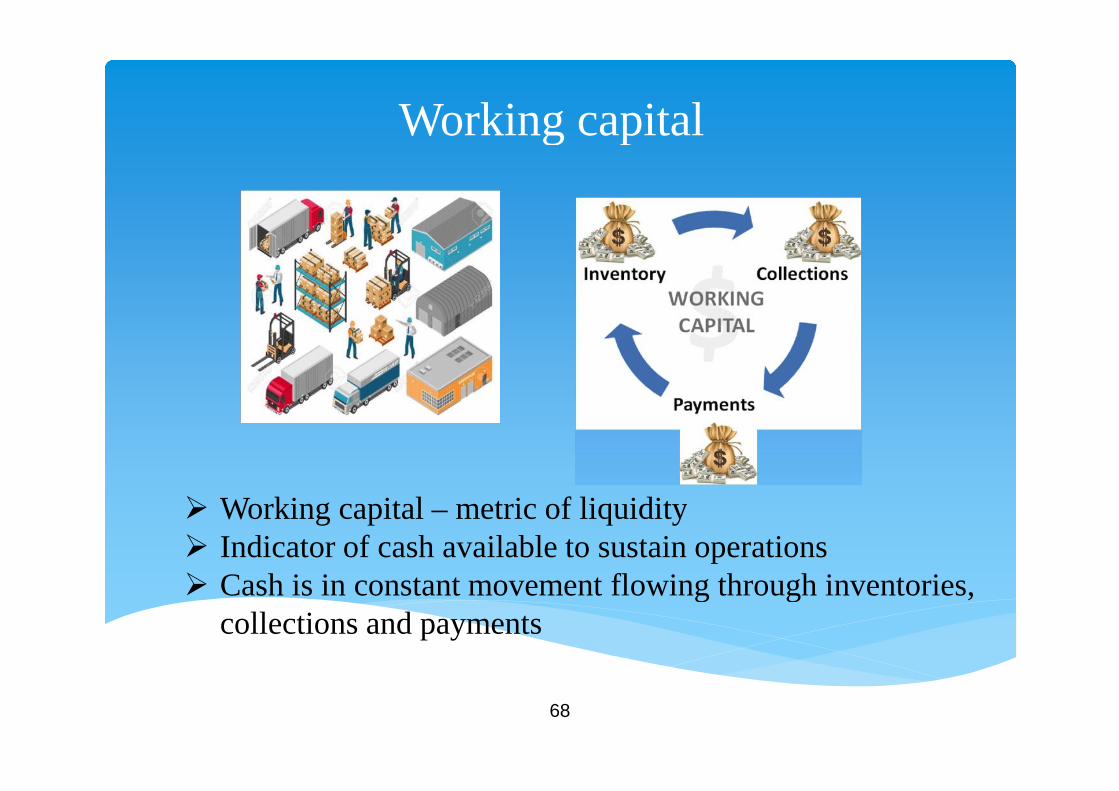
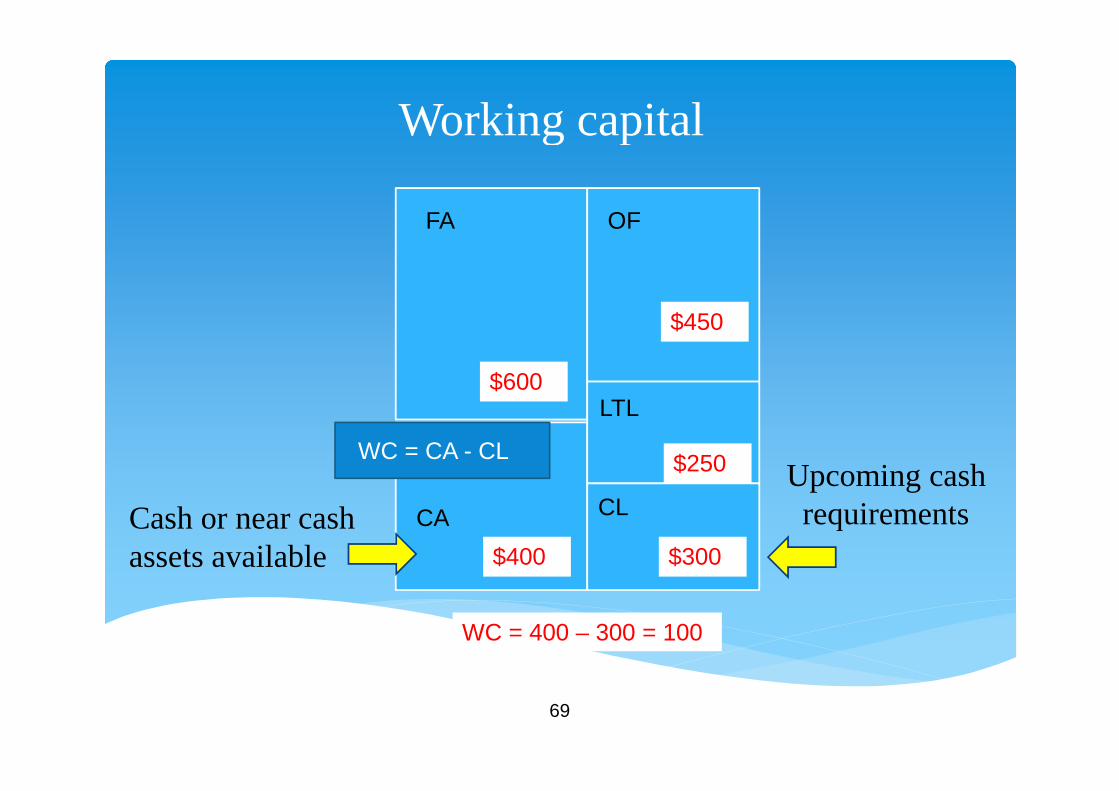
Working capital
Working capital – metric of liquidity Indicator of cash available to sustain operations Cash is in constant movement flowing through inventories,
collections and payments
69
Working capital
FA
CA
LTL
OF
CL
$600
$400
$450
$250
$300
WC = CA - CL
WC = 400 – 300 = 100
Cash or near cashassets available
Upcoming cashrequirements
70
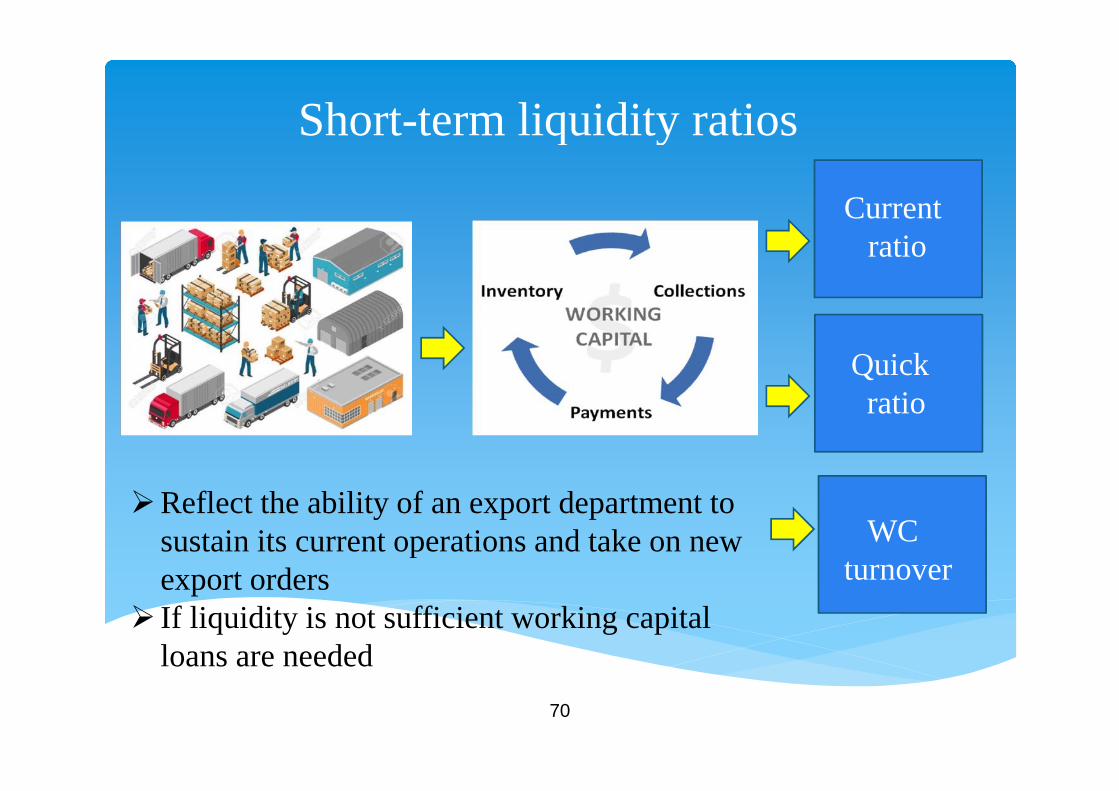
Short-term liquidity ratios
Currentratio
Quickratio
WCturnover
Reflect the ability of an export department tosustain its current operations and take on newexport orders
If liquidity is not sufficient working capitalloans are needed
71
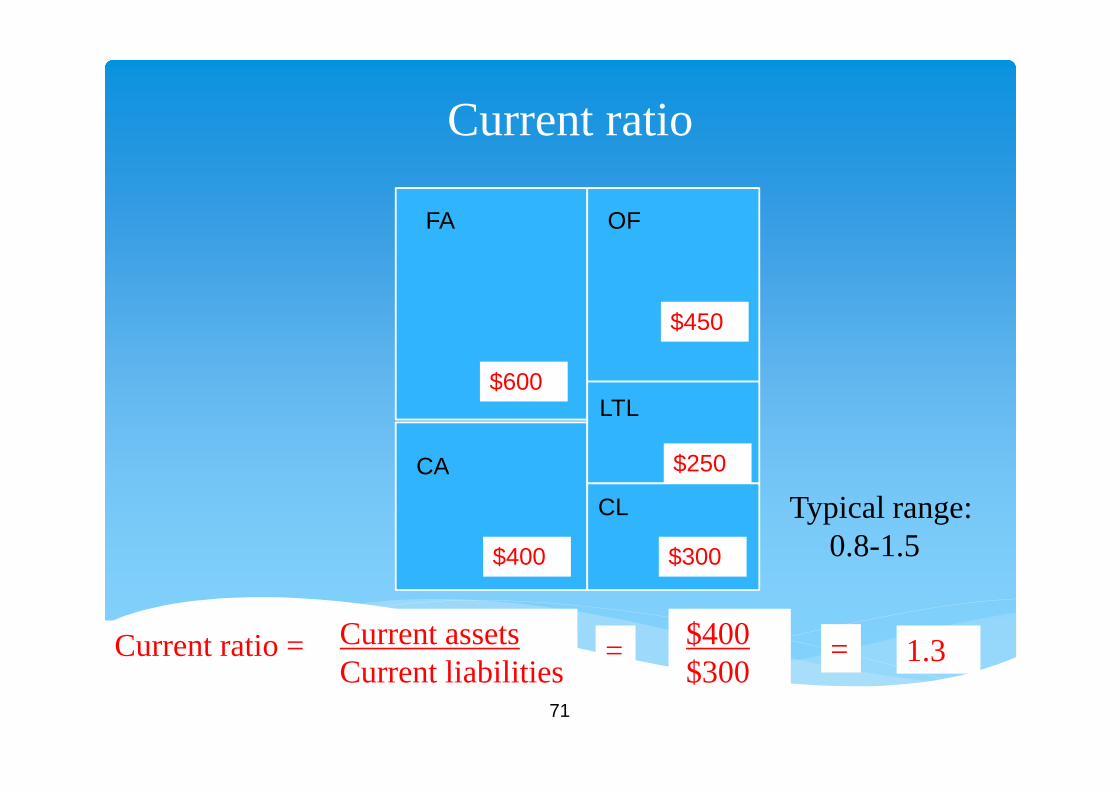
Current ratio
FA
CA
LTL
OF
CL
$600
$400
$450
$250
$300
Current assetsCurrent liabilities
$400$300
Current ratio = = = 1.3
Typical range:0.8-1.5
72
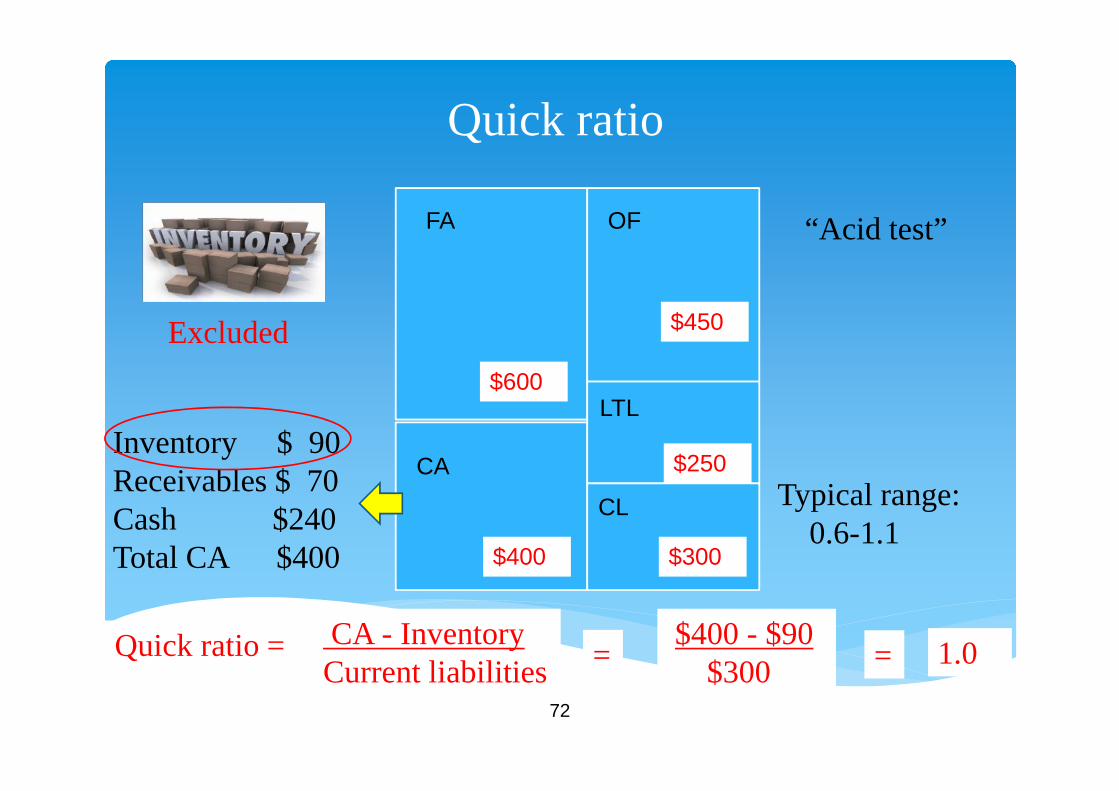
Quick ratio
FA
CA
LTL
OF
CL
$600
$400
$450
$250
$300
CA - InventoryCurrent liabilities
$400 - $90$300
Quick ratio = = = 1.0
Inventory $ 90Receivables $ 70Cash $240Total CA $400
Excluded
“Acid test”
Typical range:0.6-1.1
73
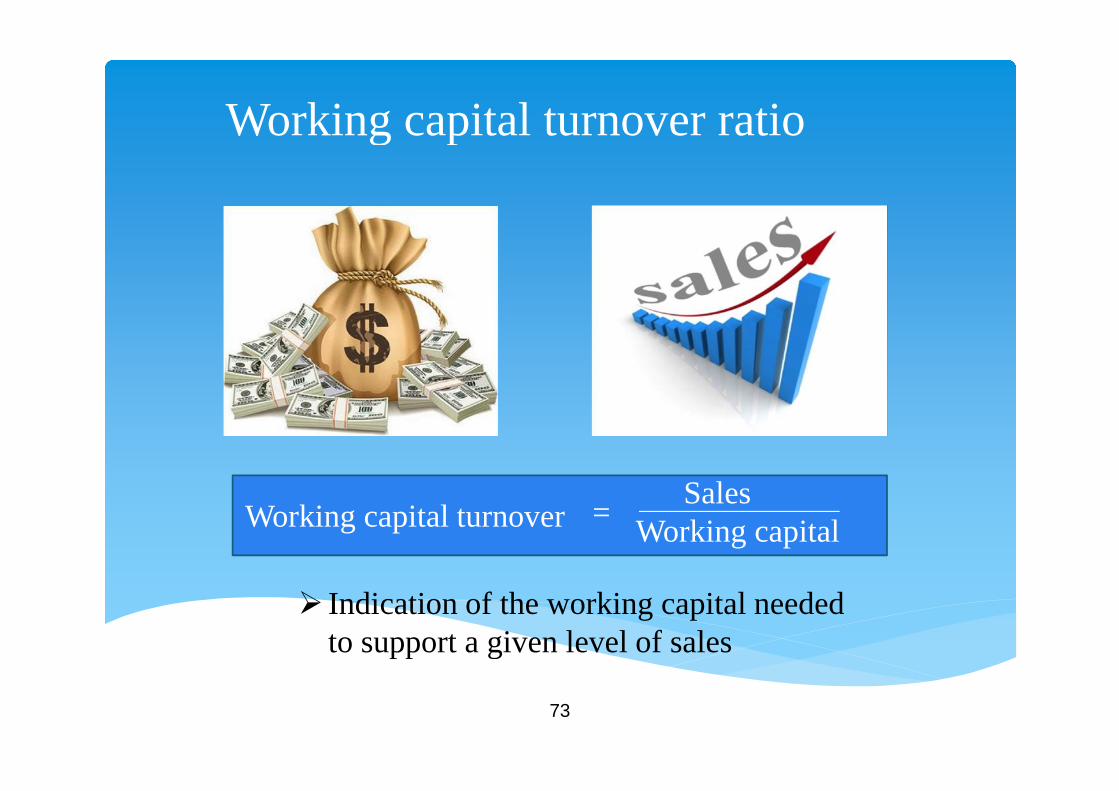
Working capital turnover ratio
Indication of the working capital neededto support a given level of sales
Working capital turnoverSales
Working capital=
74
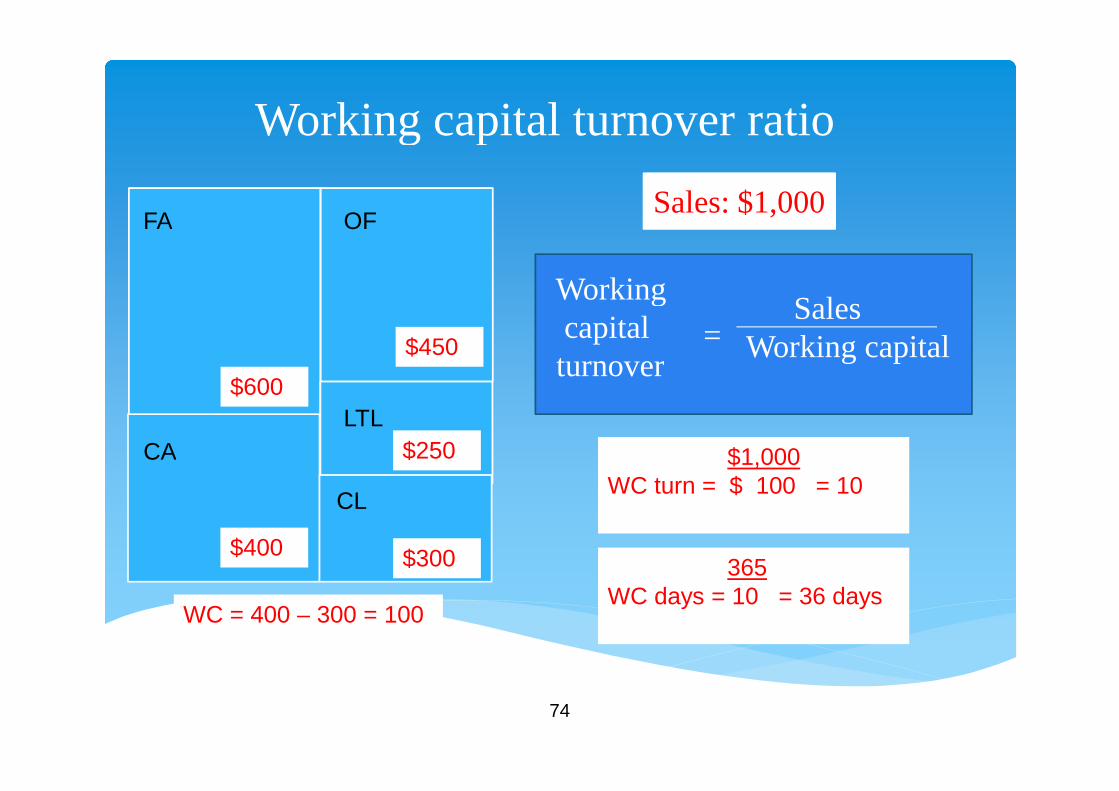
Working capital turnover ratio
FA
CA
LTL
OF
CL
$600
$400
$450
$250
$300
WC = 400 – 300 = 100
Sales: $1,000
Workingcapitalturnover
SalesWorking capital=
$1,000WC turn = $ 100 = 10
365WC days = 10 = 36 days
75
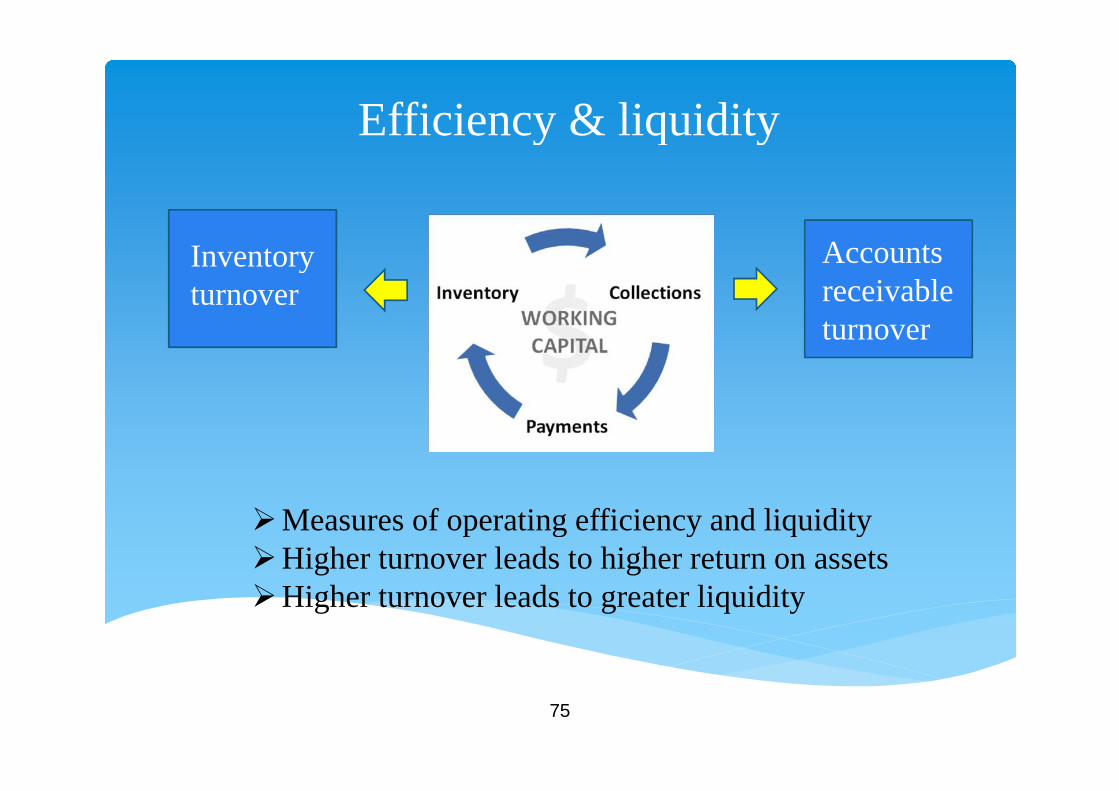
Efficiency & liquidity
Accountsreceivableturnover
Inventoryturnover
Measures of operating efficiency and liquidityHigher turnover leads to higher return on assetsHigher turnover leads to greater liquidity
76
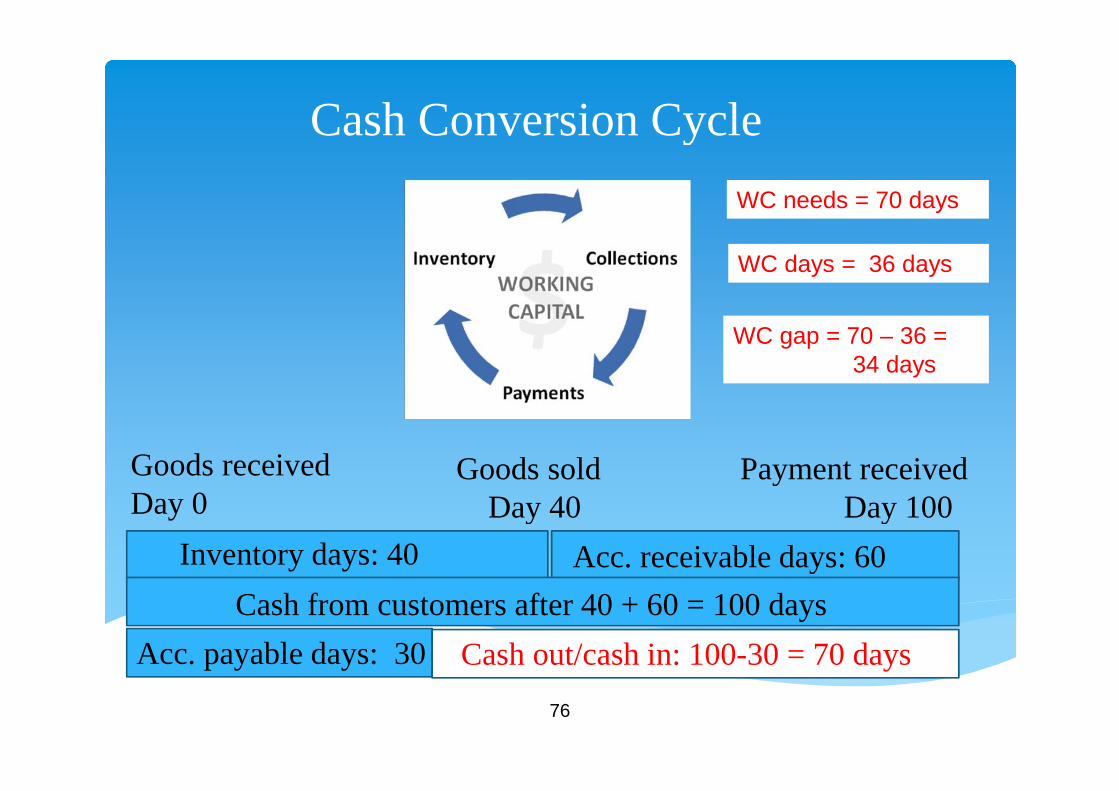
Cash Conversion Cycle
Goods receivedDay 0
Goods soldDay 40
Payment receivedDay 100
Inventory days: 40 Acc. receivable days: 60
Acc. payable days: 30
Cash from customers after 40 + 60 = 100 days
Cash out/cash in: 100-30 = 70 days
WC days = 36 days
WC gap = 70 – 36 =34 days
WC needs = 70 days
77
Working capital and Incoterms
The greater the seller obligations with regard todelivery, the more working capital is tied up intransportation and insurance costs
78
Working capital management tools
Faster recovery ofinternal capital
Infusion of externalcapital
79
Export department management
Assetturnover
Net profitmargin
Profit management
Asset management
X
Liquidity management
X
Financialleverage
ROE
ROA
80
Export department management
Develop, monitor and manage key metrics and ratios toachieve a high return on export investment