key moments in nadcp history b est p ractices in j uvenile d rug c ourts b est p ractices in j...
TRANSCRIPT

Key Moments in NADCP History BEST PRACTICES IN JUVENILE DRUG COURTS
DOUGLAS B. MARLOWE, J.D., PH.D.CHIEF OF SCIENCE, LAW & POLICY
NATIONAL ASSOCIATION OF DRUGCOURT PROFESSIONALS
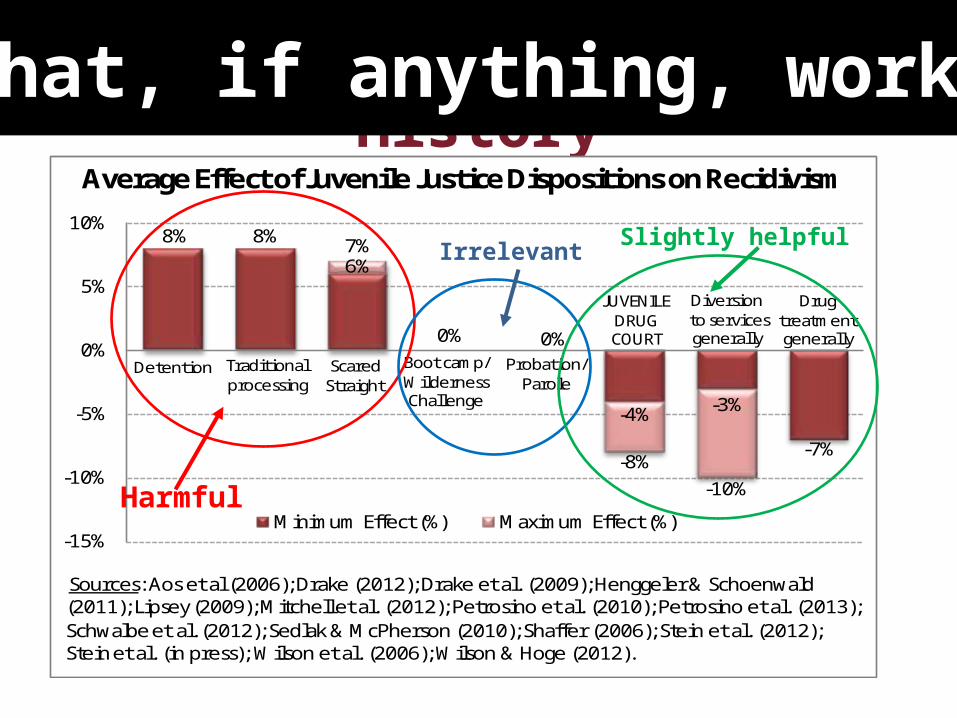
Key Moments in NADCP History What, if anything, works?Average Effect of Juvenile Justice Dispositions on Recidivism
Sources: Aos et al (2006); Drake (2012); Drake et al. (2009); Henggeler & Schoenwald(2011); Lipsey (2009); Mitchell et al. (2012); Petrosino et al. (2010); Petrosino et al. (2013); Schwalbe et al. (2012); Sedlak & McPherson (2010); Shaffer (2006); Stein et al. (2012); Stein et al. (in press); Wilson et al. (2006); Wilson & Hoge (2012).
8% 8%
6%
0% 0%
-4% -3%
-7%
7%
-8%-10%
-15%
-10%
-5%
0%
5%
10%
Minimum Effect (%) Maximum Effect (%)
Detention Traditional processing
Scared Straight
Boot camp/ Wilderness Challenge
Probation/ Parole
JUVENILEDRUGCOURT
Diversionto services generally
Drug treatment generally
Harmful
IrrelevantSlightly helpful
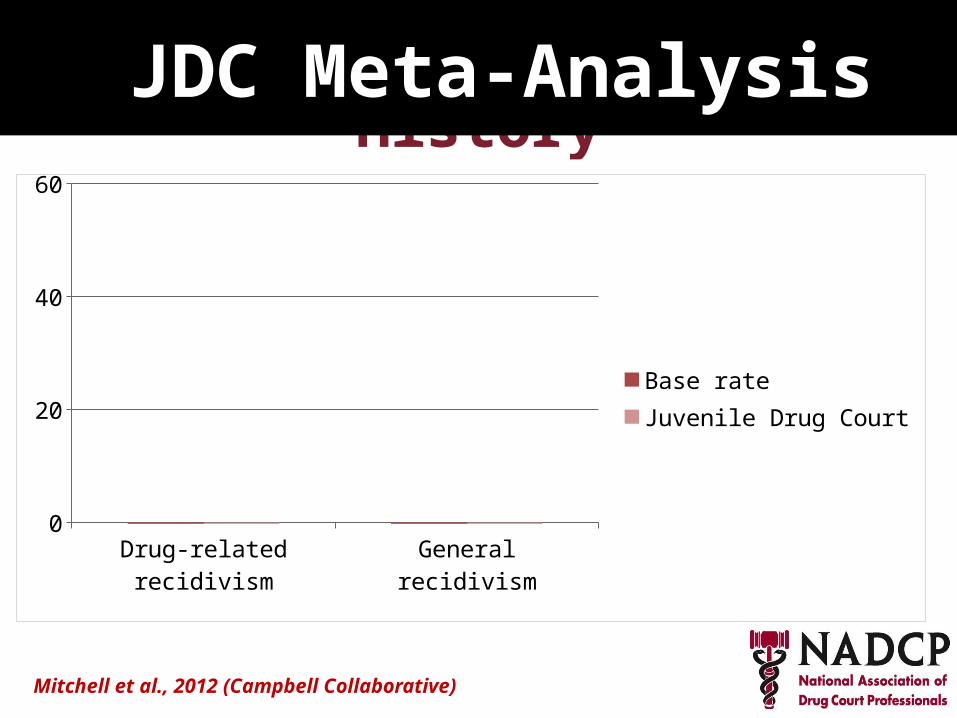
Key Moments in NADCP History JDC Meta-Analysis
Mitchell et al., 2012 (Campbell Collaborative)
Drug-related recidivism General recidivism0
20
40
60
Base rateJuvenile Drug Court
Drug-related recidivism General recidivism0
20
40
60
Base rateJuvenile Drug Court
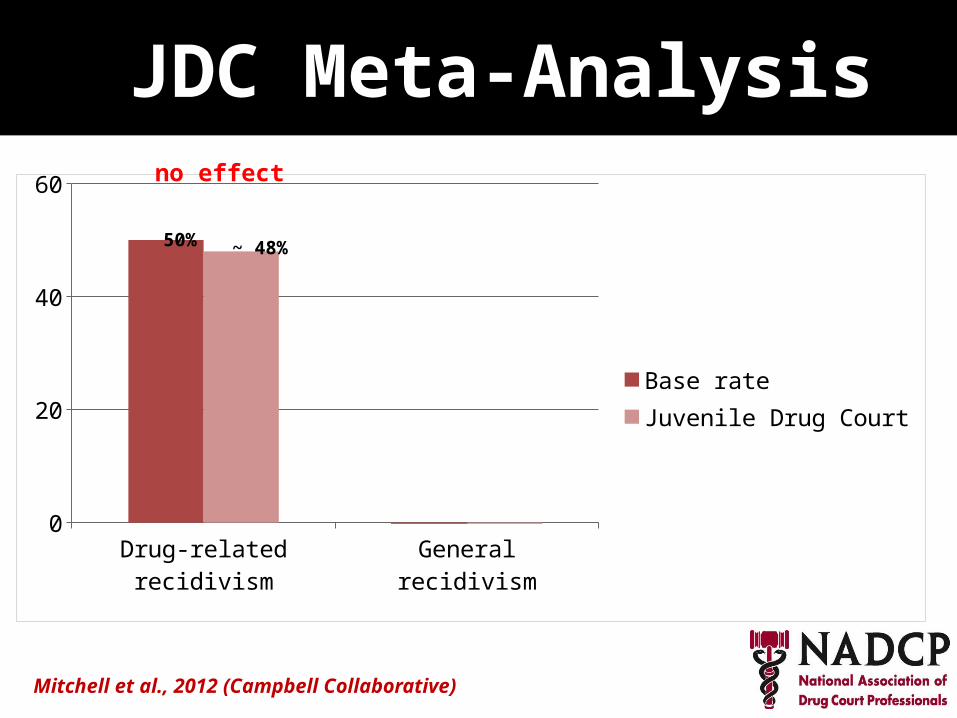
50% ~ 48%
no effect
JDC Meta-Analysis
Mitchell et al., 2012 (Campbell Collaborative)
Drug-related recidivism General recidivism0
20
40
60
Base rateJuvenile Drug Court
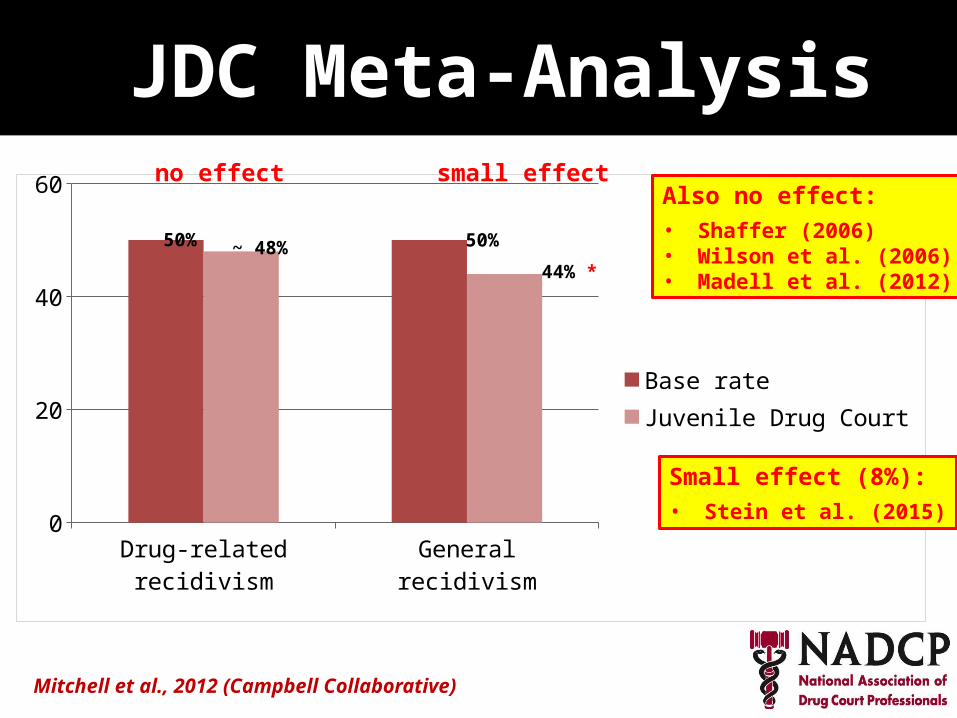
50% ~ 48%44% *
50%
no effect small effect
JDC Meta-Analysis
Mitchell et al., 2012 (Campbell Collaborative)
Also no effect:• Shaffer (2006)• Wilson et al. (2006)• Madell et al. (2012)
Small effect (8%):• Stein et al. (2015)
New offense /"
referral"
New convic
tion / "ad
judication"
0
20
40
60
Juvenile Drug CourtComparison Group
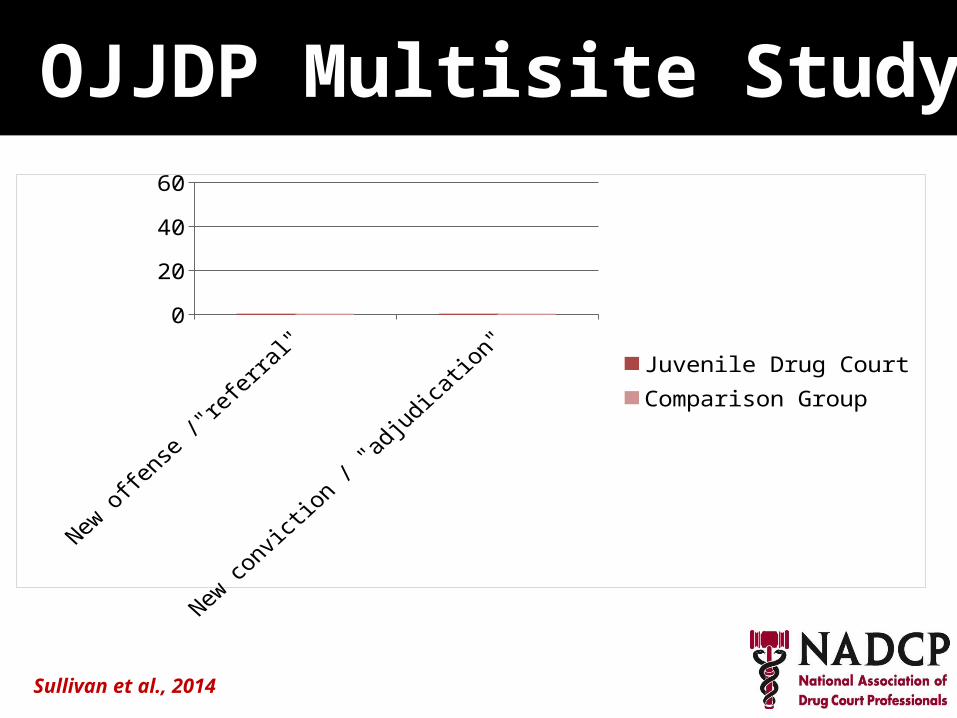
OJJDP Multisite Study
Sullivan et al., 2014
New offense /"
referral"
New convic
tion / "ad
judication"
0
20
40
60
Juvenile Drug CourtComparison Group
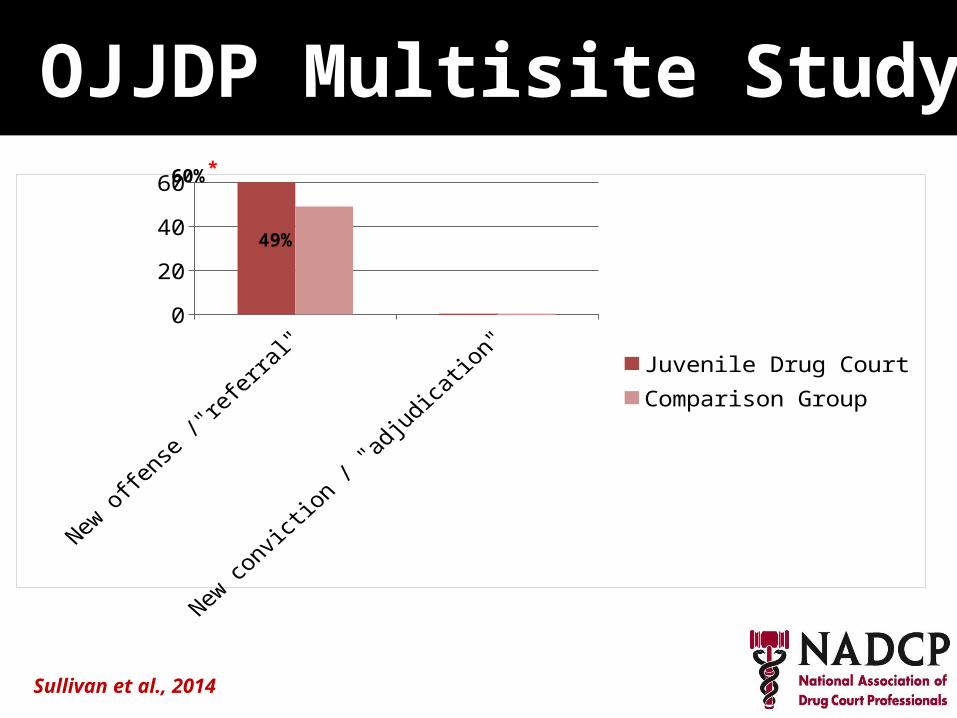
60%
49%
OJJDP Multisite Study
Sullivan et al., 2014
*
New offense /"
referral"
New convic
tion / "ad
judication"
0
20
40
60
Juvenile Drug CourtComparison Group
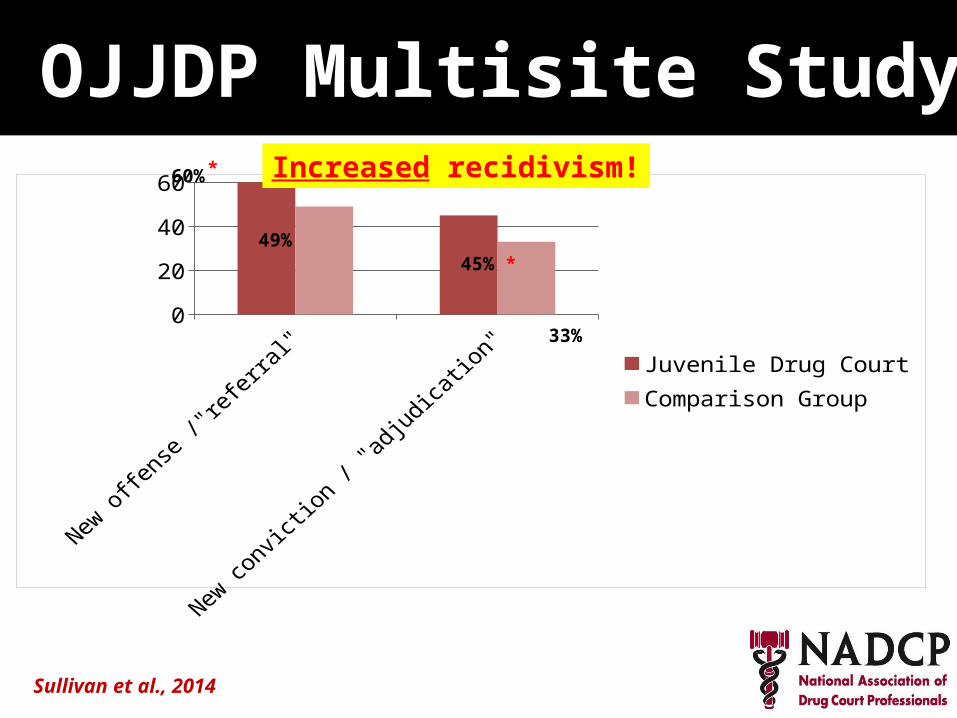
60%
49%
33%
45% *
Increased recidivism!
OJJDP Multisite Study
Sullivan et al., 2014
*
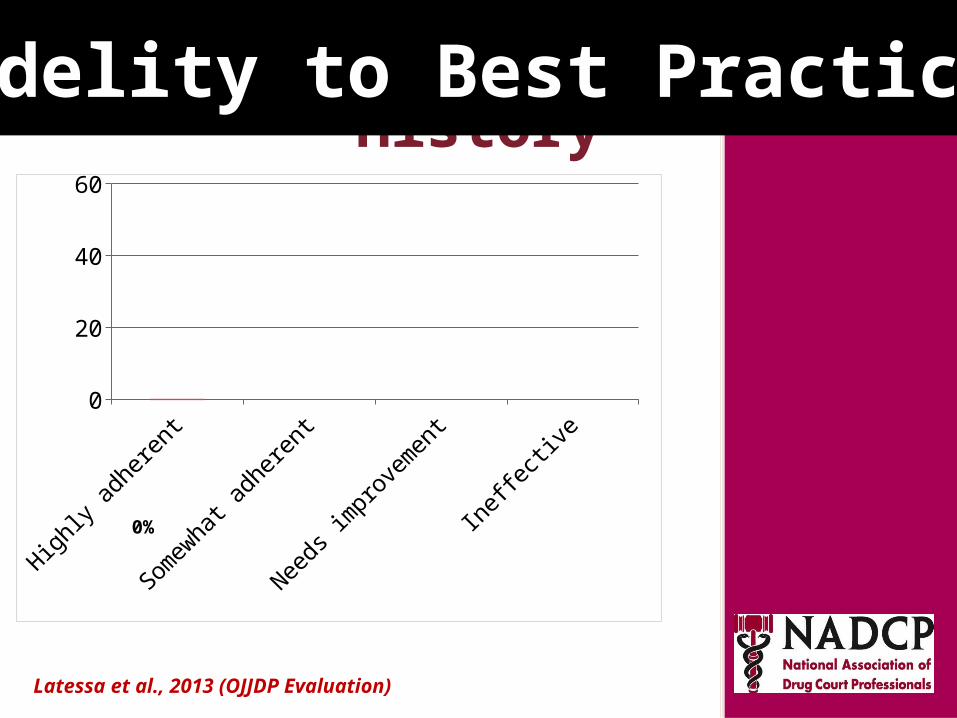
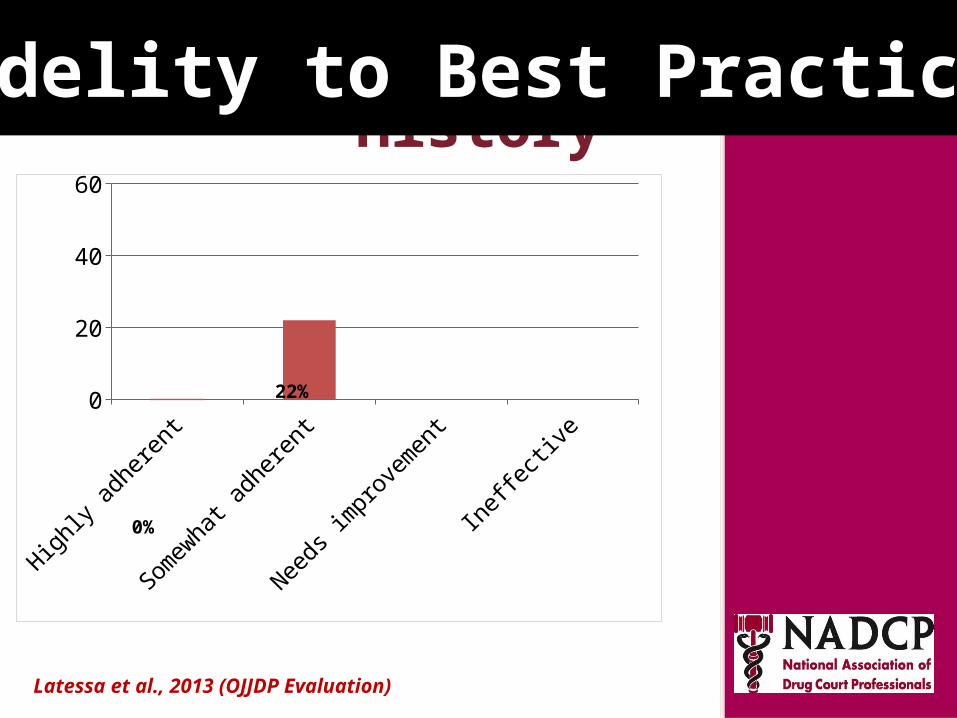
Key Moments in NADCP HistoryFidelity to Best Practices
Highly
adherent
Somewhat
adherent
Needs impro
vement
Ineffective
0
20
40
60
0%
Latessa et al., 2013 (OJJDP Evaluation)
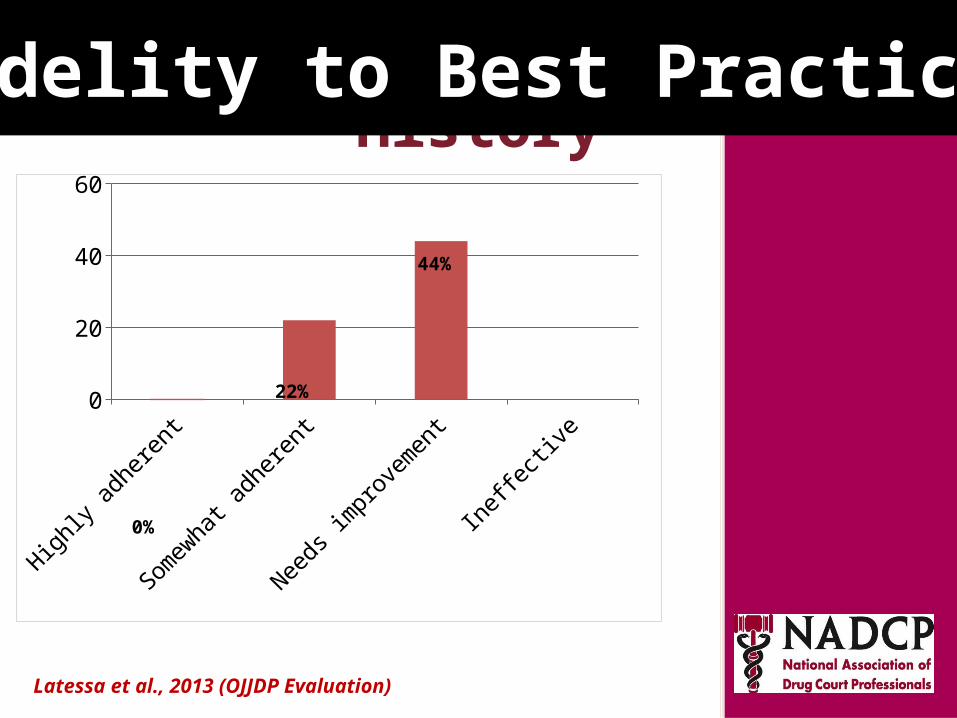
Key Moments in NADCP HistoryFidelity to Best Practices
Highly
adherent
Somewhat
adherent
Needs impro
vement
Ineffective
0
20
40
60
22%
0%
Latessa et al., 2013 (OJJDP Evaluation)
Key Moments in NADCP HistoryFidelity to Best Practices
Highly
adherent
Somewhat
adherent
Needs impro
vement
Ineffective
0
20
40
60
44%
22%
0%
Latessa et al., 2013 (OJJDP Evaluation)
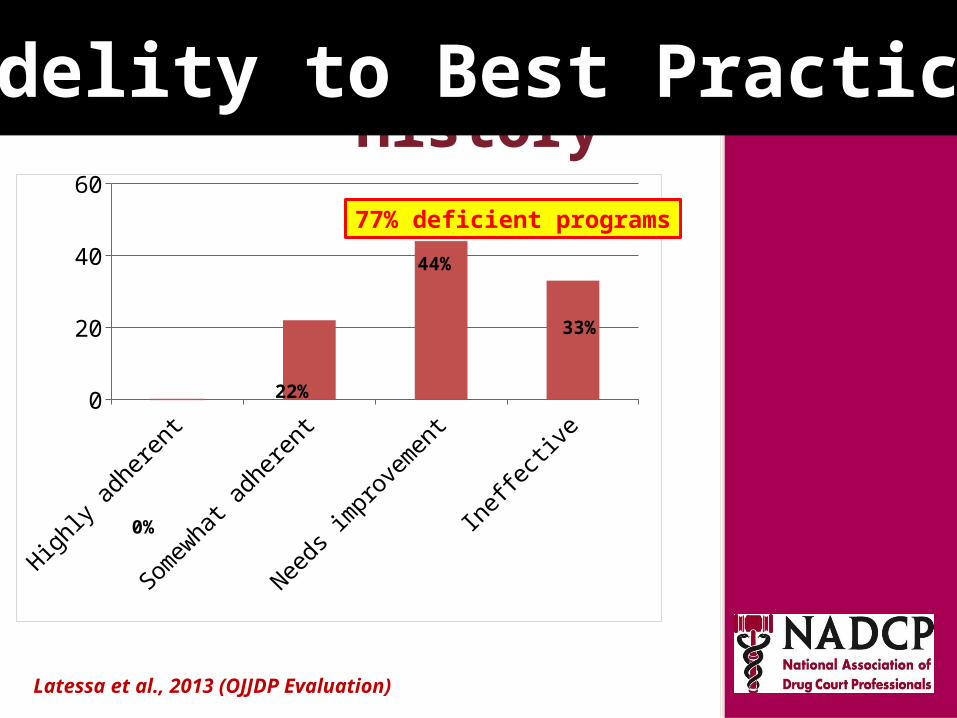
Key Moments in NADCP HistoryFidelity to Best Practices
Highly
adherent
Somewhat
adherent
Needs impro
vement
Ineffective
0
20
40
60
44%
22%
0%
Latessa et al., 2013 (OJJDP Evaluation)
33%
77% deficient programs
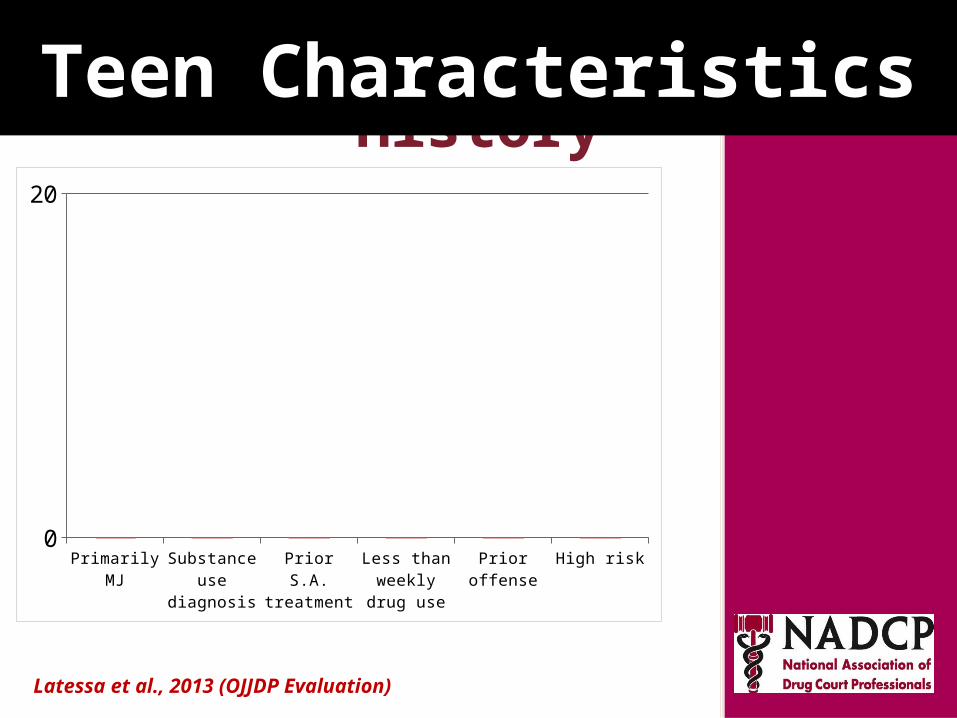
Key Moments in NADCP HistoryTeen Characteristics
Primarily MJ Substance use diagnosis
Prior S.A. treatment
Less than weekly drug
use
Prior offense High risk0
20
Latessa et al., 2013 (OJJDP Evaluation)

Key Moments in NADCP HistoryTeen Characteristics
Primarily or only MJ
Substance use diagnosis
Prior S.A. treatment
Less than weekly drug
use
Prior offense High risk0
20
40
60
8071%
Latessa et al., 2013 (OJJDP Evaluation)
Low need & variable (mixed) risk
40%
51%
26%24%
32%

Key Moments in NADCP HistoryCommunity Panels (not judges)
Cook et al., 2009
Cook et al., 2009
0%
20%
40%
60%
80%
100%
12 mos. 24 mos. 54 mos.
JDC (n = 105)Matched (n = 104)Referred (n = 52)
Re-
arre
st r
ates
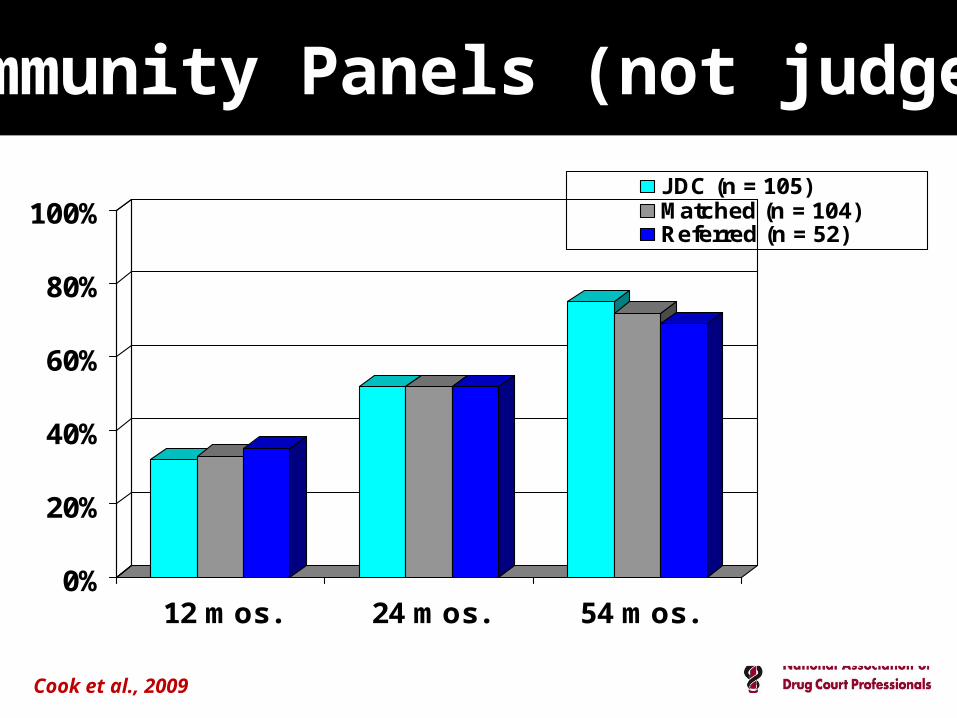
Community Panels (not judges)
Cook et al., 2009
0%
20%
40%
60%
80%
100%
12 mos. 24 mos. 54 mos.
JDC (n = 105)Matched (n = 104)Referred (n = 52)
Re-
arre
st r
ates
Community Panels (not judges)
Cook et al., 2009
0%
20%
40%
60%
80%
100%
12 mos. 24 mos. 54 mos.
JDC (n = 105)Matched (n = 104)Referred (n = 52)
Re-
arre
st r
ates
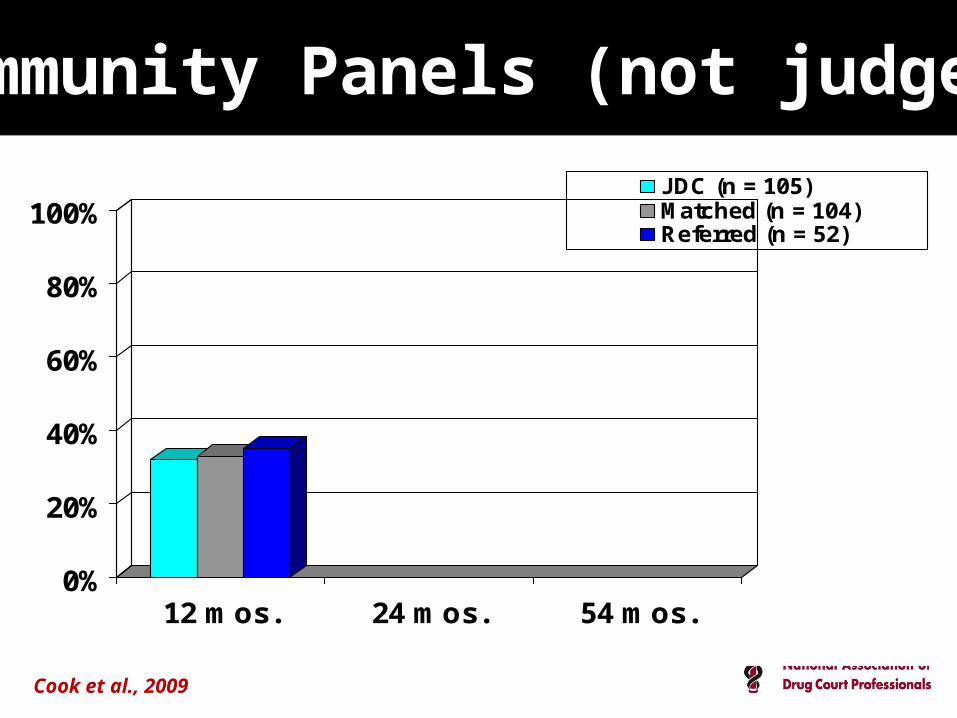
Community Panels (not judges)
32% 33% 35%
No effect
Cook et al., 2009
0%
20%
40%
60%
80%
100%
12 mos. 24 mos. 54 mos.
JDC (n = 105)Matched (n = 104)Referred (n = 52)
Re-
arre
st r
ates
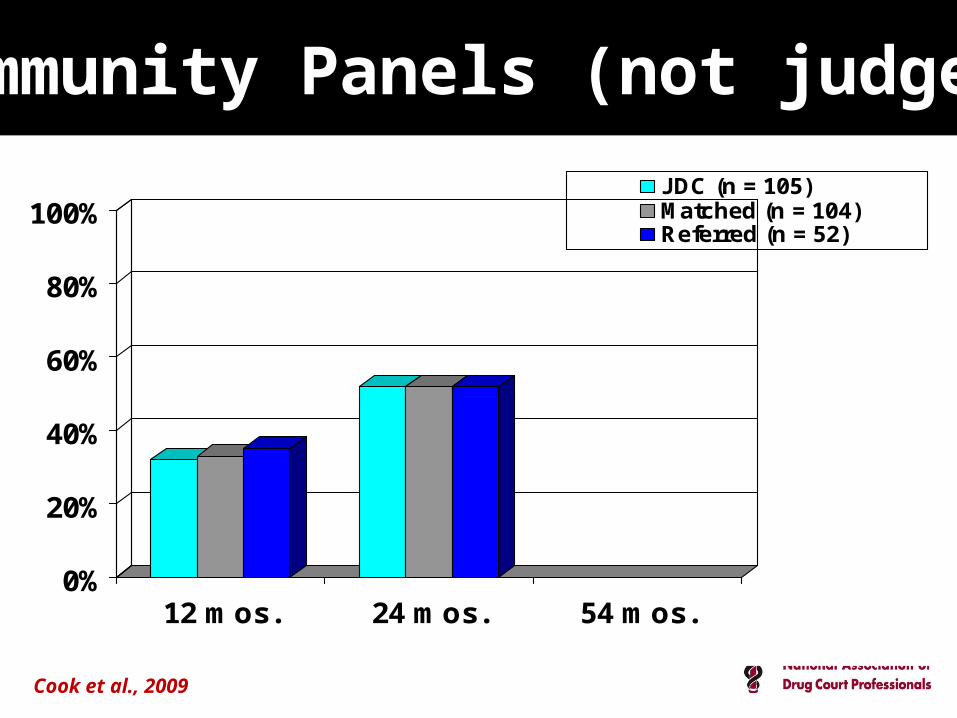
Community Panels (not judges)
32% 33% 35%
52% 52% 52%
No effect
No effect
Cook et al., 2009
0%
20%
40%
60%
80%
100%
12 mos. 24 mos. 54 mos.
JDC (n = 105)Matched (n = 104)Referred (n = 52)
Re-
arre
st r
ates
Community Panels (not judges)
32% 33% 35%
75% 72%69%
52% 52% 52%
No effect
No effect
No effect
Key Moments in NADCP HistoryStructre
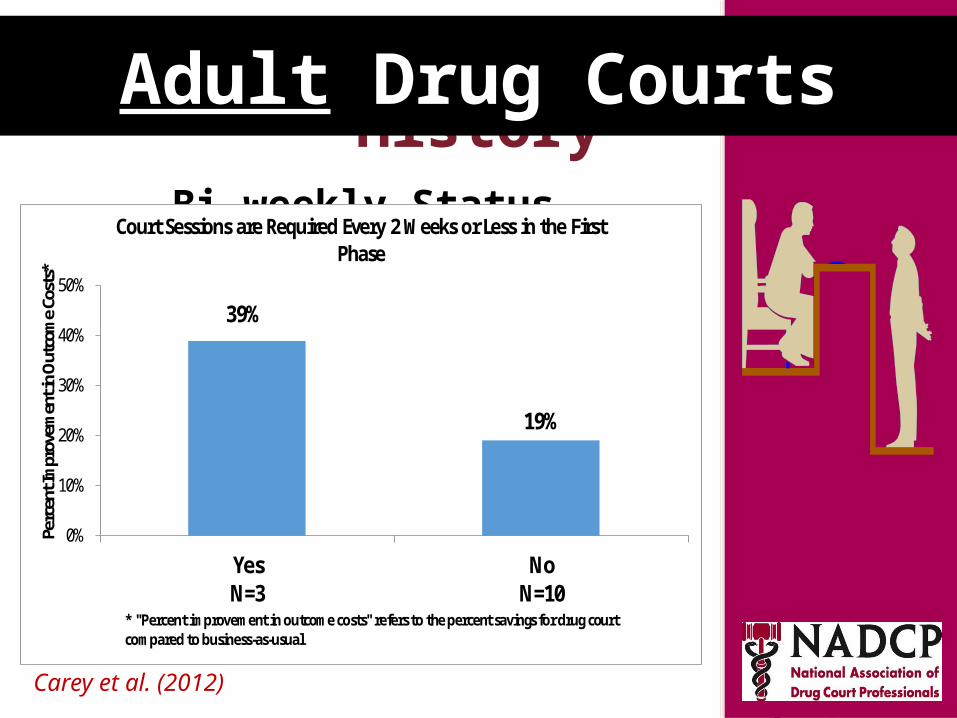
39%
19%
0%
10%
20%
30%
40%
50%
YesN=3
NoN=10
Perc
ent I
mpr
ovem
ent i
n Out
com
e Cos
ts*
* "Percent improvement in outcome costs" refers to the percent savings for drug court compared to business-as-usual
Court Sessions are Required Every 2 Weeks or Less in the First Phase
Twice the cost benefit}
Adult Drug Courts
Carey et al. (2012)
Bi-weekly Status Hearings
Key Moments in NADCP HistoryStructre
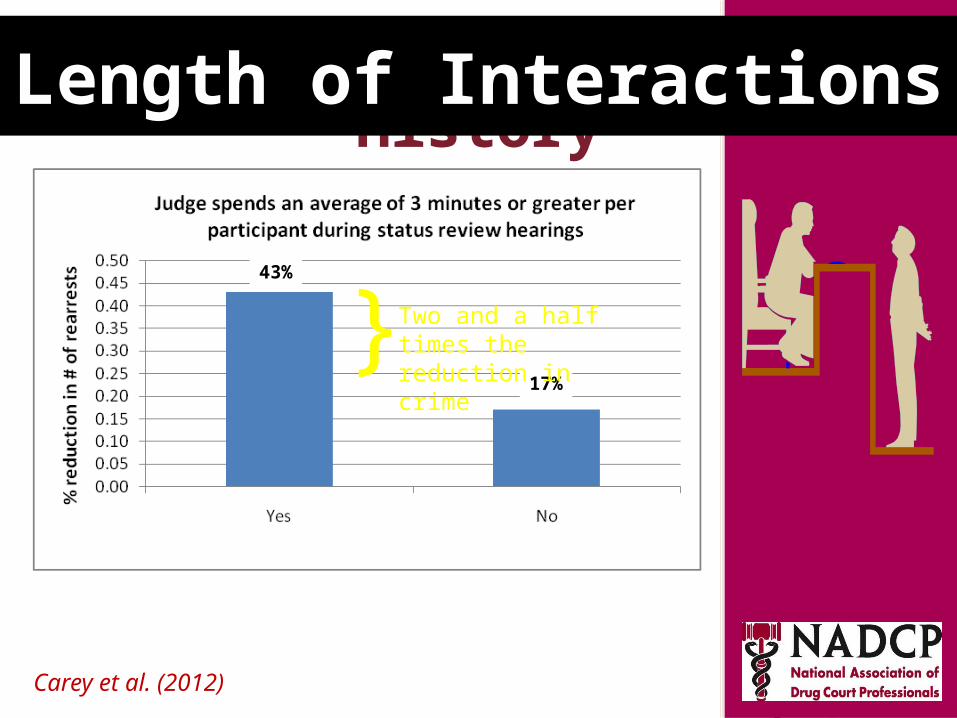
Twice the cost benefit}
Length of Interactions
Carey et al. (2012)
43%
17%
Two and a half times the reduction in crime}
0
1
2
3
4
5
6
Low Medium High
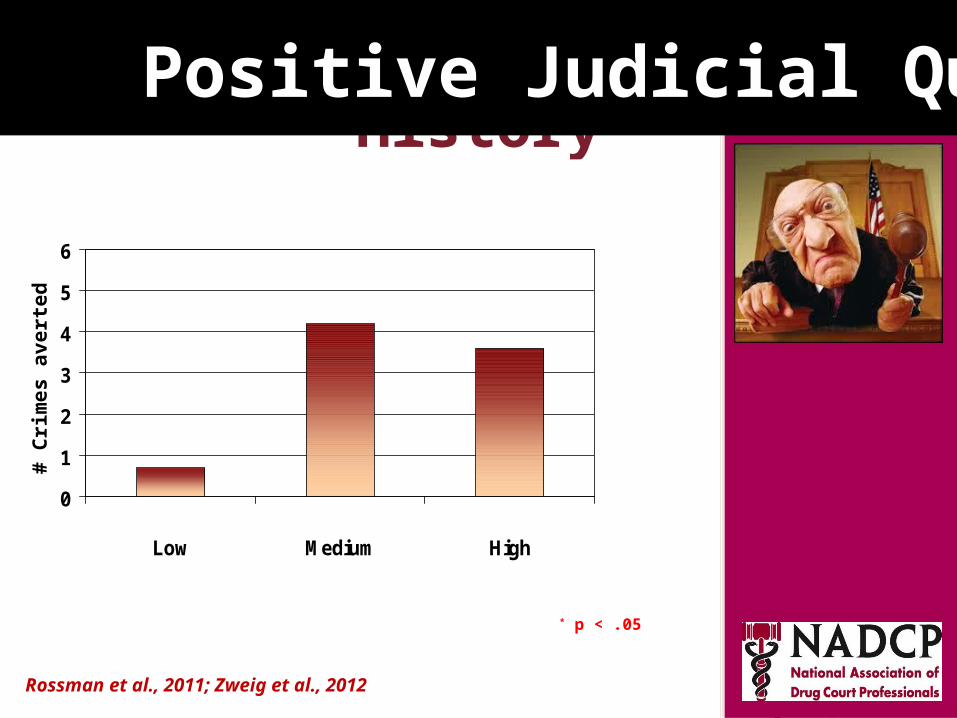
Key Moments in NADCP History Positive Judicial Qualities
3.6 *
0.7# C
rim
es
av
ert
ed
Rossman et al., 2011; Zweig et al., 2012
4.2 *
* p < .05
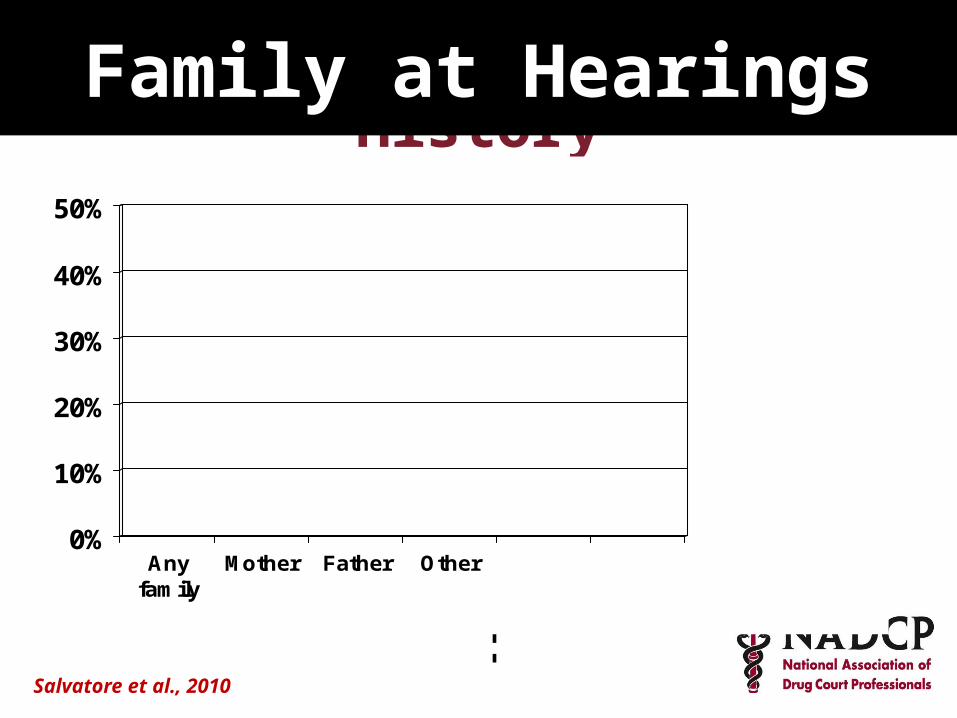
Key Moments in NADCP HistoryFamily at Hearings
0%
10%
20%
30%
40%
50%
Anyfamily
Mother Father Other
Salvatore et al., 2010
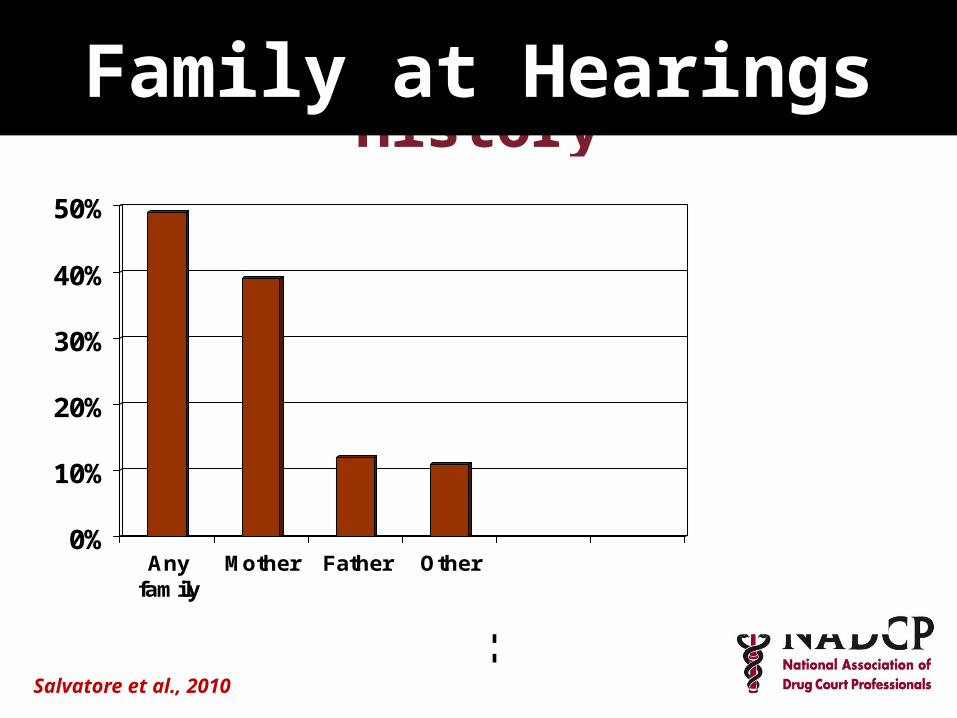
Key Moments in NADCP HistoryFamily at Hearings
Salvatore et al., 2010
0%
10%
20%
30%
40%
50%
Anyfamily
Mother Father Other
49%
11%12%
39%
Family at approx. half of hearings
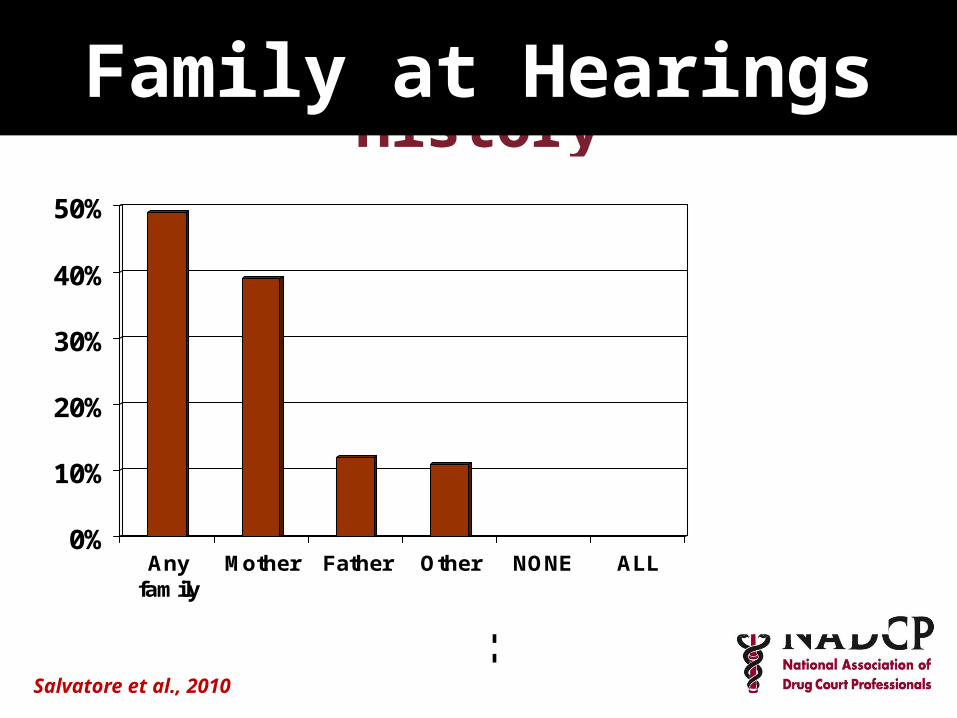
Key Moments in NADCP HistoryFamily at Hearings
Salvatore et al., 2010
0%
10%
20%
30%
40%
50%
Anyfamily
Mother Father Other NONE ALL
49%
11%12%
39%

Key Moments in NADCP HistoryFamily at Hearings
Salvatore et al., 2010
0%
10%
20%
30%
40%
50%
Anyfamily
Mother Father Other NONE ALL
49%
11%12%
39%
21%
26%
No family for fifth of kids
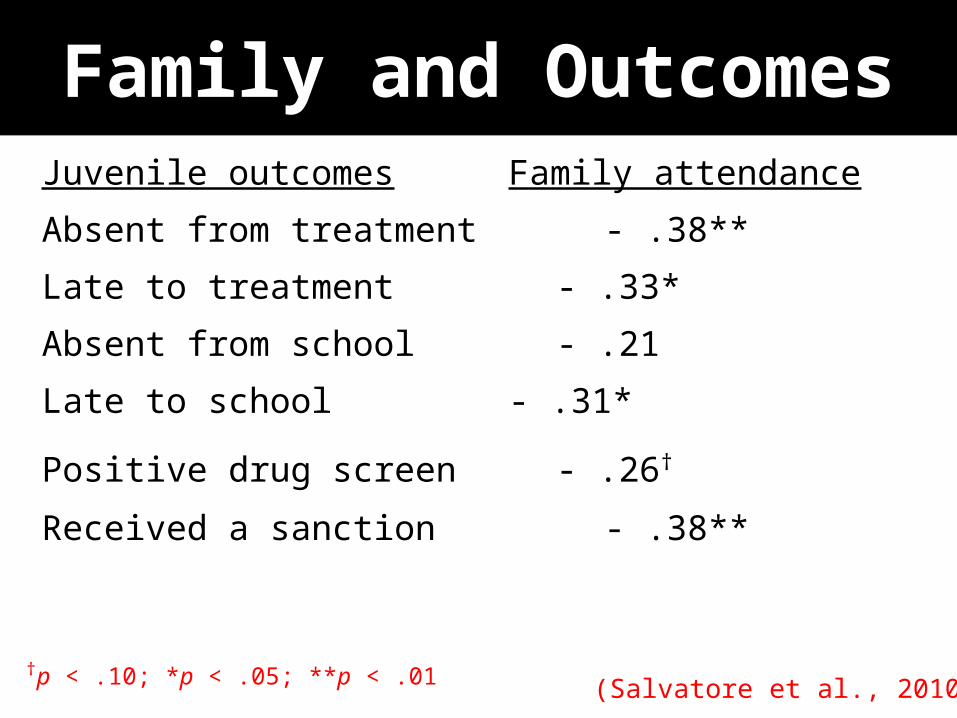
Juvenile outcomes Family attendance
Absent from treatment - .38**
Late to treatment - .33*
Absent from school - .21
Late to school - .31*
Positive drug screen - .26† Received a sanction - .38**
† p < .10; *p < .05; **p < .01 (Salvatore et al., 2010)
Family and Outcomes
0
5
10
15
20
Family Ct. JDC JDC + MST/CMn=32 n=29 n=37
Henggeler et al., 2006
Days of Substance Use Per Month at 12-Month Follow-Up
Family-Based Treatment
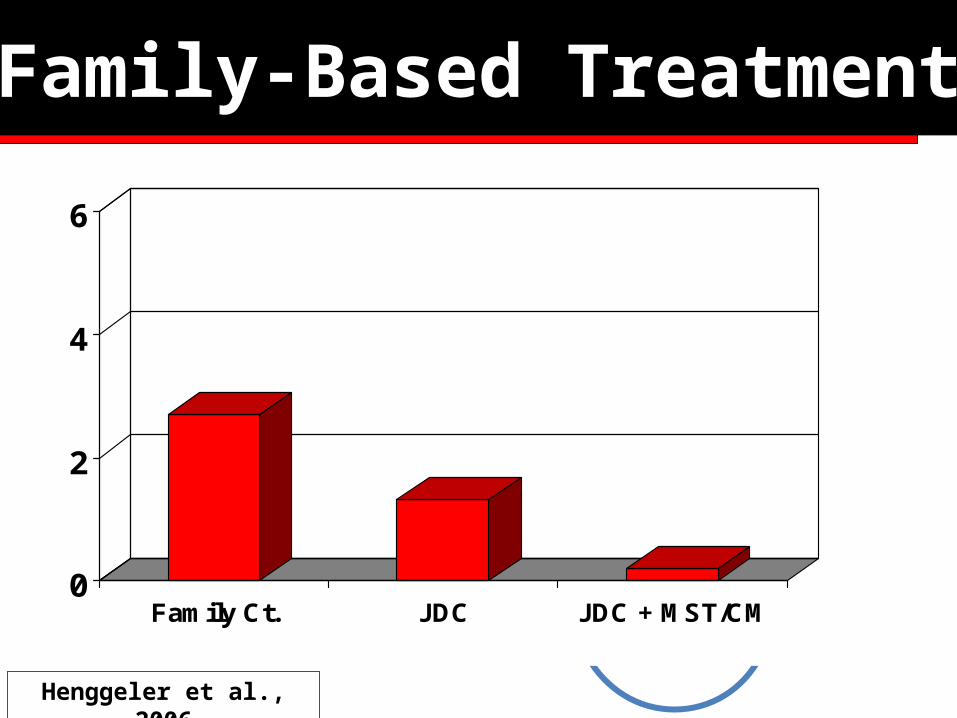
0
2
4
6
Family Ct. JDC JDC + MST/CMn=33 n=31 n=37
p < .05
*
Days of Substance Use Per Month at 12-Month Follow-Up
2.70
1.32
0.19
Family-Based Treatment
Henggeler et al., 2006
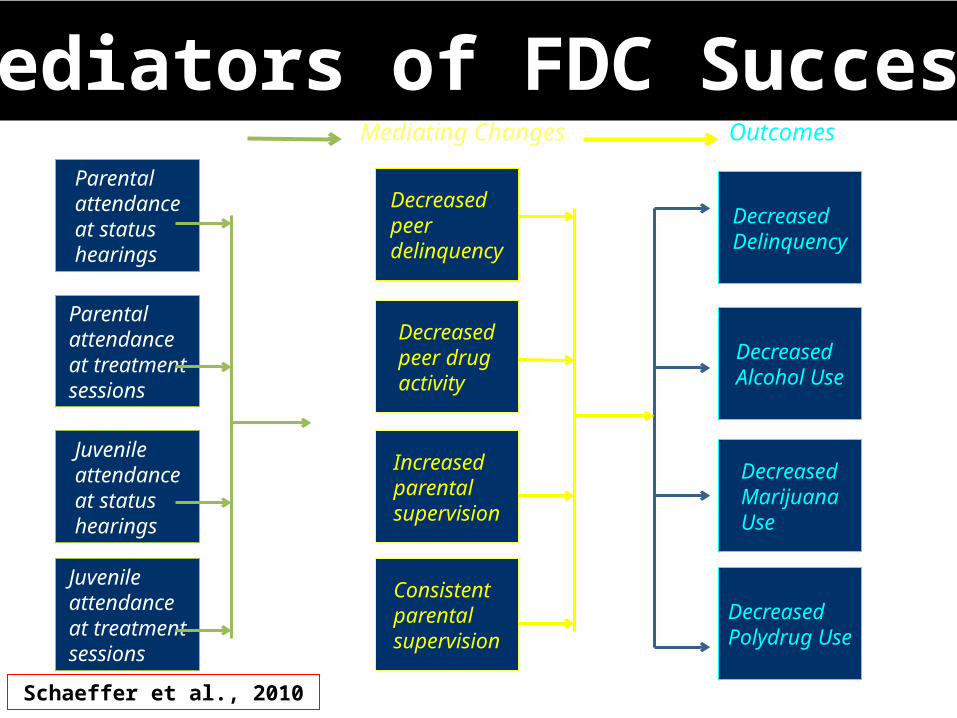
Parental attendance at status hearings
Parental attendance at treatment sessions
Juvenile attendance at status hearings
Juvenile attendance at treatment sessions
Decreased peer delinquency
Decreased peer drug activity
Increased parental supervision
Consistent parental supervision
Decreased Delinquency
Decreased Alcohol Use
Decreased Marijuana Use
Decreased Polydrug Use
Essential Services Mediating Changes Outcomes
Schaeffer et al., 2010
Mediators of FDC Success
0
2
4
Never Rarely Sometimes Always
Trea
tmen
t P
lan
Go
als
Ach
ieve
d
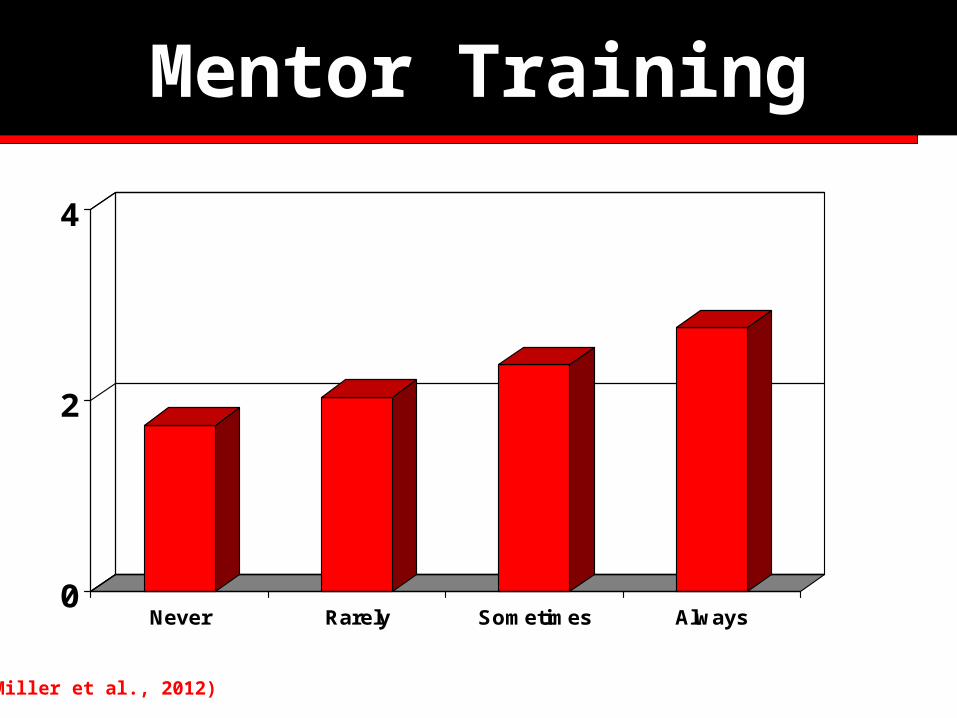
Mentor Training
(Miller et al., 2012)
Specialized Training & Supervision of Mentors
0
2
4
Never Rarely Sometimes Always * p < .05
*
Trea
tmen
t P
lan
Go
als
Ach
ieve
d
1.75
2.04
2.38
Mentor Training
(Miller et al., 2012)
Specialized Training & Supervision of Mentors
2.77
0
2
4
1 to 2 3 to 4 > 4
Trea
tmen
t P
lan
Go
als
Ach
ieve
d
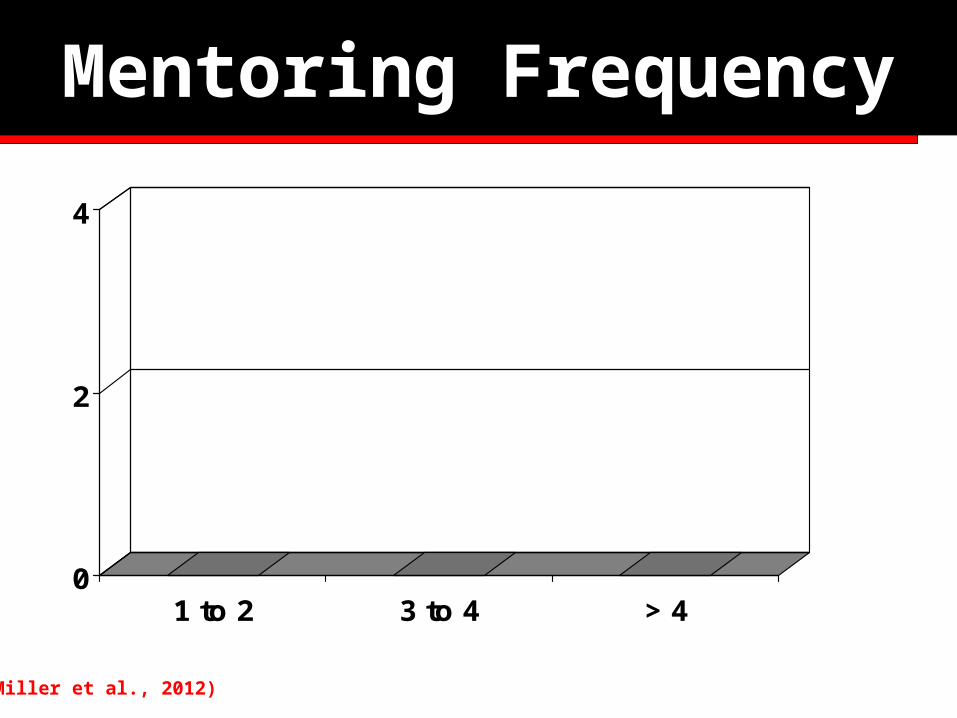
Mentoring Frequency
(Miller et al., 2012)
No. Mentor/Mentee Meetings per Month

0
2
4
1 to 2 3 to 4 > 4 * p < .05
*
Trea
tmen
t P
lan
Go
als
Ach
ieve
d
2.18
2.55
2.97
Mentoring Frequency
(Miller et al., 2012)
No. Mentor/Mentee Meetings per Month
0
2
4
< 1 hour 1 to 2 hours 2 to 3 hours > 3 hours
Trea
tmen
t P
lan
Go
als
Ach
ieve
d
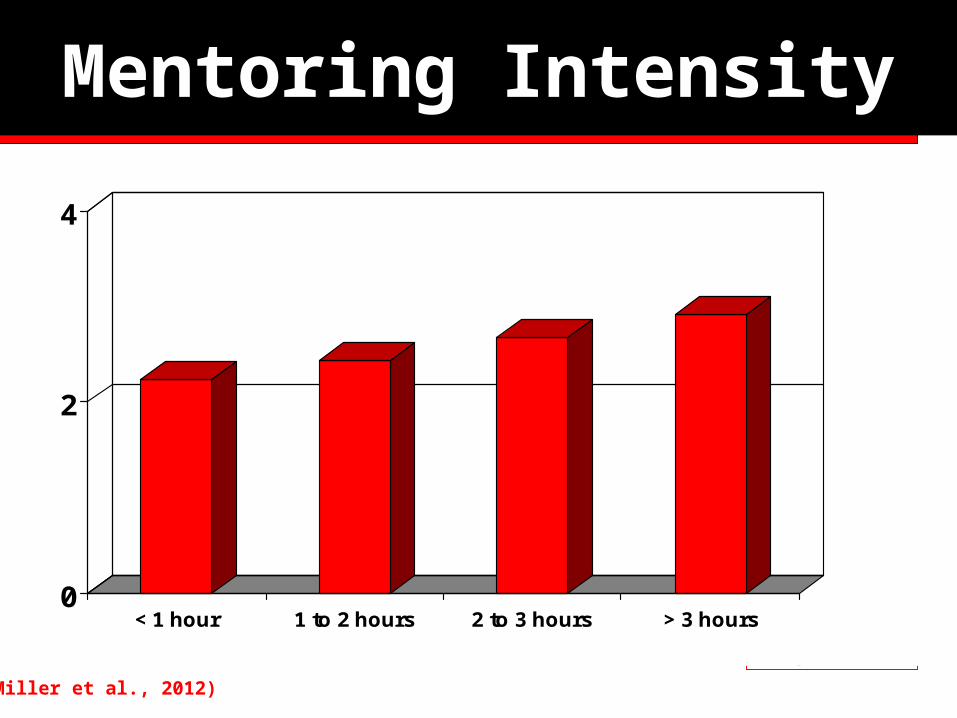
Mentoring Intensity
(Miller et al., 2012)
Duration of Mentor/Mentee Meetings
0
2
4
< 1 hour 1 to 2 hours 2 to 3 hours > 3 hours
Trea
tmen
t P
lan
Go
als
Ach
ieve
d
Mentoring Intensity
(Miller et al., 2012)
Duration of Mentor/Mentee Meetings * p < .05
*
2.242.44
2.92
2.67
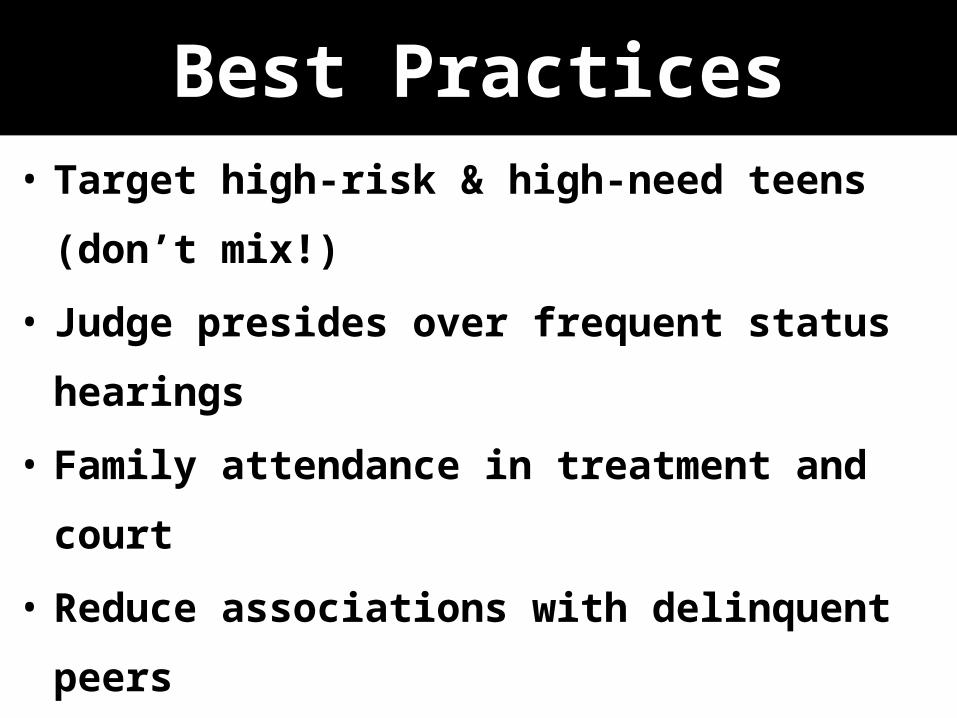
• Target high-risk & high-need teens (don’t mix!)
• Judge presides over frequent status hearings
• Family attendance in treatment and court
• Reduce associations with delinquent peers
• Enhance guardian supervision of teens
• Model consistent disciplinary practices
• Reduce reliance on detention
• Professionally trained mentors
Best Practices