key performance indicators for the uk national … performance indicators for the uk national dairy...
TRANSCRIPT
Key Performance Indicators for the UK
national dairy herd
A study of herd performance in
500 Holstein/Friesian herds for the year
ending 31st
August 2017
Dr. James Hanks
&
Dr. Mohamad Kossaibati
November, 2017
Veterinary Epidemiology & Economics Research Unit (VEERU),
School of Agriculture Policy & Development,
University of Reading,
P.O.Box 237
Reading,
RG6 6AR
1
Table of Contents
Section 1: Key Performance Indicators for the year ending 31/08/2017 ................................................ 2 Introduction .......................................................................................................................................... 2 Parameter description ........................................................................................................................... 2
The sample of herds ............................................................................................................................. 2 The parameters ..................................................................................................................................... 3 Changes to studies from earlier years .................................................................................................. 4 Acknowledgements .............................................................................................................................. 5
Section 2: KPI Results for the year ending 31/08/2017 ............................................................................ 6
Section 3: Trends in Key Performance Indicators 2010 to 2017 ........................................................... 26 Changes in Key Parameters over the 8 annual KPI studies ............................................................... 27
3.1: Trends in Culling & Longevity Parameters over the last 8 years……………………….27
3.2: Trends in Key Fertility Parameters over the last 8 years………………………………..29
3.3: Trends in Key SCC & Mastitis Parameters over the last 8 years……………………….31
Section 4. The Practical Use of Key Performance Indicators By Farmers And
Their Technical Advisers ....................................................................................................... 33 Using the target and range values to highlight a herd’s strengths & weaknesses .............................. 35 Monitoring performance and improvement of groups of herds ......................................................... 36
Relationship between parameters: Herd SCC vs % chronic high SCC milk samples ....................... 37
Appendix 1. Key Performance Indicators definitions .......................................................................... 40
Appendix 2. Herd Companion High SCC Categories .......................................................................... 43
2
Section 1: Key Performance Indicators for the year ending 31/08/2017
Introduction This is the eighth annual study describing key indicators of production, fertility and health in
commercial black and white dairy herds in the United Kingdom. The Key Performance Indicators
(KPIs) are based on milk recording data from 500 commercial black and white herds for the 12 month
period ending on 31st August 2017. Herd selection used random numbers to ensure a representative
cross-section of all herds (good, bad and indifferent) that milk record with National Milk Records
(NMR).
The range in performance across these herds is described for 38 parameters clearly showing the wide
differences in performance, as well as huge potential for improvement, in commercial dairy herds.
This includes 6 additional parameters (including mastitis rate/100 cows in milk/year) shown since the
2016 study. The principal objective throughout has been to provide farmers and technical advisers with
accurate and up-to-date information on the variation in performance of commercial dairy herds.
The calculations used to generate these parameters are identical to those used by the InterHerd+
program allowing farmers and technical advisers to compare the performance of any milk recording
herd directly with the 500 herd sample that is representative of the national performance. In other
words, for each parameter is the performance of my herd typical/outlying, good/acceptable/poor
when compared to the 500 herds? This leads on to “Why is a parameter where it is? Which
parameters could/should we improve/prioritise and what are the likely implications?” If this
promotes discussion between farmers and their technical advisers into the different causes and options
for improvement then the study has served its primary purpose.
Following the analysis of individual parameters there is a section on trends since 2010 for a selection
of the KPIs. Further sections discuss their practical use by farmers and advisers. A KPI template of 80
parameters for use in InterHerd+ is also available for users to update the KPI parameters to the target
values from the 2017 study.
Parameter description For 35 parameters described in this study (out of total of 38), the performance level of each of the 500
herds (262 herds for mastitis rate) is presented as a bar chart. The herds are displayed from “best” to
“worst”, in ascending or descending order depending on whether it is generally preferable to have a
low value (e.g. SCC, calving interval) or a high value (e.g. dry period cure, conception rate). The
“best” is always on the left side, nearest the vertical Y axis. For each parameter, a median (middle)
value and inter-quartile range values (the level achieved by the middle 50% of herds) are also derived.
The target value proposed for each parameter (and included in the KPI template) is the level achieved
by the “best” 25% of the herds for that parameter. In other words, the target is set at a level
currently achieved (or exceeded) by one in four dairy herds over the last year.
The sample of herds The source of data is the monthly milk records obtained by National Milk Records (NMR). The 500
herds used in the study all fully milk record on a monthly assisted basis and represent approximately
10% of herds recorded by NMR. Herds were selected using random numbers to ensure a representative
3
cross-section of the sample. The herds are all predominantly comprised of black and white breeds
(Holstein, Holstein-Friesian, Friesian) and have recorded for a minimum of two years. Where possible
the same herds used in the 2016 study were maintained for the 2017 herds’ sample. Herds with poor
fertility data (inadequate recording of services and pregnancy diagnoses), as well as herds no longer
recording, were replaced with new herds, again selected using random numbers. In total 445 herds
(89%) were in both the 2016 and 2017 studies.
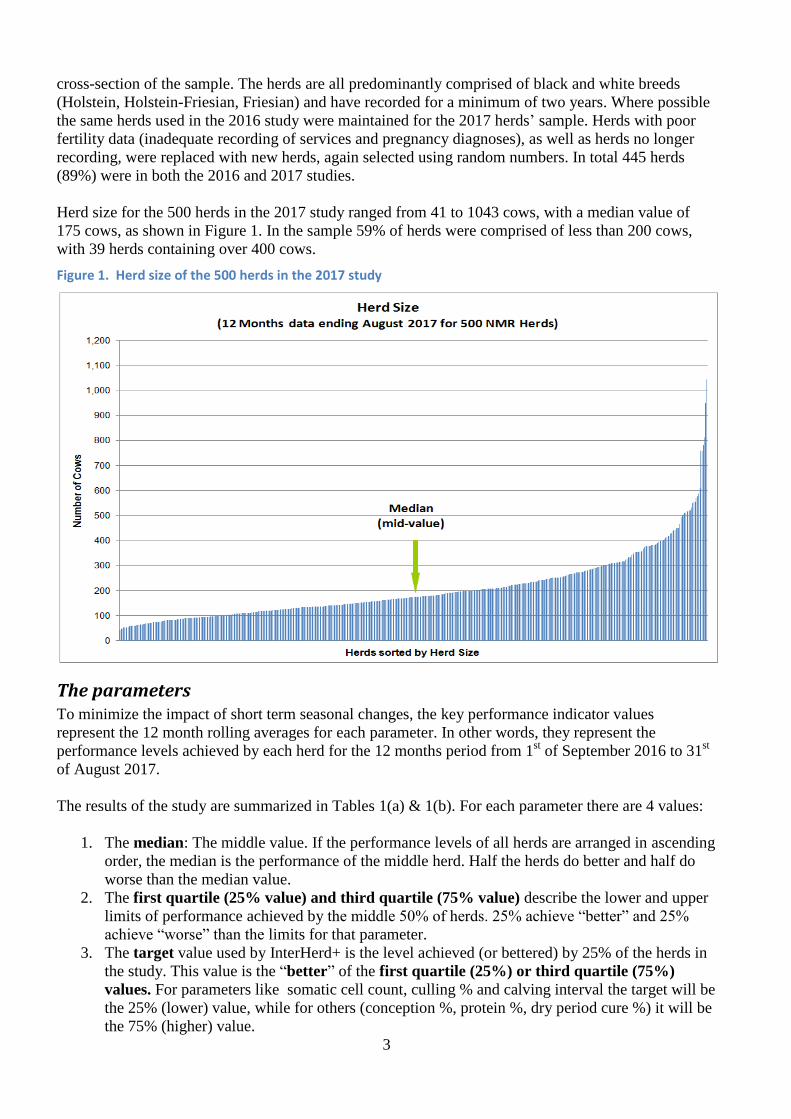
Herd size for the 500 herds in the 2017 study ranged from 41 to 1043 cows, with a median value of
175 cows, as shown in Figure 1. In the sample 59% of herds were comprised of less than 200 cows,
with 39 herds containing over 400 cows.
Figure 1. Herd size of the 500 herds in the 2017 study
The parameters To minimize the impact of short term seasonal changes, the key performance indicator values
represent the 12 month rolling averages for each parameter. In other words, they represent the
performance levels achieved by each herd for the 12 months period from 1st of September 2016 to 31
st
of August 2017.
The results of the study are summarized in Tables 1(a) & 1(b). For each parameter there are 4 values:
1. The median: The middle value. If the performance levels of all herds are arranged in ascending
order, the median is the performance of the middle herd. Half the herds do better and half do
worse than the median value.
2. The first quartile (25% value) and third quartile (75% value) describe the lower and upper
limits of performance achieved by the middle 50% of herds. 25% achieve “better” and 25%
achieve “worse” than the limits for that parameter.
3. The target value used by InterHerd+ is the level achieved (or bettered) by 25% of the herds in
the study. This value is the “better” of the first quartile (25%) or third quartile (75%)
values. For parameters like somatic cell count, culling % and calving interval the target will be
the 25% (lower) value, while for others (conception %, protein %, dry period cure %) it will be
the 75% (higher) value.

4
4. The inter-quartile range is the difference between the performance of the best and worst 25%
of herds (i.e. the difference between the first quartile (25% value) and third quartile (75%
value).
The origin of these values is described in Figure 2. Throughout this document the parameter value
is displayed on the vertical Y axis with one bar for each of the study herds arranged along the
horizontal X axis. The “best” performing herd is nearest the vertical Y axis with the worst
performing herd furthest away. The parameter described in Figure 2 is the herd average SCC so the
target value is at the lower end of the inter-quartile range (as a low average SCC is preferable to a
high average SCC).
Figure 2. A description of the median, inter-quartile range and target values generated for each parameter
The definitions of each parameter are detailed in Appendix 1.
Changes to studies from earlier years 1. Mastitis Key Performance indicators: The results of the study summarized in Tables 1(a) &
1(b) include 4 parameters relating to mastitis, including the herd overall Mastitis rate
(cases/100 cows in milk/year). This is the second year that mastitis related parameters have
been derived from the survey herds, reflecting the significant improvement in the level of
reporting of mastitis by farmers in recent years. While in 2012 less than 20% of herds reported
any mastitis, this has risen to over 52% of herds in 2017. For the purpose of this study any herd
that recorded at least 5 cases/100 cows in milk/ year was considered to record mastitis. In total
262 of the 500 herds (52%) qualified and the parameters are calculated based on these 262
herds.
2. 305 day milk/protein/fat yields: In previous reports up to that of 2015, the 305 day yield
parameter was calculated from all lactations, including lactations that were shorter than 305
days. In this report, as in 2016, the lactation must be at least 305 days long for inclusion in the
calculation. This report also details the 305 day yields (total yield up to and including the 305th
25% value
(Target) 75% value
Median
(mid-value)
Inter-quartile range
(25% - 75%)
Herds achieving
better than target
(top 25%)
Herds in the
“worst” 25%
nationally

5
day of lactation) of fat and protein. As with the milk yield, these parameters are calculated from
lactations that were at least 305 days in length. Note that the exclusion of lactations shorter
than 305 days does not apply to the calculation of the overall lactation yield. In some
circumstances, when many cows have lactation lengths below 305 days, this can result in
lactation yields smaller than the 305 day yields.
Acknowledgements The authors are very grateful to National Milk Records (NMR) for their assistance and cooperation
with the preparation of this study.
6
Section 2: KPI Results for the year ending 31/08/2017
Table 1(a) Summary of Key Performance Indicators derived from analysis of 500 NMR milk
recording herds for the year ending 31st August 2017 – Culling, fertility & milk parameters.
Parameter Median
(1)
1st – 3rd
quartile
(25% - 75%)
(2)
Target
(3)
Inter-quartile
range (4)
A. Culling rate 26% 21% - 32% 21% 11%
B. Percentage culled / died 100 days after calving 5% 3% - 7% 3% 4%
C. Age at exit (years) 6.0 5.5 - 6.7 6.7 1.2
D. Age at exit by lactations 3.6 3.1 - 4.0 4.0 0.9
E. Percentage Served by day 80 60% 47% - 70% 70% 23%
F. Percentage conceived 100 days after calving 35% 25% - 41% 41% 16%
G. Calving to 1st service interval (days) 81 69 - 95 69 26
H. Calving interval (days) 402 389 - 419 389 30
I. Age at 1st calving (years) 2.3 2.1 - 2.5 2.1 0.4
J. Conception rate 34% 28% - 41% 41% 13%
K. %Service intervals at 18-24 days (Heat detection) 36% 29% - 42% 42% 13%
L. Percentage service intervals >50 days 23% 15% - 32% 15% 17%
M. %Cows eligible for service served (Submission rate) 38% 27% - 49% 49% 22%
N. %Eligible for service that conceived (Pregnancy rate) 14% 9% - 18% 18% 9%
O. Lifetime milk / cow / day (kg) 12.3 10.3 - 14.4 14.4 4.1
P. Milk / cow / year (kg) 8,381 7,237 - 9,519 9,519 2,282
Q. Average protein% 3.26% 3.20% - 3.34% 3.34% 0.14%
R. Average fat% 4.00% 3.83% - 4.16% 4.16% 0.33%
S. 305-day milk yield (kg) 8,845 7,741 - 9,856 9,856 2,115
T. 305-day protein yield (kg) 283 252 - 315 315 63
U. 305-day fat yield (kg) 355 308- 388 388 80
(1) The median is the middle value (so 250 herds were better and 250 were worse than this value).
(2) The first quartile (25% value) and third quartile (75% value) describe the lower and upper
limits of performance achieved by the middle 50% of herds. 25%, or one in four, herds achieve
“better” and 25% “worse” than the limits for that parameter. (3) The Target is set at the level achieved by the “best” 25% of herds. One in four of the 500 herds in
the sample achieved this level or better.
(4) The inter-quartile range encompasses half the study herds. It is the difference in performance between a
herd achieving the target (best 25% value) and a herd at the worst quartile (75% value).
7
Table 1(b) Summary of Key Performance Indicators derived from analysis of 500 NMR milk
recording herds for the year ending 31st August 2017 – Somatic Cell Count (SCC) and mastitis
parameters.
Parameter Median
(1)
1st – 3rd
quartile
(25% - 75%)
(2)
Target
(3)
Inter-quartile
range (4)
V. Herd SCC (‘000 cells/ml) 179 145 - 223 145 78
W. % milk samples with High SCC (*) 19% 15% - 23% 15% 8%
X. % milk samples with SCC >=500,000 cells/ml 7% 5% - 9% 5% 4%
Y. % cows with High SCC at 1st recording in lactation
(*) 16% 13% - 22% 13% 9%
Z. % Chronic milk samples (**) 10% 7% - 13% 7% 6%
ZA. Dry period cure (High:Low) (***) 77% 69% - 84% 84% 15%
ZB. Dry period protection (Low:Low) (***) 86% 80% - 90% 90% 10%
ZC. % Low at last recording of previous lactation (*) 71% 60% - 78% 78% 18%
ZD. % samples New SCC category (**) 7% 5% - 9% 5% 4%
ZE. % cows dried-off with no High SCC samples in
the lactation (*) 43% 35% - 51% 51% 16%
ZF. Threshold Index new high / new low (****) 1.28 1.16 - 1.42 1.16 0.26
ZG. % of cows with New/First/Repeat sample that are
Low SCC at next recording (**) 54% 49% - 59% 59% 10%
ZH. % of cows with Chronic sample that are low SCC
at next recording (**) 19% 15% - 23% 23% 8%
ZI. Percentage drying off with no mastitis cases+ 80% 73% - 87% 87% 14%
ZG. Mastitis rate (cases/100 cows in milk/year)+ 32 20 - 48 20 28
ZK. Cows with Index mastitis case by Day 30+ 6% 3% - 8% 3% 5%
ZL. Index mastitis rate after Day 30+ 20% 12% - 28% 12% 16%
(*) HIGH SCC is a milk sample with >=200,000 cells/ml milk;
LOW SCC is a milk sample with below 200,000 cells/ml milk
(**) CHRONIC / NEW / FIRST and REPEAT are the Herd Companion categories describing high SCC
cows. See Appendix 2 for definitions.
(***) Dry period protection (High:Low): The percentage of cows finishing a lactation with a HIGH SCC
sample that starts the new lactation with a LOW SCC sample;
Dry Period Cure (Low:Low): The percentage of cows finishing a lactation with a LOW SCC sample
that starts the new lactation with a LOW SCC sample.
(****) Threshold Index: The total cows changing from Low to High SCC divided by the total cows changing
from High to Low SCC at consecutive milk recordings.
(1) The median is the middle value (so 250 herds were better and 250 were worse than this value).
(2) The first quartile (25% value) and third quartile (75% value) describe the lower and upper
limits of performance achieved by the middle 50% of herds. 25%, or one in four, herds achieve
“better” and 25% “worse” than the limits for that parameter. (3) The Target is set at the level achieved by the “best” 25% of herds. One in four of the 500 herds in the
sample achieved this level or better.
(4) The inter-quartile range encompasses half the study herds. It is the difference in performance between a
herd achieving the target (best 25% value) and a herd at the worst quartile (75% value). + The mastitis parameters are derived from a group of 262 herds (within the 500 herds in the study)
where mastitis rate >5 cases per 100 cows in milk / year.

8
A. Culling/death rate: The % of cows that left the herd (culled/sold/died) in the last 12 months.
Target (top ¼ of herds’ level): 21%
Median: 26%
75% level: 32%
Inter-quartile range: 11%
B. Percentage of cows/heifers calving during the last 12 months that were culled / died during
the first 100 days after calving. A possible indicator of “involuntary culling”.
Target (top ¼ of herds’ level): 3%
Median: 5%
75% level: 7%
Inter-quartile range: 4%
“Target”
≤ 21%
“Worst ¼ of the herds”
>32%
“Target”
≤ 3%
“Worst ¼ of the herds”
>7%

9
C. Average Age (in years) at exit: The average age of cows leaving the herd in the last 12 months
at the time of exit. A potential measure of longevity.
Target (top ¼ of herds’ level): 6.7
Median: 6.0
75% level: 5.5
Inter-quartile range: 1.2
D. Average Age at exit by lactations: The average lactation number of cows leaving the herd in
the last 12 months. A potential measure of longevity.
Target (top ¼ of herds’ level): 4.0
Median: 3.6
75% level: 3.1
Inter-quartile range: 0.9
“Worst ¼ of the herds”
< 5.5
“Target”
> 6.7
“Target”
> 4.0 “Worst ¼ of the herds”
< 3.1

10
E. Served by day 80: The percentage of calving cows served at least once within 80 days of
calving.
Target (top ¼ of herds’ level): 70%
Median: 60%
75% level: 47%
Inter-quartile range: 23%
F. Percentage conceived 100 days after calving: The percentage of calving cows that had
conceived within 100 days of calving.
Target (top ¼ of herds’ level): 41%
Median: 35%
75% level: 25%
Inter-quartile range: 16%
“Worst ¼ of the herds”
< 25%
“Worst ¼ of the herds”
< 47%
“Target”
> 70%
“Target”
> 41%

11
G. Calving to 1st service interval: The average number of days between calving and 1st service.
Target (top ¼ of herds’ level): 69
Median: 81
75% level: 95
Inter-quartile range: 26
H. Calving interval: The average interval between consecutive calvings (in days).
Target (top ¼ of herds’ level): 389
Median: 402
75% level: 419
Inter-quartile range: 30
“Target”
< 389
“Worst ¼ of the herds”
> 419
“Target”
< 69
“Worst ¼ of the herds”
> 95
12
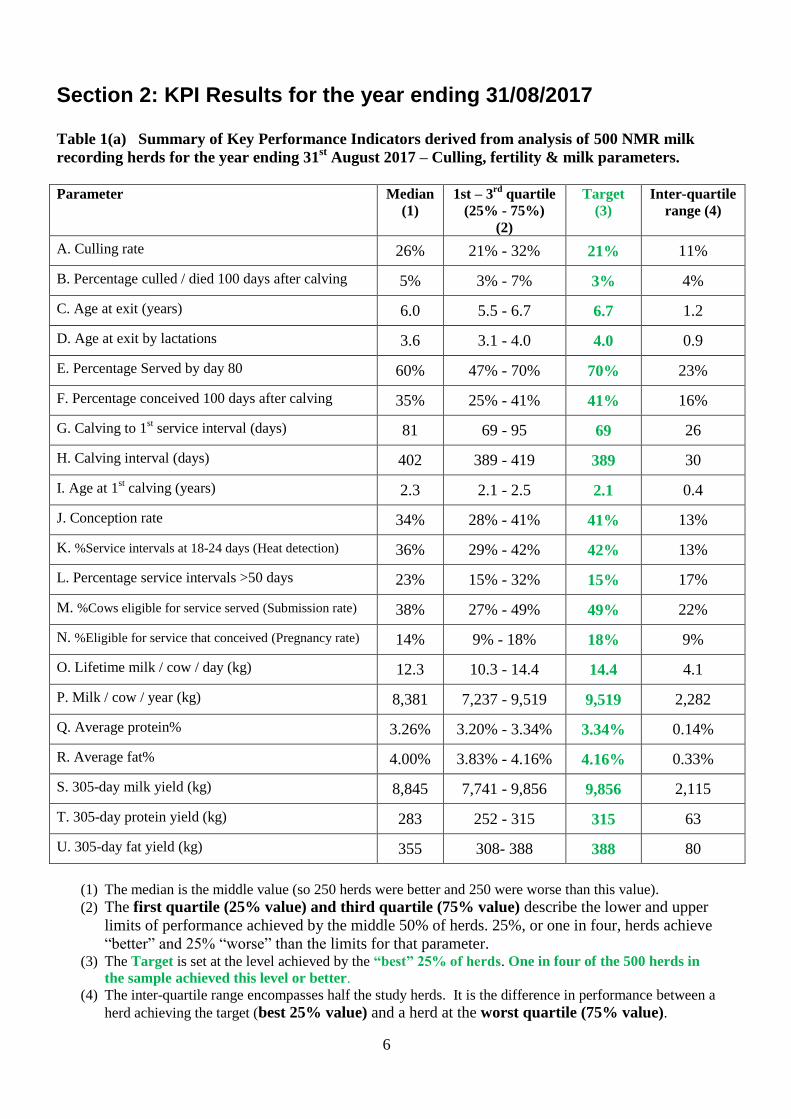
I. Age at 1st calving: The average age (in years) of heifers calving down over the last year.
Target (top ¼ of herds’ level): 2.1
Median: 2.3
75% level: 2.5
Inter-quartile range: 0.4
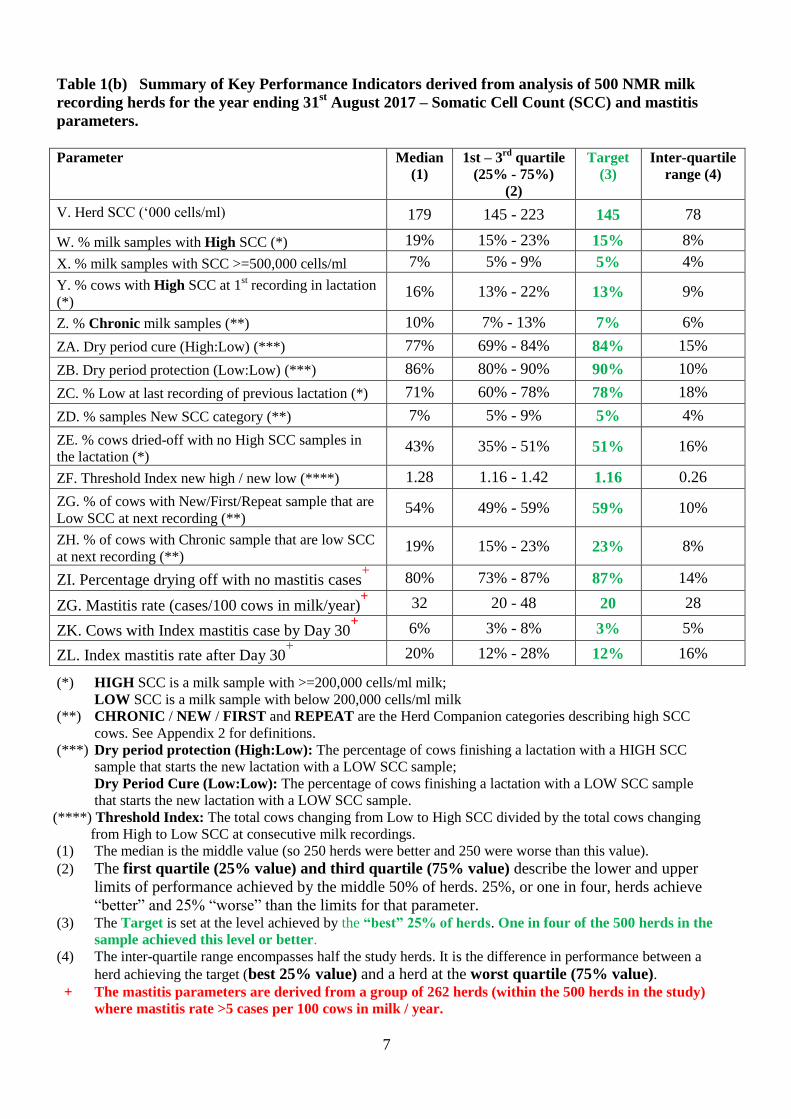
J. Conception rate: The average conception rate for all services in the last 12 months.
Target (top ¼ of herds’ level): 41%
Median: 34%
75% level: 28%
Inter-quartile range: 13%
“Worst ¼ of the herds”
> 2.5
“Target”
> 41%
“Target”
< 2.1
“Worst ¼ of the herds”
< 28%

13
K. Percentage service intervals at 18-24 days (Heat detection): The % of all repeat services
occurring 18-24 days (one oestrus cycle) after the previous service.
Target (top ¼ of herds’ level): 42%
Median: 36%
75% level: 29%
Inter-quartile range: 13%
L. Percentage service intervals >50 days: The % of all repeat services with an interval of over 50
days since the previous service. A potential indicator of poor heat detection.
Target (top ¼ of herds’ level): 15%
Median: 23%
75% level: 32%
Inter-quartile range: 17%
“Target”
< 15%
“Worst ¼ of the herds”
> 32%
“Target”
> 42% “Worst ¼ of the herds”
< 29%
14
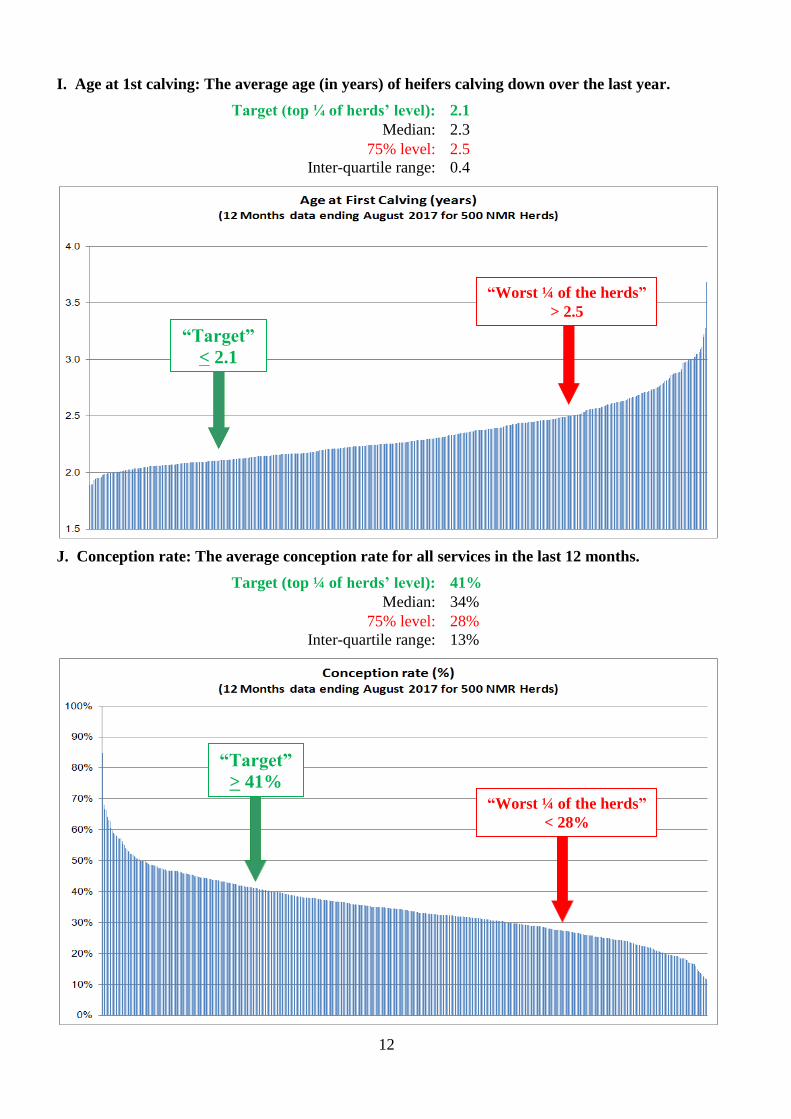
M. Percentage of cows eligible for service that were served (Submission rate): The percentage of
cows eligible for service (>42 days calved, not barren, not pregnant) that were served.
Target (top ¼ of herds’ level): 49%
Median: 38%
75% level: 27%
Inter-quartile range: 22%
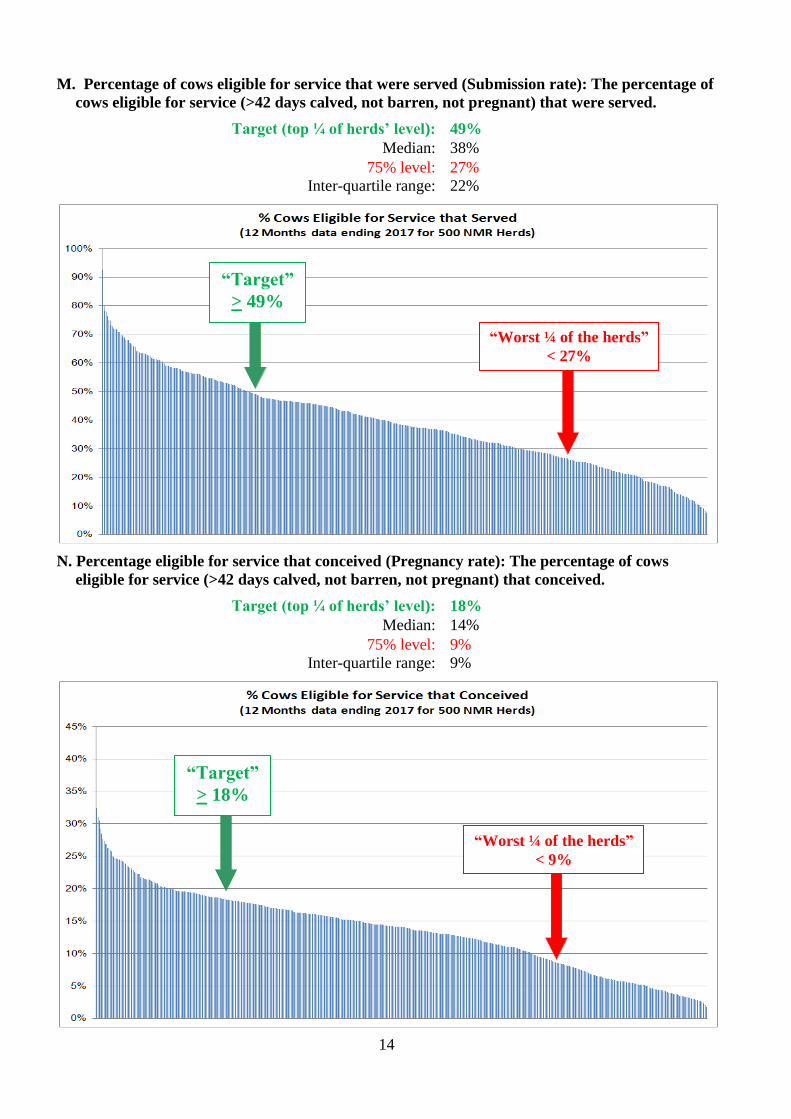
N. Percentage eligible for service that conceived (Pregnancy rate): The percentage of cows
eligible for service (>42 days calved, not barren, not pregnant) that conceived.
Target (top ¼ of herds’ level): 18%
Median: 14%
75% level: 9%
Inter-quartile range: 9%
“Worst ¼ of the herds”
< 27%
“Target”
> 18%
“Target”
> 49%
“Worst ¼ of the herds”
< 9%

15
O. Lifetime milk / cow / day (kg): Equates to the average daily milk yield of cows across their
whole lifetime (including unproductive periods: time as a heifer, dry period).
Target (top ¼ of herds’ level): 14.4
Median: 12.3
75% level: 10.3
Inter-quartile range: 4.1
P. Milk / cow / year (kg): The average annual milk yield of all cows in the year. Total milk
divided by the average cow population. A measure of milk yield per cow place in the herd.
Target (top ¼ of herds’ level): 9,519
Median: 8,381
75% level: 7,237
Inter-quartile range: 2,282
“Target”
> 9,519
“Target”
> 14.4
“Worst ¼ of the herds”
< 7,237
“Worst ¼ of the herds”
< 10.3

16
Q. Average protein%: The average % protein of all milk samples taken over the year.
Target (top ¼ of herds’ level): 3.34%
Median: 3.26%
75% level: 3.20%
Inter-quartile range: 0.14%
R. Average fat%: The average % fat of all milk samples taken over the year.
Target (top ¼ of herds’ level): 4.16%
Median: 4.00%
75% level: 3.83%
Inter-quartile range: 0.33%
“Target”
> 3.34% “Worst ¼ of the herds”
< 3.20%
“Target”
> 4.16% “Worst ¼ of the herds”
< 3.83%

17
S. 305 day yield (kg): The average yield of cows by day 305 of the lactation.
Target (top ¼ of herds’ level): 9,856
Median: 8,845
75% level: 7,741
Inter-quartile range: 2,115
T. 305 day protein (kg): The average milk protein yield of cows by day 305 of the lactation.
Target (top ¼ of herds’ level): 315
Median: 283
75% level: 252
Inter-quartile range: 63
“Target”
> 9,856 “Worst ¼ of the herds”
< 7,741
“Target”
> 315 “Worst ¼ of the herds”
< 252
18
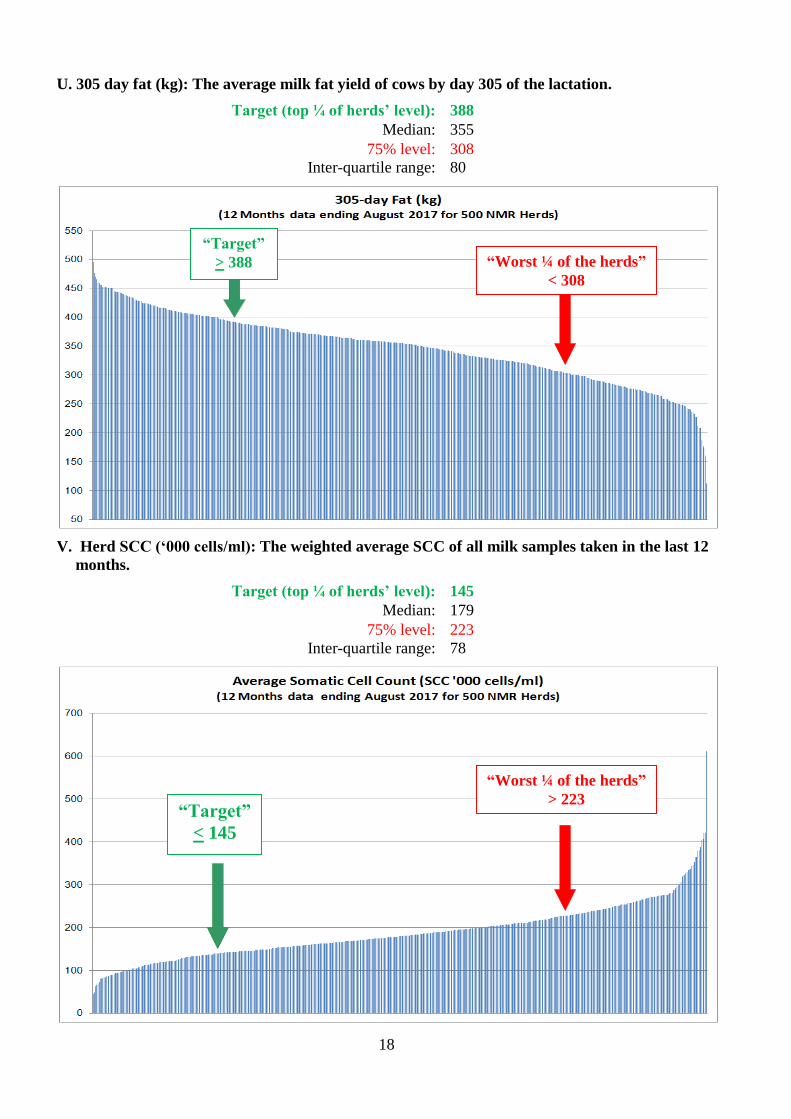
U. 305 day fat (kg): The average milk fat yield of cows by day 305 of the lactation.
Target (top ¼ of herds’ level): 388
Median: 355
75% level: 308
Inter-quartile range: 80
V. Herd SCC (‘000 cells/ml): The weighted average SCC of all milk samples taken in the last 12
months.
Target (top ¼ of herds’ level): 145
Median: 179
75% level: 223
Inter-quartile range: 78
“Target”
> 388 “Worst ¼ of the herds”
< 308
“Target”
< 145
“Worst ¼ of the herds”
> 223

19
W. Percentage of milk samples with high SCC: The % of milk samples in the last 12 months
with a SCC over 200,000 cells/ml of milk. Indicates the size of any reservoir of infection.
Target (top ¼ of herds’ level): 15%
Median: 19%
75% level: 23%
Inter-quartile range: 8%
X. Percentage of milk samples with SCC >=500,000 cells/ml: The % of milk samples taken in the
last 12 months with a SCC over 500,000 cells/ml of milk.
Target (top ¼ of herds’ level): 5%
Median: 7%
75% level: 9%
Inter-quartile range: 4%
“Target”
< 15%
“Worst ¼ of the herds”
> 9%
“Worst ¼ of the herds”
> 23%
“Target”
< 5%

20
Y. Percentage 1st recording SCC >=200,000 cells/ml: The % of new lactations in the last year
starting with a high SCC (>=200,000 cells) at the first milk recording.
Target (top ¼ of herds’ level): 13%
Median: 16%
75% level: 22%
Inter-quartile range: 9%
Z. Percentage chronic SCC >=200,000 cells/ml: The % of all milk samples taken over the last 12
months that were from CHRONIC cows (cows whose milk was over 200,000 cells at both the
CURRENT AND PREVIOUS milk recordings).
Target (top ¼ of herds’ level): 7%
Median: 10%
75% level: 13%
Inter-quartile range: 6%
“Target”
< 13%
“Worst ¼ of the herds”
> 22%
“Target”
< 7%
“Worst ¼ of the herds”
> 13%
21
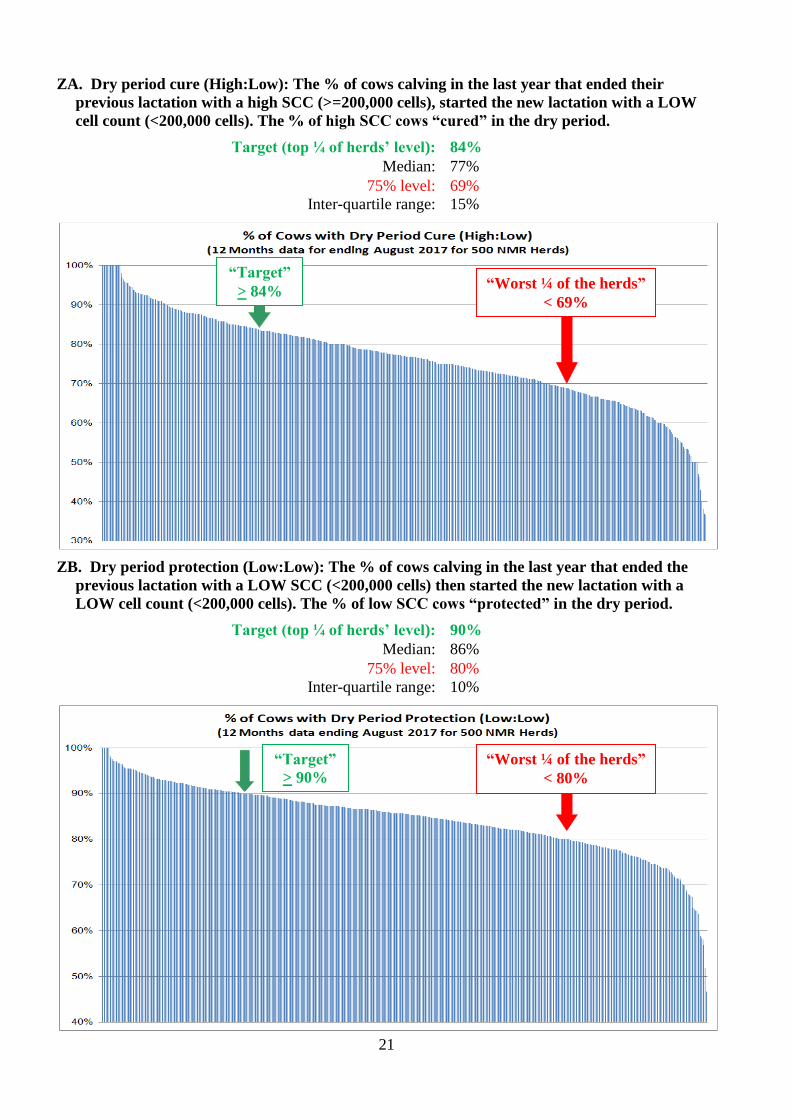
ZA. Dry period cure (High:Low): The % of cows calving in the last year that ended their
previous lactation with a high SCC (>=200,000 cells), started the new lactation with a LOW
cell count (<200,000 cells). The % of high SCC cows “cured” in the dry period.
Target (top ¼ of herds’ level): 84%
Median: 77%
75% level: 69%
Inter-quartile range: 15%
ZB. Dry period protection (Low:Low): The % of cows calving in the last year that ended the
previous lactation with a LOW SCC (<200,000 cells) then started the new lactation with a
LOW cell count (<200,000 cells). The % of low SCC cows “protected” in the dry period.
Target (top ¼ of herds’ level): 90%
Median: 86%
75% level: 80%
Inter-quartile range: 10%
“Target”
> 84% “Worst ¼ of the herds”
< 69%
“Target”
> 90%
“Worst ¼ of the herds”
< 80%

22
ZC. Percentage Low at the end of previous lactation: The % of cows calving in the last year that
ended their previous lactation with a LOW SCC (<200,000 cells).
Target (top ¼ of herds’ level): 78%
Median: 71%
75% level: 60%
Inter-quartile range: 18%
ZD. The percentage of NEW SCC milk samples: Of all milk samples the % that were of the
NEW Herd Companion SCC Category (the first HIGH SCC (>=200,000cells/ml) in a lactation
following one or more low SCC samples).
Target (top ¼ of herds’ level): 5%
Median: 7%
75% level: 9%
Inter-quartile range: 4%
“Target”
> 78% “Worst ¼ of the herds”
< 60%
“Target”
< 5%
“Worst ¼ of the herds”
> 9%
23
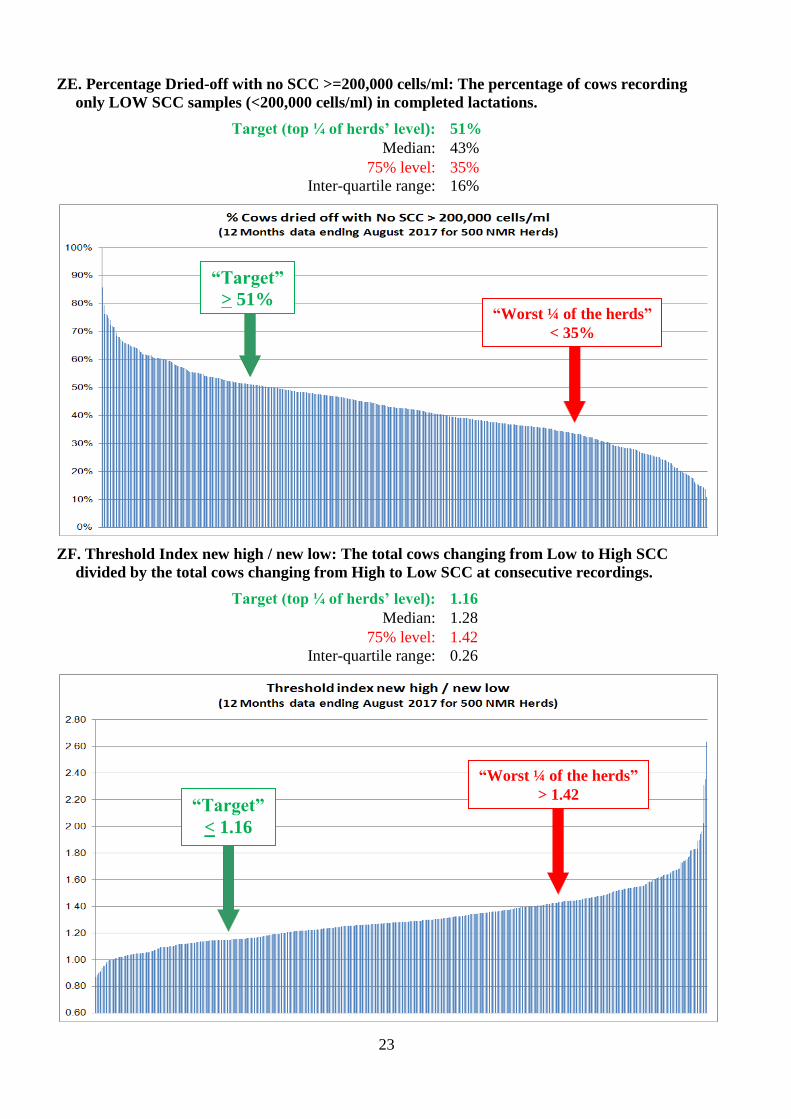
ZE. Percentage Dried-off with no SCC >=200,000 cells/ml: The percentage of cows recording
only LOW SCC samples (<200,000 cells/ml) in completed lactations.
Target (top ¼ of herds’ level): 51%
Median: 43%
75% level: 35%
Inter-quartile range: 16%
ZF. Threshold Index new high / new low: The total cows changing from Low to High SCC
divided by the total cows changing from High to Low SCC at consecutive recordings.
Target (top ¼ of herds’ level): 1.16
Median: 1.28
75% level: 1.42
Inter-quartile range: 0.26
“Target”
> 51% “Worst ¼ of the herds”
< 35%
“Target”
< 1.16
“Worst ¼ of the herds”
> 1.42

24
ZG. Recovery percentage of New/First/Repeat infections: Of HIGH SCC cows
(>=200,000cells/ml) that at the previous recording were either low SCC or not yet in milk, the
percentage that were LOW SCC (<200,000 cells/ml) at the following recording.
Target (top ¼ of herds’ level): 59%
Median: 54%
75% level: 49%
Inter-quartile range: 10%
ZH. Recovery percentage of chronic infections: Of cows with two or more consecutive HIGH
SCC recordings (>=200,000 cells/ml), the percentage that recorded a LOW SCC (<200,000
cells/ml) at the following recording.
Target (top ¼ of herds’ level): 23%
Median: 19%
75% level: 15%
Inter-quartile range: 8%
“Target”
> 59% “Worst ¼ of the herds”
< 49%
“Target”
> 23%
“Target”
> 23% “Worst ¼ of the herds”
< 15%

25
ZJ. Mastitis rate: Number of clinical mastitis cases per 100 cows in milk in the herd over a year.
Target (top ¼ of herds’ level): 20
Median: 32
75% level: 48
Inter-quartile range: 28
“Target”
< 20
“Worst ¼ of the herds”
> 48
26
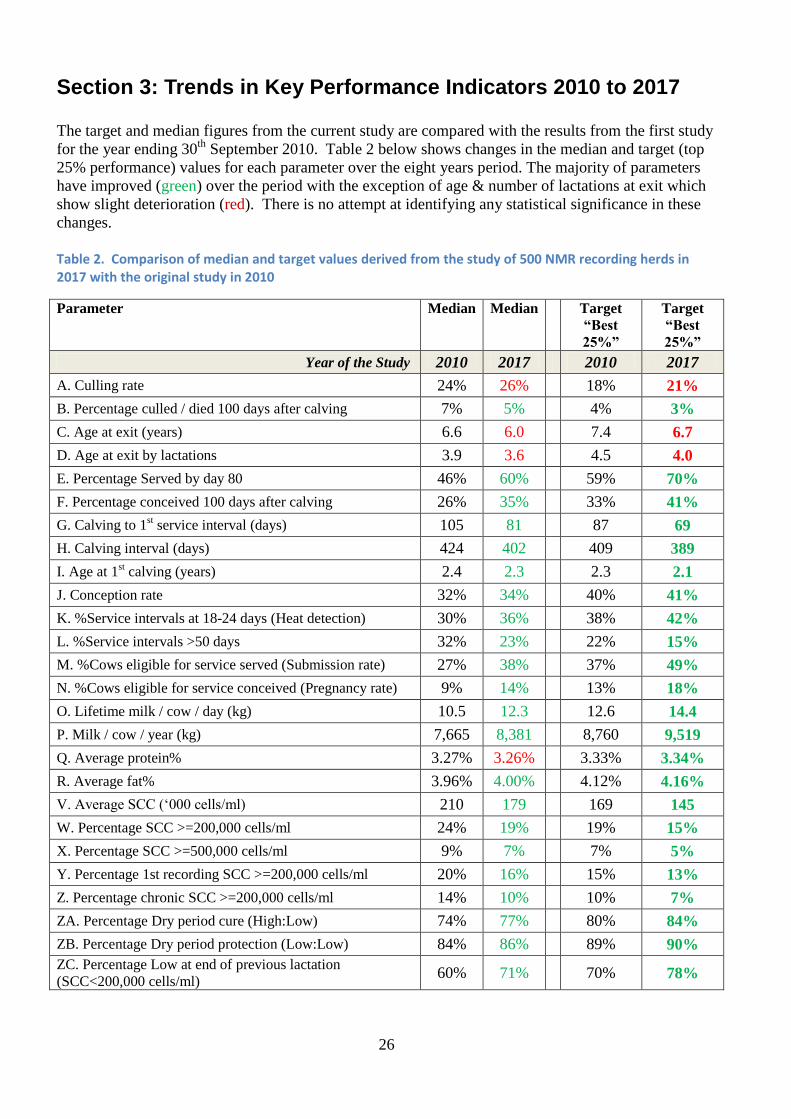
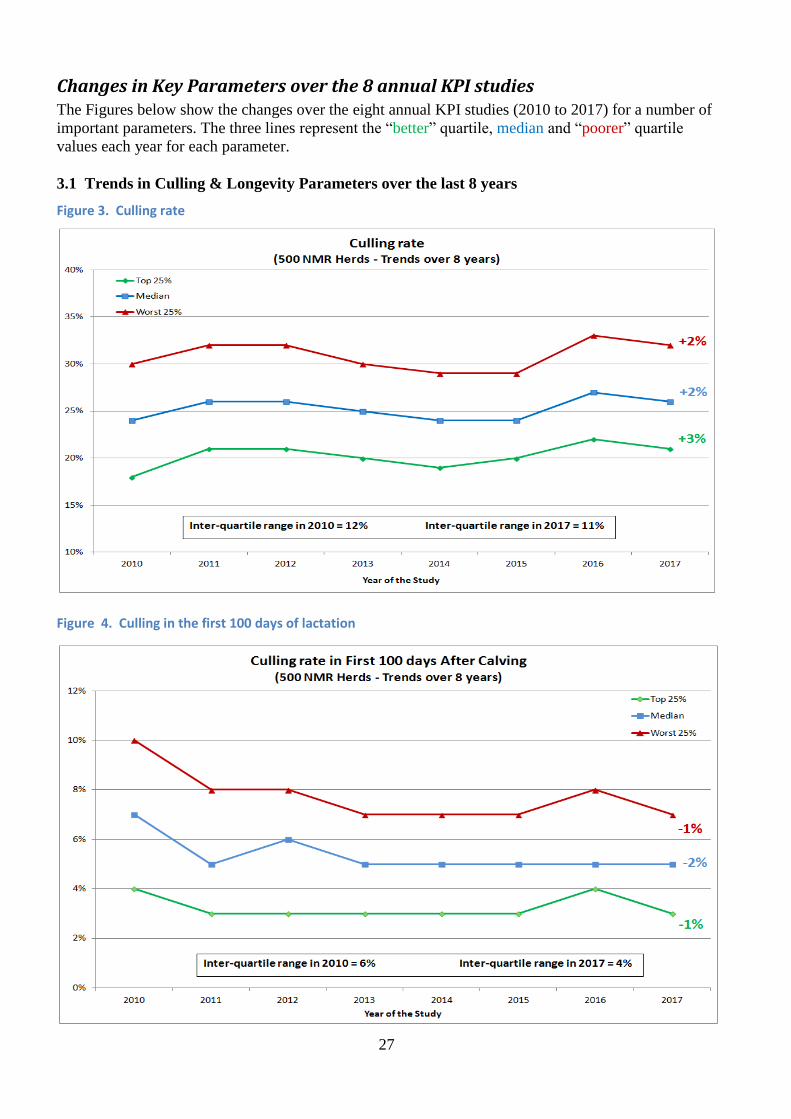
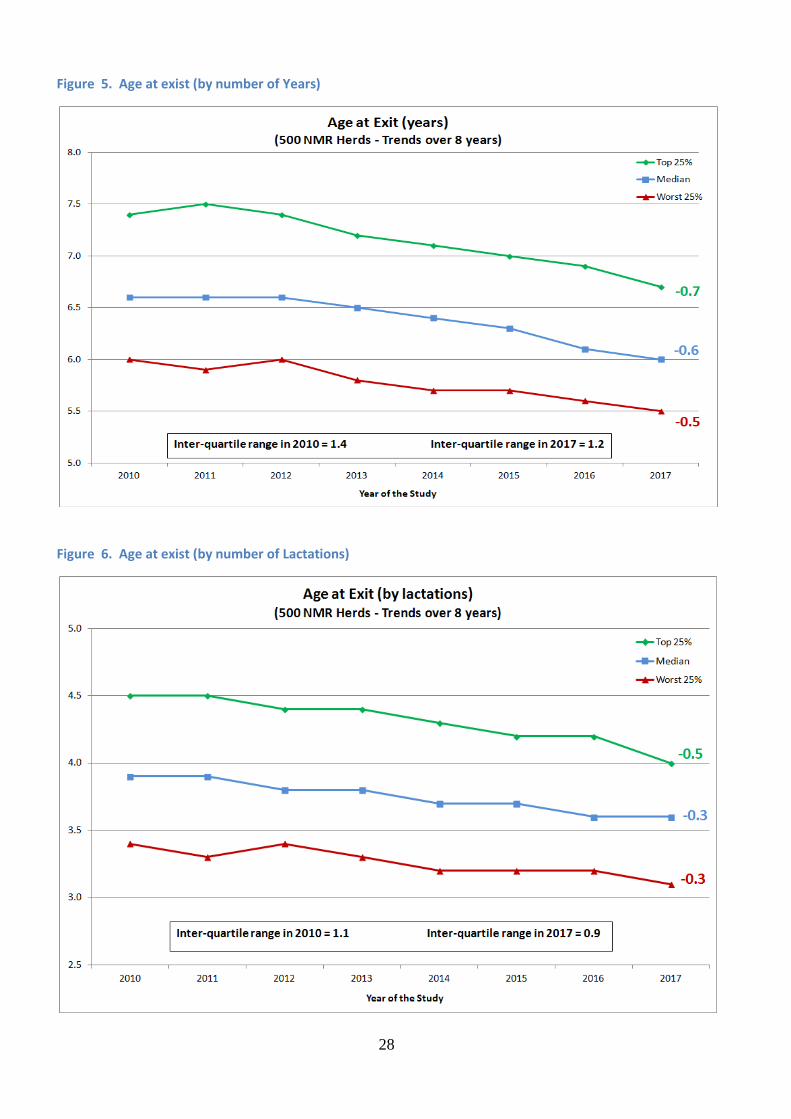
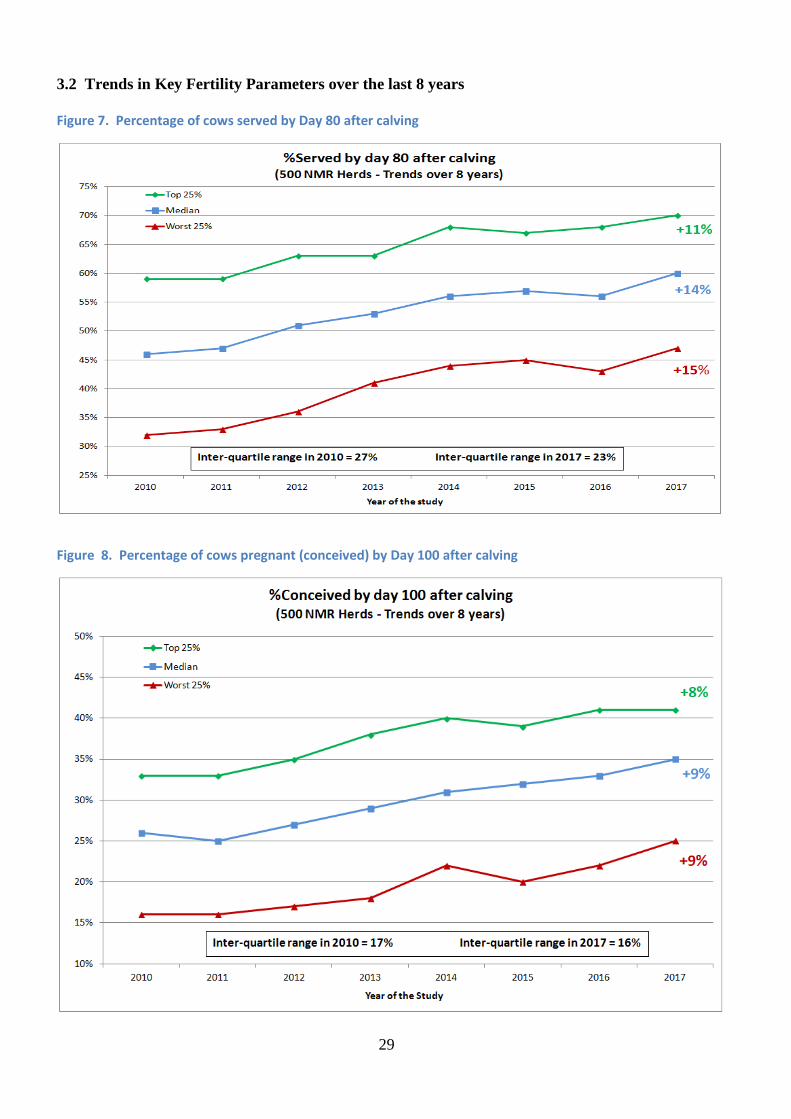
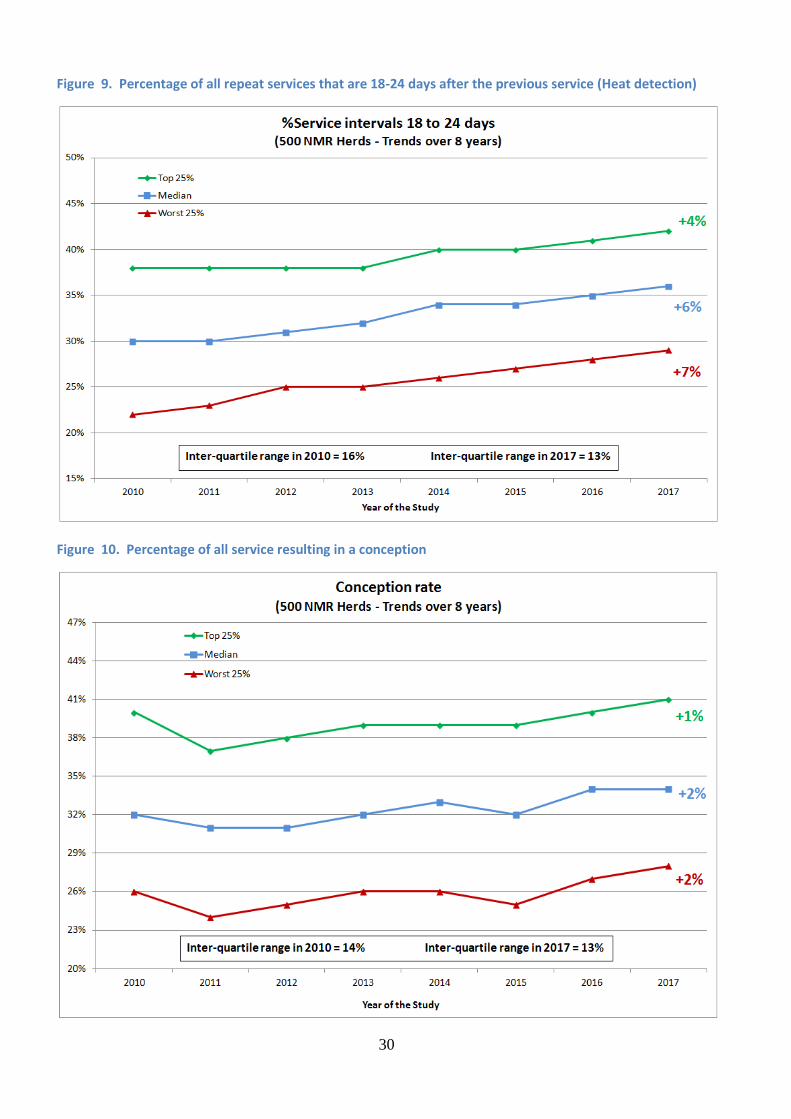
Section 3: Trends in Key Performance Indicators 2010 to 2017
The target and median figures from the current study are compared with the results from the first study
for the year ending 30th
September 2010. Table 2 below shows changes in the median and target (top
25% performance) values for each parameter over the eight years period. The majority of parameters
have improved (green) over the period with the exception of age & number of lactations at exit which
show slight deterioration (red). There is no attempt at identifying any statistical significance in these
changes.
Table 2. Comparison of median and target values derived from the study of 500 NMR recording herds in 2017 with the original study in 2010
Parameter Median Median Target
“Best
25%”
Target
“Best
25%”
Year of the Study 2010 2017 2010 2017
A. Culling rate 24% 26% 18% 21%
B. Percentage culled / died 100 days after calving 7% 5% 4% 3%
C. Age at exit (years) 6.6 6.0 7.4 6.7
D. Age at exit by lactations 3.9 3.6 4.5 4.0
E. Percentage Served by day 80 46% 60% 59% 70%
F. Percentage conceived 100 days after calving 26% 35% 33% 41%
G. Calving to 1st service interval (days) 105 81 87 69
H. Calving interval (days) 424 402 409 389
I. Age at 1st calving (years) 2.4 2.3 2.3 2.1
J. Conception rate 32% 34% 40% 41%
K. %Service intervals at 18-24 days (Heat detection) 30% 36% 38% 42%
L. %Service intervals >50 days 32% 23% 22% 15%
M. %Cows eligible for service served (Submission rate) 27% 38% 37% 49%
N. %Cows eligible for service conceived (Pregnancy rate) 9% 14% 13% 18%
O. Lifetime milk / cow / day (kg) 10.5 12.3 12.6 14.4
P. Milk / cow / year (kg) 7,665 8,381 8,760 9,519
Q. Average protein% 3.27% 3.26% 3.33% 3.34%
R. Average fat% 3.96% 4.00% 4.12% 4.16%
V. Average SCC (‘000 cells/ml) 210 179 169 145
W. Percentage SCC >=200,000 cells/ml 24% 19% 19% 15%
X. Percentage SCC >=500,000 cells/ml 9% 7% 7% 5%
Y. Percentage 1st recording SCC >=200,000 cells/ml 20% 16% 15% 13%
Z. Percentage chronic SCC >=200,000 cells/ml 14% 10% 10% 7%
ZA. Percentage Dry period cure (High:Low) 74% 77% 80% 84%
ZB. Percentage Dry period protection (Low:Low) 84% 86% 89% 90%
ZC. Percentage Low at end of previous lactation
(SCC<200,000 cells/ml) 60% 71% 70% 78%
27
Changes in Key Parameters over the 8 annual KPI studies The Figures below show the changes over the eight annual KPI studies (2010 to 2017) for a number of
important parameters. The three lines represent the “better” quartile, median and “poorer” quartile
values each year for each parameter.
3.1 Trends in Culling & Longevity Parameters over the last 8 years
Figure 3. Culling rate
Figure 4. Culling in the first 100 days of lactation
28
Figure 5. Age at exist (by number of Years)
Figure 6. Age at exist (by number of Lactations)
29
3.2 Trends in Key Fertility Parameters over the last 8 years
Figure 7. Percentage of cows served by Day 80 after calving
Figure 8. Percentage of cows pregnant (conceived) by Day 100 after calving
30
Figure 9. Percentage of all repeat services that are 18-24 days after the previous service (Heat detection)
Figure 10. Percentage of all service resulting in a conception
31
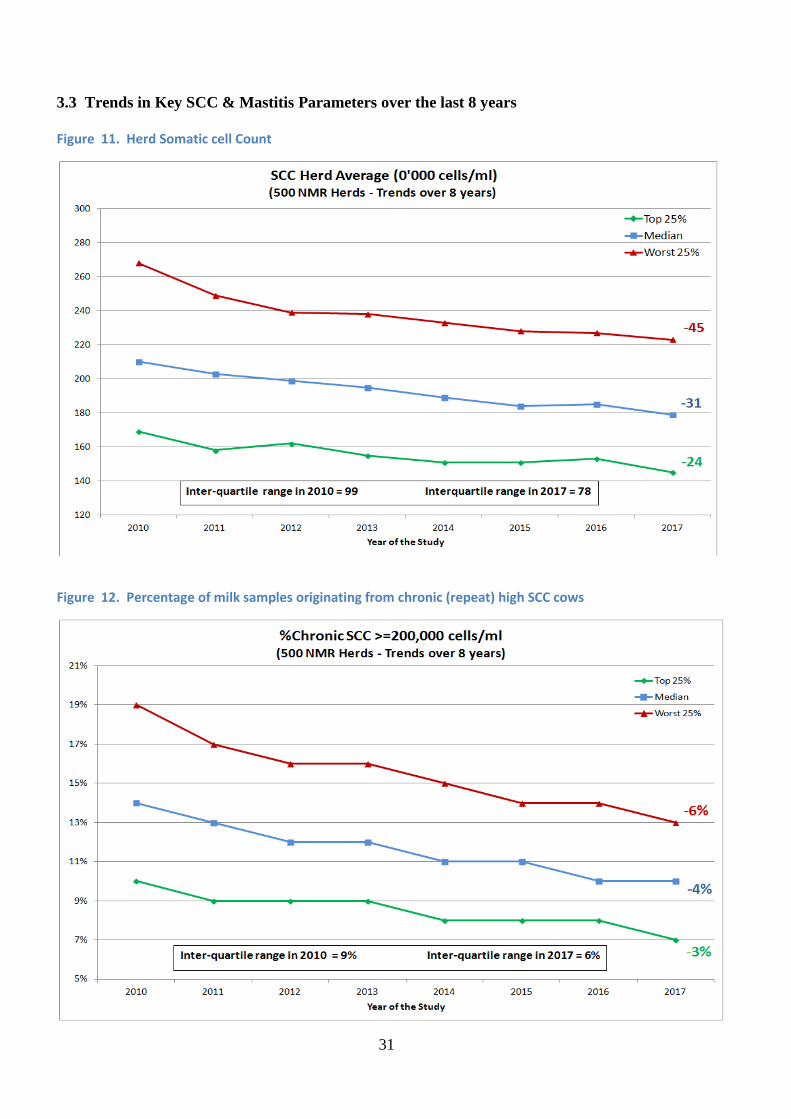
3.3 Trends in Key SCC & Mastitis Parameters over the last 8 years
Figure 11. Herd Somatic cell Count
Figure 12. Percentage of milk samples originating from chronic (repeat) high SCC cows

32
Figure 13. Mastitis rate (cases / 100 cows in milk / year)

33
Section 4. The Practical Use of Key Performance Indicators By Farmers And Their Technical Advisers
The figures obtained from this study can be treated as “national standards” for UK 'black and white'
dairy herds in 2017, with target values set at the level currently achieved on one in four of the 500
farms in the survey. A farmer can readily see where his/her herd would perform for each parameter
relative to the 500 herds. This can be used to focus discussion on the causes and options/need for
improvement.
The Key Performance Indicators Report in the InterHerd+ program provides an overview of
performance for an individual herd. Parameters are calculated in an identical way so are directly
comparable to the herds in the study. Comparing the performance of the herd with the results of the
study highlights areas of strength and weakness in that herd’s performance (Figure 14).
The combination of parameters relating to production, fertility and health, emphasizes the dynamic
nature of dairy production and the need for high standards across all areas of herd management. Many
herds are excellent in one area of production, fertility or health but seldom in all. There is always room
for improvement in efficiency.
Figure 14. The Key Performance Indicator Report of InterHerd+
Better than
target (top
25%
nationally)
Lowest
25%
nationally
34
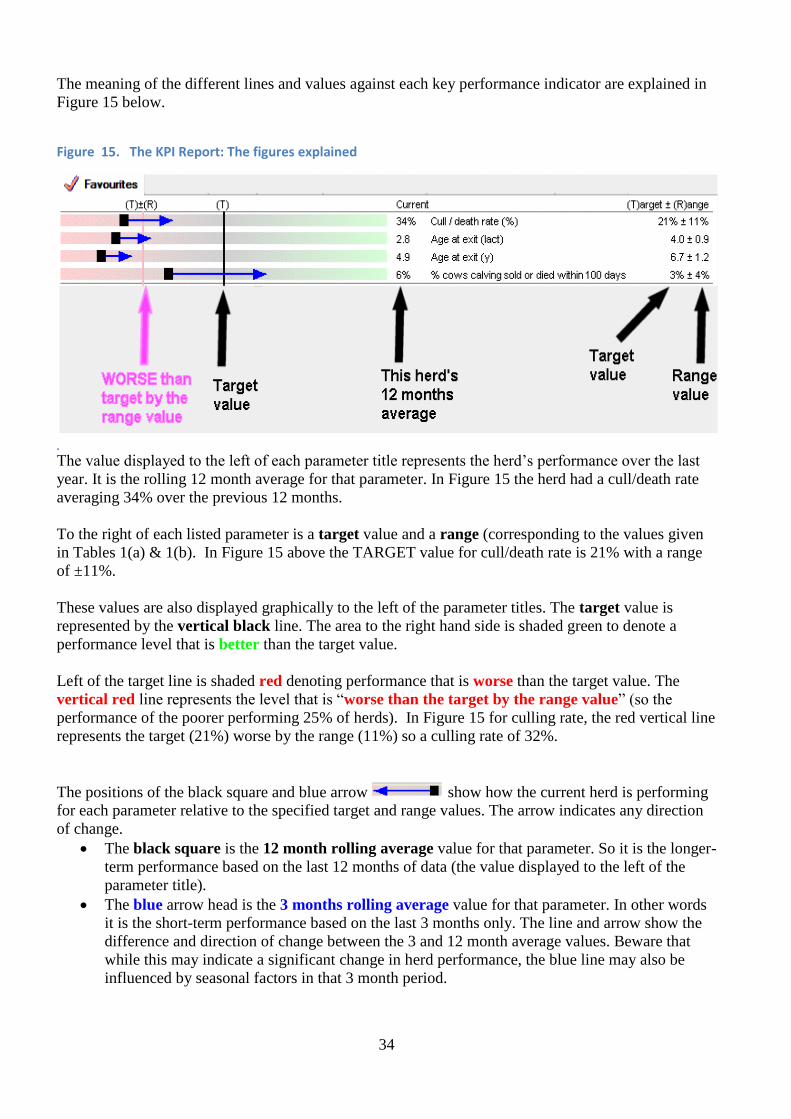
The meaning of the different lines and values against each key performance indicator are explained in
Figure 15 below.
Figure 15. The KPI Report: The figures explained
The value displayed to the left of each parameter title represents the herd’s performance over the last
year. It is the rolling 12 month average for that parameter. In Figure 15 the herd had a cull/death rate
averaging 34% over the previous 12 months.
To the right of each listed parameter is a target value and a range (corresponding to the values given
in Tables 1(a) & 1(b). In Figure 15 above the TARGET value for cull/death rate is 21% with a range
of ±11%.
These values are also displayed graphically to the left of the parameter titles. The target value is
represented by the vertical black line. The area to the right hand side is shaded green to denote a
performance level that is better than the target value.
Left of the target line is shaded red denoting performance that is worse than the target value. The
vertical red line represents the level that is “worse than the target by the range value” (so the
performance of the poorer performing 25% of herds). In Figure 15 for culling rate, the red vertical line
represents the target (21%) worse by the range (11%) so a culling rate of 32%.
The positions of the black square and blue arrow show how the current herd is performing
for each parameter relative to the specified target and range values. The arrow indicates any direction
of change.
The black square is the 12 month rolling average value for that parameter. So it is the longer-
term performance based on the last 12 months of data (the value displayed to the left of the
parameter title).
The blue arrow head is the 3 months rolling average value for that parameter. In other words
it is the short-term performance based on the last 3 months only. The line and arrow show the
difference and direction of change between the 3 and 12 month average values. Beware that
while this may indicate a significant change in herd performance, the blue line may also be
influenced by seasonal factors in that 3 month period.

35
Using the target and range values to highlight a herd’s strengths & weaknesses
Herd strengths: This study identifies the level achieved by the best 25% of the herds for each
parameter. That value is then set as the “TARGET” for comparison with other herds. In Figure 16, any
KPI with a black square to the right (green side) of the vertical black target line is “in the best
25%” when compared to the 500 study herds. In Figure 16, the herd displayed has 8 parameters that
are “better than target” so this herd would currently be in the top 25% of herds nationally for those
parameters. This mainly includes several fertility & milk yield parameters.
Herd weaknesses: The vertical red line represents the performance achieved or bettered by 75% of
the 500 herds (the target, worse by the range). Any parameter with a black square to the left of the
vertical red line would be “in the bottom 25%” for that parameter when compared to the 500 study
herds. There are 9 parameters highlighted in Figure 16, including culling, conception rate, protein &
fat%, in addition to average SCC, so this herd would currently appear in the bottom 25% of herds for
those parameters.
Average performance levels: Parameters that fall between the vertical black and red lines are within
the inter-quartile range (so the middle 50% of herds) when compared with the 500 study herds.
Figure 16. Highlighting the strengths and weaknesses of a dairy herd

36
Figure 16 must be treated as a DISCUSSION DOCUMENT. The emphasis is on achieving an
appropriate balance of performance in production, fertility and health. A parameter in the bottom 25%
is not necessarily a bad thing, the herd in Figure 16, for example, has low protein% value for milk but
as it is a high yielding herd the 305-day yield of protein would put the herd in the top 25%.
Conversely, although in this herd most fertility parameters are in the “top 25%” performance, the
conception rate is in the lowest 25%” performance level. The reason the conception is poor clearly
needs investigation.
The aim is to stimulate informed discussion between farmers and their advisers about what is
happening and WHY.
Monitoring performance and improvement of groups of herds In addition to measuring individual herds, advisers and milk buyers are increasingly making use of the
500 herd graphs to monitor the status and improvement of their clients/members over time. Figure 17
shows the distribution of the heat detection rate of 26 client herds of Drove Farm Vets in Swindon,
superimposed on the graph for the same parameter across the 500 herds. Each client herd is
represented by a red vertical line. In this example it can be seen that 12 of the client herds are located
in the best 25 % of herds in the 500 herd national study. So 12 of 26 herds (46% of the clients) have a
performance level that puts them in the best quartile nationally. Figure 17. Heat detection (of returns to service) of 26 client herds compared to the 500 herds study of 2016.
37
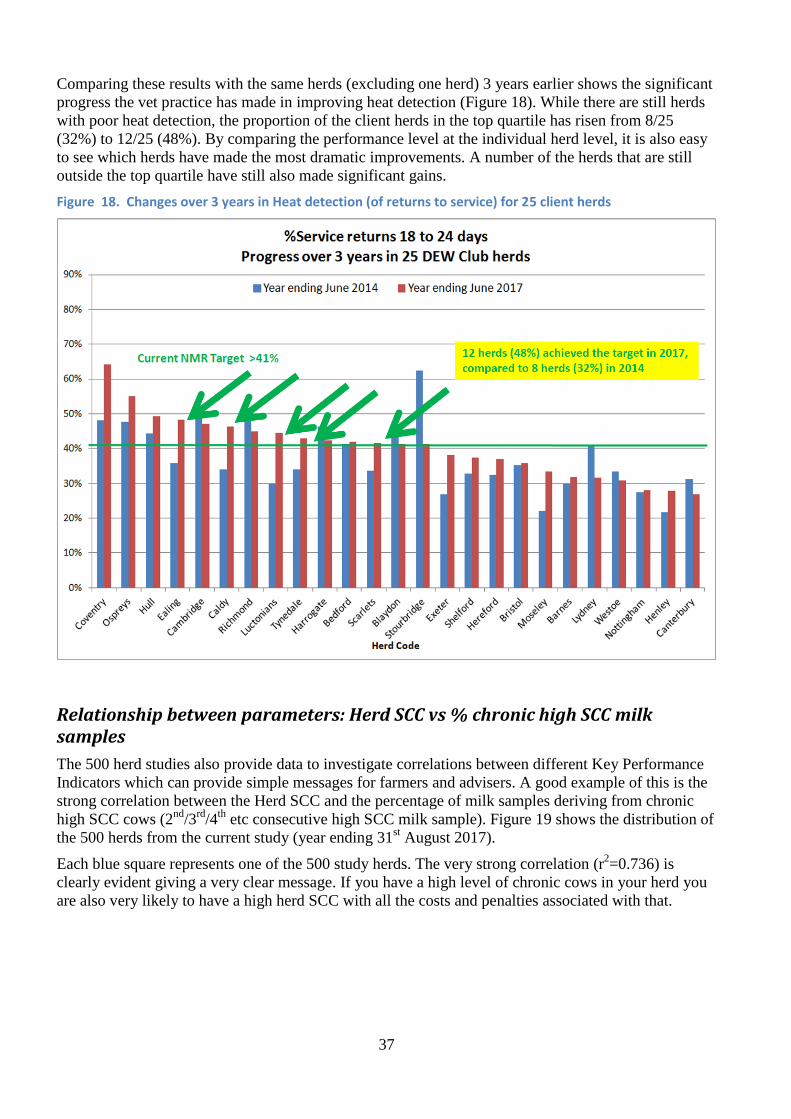
Comparing these results with the same herds (excluding one herd) 3 years earlier shows the significant
progress the vet practice has made in improving heat detection (Figure 18). While there are still herds
with poor heat detection, the proportion of the client herds in the top quartile has risen from 8/25
(32%) to 12/25 (48%). By comparing the performance level at the individual herd level, it is also easy
to see which herds have made the most dramatic improvements. A number of the herds that are still
outside the top quartile have still also made significant gains.
Figure 18. Changes over 3 years in Heat detection (of returns to service) for 25 client herds
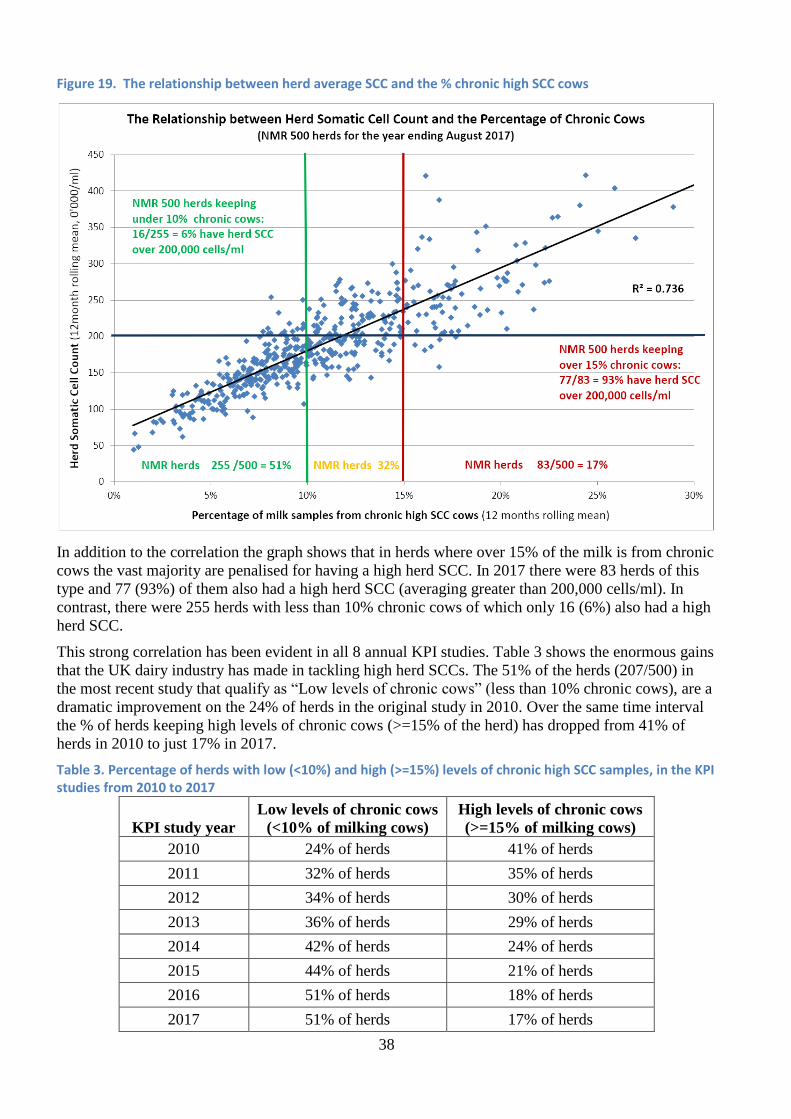
Relationship between parameters: Herd SCC vs % chronic high SCC milk samples
The 500 herd studies also provide data to investigate correlations between different Key Performance
Indicators which can provide simple messages for farmers and advisers. A good example of this is the
strong correlation between the Herd SCC and the percentage of milk samples deriving from chronic
high SCC cows (2nd
/3rd
/4th
etc consecutive high SCC milk sample). Figure 19 shows the distribution of
the 500 herds from the current study (year ending 31st August 2017).
Each blue square represents one of the 500 study herds. The very strong correlation (r2=0.736) is
clearly evident giving a very clear message. If you have a high level of chronic cows in your herd you
are also very likely to have a high herd SCC with all the costs and penalties associated with that.
38
Figure 19. The relationship between herd average SCC and the % chronic high SCC cows
In addition to the correlation the graph shows that in herds where over 15% of the milk is from chronic
cows the vast majority are penalised for having a high herd SCC. In 2017 there were 83 herds of this
type and 77 (93%) of them also had a high herd SCC (averaging greater than 200,000 cells/ml). In
contrast, there were 255 herds with less than 10% chronic cows of which only 16 (6%) also had a high
herd SCC.
This strong correlation has been evident in all 8 annual KPI studies. Table 3 shows the enormous gains
that the UK dairy industry has made in tackling high herd SCCs. The 51% of the herds (207/500) in
the most recent study that qualify as “Low levels of chronic cows” (less than 10% chronic cows), are a
dramatic improvement on the 24% of herds in the original study in 2010. Over the same time interval
the % of herds keeping high levels of chronic cows (>=15% of the herd) has dropped from 41% of
herds in 2010 to just 17% in 2017.
Table 3. Percentage of herds with low (<10%) and high (>=15%) levels of chronic high SCC samples, in the KPI studies from 2010 to 2017
KPI study year
Low levels of chronic cows
(<10% of milking cows)
High levels of chronic cows
(>=15% of milking cows)
2010 24% of herds 41% of herds
2011 32% of herds 35% of herds
2012 34% of herds 30% of herds
2013 36% of herds 29% of herds
2014 42% of herds 24% of herds
2015 44% of herds 21% of herds
2016 51% of herds 18% of herds
2017 51% of herds 17% of herds

39
In contrast to the strong correlation between herd SCC and the level of chronic cows, there is no clear
correlation between the level of mastitis incidence and the herd SCC. Figure 20 shows the poor
correlation observed in 2017.
Figure 20. The relationship between herd average SCC and mastitis incidence
40
Appendix 1. Key Performance Indicators definitions
In the following definitions the average population of cows is calculated using animal days. Every day
that animal is present in the population at risk during the period of study is a 365th
of an animal year.
The total animal days is divided by 365 to give animal years, which equates to the average population
at risk.
Parameter Description
A. Culling rate The number of cows dying or culled during the 12 month period
expressed as a percentage of the average cow population for the
same 12 month period.
B. Percentage culled / died 100
days after calving The percentage of heifers/cows calving during the 12 month
period that exit within 100 days after calving.
C. Age at exit (years) The average age (in days) of cows culled/died in the analysis
period, divided by 365.24
D. Age at exist by lactations The average number of lactations completed by cows culled/died
in the analysis period.
E. Percentage Served by day 80 The percentage of cows reaching the 80th
day after calving that
have been served at least once.
F. Percentage conceived 100
days after calving
The percentage of cows reaching 100 days after calving that have
conceived.
G. Calving to 1st service interval
(days)
The average days between calving and 1st service for all cows
served for the first time in a lactation during the analysis period.
H. Calving interval (days) The interval between calvings, in days, for all re-calvings
recorded in the analysis period.
I. Age at 1st calving (years) The age at first calving for all cows calving for the first time
during the analysis period.
J. Conception rate The number of conceptions as a percentage of the total number
of services (services to cows culled are included) during the
analysis period.
K. Percentage service intervals
at 18-24 days (Heat detection)
The percentage of all service intervals for cows returning to
service during the analysis period that are between 18 and 24
days (equating to one oestrus cycle after the previous service).
L. Percentage service intervals
>50 days
The percentage of all service intervals for cows returning to
service during the analysis period that are over 50 days.
M. Percentage of cows eligible
for service that were served
(Submission rate)
The percentage of cows that are eligible for service (42 days+
after calving and not barren) during the analysis period that are
served.
N. Percentage of cows eligible
for service that conceived
(Pregnancy rate)
The percentage of cows that are eligible for service (42 days+
after calving) during the analysis period that conceived.
O. Lifetime milk / cow/day (kg) The total milk produced per cow and heifer place in the year.
The total milk produced in the year, divided by the average
population of cows (both in milk and dry) and heifers (including
heifer replacements being reared elsewhere), divided by 365.
P. Milk / cow / year (kg) The total milk produced per cow place in the year.
The total milk divided by the average population of cows (both
in milk and dry).
Q. Average protein% The weighted average protein% of all milk recorded during the
analysis period.

41
Parameter Description
R. Average fat% The weighted average fat% of all milk recorded during the
analysis period.
S. 305 day yield (kg) The average 305 day production for all cows reaching 305 days
after calving during the analysis period.
T. 305 day protein (kg) The average 305 day production of milk protein for all cows
reaching 305 days after calving during the analysis period.
U. 305 day fat (kg) The average 305 day production of milk fat for all cows reaching
305 days after calving during the analysis period.
V. Average SCC (‘000 cells/ml) The weighted average somatic cell count of all milk recorded
during the analysis period.
W. Percentage SCC >=200,000
cells/ml
The percentage of all recorded milk samples during the analysis
period that had an individual SCC reading of 200,000 cells/ml or
higher.
X. Percentage SCC >=500,000
cells/ml
The percentage of all recorded milk samples during the analysis
period that had an individual SCC reading of 500,000 cells/ml or
higher.
Y. Percentage 1st recording
SCC >=200,000 cells/ml
The percentage of all cows starting new lactations that had a high
SCC (>=200,000 cells/ml) reading at the first milk recording in
the lactation.
Z. Percentage chronic SCC
>=200,000 cells/ml
The percentage of all milk samples taken in the analysis period
that originated from chronic SCC cows where the current and
previous milk samples both had SCC levels of 200,000 cells/ml
milk or greater.
ZA. Percentage Dry period cure
(High:Low)
Of re-calving cows recorded starting a new lactation during the
analysis period: the percentage of cows ending the previous
lactation with a HIGH SCC (>=200,000 cells/ml) that started the
new lactation with a LOW SCC (<200,000 cells/ml).
ZB. Percentage Dry period
protection (Low:Low)
Of re-calving cows recorded starting a new lactation during the
analysis period: the percentage of cows ending the previous
lactation with a LOW SCC (<200,000 cells/ml) that also started
the new lactation with a LOW SCC (<200,000 cells/ml).
ZC. Percentage Low at end of
previous lactation
(SCC<200,000 cells/ml)
Of re-calving cows recorded starting a new lactation during the
analysis period: The percentage that had a LOW SCC (<200,000
cells/ml) at the last milk recording in the previous lactation.
ZD. Percentage New SCC
>=200,000 cells/ml
The percentage of all recorded milk samples that were of the
“New” SCC Category, namely the first HIGH SCC (>=200,000)
in a lactation following one or more low SCC samples.
ZE. Percentage Dried-off with
no SCC >=200,000 cells/ml
The percentage of cows completing a lactation without recording
a high SCC (cows recording only LOW SCC samples (<200,000
cells/ml) in the previous lactation).
ZF. Threshold Index new high /
new low
Of cows with consecutive milk records in the same lactation, the
number of cows changing from Low SCC at the previous to High
SCC at the next recording divided by the number of cows going
from High SCC at the previous to Low SCC at the next
recording.
ZG. Recovery percentage of
new/first/repeat infections
Of HIGH SCC cows (>=200,000cells/ml) that at the previous
recording were either low SCC or not yet in milk, the percentage
that were LOW SCC (<200,000 cells/ml) at the following
recording.
42
Parameter Description
ZH. Recovery percentage of
chronic infections
Of CHRONIC High SCC cows (High SCC cows that at the
previous recording were also High SCC), the percentage of those
milked that were LOW SCC (<200,000 cells/ml) at the following
recording.
ZI. Percentage drying off with
no mastitis cases
The percentage of cows completing a lactation without recording
a mastitis case.
ZJ. Mastitis rate (cases/100 cows
in milk per year)
The total cow cases of mastitis recorded divided by the average
population of cows in milk, represented as a % (cases/100 cows
in milk).
ZK. Index mastitis case by Day
30
The percentage of cows calving during the12 month period that
recorded a mastitis case by day 30 of the lactation.
ZL. Index mastitis rate after Day
30
The incidence rate of index mastitis cases in cows that have
passed 30 days since calving.
43
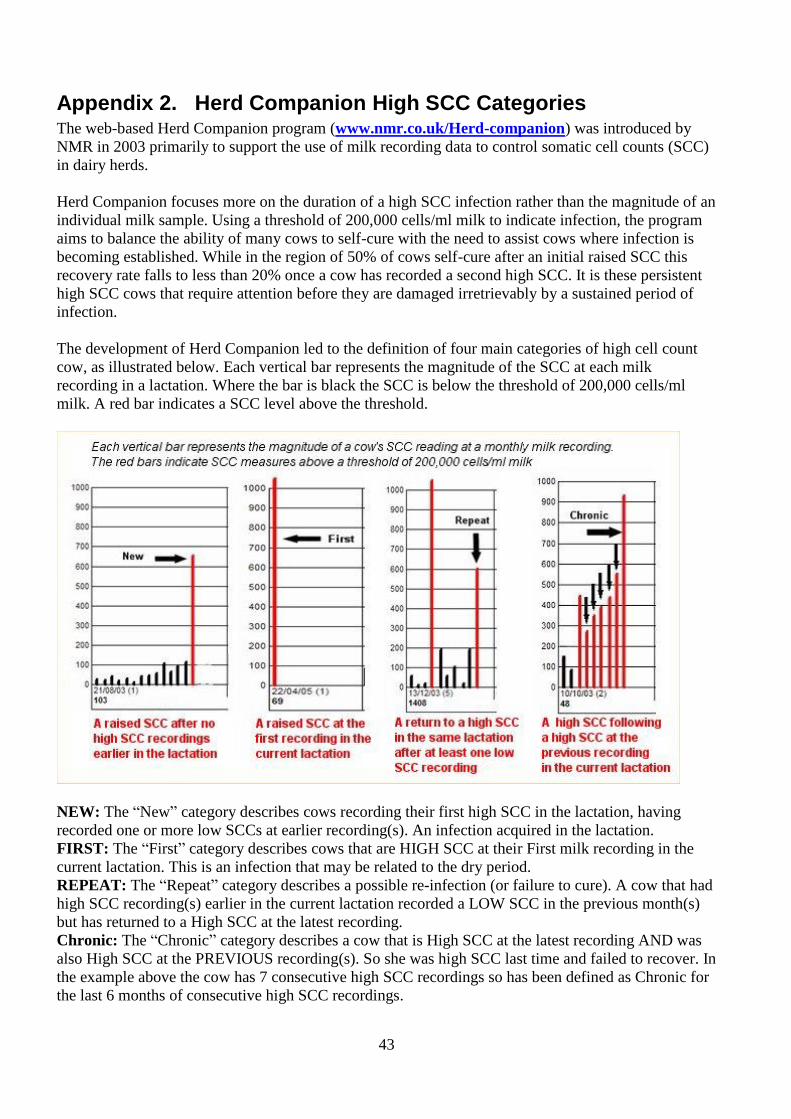
Appendix 2. Herd Companion High SCC Categories The web-based Herd Companion program (www.nmr.co.uk/Herd-companion) was introduced by
NMR in 2003 primarily to support the use of milk recording data to control somatic cell counts (SCC)
in dairy herds.
Herd Companion focuses more on the duration of a high SCC infection rather than the magnitude of an
individual milk sample. Using a threshold of 200,000 cells/ml milk to indicate infection, the program
aims to balance the ability of many cows to self-cure with the need to assist cows where infection is
becoming established. While in the region of 50% of cows self-cure after an initial raised SCC this
recovery rate falls to less than 20% once a cow has recorded a second high SCC. It is these persistent
high SCC cows that require attention before they are damaged irretrievably by a sustained period of
infection.
The development of Herd Companion led to the definition of four main categories of high cell count
cow, as illustrated below. Each vertical bar represents the magnitude of the SCC at each milk
recording in a lactation. Where the bar is black the SCC is below the threshold of 200,000 cells/ml
milk. A red bar indicates a SCC level above the threshold.
NEW: The “New” category describes cows recording their first high SCC in the lactation, having
recorded one or more low SCCs at earlier recording(s). An infection acquired in the lactation.
FIRST: The “First” category describes cows that are HIGH SCC at their First milk recording in the
current lactation. This is an infection that may be related to the dry period.
REPEAT: The “Repeat” category describes a possible re-infection (or failure to cure). A cow that had
high SCC recording(s) earlier in the current lactation recorded a LOW SCC in the previous month(s)
but has returned to a High SCC at the latest recording.
Chronic: The “Chronic” category describes a cow that is High SCC at the latest recording AND was
also High SCC at the PREVIOUS recording(s). So she was high SCC last time and failed to recover. In
the example above the cow has 7 consecutive high SCC recordings so has been defined as Chronic for
the last 6 months of consecutive high SCC recordings.