key statistics and trends in trade policy 2016 -...
TRANSCRIPT
UNITED NATIONSUN
CTAD
UNITED NATIONSUN
CTAD
U N I T E D N AT I O N S C O N F E R E N C E O N T R A D E A N D D E V E L O P M E N TU N I T E D N AT I O N S C O N F E R E N C E O N T R A D E A N D D E V E L O P M E N T
KEY STATISTICS AND TRENDS in Trade Policy 2016
G20 POLICIES AND EXPORT PERFORMANCEOF THE LEAST DEVELOPED COUNTRIES


KEY STATISTICS AND TRENDS in Trade Policy 2016
G20 POLICIES AND EXPORT PERFORMANCEOF THE LEAST DEVELOPED COUNTRIES
U N I T E D N AT I O N S C O N F E R E N C E O N T R A D E A N D D E V E L O P M E N T
Geneva, 2017

Key Statistics and Trends in Trade Policy 2016
UNCTAD | Division on International Trade in Goods and Services, and Commodities
ii
NOTE
Key Statistics and Trends in Trade Policy 2016 is the fourth annual edition of the study initiated in
2013. It is a product of the Trade Analysis Branch, Division on International Trade in Goods and Services, and
Commodities, UNCTAD secretariat. This study is part of a larger effort by UNCTAD to analyse trade-related
issues of particular importance to developing countries in terms of their participation in the international trading
system, as requested by the mandate of the fourteenth session of the United Nations Conference on Trade and
Development. This study was prepared by Alessandro Nicita.
The designations employed and the presentation of the material do not imply the expression of any
opinion on the part of the United Nations concerning the legal status of any country, territory, city or area or of
authorities, or concerning the delimitation of its frontiers or boundaries.
References to dollars are United States of America dollars.
This publication has not been formally edited.
Material in this publication may be freely quoted or reprinted, but acknowledgement is requested,
together with a copy of the publication containing the quotation or reprint to be sent to the UNCTAD secretariat
at the following address:
Trade Analysis Branch
Division on International Trade in Goods and Services, and Commodities
United Nations Conference on Trade and Development
Palais des Nations, 1211 Geneva 10, Switzerland
E-mail: [email protected] or [email protected]
Copyright © United Nations, 2017
All rights reserved
UNCTAD/DITC/TAB/2016/2
UNITED NATIONS PUBLICATION
ISSN 2409-7713

Key Statistics and Trends in Trade Policy 2016
UNCTAD | Division on International Trade in Goods and Services, and Commodities
iii
CONTENTS
Overview ......................................................................................................................... v Glossary ......................................................................................................................... vi Data Sources ............................................................................................................... viii
In Focus: G20 policies and export performance of the least developed countries ............................................................................................. 1 G20 Policies on the least developed countries ................................................................................................ 1
Effect of G20 policies on exports of the least developed countries ................................................................. 3
Is improved market access a solution for economic integration of the least developed countries? .............. 3
1. Tariffs ......................................................................................................................... 5 Average import and export restrictiveness, by region ...................................................................................... 5
Multilateral and preferential tariff liberalization ................................................................................................. 6
Free trade and remaining tariffs, by broad category ........................................................................................ 7
Trade weighted average tariffs, by region, broad category and sector ............................................................ 8
Tariff peaks, by region, broad category and sector .......................................................................................... 9
Tariff escalation by region, broad category and sector .................................................................................. 10
Tariff restrictiveness, matrix by region ............................................................................................................ 11
Relative preferential margins, matrix by region .............................................................................................. 12
Import restrictiveness ..................................................................................................................................... 13
2. Trade Agreements .................................................................................................. 14 Trade agreements ........................................................................................................................................... 14
Importance of preferential trade agreements ................................................................................................. 15
Policy space: Multilateral constraints ............................................................................................................. 16
3. Non-Tariff Measures ............................................................................................... 17 Prevalence of non-tariff measures, by type and broad category .................................................................. 17
Non-tariff measures, by sector ...................................................................................................................... 18
Technical non-tariff measures, by country .................................................................................................... 19
4. Trade Defence Measures. ...................................................................................... 20 Trade defence measures ................................................................................................................................ 20
Trade defence measures in effect, by country ............................................................................................... 21
Trade defence measures and investigations, by sector ................................................................................ 22
5. Exchange Rates. ..................................................................................................... 23 International competitiveness, real effective exchange rate ........................................................................... 23
Change in the nominal exchange rate vs US dollar ........................................................................................ 24
6. Trade Costs. ............................................................................................................ 25 Liner shipping bilateral connectivity index ...................................................................................................... 25

Key Statistics and Trends in Trade Policy 2016
UNCTAD | Division on International Trade in Goods and Services, and Commodities
iv
OVERVIEW
During the last decade international trade has been characterized by a progressive shift in the use of trade
policy instruments. Tariffs have remained substantially stable during the last few years with tariff protection
remaining a critical factor only in certain sectors in limited number of markets. On the other hand, the use of
regulatory measures and other non-tariff measures such as antidumping has become more widespread. The
recent years have also been characterized by substantial movements in some of the major currencies.
Overall, tariffs have remained substantially stable during the last years. As of 2015, developed countries import
restrictiveness is at an average of about 1.2 per cent. However, import restrictiveness remained higher in many
developing countries, especially in South Asia and sub-Saharan African Countries. Although low on average,
tariffs remain relatively high in some sectors. Moreover, tariff peaks are present in important sectors, including
some of key interest to low income countries such as agriculture, apparel, textiles and leather products. Tariffs
also remain substantial for most South–South trade. As of 2015, international trade is increasingly subject to
and influenced by a wide array of policies and instruments reaching beyond tariffs. Technical measures and
requirements regulate about two thirds of world trade, while various forms of sanitary and phytosanitary
measures (SPS) are applied to almost the totality of agricultural trade. The past few years have also seen a
general increase in the use of trade defence measures within the World Trade Organization (WTO) framework.
In spite of the effects of the economic crisis, the process of deeper economic integration has remained strong
at a regional and bilateral level, with an increasing number of preferential trade agreements (PTAs) being
negotiated and implemented. PTAs increasingly address not only goods but also services and increasingly deal
with rules beyond reciprocal tariff concessions to cover a wide range of behind the border issues. As of 2015,
about half of world trade has occurred under some form of PTAs. The economic turbulence of recent years has
been reflected in exchange rate markets, both for developing and developed countries’ currencies. Exchange
rate movements are playing an important role in shaping international trade in the last few years as they have
influenced countries’ external competitiveness. In particular, 2015 saw the value of the United States dollar
appreciate against most major currencies.
This report is structured in two parts. The first part presents an overview of the effects of G20 policies on LDCs
exports. The second part discusses trends in selected trade policy instruments including illustrative statistics.
The second part is divided in six chapters: tariffs, trade agreements, non-tariff measures, trade defence
measures, exchange rates and trade costs. Trade trends and statistics are provided at various levels of
aggregation illustrating the use of the trade policy measures across economic sectors and geographic regions.

Key Statistics and Trends in Trade Policy 2016
UNCTAD | Division on International Trade in Goods and Services, and Commodities
v
Glossary
Antidumping: A trade policy instrument within the WTO framework to rectify the situation arising out of the
dumping of goods and its trade distortive effect
Applied tariff: The actual tariff rate in effect at a country's border
ASEAN: Association of Southeast Asian Nations
Binding overhang: The extent to which a country's WTO bound tariff rate exceeds its applied rate
Bound tariff line: See tariff binding.
CIS: Free Trade Agreement of the Commonwealth of Independent States
COMESA: Common Market for Eastern and Southern Africa
Countervailing duty: A tariff designed to counteract the effect of export subsidies
Coverage ratio: The percentage of trade affected by a measure or set of measures
Currency appreciation: An increase in the value of a country's currency on the exchange market
Currency depreciation: A fall in the value of a country's currency on the exchange market
Currency misalignment: An index measuring the divergence of the exchange rate from its long-term equilibrium
Deep trade agreements: Agreements that include provisions that go beyond reciprocal reductions of tariffs
Duty-free: Not subject to import tariffs
ECOWAS: Economic Community of West African States
Effective exchange rate: An index of a currency's value relative to a group of other currencies
Exchange rate volatility: The tendency for currencies to appreciate or depreciate in value within a period
Export restrictiveness: The average level of tariff restrictions imposed on a country's exports as measured by
the MA-TTRI
Frequency index: The percentage of tariff lines covered by a measures or set of measures
GDP: Gross domestic product
HS: Harmonized System – An international system for classifying goods in international trade
Import restrictiveness: The average level of tariff restrictions on imports as measured by the TTRI
LDC: Least developed country
LSBCI: Liner Shipping Bilateral Connectivity Index
MA-TTRI: An index measuring the average level of tariff restrictions imposed on exports
MERCOSUR: Mercado Común del Sur (Southern Common Market)
MFN (most favoured nation) tariff: The tariff level that a member of the General Agreement on Tariffs and Trade
/WTO charges on a good to other members
NAFTA: North American Free Trade Agreement
Nominal exchange rate: The actual rate at which currencies are exchanged on the exchange market
NTM: non-tariff measure – Any policy, other than tariffs, that alters the conditions of international trade
Preferential scheme: An arrangement under which countries levy lower (or zero) tariffs against imports from
members than outsiders
Key Statistics and Trends in Trade Policy 2016
UNCTAD | Division on International Trade in Goods and Services, and Commodities
vi
PTA: preferential trade agreement. This includes what WTO refers to as regional trade agreements and also
free trade areas, custom unions and common markets.
REER: real effective exchange rate –The effective exchange rate adjusted for the rate of inflation
RPM: relative preferential margin – A measure of the preferential margin for a given country relative to foreign
competitors
Safeguard: A WTO-compliant import protection policy that permits restricting imports if they cause injury to
domestic industry
Shallow trade agreement: Preferential agreements including only a reduction of tariffs
SPS: Sanitary and phytosanitary measures
Tariff binding: A commitment, under the General Agreement on Tariffs and Trade, by a country not to raise the
tariff on an item above the specified bound
Tariff escalation: Higher tariffs on processed goods than raw materials from which they are produced
Tariff line: A single item in a country's tariff schedule
Tariff peak: A single tariff or a small group of tariffs that is/are particularly high
Tariff water: See binding overhang.
TBT: Technical barriers to trade
Technical NTM: Non-tariff measure related to SPS and TBT
TPP: Trans-Pacific Partnership
Trade defence measure: Policies within the WTO framework preventing or correcting injury to domestic
industry due to imports
True tariff water: Tariff water that takes into account implicit bindings imposed by PTA obligations
TTIP: Transatlantic Trade and Investment Partnership
TTRI: Tariff trade restrictiveness index – An index measuring the average level of tariff restrictions imposed on
imports
Unbound tariff line: See tariff binding.
Weighted average tariff: Average tariffs, weighted by value of imports
WTO: World Trade Organization
Key Statistics and Trends in Trade Policy 2016
UNCTAD | Division on International Trade in Goods and Services, and Commodities
vii
Data sources
All statistics in this publication have been produced by the UNCTAD secretariat by using data from various
sources. Data on tariffs and non-tariff measures originate from the UNCTAD Trade Analysis and Information
System (TRAINS) and Integrated Trade Intelligence Portal (I-TIP) databases (http://i-tip.unctad.org/), while data
on bound tariffs derive from the WTO’s Consolidated Tariff Schedules database (tdf.wto.org). Trade data are
from the United Nations Commodity Trade Statistics Database (COMTRADE; comtrade.un.org). Data on trade
defence measures are sourced from the WTO I-TIP (i-tip.wto.org). Tariff and trade data are at the Harmonized
System 6-digit level and have been standardized to ensure comparability across countries. Data related to
preferential trade agreements are derived from various databases, including the WTO regional trade
agreement gateway (rtais.wto.org) and the World Bank global preferential agreements database
(wits.worldbank.org/gptad/trade_database.html). Yearly exchange rate data originate from financial statistics
of the International Monetary Fund, and other macro level data used in the figures originate from UNCTADstat
(unctadstat.unctad.org). Unless otherwise specified, aggregated data cover more than 160 countries
representing over 95 per cent of world trade. Data on non-tariff measures only cover around 60 countries,
and therefore may not be representative of world trade.
Countries are categorized by geographic region as defined by the United Nations classification (UNSD M49).
Developed countries comprise those commonly categorized as such in United Nations statistics. For the
purpose of this report, transition economies, when not treated as a single group, are included in the broad
aggregate of developing countries. Product sectors are categorized according to the Broad Economic
Categories (BEC) and the International Standard Industrial Classification (ISIC). Preferential trade agreements
that relate to both goods and services are counted as one. Non-tariff measures are classified according to
UNCTAD classification 2012 (http://unctad.org/en/PublicationsLibrary/ ditctab20122_en.pdf).
Further information relating to the construction of data, statistics, tables and graphs contained in this
publication can be made available by contacting [email protected].


Key Statistics and Trends in Trade Policy 2016
UNCTAD | Division on International Trade in Goods and Services, and Commodities
1
In focus: G20 policies and export performance of the least developed countries
Despite some progress in the last decade, the participation of least developing countries (LDCs) in the
global economy remains marginal. While the 48 LDCs account for about 12 per cent of the world's population, their share in global merchandise exports has remained at about 1 per cent since 2008. The weak integration of LDCs is not only due to their relatively small economies, but also to the fact that LDCs generally trade much less than the size of their economies would suggest. LDCs' export-to-GDP ratios are on average at about 25 per cent, substantially below the average for developing countries, which is about 35 per cent. Moreover, the fact that this indicator has been on a clear downward trend since 2011
highlights the LDCs' progressive struggle in the global economy.
The international community has long recognized
the export constraints of LDCs as an important
element hindering their economic growth.
Indeed, one of the main features of the
international cooperation agenda in the last 50
years has been to promote the economic
integration of poorer countries into the global
economy through enhanced participation in
international trade. This proposition has
appeared in many multilateral declarations,
including the United Nations 2030 Agenda for
Sustainable Development and the Sustainable
Development Goals. In particular, Goal 17
specifically calls for facilitating the integration of
poorer countries into the global economy. The
rationale is that stronger integration would
enhance economic growth, industrial
transformation and ultimately provide resources
for sustainable and inclusive development. For
this purpose, Goal 17 identifies two targets:
target 17.11 ("Increase significantly the exports
of developing countries, in particular with a view to doubling the least developing countries' share of global
exports by 2020") and target 17.12 ("Realize timely implementation of duty-free and quota-free market access
on a lasting basis for all least developed countries"). Target 17.11 explicitly recognizes the persistent problem
of the weak economic integration of LDCs, while target 17.12 identifies facilitating market access as a one of
the solutions to such a problem.
G20 policies on the least developed countries
The G201 generally provides LDC exporters with mechanisms which facilitate trade, or at least do not impose additional burdens. The means through which the larger and more advanced economies try to compensate for LDCs' poor export capacities and lack of competitiveness in global markets take the form of duty-free quota-free access, softer rules of origin, broader lists of eligible products, special and
1 The following are members of the Group: Argentina, Australia, Brazil, Canada, China, France, Germany, India,
Indonesia, Italy, Japan, the Republic of Korea, Mexico, the Russian Federation, Saudi Arabia, South Africa, Turkey,
the United Kingdom of Great Britain and Northern Ireland, the United States and the European Union.
Developing countries exports over GDP (left axis)
LDCs exports over GDP (left axis)
LDCs share in global exports (right axis)
0
.5
1
1.5
2
2.5
Per
cent
0
10
20
30
40
Per
cent
2005
2006
2007
2008
2009
2010
2011
2012
2013
2014
2015
LDCs integration in the global economy is low, and declining
Chart 1: LDCs Export Performance
Source: UNCTAD calculations based on UNCTADSTAT dataSource: UNCTAD secretariat calculations based on UNCTADStat data.
Key Statistics and Trends in Trade Policy 2016
UNCTAD | Division on International Trade in Goods and Services, and Commodities
2
differential treatment in implementation of trade agreements, Aid for Trade initiatives and technical facilitation programmes to reduce trade costs and boost productive capacity.
The most common instrument to facilitate exports from LDCs is by granting them preferential access in order to provide them with a competitive edge, the preferential margin. Indeed, many high-income countries provide tariff preferences to LDCs under the
General System of Preferences and specific arrangements. Non-reciprocal preferential access for LDCs is also provided by some of the G20 developing countries such as China and India, which have recently started their own preferential schemes. Most of the
preferential schemes, although generous, come with conditions attached. Rules of origin, though necessary, often make preferential schemes less effective and many preferential programmes often exclude products of importance for LDCs on the basis of sensitivity
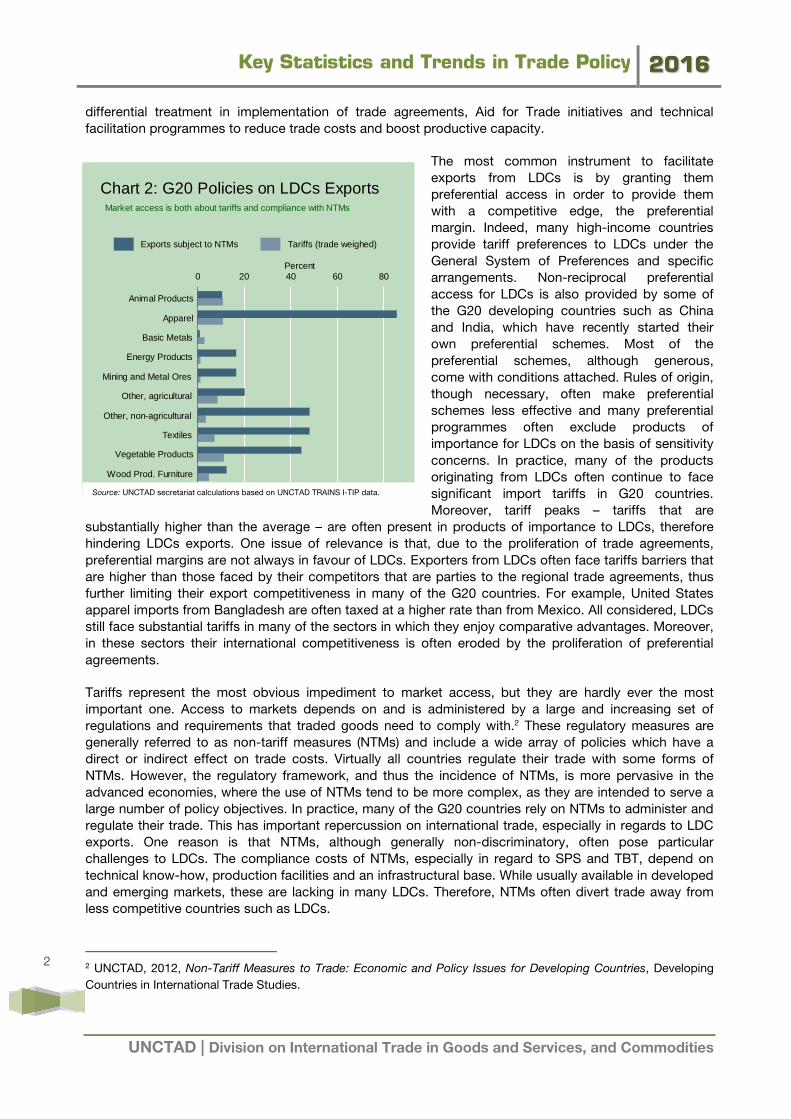
concerns. In practice, many of the products originating from LDCs often continue to face significant import tariffs in G20 countries. Moreover, tariff peaks – tariffs that are
substantially higher than the average – are often present in products of importance to LDCs, therefore hindering LDCs exports. One issue of relevance is that, due to the proliferation of trade agreements,
preferential margins are not always in favour of LDCs. Exporters from LDCs often face tariffs barriers that are higher than those faced by their competitors that are parties to the regional trade agreements, thus further limiting their export competitiveness in many of the G20 countries. For example, United States apparel imports from Bangladesh are often taxed at a higher rate than from Mexico. All considered, LDCs still face substantial tariffs in many of the sectors in which they enjoy comparative advantages. Moreover, in these sectors their international competitiveness is often eroded by the proliferation of preferential
agreements.
Tariffs represent the most obvious impediment to market access, but they are hardly ever the most important one. Access to markets depends on and is administered by a large and increasing set of regulations and requirements that traded goods need to comply with.2 These regulatory measures are generally referred to as non-tariff measures (NTMs) and include a wide array of policies which have a direct or indirect effect on trade costs. Virtually all countries regulate their trade with some forms of
NTMs. However, the regulatory framework, and thus the incidence of NTMs, is more pervasive in the advanced economies, where the use of NTMs tend to be more complex, as they are intended to serve a large number of policy objectives. In practice, many of the G20 countries rely on NTMs to administer and regulate their trade. This has important repercussion on international trade, especially in regards to LDC exports. One reason is that NTMs, although generally non-discriminatory, often pose particular challenges to LDCs. The compliance costs of NTMs, especially in regard to SPS and TBT, depend on
technical know-how, production facilities and an infrastructural base. While usually available in developed and emerging markets, these are lacking in many LDCs. Therefore, NTMs often divert trade away from less competitive countries such as LDCs.
2 UNCTAD, 2012, Non-Tariff Measures to Trade: Economic and Policy Issues for Developing Countries, Developing
Countries in International Trade Studies.
0 20 40 60 80Percent
Wood Prod. Furniture
Vegetable Products
Textiles
Other, non-agricultural
Other, agricultural
Mining and Metal Ores
Energy Products
Basic Metals
Apparel
Animal Products
Market access is both about tariffs and compliance with NTMs
Chart 2: G20 Policies on LDCs Exports
Exports subject to NTMs Tariffs (trade weighed)
Source: UNCTAD calculations based on UNCTAD TRAINS I-TIP dataSource: UNCTAD secretariat calculations based on UNCTAD TRAINS I-TIP data.

Key Statistics and Trends in Trade Policy 2016
UNCTAD | Division on International Trade in Goods and Services, and Commodities
3
Effect of G20 policies on exports of the least developed countries
G20 trade policies, both tariffs and non-tariff measures, have a substantial effect on LDCs export potential. A recent UNCTAD study quantifies the merchandise export loss resulting from the remaining tariffs that the G20 apply to LDCs is about $10 billion.3 That is, granting LDCs truly duty-free access to G20 markets would lead to an increase in LDCs' total export of almost five per cent. In regard to non-tariff measures, the distortionary effect of the regulatory framework related to technical NTMs is estimated at a $23 billion export loss for LDCs. Eliminating the distortionary trade effects of such NTMs
would increase LDC exports by about 10 per cent. Taken together, fully liberalizing market access for LDCs and eliminating the negative trade effect of NTMs on LDCs would increase their exports by about 15 per cent. These aggregate effects mask the heterogeneity of effects across LDCs and G20 countries. In
practice, most of the effects of tariff liberalization and eliminating the negative trade effects of NTMs would be concentrated in the textile and apparel sectors, as well as in some of the agricultural categories (vegetable products). Such
diverse sectoral effects would result in substantial heterogeneity across LDCs. In practice, the benefits would be concentrated in countries whose export potential is oriented towards agriculture and light manufacturing (e.g. Asian LDCs and some of
the African agricultural exporters). Improved market access would have a substantially smaller effect for LDCs that are exporters of natural resources.
Trade policy effects are also heterogeneous across G20 members. In general, while NTMs remain the most important trade policy hurdle limiting LDC exports to all G20 markets, and especially so for entering
European Union markets, there is still room for tariff concessions. Providing LDCs with duty-free access remains important for the United States, as well as for many of the smaller G20 economies. With regard to China, the effects are relatively milder. This is because Chinese imports from LDCs are largely concentrated in natural resources and other commodities, which already face very low tariffs and relatively few NTMs. In non-commodity sectors, effects remain substantial in the Chinese market as well.
Is improved market access a solution for the economic integration of the least developed countries?
Market access should be seen as part of the approach to facilitate LDCs' exports expansion. However, alone it will fall short of meeting the ambitious Sustainable Development Goal target of doubling the
LDCs' export share by 2020. Moreover, while LDCs will surely benefit from the elimination of the remaining tariffs imposed on their exports, it is of primary importance to reduce the distortionary effects of NTMs when addressing market access constraints faced by LDCs. In this regard, target 17.12 falls short of recognizing these constraints.
3 A Nicita and J Seiermann, 2016, G20 Policies and Export Performance of Least Developed Countries. Policy Issues
in International Trade and Commodities Research Study Series No. 75, UNCTAD.
0 2 4 6 8 10Billion US$
Wood Prod. Furniture
Energy products
Animal Products
Other, agricultural
Mining and Metal Ores
Metals
Other, nonagricultural
Vegetable Products
Textiles
Apparel
Facilitating compliance with NTMs and lower tariff would help
Chart 3: Market Access still Matters
NTMs Tariffs
Source: UNCTAD Policy Series Study #75: G20 Policies and LDCs Export PerformanceSource: UNCTAD Policy Series Study no. 75: G20 Policies and Export Performance of LDCs.

Key Statistics and Trends in Trade Policy 2016
UNCTAD | Division on International Trade in Goods and Services, and Commodities
4
An issue of fundamental importance relates to the implementation of the policy options to improve LDCs' market access. Providing full duty-free access for LDCs is definitively more straightforward than reducing
the distortionary effects of NTMs. Enlarging preferential schemes to cover all LDC exports would be much easier to implement, with the only difficulties originating from limiting possible trans-shipments. In practice, LDC exports still face significant tariffs in many G20 markets, and there is ample room for enlarging and strengthening the G20 preferential schemes to LDCs. In this regard, G20 countries should review their eligibility rules, product coverage and exemptions, rules of origin, and administrative costs, all of which often limit the effectiveness of their preferential schemes towards LDCs.
On the other hand, reducing the distortionary effects of NTMs requires a much more complex approach. Many NTMs serve public policy objectives and are instruments of domestic economic policy. Therefore, these measures cannot be removed, or waived, without disrupting the very purpose they serve.4 Reducing the distortionary effects of NTMs against LDCs has to originate not so much from the removal of NTMs but from helping LDCs to comply with them on a cost-efficient basis. This insight gives rise to two policy recommendations. First, the G20 countries should design and amend their regulatory
framework so that it does not unnecessarily create discrimination against LDC exporters. Second, the G20 countries should provide LDC exporters with the necessary information and support so as to minimize unavoidable distortions against LDC exports. In this regard also, G20 countries should improve assistance specifically targeted to reduce the relatively higher cost of LDCs' compliance with NTMs. Further progress in Aid for Trade initiatives and increases in technical assistance programmes both at the bilateral and multilateral levels would help to minimize LDCs' cost of compliance with NTMs and therefore
facilitate the integration of LDCs in the global economy.
4 UNCTAD, 2016, Trading into Sustainable Development: Trade, Market Access and the Sustainable Development Goals, Developing Countries in International Trade Studies.
Key Statistics and Trends in Trade Policy 2016
UNCTAD | Division on International Trade in Goods and Services, and Commodities
5
1. TARIFFS
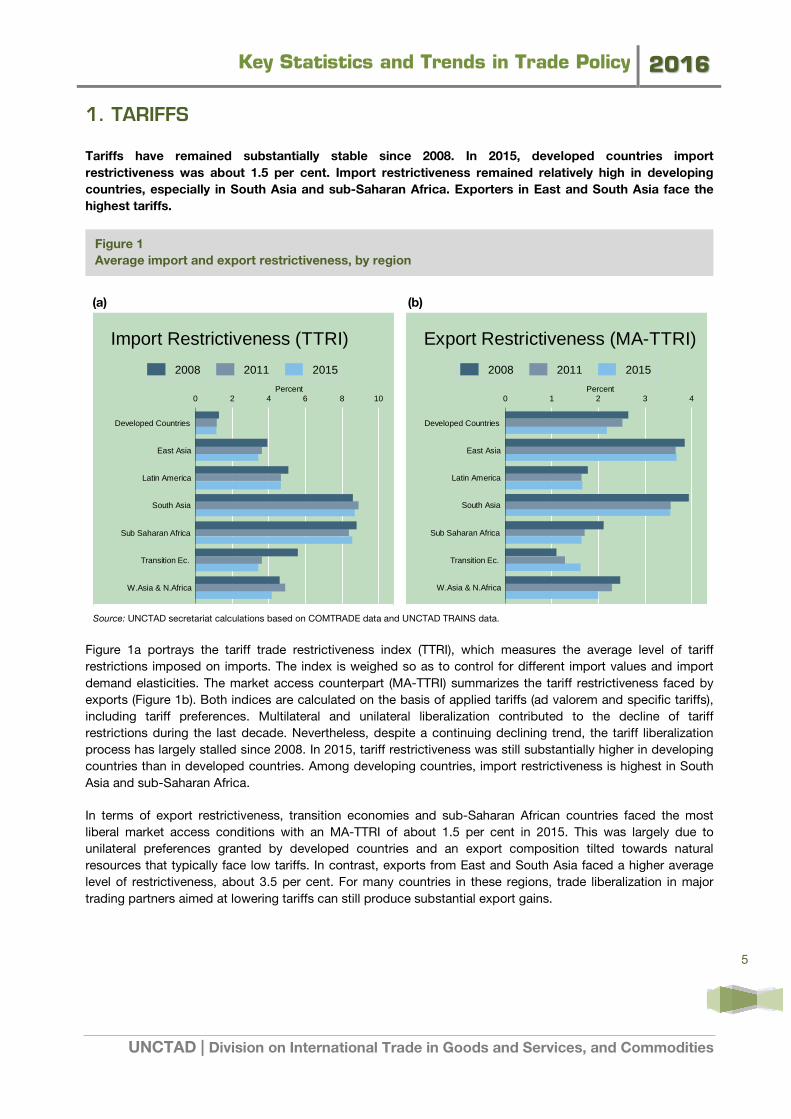
Tariffs have remained substantially stable since 2008. In 2015, developed countries import
restrictiveness was about 1.5 per cent. Import restrictiveness remained relatively high in developing
countries, especially in South Asia and sub-Saharan Africa. Exporters in East and South Asia face the
highest tariffs.
(a) (b)
Source: UNCTAD secretariat calculations based on COMTRADE data and UNCTAD TRAINS data.
Figure 1a portrays the tariff trade restrictiveness index (TTRI), which measures the average level of tariff
restrictions imposed on imports. The index is weighed so as to control for different import values and import
demand elasticities. The market access counterpart (MA-TTRI) summarizes the tariff restrictiveness faced by
exports (Figure 1b). Both indices are calculated on the basis of applied tariffs (ad valorem and specific tariffs),
including tariff preferences. Multilateral and unilateral liberalization contributed to the decline of tariff
restrictions during the last decade. Nevertheless, despite a continuing declining trend, the tariff liberalization
process has largely stalled since 2008. In 2015, tariff restrictiveness was still substantially higher in developing
countries than in developed countries. Among developing countries, import restrictiveness is highest in South
Asia and sub-Saharan Africa.
In terms of export restrictiveness, transition economies and sub-Saharan African countries faced the most
liberal market access conditions with an MA-TTRI of about 1.5 per cent in 2015. This was largely due to
unilateral preferences granted by developed countries and an export composition tilted towards natural
resources that typically face low tariffs. In contrast, exports from East and South Asia faced a higher average
level of restrictiveness, about 3.5 per cent. For many countries in these regions, trade liberalization in major
trading partners aimed at lowering tariffs can still produce substantial export gains.
0 2 4 6 8 10Percent
W.Asia & N.Africa
Transition Ec.
Sub Saharan Africa
South Asia
Latin America
East Asia
Developed Countries
Import Restrictiveness (TTRI)
2008 2011 2015
Source: UNCTAD calculations based on UN COMTRADE and UNCTAD TRAINS data
0 1 2 3 4Percent
W.Asia & N.Africa
Transition Ec.
Sub Saharan Africa
South Asia
Latin America
East Asia
Developed Countries
Export Restrictiveness (MA-TTRI)
2008 2011 2015
Source: UNCTAD calculations based on UN COMTRADE and UNCTAD TRAINS data
Figure 1
Average import and export restrictiveness, by region
Key Statistics and Trends in Trade Policy 2016
UNCTAD | Division on International Trade in Goods and Services, and Commodities
6
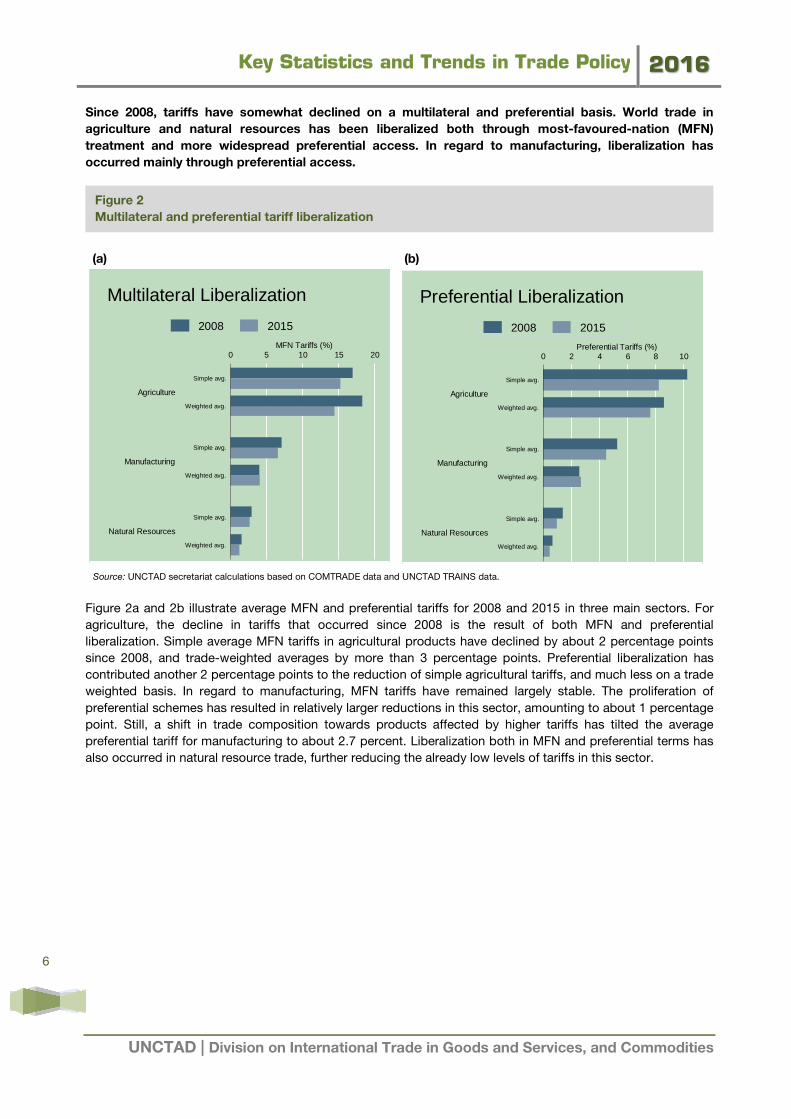
Since 2008, tariffs have somewhat declined on a multilateral and preferential basis. World trade in
agriculture and natural resources has been liberalized both through most-favoured-nation (MFN)
treatment and more widespread preferential access. In regard to manufacturing, liberalization has
occurred mainly through preferential access.
(a) (b)
Source: UNCTAD secretariat calculations based on COMTRADE data and UNCTAD TRAINS data.
Figure 2a and 2b illustrate average MFN and preferential tariffs for 2008 and 2015 in three main sectors. For
agriculture, the decline in tariffs that occurred since 2008 is the result of both MFN and preferential
liberalization. Simple average MFN tariffs in agricultural products have declined by about 2 percentage points
since 2008, and trade-weighted averages by more than 3 percentage points. Preferential liberalization has
contributed another 2 percentage points to the reduction of simple agricultural tariffs, and much less on a trade
weighted basis. In regard to manufacturing, MFN tariffs have remained largely stable. The proliferation of
preferential schemes has resulted in relatively larger reductions in this sector, amounting to about 1 percentage
point. Still, a shift in trade composition towards products affected by higher tariffs has tilted the average
preferential tariff for manufacturing to about 2.7 percent. Liberalization both in MFN and preferential terms has
also occurred in natural resource trade, further reducing the already low levels of tariffs in this sector.
0 5 10 15 20MFN Tariffs (%)
Natural Resources
Manufacturing
Agriculture
Weighted avg.
Simple avg.
Weighted avg.
Simple avg.
Weighted avg.
Simple avg.
Multilateral Liberalization
2008 2015
Source: UNCTAD calculations based on UN COMTRADE and UNCTAD TRAINS data
0 2 4 6 8 10Preferential Tariffs (%)
Natural Resources
Manufacturing
Agriculture
Weighted avg.
Simple avg.
Weighted avg.
Simple avg.
Weighted avg.
Simple avg.
Preferential Liberalization
2008 2015
Source: UNCTAD calculations based on UN COMTRADE and UNCTAD TRAINS data
Figure 2
Multilateral and preferential tariff liberalization
Key Statistics and Trends in Trade Policy 2016
UNCTAD | Division on International Trade in Goods and Services, and Commodities
7
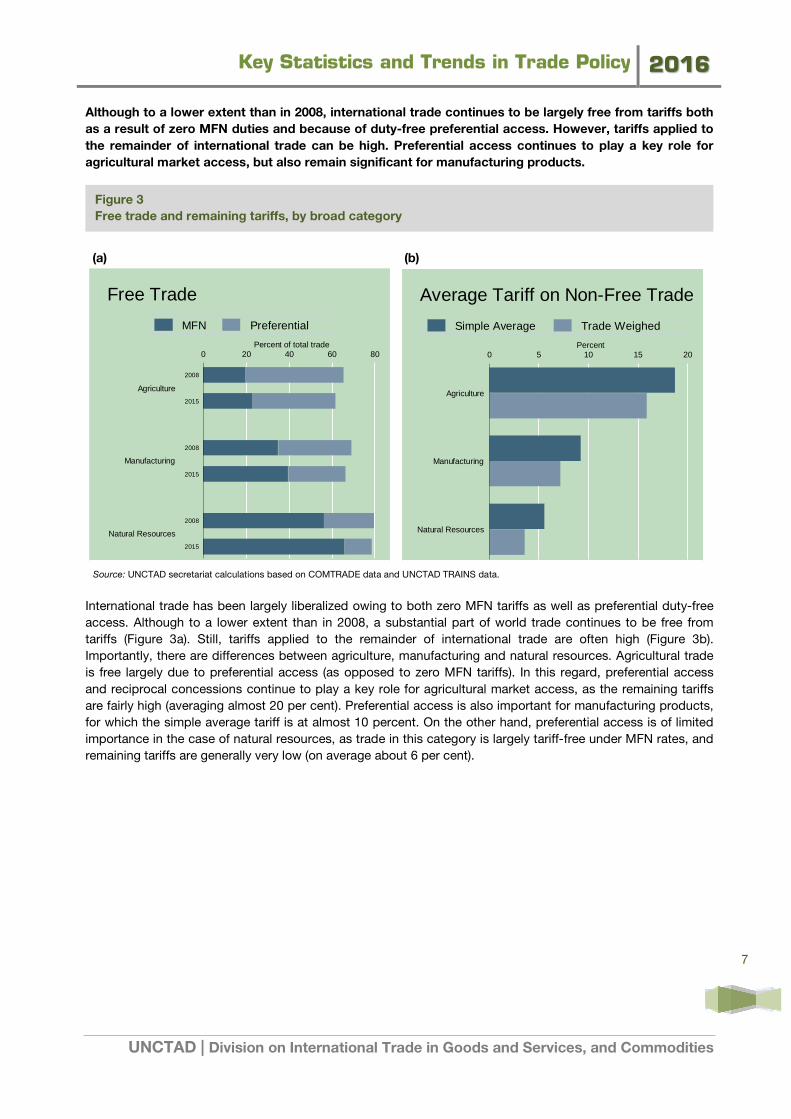
Although to a lower extent than in 2008, international trade continues to be largely free from tariffs both
as a result of zero MFN duties and because of duty-free preferential access. However, tariffs applied to
the remainder of international trade can be high. Preferential access continues to play a key role for
agricultural market access, but also remain significant for manufacturing products.
(a) (b)
Source: UNCTAD secretariat calculations based on COMTRADE data and UNCTAD TRAINS data.
International trade has been largely liberalized owing to both zero MFN tariffs as well as preferential duty-free
access. Although to a lower extent than in 2008, a substantial part of world trade continues to be free from
tariffs (Figure 3a). Still, tariffs applied to the remainder of international trade are often high (Figure 3b).
Importantly, there are differences between agriculture, manufacturing and natural resources. Agricultural trade
is free largely due to preferential access (as opposed to zero MFN tariffs). In this regard, preferential access
and reciprocal concessions continue to play a key role for agricultural market access, as the remaining tariffs
are fairly high (averaging almost 20 per cent). Preferential access is also important for manufacturing products,
for which the simple average tariff is at almost 10 percent. On the other hand, preferential access is of limited
importance in the case of natural resources, as trade in this category is largely tariff-free under MFN rates, and
remaining tariffs are generally very low (on average about 6 per cent).
0 20 40 60 80Percent of total trade
Natural Resources
Manufacturing
Agriculture
2015
2008
2015
2008
2015
2008
Free Trade
MFN Preferential
Source: UNCTAD calculations based on UN COMTRADE and UNCTAD TRAINS data
0 5 10 15 20Percent
Natural Resources
Manufacturing
Agriculture
Average Tariff on Non-Free Trade
Simple Average Trade Weighed
Source: UNCTAD calculations based on UN COMTRADE and UNCTAD TRAINS data
Figure 3
Free trade and remaining tariffs, by broad category
Key Statistics and Trends in Trade Policy 2016
UNCTAD | Division on International Trade in Goods and Services, and Commodities
8
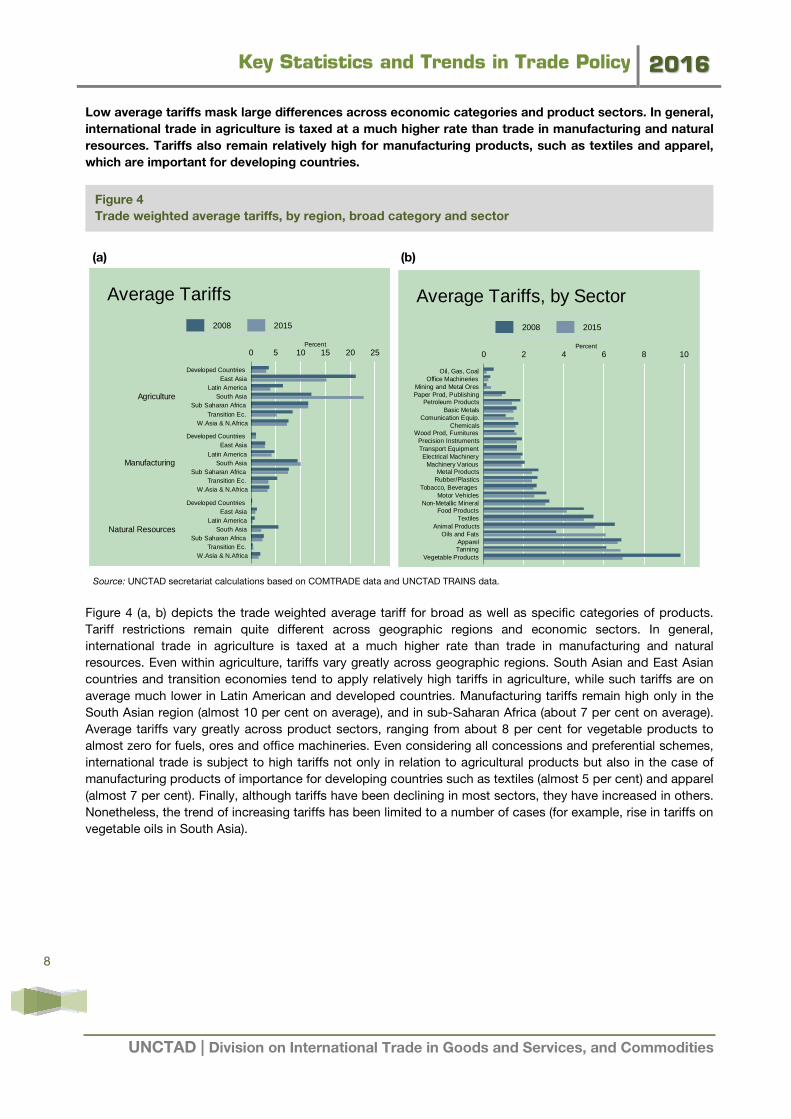
Low average tariffs mask large differences across economic categories and product sectors. In general,
international trade in agriculture is taxed at a much higher rate than trade in manufacturing and natural
resources. Tariffs also remain relatively high for manufacturing products, such as textiles and apparel,
which are important for developing countries.
(a) (b)
Source: UNCTAD secretariat calculations based on COMTRADE data and UNCTAD TRAINS data.
Figure 4 (a, b) depicts the trade weighted average tariff for broad as well as specific categories of products.
Tariff restrictions remain quite different across geographic regions and economic sectors. In general,
international trade in agriculture is taxed at a much higher rate than trade in manufacturing and natural
resources. Even within agriculture, tariffs vary greatly across geographic regions. South Asian and East Asian
countries and transition economies tend to apply relatively high tariffs in agriculture, while such tariffs are on
average much lower in Latin American and developed countries. Manufacturing tariffs remain high only in the
South Asian region (almost 10 per cent on average), and in sub-Saharan Africa (about 7 per cent on average).
Average tariffs vary greatly across product sectors, ranging from about 8 per cent for vegetable products to
almost zero for fuels, ores and office machineries. Even considering all concessions and preferential schemes,
international trade is subject to high tariffs not only in relation to agricultural products but also in the case of
manufacturing products of importance for developing countries such as textiles (almost 5 per cent) and apparel
(almost 7 per cent). Finally, although tariffs have been declining in most sectors, they have increased in others.
Nonetheless, the trend of increasing tariffs has been limited to a number of cases (for example, rise in tariffs on
vegetable oils in South Asia).
0 5 10 15 20 25Percent
Natural Resources
Manufacturing
Agriculture
W.Asia & N.AfricaTransition Ec.
Sub Saharan AfricaSouth Asia
Latin AmericaEast Asia
Developed Countries
W.Asia & N.AfricaTransition Ec.
Sub Saharan AfricaSouth Asia
Latin AmericaEast Asia
Developed Countries
W.Asia & N.AfricaTransition Ec.
Sub Saharan AfricaSouth Asia
Latin AmericaEast Asia
Developed Countries
Average Tariffs
2008 2015
Source: UNCTAD calculations based on UN COMTRADE and UNCTAD TRAINS data
0 2 4 6 8 10Percent
Vegetable ProductsTanningApparel
Oils and FatsAnimal Products
TextilesFood Products
Non-Metallic MineralMotor Vehicles
Tobacco, BeveragesRubber/PlasticsMetal Products
Machinery VariousElectrical Machinery
Transport EquipmentPrecision Instruments
Wood Prod, FurnituresChemicals
Comunication Equip.Basic Metals
Petroleum ProductsPaper Prod, PublishingMining and Metal Ores
Office MachineriesOil, Gas, Coal
Average Tariffs, by Sector
2008 2015
Source: UNCTAD calculations based on UN COMTRADE and UNCTAD TRAINS data
Figure 4
Trade weighted average tariffs, by region, broad category and sector
Key Statistics and Trends in Trade Policy 2016
UNCTAD | Division on International Trade in Goods and Services, and Commodities
9
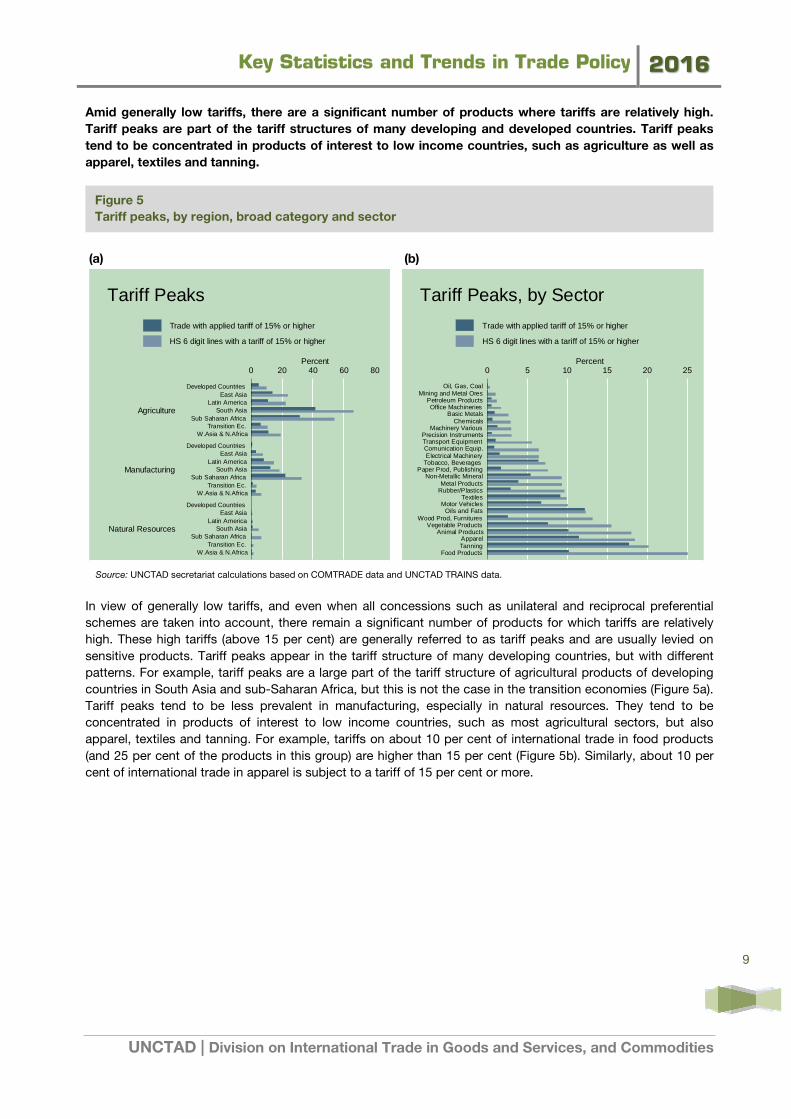
Amid generally low tariffs, there are a significant number of products where tariffs are relatively high.
Tariff peaks are part of the tariff structures of many developing and developed countries. Tariff peaks
tend to be concentrated in products of interest to low income countries, such as agriculture as well as
apparel, textiles and tanning.
(a) (b)
Source: UNCTAD secretariat calculations based on COMTRADE data and UNCTAD TRAINS data.
In view of generally low tariffs, and even when all concessions such as unilateral and reciprocal preferential
schemes are taken into account, there remain a significant number of products for which tariffs are relatively
high. These high tariffs (above 15 per cent) are generally referred to as tariff peaks and are usually levied on
sensitive products. Tariff peaks appear in the tariff structure of many developing countries, but with different
patterns. For example, tariff peaks are a large part of the tariff structure of agricultural products of developing
countries in South Asia and sub-Saharan Africa, but this is not the case in the transition economies (Figure 5a).
Tariff peaks tend to be less prevalent in manufacturing, especially in natural resources. They tend to be
concentrated in products of interest to low income countries, such as most agricultural sectors, but also
apparel, textiles and tanning. For example, tariffs on about 10 per cent of international trade in food products
(and 25 per cent of the products in this group) are higher than 15 per cent (Figure 5b). Similarly, about 10 per
cent of international trade in apparel is subject to a tariff of 15 per cent or more.
0 20 40 60 80Percent
Natural Resources
Manufacturing
Agriculture
W.Asia & N.AfricaTransition Ec.
Sub Saharan AfricaSouth Asia
Latin AmericaEast Asia
Developed Countries
W.Asia & N.AfricaTransition Ec.
Sub Saharan AfricaSouth Asia
Latin AmericaEast Asia
Developed Countries
W.Asia & N.AfricaTransition Ec.
Sub Saharan AfricaSouth Asia
Latin AmericaEast Asia
Developed Countries
Tariff Peaks
Trade with applied tariff of 15% or higher
HS 6 digit lines with a tariff of 15% or higher
Source: UNCTAD calculations based on UN COMTRADE and UNCTAD TRAINS data
0 5 10 15 20 25Percent
Food ProductsTanningApparel
Animal ProductsVegetable Products
Wood Prod, FurnituresOils and Fats
Motor VehiclesTextiles
Rubber/PlasticsMetal Products
Non-Metallic MineralPaper Prod, Publishing
Tobacco, BeveragesElectrical MachineryComunication Equip.Transport EquipmentPrecision Instruments
Machinery VariousChemicals
Basic MetalsOffice Machineries
Petroleum ProductsMining and Metal Ores
Oil, Gas, Coal
Tariff Peaks, by Sector
Trade with applied tariff of 15% or higher
HS 6 digit lines with a tariff of 15% or higher
Source: UNCTAD calculations based on UN COMTRADE and UNCTAD TRAINS data
Figure 5
Tariff peaks, by region, broad category and sector

Key Statistics and Trends in Trade Policy 2016
UNCTAD | Division on International Trade in Goods and Services, and Commodities
10
Tariff escalation remains a feature of the tariff regimes of both developed and developing countries. It is
more pervasive in manufacturing products than in agriculture. Tariff escalation is prevalent in most
sectors, including those of importance (e.g. apparel) to developing countries.
(a) (b)
Source: UNCTAD secretariat calculations based on COMTRADE data and UNCTAD TRAINS data.
Tariff escalation – the practice of imposing higher tariffs on consumer (finished) products than on intermediates
and raw materials – is present in the tariff structure of many countries. This practice favours processing
industries closer to consumers, while discouraging the undertaking of processing activities in countries where
raw materials originate. Most developing and developed countries adopt escalating tariff structures, but to
varying degrees. Tariff escalation is more pervasive in manufacturing products than in agriculture (Figure 6a).
Indeed, the tariff structure of countries in South Asia, West Asia and North Africa is not escalating in the
agricultural sector. Tariff escalation is prevalent in most sectors, including those of importance to developing
countries: apparel, animal products, tanning and many light manufacturing sectors (Figure 6b).
0 10 20 30Percent
Manufacturing
Agriculture
W.Asia & N.Africa
Transition Ec.
Sub Saharan Africa
South Asia
Latin America
East Asia
Developed Countries
W.Asia & N.Africa
Transition Ec.
Sub Saharan Africa
South Asia
Latin America
East Asia
Developed Countries
Tariff Escalation
Primary Intermediate Consumer
Source: UNCTAD calculations based on UN COMTRADE and UNCTAD TRAINS data
0 2 4 6 8 10Percent
Non-Metallic MineralTanningApparelTextiles
Animal ProductsTransport EquipmentTobacco, Beverages
Food ProductsMetal Products
Electrical MachineryVegetable Products
Oils and FatsMachinery Various
Rubber/PlasticsComunication Equip.
Wood Prod, FurnituresMotor Vehicles
Paper Prod, PublishingChemicals
Precision InstrumentsOffice Machineries
Petroleum ProductsOil, Gas, Coal
Mining and Metal OresBasic Metals
Tariff Escalation, by Sector
Primary Intermediate Consumer
Source: UNCTAD calculations based on UN COMTRADE and UNCTAD TRAINS data
Figure 6
Tariff escalation by region, broad category and sector
Key Statistics and Trends in Trade Policy 2016
UNCTAD | Division on International Trade in Goods and Services, and Commodities
11
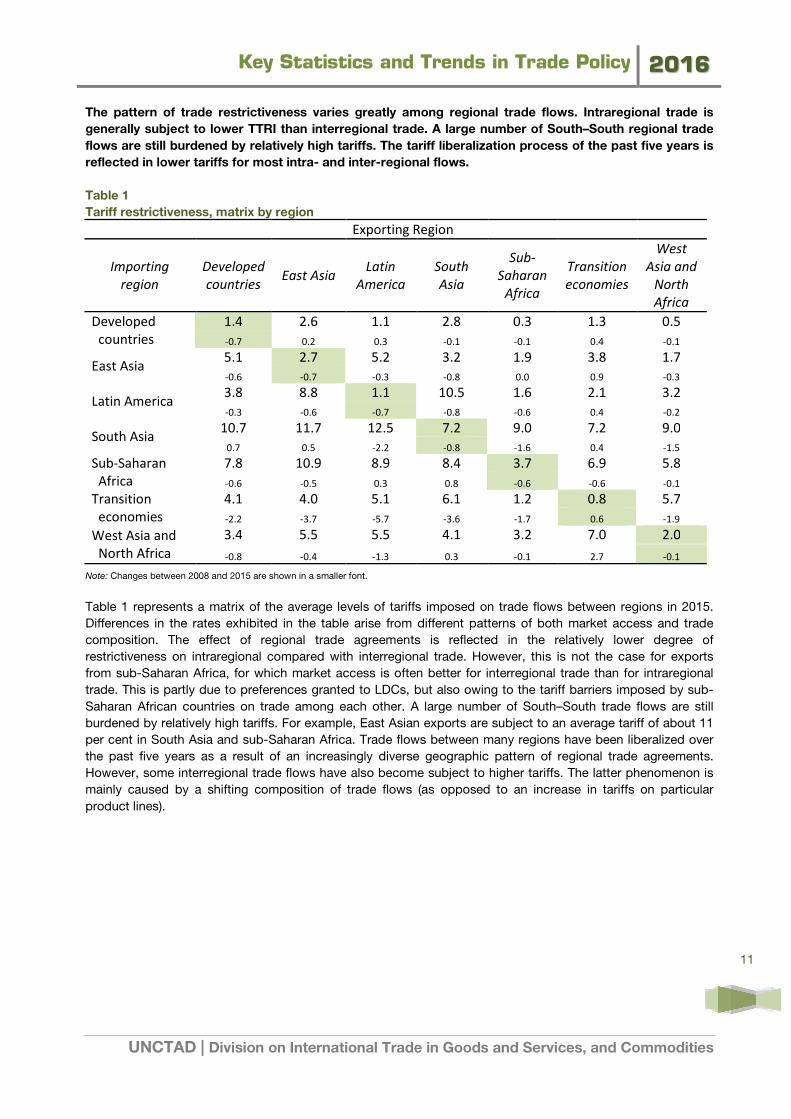
The pattern of trade restrictiveness varies greatly among regional trade flows. Intraregional trade is
generally subject to lower TTRI than interregional trade. A large number of South–South regional trade
flows are still burdened by relatively high tariffs. The tariff liberalization process of the past five years is
reflected in lower tariffs for most intra- and inter-regional flows.
Table 1
Tariff restrictiveness, matrix by region
Exporting Region
Importing
region
Developed
countries East Asia
Latin
America
South
Asia
Sub-
Saharan
Africa
Transition
economies
West
Asia and
North
Africa
Developed
countries
1.4 2.6 1.1 2.8 0.3 1.3 0.5
-0.7 0.2 0.3 -0.1 -0.1 0.4 -0.1
East Asia 5.1 2.7 5.2 3.2 1.9 3.8 1.7
-0.6 -0.7 -0.3 -0.8 0.0 0.9 -0.3
Latin America 3.8 8.8 1.1 10.5 1.6 2.1 3.2
-0.3 -0.6 -0.7 -0.8 -0.6 0.4 -0.2
South Asia 10.7 11.7 12.5 7.2 9.0 7.2 9.0
0.7 0.5 -2.2 -0.8 -1.6 0.4 -1.5
Sub-Saharan
Africa
7.8 10.9 8.9 8.4 3.7 6.9 5.8
-0.6 -0.5 0.3 0.8 -0.6 -0.6 -0.1
Transition
economies
4.1 4.0 5.1 6.1 1.2 0.8 5.7
-2.2 -3.7 -5.7 -3.6 -1.7 0.6 -1.9
West Asia and
North Africa
3.4 5.5 5.5 4.1 3.2 7.0 2.0
-0.8 -0.4 -1.3 0.3 -0.1 2.7 -0.1
Note: Changes between 2008 and 2015 are shown in a smaller font.
Table 1 represents a matrix of the average levels of tariffs imposed on trade flows between regions in 2015.
Differences in the rates exhibited in the table arise from different patterns of both market access and trade
composition. The effect of regional trade agreements is reflected in the relatively lower degree of
restrictiveness on intraregional compared with interregional trade. However, this is not the case for exports
from sub-Saharan Africa, for which market access is often better for interregional trade than for intraregional
trade. This is partly due to preferences granted to LDCs, but also owing to the tariff barriers imposed by sub-
Saharan African countries on trade among each other. A large number of South–South trade flows are still
burdened by relatively high tariffs. For example, East Asian exports are subject to an average tariff of about 11
per cent in South Asia and sub-Saharan Africa. Trade flows between many regions have been liberalized over
the past five years as a result of an increasingly diverse geographic pattern of regional trade agreements.
However, some interregional trade flows have also become subject to higher tariffs. The latter phenomenon is
mainly caused by a shifting composition of trade flows (as opposed to an increase in tariffs on particular
product lines).

Key Statistics and Trends in Trade Policy 2016
UNCTAD | Division on International Trade in Goods and Services, and Commodities
12
The system of tariff preferences affects international competitiveness by providing various countries
with different market access conditions. Because trade agreements are often regional, the system of
preferences tends to favour regional trade over interregional trade. Still, the magnitude of the effect of
preferences differs widely across regions. Latin American countries enjoy the highest preferential
margins in trading with regional partners, estimated at about 4.3 percentage points.
Table 2
Relative preferential margins, matrix by region
Exporting region
Importing
region
Developed
countries East Asia
Latin
America
South
Asia
Sub-
Saharan
Africa
Transition
economies
West
Asia and
North
Africa
Developed
countries
0.4 -1.1 0.8 -0.5 0.3 -0.5 0.2
0.1 -0.3 0.4 0.4 0.2 -0.3 0.0
East Asia -0.4 0.5 -0.8 -0.2 -0.4 -0.7 -0.4
0.0 0.2 -0.8 -0.1 -0.3 -0.6 -0.3
Latin America 0.3 -1.7 4.3 -3.5 -0.7 -1.0 -0.9
-0.7 0.9 -0.1 -0.7 0.1 -0.5 0.1
South Asia -0.4 -0.1 -0.1 2.0 -0.2 -0.1 -0.1
-0.2 -0.2 -0.1 0.5 -0.1 0.0 0.0
Sub-Saharan
Africa
0.1 -0.9 -1.0 -0.9 3.2 -0.2 -0.5
0.7 0.9 0.0 -0.2 0.6 0.6 -0.1
Transition
economies
-0.6 0.3 0.3 -1.2 0.4 2.9 -1.1
0.0 1.3 0.6 -0.5 0.4 -0.2 -0.2
West Asia and
North Africa
0.3 -1.1 -0.7 -0.9 -0.3 -1.5 2.0
0.2 0.1 0.0 -0.1 -0.2 -0.6 -0.2
Note: Changes between 2008 and 2015 are shown in a smaller font.
Table 2 reports relative preferential margins (RPMs) calculated at the regional level for 2015 and their changes
since 2008. RPMs provide a measure of the average preferential margin for a given country by taking into
consideration any preference provided by its trading partners to foreign competitors. RPMs can be positive or
negative, depending on the advantage or disadvantage a country has in terms of preferences with respect to
other competing exporters. The RPM is exactly zero when there is no discrimination; it is largest for Latin
American countries which enjoy about a 4.3 percentage point advantage on foreign competitors when trading
within their region. On the other hand, the system of preferences provides only half of a percentage point
advantage to East Asian countries trading in their own region. With very few exceptions, interregional trade
faces a negative RPM, suggesting that the tariff structure negatively impacts non-regional exporters’
competitiveness. The least favoured are exporters of South Asia and East Asia seeking to trade with Latin
America. For sub-Saharan exporters, the effects of the system of preferences for interregional trade are often
negligible.
Key Statistics and Trends in Trade Policy 2016
UNCTAD | Division on International Trade in Goods and Services, and Commodities
13
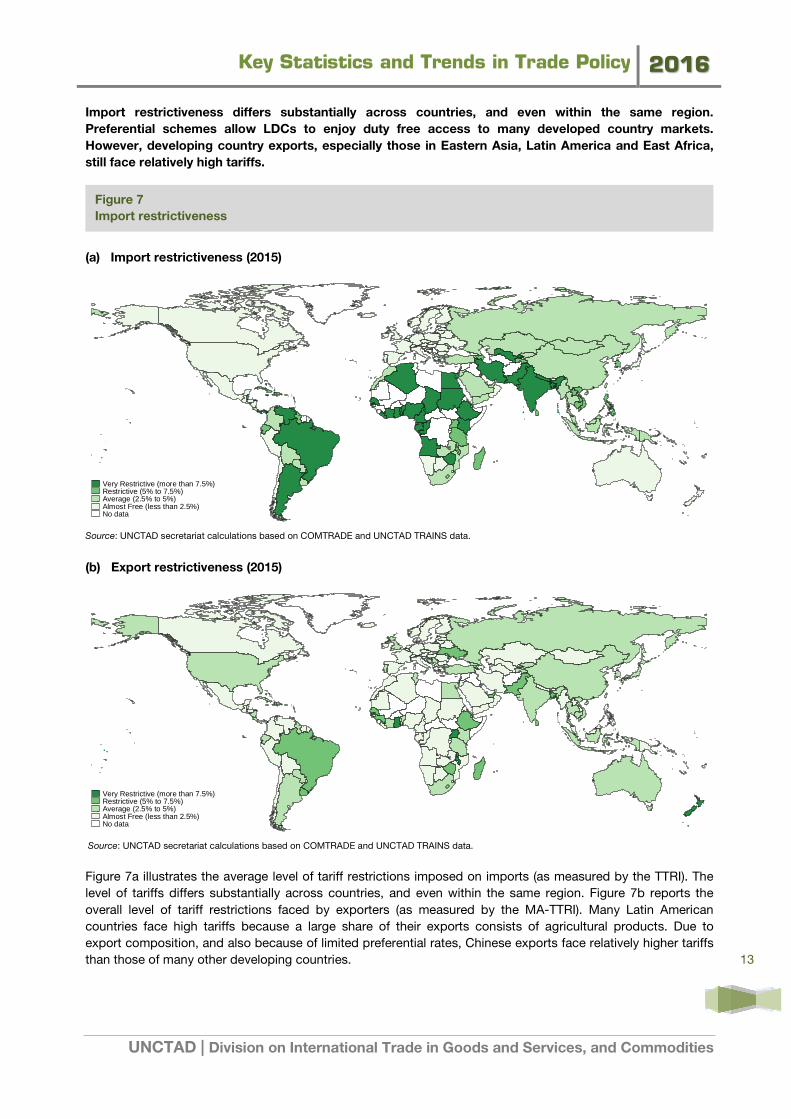
Import restrictiveness differs substantially across countries, and even within the same region.
Preferential schemes allow LDCs to enjoy duty free access to many developed country markets.
However, developing country exports, especially those in Eastern Asia, Latin America and East Africa,
still face relatively high tariffs.
(a) Import restrictiveness (2015)
Source: UNCTAD secretariat calculations based on COMTRADE and UNCTAD TRAINS data.
(b) Export restrictiveness (2015)
Source: UNCTAD secretariat calculations based on COMTRADE and UNCTAD TRAINS data.
Figure 7a illustrates the average level of tariff restrictions imposed on imports (as measured by the TTRI). The
level of tariffs differs substantially across countries, and even within the same region. Figure 7b reports the
overall level of tariff restrictions faced by exporters (as measured by the MA-TTRI). Many Latin American
countries face high tariffs because a large share of their exports consists of agricultural products. Due to
export composition, and also because of limited preferential rates, Chinese exports face relatively higher tariffs
than those of many other developing countries.
Very Restrictive (more than 7.5%)Restrictive (5% to 7.5%)Average (2.5% to 5%)Almost Free (less than 2.5%)No data
Very Restrictive (more than 7.5%)Restrictive (5% to 7.5%)Average (2.5% to 5%)Almost Free (less than 2.5%)No data
Figure 7
Import restrictiveness

Key Statistics and Trends in Trade Policy 2016
UNCTAD | Division on International Trade in Goods and Services, and Commodities
14
2. TRADE AGREEMENTS
The international trading system is regulated by an increasing number of preferential trade agreements
(PTAs). Most of the recent trade agreements address not only goods but also services, and deal with
rules beyond reciprocal tariff concessions. In 2015 about half of world trade was taking place between
countries that had signed a PTA, and one third was regulated by deep trade agreements.
(a) (b)
Source: UNCTAD secretariat calculations based on WTO RTAIS data. Source: UNCTAD secretariat calculations based on WTO RTAIS data and COMTRADE data.
Figure 8a illustrates the number of PTAs that have been in force in each year since 2005. The number of PTAs
in force has approximately doubled from less than 150 in 2005 to almost 290 in 2015. This upward trend is
likely to continue, as additional PTAs are still in the negotiation phase and likely to be implemented in the next
few years. About half of all trade agreements in force go beyond tariff concessions, to cover services and
behind-the border measures. Although the number of PTAs has increased dramatically, the percentage of trade
taking place under PTAs has not increased as much (Figure 8b). Still, even without considering trade within the
European Union, about one third of world trade took place under deep trade agreements (i.e. those with trade
rules going beyond traditional tariffs and existing WTO agreements, to cover deeper behind-the-border
measures) in 2015. Almost 10 per cent of world trade was covered by trade agreements limited to preferential
access, and about 7 per cent was under unilateral preferences such as the ones provided by developed
countries to LDCs.
0
50
100
150
PT
As
in F
orce
2005 2006 2007 2008 2009 2010 2011 2012 2013 2014 2015
Trade Agreements
Goods only Goods and Services
Source: UNCTAD calculations based on WTO RTAIS data
0
10
20
30
40
50
Per
cent
age
2005 2006 2007 2008 2009 2010 2011 2012 2013 2014 2015
Trade under PTAs
Deep Ag. Bilateral Pref. Unilateral Pref.
Source: UNCTAD calculations based on WTO RTAIS and UN COMTRADE data
Figure 8
Trade agreements
Key Statistics and Trends in Trade Policy 2016
UNCTAD | Division on International Trade in Goods and Services, and Commodities
15
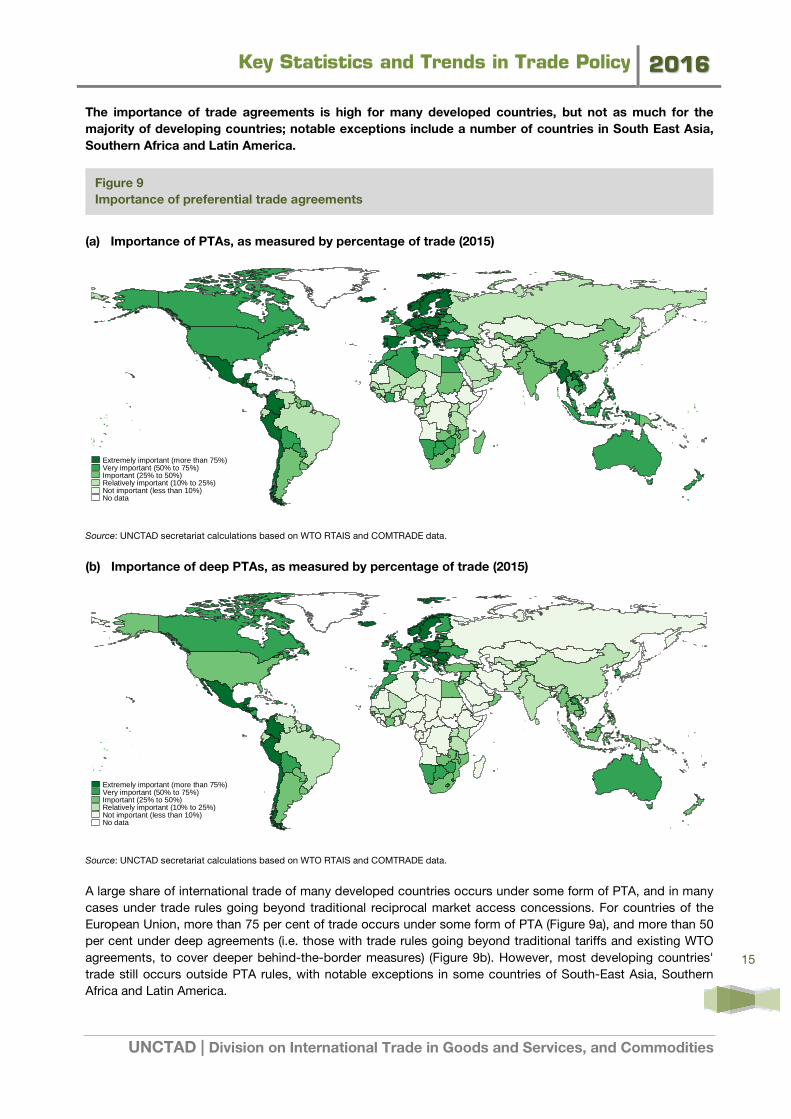
The importance of trade agreements is high for many developed countries, but not as much for the
majority of developing countries; notable exceptions include a number of countries in South East Asia,
Southern Africa and Latin America.
(a) Importance of PTAs, as measured by percentage of trade (2015)
Source: UNCTAD secretariat calculations based on WTO RTAIS and COMTRADE data.
(b) Importance of deep PTAs, as measured by percentage of trade (2015)
Source: UNCTAD secretariat calculations based on WTO RTAIS and COMTRADE data.
A large share of international trade of many developed countries occurs under some form of PTA, and in many
cases under trade rules going beyond traditional reciprocal market access concessions. For countries of the
European Union, more than 75 per cent of trade occurs under some form of PTA (Figure 9a), and more than 50
per cent under deep agreements (i.e. those with trade rules going beyond traditional tariffs and existing WTO
agreements, to cover deeper behind-the-border measures) (Figure 9b). However, most developing countries'
trade still occurs outside PTA rules, with notable exceptions in some countries of South-East Asia, Southern
Africa and Latin America.
Extremely important (more than 75%)Very important (50% to 75%)Important (25% to 50%)Relatively important (10% to 25%)Not important (less than 10%)No data
Extremely important (more than 75%)Very important (50% to 75%)Important (25% to 50%)Relatively important (10% to 25%)Not important (less than 10%)No data
Figure 9
Importance of preferential trade agreements

Key Statistics and Trends in Trade Policy 2016
UNCTAD | Division on International Trade in Goods and Services, and Commodities
16
Trade agreements result in different degrees of policy space across countries. Developed countries and
economies in transition tend to have very limited policy space, as most tariff lines are bound by WTO
obligations with little tariff water. Policy space within WTO is greater for sub-Saharan African countries,
and lower-income countries in general. Once PTAs are accounted for, a substantial amount of trade is
locked under preferential tariffs, which in turn means that the amount of "true" tariff water in many
cases is less than half of the WTO binding overhang.
(a) Tariff water (2015)
(b) True tariff water (2015)
Figure 10a portrays the average tariff water (trade weighed) calculated as the difference between WTO bound
tariffs and applied MFN tariffs. Policy space within WTO is greater for developing countries, especially those of
lower income status. Figure 10b portrays the average tariff water calculated as the difference between bound
and applied tariffs, taking into account the implicit bindings imposed by both WTO and PTA commitments.
Countries that have a large share of trade under preferential commitments and/or have low true tariff water
cannot raise their tariffs without infringing WTO or PTA commitments.
Most constrained (less than 5%)Very constrained (5% to 10%)Constrained (10% to 20%)Slightly constrained (20% to 30%)Not constrained (more than 30%)No data
Most constrained (less than 5%)Very constrained (5% to 10%)Constrained (10% to 20%)Slightly constrained (20% to 30%)Not constrained (more than 30%)No data
Figure 10
Policy space: Multilateral constraints
Key Statistics and Trends in Trade Policy 2016
UNCTAD | Division on International Trade in Goods and Services, and Commodities
17
3. NON-TARIFF MEASURES
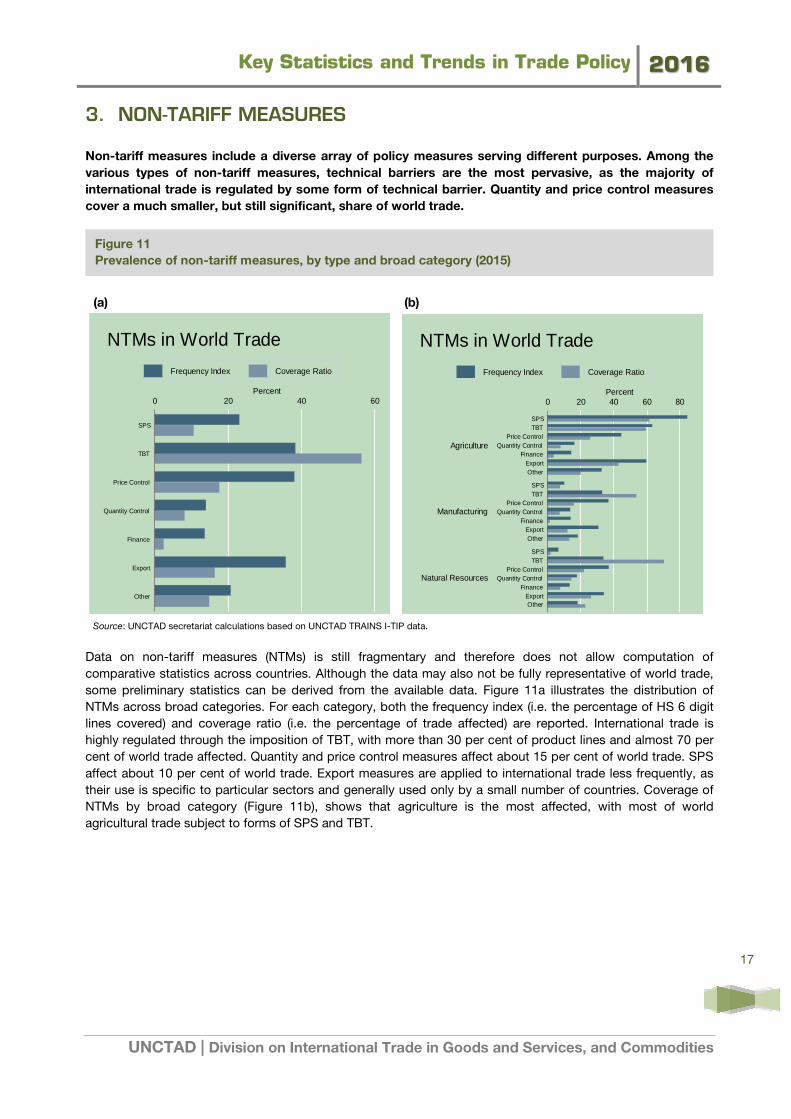
Non-tariff measures include a diverse array of policy measures serving different purposes. Among the
various types of non-tariff measures, technical barriers are the most pervasive, as the majority of
international trade is regulated by some form of technical barrier. Quantity and price control measures
cover a much smaller, but still significant, share of world trade.
(a) (b)
Source: UNCTAD secretariat calculations based on UNCTAD TRAINS I-TIP data.
Data on non-tariff measures (NTMs) is still fragmentary and therefore does not allow computation of
comparative statistics across countries. Although the data may also not be fully representative of world trade,
some preliminary statistics can be derived from the available data. Figure 11a illustrates the distribution of
NTMs across broad categories. For each category, both the frequency index (i.e. the percentage of HS 6 digit
lines covered) and coverage ratio (i.e. the percentage of trade affected) are reported. International trade is
highly regulated through the imposition of TBT, with more than 30 per cent of product lines and almost 70 per
cent of world trade affected. Quantity and price control measures affect about 15 per cent of world trade. SPS
affect about 10 per cent of world trade. Export measures are applied to international trade less frequently, as
their use is specific to particular sectors and generally used only by a small number of countries. Coverage of
NTMs by broad category (Figure 11b), shows that agriculture is the most affected, with most of world
agricultural trade subject to forms of SPS and TBT.
0 20 40 60Percent
Other
Export
Finance
Quantity Control
Price Control
TBT
SPS
NTMs in World Trade
Frequency Index Coverage Ratio
Source: UNCTAD calculations based on UNCTAD TRAINS I-TIP data
0 20 40 60 80Percent
Natural Resources
Manufacturing
Agriculture
OtherExport
FinanceQuantity Control
Price ControlTBTSPS
OtherExport
FinanceQuantity Control
Price ControlTBTSPS
OtherExport
FinanceQuantity Control
Price ControlTBTSPS
NTMs in World Trade
Frequency Index Coverage Ratio
Source: UNCTAD calculations based on UNCTAD TRAINS I-TIP data
Figure 11
Prevalence of non-tariff measures, by type and broad category (2015)
Key Statistics and Trends in Trade Policy 2016
UNCTAD | Division on International Trade in Goods and Services, and Commodities
18
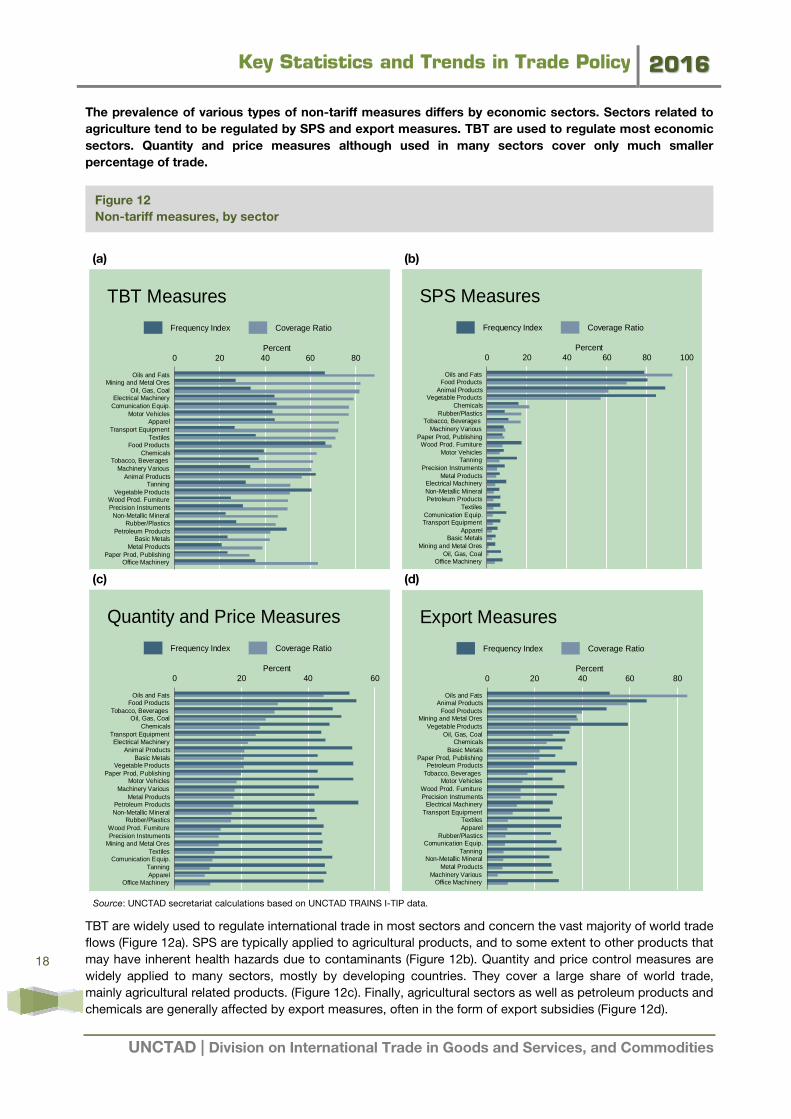
The prevalence of various types of non-tariff measures differs by economic sectors. Sectors related to
agriculture tend to be regulated by SPS and export measures. TBT are used to regulate most economic
sectors. Quantity and price measures although used in many sectors cover only much smaller
percentage of trade.
(a) (b)
(c) (d)
Source: UNCTAD secretariat calculations based on UNCTAD TRAINS I-TIP data.
TBT are widely used to regulate international trade in most sectors and concern the vast majority of world trade
flows (Figure 12a). SPS are typically applied to agricultural products, and to some extent to other products that
may have inherent health hazards due to contaminants (Figure 12b). Quantity and price control measures are
widely applied to many sectors, mostly by developing countries. They cover a large share of world trade,
mainly agricultural related products. (Figure 12c). Finally, agricultural sectors as well as petroleum products and
chemicals are generally affected by export measures, often in the form of export subsidies (Figure 12d).
0 20 40 60 80Percent
Office MachineryPaper Prod, Publishing
Metal ProductsBasic Metals
Petroleum ProductsRubber/Plastics
Non-Metallic MineralPrecision InstrumentsWood Prod. Furniture
Vegetable ProductsTanning
Animal ProductsMachinery Various
Tobacco, BeveragesChemicals
Food ProductsTextiles
Transport EquipmentApparel
Motor VehiclesComunication Equip.Electrical Machinery
Oil, Gas, CoalMining and Metal Ores
Oils and Fats
TBT Measures
Frequency Index Coverage Ratio
0 20 40 60 80 100Percent
Office MachineryOil, Gas, Coal
Mining and Metal OresBasic Metals
ApparelTransport EquipmentComunication Equip.
TextilesPetroleum ProductsNon-Metallic MineralElectrical Machinery
Metal ProductsPrecision Instruments
TanningMotor Vehicles
Wood Prod. FurniturePaper Prod, Publishing
Machinery VariousTobacco, Beverages
Rubber/PlasticsChemicals
Vegetable ProductsAnimal Products
Food ProductsOils and Fats
SPS Measures
Frequency Index Coverage Ratio
Source: UNCTAD calculations based on UNCTAD TRAINS I-TIP data
0 20 40 60Percent
Office MachineryApparelTanning
Comunication Equip.Textiles
Mining and Metal OresPrecision InstrumentsWood Prod. Furniture
Rubber/PlasticsNon-Metallic MineralPetroleum Products
Metal ProductsMachinery Various
Motor VehiclesPaper Prod, Publishing
Vegetable ProductsBasic Metals
Animal ProductsElectrical Machinery
Transport EquipmentChemicals
Oil, Gas, CoalTobacco, Beverages
Food ProductsOils and Fats
Quantity and Price Measures
Frequency Index Coverage Ratio
Source: UNCTAD calculations based on UNCTAD TRAINS I-TIP data
0 20 40 60 80Percent
Office MachineryMachinery Various
Metal ProductsNon-Metallic Mineral
TanningComunication Equip.
Rubber/PlasticsApparelTextiles
Transport EquipmentElectrical Machinery
Precision InstrumentsWood Prod. Furniture
Motor VehiclesTobacco, BeveragesPetroleum Products
Paper Prod, PublishingBasic Metals
ChemicalsOil, Gas, Coal
Vegetable ProductsMining and Metal Ores
Food ProductsAnimal Products
Oils and Fats
Export Measures
Frequency Index Coverage Ratio
Source: UNCTAD calculations based on UNCTAD TRAINS I-TIP data
Figure 12
Non-tariff measures, by sector

Key Statistics and Trends in Trade Policy 2016
UNCTAD | Division on International Trade in Goods and Services, and Commodities
19
The regulatory framework related to technical non-tariff measures (SPS and TBT) differs across
countries. The use of technical measures tends to be more pervasive in the European Union, China,
Brazil and Australia and less so in many low-income countries. Developed countries' use of technical
non-tariff measures tends to be more targeted to specific products. This applies also to China and
Brazil. Other developing countries tend to use technical non-tariff measures in a more homogenous
manner.
(a) Technical non-tariff measures, relative intensity across countries (2015)
Source: UNCTAD secretariat calculations based on UNCTAD TRAINS I-TIP data.
(b) Technical non-tariff measures, intensity across products (2015)
Source: UNCTAD secretariat calculations based on UNCTAD TRAINS I-TIP data.
The use of TBT and SPS differs across countries. To capture the diverse use of non-technical measures across
countries Figure 13a illustrates an intensity. This index is computed by calculating the difference between the
number of non-technical measures applied by a given country in each product and the average number of
measures applied to that product. Then, country averages are computed by weighing each product by its
importance in world trade. Figure 13b reports the standard deviation of product level differences within each
country. This illustrates whether non-technical measures tend to be uniformly applied across products or are
applied with different intensity across products.
More than averageAverageLess than averageNo data
Differently AppliedAverageUniformly AppliedNo data
Figure 13
Technical non-tariff measures, by country
Key Statistics and Trends in Trade Policy 2016
UNCTAD | Division on International Trade in Goods and Services, and Commodities
20
4. TRADE DEFENCE MEASURES
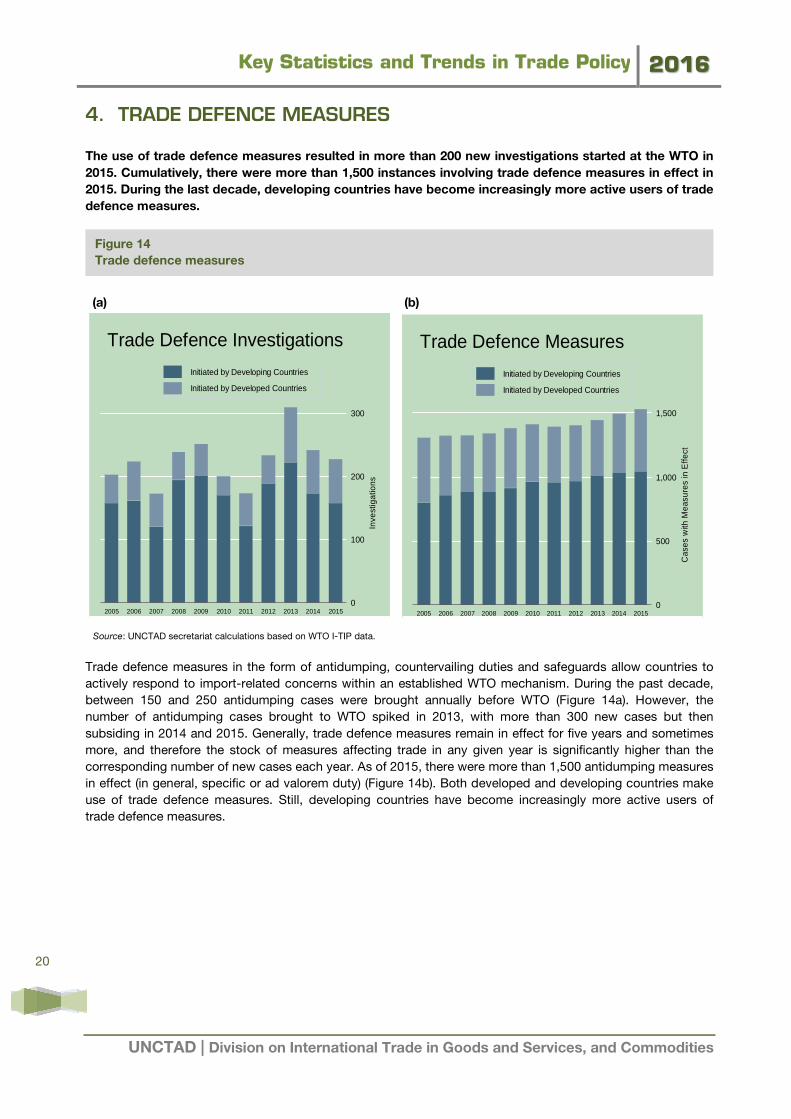
The use of trade defence measures resulted in more than 200 new investigations started at the WTO in
2015. Cumulatively, there were more than 1,500 instances involving trade defence measures in effect in
2015. During the last decade, developing countries have become increasingly more active users of trade
defence measures.
(a) (b)
Source: UNCTAD secretariat calculations based on WTO I-TIP data.
Trade defence measures in the form of antidumping, countervailing duties and safeguards allow countries to
actively respond to import-related concerns within an established WTO mechanism. During the past decade,
between 150 and 250 antidumping cases were brought annually before WTO (Figure 14a). However, the
number of antidumping cases brought to WTO spiked in 2013, with more than 300 new cases but then
subsiding in 2014 and 2015. Generally, trade defence measures remain in effect for five years and sometimes
more, and therefore the stock of measures affecting trade in any given year is significantly higher than the
corresponding number of new cases each year. As of 2015, there were more than 1,500 antidumping measures
in effect (in general, specific or ad valorem duty) (Figure 14b). Both developed and developing countries make
use of trade defence measures. Still, developing countries have become increasingly more active users of
trade defence measures.
0
100
200
300
Inve
stig
atio
ns
2005 2006 2007 2008 2009 2010 2011 2012 2013 2014 2015
Trade Defence Investigations
Initiated by Developing Countries
Initiated by Developed Countries
Source: UNCTAD Calculations based on WTO I-TIP database
0
500
1,000
1,500
Cas
es w
ith M
easu
res
in E
ffect
2005 2006 2007 2008 2009 2010 2011 2012 2013 2014 2015
Trade Defence Measures
Initiated by Developing Countries
Initiated by Developed Countries
Figure 14
Trade defence measures

Key Statistics and Trends in Trade Policy 2016
UNCTAD | Division on International Trade in Goods and Services, and Commodities
21
The use and impact of trade defence measures vary greatly across countries. Trade defence measures
are imposed mainly by developed and emerging economies, and are largely targeted against products
originating from China, the European Union and the United States.
(a) Trade defence measures in effect, by imposing country (2015)
Source: UNCTAD secretariat calculations based on WTO I-TIP data.
(b) Trade defence measures in effect, by targeted country (2015)
Source: UNCTAD secretariat calculations based on WTO I-TIP data.
Most cases relating to trade defence measures are brought to WTO by major economies. The main users of
such measures include India, the United States, the European Union, China and, more recently, Turkey, Brazil
and Argentina (Figure 15a). China is by far the most targeted county with more than 400 measures in effect as
of 2015 (Figure 15b). A large number of trade defence measures are also imposed against the European Union,
the United States and India.
Very active use (more than 200)Active use (100 to 200)Average use (50 to 100)Limited use (25 to 50)Very limited use (less than 25)No use
Very frequently targeted (more than 200)Frequently targeted (100 to 200)Often targeted (50 to 100)Occasionally targeted (less than 50)Never targeted
Figure 15
Trade defence measures in effect, by country
Key Statistics and Trends in Trade Policy 2016
UNCTAD | Division on International Trade in Goods and Services, and Commodities
22
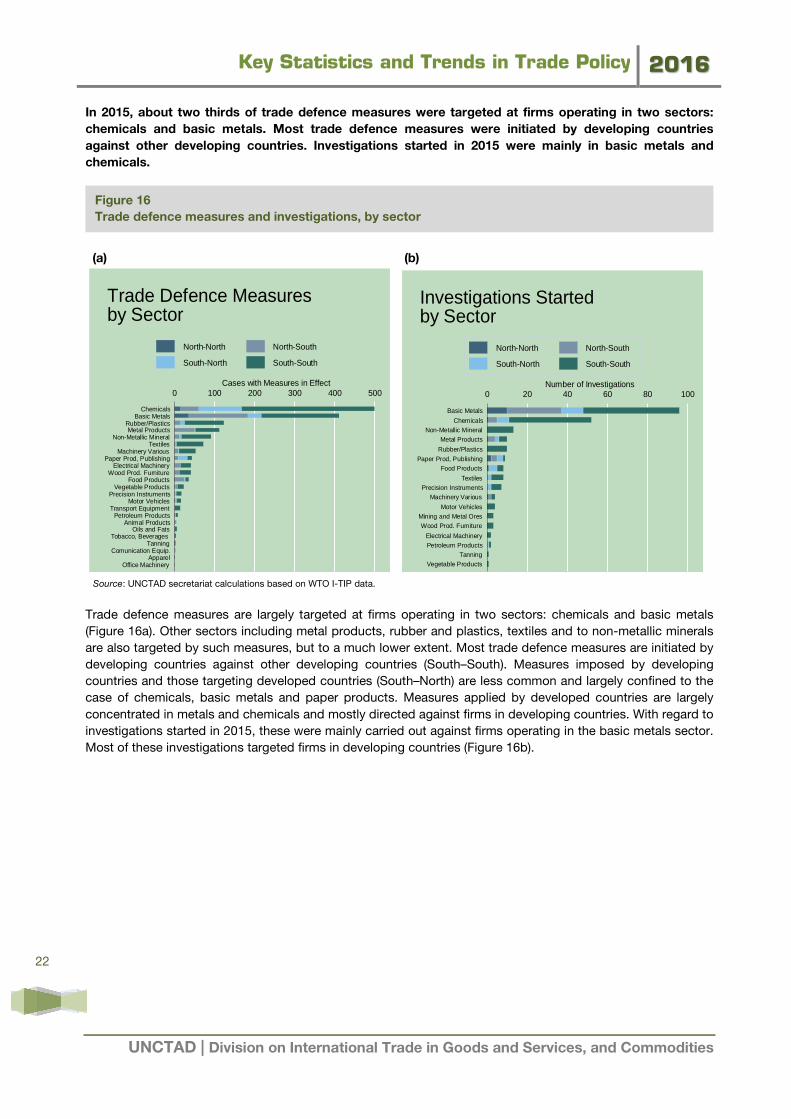
In 2015, about two thirds of trade defence measures were targeted at firms operating in two sectors:
chemicals and basic metals. Most trade defence measures were initiated by developing countries
against other developing countries. Investigations started in 2015 were mainly in basic metals and
chemicals.
(a) (b)
Source: UNCTAD secretariat calculations based on WTO I-TIP data.
Trade defence measures are largely targeted at firms operating in two sectors: chemicals and basic metals
(Figure 16a). Other sectors including metal products, rubber and plastics, textiles and to non-metallic minerals
are also targeted by such measures, but to a much lower extent. Most trade defence measures are initiated by
developing countries against other developing countries (South–South). Measures imposed by developing
countries and those targeting developed countries (South–North) are less common and largely confined to the
case of chemicals, basic metals and paper products. Measures applied by developed countries are largely
concentrated in metals and chemicals and mostly directed against firms in developing countries. With regard to
investigations started in 2015, these were mainly carried out against firms operating in the basic metals sector.
Most of these investigations targeted firms in developing countries (Figure 16b).
0 100 200 300 400 500Cases with Measures in Effect
Office MachineryApparel
Comunication Equip.Tanning
Tobacco, BeveragesOils and Fats
Animal ProductsPetroleum Products
Transport EquipmentMotor Vehicles
Precision InstrumentsVegetable Products
Food ProductsWood Prod. Furniture
Electrical MachineryPaper Prod, Publishing
Machinery VariousTextiles
Non-Metallic MineralMetal Products
Rubber/PlasticsBasic Metals
Chemicals
Trade Defence Measuresby Sector
North-North North-South
South-North South-South
Source: UNCTAD calculations based on WTO I-TIP database
0 20 40 60 80 100Number of Investigations
Vegetable ProductsTanning
Petroleum ProductsElectrical Machinery
Wood Prod. FurnitureMining and Metal Ores
Motor Vehicles
Machinery VariousPrecision Instruments
Textiles
Food ProductsPaper Prod, Publishing
Rubber/Plastics
Metal ProductsNon-Metallic Mineral
Chemicals
Basic Metals
Investigations Startedby Sector
North-North North-South
South-North South-South
Source: UNCTAD calculations based on WTO I-TIP database
Figure 16
Trade defence measures and investigations, by sector

Key Statistics and Trends in Trade Policy 2016
UNCTAD | Division on International Trade in Goods and Services, and Commodities
23
5. EXCHANGE RATES
As measured by the real effective exchange rate, changes in external competitiveness have been
diverse across countries. The United States' competitiveness has declined, while that of the European
Union and Japan has increased. In regard to developing countries, Brazil and South Africa have seen
their competitiveness increase, while China's competitiveness has decreased. In 2015, the external
competitiveness of China and the United States declined further.
(a) REER changes between 2010 and 2015
Source: UNCTAD secretariat calculations based on IMF financial statistics.
(b) REER changes between 2014 and 2015
Source: UNCTAD secretariat calculations based on IMF financial statistics.
The real effective exchange rate (REER) is a measure of the trade-weighted average exchange rate of a
currency against a basket of currencies after adjusting for inflation differentials (consumer price index). It
measures external competitiveness. In general, an appreciation in the REER results in a loss of
competitiveness, while a decline in the REER indicates an increase in external competitiveness.
Very strong appreciation (more than 20%)Appreciation (5% to 20%)No substnatial change (up to 5%)Depreciation (5% to 20%)Strong depreciation (more than 20%)No data
Very strong appreciation (more than 20%)Appreciation (5% to 20%)No substnatial change (up to 5%)Depreciation (5% to 20%)Strong depreciation (more than 20%)No data
Figure 17
International competitiveness, real effective exchange rate

Key Statistics and Trends in Trade Policy 2016
UNCTAD | Division on International Trade in Goods and Services, and Commodities
24
Movements in the nominal exchange rates versus the dollar can play a substantial role in determining
the competitiveness of countries. Since 2010, with the notable exception of China, most currencies
depreciated against the dollar, sometimes substantially. The dollar remained strong during 2015, with
most currencies further depreciating.
(a) Exchange rates changes vs US dollar (2010-2015)
Source: UNCTAD secretariat calculations based on IMF financial statistics.
(b) Exchange rates changes vs US dollar (2014-2015)
Source: UNCTAD secretariat calculations based on IMF financial statistics.
As international trade transactions are generally in dollars, appreciation and depreciations against the dollar
can play a substantial role in the competitiveness of countries. Figures 18a and 18b portray the percentage
change in nominal exchange rates of world currencies against the dollar between 2010 and 2015, and between
2014 and 2015, respectively (annual average).
Very strong appreciation (more than 20%)Appreciation (5% to 20%)No substnatial change (up to 5%)Depreciation (5% to 20%)Strong depreciation (more than 20%)No data
Very strong appreciation (more than 20%)Appreciation (5% to 20%)No substnatial change (up to 5%)Depreciation (5% to 20%)Strong depreciation (more than 20%)No data
Figure 18
Change in the nominal exchange rate vs US dollar
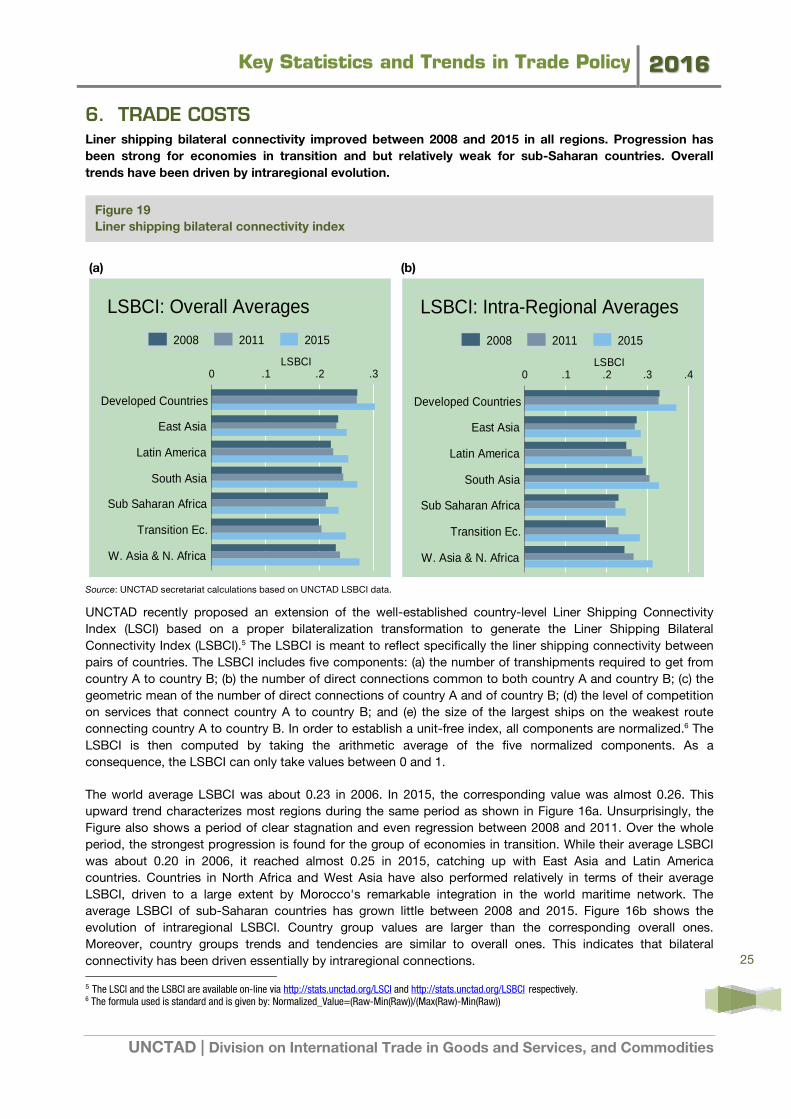
Key Statistics and Trends in Trade Policy 2016
UNCTAD | Division on International Trade in Goods and Services, and Commodities
25
6. TRADE COSTS Liner shipping bilateral connectivity improved between 2008 and 2015 in all regions. Progression has
been strong for economies in transition and but relatively weak for sub-Saharan countries. Overall
trends have been driven by intraregional evolution.
(a) (b)
Source: UNCTAD secretariat calculations based on UNCTAD LSBCI data.
UNCTAD recently proposed an extension of the well-established country-level Liner Shipping Connectivity
Index (LSCI) based on a proper bilateralization transformation to generate the Liner Shipping Bilateral
Connectivity Index (LSBCI).5 The LSBCI is meant to reflect specifically the liner shipping connectivity between
pairs of countries. The LSBCI includes five components: (a) the number of transhipments required to get from
country A to country B; (b) the number of direct connections common to both country A and country B; (c) the
geometric mean of the number of direct connections of country A and of country B; (d) the level of competition
on services that connect country A to country B; and (e) the size of the largest ships on the weakest route
connecting country A to country B. In order to establish a unit-free index, all components are normalized.6 The
LSBCI is then computed by taking the arithmetic average of the five normalized components. As a
consequence, the LSBCI can only take values between 0 and 1.
The world average LSBCI was about 0.23 in 2006. In 2015, the corresponding value was almost 0.26. This
upward trend characterizes most regions during the same period as shown in Figure 16a. Unsurprisingly, the
Figure also shows a period of clear stagnation and even regression between 2008 and 2011. Over the whole
period, the strongest progression is found for the group of economies in transition. While their average LSBCI
was about 0.20 in 2006, it reached almost 0.25 in 2015, catching up with East Asia and Latin America
countries. Countries in North Africa and West Asia have also performed relatively in terms of their average
LSBCI, driven to a large extent by Morocco's remarkable integration in the world maritime network. The
average LSBCI of sub-Saharan countries has grown little between 2008 and 2015. Figure 16b shows the
evolution of intraregional LSBCI. Country group values are larger than the corresponding overall ones.
Moreover, country groups trends and tendencies are similar to overall ones. This indicates that bilateral
connectivity has been driven essentially by intraregional connections. 5 The LSCI and the LSBCI are available on-line via http://stats.unctad.org/LSCI and http://stats.unctad.org/LSBCI respectively. 6 The formula used is standard and is given by: Normalized_Value=(Raw-Min(Raw))/(Max(Raw)-Min(Raw))
0 .1 .2 .3LSBCI
W. Asia & N. Africa
Transition Ec.
Sub Saharan Africa
South Asia
Latin America
East Asia
Developed Countries
Source: UNCTAD calculations based on UNCTAD LSBCI data
LSBCI: Overall Averages
2008 2011 2015
0 .1 .2 .3 .4LSBCI
W. Asia & N. Africa
Transition Ec.
Sub Saharan Africa
South Asia
Latin America
East Asia
Developed Countries
LSBCI: Intra-Regional Averages
2008 2011 2015
Figure 19
Liner shipping bilateral connectivity index


unctad.org/tab
Phot
o cr
edit:
Fot
olia
©St
auke
, ©so
leg,
©UN
Pho
to b
y FA
O/G
Torto
li
Printed at United Nations, Geneva – 1703028 (E) – February 2017 – 236 – UNCTAD/DITC/TAB/2016/2