key trends in us specialty pharmacy and access
TRANSCRIPT

Key Trends in US Specialty Pharmacy and Access Payer Perspectives and Developer Strategies, 2020-23
Isha Bangia PhamD MBA, Manager, US Market Access, Certara (New Jersey)
Ulrich Neumann FRSA, MBA, MSC MA, Senior Director & Head, US Access & Commercial Strategy, Certara (New York)
We would like to acknowledge the research of Maximilian Vargas, PhD MBA and thank both him, and Barbara Pannone, PhD for her instructive edits and feedback as well as Bill Weir for substantive copy review. Corresponding author: Ulrich Neumann at Certara, 295 Madison Avenue, 23rd Floor, New York, NY 10017. Email: [email protected]
2
Report OverviewWelcome to the 2020 trends report.
To allow for the optimal positioning of your product, portfolio or company, it is critical to understand the various forces that shape the US specialty access landscape. For the last two decades, our team has been tracking a wide range of critical market access developments. Certara clients rely on tested playbooks to help them navigate complex and competitive situations such as:
• Increasing volume control over prescribed therapies by various payer types
• Tighter formularies and stricter utilization management
• Provider incentives shifting away from volume, physicians’ flexibility to make Rx decisions
• Increased patient exposure to out-of-pocket cost burden
• Consolidation in the site-of-care landscape and payer cost shifting strategies
• Rising complexity of reimbursement-relevant coding and billing procedures depending on setting/site of administration
• Growing payer ability to leverage biosimilar entrants and therapeutic alternatives across crowded drug classes
We usually look at how these forces shape the landscape for individual product or portfolio access. This report shares some of the broader and more ubiquitous market trends we have uncovered in our engagement with Certara’s ‘Compass Expert Panel’, a leading proprietary database of formulary decision makers in health plans, PBMs, hospitals/IDNs and channels influencing access, including specialty pharmacy, GPOs. Ready for rapid deployment, it is updated in real time and, to date, has been leveraged across hundreds of strategic projects in life sciences.
We are convinced that the range of topics discussed in this report will pique your interest and hopefully, encourage you to dig deeper. All of these are more than just trends. Successful developers need awareness of their individual context and strategic foresight in order to thrive in an environment that gets more complex every day. We are specifically including a section on future policies, some of which offer a drastic redesign of the current landscape described in the earlier chapters of the report. To enable decision-making in the face of ever more uncertainty, our consultants specialize in scientific value story development, pro-active policy and payer engagement, as well as multi-faceted go-to-market and distribution strategies.
Our team would be thrilled to schedule a personal consultation to discuss what these insights may mean for your product or pipeline asset. Please feel free to reach out.

3
Research Methodology
Guidance on Document Use, Important Terms, and Abbreviations
• Using Certara’s Compass research network, we conducted an online survey among active voting members of P&T committees in US managed care organizations (MCOs), followed by a set of semi-structured interviews for further interpretation and probing of key trends. In-depth interviews often help to clarify the gap between expressions in survey research and reality on the ground.
• A targeted literature review was conducted to contextualize the research in the current landscape of the specialty pharmacy category.
• Of 31 respondents, 19 were pharmacy directors and 12 were medical directors. These payers represent a total of 198.8M US lives (169.6M Commercial and 29.2M Medicare
lives). All 31 respondents were responsible for Commercial lives and 25 of the 31 responsible for Medicare as well.
• Respondents were comprised of national (n=17) and regional health plans (n=14), pharmacy benefit managers (PBMs; n=7) and integrated delivery networks (IDNs; n=6).
• MCOs were also categorized by size, based on the number of covered lives, into large, mid-sized and small health plans
• Small plans: <920,000 lives; n=7 plans
• Mid-sized/medium plans: (≥920,000 lives and <3.4M lives) (n=8 plans)
• Large plans: (≥3.4M lives) (n=11 plans)
• PBMs: 59.5M lives (6 unique organizations)
• IDNs: 24.4M lives (6 unique organizations)
• Small plans: 3.4M lives (7 unique plans; includes PBMs and IDNs)
• Mid-sized/medium plans: 13.5M lives (8 unique plans; includes PBMs and IDNs)
• Large plans: 182M lives (11 unique plans; includes PBMs and IDNs).
• Parts of the analysis presented in this report have been accepted for publication as posters by the American Academy of Managed Care Pharmacy (AMCP) in 2020, one of which has been awarded a prestigious gold ribbon in professional review.1,2
ACO Accountable care organization
AMA American Medical Association
AAFP American Academy of Family Physicians
AMCP Academy of Managed Care Pharmacy
CMS Center for Medicare and Medicaid Services
ESI Express Scripts
FDA Food and Drug Administration
HHS Department of Health and Human Services
ICER Institute for Clinical and Economic Review
IDN Integrated delivery network
MAPD Medicare Advantage plan
MCO Managed care organization
OBA Outcomes-based agreements
OIG Office of Inspector General
OMB Office of Management and Budget
P&T Pharmacy & Therapeutics
PA Prior authorization
PBM Pharmacy benefit manager
Rx Prescription
SME Small molecular entities
SPP Specialty pharmacy provider
UM Utilization management
US United States
LIST OF ABBREVIATIONS Limitations
The estimates and findings in this report are based on a qualitative research methodology. Throughout this report, the numbers of covered Commercial and Medicare lives per health plan type are reported to illustrate and provide a deeper understanding of the research findings. The numbers of reported lives are approximations provided by research respondents.
Certara has not accounted for any overlap in covered lives between health plans. As such, findings on the trends we document should be considered indicative rather than conclusive.

The Shifting Landscape ofSpecialty Coverage

5
Market Context
Research Methodology
• No universally accepted definition exists for specialty pharmaceuticals. Most refer to high-costa complex therapies often used for chronic conditions which require special monitoring, dose adjustments, special distribution and administration (self- or physician-administered injectables) practices.
• While larger, injectable, protein-based molecules (known as biologics) are most likely going to be specialty drugs, we note that roughly half of all specialty sales are still small molecular entities.4
• Covering the range of $10,000 to $7,000,000 per patient annually, specialty drugs are understood to be higher priced therapies accounting for half of all US pharmaceutical spending roughly evenly split between the medical and the pharmacy benefit categories.5,6
• The FDA has approved over 140 new specialty drugs since 2013 and approximately two-thirds of the 48 novel therapies approved in 2019 were specialty drugs.7,8 About 60% of new molecular entities awaiting FDA approval through 2021 can be
classified as specialty pharmaceuticals9 as late stage pipelines are dominated by specialty therapies led by oncology indications and niche products across a range of classes.
a >$670 sponsor-negotiated price per Medicare standards for 20193
Figure 1.
Pharmaceutical spending since 2015
6
Market Context
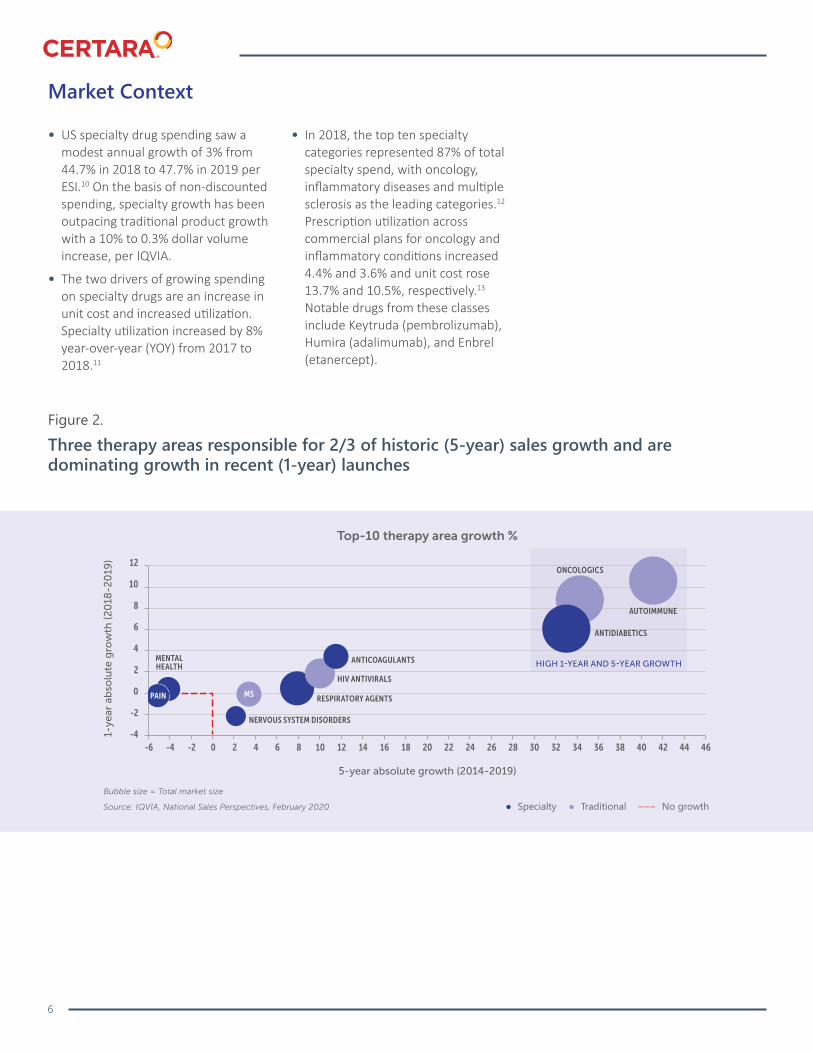
• US specialty drug spending saw a modest annual growth of 3% from 44.7% in 2018 to 47.7% in 2019 per ESI.10 On the basis of non-discounted spending, specialty growth has been outpacing traditional product growth with a 10% to 0.3% dollar volume increase, per IQVIA.
• The two drivers of growing spending on specialty drugs are an increase in unit cost and increased utilization. Specialty utilization increased by 8% year-over-year (YOY) from 2017 to 2018.11
• In 2018, the top ten specialty categories represented 87% of total specialty spend, with oncology, inflammatory diseases and multiple sclerosis as the leading categories.12 Prescription utilization across commercial plans for oncology and inflammatory conditions increased 4.4% and 3.6% and unit cost rose 13.7% and 10.5%, respectively.13 Notable drugs from these classes include Keytruda (pembrolizumab), Humira (adalimumab), and Enbrel (etanercept).
Figure 2.
Three therapy areas responsible for 2/3 of historic (5-year) sales growth and are dominating growth in recent (1-year) launches
7
Key Market Trends
With respect to their management of the specialty category, the top 3 challenges noted by payers outside of rising cost are:
The increased utilization and expanded indications of drugs(cited by 15%)
A large number of rare diseaseproducts (13%)
Entry of one-time treatments such as gene therapies (12%)
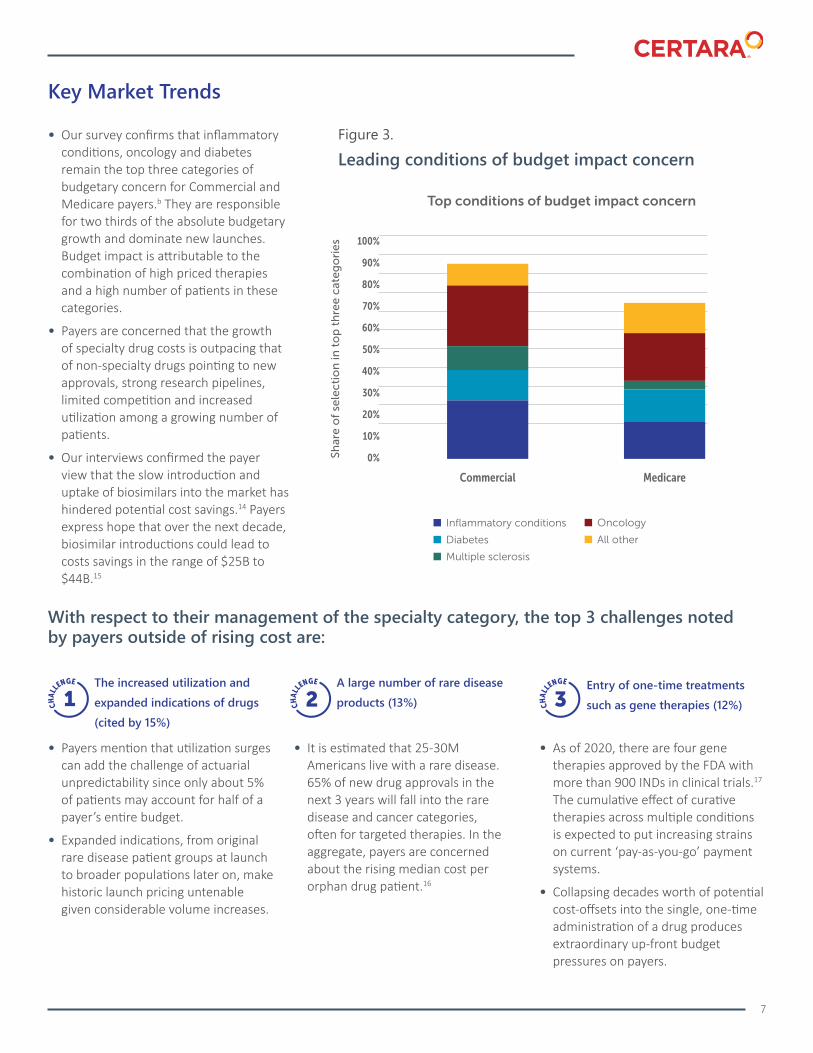
• Our survey confirms that inflammatory conditions, oncology and diabetes remain the top three categories of budgetary concern for Commercial and Medicare payers.b They are responsible for two thirds of the absolute budgetary growth and dominate new launches. Budget impact is attributable to the combination of high priced therapies and a high number of patients in these categories.
• Payers are concerned that the growth of specialty drug costs is outpacing that of non-specialty drugs pointing to new approvals, strong research pipelines, limited competition and increased utilization among a growing number of patients.
• Our interviews confirmed the payer view that the slow introduction and uptake of biosimilars into the market has hindered potential cost savings.14 Payers express hope that over the next decade, biosimilar introductions could lead to costs savings in the range of $25B to $44B.15
• Payers mention that utilization surges can add the challenge of actuarial unpredictability since only about 5% of patients may account for half of a payer’s entire budget.
• Expanded indications, from original rare disease patient groups at launch to broader populations later on, make historic launch pricing untenable given considerable volume increases.
• It is estimated that 25-30M Americans live with a rare disease. 65% of new drug approvals in the next 3 years will fall into the rare disease and cancer categories, often for targeted therapies. In the aggregate, payers are concerned about the rising median cost per orphan drug patient.16
• As of 2020, there are four gene therapies approved by the FDA with more than 900 INDs in clinical trials.17 The cumulative effect of curative therapies across multiple conditions is expected to put increasing strains on current ‘pay-as-you-go’ payment systems.
• Collapsing decades worth of potential cost-offsets into the single, one-time administration of a drug produces extraordinary up-front budget pressures on payers.
Figure 3.
Leading conditions of budget impact concern

8
With respect to their management of the specialty category, payers also see these top three opportunities:
The increased utilization and expanded indications of drugs(cited by 15%)
A large number of rare diseaseproducts (13%)
Entry of one-time treatments such as gene therapies (12%)
• Traditionally, there has been little to no contracting for medical benefit products but that may be changing as systems evolve to incorporate pharmacy benefit strategies.
• As more clinically undifferentiated products (like biosimilars) enter a category, there are more opportunities to contract for preferred access.
• Utilization management tactics remain the focal point for payers in managing spend in the specialty category and are expanding in most areas.
• Payers are determined to become more restrictive across the board with different tactics to contain costs.
• Payers express a strong desire to manage the medical benefit like the pharmacy benefit and increasingly integrate coverage decisions across both categories. In shifting the medical benefit to parity with the pharmacy benefit, they hope to draw more heavily on UM tactics such as product exclusions and preferred products.
• No longer protected from cost containment, the medical benefit is now subject to the type of restrictions once limited to pharmacy benefit drugs.18 Payers reiterate that a key medical management objective is to move specialty infusions towards the lowest cost site of service.19
Managed market success requires the tactical employment of a growing set of commercial partners. In today’s market, patient access and therapy use become a product of comprehensive employment of hubs, ‘wrap-around’ services, patient assistance and ‘quick-start’ programs. Interestingly, those are moving from specialty and orphan drugs to increasingly ‘hub’-lite areas like chronic care.
– PAUL GALLAGHER, Vice President, US Access Strategy, Certara
“
”Patient cost-sharing as leading response strategy• Payers listed “increased cost-sharing” as
the leading strategy to finance specialty therapeutics across 50% of Commercial and 30% of Medicare lives overall.
• 42% of respondentsc have currently implemented cost-sharing for greater than 70% of covered Commercial lives. For the future, 67%d of payers report they are likely to have implemented a cost-sharing strategy across Commercial lives.
• On the Medicare side, 35%e
of respondents have currently implemented cost-sharing for greater than 70% of covered lives. In the future, 48%f are likely to use cost-sharing.
• Mid-sized plans (≥920,000 and <3.4M covered lives) draw on increased costsharing for 70-90% of Commercial lives while regional plans are nearly twice as likely as larger, national plans to expand it further. On the Medicare side, regional plans are four times more likely to utilize cost-sharing than national plans.
c n=13; representing 49.7M Commercial lives
d n=21 representing 107.4M Commercial lives
e n=11 representing 3.2M Medicare lives
f n=15, representing 9M Medicare lives
42%OF RESPONDENTS HAVE CURRENTLY
IMPLEMENTED COST-SHARING
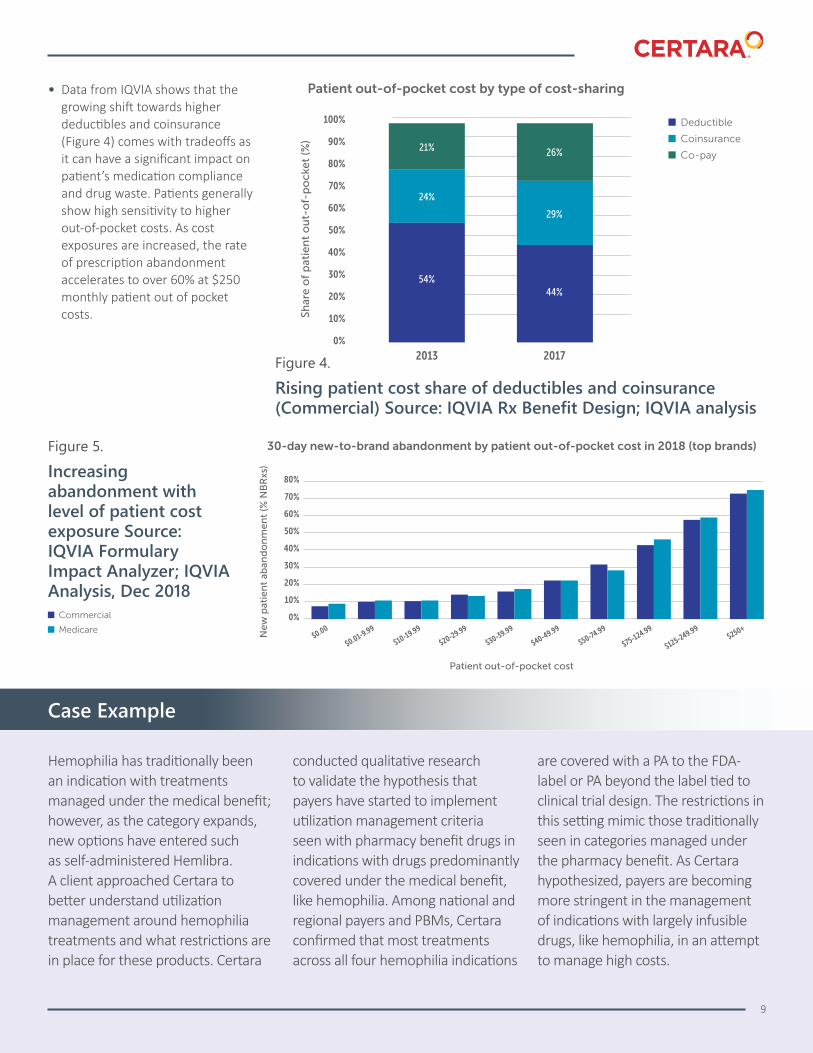
• Data from IQVIA shows that the growing shift towards higher deductibles and coinsurance (Figure 4) comes with tradeoffs as it can have a significant impact on patient’s medication compliance and drug waste. Patients generally show high sensitivity to higher out-of-pocket costs. As cost exposures are increased, the rate of prescription abandonment accelerates to over 60% at $250 monthly patient out of pocket costs.
Figure 4.
Rising patient cost share of deductibles and coinsurance (Commercial) Source: IQVIA Rx Benefit Design; IQVIA analysis
Figure 5.
Increasing abandonment with level of patient cost exposure Source: IQVIA Formulary Impact Analyzer; IQVIA Analysis, Dec 2018
Hemophilia has traditionally been an indication with treatments managed under the medical benefit; however, as the category expands, new options have entered such as self-administered Hemlibra. A client approached Certara to better understand utilization management around hemophilia treatments and what restrictions are in place for these products. Certara
conducted qualitative research to validate the hypothesis that payers have started to implement utilization management criteria seen with pharmacy benefit drugs in indications with drugs predominantly covered under the medical benefit, like hemophilia. Among national and regional payers and PBMs, Certara confirmed that most treatments across all four hemophilia indications
are covered with a PA to the FDA-label or PA beyond the label tied to clinical trial design. The restrictions in this setting mimic those traditionally seen in categories managed under the pharmacy benefit. As Certara hypothesized, payers are becoming more stringent in the management of indications with largely infusible drugs, like hemophilia, in an attempt to manage high costs.
Case Example
9
Utilization ManagementRestrictions

11
KEY TRENDS WITH RESPECT TO UTILIZATION MANAGEMENT (UM) REACH ACROSS EIGHT AREAS
Prior authorizations limiting to populations narrower than label approved indication
Evidence-based pathways promoted to specify drug use
“Brand A before Brand B”step edits expanded
Quantity restrictions
Split-fill program
Reauthorization criteria based onimproved clinical response to drug
Designate preferred medical benefit specialty products
Medical benefit products excluded
Figure 6.
Average level of UM tactics in 2020, as estimated by Commercial and Medicare payers

12
Prior authorizations and reauthorizations
• Payers limit drug utilization to populations narrower than the FDA approved indication based on clinical study design. Restrictions beyond the FDA label make the PA process more rigorous and limit use of specialty medications.
• Payers require confirmation of clinical response to drug as renewal criteria. These reauthorization criteria are used by payers to ensure that continued use of a product is warranted. Evidence of clinical response to treatments is often required at annual or six-month intervals.
Current State
• 55% of surveyed payersg utilize PAs beyond the label for an estimated 70% or more of their Commercial and Medicare lives.
• 70% of payers from PBMsh and 50% of IDNsi implement PAs beyond the label for at least 70% covered Commercial lives.
• According to the Kaiser Family Foundation, 72% of beneficiaries with Medicare Advantage require a prior authorization for Part B drugs.20 We find that 35% of payers are implementing a narrow PA for 70% (or more) Medicare lives.
• Two-thirds of payersj utilize reauthorization criteria based on improved clinical response to drug for at least 70% of Commercial lives including 86% of PBMsk, 80% of small and mid-sized plansl, 66% of IDNsm, and 56% of larger MCO plans.
Figure 7.
Customary steps in the prior authorization 21
g n=17, representing 34.3M Commercial lives
h n=5, representing 24.8M Commercial lives
i n=3, representing 1.1M Commercial lives
j n=21, representing 145.4M Commercial lives
k n=7, representing 57.3M Commercial lives
l n=15, representing 10.9M Commercial lives
m n=6, representing 5.1M Commercial lives
n n=9, representing 135.5M Commercial lives
13
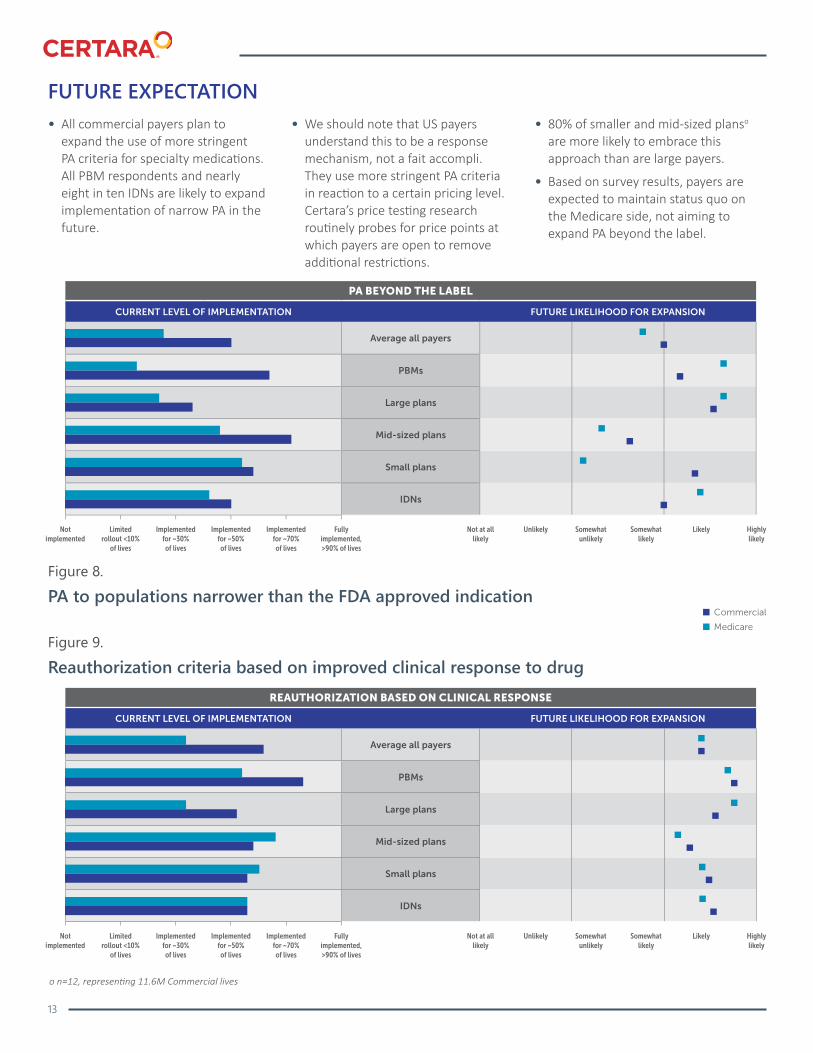
FUTURE EXPECTATION• All commercial payers plan to
expand the use of more stringent PA criteria for specialty medications. All PBM respondents and nearly eight in ten IDNs are likely to expand implementation of narrow PA in the future.
• We should note that US payers understand this to be a response mechanism, not a fait accompli. They use more stringent PA criteria in reaction to a certain pricing level. Certara’s price testing research routinely probes for price points at which payers are open to remove additional restrictions.
• 80% of smaller and mid-sized planso are more likely to embrace this approach than are large payers.
• Based on survey results, payers are expected to maintain status quo on the Medicare side, not aiming to expand PA beyond the label.
Figure 8.
PA to populations narrower than the FDA approved indication
Figure 9.
Reauthorization criteria based on improved clinical response to drug
o n=12, representing 11.6M Commercial lives
14
• There will be a 62% increase in the number of payers using reauthorization criteria for Medicare lives, up from 42% to 68% of payers.
• Nearly 9 in 10 commercial payers are likely to expand future use of reauthorization criteria as a means for cost containment.
• While PAs and reauthorizations are seen as an effective means for cost containment and reduction of drug waste from the payer perspective, they do increase the treatment burden for patients, providers and developers from an access perspective.
Provider burden
• According to the American Medical Association (AMA), 9 in 10 physicians find that prior authorizations have a
negative impact on patient outcomes and believe the burden associated with PAs has increased over the past 5 years.23 79% of physicians report that they sometimes, often or always have to submit medication reauthorizations when a patient with a chronic condition is stabilized.24
• Most of Certara’s physician research engagements are aimed to give a nuanced perspective on the level of disruption or burden of the administrative procedure that is associated with PA. It depends on various factors such as provider type, indication, type (e.g. soft, or requiring lab values etc.) and associated requirements (e.g. step edits).
Patient burden
• Nearly 8 in 10 physicians find that PAs may result in patients stopping treatment and sometimes lead to treatment abandonment.25
• 9 in 10 physicians report that PAs cause delays in patient care.26,27
• PAs also impact therapeutic areas with recognized need of treatment personalization. According to a survey among cancer radiologists, 73% report their cancer patients regularly express concern about the delay caused by prior authorizations, forcing a third of doctors to pursue different treatments than the ones indicated just to avoid such delays.28
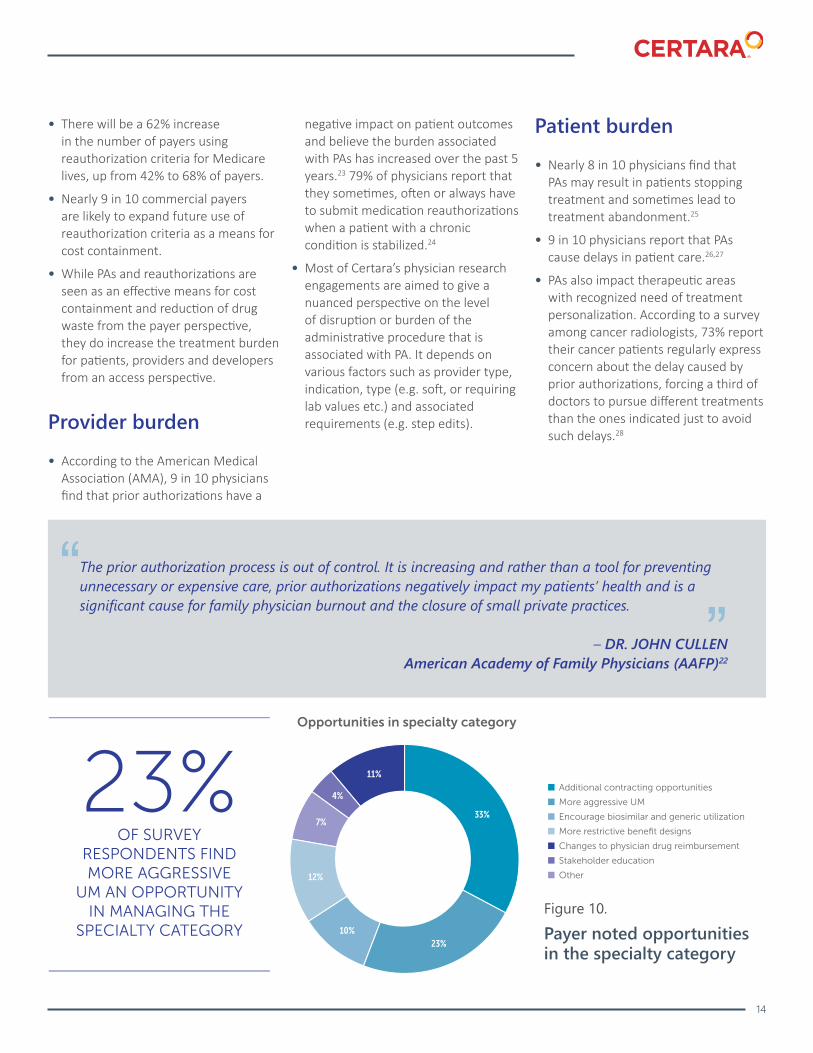
Figure 10.
Payer noted opportunities in the specialty category
The prior authorization process is out of control. It is increasing and rather than a tool for preventing unnecessary or expensive care, prior authorizations negatively impact my patients’ health and is a significant cause for family physician burnout and the closure of small private practices.
– DR. JOHN CULLEN American Academy of Family Physicians (AAFP)22
“”

15
When beneficiaries and providers appealed preauthorization and payment denials, Medicare Advantage Organizations (MAOs) overturned 75 percent of their own denials during 2014–16, overturning approximately 216,000 denials each year. During the same period, independent reviewers at higher levels of the appeals process overturned additional denials in favor of beneficiaries and providers. The high number of overturned denials raises concerns that some Medicare Advantage beneficiaries and providers were initially denied services and payments that should have been provided. This is especially concerning because beneficiaries and providers rarely used the appeals process, which is designed to ensure access to care and payment. During 2014-16, beneficiaries and providers appealed only 1 percent of denials to the first level of appeal.
– HHS OFFICE OF THE INSPECTOR GENERAL, 2018 American Academy of Family Physicians
“
”
CMS concerned about denials in Medicare Advantage
• When the US HHS Office of Inspector General (OIG) ran an audit of Medicare Advantage Plans (operated by private companies commissioned by CMS, many covering prescription drug benefits), it found notable over- and misuse of coverage and payment denials contributing to “physical or financial harm” of beneficiaries.
• CMS confirmed that yearly audits discovered widespread performance issues regarding denials, leading to citations, a variety of fines and sanctions.29
Figure 11.
Challenges encountered in the course of prior authorizationsData from Avalere, Covermymeds, TrialCard, published in: Basta, N.The Prior Authorization Obstacle Course. Pharmaceutical Commerce.https://pharmaceuticalcommerce.com/special-report/hub-services-special-report-2016/. Published March 15, 2016. Accessed April 08. 2020
Restrictive prior authorization practices can cause unnecessary, stressful and potentially life-threatening delays for cancer patients. ... In its current form, prior authorization causes immense anxiety and wastes precious time for cancer patients.
– PROF. PAUL HARARI, MD, FASTRO Chairman of Human Oncology, University of Wisconsin-Madison30
“”
Case Example
16
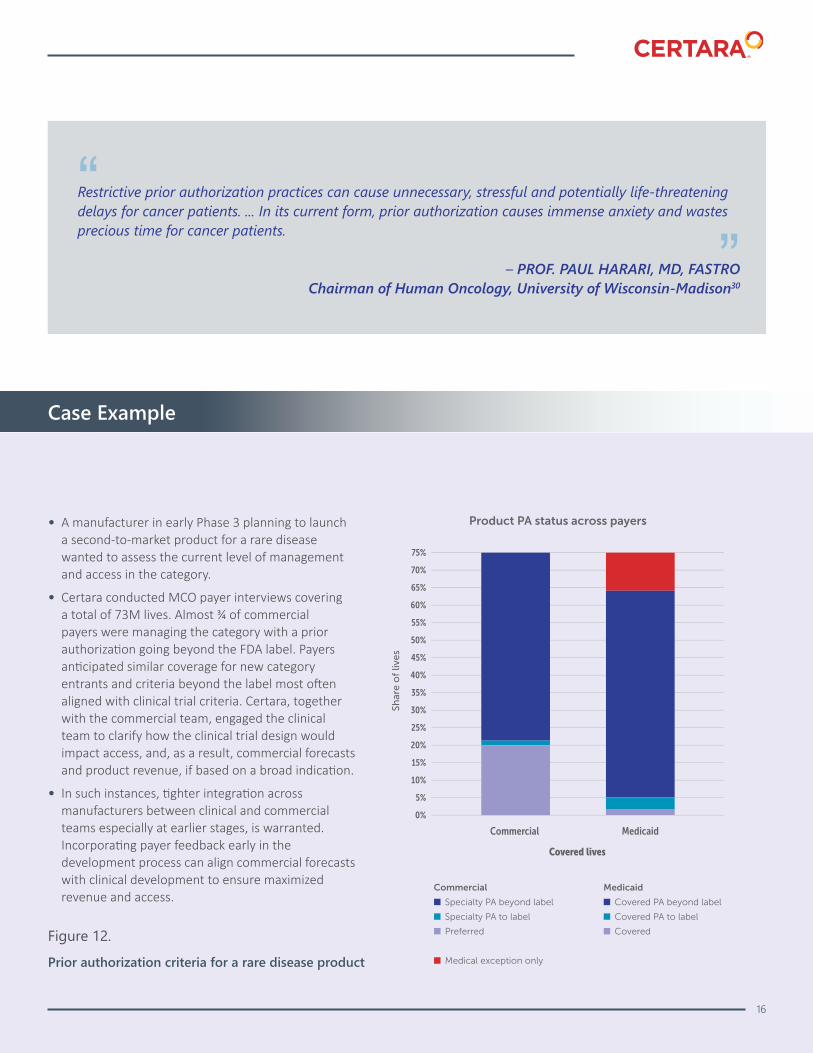
• A manufacturer in early Phase 3 planning to launch a second-to-market product for a rare disease wanted to assess the current level of management and access in the category.
• Certara conducted MCO payer interviews covering a total of 73M lives. Almost ¾ of commercial payers were managing the category with a prior authorization going beyond the FDA label. Payers anticipated similar coverage for new category entrants and criteria beyond the label most often aligned with clinical trial criteria. Certara, together with the commercial team, engaged the clinical team to clarify how the clinical trial design would impact access, and, as a result, commercial forecasts and product revenue, if based on a broad indication.
• In such instances, tighter integration across manufacturers between clinical and commercial teams especially at earlier stages, is warranted. Incorporating payer feedback early in the development process can align commercial forecasts with clinical development to ensure maximized revenue and access.
Figure 12.
Prior authorization criteria for a rare disease product

17
Designating Preferred Specialty Products on the Medical Benefit
CURRENT STATE FUTURE EXPECTATION
• Compared to treatments on the medical benefit, medications covered on the pharmacy benefit traditionally allow payers to have more control on management and utilization.
• Specialty drugs covered on the medical benefit (physician administered) are no longer immune to UM tactics such as product exclusions and designated preferred products as payers try to integrate medical and pharmacy benefits.
• According to Express Scripts data, up to 15% of the specialty spend could be reduced by health plans implementing medical benefit management services.31
• All surveyedp IDNs currently implement preferred medical products for 70% or more lives.
• One in two MCO plansq, regardless of plan size, implements this UM tactic for medical benefit drugs.
• Going forward all payers will likely expand, or in the case of IDNs continue, this model of preferred medical treatments.
• Based on the status quo, we may see more preferred products on PBM and MCO formularies in the coming years.
US health plan sponsors are projected to waste more than $9 billion, or 49% of their total pharmacy spend on specialty medication services that provide no additional value. This wasteful spending could be recovered if payers applied the same cost-saving techniques from the pharmacy benefit on medications that are administered through the medical benefit.
– BRIAN SEIZ PharmD, President
Pharmacy at Express Scripts32
“
”
Figure 13.
Total specialty spend between benefit type Data source: Medicines Use and Spending in the US IMS, April 2016. NHE, Artemetrix, CVS Health Internal Analysis, 2016.
Figure 14.
Designating preferred specialty products
p n=6, representing 18.6M Commercial lives q n=18

18
Increasing Product Exclusions of Specialty Drugs
CURRENT STATE
FUTURE EXPECTATION
• The concept of product exclusions traditionally applied to small-molecule drugs on the pharmacy benefit.
• Payers started introducing product exclusion lists as another UM tool and cost containment strategy. While traditional drug classes see this more than specialty drugs, specialty drugs in rare diseases and on the medical benefit are no longer immune to exclusions.
• The first exclusion list, released by CVS in 2012, only applied to small-molecule non-specialty drugs. In 2017, CVS also began excluding products for rare diseases such as Gleevec and Tasigna for chronic myeloid leukemia (CML), though still on the pharmacy benefit.33,34
• In 2014, ESI started excluding certain specialty products like biologics Cimzia, Simponi, Stelara, Xeljanz for inflammatory indications.35 In 2019, 50 new drugs were excluded including specialty products like Onpattro for polyneuropathy of hereditary transthyretin-mediated amyloidosis. In 2020, ESI is excluding 32 new drugs from its national formulary including specialty products like Factor VIII recombinant products for hemophilia and granulocyte stimulating agents.36
• Other important payers such as Cigna, Aetna, Optum, and Prime Therapeutics also began product exclusions since 2016.37
• We find that there is still overall limited implementation of product exclusions across all payers today with only a quarter of payersr excluding particular specialty products covered on the medical benefit 70% or greater covered Commercial lives.
• 12% of survey respondents consider more restrictive benefit designs a key opportunity in managing specialty pharmaceuticals.
• All payer archetypes anticipate to expand use of this tactic to more covered Commercial lives in the next few years with more than two-thirds of the 31 payer respondents likely to begin excluding particular medical benefit products.
Figure 15.
Number of brand exclusions from PBM formularies Source: Drug Channels Institute. Numbers of Products on PBM Formulary Exclusion Lists, 2012 To 2019.; 2018. https://www.drugchannels.net/2018/08/2019-expressscripts-formula. Accessed April 16, 2020.`
Figure 16.
Exclude particular medical benefit products
r n=8, representing 47.2M Commercial lives s n=21, representing 77.1M Commercial lives

19
Split-fill Programs
• Split-fill (also known as partial fill) programs for oral medications allow payers to reduce medication waste, improve medication adherence and consequently drive down costs.
• AllianceRx Walgreens Prime research found that within the first 3 months of implementing a split-fill program, payers would see savings of $2,724 per month on average for one oral oncology medication. Within the first month, split-fill was associated with a $132.50 lower copay than non-split fills (p<0.007).38
• Split-fill programs showed lower discontinuation rates, pharmacy costs and potential wastage as demonstrated by a study of an oral oncology split fill program in a national specialty pharmacy. Within six months, the Walgreens program saved $2,646.74 monthly in medication wastage.39
• Only about 30% of all payerst have not implemented any split-fill programs for specialty products within their organizations--half of them PBM and IDN payers.
CURRENT STATE
Figure 17.
Monthly mean differences in cost between split-fill and nonsplit-fill
Figure 18.
Split-fill Programs
t n=10, representing 48.8M Commercial lives
20
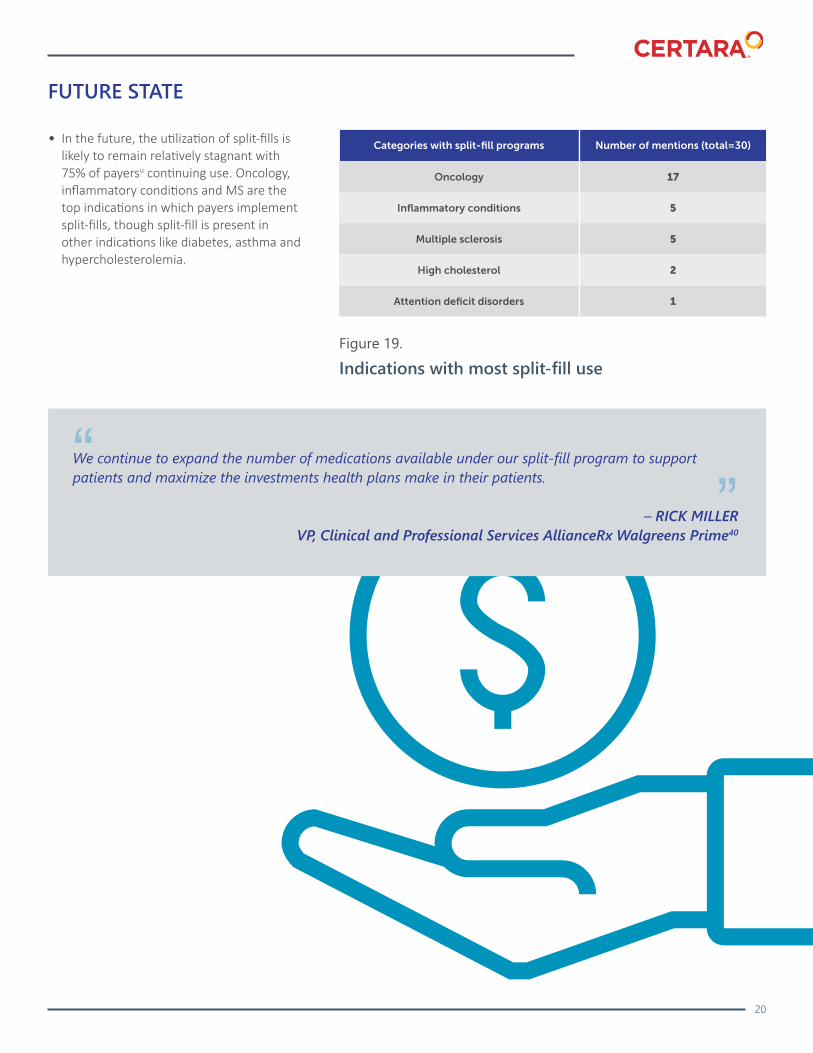
• In the future, the utilization of split-fills is likely to remain relatively stagnant with 75% of payersu continuing use. Oncology, inflammatory conditions and MS are the top indications in which payers implement split-fills, though split-fill is present in other indications like diabetes, asthma and hypercholesterolemia.
FUTURE STATE
Figure 19.
Indications with most split-fill use
We continue to expand the number of medications available under our split-fill program to support patients and maximize the investments health plans make in their patients.
– RICK MILLER VP, Clinical and Professional Services AllianceRx Walgreens Prime40
“”
21
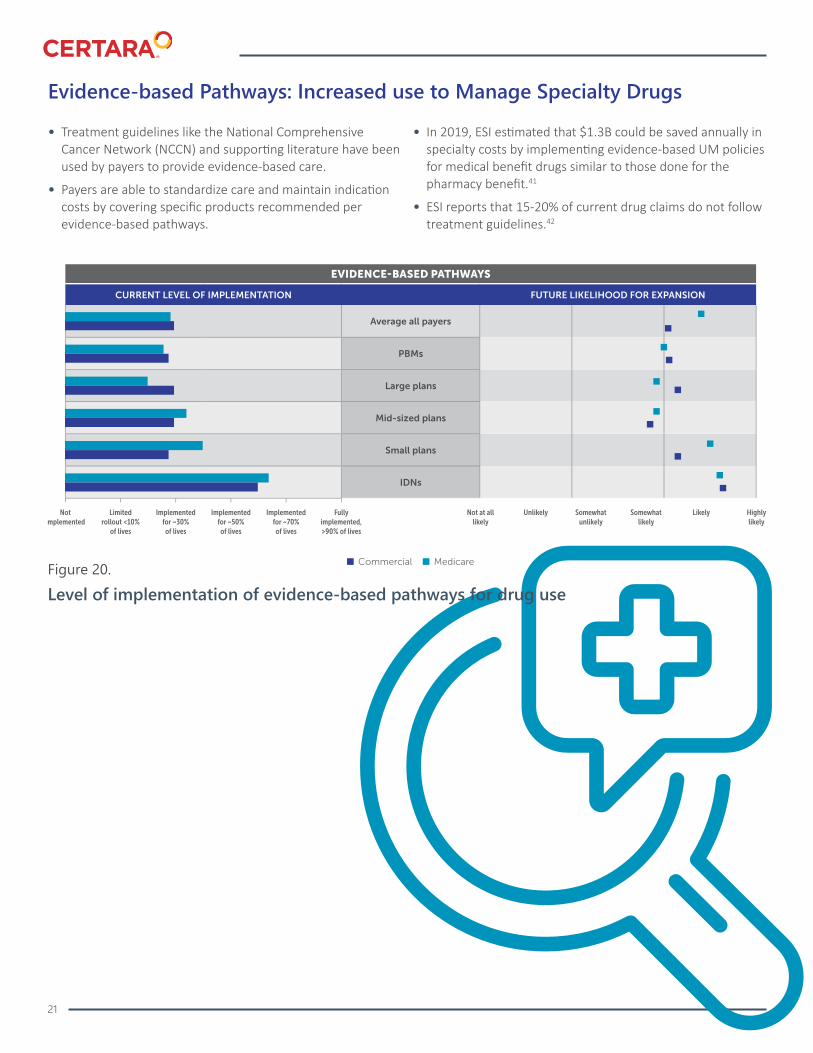
Evidence-based Pathways: Increased use to Manage Specialty Drugs
• Treatment guidelines like the National Comprehensive Cancer Network (NCCN) and supporting literature have been used by payers to provide evidence-based care.
• Payers are able to standardize care and maintain indication costs by covering specific products recommended per evidence-based pathways.
• In 2019, ESI estimated that $1.3B could be saved annually in specialty costs by implementing evidence-based UM policies for medical benefit drugs similar to those done for the pharmacy benefit.41
• ESI reports that 15-20% of current drug claims do not follow treatment guidelines.42
Figure 20.
Level of implementation of evidence-based pathways for drug use
22
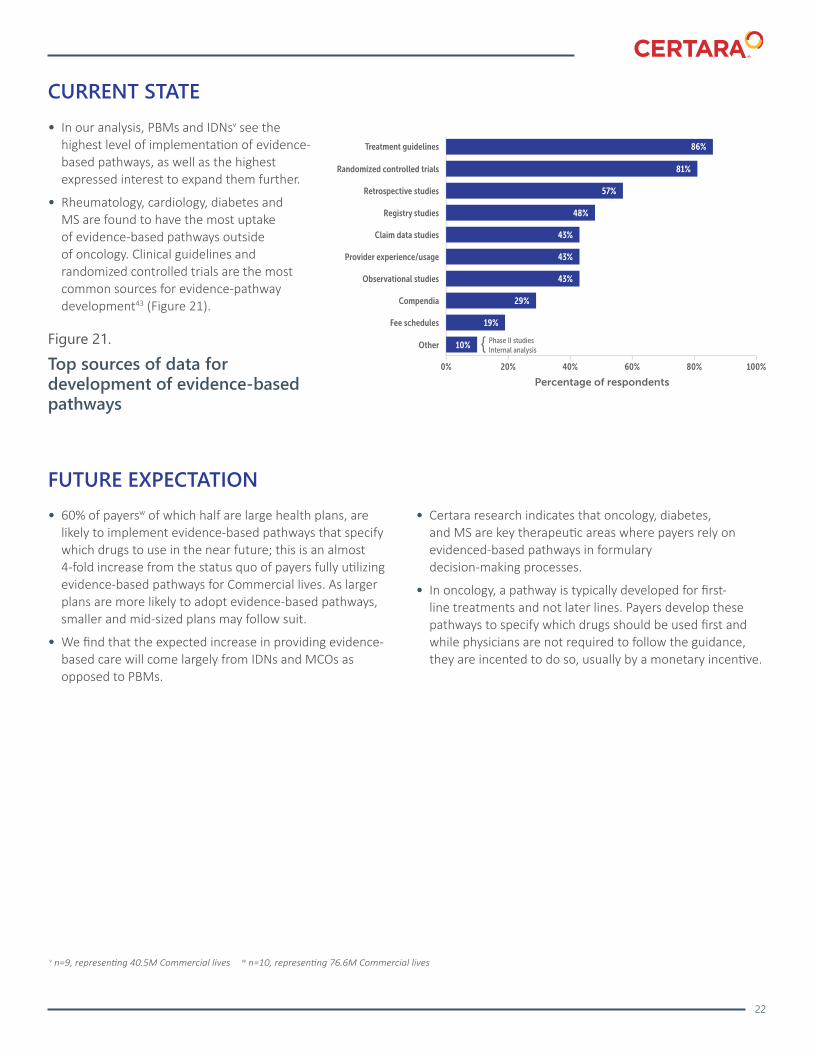
• In our analysis, PBMs and IDNsv see the highest level of implementation of evidence-based pathways, as well as the highest expressed interest to expand them further.
• Rheumatology, cardiology, diabetes and MS are found to have the most uptake of evidence-based pathways outside of oncology. Clinical guidelines and randomized controlled trials are the most common sources for evidence-pathway development43 (Figure 21).
• 60% of payersw of which half are large health plans, are likely to implement evidence-based pathways that specify which drugs to use in the near future; this is an almost 4-fold increase from the status quo of payers fully utilizing evidence-based pathways for Commercial lives. As larger plans are more likely to adopt evidence-based pathways, smaller and mid-sized plans may follow suit.
• We find that the expected increase in providing evidence-based care will come largely from IDNs and MCOs as opposed to PBMs.
• Certara research indicates that oncology, diabetes, and MS are key therapeutic areas where payers rely on evidenced-based pathways in formulary decision-making processes.
• In oncology, a pathway is typically developed for first-line treatments and not later lines. Payers develop these pathways to specify which drugs should be used first and while physicians are not required to follow the guidance, they are incented to do so, usually by a monetary incentive.
Figure 21.
Top sources of data for development of evidence-based pathways
CURRENT STATE
FUTURE EXPECTATION
v n=9, representing 40.5M Commercial lives w n=10, representing 76.6M Commercial lives

23
Quantity Restrictions and Step Edits
• Quantity limits and step edits have been cited as two of the most common restrictions payers use in drug management.44
• Our research confirms that quantity restrictions and step edits are the most implemented UM tactics with the latter seeing further expansion across all payer types in the future.
Figure 22.
Current and future utilization of quantity limits
Figure 23.
Current and future utilization of Brand A before B step edits

DEVELOPER TAKEAWAYS
• Clinical trial designs are subject to scrutiny as a means to limit product use with a narrower PA than the FDA label.
• Developers of specialty pharmaceuticals will be subject to more stringent reauthorization criteria which will likely align with clinical response.
• Strong engagement with payers via advisory board and primary research provides vital insight on PA management and criteria that may be included in PAs.
• Developers must be proactive with payer engagement to understand the current reauthorization environment for their product’s respective indication and competition.
• Developers should educate payers on clinical endpoints/responses that are most relevant for their product.
• A robust assessment of clinical trial designs through the payer perspective early on in the clinical development phases is warranted to ensure the most appropriate and widest patient inclusion criteria are developed.
• An expanded use of product exclusions by payers suggests that payers are unable to distinguish value across products in crowded therapeutic areas.
• Payers may use product exclusions to negotiate deeper rebates with developers.
• Developers must leverage attributes of product value that may warrant a preferred product status outside of and beyond price.
• Key considerations for developers include:
• Will inclusion in certain guidelines or treatment protocols such as the NCCN allow for better access at the payer level?
• Does the timing of inclusion vs. P&T review impact access?
• Does use of evidence-based pathways vary across payer segments?
• What can developers do to support physician use of evidence-based pathways?
The definition of what constitutes “value” for healthcare interventions is an incredibly complex and hotly debated topic. However, regardless of the school of thought you come from, there is broad consensus that value assessment must take into consideration a multitude of factors beyond purely economic ones. Especially important in value assessment are factors such as unmet needs and disease severity, in particular this applies for rare diseases. Whether they are explicitly or implicitly captured in the assessment criteria, it is clear that healthcare decision-makers are indeed swayed by these factors, and as such it is critical for developers take a holistic approach to their evidence development and communication activities.
– ROMAN CASCIANO General Manager and SVP, Certara Evidence & Access
“
”
24
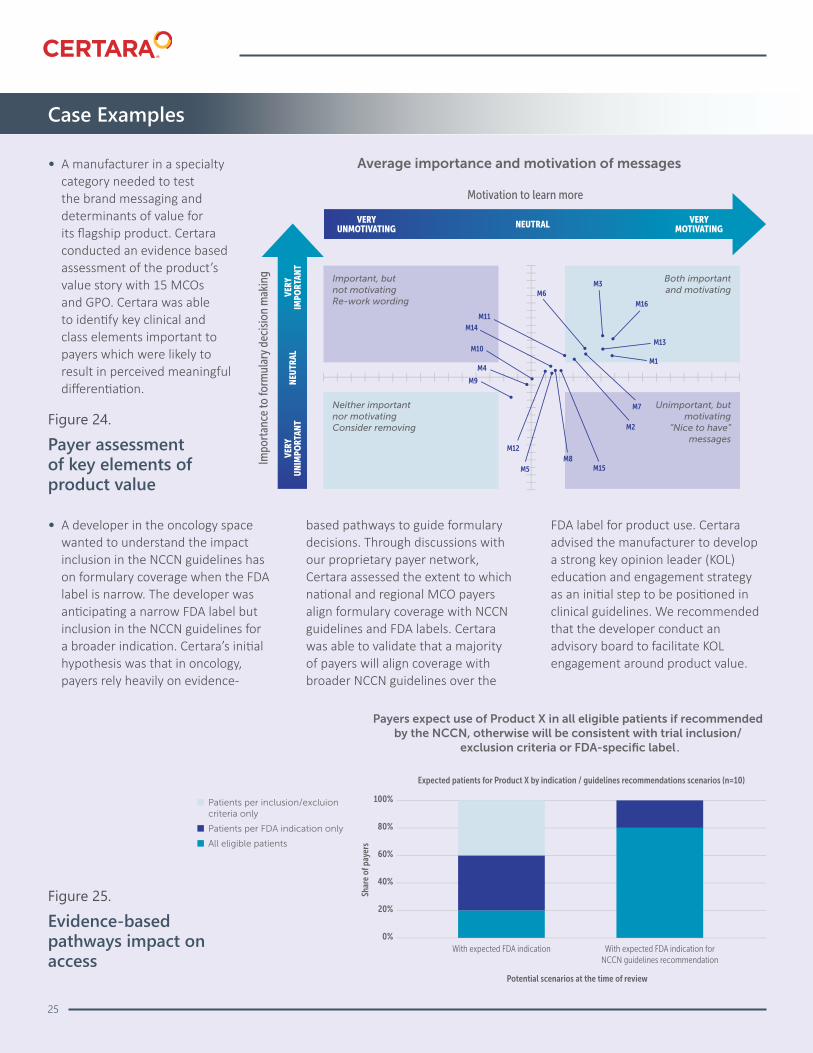
• A manufacturer in a specialty category needed to test the brand messaging and determinants of value for its flagship product. Certara conducted an evidence based assessment of the product’s value story with 15 MCOs and GPO. Certara was able to identify key clinical and class elements important to payers which were likely to result in perceived meaningful differentiation.
• A developer in the oncology space wanted to understand the impact inclusion in the NCCN guidelines has on formulary coverage when the FDA label is narrow. The developer was anticipating a narrow FDA label but inclusion in the NCCN guidelines for a broader indication. Certara’s initial hypothesis was that in oncology, payers rely heavily on evidence-
based pathways to guide formulary decisions. Through discussions with our proprietary payer network, Certara assessed the extent to which national and regional MCO payers align formulary coverage with NCCN guidelines and FDA labels. Certara was able to validate that a majority of payers will align coverage with broader NCCN guidelines over the
FDA label for product use. Certara advised the manufacturer to develop a strong key opinion leader (KOL) education and engagement strategy as an initial step to be positioned in clinical guidelines. We recommended that the developer conduct an advisory board to facilitate KOL engagement around product value.
Case Examples
25
Figure 24.
Payer assessment of key elements of product value
Figure 25.
Evidence-based pathways impact on access
Distribution ChannelsDisruption
27
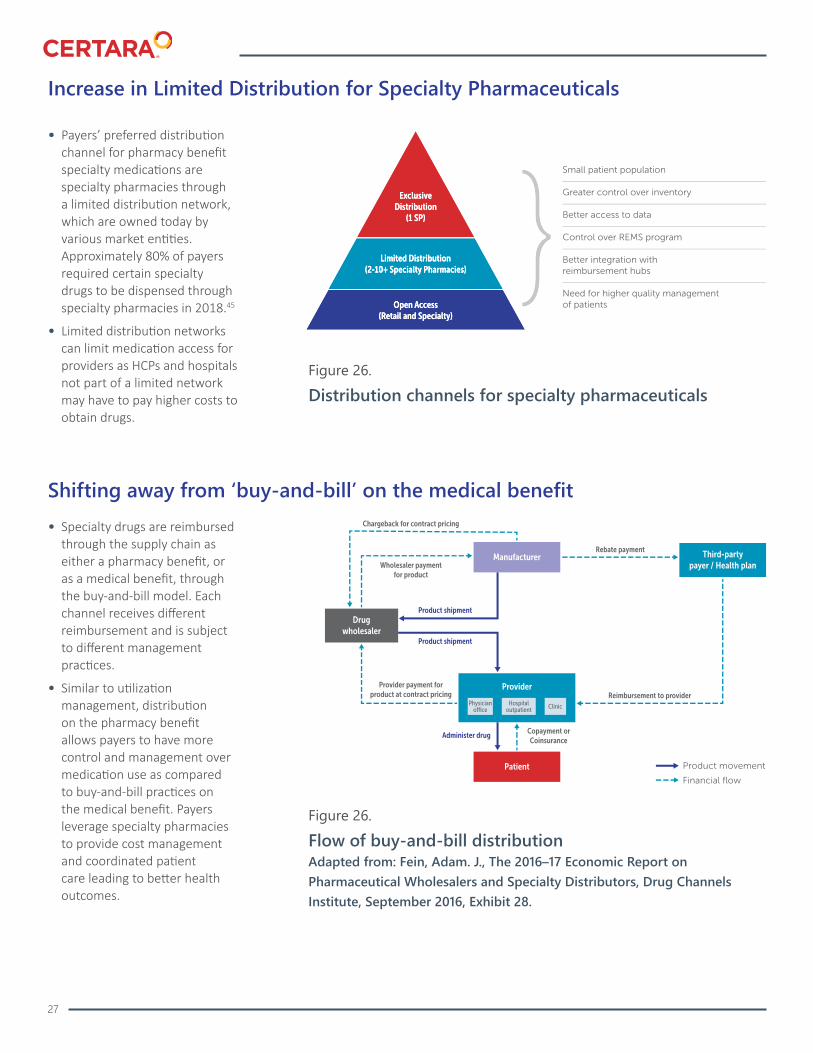
• Payers’ preferred distribution channel for pharmacy benefit specialty medications are specialty pharmacies through a limited distribution network, which are owned today by various market entities. Approximately 80% of payers required certain specialty drugs to be dispensed through specialty pharmacies in 2018.45
• Limited distribution networks can limit medication access for providers as HCPs and hospitals not part of a limited network may have to pay higher costs to obtain drugs.
Increase in Limited Distribution for Specialty Pharmaceuticals
Shifting away from ‘buy-and-bill’ on the medical benefit
Figure 26.
Distribution channels for specialty pharmaceuticals
Figure 26.
Flow of buy-and-bill distributionAdapted from: Fein, Adam. J., The 2016–17 Economic Report on Pharmaceutical Wholesalers and Specialty Distributors, Drug Channels Institute, September 2016, Exhibit 28.
• Specialty drugs are reimbursed through the supply chain as either a pharmacy benefit, or as a medical benefit, through the buy-and-bill model. Each channel receives different reimbursement and is subject to different management practices.
• Similar to utilization management, distribution on the pharmacy benefit allows payers to have more control and management over medication use as compared to buy-and-bill practices on the medical benefit. Payers leverage specialty pharmacies to provide cost management and coordinated patient care leading to better health outcomes.
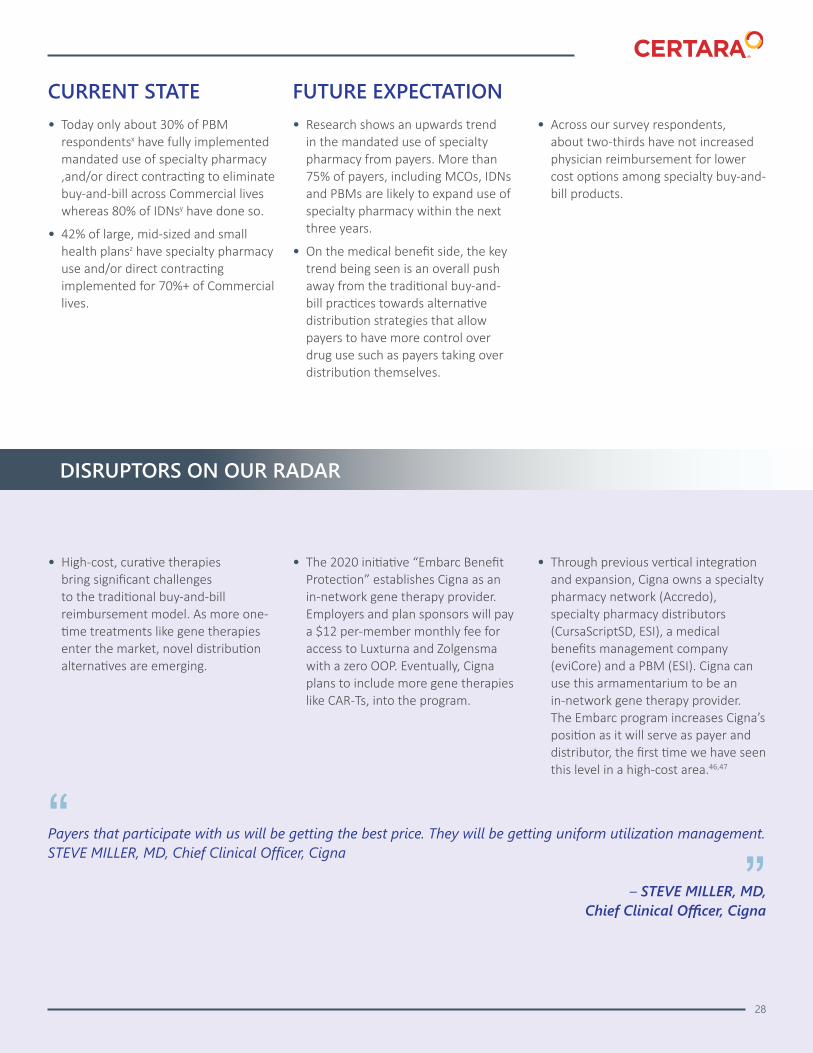
• Today only about 30% of PBM respondentsx have fully implemented mandated use of specialty pharmacy ,and/or direct contracting to eliminate buy-and-bill across Commercial lives whereas 80% of IDNsy have done so.
• 42% of large, mid-sized and small health plansz have specialty pharmacy use and/or direct contracting implemented for 70%+ of Commercial lives.
• Research shows an upwards trend in the mandated use of specialty pharmacy from payers. More than 75% of payers, including MCOs, IDNs and PBMs are likely to expand use of specialty pharmacy within the next three years.
• On the medical benefit side, the key trend being seen is an overall push away from the traditional buy-and-bill practices towards alternative distribution strategies that allow payers to have more control over drug use such as payers taking over distribution themselves.
• Across our survey respondents, about two-thirds have not increased physician reimbursement for lower cost options among specialty buy-and-bill products.
CURRENT STATE FUTURE EXPECTATION
DISRUPTORS ON OUR RADAR
• High-cost, curative therapies bring significant challenges to the traditional buy-and-bill reimbursement model. As more one-time treatments like gene therapies enter the market, novel distribution alternatives are emerging.
• The 2020 initiative “Embarc Benefit Protection” establishes Cigna as an in-network gene therapy provider. Employers and plan sponsors will pay a $12 per-member monthly fee for access to Luxturna and Zolgensma with a zero OOP. Eventually, Cigna plans to include more gene therapies like CAR-Ts, into the program.
• Through previous vertical integration and expansion, Cigna owns a specialty pharmacy network (Accredo), specialty pharmacy distributors (CursaScriptSD, ESI), a medical benefits management company (eviCore) and a PBM (ESI). Cigna can use this armamentarium to be an in-network gene therapy provider. The Embarc program increases Cigna’s position as it will serve as payer and distributor, the first time we have seen this level in a high-cost area.46,47
Payers that participate with us will be getting the best price. They will be getting uniform utilization management. STEVE MILLER, MD, Chief Clinical Officer, Cigna
– STEVE MILLER, MD, Chief Clinical Officer, Cigna
“”
28
29
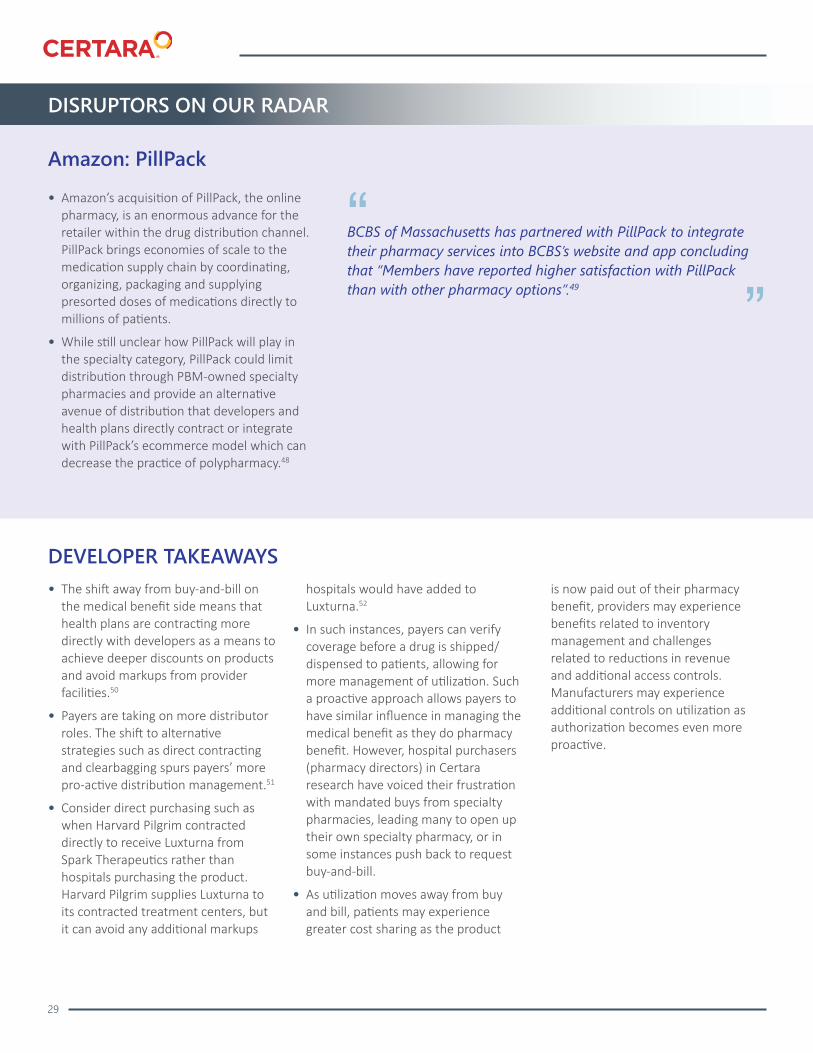
• Amazon’s acquisition of PillPack, the online pharmacy, is an enormous advance for the retailer within the drug distribution channel. PillPack brings economies of scale to the medication supply chain by coordinating, organizing, packaging and supplying presorted doses of medications directly to millions of patients.
• While still unclear how PillPack will play in the specialty category, PillPack could limit distribution through PBM-owned specialty pharmacies and provide an alternative avenue of distribution that developers and health plans directly contract or integrate with PillPack’s ecommerce model which can decrease the practice of polypharmacy.48
DISRUPTORS ON OUR RADAR
Amazon: PillPack
DEVELOPER TAKEAWAYS
BCBS of Massachusetts has partnered with PillPack to integrate their pharmacy services into BCBS’s website and app concluding that “Members have reported higher satisfaction with PillPack than with other pharmacy options”.49
“”
• The shift away from buy-and-bill on the medical benefit side means that health plans are contracting more directly with developers as a means to achieve deeper discounts on products and avoid markups from provider facilities.50
• Payers are taking on more distributor roles. The shift to alternative strategies such as direct contracting and clearbagging spurs payers’ more pro-active distribution management.51
• Consider direct purchasing such as when Harvard Pilgrim contracted directly to receive Luxturna from Spark Therapeutics rather than hospitals purchasing the product. Harvard Pilgrim supplies Luxturna to its contracted treatment centers, but it can avoid any additional markups
hospitals would have added to Luxturna.52
• In such instances, payers can verify coverage before a drug is shipped/ dispensed to patients, allowing for more management of utilization. Such a proactive approach allows payers to have similar influence in managing the medical benefit as they do pharmacy benefit. However, hospital purchasers (pharmacy directors) in Certara research have voiced their frustration with mandated buys from specialty pharmacies, leading many to open up their own specialty pharmacy, or in some instances push back to request buy-and-bill.
• As utilization moves away from buy and bill, patients may experience greater cost sharing as the product
is now paid out of their pharmacy benefit, providers may experience benefits related to inventory management and challenges related to reductions in revenue and additional access controls. Manufacturers may experience additional controls on utilization as authorization becomes even more proactive.
Rising Cost EffectivenessConsiderations
31
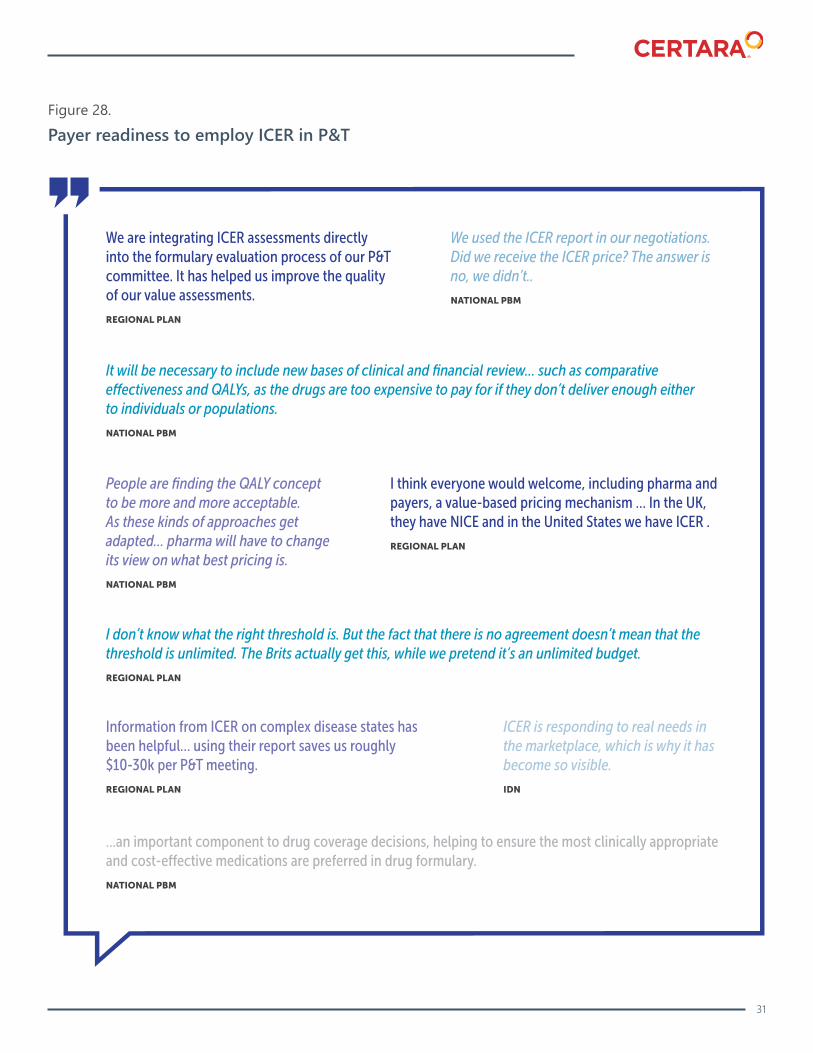
Figure 28.
Payer readiness to employ ICER in P&T

32
• The public debate around drug pricing has spurred demand for standardized value assessment in the US. A venture-funded think-tank called “ICER” (Institute for Clinical and Economic Review), has made its name as America’s “drug price watchdog”, selecting pharmaceutical products for review under cost effectiveness criteria. The incremental health gains are measured in quality adjusted life years and equal value of life years gained, as complimentary method the organization suggests for life extending treatments (Figure 29).
• 97% of reports the organization published online in 2018 found that developer WAC prices do not match the value the products provide, requesting discounts beyond 60% in nearly half of all reviews. To further address affordability concerns, “ICER” also projects a budget impact of interventions on the basis of a population-level back of the envelope calculation for the US healthcare system as shown in (Figure 30).
Market context
Figure 29.
(Simplified) components of ICER’s value framework andcost-effectiveness calculation
Figure 30.
Assumptions, ICER budget impact calculationSource: ICER
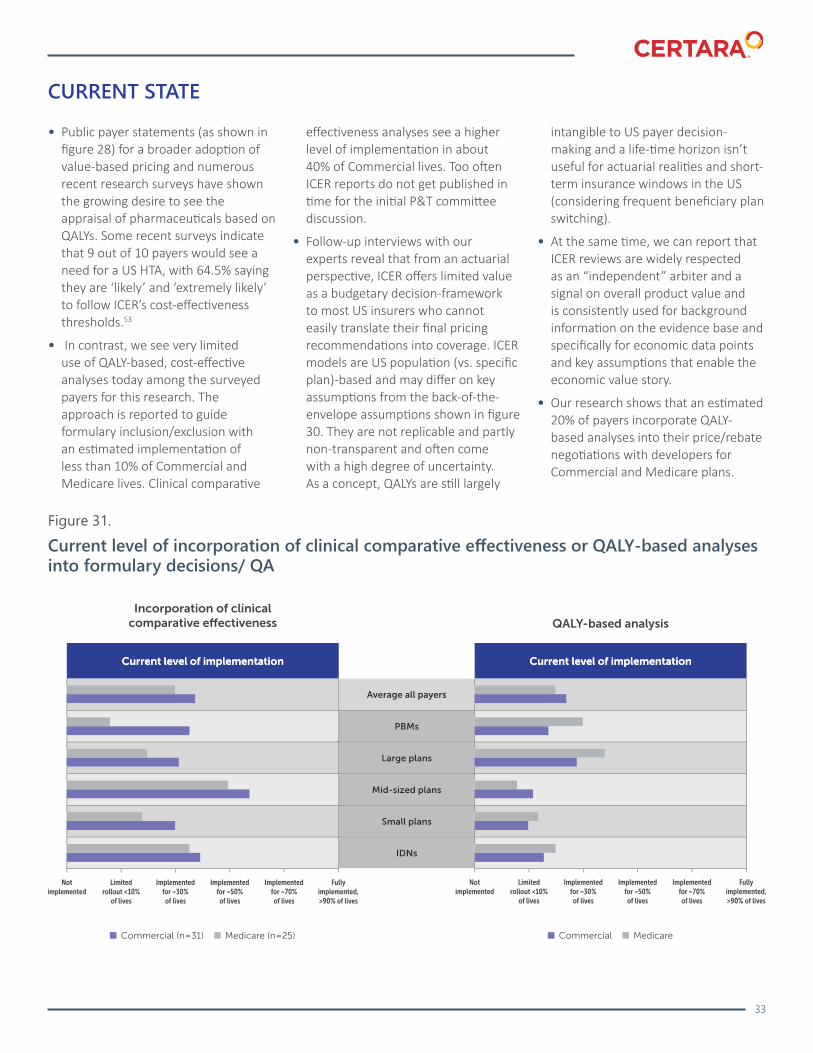
33
• Public payer statements (as shown in figure 28) for a broader adoption of value-based pricing and numerous recent research surveys have shown the growing desire to see the appraisal of pharmaceuticals based on QALYs. Some recent surveys indicate that 9 out of 10 payers would see a need for a US HTA, with 64.5% saying they are ‘likely’ and ‘extremely likely’ to follow ICER’s cost-effectiveness thresholds.53
• In contrast, we see very limited use of QALY-based, cost-effective analyses today among the surveyed payers for this research. The approach is reported to guide formulary inclusion/exclusion with an estimated implementation of less than 10% of Commercial and Medicare lives. Clinical comparative
effectiveness analyses see a higher level of implementation in about 40% of Commercial lives. Too often ICER reports do not get published in time for the initial P&T committee discussion.
• Follow-up interviews with our experts reveal that from an actuarial perspective, ICER offers limited value as a budgetary decision-framework to most US insurers who cannot easily translate their final pricing recommendations into coverage. ICER models are US population (vs. specific plan)-based and may differ on key assumptions from the back-of-the-envelope assumptions shown in figure 30. They are not replicable and partly non-transparent and often come with a high degree of uncertainty. As a concept, QALYs are still largely
intangible to US payer decision-making and a life-time horizon isn’t useful for actuarial realities and short-term insurance windows in the US (considering frequent beneficiary plan switching).
• At the same time, we can report that ICER reviews are widely respected as an “independent” arbiter and a signal on overall product value and is consistently used for background information on the evidence base and specifically for economic data points and key assumptions that enable the economic value story.
• Our research shows that an estimated 20% of payers incorporate QALY-based analyses into their price/rebate negotiations with developers for Commercial and Medicare plans.
CURRENT STATE
Figure 31.
Current level of incorporation of clinical comparative effectiveness or QALY-based analyses into formulary decisions/ QA

34
• 50% of payers aa,report that they are likely to use QALY-based assessments like ICER in decision-making. This contrasts with a higher share at 70% of payers bb, who are likely to use comparative effectiveness research in formulary decision-making in the next three years. They expect QALY-based, cost-effective analyses to guide formulary inclusion/exclusion for about 30% of lives in both Commercial and Medicare.
• Establishing an official, independent US HTA is payors‘ most preferred of all major recent policy proposals. While receiving average level of “somewhat” support, it still ranks roughly 20% in preference above drug Importation and POS rebate passthrough legislation, and even 4% higher than ‘External Pricing Indexing,’ such as introduced by HHS.54 Payers managing 63.7M lives and 73.8M lives strongly favor or somewhat favor having an official cost effectiveness body in the US, respectively.
FUTURE EXPECTATION
Figure 32.
Current level of incorporation of clinical comparative effectiveness or QALY-based analyses into formulary decisions/ QA
Figure 33.
Level of payer support for policy proposal to institutean independent US HTA body which appraises drugvalue through QALY-based cost-effectiveness methods

35
• While QALY-based approaches like that of “ICER” do not render themselves for easy adoption for payer decision making, they have become an important element in negotiations, and most payers today acknowledge considering such reports at some point during the drug evaluation process.
• Given the opportunity to use utilization management tools as outlined in previous sections, payers are keen to look for assumptions to define eligible patients when considering coverage, limiting PA to label and/or trial, and opportunities for coverage with evidence development and/or outcomes-based deals. Additional collection of clinical evidence may be required for re-authorization when coverage is re-evaluated.
• “ICER” does not currently follow a standardized selection process for its review of therapies. Getting involved with the process during the review window is critical, but engagement doesn’t equate to influence over shaping the report findings. Analyses show that contributions rarely result in major amendments in terms of the conclusion but may significantly influence the revision of model assumptions which may matter to US payers.
• “ICER” generally acknowledges industry comments per table response and tends to address specific methodological considerations with varying levels of robustness. As long as specific alternatives have been offered by the developer, roughly 1/3 of suggestions make their way into final reports, thereby modifying
the final evidence report. However, significant variation exists and not all changes are desirable from a developer perspective.
• Developers should explain systematically why they might find specific “ICER” assumptions to be problematic and illustrate the materiality of these concerns towards the value determination more definitively wherever possible (e.g. are these concerns leading to a required shift in value category?). We reiterate that a strong need remains for developers to provide greater specificity and determination in their comments and interaction with ICER.
Figure 34.
Targeted publications as part of a strategic ICER defense
DEVELOPER TAKEAWAYS

Innovative Financing forNovel Therapies
37
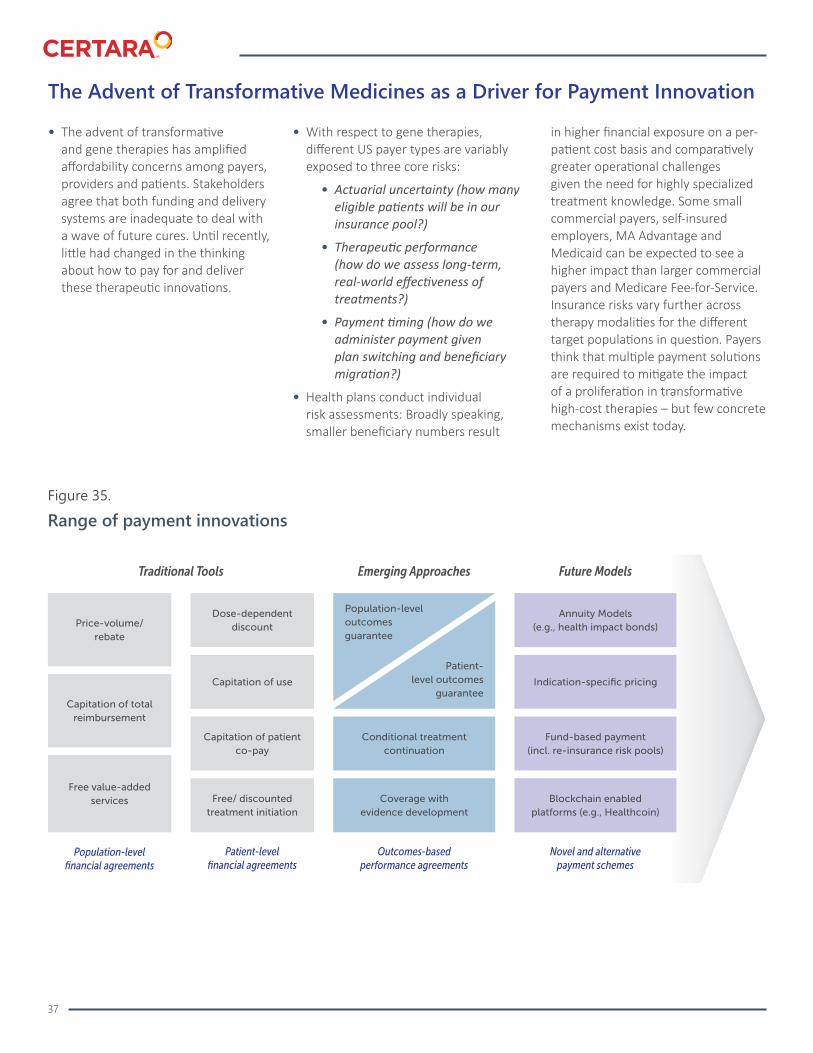
The Advent of Transformative Medicines as a Driver for Payment Innovation
• The advent of transformative and gene therapies has amplified affordability concerns among payers, providers and patients. Stakeholders agree that both funding and delivery systems are inadequate to deal with a wave of future cures. Until recently, little had changed in the thinking about how to pay for and deliver these therapeutic innovations.
• With respect to gene therapies, different US payer types are variably exposed to three core risks:
• Actuarial uncertainty (how many eligible patients will be in our insurance pool?)
• Therapeutic performance (how do we assess long-term, real-world effectiveness of treatments?)
• Payment timing (how do we administer payment given plan switching and beneficiary migration?)
• Health plans conduct individual risk assessments: Broadly speaking, smaller beneficiary numbers result
in higher financial exposure on a per-patient cost basis and comparatively greater operational challenges given the need for highly specialized treatment knowledge. Some small commercial payers, self-insured employers, MA Advantage and Medicaid can be expected to see a higher impact than larger commercial payers and Medicare Fee-for-Service. Insurance risks vary further across therapy modalities for the different target populations in question. Payers think that multiple payment solutions are required to mitigate the impact of a proliferation in transformative high-cost therapies – but few concrete mechanisms exist today.
Figure 35.
Range of payment innovations
38
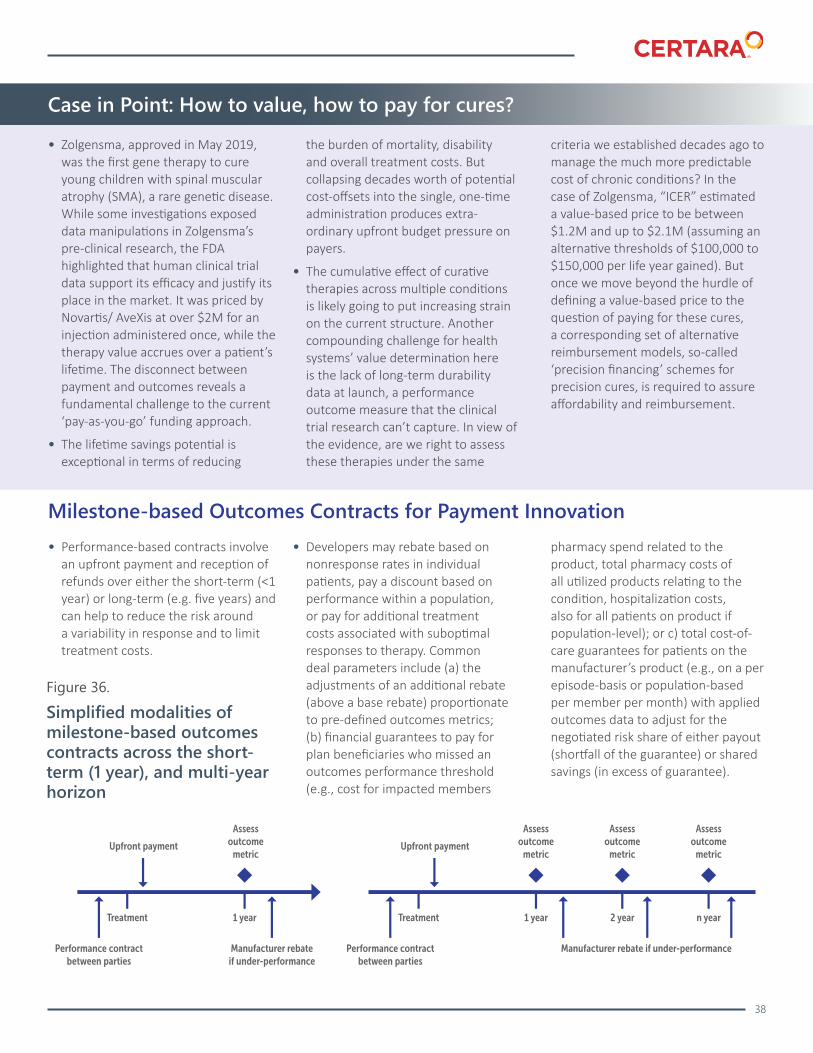
• Performance-based contracts involve an upfront payment and reception of refunds over either the short-term (<1 year) or long-term (e.g. five years) and can help to reduce the risk around a variability in response and to limit treatment costs.
• Developers may rebate based on nonresponse rates in individual patients, pay a discount based on performance within a population, or pay for additional treatment costs associated with suboptimal responses to therapy. Common deal parameters include (a) the adjustments of an additional rebate (above a base rebate) proportionate to pre-defined outcomes metrics; (b) financial guarantees to pay for plan beneficiaries who missed an outcomes performance threshold (e.g., cost for impacted members
pharmacy spend related to the product, total pharmacy costs of all utilized products relating to the condition, hospitalization costs, also for all patients on product if population-level); or c) total cost-of-care guarantees for patients on the manufacturer’s product (e.g., on a per episode-basis or population-based per member per month) with applied outcomes data to adjust for the negotiated risk share of either payout (shortfall of the guarantee) or shared savings (in excess of guarantee).
Milestone-based Outcomes Contracts for Payment Innovation
Figure 36.
Simplified modalities of milestone-based outcomes contracts across the short-term (1 year), and multi-year horizon
Case in Point: How to value, how to pay for cures?
• Zolgensma, approved in May 2019, was the first gene therapy to cure young children with spinal muscular atrophy (SMA), a rare genetic disease. While some investigations exposed data manipulations in Zolgensma’s pre-clinical research, the FDA highlighted that human clinical trial data support its efficacy and justify its place in the market. It was priced by Novartis/ AveXis at over $2M for an injection administered once, while the therapy value accrues over a patient’s lifetime. The disconnect between payment and outcomes reveals a fundamental challenge to the current ‘pay-as-you-go’ funding approach.
• The lifetime savings potential is exceptional in terms of reducing
the burden of mortality, disability and overall treatment costs. But collapsing decades worth of potential cost-offsets into the single, one-time administration produces extra-ordinary upfront budget pressure on payers.
• The cumulative effect of curative therapies across multiple conditions is likely going to put increasing strain on the current structure. Another compounding challenge for health systems’ value determination here is the lack of long-term durability data at launch, a performance outcome measure that the clinical trial research can’t capture. In view of the evidence, are we right to assess these therapies under the same
criteria we established decades ago to manage the much more predictable cost of chronic conditions? In the case of Zolgensma, “ICER” estimated a value-based price to be between $1.2M and up to $2.1M (assuming an alternative thresholds of $100,000 to $150,000 per life year gained). But once we move beyond the hurdle of defining a value-based price to the question of paying for these cures, a corresponding set of alternative reimbursement models, so-called ‘precision financing’ schemes for precision cures, is required to assure affordability and reimbursement.
39
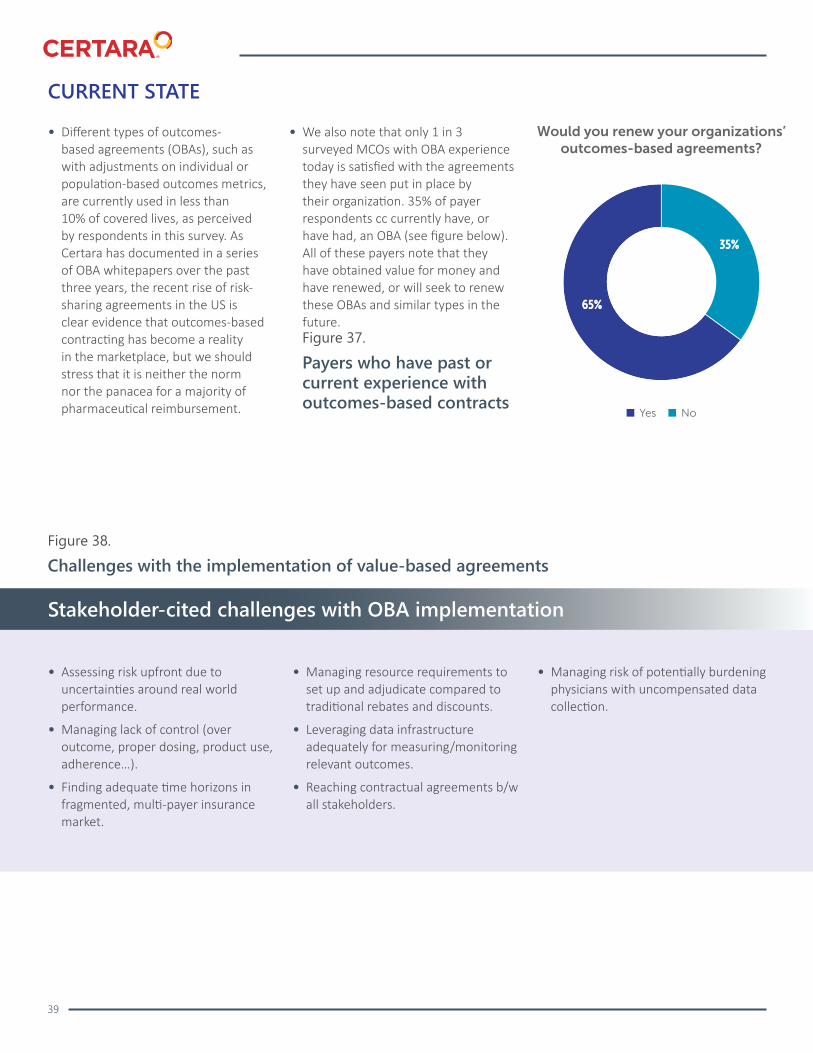
• Different types of outcomes-based agreements (OBAs), such as with adjustments on individual or population-based outcomes metrics, are currently used in less than 10% of covered lives, as perceived by respondents in this survey. As Certara has documented in a series of OBA whitepapers over the past three years, the recent rise of risk-sharing agreements in the US is clear evidence that outcomes-based contracting has become a reality in the marketplace, but we should stress that it is neither the norm nor the panacea for a majority of pharmaceutical reimbursement.
• We also note that only 1 in 3 surveyed MCOs with OBA experience today is satisfied with the agreements they have seen put in place by their organization. 35% of payer respondents cc currently have, or have had, an OBA (see figure below). All of these payers note that they have obtained value for money and have renewed, or will seek to renew these OBAs and similar types in the future.
• Assessing risk upfront due to uncertainties around real world performance.
• Managing lack of control (over outcome, proper dosing, product use, adherence…).
• Finding adequate time horizons in fragmented, multi-payer insurance market.
• Managing resource requirements to set up and adjudicate compared to traditional rebates and discounts.
• Leveraging data infrastructure adequately for measuring/monitoring relevant outcomes.
• Reaching contractual agreements b/w all stakeholders.
• Managing risk of potentially burdening physicians with uncompensated data collection.
CURRENT STATE
Figure 37.
Payers who have past or current experience with outcomes-based contracts
Figure 38.
Challenges with the implementation of value-based agreements
Stakeholder-cited challenges with OBA implementation

40
• When asked about their likelihood for renewal, contracts are expected to be renewed for national plans. Only IDNs are moderately confident to expand OBA use beyond pilots.
• Additional qualitative feedback also indicates why the current types of OBA have seen limited scale, frequently citing lack of resources and lack of manufacturer’ commitment to more meaningful areas of implementation. Developers also must agree to a set of measurable and obtainable outcomes which can be challenging in several disease states.
• Given the need for third-party adjudication services, and data and analytics infrastructure to track patients over time (across payers and providers), we do not expect a large-scale uptake within the next three years. These steps add to the already costly administration and legal complexity. At the same time, developers are well advised to be prepared for the emerging payer environment where meaningful commitment to value in the real world, not RCT simply results, will be the marker of differentiation.
FUTURE EXPECTATIONS
Figure 39.
Benefits associated with offering value-based contracting options

41
• Following our results, there is still an opening for developers to further adopt alternative models – but it remains restricted to IDN archetypes within the next three years.
• We believe that regulatory clarity would serve as a key enabler: CMS could provide reasonable accommodation for best-price and other government price reporting, the OIG could advance anti-kickback statues to define explicit safe harbors, and FDA could further specify communication guidelines to enable appropriate communication between payers and developers. There have been encouraging proposals by the OIG and CMS for new AKS and Stark protections for value-based agreements on the provider site currently pending at OMB, but such arrangements explicitly exclude manufacturers of drugs, medical equipment, prosthetics, orthotics or supplies.
Figure 40.
Outcomes based agreement with financial adjustment based on performance in population (Commercial)
Figure 41.
Outcomes based agreement with financial adjustment based on performance in individual patients (Commercial)
Figure 42.
Outcomes based agreement with financial adjustment based on performance in individual patients (Commercial)

42
Figure 44.
Interest in adopting annuity payment model within the next 3 years (Commercial)
Figure 43.
Simplified modalities for multi-year installment payments
Annuities Payments/ installment Financing
• The objective of annuity financing (which can be combined with outcomes measures) is to spread the cost of a therapy over a fixed time frame thus smoothing the scheduling of payments. This would help tackle the immediate budget pressures in the first year faced by smaller insurance pools and partially mitigate the actuarial risk around patient backlogs and individual high-cost cases. Typically, the timeframe is based on the durability of response in the trial; many payers would want to see five years. This currently faces a major implementation obstacle in terms of patient potability.
• Currently, no payers report using annuity financing arrangements. Policymakers have hitherto made no tangible commitment to developing an infrastructure for annuity financing or to enabling long-term, value-based pharmaceutical reimbursement.
• We note that the bi-partisan legislation from the Senate Finance Committee (Grassley/Widen) would enable Medicaid plans to amortize the cost of delivering curative gene therapy over time.
• Given the multi-year contract horizon, open questions around patient tracking, pricing regulation and accounting issues persist and payer interest in adopting these payment options is muted.
FUTURE EXPECTATIONSCURRENT STATE
43
FUTURE EXPECTATIONS
CURRENT STATE
Reinsurance / Stop loss
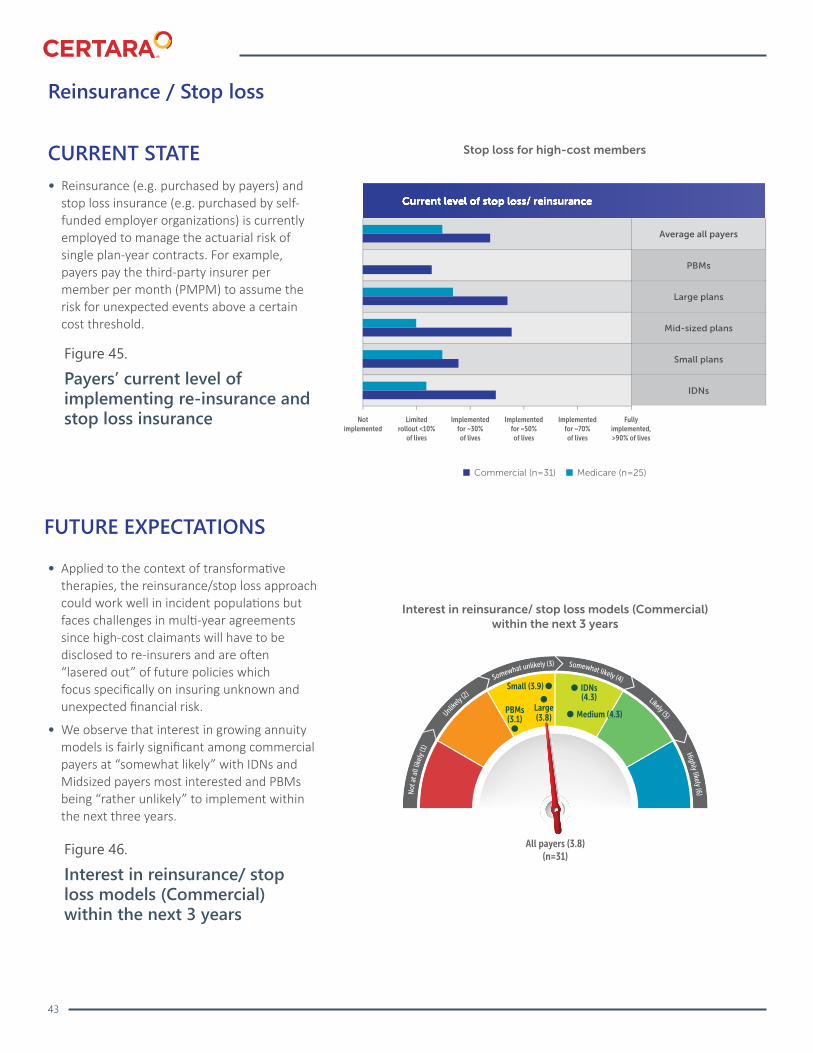
• Reinsurance (e.g. purchased by payers) and stop loss insurance (e.g. purchased by self-funded employer organizations) is currently employed to manage the actuarial risk of single plan-year contracts. For example, payers pay the third-party insurer per member per month (PMPM) to assume the risk for unexpected events above a certain cost threshold.
• Applied to the context of transformative therapies, the reinsurance/stop loss approach could work well in incident populations but faces challenges in multi-year agreements since high-cost claimants will have to be disclosed to re-insurers and are often “lasered out” of future policies which focus specifically on insuring unknown and unexpected financial risk.
• We observe that interest in growing annuity models is fairly significant among commercial payers at “somewhat likely” with IDNs and Midsized payers most interested and PBMs being “rather unlikely” to implement within the next three years.
Figure 45.
Payers’ current level of implementing re-insurance and stop loss insurance
Figure 46.
Interest in reinsurance/ stop loss models (Commercial) within the next 3 years
44
FUTURE EXPECTATIONSCURRENT STATE
Subscription-based Pricing
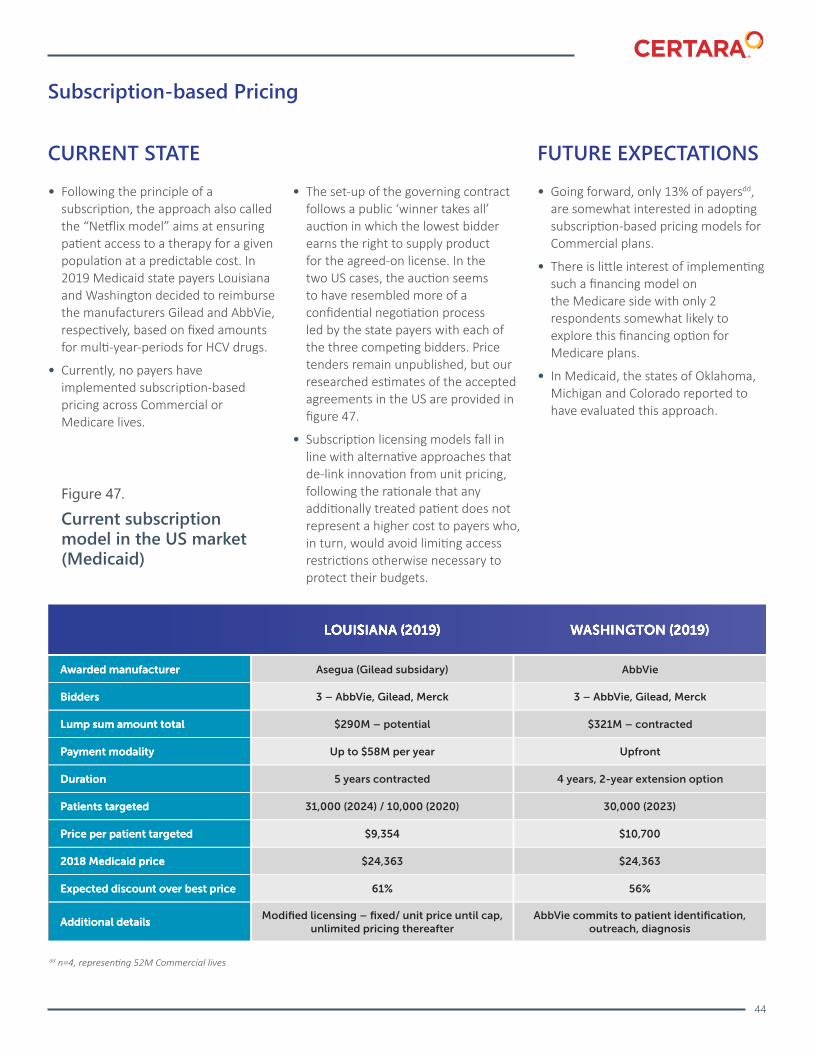
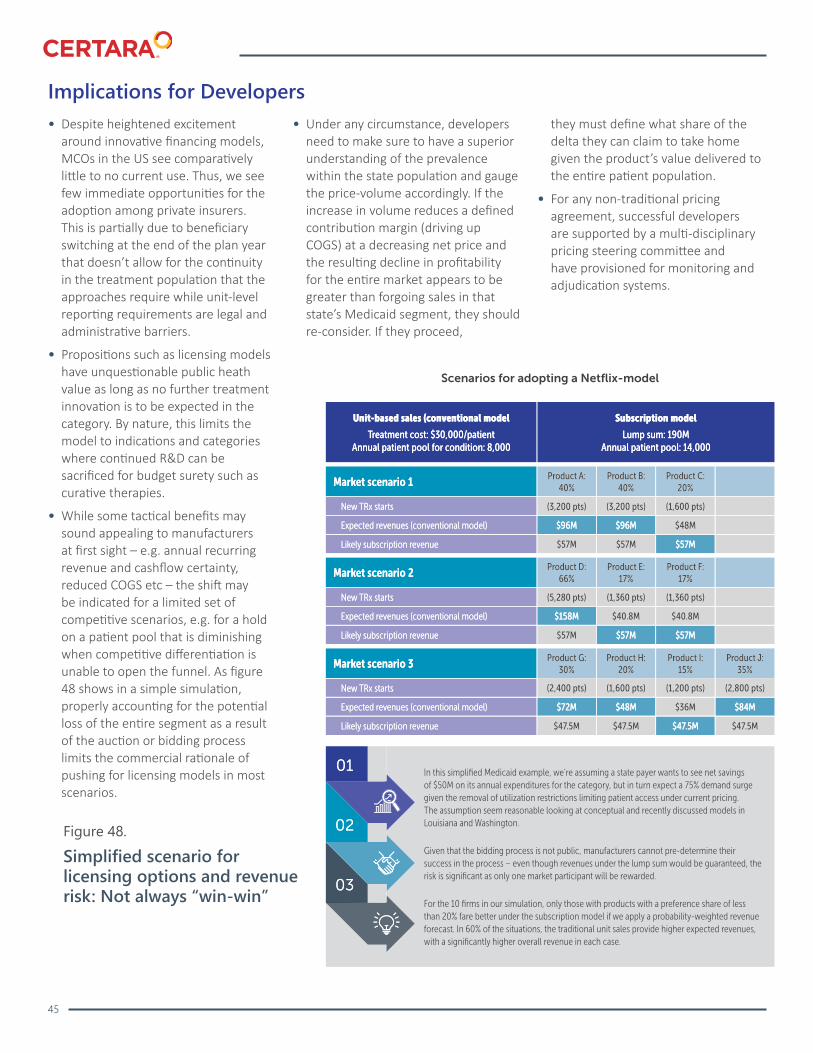
• Following the principle of a subscription, the approach also called the “Netflix model” aims at ensuring patient access to a therapy for a given population at a predictable cost. In 2019 Medicaid state payers Louisiana and Washington decided to reimburse the manufacturers Gilead and AbbVie, respectively, based on fixed amounts for multi-year-periods for HCV drugs.
• Currently, no payers have implemented subscription-based pricing across Commercial or Medicare lives.
• The set-up of the governing contract follows a public ‘winner takes all’ auction in which the lowest bidder earns the right to supply product for the agreed-on license. In the two US cases, the auction seems to have resembled more of a confidential negotiation process led by the state payers with each of the three competing bidders. Price tenders remain unpublished, but our researched estimates of the accepted agreements in the US are provided in figure 47.
• Subscription licensing models fall in line with alternative approaches that de-link innovation from unit pricing, following the rationale that any additionally treated patient does not represent a higher cost to payers who, in turn, would avoid limiting access restrictions otherwise necessary to protect their budgets.
• Going forward, only 13% of payersdd, are somewhat interested in adopting subscription-based pricing models for Commercial plans.
• There is little interest of implementing such a financing model on the Medicare side with only 2 respondents somewhat likely to explore this financing option for Medicare plans.
• In Medicaid, the states of Oklahoma, Michigan and Colorado reported to have evaluated this approach.
Figure 47.
Current subscription model in the US market (Medicaid)
dd n=4, representing 52M Commercial lives
45
Implications for Developers• Despite heightened excitement
around innovative financing models, MCOs in the US see comparatively little to no current use. Thus, we see few immediate opportunities for the adoption among private insurers. This is partially due to beneficiary switching at the end of the plan year that doesn’t allow for the continuity in the treatment population that the approaches require while unit-level reporting requirements are legal and administrative barriers.
• Propositions such as licensing models have unquestionable public heath value as long as no further treatment innovation is to be expected in the category. By nature, this limits the model to indications and categories where continued R&D can be sacrificed for budget surety such as curative therapies.
• While some tactical benefits may sound appealing to manufacturers at first sight – e.g. annual recurring revenue and cashflow certainty, reduced COGS etc – the shift may be indicated for a limited set of competitive scenarios, e.g. for a hold on a patient pool that is diminishing when competitive differentiation is unable to open the funnel. As figure 48 shows in a simple simulation, properly accounting for the potential loss of the entire segment as a result of the auction or bidding process limits the commercial rationale of pushing for licensing models in most scenarios.
• Under any circumstance, developers need to make sure to have a superior understanding of the prevalence within the state population and gauge the price-volume accordingly. If the increase in volume reduces a defined contribution margin (driving up COGS) at a decreasing net price and the resulting decline in profitability for the entire market appears to be greater than forgoing sales in that state’s Medicaid segment, they should re-consider. If they proceed,
they must define what share of the delta they can claim to take home given the product’s value delivered to the entire patient population.
• For any non-traditional pricing agreement, successful developers are supported by a multi-disciplinary pricing steering committee and have provisioned for monitoring and adjudication systems.
Figure 48.
Simplified scenario for licensing options and revenue risk: Not always “win-win”
46
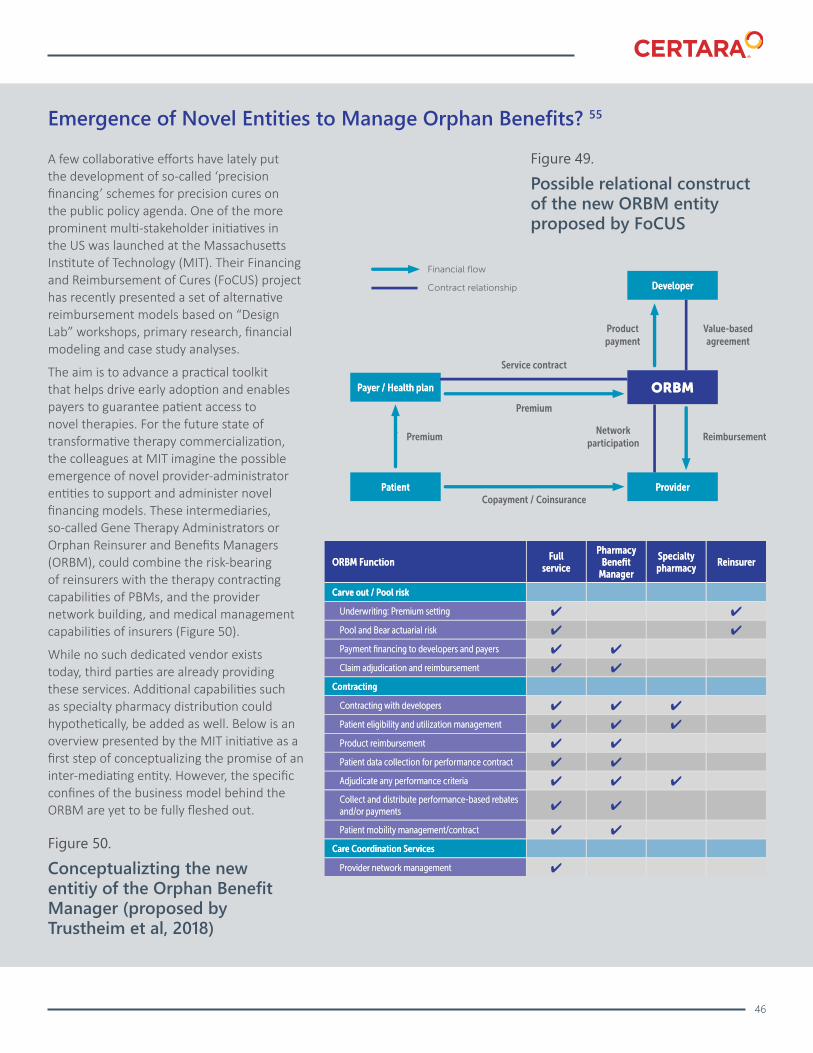
Emergence of Novel Entities to Manage Orphan Benefits? 55
A few collaborative efforts have lately put the development of so-called ‘precision financing’ schemes for precision cures on the public policy agenda. One of the more prominent multi-stakeholder initiatives in the US was launched at the Massachusetts Institute of Technology (MIT). Their Financing and Reimbursement of Cures (FoCUS) project has recently presented a set of alternative reimbursement models based on “Design Lab” workshops, primary research, financial modeling and case study analyses.
The aim is to advance a practical toolkit that helps drive early adoption and enables payers to guarantee patient access to novel therapies. For the future state of transformative therapy commercialization, the colleagues at MIT imagine the possible emergence of novel provider-administrator entities to support and administer novel financing models. These intermediaries, so-called Gene Therapy Administrators or Orphan Reinsurer and Benefits Managers (ORBM), could combine the risk-bearing of reinsurers with the therapy contracting capabilities of PBMs, and the provider network building, and medical management capabilities of insurers (Figure 50).
While no such dedicated vendor exists today, third parties are already providing these services. Additional capabilities such as specialty pharmacy distribution could hypothetically, be added as well. Below is an overview presented by the MIT initiative as a first step of conceptualizing the promise of an inter-mediating entity. However, the specific confines of the business model behind the ORBM are yet to be fully fleshed out.
Figure 49.
Possible relational construct of the new ORBM entity proposed by FoCUS
Figure 50.
Conceptualizting the new entitiy of the Orphan Benefit Manager (proposed by Trustheim et al, 2018)
47
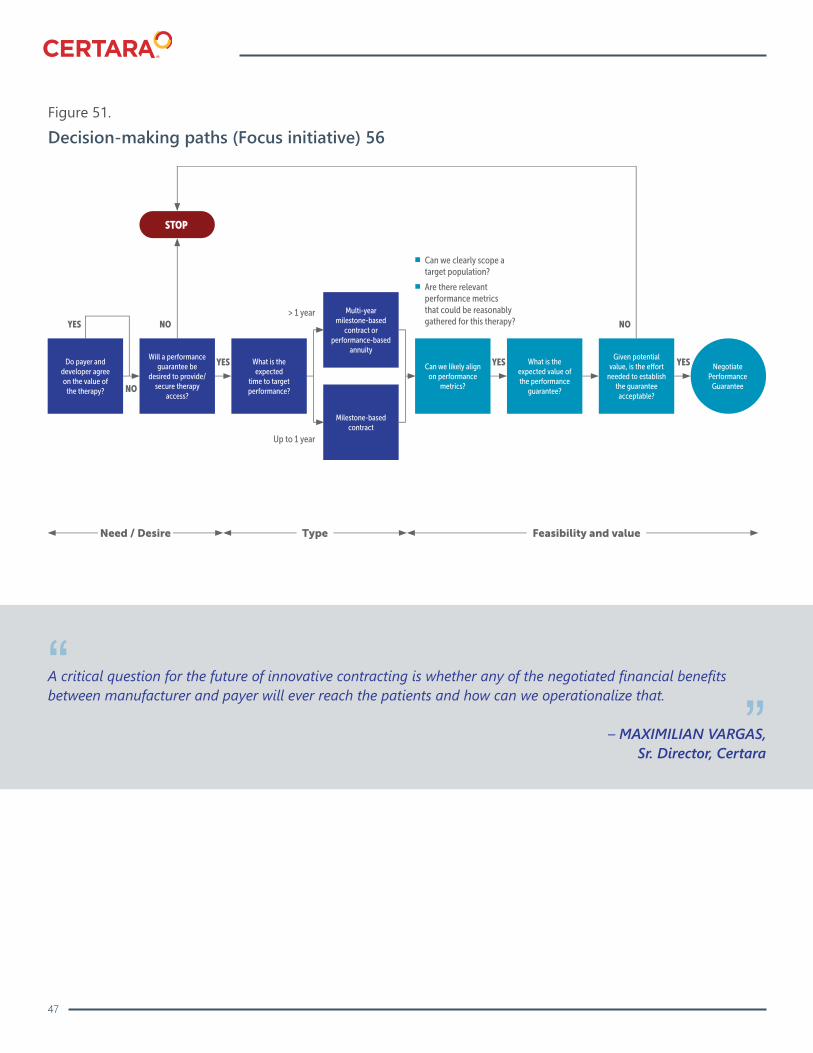
Figure 51.
Decision-making paths (Focus initiative) 56
A critical question for the future of innovative contracting is whether any of the negotiated financial benefits between manufacturer and payer will ever reach the patients and how can we operationalize that.
– MAXIMILIAN VARGAS, Sr. Director, Certara
“”

48
Figure 52.
Barriers to adoption of novel financing arrangements, and innovative horizons to overcome them

Escalating PolicyEnvironment

50
Legislative context
Passed regulations
• In the 2020 campaign for the US White House, the pharmaceutical industry had become a prime target of bipartisan outrage. We should note that the healthcare debate’s focus on drug costs and pricing processes is not new – it has been a matter of public debate for over thirty years. The recent inflation of regulatory rule-making in Washington and the degree of disruption likely to be caused by key legislative proposals, are seen by many as historically unprecedented.
• With the so-called “Blueprint”, the Trump Administration released an aggressive set of drug pricing reform concepts in May 2018 aiming to combine volume control with limitations on branded drug spending followed by rule-making activity at unforeseen levels.
• Several regulatory proposals are still under debate, and some have been withdrawn following public comment periods. By many accounts, one of the most disruptive and the furthest progressed towards becoming law is the International Pricing Index Proposal (IPI) that seeks to peg Part B prices on averaged Ex-US prices. It is currently pending under OMB. Listen to our our 2018 analysis here: https://tinyurl.com/ ybwy2d32.
• Final rule-making with respect to Medicare Part B:
• Allowing Medicare Advantage plans to use step therapy for physician-administered drugs.
• Payment reduction for drugs purchased with 340B discount to ASP- 22.5%.
• Changes to new drug reimbursement (prior to ASP data availability) to 103$ of WAC (with sequestration cuts, effectively WAC +1.35%).
• Final rule-making with respect to Medicare Part D:
• Plans given broader flexibility to make formulary maintenance changes mid-year immediately upon generic approval.
• Announcement of the voluntary “Senior Savings Model”, offering alternative Part D options with OOP cost caps for a set of plan-formulary insulins at $35/30-day supply for both standalone PDPs and Medicare Advantage (MA-PD) with beginning CY 2021 participating developers Lilly, Novo Nordisk and Sanofi.
In recent years, health policy pushes have seen an increasingly nuclear focus on drug costs and pricing processes. We are witnessing regulatory moves at unforeseen speed towards combining volume control with regulations on pharmacy costs on the federal level. At the same time there is an escalation in various state legislatures to regulate drug pricing transparency, co-pay assistance, importation, rate setting, price gouging, spending targets, group purchasing and biosimilar substitution.
– ULRICH NEUMANN, Sr. Director, Certara
“
”

51
Major congressional legislation• Key piece of legislation passed in the
House of Representatives is H.R.3, the “Lower Drug Costs Now Act”, combining various measures in three main categories: Inflation-based rebates, caps on patient out-of-pocket spending and direct price negotiations. The latter would be run by the federal government but grants access to prices to all commercial plans, applied to at least 25 and at most 250 drugs, leveraging tax penalties for developers who refuse to come to accept agreements within 2 months which can range to from 65% and up to 95% of sales proceeds. Estimates suggest the bill would reduce net revenues of developers by up to $1 trillion or roughly 58% of companies’ earnings before interest and taxes (EBIT),57 and the non-partisan Congressional Budget Office predicted that $456bn savings to the government over 10 years may come with the effect of 30 fewer novel
drugs coming to market given reduced innovation incentives. Other health economic studies indicate that the impact on small and emerging biotech could be more dramatic resulting in small biotech in states like California developing 88% fewer drugs.58
• A major bill under discussion in the Senate is the bi-partisan legislation passed within the Senate Financing Committee. The “Prescription Drug Pricing Reduction Act” by Senators Grassley and Widen is drawing on inflation caps and benefit re-designs aiming to reduce government spending on drugs by $100 billion across Medicare and Medicaid programs over the next decade. The bill received support from the White House but at the time of publication of this report has yet to be brought to a Senate floor vote by Senate Majority Leader McConnell.
• If we dissect the major drug pricing reform bills that are currently debated in both houses of Congress and under consideration for rule making by HHS, we find a cluster of core policies suggestions:
• Government Drug Price Negotiation (e.g. in H.R. 3),
• Importation of Products (proposed by HHS in Dec. 2019, such as from Canada),
• Pass-Through of Rebates (to Point-of Sale, e.g. HHS proposal in 2019),
• External Reference Pricing (i.e. adjusted by international price basket of selected countries, proposed as the HHS IPI Model for Part B),
• Internal Reference Pricing (i.e. adjusted with a price basket of similar therapeutics, a called pre-specified equivalence class).
Figure 53.
Key legislative proposals impact on Part D re-design59

52
Policy Dashboards: Positioning payers on drug pricing proposals
• Figure 53 shows the overall level of support of key payer archetypes for the core reform policies. PBMs tend to be least enthusiastic about current price reform proposals being on average “neutral” across all policies. With the exception of large plans which fall in slightly opposing territory on government price controls, we must note that at least, on average, no other payers are opposed or strongly opposed to any of the legislative proposal though.
• Internal reference pricing and drug importation are most supported by midsized plans. Small plan representatives lead support on international price referencing, while IDNs lead support across all other policy categories. Except for internal reference pricing which receives strong marks from mid-size plan representatives, looking across the mean the level of support is in broad summary not enthusiastic but still mildly in favor.
• Given the potentially drastic consequences of these proposals on pharmaceutical spending and innovation as well as the very nature of payer-pharma engagements, we decided to present six panels with a closer look on various payer types. These deep dives reveal the level of support for the current proposals within archetypes as well as the noticeable range of opinions among their individual payer representatives. While we underscore that these results are qualitative in nature and not a representative survey of the US payer universe, they offer unique insights into the considerable support that exists among so many commercial insurers, responsible for millions of US lives, for a set of policies that are historically antithetical
to the free market-based drug pricing paradigm that distinguished the US from the rest of the world for many decades. We believe that a shift in political and public opinion has made its mark on payer sentiments; a trend our research will closely document in future editions of this report.
• Overall, most payers are in favor of drug pricing proposals--with IDNs and midsized/medium plans the most supportive and PBMs the least supportive. Proposals around internal reference pricing and international pricing indexing draw the most support across all payer archetypes.
Figure 54.
Average level of support for legislative proposals around drug pricing
53
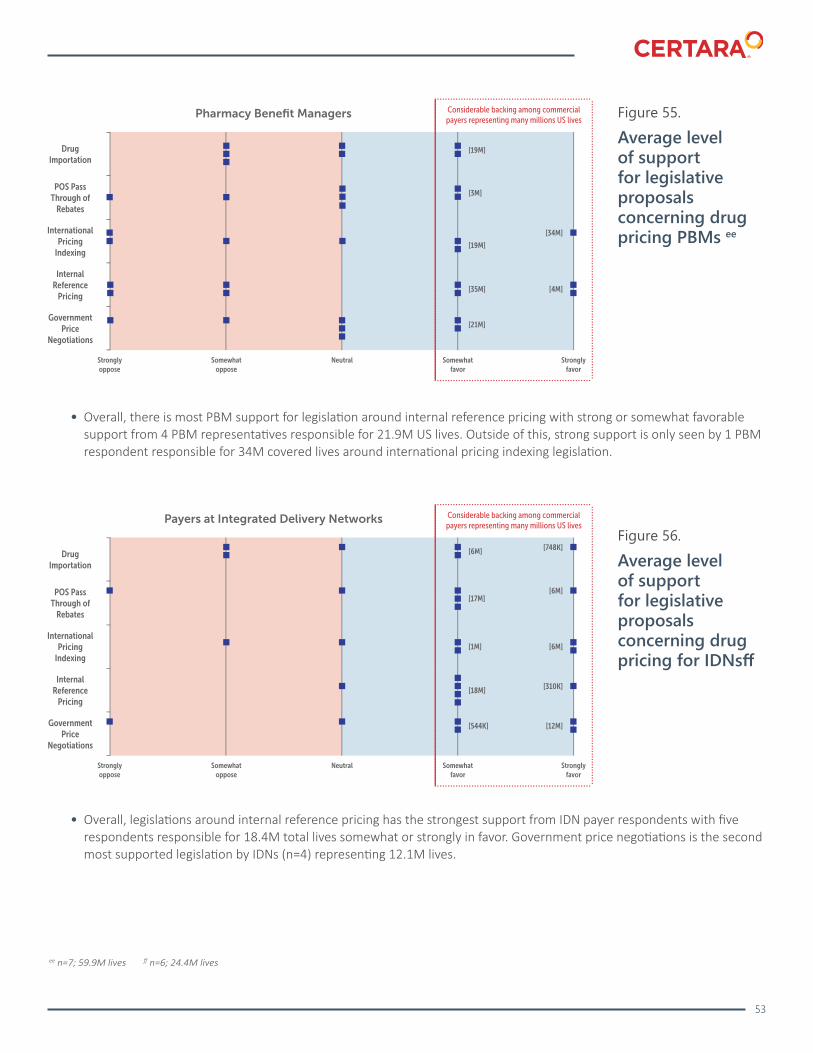
• Overall, there is most PBM support for legislation around internal reference pricing with strong or somewhat favorable support from 4 PBM representatives responsible for 21.9M US lives. Outside of this, strong support is only seen by 1 PBM respondent responsible for 34M covered lives around international pricing indexing legislation.
• Overall, legislations around internal reference pricing has the strongest support from IDN payer respondents with five respondents responsible for 18.4M total lives somewhat or strongly in favor. Government price negotiations is the second most supported legislation by IDNs (n=4) representing 12.1M lives.
Figure 55.
Average level of support for legislative proposals concerning drug pricing PBMs ee
Figure 56.
Average level of support for legislative proposals concerning drug pricing for IDNsff
ee n=7; 59.9M lives ff n=6; 24.4M lives

54
• Large plans representing 121.6M lives support international pricing indexing. The second most supported pricing proposal across large plans by those responsible for 115.9M lives are around internal reference pricing.
• Across mid-sized plans, the most supported legislative proposal is for internal reference pricing favored by plans representing 10M lives. International Pricing Indexing is the second most supported proposal across plans responsible for 9.5M lives.
Figure 57.
Average level of support forlegislative proposals concerningdrug pricing for Large plans gg
Figure 58.
Average level of support for legislative proposals concerning drug pricing for Medium/mid-sized plans hh
gg n=16, 182M lives hh n=8; 13.5M lives
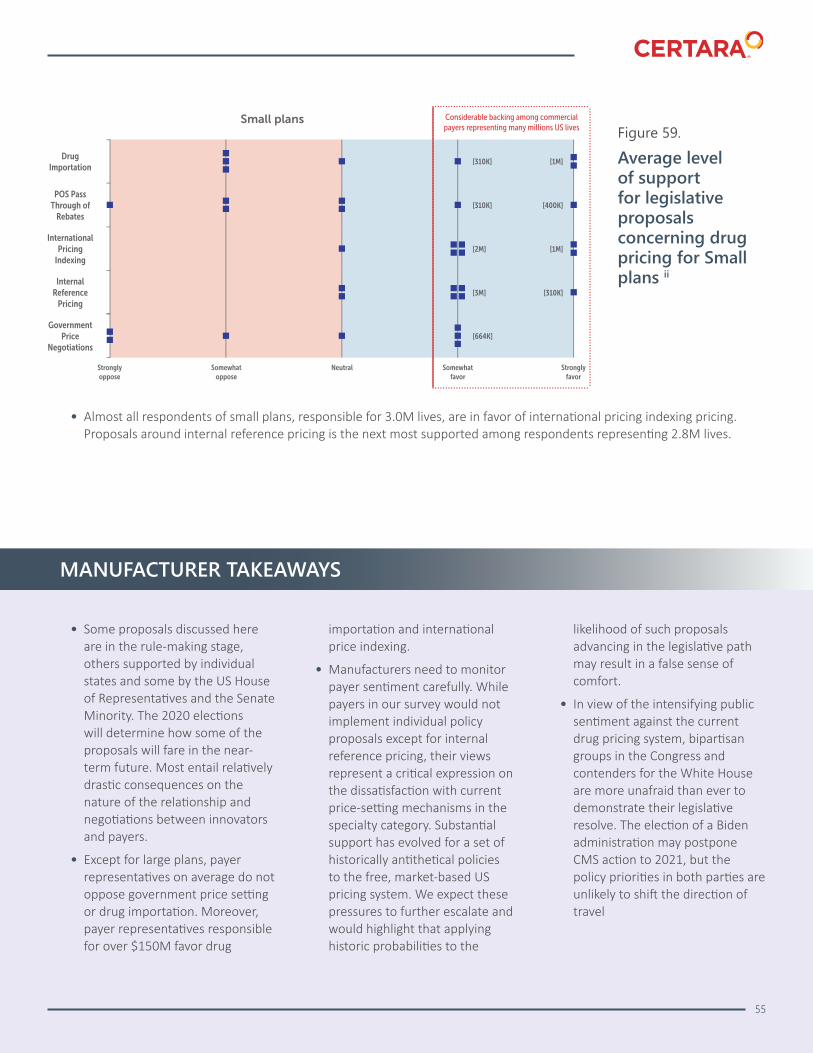
• Almost all respondents of small plans, responsible for 3.0M lives, are in favor of international pricing indexing pricing. Proposals around internal reference pricing is the next most supported among respondents representing 2.8M lives.
Figure 59.
Average level of support for legislative proposals concerning drug pricing for Small plans ii
MANUFACTURER TAKEAWAYS
• Some proposals discussed here are in the rule-making stage, others supported by individual states and some by the US House of Representatives and the Senate Minority. The 2020 elections will determine how some of the proposals will fare in the near-term future. Most entail relatively drastic consequences on the nature of the relationship and negotiations between innovators and payers.
• Except for large plans, payer representatives on average do not oppose government price setting or drug importation. Moreover, payer representatives responsible for over $150M favor drug
importation and international price indexing.
• Manufacturers need to monitor payer sentiment carefully. While payers in our survey would not implement individual policy proposals except for internal reference pricing, their views represent a critical expression on the dissatisfaction with current price-setting mechanisms in the specialty category. Substantial support has evolved for a set of historically antithetical policies to the free, market-based US pricing system. We expect these pressures to further escalate and would highlight that applying historic probabilities to the
likelihood of such proposals advancing in the legislative path may result in a false sense of comfort.
• In view of the intensifying public sentiment against the current drug pricing system, bipartisan groups in the Congress and contenders for the White House are more unafraid than ever to demonstrate their legislative resolve. The election of a Biden administration may postpone CMS action to 2021, but the policy priorities in both parties are unlikely to shift the direction of travel
55

56
1 Bangia I, Garcia Padilla J, Neumann U, Vargas M. A Survey-Based Analysis of Formulary Decision Making and Utilization Management Trends Across Managed Care Organizations. In Journal of Managed Care and Specialty Pharmacy; April 2020; Houston, TX.
2 Neumann U, Bangia I, Garcia Padilla J, Vargas M. A Systematic Comparison of Status Quo and Future Expectations for Novel Drug Financing Strategies Across Managed Care Organizations. In Journal of Managed Care and Specialty Pharmacy; April 2020; Houston, TX.
3 Centers for Medicare & Medicaid Services; 2018. https://www. cms.gov/Medicare/Health-Plans/MedicareAdvtgSpecRateStats/ Downloads/Announcement2019.pdf. Accessed April 20, 2020.
4 Why Small Molecules Are Still a Big Deal. The Medicine Maker. https://themedicinemaker.com/manufacture/why-smallmolecules-are-still-a-big-deal. Published 2020. Accessed April 6, 2020.
5 Specialty Pharmaceuticals | AMCP.org. Amcp.org. https://www. amcp.org/about/managed-care-pharmacy-101/conceptsmanaged-care-pharmacy/specialty-pharmaceuticals. Published 2020. Accessed April 6, 2020.
6 Medication Access Report. Covermymeds.com. https://www. covermymeds.com/main/medication-access-report/. Published 2020. Accessed April 6, 2020.
7 Rosenthal M. The Year in Drug Approvals: Specialty Still Leads the Pack. Pharmacypracticenews. https://www.pharmacypracticenews. com/Policy/Article/12-19/The-Year-in-Drug-Approvals-SpecialtyStill-Leads-the-Pack/56748. Published 2019. Accessed April 6, 2020.
8 Fda.gov. https://www.fda.gov/media/134493/download. Published 2020. Accessed April 6, 2020.
9 2019 State of Specialty Pharmacy Report. Academynet.com. https:// academynet.com/sites/default/files/csi2019spreport.pdf. Published 2020. Accessed April 6, 2020.
10 2018 Drug Trend Report. Express Scripts; 2019. https://www. express-scripts.com/corporate/2018-drug-trend-report. Accessed April 6, 2020.
11 Toich L. Increases in Cost, Utilization Drive Specialty Drug Spending Growth. Pharmacy Times. https://www.pharmacytimes.com/news/ increases-in-cost-utilization-drive-specialty-drug-spendinggrowth. Published 2018. Accessed April 6, 2020.
12 2019 State of Specialty Spend and Trend Report. Artemetryx; 2019.
13 Fein, J. A. Which PBM Best Managed Drug Spending in 2018: CVS Health, Express Scripts, MedImpact, or Prime Therapeutics?. Drugchannels.net. https://www.drugchannels.net/2019/05/whichpbm-best-managed-drug-spending-in.html. Published 2020. Accessed April 6, 2020.
14 Segalco.com. https://www.segalco.com/media/1664/segal_trend_ survey_2020.pdf. Published 2019. Accessed April 6, 2020.
15 Rumore M, Vogenberg F. Biosimilars: Still Not Quite Ready for Prime Time. P&T Community. https://www.ptcommunity.com/journal/ article/full/2016/6/366/biosimilars-still-not-quite-ready-primetime. Published 2020. Accessed April 6, 2020.
16 Medication Access Report. Covermymeds.com. https://www. covermymeds.com/main/medication-access-report/. Published 2020. Accessed April 6, 2020.
17 FDA Continues Strong Support of Innovation in Development of Gene Therapy Products. U.S. Food and Drug Administration. https:// www.fda.gov/news-events/press-announcements/fda-continuesstrong-support-innovation-development-gene-therapy-products. Published 2020. Accessed April 6, 2020.
18 Long D. Medimpact: 2018-2019 Pharmaceutical Marketplace Trends. IQVIA; 2019. https://conference.medimpact.com/ documents/398252/453336/MedImpact+2019+0415.pdf/ e440e7d0-8e65-4bc4-90c0-457ef25cf004. Accessed April 6, 2020.
19 EMD Serono Specialty Digest: Managed Care Strategies For Specialty Pharmaceuticals. 14th ed. EMD Serono; 2018.
57
20 Jacobsen G, Freed M, Damico A, Neuman T. A Dozen Facts About Medicare Advantage in 2019. The Henry J. Kaiser Family Foundation. https://www.kff.org/medicare/issue-brief/a-dozenfacts-about-medicare-advantage-in-2019/. Published 2019. Accessed April 6, 2020.
21 Adapted from: Modernize Prior Authorization to Ensure Access to Care. Rheumatology.org. https://www.rheumatology.org/ Portals/0/Files/Issue-Brief-Prior-Authorization-Process.pdf. Accessed April 6, 2020.
22 Cut Red Tape for Family Physicians, AAFP Tells Congress.afp.org. https://www.aafp.org/news/government-medicine/20190923house testimony.html. Published 2019. Accessed April 6, 2020.
23 2018 AMA Prior Authorization (PA) Physician Survey. American Medical Association; 2019. https://www.ama-assn.org/system/ files/2019-02/prior-auth-2018.pdf. Accessed April 14, 2020.
24 2018 AMA Prior Authorization (PA) Physician Survey. American Medical Association; 2019. https://www.ama-assn.org/system/ files/2019-02/prior-auth-2018.pdf. Accessed April 14, 2020.
25 2018 AMA Prior Authorization (PA) Physician Survey. American Medical Association; 2019. https://www.ama-assn.org/system/ files/2019-02/prior-auth-2018.pdf. Accessed April 14, 2020.
26 Modernize Prior Authorization to Ensure Access to Care. Rheumatology.org. https://www.rheumatology.org/Portals/0/Files/ Issue-Brief-Prior-Authorization-Process.pdf. Accessed April 6, 2020.
27 The Prior Authorization Burden in Healthcare – Center for Health Innovation & Implementation Science. Center for Health Innovation & Implementation Science. https://www.hii.iu.edu/the-priorauthorization-burden-in-healthcare/. Published 2018. Accessed April 6, 2020.
28 Prior authorization obstacles unnecessarily delay patient access to cancer treatments, physician survey finds - American Society for Radiation Oncology (ASTRO) - American Society for Radiation Oncology (ASTRO). Prior authorization obstacles unnecessarily delay patient access to cancer treatments, physician survey finds. https://www.astro.org/News-and-Publications/News-and-MediaCenter/News-Releases/2019/Prior-authorization-obstaclesunnecessarily-delay. Accessed June 1, 2020.
29 US Department of Health and Human Services Office of Inspector General. Medicare Advantage Appeal Outcomes and Audit Findings Raise Concerns About Service and Payment Denials. 2018. https:// oig.hhs.gov/oei/reports/oei-09-16-00410.pdf
31 Seiz B. Medical Benefit Management Controls Specialty Drug Spend. Express-scripts.com. https://www.express-scripts.com/corporate/ articles/medical-benefit-management-controls-specialty-drugspend. Published 2019. Accessed April 6, 2020.
32 Seiz B. Medical Benefit Management Controls Specialty Drug Spend. Express-scripts.com. https://www.express-scripts.com/corporate/ articles/medical-benefit-management-controls-specialty-drugspend. Published 2019. Accessed April 6, 2020.
33 Schafer J. Rare diseases are losing their immunity in formulary exclusion lists – STAT. STAT. https://www.statnews. com/2018/08/22/rare-diseases-losing-immunity-formularyexclusion/. Published 2018. Accessed April 6, 2020.
34 http://www.pembrokeconsulting.com/pdfs/2017_CVS_Health_ Standard_Formulary_Drug_Removal_List.pdf. Published 2016. Accessed April 6, 2020.
35 2014 Preferred Drug List Exclusions. Static1.1.sqspcdn. com. http://static1.1.sqspcdn.com/static/ f/854323/24139682/1388679250987/2014-ESI-Preferred-DrugList-Exclusions.pdf?token=nIq0kM89Lv3KM8pyUtBHEYkGaxk%3D. Published 2013. Accessed April 6, 2020.
58
36 Prabhu N, Manne A. ESI to Exclude 32 Drugs in 2020 From its National Preferred Formulary | DRG Blog, Market Access | DRG. DRG. https://decisionresourcesgroup.com/blog/esi-exclude32-drugs-2020-national-preferred-formulary/. Published 2019. Accessed April 6, 2020.
37 Schafer J. Rare diseases are losing their immunity in formulary exclusion lists – STAT. STAT. https://www.statnews. com/2018/08/22/rare-diseases-losing-immunity-formularyexclusion/. Published 2018. Accessed April 6, 2020.
38 Staskon, F., Kirkham, H., Pfeifer, A.,CSP, Miller, R.T., Cost and Wastage Estimates for an Oral Oncology Medication Split-Fill Option in a Patient Management Program. Poster presented at: 2019 Managed Care & Specialty Pharmacy Annual Meeting, March 25 – 28, 2019; San Diego Convention Center in San Diego, CA.
39 Staskon FC, Kirkham HS, Pfeifer A, Miller RT. Estimated Cost and Savings in a Patient Management Program for Oral Oncology Medications: Impact of a Split-Fill Component. Journal of oncology practice. 2019;15(10):e856-e862.
40 AllianceRx Walgreens Prime study demonstrates oral oncology split-fill program drives adherence, reduces costs and decreases medication waste. BioSpace. https://www.biospace.com/article/ releases/alliancerx-walgreens-prime-study-demonstrates-oraloncology-split-fill-program-drives-adherence-reduces-costs-anddecreases-medication-waste/. Published March 26, 2019. Accessed April 6, 2020.
41 Seiz B. Medical Benefit Management Controls Specialty Drug Spend. Express-scripts.com. https://www.express-scripts.com/corporate/ articles/medical-benefit-management-controls-specialty-drugspend. Published 2019. Accessed April 6, 2020.
42 Seiz B. Medical Benefit Management Controls Specialty Drug Spend. Express-scripts.com. https://www.express-scripts.com/corporate/ articles/medical-benefit-management-controls-specialty-drugspend. Published 2019. Accessed April 6, 2020.
43 Chawla A, Westrich K, Matter S, Kaltenboeck A, Dubois R. Care pathways in US healthcare settings: current successes and limitations, and future challenges. The American journal of managed care. 2016;22(1):53-62.
44 Cohen J. Drug Formulary Managers’ Use Of Step Therapy Can Lead To Sub-Optimal Outcomes. Forbes. https://www.forbes.com/sites/ joshuacohen/2019/09/09/drug-formulary-managers-use-of-steptherapy-can-lead-to-sub-optimal-outcomes/#62f67f8a6374. Published September 9, 2019. Accessed April 6, 2020.
45 EMD Serono Specialty Digest: Managed Care Strategies For Specialty Pharmaceuticals. 14th ed. EMD Serono; 2018.
46 Prabhu N, Manne A. ESI to Exclude 32 Drugs in 2020 From its National Preferred Formulary | DRG Blog, Market Access | DRG. DRG. https://decisionresourcesgroup.com/blog/esi-exclude32-drugs-2020-national-preferred-formulary/. Published 2019. Accessed April 6, 2020.
47 Waddill K. Cigna Uses Industry Consolidation to Increase Access to Gene Therapy. Cigna Uses Industry Consolidation to Increase Access to Gene Therapy. https://healthpayerintelligence.com/news/ cigna-uses-industry-consolidation-to-increase-access-to-genetherapy. Published September 9, 2019. Accessed April 6, 2020.
48 Belazi D. Amazon Purchase of PillPack Poses Disruptions of Healthcare Environment. StackPath. https://www. hcinnovationgroup.com/clinical-it/pharmacy/article/21072247/ amazon-purchase-of-pillpack-poses-disruptions-of-healthcareenvironment. Published May 15, 2019. Accessed April 6, 2020.
49 Japsen B. Why Amazon Makes A Big Pharmacy Move In 2020. Forbes. https://www.forbes.com/sites/brucejapsen/2019/12/30/whyamazon-will-make-a-big-pharmacy-move-in-2020/#5eb14cf62b54. Published January 7, 2020. Accessed April 6, 2020.
50 Segalco.com. https://www.segalco.com/media/1664/segal_trend_ survey_2020.pdf. Published 2019. Accessed April 6, 2020.

59
51 Altendorf S. Lessons Learned: Starting a Health-System, Oncologyfocused Specialty Pharmacy. Pharmacy Times. https://www. pharmacytimes.com/publications/Directions-in-Pharmacy/2019/ September2019/lessons-learned-starting-a-healthsystemoncologyfocused-specialty-pharmacy. Published September 177, 2019. Accessed April 6, 2020.
52 Harvard Pilgrim is first health plan to directly negotiate outcomesbased agreement for groundbreaking gene therapy. Harvard Pilgrim Health Care. https://www.harvardpilgrim.org/public/ news-detail?nt=HPH_News_C&nid=1471914707173. Accessed April 6, 2020.
53 Pharma Exec Trends.
54 US Department of Health and Human Services. HHS Advances Payment Model to Lower Drug Costs for Patients. HHS.gov. https:// www.hhs.gov/about/news/2018/10/25/hhs-advances-paymentmodel-to-lower-drug-costs-for-patients.html. Published October 29, 2018. Accessed June 1, 2020.
55 Source: Paying for Cures Toolkit (2019). Financing and Reimbursement of Cures in the US (FoCUS) Project, NEWDIGS Initiative, Center for Biomedical Innovation, Massachusetts Institute of Technology, Cambridge, MA.
56 Trusheim, M. et al., Improving Management of Gene and Cell Therapies, Pharmaceutical Executive (Sep. 10, 2018), accessed 6/18/2019.
57 Cole M, Brantley K, Stengel K. The Public Option: Single Payer on the Installment Plan. Impact of H.R.3 Scenarios on Federal Spending and Drug Manufacturer Revenues. https://www.heritage.org/sites/ default/files/2020-02/BG3462_0.pdf. Accessed June 1, 2020.
58 Vital Transformations (2019). H.R. 3 – Medicare Part D Reform. Calculating the Impact of International Reference Pricing on California’s Biopharmaceutical Innovation Ecosystem. Retrieved from https://califesciences.org/wp-content/uploads/2019/10/ FINAL-Vital-Transformation-HR-3-Analysis-for-CLSA-10.30.19.pdf
59 Sources: Andel, M. Getting Up to Speed on Prescription Drug Pricing Reform Efforts. AMCP Briefing. 2019, H.R. 3 Bill Text: https://www.congress.gov/116/bills/hr3/BILLS-116hr3eh.pdf; H.R. 3 CBO Score: https://www.cbo.gov/system/files/2019-12/ hr3_complete.pdf; Senate Legislative Bill Text: https://www.finance. senate.gov/imo/media/doc/Prescription%20Drug%20Pricing%20 Reduction%20and%20Health%20and%20Human%20Services%20 Improvements%20Act.pdf; Senate CBO Score:https://www.finance. senate.gov/imo/media/doc/2020-03-13%20PDPRA-SFC%20 CBO%20Table.pdf

© Copyright Certara 2020
About CertaraAt Certara, we accelerate medicines to patients, partnering with life science innovators. Together with our partners, we use biosimulation and technology-enabled services to transform drug discovery and development.
For more information visit www.certara.com or email [email protected].