keynote address: energy renaissance · manufacturing renaissance to be the key driver in re-raising...
TRANSCRIPT


Keynote Address: Energy renaissance – capitalising on the direct and indirect
investment opportunities from shale energy
Christopher Moore Portfolio Manager
Fidelity Worldwide Investment

Investment opportunities within a Shale theme
Christopher MoorePortfolio ManagerGlobal Equities
October 2013
This information is for investment professionals only

Christopher Moore Portfolio Manager
Funds currently under management
Shale Opportunities Strategy* March 2013 - present
FF Global Industrials Fund (sole responsibility) Mar 2012 – present
FF Global Industrials Fund (joint with Angel Agudo) Jan 2011 – Mar 2012
Experience at Fidelity
Assistant Portfolio Manager, FF Global Industrials Fund 2010
Director of Research, Emerging Markets, Consumer & Healthcare teams 2009 – 2010
Team Leader, Natural Resources, Energy & Utilities 2007 – 2009
European Research Analyst , Mid & Large-cap Utilities 2005 – 2009
Previous experience
Deloitte & Touche 2002 – 2004
Arthur Andersen Business Consulting 1998 – 2002
Christopher Moore Portfolio Manager
Based in: London
Years of investment experience: 8
Education: MBA, (Said Business School, Oxford)
BA Philosophy, Politics & Economics (University College Oxford)
Source: FIL Limited as at 30 August 2013. * Segregated Account, not a pooled fund.
1

Upstream: The US shale industry has been building out for over a decade & now has an unassailable lead
2
Proliferation of US shale opportunities

Upstream: The US shale industry has been building out for over a decade & now has an unassailable lead (contd.)
3
Geology better understood – forecasts revised
Source: Wood MacKenzie

Upstream: The US shale industry has been building out for over a decade & now has an unassailable lead (contd.)
4
Horizontal & pad drilling is driving the phenomenon
Source: Baker Hughes
Upstream: The US shale industry has been building out for over a decade & now has an unassailable lead (contd.)
5
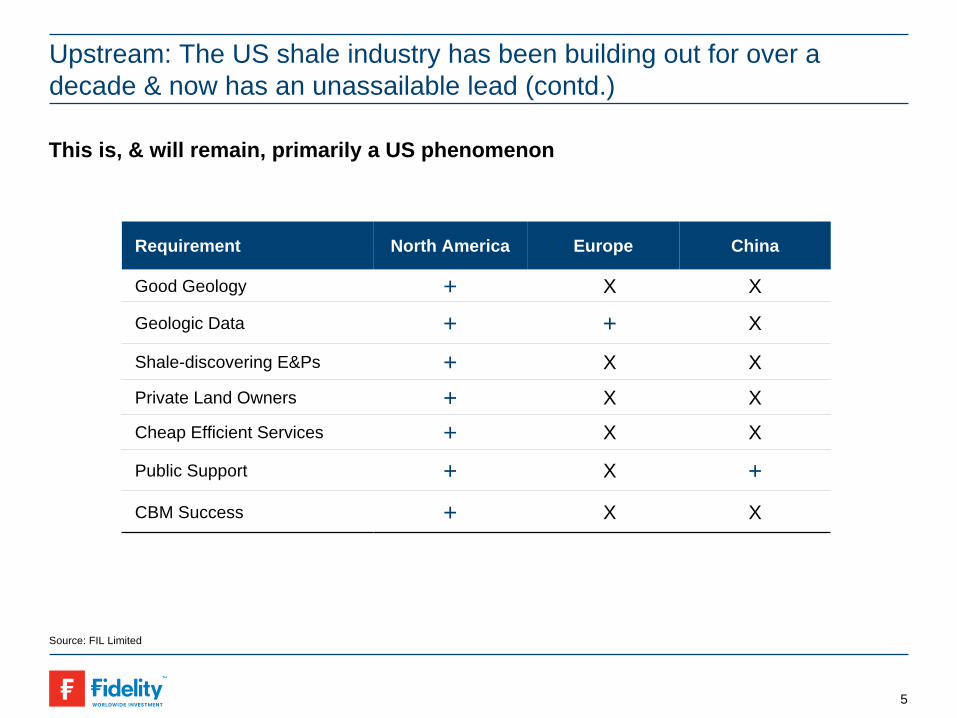
This is, & will remain, primarily a US phenomenon
Requirement North America Europe China
Good Geology + X X
Geologic Data + + X
Shale-discovering E&Ps + X X
Private Land Owners + X X
Cheap Efficient Services + X X
Public Support + X +CBM Success + X X
Source: FIL Limited

Stacked zones refer to the discovery of independent oil at different depths
Multiple zones have recently been proved up in the Permian basin where 22 zones have been discovered i.e. an initial 100k acres could turn into >1m acres.
The same potential exists in the Bakken, as shown
Thought about a different way, each acre accrues multiple times its initial value
US shale technology & efficiency continues to move ahead, currently driven by attacking stacked zones & downspacing
Sources: Continental Resources
Three forks potential under the Bakken shale
6

US shale technology & efficiency continues to move ahead, currently driven by attacking stacked zones & downspacing (contd.)
Better understanding of basins leads to more accurate forecasts of decline rates & peak production giving a base Internal Rate of Return (IRR) stretching out over a decade
Example: EOG is achieving over 50% returns from the Eagle Ford, but this can increase further from higher recovery rates (only 8% of oil is recovered), downspacing & the discovery of stacked zones
*The differential includes an NGL adjustmentSource: EOG Resources
With field model at $100 Brent EF Oil
IRR @100 Brent 51.0%Breakeven $/bbl (15% IRR) 68.9
NPV $/bbl @ 100$ Brent 6.3
EUR 495
Oil reserves (mmboe) 7,785
2013 oil production mbls/d 456
Differential to Brent 14.9
Well cost ($) 8.0
Decline rate yr 1 (%) 80%
Decline rate yr 2 (%) 40%
Production peak (yr) 2023
Eagle Ford Economics* Eagle Ford production profile
7

Giving the US greater geopolitical freedom & lower oil/gas costs for a range of industries
8
Sources: Boenning & Scattergood
US petroleum trade balance (in billions $)
The US oil trade balance has more than halved in the last 5 years, setting it on course for oil self-sufficiency around 2020
This may suggest an increasing disinterest in Middle Eastern politics, given reducing dependence on its oil

Giving the US greater geopolitical freedom & lower oil/gas costs for a range of industries (cont’d)
9
Shale gas has established a 400% US price advantage vs. other regions
Prior to any manufacturing renaissance, this cheaper energy should drive a 70bp p.a. accretion to US GDP growth by 2015, even excluding the impact of shale oil*
Global natural gas prices – from 1984 – 2012
*IHS Global InsightSources: BP Statistical Review

Midstream & logistics: 2013 has been the year of diminishing returns for refiners as pipelines are built & the train takes the strain
10
Bakken gas flaring (due to lack of pipelines) has been visible from space.
Huge ongoing investment in both oil & gas pipelines is now more efficiently getting product to regional hubs
Source: Credit Suisse, August 2013

Midstream & logistics: 2013 has been the year of diminishing returns for refiners as pipelines are built & the train takes the strain (cont’d)
11
The oil pipeline & crude by rail network build out has ended the cheap oil windfall received by refiners in 2011/12 when the brent/WTI spread ballooned to >$25.
Pipelines can't do it all - rail, trucking & inter- model will continue to play a part as oil production increases
Supply and takeaway capacity growth – Base case
Source: FIL Limited as at 31 January 2013
New Supply

Downstream: the coming boom in petrochemical, gas fired power, fertilizers, & LNG capex
Source: IHS, Credit Suisse. October 2013
Cheap Ethane leads to ethylene cracker investment
12
Global Ethylene cash cost comparison Incremental US chemical capex
0
2000
4000
6000
8000
10000
12000
14000
16000
18000
2000019
90‐94
1991
‐95
1992
‐96
1993
‐97
1994
‐98
1995
‐99
1996
‐00
1997
‐01
1998
‐02
1999
‐03
2000
‐04
2001
‐05
2002
‐06
2003
‐07
2004
‐08
2005
‐09
2006
‐10
2007
‐11
2008
‐12
2009
‐13
2010
‐14
2011
‐15
2012
‐16
5yr projection
Actual additions
5yr projection
Actual additions
Downstream: the coming boom in petrochemical, gas fired power, fertilizers, & LNG capex (cont’d)
13
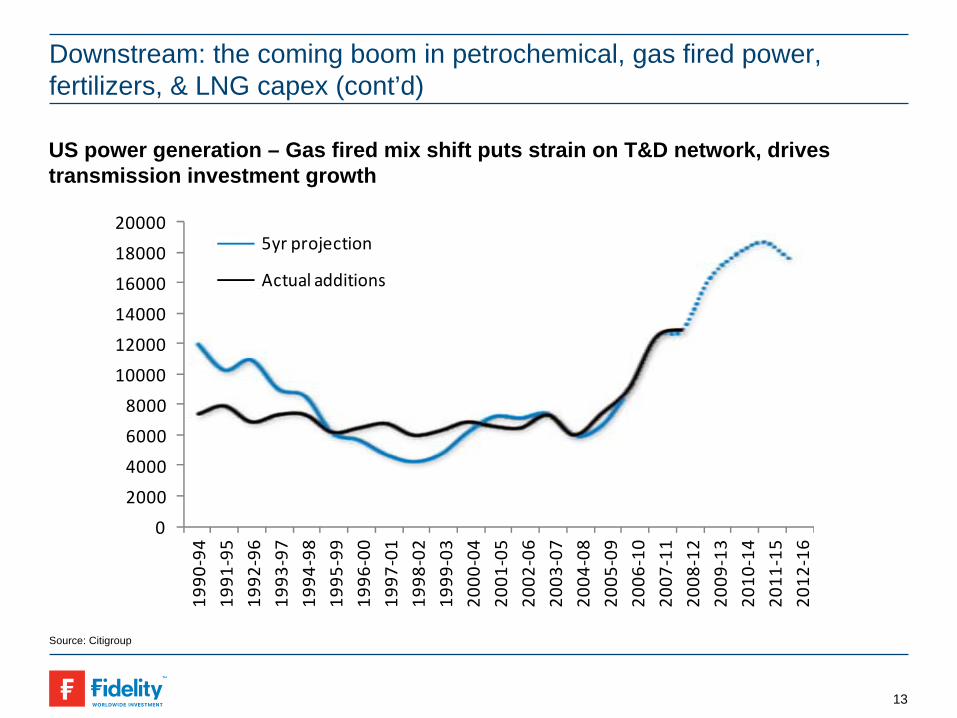
US power generation – Gas fired mix shift puts strain on T&D network, drives transmission investment growth
Source: Citigroup
Downstream: the coming boom in petrochemical, gas fired power, fertilizers, & LNG capex (cont’d)
14
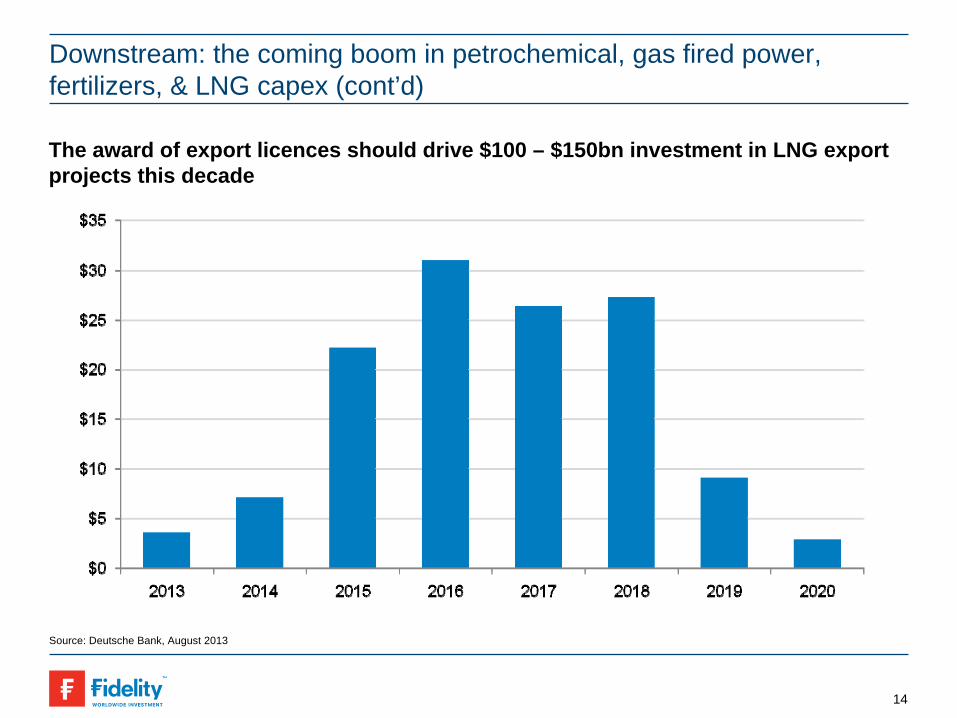
The award of export licences should drive $100 – $150bn investment in LNG export projects this decade
Source: Deutsche Bank, August 2013
With opportunities greatest for EPCs, flow & automation companies
15
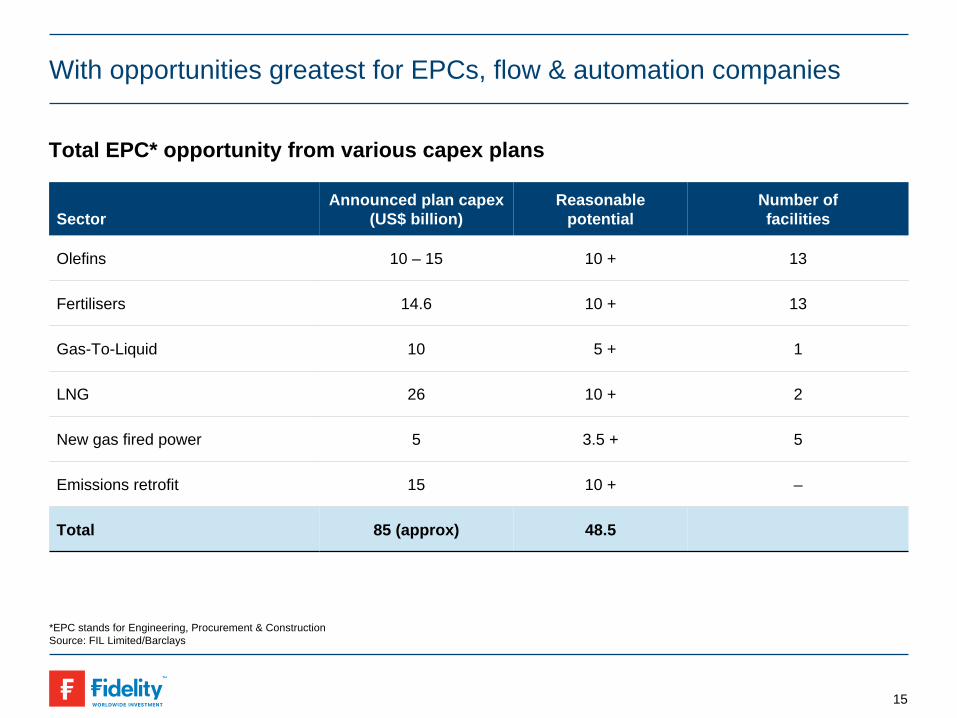
Total EPC* opportunity from various capex plans
SectorAnnounced plan capex
(US$ billion)Reasonable
potentialNumber of facilities
Olefins 10 – 15 10 + 13
Fertilisers 14.6 10 + 13
Gas-To-Liquid 10 5 + 1
LNG 26 10 + 2
New gas fired power 5 3.5 + 5
Emissions retrofit 15 10 + –
Total 85 (approx) 48.5
*EPC stands for Engineering, Procurement & ConstructionSource: FIL Limited/Barclays

EPC suppliers – backlogs back to peak and growing
With opportunities greatest for EPCs, Flow & Automation companies (cont’d)
Source: Barclays, August 2013 Source: Company Data
16
Shale Capex
140,000
120,000
100,000
80,000
60,000
40,000
20,000
-
4Q08
1999
2001
2003
2005
2006
4Q06
2Q07
4Q07
2Q09
4Q09
2Q10
4Q10
2Q11
2Q12
4Q12
4Q11
2Q08
FLRSHAWCBIKBRBWCMDRFWLTJEC
$ m
illion

Followed by the wider economic benefits of a US manufacturing renaissance
17
Cheap gas – helps steel, paper, chemicals & metals
Source: Louisiana State University Center for Energy Studies, FIL Limited. 31January 2013

Followed by the wider economic benefits of a US manufacturing renaissance (cont’d)
18
Gas as a transport fuel America’s natural gas highway
Source: Louisiana State University Center for Energy Studies, FIL Limited. 31January 2013. Credit Suisse October 2013
LNG truck fuelling coast-coast and border-to-border
3.7 billion cubic feet per day needed by 2020 for US transport
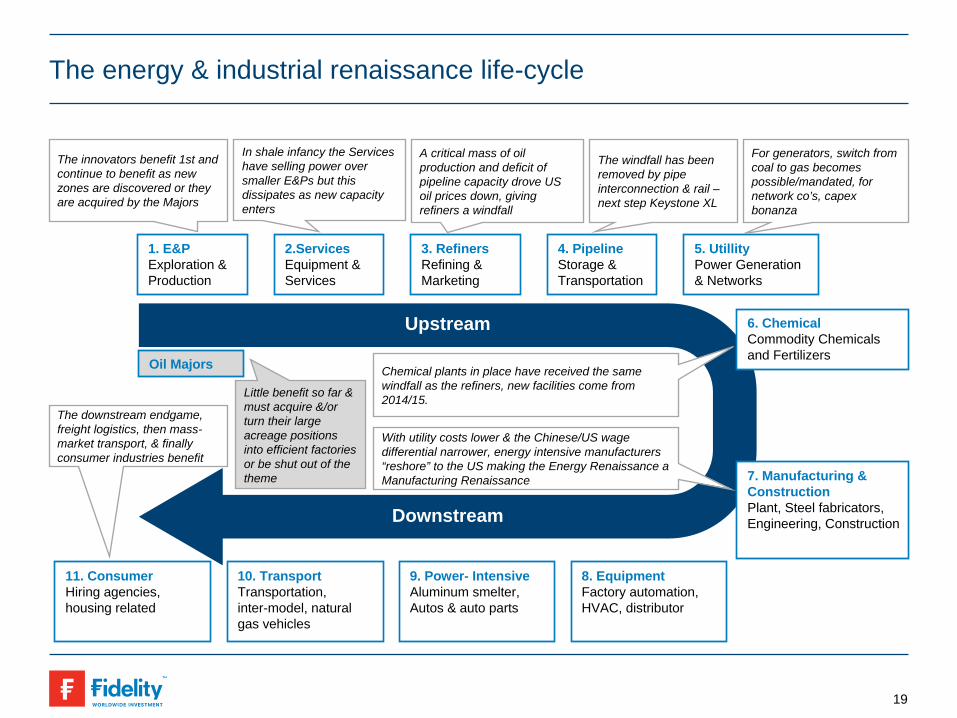
The energy & industrial renaissance life-cycle
1. E&P Exploration & Production
Upstream
Downstream
2.Services Equipment & Services
3. Refiners Refining & Marketing
4. Pipeline Storage & Transportation
5. Utillity Power Generation & Networks
6. Chemical Commodity Chemicals and Fertilizers
7. Manufacturing & Construction Plant, Steel fabricators, Engineering, Construction
8. EquipmentFactory automation, HVAC, distributor
11. ConsumerHiring agencies, housing related
10. TransportTransportation, inter-model, natural gas vehicles
9. Power- IntensiveAluminum smelter, Autos & auto parts
Chemical plants in place have received the same windfall as the refiners, new facilities come from 2014/15.
With utility costs lower & the Chinese/US wage differential narrower, energy intensive manufacturers “reshore” to the US making the Energy Renaissance a Manufacturing Renaissance
The innovators benefit 1st and continue to benefit as new zones are discovered or they are acquired by the Majors
In shale infancy the Services have selling power over smaller E&Ps but this dissipates as new capacity enters
A critical mass of oil production and deficit of pipeline capacity drove US oil prices down, giving refiners a windfall
The windfall has been removed by pipe interconnection & rail – next step Keystone XL
For generators, switch from coal to gas becomes possible/mandated, for network co’s, capex bonanza
Oil Majors
The downstream endgame, freight logistics, then mass- market transport, & finally consumer industries benefit
Little benefit so far & must acquire &/or turn their large acreage positions into efficient factories or be shut out of the theme
19

Followed by the wider economic benefits of a US manufacturing renaissance
20
Implications for employment & multiplier effects
Source: International Strategy & Investment, December 2012, Louisiana State University Center for Energy Studies, FIL Limited. 31 January 2013

Followed by the wider economic benefits of a US manufacturing renaissance (contd.)
21
Direct + Indirect + Induced impacts. Example: Louisiana
Source: International Strategy & Investment, December 2012, Louisiana State University Center for Energy Studies, FIL Limited. 31 January 2013
Ongoing impact from expanded production of petrochemicals & derivatives
Impact type Employment Payroll ($ million) Output ($ billion)
Direct 5490 730 10.9
Indirect 18092 1089 6.9
Induced 11893 436 1.3
Total 35475 2255 19.2
Economic impact from new investment in plant & equipment
Impact type Employment Payroll ($ million) Output ($ million)
Direct 9511 499 1240
Indirect 2070 111 1346
Induced 4014 147 448
Total 15595 758 2034

Source: Patelis Macro and FIL Limited as at 30 September 2013,
Manufacturing renaissance to be the key driver in re-raising US trend growth & providing competitive advantage following global financial crisis
22
History suggests lower trend growth rates persist for up to a decade or more following financial crises.
Shale energy and its industrial implications are a positive economic shock for the US economy, causing capital to flood to its beneficiaries.
Average growth

Investing in shale energy as a driver of manufacturing renaissance has a proven powerful investment strategy
23
Portfolio constructionReturns for back-testedEnergy Renaissance Strategy
Source FactSet and FIL Limited

Source: FIL Limited as at September 2013, company websites
Its HiWAY flow-channel hydraulic fracturing significantly increases fracture conductivity while reducing water, ceramic proppant & sand consumption
Its CleanStim® fracturing service uses a new fracturing fluid formulation made with ingredients sourced from the food industry
Provides citrus chemistry in both fracturing fluid formulations & for well-bore cleanout operations. It recently entered a JV to build an R&D lab in Oman to extend this technology to the Middle East
Oil Services: Efficiency & environmental advances: Schlumberger, Halliburton & Flotek
24

Source: FIL Limited as at September 2013, company websites
Cheniere Energy
Won federal approval to build the largest US natural-gas export terminal as drillers who extract the fuel from shale formations struggle to find domestic buyers to absorb a glut
As surging shale-gas drilling pushed US production to record level, LNG importers have switched course and sought permission to export fuel to booming energy markets in Asia
Shell Canada
Has purchased land at Kitimat and selected TransCanada to build a pipeline across British Columbia to deliver gas to its proposed Kitimat plant
Its LNG proposal for Kitimat (~US$12 billion) makes it one of the largest, if not the largest, investment ever in British Columbia.
Liquefied Natural Gas exports: Cheniere Energy & Shell Canada
25

Truck engines
Developed natural gas engines ranging from 5.9 to 12L, enabling trucking companies to take advantage of record spread between shale gas & gasoline/diesel
Received EPA certification for a 12L engine, meeting new greenhouse gas and fuel efficiency rules taking effect in 2014. The engine launched in August 2013. Cummins projects that by 2020, nearly 30% of its high horsepower engine production will be natural gas
Specialist high horsepower engines for industrial use
Differentiated offering through dual fuel engines capable of running on either diesel or natural gas ranging from 800hp to 3500hp (597-2610 kW). These include engines for oil & gas well servicing applications launched in mid-2013 which recycle shale gas produced to power further shale energy production
Electricity generators
Natural gas/propane electricity generators (7 to 150kW), & lean-burn gas generators (315kW to 2MW)
Source: FIL Limited as at September 2013, company websites
Next generation fuel and energy efficiency solutions:Cummins
26

Mexichem - Occidental
JV with Occidental to build a 500mtpa ethylene cracker that will make it self- sufficient for production of PVC resin used for building materials
Has 45% of the Latin American PVC market which is set for strong growth this decade from the 100m Latin American housing unit shortage
As ethylene is 60% of the cost of PVC, tapping into US shale will make it the lowest cost producer globally
Pemex - Schlumberger / Petrofac
In partnership with US oil companies to step up efforts to extend the Eagle Ford shale south into Mexico, potentially extending the coming manufacturing renaissance across the border
It is outsourcing management of mature conventional fields to Schlumberger/Petrofac, and sponsoring new energy law aimed at encouraging foreign investment to unlock Mexico’s shale potential
Source: FIL Limited as at September 2013, company websites
US shale as a driver of growth abroad: Mexico
27

Industries Qatar
Industries Qatar ($22.5bn), a listed subsidiary of Qatar Petroleum is a one-company microcosm of the potential afforded by shale gas to related industries.
It produces urea fertilizer (45% of sales), petrochemicals (35%) & steel (20%) on one single site using $1-2/mcf gas feedstock for urea & petrochemicals and gas- powered electricity for steel.
Coming to the end of a capex buildout afforded by its cheap gas feedstock, it now generates a 12% FCF yield, distributes a 5% dividend and it is looking at options to develop further gas-related competencies.
This level of integration may develop in US shale areas over the next 5 years.
Source: FIL Limited as at September 2013, company websites
A glimpse in the future A fully integrated model afforded by cheap feedstock
28

Proliferation of global shale opportunities
29
Source: US EIA. May 2013. US basins from US Energy Information Administration and US Geological Survey; other basins from ARI based on data from various published studies.

Important information
This information is for Investment Professionals only and should not be relied upon by private investors. It must not be reproduced or circulated without prior permission. This communication is not directed at, and must not be acted upon by persons inside the United States and is otherwise only directed at persons residing in jurisdictions where the relevant funds are authorised for distribution or where no such authorisation is required. Research professionals include both analysts and associates. Fidelity/Fidelity Worldwide Investment means FIL Limited and its subsidiary companies. Unless otherwise stated, all views are those of Fidelity. Top security holdings are those securities in which the largest percentage of the fund’s total assets are invested. Holdings in different securities issued by the same company are listed separately and any exposure achieved by derivatives is not shown. This means that the data may not always represent the total exposure of the portfolio to any given company. A full list of holdings, including derivatives is available on request. Reference in this document to specific securities should not be construed as a recommendation to buy or sell these securities, but is included for the purposes of illustration only. Investors should also note that the views expressed may no longer be current and may have already been acted upon by Fidelity. The research and analysis used in this documentation is gathered by Fidelity for its use as an investment manager and may have already been acted upon for its own purposes. Fidelity only offers information on its own products and services and does not provide investment advice based on individual circumstances. Fidelity, Fidelity Worldwide Investment, the Fidelity Worldwide Investment logo and F symbol are trademarks of FIL Limited. Fidelity Funds is an open-ended investment company established in Luxembourg with different classes of shares. Reference to FF before a fund name refers to Fidelity Funds. Holdings can vary from those in the index quoted. For this reason the comparison index is used for reference only. This document may not be reproduced or circulated without prior permission. No statements or representations made in this document are legally binding on Fidelity or the recipient. Past performance is not a reliable indicator of future results. The value of investments can go down as well as up and investors may not get back the amount invested. For funds that invest in overseas markets, changes in currency exchange rates may affect the value of an investment. Foreign exchange transactions may be effected on an arms length basis by or through Fidelity companies from which a benefit may be derived by such companies. Third party trademark, copyright and other intellectual property rights are and remain the property of their respective owners. Materials might use company logos when giving stock examples, then these should be accompanied by the following footnote: “Third party trademark, copyright and other intellectual property rights are, and remain, the property of their respective owners. We recommend that you obtain detailed information before taking any investment decision. Investments should be made on the basis of the current prospectus, which is available along with the current annual and semi-annual reports free of charge from our distributors, from our European Service Centre in Luxembourg; from your financial advisor or from the branch of your bank in the Nordic countries ;Please note that not all funds in the SICAV fund range are suitable for UK investors and tax advice should be sought before investing. Fidelity Funds are recognised under section 264 of the Financial Services and Markets Act 2000. Investors should note that loss caused by such recognised funds will not be covered by the provisions of the Financial Services Compensation Scheme (or by any similar scheme in Luxembourg) if the fund is unable to meet its obligations, however claims for loss in regards to such recognised funds against a FSA authorised firm such as Fidelity will be. The Full Prospectus and Key Investor Information Document (KIIDS) for these funds are available from Fidelity on request by calling 0800414181. The UK distributor of Fidelity Funds is Fidelity Worldwide Investments; Issued by FIL Investments International (Financial Conduct Authority (FCA) registered number 122170) a firm authorised and regulated by the FCA. FIL Investments International is a member of the Fidelity Worldwide Investment group of companies and is registered in England and Wales under the company number 1448245. The registered office of the company is Oakhill House, 130 Tonbridge Road, Hildenborough, Tonbridge, Kent TN11 9DZ, United Kingdom. Fidelity Worldwide Investment’s VAT identification number is 395 3090 35. Third party trademark, copyright and other intellectual property rights are, and remain, the property of their respective owners.
GLEMUS1372-1013
30