khalid ikram-the egyptian economy. performance policies and issues (1952-2000)
TRANSCRIPT

Batch number: 1
CHECKLIST (must be completed before press)(Please cross through any items that are not applicable)
Front board: Spine: Back board:
❑ Title ❑ Title ❑ ISBN❑ Subtitle ❑ Subtitle ❑ Barcode❑ Author/edited by ❑ Author/edited by❑ Series title ❑ Extra logo if required❑ Extra logo if required
General:
❑ Book size❑ Type fit on spine
CIRCULATED Date:
SEEN BY DESK EDITOR: REVISE NEEDED Initial:Date:
APPROVED FOR PRESS BY DESK EDITOR Initial:Date:
PC4 Royal Demy B-format Spine back edge
TPS:Royal
TH
E E
GY
PT
IAN
EC
ON
OM
YK
halid
Ikram
The Egyptian Economy,1952–2000Performance Policies and Issues
Khalid Ikram
Routledge studies in Middle Eastern economies
0203014464(.qxd 5/25/2006 6:00 PM Page 1

The Egyptian Economy, 1952–2000
The Egyptian Economy describes developments in the Egyptian economy and exam-ines the dynamics of economic policymaking during 1952–2000. This book ana-lyzes the structural changes that occurred and the main thematic issues thatpolicymakers confronted, in particular those relating to investment and productiv-ity, the balance of payments, external debt management, fiscal policy, the financialsector and monetary policy, the labor force and employment, and poverty. It alsodiscusses in detail the strategic and institutional issues that Egypt must address inorder to sustain rapid growth in the future. This discussion covers:
• Bureaucracy• Judicial system• System of taxation• Education and training• Planning and economic management• Constraints imposed by the availability of water• Costs of economic growth on the environment.
The book has been written from the point of view of a “participant–observer,” whohas provided advice on economic policymaking both to Egyptian officials and tointernational organizations. Khalid Ikram – a former Director of the World Bank’sEgypt Department and the author of a previous book on the Egyptian economy –has interviewed many leading policymakers of the period, whose insights are dis-cussed in the text. The book benefits from access to the databases of the WorldBank, the International Monetary Fund, and the Central Bank of Egypt, and drawson studies conducted by these organizations, bilateral and multilateral aid institu-tions, and Egyptian ministries and think tanks, in addition to published sources.
Khalid Ikram has worked within the Pakistan Government, World Bank, and morerecently as an international consultant for the UNCTAD, OECD, GTZ, and theAsian Development Bank. His main research interests include development strat-egy, policies, trade, and finance. He is the author of Egypt: Economic Management ina Period of Transition (Johns Hopkins University Press).

Routledge studies in Middle Eastern economies
1 The Egyptian Economy, 1952–2000Performance, policies, and issuesKhalid Ikram

The Egyptian Economy,1952–2000Performance, policies, and issues
Khalid Ikram
First published 2006by Routledge2 Park Square, Milton Park, Abingdon, Oxon OX14 4RN
Simultaneously published in the USA and Canadaby Routledge270 Madison Ave, New York, NY 10016
Routledge is an imprint of the Taylor & Francis Group
© 2006 Khalid Ikram
Typeset in Baskerville by Wearset Ltd, Boldon, Tyne and WearPrinted and bound in Great Britain by MPG Books Ltd, Bodmin
All rights reserved. No part of this book may be reprinted orreproduced or utilized in any form or by any electronic, mechanical,or other means, now known or hereafter invented, includingphotocopying and recording, or in any information storage orretrieval system, without permission in writing from the publishers.
British Library Cataloguing in Publication DataA catalogue record for this book is available from the British Library
Library of Congress Cataloging in Publication DataA catalog record for this book has been requested
ISBN 0-415-36342-X
Contents
List of figures viList of tables viiiPreface xAcknowledgments xiiAbbreviations and acronyms xv
1 Economic development and policymaking, 1952–73 1
2 Economic development and policymaking, 1973–87 24
3 Economic development and policymaking, 1987–2000 57
4 Growth, productivity, and structural change, 1960–2000 85
5 The external sector 117
6 The public finances 155
7 The financial sector and monetary policy 180
8 Labor force and employment 210
9 Poverty and income distribution 247
10 Toward sustainable growth: strategic and institutional issues 277
Notes 318Bibliography 330Name index 351Subject index 354

Figures
3.1 Budget deficit, 1988–97 663.2 Seigniorage and the inflation tax, 1988–97 693.3 Liquidity growth and inflation, 1988–97 703.4 Dollarization ratio, 1985–97 704.1 Average growth rates of GDP at 1992 market prices,
1965–2000 874.2 Structure of GDP, 1965–2000 884.3 GDP growth and oil prices, 1974–2000 894.4 Investment and savings, 1965–2000 914.5 Public and private investment, 1965–2000 924.6 Unemployment as percent of labor force, 1960–2000 954.7 Structure of employment, 1960–2000 964.8 Unemployment and inflation in Egypt (The Phillips
Curve), 1982–2002 985.1 Current account balance, 1965–2000 1195.2 Merchandise exports and imports, 1965–2000 1205.3 Composition of imports, 1965–2000 1225.4 Egypt’s share of world exports, 1965–2000 1225.5 Oil and non-oil exports, 1975–2000 1245.6 Main contributors to foreign exchange earnings,
1975–2000 1255.7 Composition of foreign exchange earnings, 1975–2000 1265.8 Debt service due and paid as percent of foreign exchange
earnings, 1970–2000 1485.9 Total debt outstanding and share of concessional debt,
1970–2000 1536.1 Revenue, expenditure, and budget deficit, 1965–2000 1586.2 External and domestic financing of fiscal deficit,
1965–2000 1616.3 Bank financing of budget deficit, 1965–2000 1626.4 Composition of revenues, 1965–2000 1646.5 Development of major taxes, 1965–2000 1656.6 Composition of tax revenues, 1965–2000 167

6.7 Composition of expenditures, 1965–2000 1726.8 Development of government expenditures, 1965–2000 1736.9 Domestic debt as percent of total debt, 1987–2000 1758.1a LFSS reported unemployment rates, 1988–95 2258.1b LFSS adjusted unemployment rates, 1988–93 2258.2 Unemployment rates by age, 1986 and 1995 2288.3 Unemployment rate by educational attainment, 1986 and
1995 2308.4 Employment growth by sector, 1960–96 2368.5 Employment by economic activity, LFSS 1995 2389.1 Incidence of urban poverty, 1975–96 2499.2 Incidence of rural poverty, 1975–96 2509.3 Lorenz curves by urban/rural classification, 1982–96 2529.4 Regional poverty, 1982–96 2559.5 Regional poverty, 1991–2000 271
10.1 Unemployment and shortfall between potential and actual GDP, 1992–2002 280
10.2 Gross domestic fixed and public investment, 1965–2000 28210.3 Chance of being poor by level of education, 2000 305
Figures vii

Tables
3.1 Development of privatization, 1993–2000 834.1 Population and urbanization, census years 1947–96 864.2 Demand decomposition of growth, 1965–2000 904.3 Labor force and employment, 1960–2000 944.4 Investment and savings ratios, 1965–2000 1014.5 Factors’ contribution to GDP growth, 1965–2000 1055.1 Summary balance of payments: selected years, 1965–2000 1215.2 Composition of merchandise exports, 1965–2000 1235.3 Revealed comparative advantage by product groups, 1970,
1980, 1992 1285.4 Egypt’s Trade Positioning Matrix, 1990–2000 1305.5 Indexes of nominal and real effective exchange rates,
and international competitiveness, 1980–2000 1335.6 Balance of payments, 1965–2000 146–75.7 External debt and debt servicing, 1970–2000 1496.1 Summary of fiscal performance: selected years, 1965–2000 1606.2 Buoyancy of major revenue sources, 1965–2000 1666.3 Structure of taxes, 1965–2000 1676.4 Buoyancy of major expenditures, 1965–2000 1737.1 Measures of bank performance, 1991–2000 1837.2 Summary stock exchange statistics, 1961–2001 2018.1 Labor force growth, employment, and unemployment,
1986–96 211–128.2 Population, labor force, and economic activity, 1977–98 220–18.3 Participation rates by data source, ages 15–64 2218.4 Unemployment level and rate, population censuses,
1960–96 2248.5 Unemployment by age categories, LFSS 1995 2298.6 Unemployment by educational attainment (ages 12–64),
1986–95 2308.7 Underemployment ratio by gender, urban/rural
residence, 1988 and 1998 2328.8 Sectoral structure of employment, 1977–92, ages 12–64 240

8.9 Sectoral distribution of employment growth by gender, 1988–98 242
9.1 Estimates of poverty in Egypt, 1959–96 2499.2 Poverty measurements, 1982–96 2509.3 Capability poverty and income poverty, 1995 2549.4 Regional incidence of poverty (P0), 1982–96 2569.5 Households by chronic, transitory, and total poverty status,
1999 26810.1 Annual cost of environmental degradation, 1999 30910.2 Precision of plan forecasts, 1983–2002 311
Tables ix

Preface
This book describes the development of the Egyptian economy and pro-vides an analysis of policymaking from 1952 to 2000. The emphasis is onthe more durable, structural issues that Egyptian policymakers con-fronted, rather than on a year-to-year chronology or on quotidian details.I have also tried to identify the crucial questions that Egypt will have toaddress in order to sustain rapid growth in the future. The book has beenwritten from the point of view of a “participant-observer,” who was privi-leged to witness at close hand the dynamics of policymaking by Egypt’seconomic managers, and to engage in some measure in the shaping ofdecisions by major donor agencies at critical periods in the country’shistory.
I should like to draw attention to five points:
1 My earlier book, Ikram (1980), was conceived of partly as a work ofreference, since at the time there were few comprehensive studies ofthe Egyptian economy. In keeping with its reference function, thatwork contained a very large number of data tables. However, dataseries are now available in the World Bank’s Live Data Base, the IMF’sInternational Financial Statistics, the Penn World Tables, and the websites of Egyptian ministries and of the Central Bank of Egypt. There islittle point in duplicating this information. In order to discuss issuesin sufficient depth and yet keep the book to a reasonable size, theamount of tables and graphs has been restricted to that necessary todevelop the argument.
My reliance on the sources mentioned above will be obvious. I amalso indebted to the generosity of successive Ministers of Planning,Presidents of CAPMAS, and Governors of the Central Bank of Egyptfor providing me with liberal access to their information bases and forhaving their research departments perform special studies at myrequest.
2 The earlier work included a discussion of sectors such as agricultureand industry. With the appearance of a number of publications inthese fields, it seemed more worthwhile to focus attention in the

present book on areas such as the labor market, employment, poverty,the environment, privatization, the financial sector, and issues facingthe system of planning and economic management, in which theavailable research is scattered or for other reasons difficult to access.
3 In line with contemporary thinking on long-term development, thisbook takes into account the vital role of institutions. It therefore dis-cusses critical questions relating to the commercial judicial system, theapparatus of taxation, the education and training systems, and thebureaucracy, in order to identify what would be required to makeEgypt more competitive in the world economy and to provide a firmerbase for launching the country on the path of sustainable growth.
4 In the preparation of this book, I interviewed many of the leadingpolicymakers so as to better understand how they approached theirtasks and reacted to the constraints under which their assignmentshad to be performed. I was overwhelmed by the candor and the detailwith which they responded, frequently agreeing to multiple inter-views. Many of their perceptions have been directly quoted in thebook, and are referenced. However, there were occasions when theinsight was important but identification might have embarrassedthe source; such comments have been paraphrased without attribu-tion. I am aware that respondents in an interview tend to offer themost favorable interpretation of their actions; therefore, whereverpossible I cross-checked with those who might hold different views orpossess additional information.
5 The book contains a detailed set of references. During the last 25years, a considerable amount of research has been conducted on theEgyptian economy. However, much of this work is not known outsidespecialized research centers or institutions such as the World Bank,the IMF, the European Union, and the USAID. I hope that the biblio-graphy will increase awareness of at least the non-confidential part ofthis research. I also point out areas in which research has lagged, withthe hope that this will stimulate efforts to fill in the lacunae.
Preface xi

Acknowledgments
Anyone who has worked on Egypt will recognize how quickly he incursdebts that beggar his ability to repay them adequately. I am acutely con-scious of the impossibility of providing due acknowledgment to all thescholars, policymakers, government officials, businessmen, bankers,lawyers, journalists, colleagues, friends and others who provided advice,information, hospitality, and support during my association with Egyptover a period of nearly 30 years.
Nevertheless, an attempt must be made. My thinking on the Egyptianeconomy has been much influenced by discussions with scholars who gen-erously shared their time and insights. My biggest debts are to RobertMabro, Heba Handoussa, Hanaa Kheir El Din, Samir Radwan, the lateBent Hansen, and to Mahmoud Abdel Fadil, Adel Bishai, Gouda AbdelKhalek, Ragui Assaad, Nader Fergany, Ahmed Galal, Galal Amin,Mahmoud Mohieldin, Heba Nassar, Heba El Leithy, Karima Korayem,William Mikhail, Lance Taylor, and John Waterbury.
I am grateful for the openness with which leading policymakers dis-cussed their successes and failures, and elaborated the pressures underwhich their policies were formulated. For many hours of fascinating dis-cussions, I am indebted to Abdel Aziz Hegay, Kemal El Ganzoury, AtefEbeid, the late Abdel Razzaq Abdel Meguid, the late Hilmy AbdelRahman, Ismail Sabri Abdullah, the late Hamed El Sayeh, YoussefBoutros-Ghali, Sultan Abu Ali, Ahmed Abou Ismail, the late Zaki Shafei,Zafer El Bishry, Osman Mohamed Osman, Fouad Sultan, Hilal El Das-souki, Mahmoud El Imam, Ahmed El Dersh, Hassan Khedr, Nawal ElTatawy, Ahmed Goueili, the late Waguih Shindy, Ali Negm, Salah Hamed,Ismail Hassan, and Mahmoud Abul-Eyoun.
Among government officials, I should particularly like to acknowledgethe help I received from Ehab Elwy, Ismail Bedawy, Asma Thabet, SaadBarghout, Samir Koraiem, Gamal Bayoumi, Hussein El Gamal, Nadia ElTatawy, and Rafik Sowelem.
I received a great deal of information about the practical impact of pol-icies from the business, financial, legal, and NGO community. For sharingtheir special experience, I should like to express my thanks to Taher

Helmy, Moataz El Alfy, Said El Alfy, Yehyia El Gamal, Ahmed Ezz, ShafikGabr, Ibrahim Kamel, Farid Khamis, Sameh Sawiris, Hisham Fahmy,Mohammed Taymour, Omar Mohanna, Mohammed Ozalp, MonaMakram Ebeid, Maisa El Gamal, and Magdi Tolba.
From the media, I am particularly grateful to Galal Dowidar and EssamRifaat for sharing their knowledge of events in Egypt.
From the donor community, I profited from the sagacity of HermanEilts, Roy Atherton, Edward Walker, Daniel Kurtzer, Sir Nigel Barrington,Sir David Blatherwick, the late Don Brown, Toni Wagner, John Westley,Christian Voigt, Edward Peck, and Henry Mattox.
My debt to my former colleagues in the international agencies isparticularly heavy. From the World Bank, I benefited enormously fromdiscussions over many years with Kemal Dervis, Martijn Paijmans, AtillaKaraosmanoglu, the late Ibrahim Shihata, the late Wafik Hosni,Mohammed Kamel Amr, Vinod Dubey, Ismail Serageldin, John Page,Nemat Shafik, Sven Burmester, Marcelo Giugale, Shahid AmjadChaudhry, John Wall, Sadiq Ahmed, Mustapha Nabli, Christian Petersen,Nadir Mohammed, Sarosh Sattar, Chang-Po Yang, Wafik Grais, Sherif Arif,Zafiris Tzannatos, Nabil Shehadeh, David Grey, Christina Leb, MalvinaPollock, Shaha Riza, and Farrukh Iqbal. I am also indebted to the staff andarchivists of the World Bank/IMF Joint Library – especially LachanceNtonme, Chet Nonoo-Quarcoo, and Southamini Borlo – for providing acongenial environment for work, and for tracking down and obtainingpublications and papers that otherwise might have been impossible tofind.
From the IMF, I have had the benefit of extended discussions withShakoor Shalaan, Andrew Crocket, Paul Dickie, Mohammed El Erian,Arvind Subramaniam, Mario Mecagni, Azizali F. Mohammad, andNadeem ul Haque.
My colleagues in the Cairo office of the World Bank provided indis-pensable advice and support. For making my stay in Egypt both profes-sionally and personally rewarding, my warm thanks to Mahmoud Gamal ElDin, Nadir Mohammed, Alaa El Shazly, Rouchdy Saleh, Badr Kamel, AlaaHamed, Hisham Waly, Nagwa Riad, Hélène Cottenet, Sherine Al-Shawarby, Sahar Nasr, Ayyat Soliman, Ahmed Abdel Aziz, Amira Kazem,Nahed El Husseini, Nehal El Kouesny, Nadia Kira, Georgette Mounir,Dalia Ramzi, Inas El Gamal, Sahar Mohamed Hegazy, Noha Abdel Gawad,and Maya El Azzazi.
In the preparation of this book, I should especially like to acknowledgethe help of Nadir Mohammed, Nagwa Riad, Sarosh Sattar, Alaa El Shazly,Nadeem ul Haque, and Farrukh Iqbal, who were generous with materialand helped to elucidate several issues.
The thrust of this book is on policymaking in an increasingly market-led economy and its impact on poverty alleviation. My biggest intellectualdebts are to the late Mahbub ul Haq, who for many years in the Pakistan
Acknowledgments xiii

Planning Commission and the World Bank was my mentor in the formula-tion and analysis of economic policies; to Gustav Papanek, my thesisadvisor, who has written eloquently about harnessing the “social utility ofgreed”; and to Amartya Sen, whose writings on poverty and the purpose ofdevelopment have done so much to shape contemporary attitudes towardsthese subjects, and who has been teacher and friend from my student daysat Cambridge and Harvard.
My deepest debt of all is to my family, who for years have put up withmy preoccupations and absences. What may have helped them is theirprofound attachment to Egypt, which quite rivals my own. To Shirin,Salima, Aden, and Nicholas this book is dedicated, with inexpressible grat-itude and affection.
Needless to say, none of those mentioned is responsible for any errorsof fact or interpretation in this book, which remain my responsibility.
xiv Acknowledgments
Abbreviations and acronyms
CAPMAS Central Agency for Public Mobilization and StatisticsCASE Cairo and Alexandria Stock ExchangeCBE Central Bank of EgyptCMA Capital Markets AuthorityEGP Employment Guarantee ProgramEGPC Egyptian General Petroleum CompanyEHDR Egypt Human Development ReportELMS Egyptian Labor Market SurveyGASI General Authority for Social InsuranceGDP Gross Domestic ProductGNP Gross National ProductGODE Gulf Organization for the Development of EgyptHDI Human Development IndexHDR Human Development ReportHIES Household Income and Expenditure SurveyHPI Human Poverty IndexIBRD International Bank for Reconstruction and DevelopmentIFIs International Financial InstitutionsIFPRI International Food Policy Research InstituteIMF International Monetary FundLDB Live Data BaseLE Egyptian poundLFSS Labor Force Sample SurveyLIBOR London Inter-Bank Offered RateM/SMEs Micro and Small and Medium EnterprisesMLEs Medium and Large EnterprisesMOF Ministry of FinanceMOP Ministry of PlanningNIB National Investment BankNOIP National Organization for Insurance and PensionsPBDAC Principal Bank for Development and Agricultural CreditPC Population CensusPEIC Public Enterprise Information Center

PRIDE Project in Development and the EnvironmentRCA Revealed Comparative AdvantageREER Real Effective Exchange RateSCA Suez Canal AuthoritySIS Social Insurance SystemSMEs Small and Medium EnterprisesTFP Total Factor ProductivityUNDP United Nations Development ProgramUSAID United States Agency for International DevelopmentWB World Bank
xvi Abbreviations and acronyms
1 Economic development andpolicymaking, 1952–73
In July 1952, the Egyptian monarchy was overthrown, and the contempor-ary phase of Egypt’s history began. The Free Officers, who led the revolu-tion, came into power without a clear political agenda. “It has often beensaid,” wrote Roussillon in the Cambridge History of Egypt (1998, vol. 2: 338),“that the . . . officers forming the Revolutionary Command Council hadno program, almost no ideology, and barely any ‘philosophy.’ ” Similarly,Vatikiotis (1961: 67–8) observed that “One finds few indications of anypolitical program or plan of action. . . . There were perhaps as manyshades of political belief as there were members of the Free Officers Exec-utive.” And Baker (1978: 101) commented that “They [The Free Officers]had no action program that would have provided some conception of thesociety their revolution aimed at creating.” Such views were not confinedto foreign commentators; Mohamed Heikal wrote that “This movement. . . did not have an exact vision of the import and the profundity of theenterprise which it had undertaken.”1 The revolution was instigatedprincipally by resentment against the corruption of the monarchy andfrustration with the failure of the political process to rid the country ofBritish occupation.
Nor was the new regime wedded to a particular economic philosophy.In any case, Egypt’s recent history did not provide a model that hadproved unambiguously superior to all the alternatives. Since the nine-teenth century Egypt had known, sometimes through choice and some-times by accident, a variety of economic systems. Under Muhammad Ali,the ruler was identified with the state as the major economic agent.Government monopolies were set up in agriculture, industry, and foreigntrade, while import substitution was attempted under the aegis of thestate. Muhammad Ali’s grants of lands to members of his family, seniorgovernment officials, and high army officials led to the creation of largeprivate estates in agriculture. Land privatization continued under his suc-cessors, particularly the Khedive Ismail. Muhammad Ali’s defeat in 1839by the Ottoman rulers and the European powers ended the import-substitution strategy and started a process of free trade. The period of freetrade and laissez-faire reached its apex from the 1880s to the 1930s. The
government still played a major role in economic development because ofits special responsibilities for irrigation, but economic activity was over-whelmingly conducted by the private sector.
The government’s direct involvement with other sectors of theeconomy began to grow from the 1930s, when an escalating tariff struc-ture intended to favor industry was adopted. During World War II, con-trols were introduced on foreign trade, supplies of necessities, prices,rents, and foreign exchange. After the war some controls were disman-tled, but liberalization remained incomplete. The government continuedto fix prices of basic consumer goods, using subsidies in an attempt tokeep down the cost of living. Tariff levels were raised in the late 1940s andagain in the 1950s in furtherance of specific import-substitution object-ives. Yet private enterprises continued to operate in a relatively freeenvironment, deriving benefits from protectionist policies which probablyoutweighed the cost of the price controls.
Predominance of the private sector, 1952–56
In 1952, the economic role of the state was virtually confined to invest-ment in infrastructure (chiefly in the irrigation system) and social services.The main productive sectors – agriculture and industry, internal andforeign trade, banking, insurance, urban transport, and even a number ofutilities, such as electricity and water – were in private hands. Mead (1967:272–3) estimates that the public sector accounted for only 13 percent ofthe Gross Domestic Product.2
In view of what transpired subsequently, it may be surprising that thearchitects of the 1952 revolution initially were favorable to private enter-prise. During the first four years of the new regime, the government’s pro-nouncements on economic ideology emphasized the importance of theprivate sector. Official policies were also intended to reassure privateenterprise. The government, for example, consulted regularly with theFederation of Egyptian Industries, and agreed to the Federation’s demandfor lower taxes and higher protection by lowering customs duties on rawmaterials and capital goods and by raising tariffs on items produceddomestically. Taxes on profits and undistributed dividends were alsoreduced. The government insisted that it would act as the partner ofprivate enterprise and confine itself to heavy, or basic, industry. The restof the manufacturing sector was explicitly reserved for private enterprise.Government investment continued to be directed largely toward the tradi-tional areas of irrigation, drainage, and land reclamation. The maintheme of the economic policy debate during this period was not therespective responsibilities of the public and private sectors, but rather therole of foreign investment. In this area, too, the authorities proceededcautiously. Until 1957 the state continued to woo foreign capital throughlaws providing tax holidays and generous provisions for the repatriation of
2 Economic development and policymaking, 1952–73

profits. The government also partially reversed the Egyptianization policyof the former regime by allowing foreign shareholders to hold a majorityinterest and control in any domestic company.3
Perhaps the most significant restraint imposed on the private sector wasthe agrarian reform of September 1952, which limited individual owner-ship to a maximum of 200 feddans. The main purpose was not to attackthe principle of private ownership – the excess feddans were distributed tolandless peasants. “The most immediate objective of the land reform law,”wrote Abdel-Faddil (1975: 7), “was to break the power of the old rulingoligarchy, with its roots in big estates.” The most radical component of theagrarian reform was the introduction of agricultural cooperatives. Toobtain inputs or agricultural credit, a farmer had to become a member ofa cooperative and abide by its rules concerning crop rotation, outputpricing, marketing, and so forth. Since the cooperatives were directed bythe government, this was an effective, if indirect, method of control.
Decisions in 1952–54 did not attack private enterprise, but merelyrevealed the government’s intention to engage more actively in theeconomy. It was decided to build the Aswan High Dam at about this time(though the execution was much delayed) and the government engagedimmediately in ambitious land reclamation projects. Some partial plan-ning was introduced in 1953 through the creation of the PermanentCouncil for the Development of National Production, comprising repre-sentatives of both the government and the private sector. The Councilstudied projects, coordinated the public works program and the stateinvestment budget, and paved the way for the government to participateas an equity owner in new industries for the first time since the 1860s.
Growing government intervention, 1957–60
The transition from a free, private enterprise system to a plannedeconomy with a dominant public sector took place between 1954 and theearly 1960s. The first small step was the government’s decision to take anequity stake in two new industrial companies established in 1954. Thepublic sector then expanded in 1957 through the nationalization ofBritish and French economic interests after the Suez Canal war, andthrough public investment in industry.
International developments also prompted increased governmentintervention. In the years following 1956, Egypt lost much of its access toWestern sources of finance. This inevitably included countries such asBritain and France, which had participated in the Suez Canal war of thatyear. However, with Egypt turning to the Eastern bloc for arms and diplo-matic support, finance from major Western-dominated internationaldevelopment agencies, especially the World Bank, also evaporated. Thechief bone of contention between the Bank and Egypt was the AswanHigh Dam.
Economic development and policymaking, 1952–73 3
The story of the Aswan High Dam project and the relations betweenEgypt, the World Bank, and the Bank’s principal shareholders was acomplex interaction of politics and economics and, at times, of politicsmasquerading as economics. The United States and the United Kingdomhad agreed to seek approval from their legislatures for providing $70million ($54.6 million from the United States and £5.5 million from theUnited Kingdom) to cover the foreign exchange costs of the first phase ofthe project. The two governments also stated that they would be preparedto consider, in the light of then existing circumstances, providing addi-tional resources to supplement the World Bank’s financing of later stages.The Bank was expected to participate in the foreign exchange financingof the project, which Mason and Asher (1973: 638) report as amountingto $200 million out of a total foreign exchange requirement of $390million.
Waterbury (1979: 105) lists a number of conditions that were attachedto the financial offer. Thus, for example, Egypt would have to allocateone-third of its internal revenues to the High Dam project; contractswould have to be awarded through international bidding with communistcountries excluded; Egypt would have to avoid incurring additionalforeign debt without the approval of the World Bank; disbursementswould begin only after Egypt and the Sudan reached a new accord on thesharing of the Nile waters, and so on.
These conditions aroused considerable resentment in Egypt. The great-est unease arose from the division of the financing into two phases. Thequalified nature of the offer of finance by the United States and theUnited Kingdom for the second phase was disturbing, because it provideda lever by which the Western countries could press Egypt to settle theArab–Israeli dispute on possibly unfavorable terms. And, indeed, Masonand Asher (1973: 642) in the World Bank’s authorized history of its first25 years of operation concede that, “They [the Western powers] may havethought of it as potentially useful in this regard.”
In July 1956, the US and UK governments decided to withdraw from thefinancing of the Aswan High Dam. The World Bank’s offer then lapsed,because the financing for the project was left with a gap. In the Bank’s view,it would be a waste to commit its resources to a project that was incom-pletely funded and therefore might never be implemented. However, thereis little doubt that the political views of the Bank’s principal shareholdersswayed its decision. The cancellation of the financing led Egypt to national-ize the Suez Canal, in order to use the revenue from transit tolls to financethe construction of the High Dam. The nationalization was offered as apretext by Britain, France, and Israel for invading Egypt.
Subsequent to the Suez Canal war, the phase of government policy in1957–60 was aptly described by President Abd el-Nasser as “controlled cap-italistic economy.”4 The government intervened vigorously in economicactivity along four major paths.
4 Economic development and policymaking, 1952–73

First, although private sector activity was still encouraged, the new Con-stitution of 1956 set out an ideological framework within which such activ-ity was to be conducted.
Second, the Suez Canal war of 1956 led to the sequestration of Britishand French assets, much of which were concentrated in banking andinsurance. A special state Economic Organization was set up in early 1957to manage these and other assets in which the government already had ashare. This agency thus acquired considerable influence as a vehicle forpromoting the government’s economic policies. By 1958 the EconomicOrganization controlled all the specialist banks in Egypt, seven commer-cial banks which accounted for nearly half of all commercial bank loans,and five insurance companies responsible for 68 percent of all insurancebusiness transacted in Egypt. O’Brien (1966: 90, 95) estimates it to havebeen responsible for roughly a third of aggregate output produced by theorganized industrial sector, and to have employed about 20 percent of thelabor force in that sector.
Third, a move to rapidly “Egyptianize” the main arteries of the nationaleconomy was put into effect. All foreign banks, insurance companies, andcommercial agencies were required to be converted into domestically-owned joint stock companies within five years. The major banks and insur-ance companies were put under the control of the EconomicOrganization.
Fourth, comprehensive economic planning was introduced. In January1957, a National Planning Committee was set up to prepare a long-termplan for social and economic development that was to come into effectfrom July 1, 1960. In 1958, however, a five-year plan for industry waslaunched, in which the state was to provide 60 percent of the finance,mainly for heavy industry. The industrial plan required a rapid accelera-tion in investment from the annual average of LE 34 million of grossinvestment in the previous quinquennium to an annual average of LE 45million of net investment between 1957 and 1961.
Thus, in this phase of economic management, the government movedaway from relying on the private sector as the main engine of growth, andstate intervention and influence became increasingly important. This wasmost apparent in the area of capital formation. In 1952, the public sectoraccounted for about 13 percent of GDP and 28 percent of gross capitalformation; by 1960, while still accounting for only 18 percent of GDP, thepublic sector undertook nearly 74 percent of gross investment.5 The shareof government both in investment and in economic activity generally con-tinued to rise; Hansen (1975: 203) estimated that in 1973 perhaps 90percent of investment and 63–70 percent of the total availability ofresources was accounted for by the public sector.6 However, Amin (1968:41) points out that although the authorities had started to invoke a social-istic ideology, most nationalization was still ad hoc and was justified on avariety of non-ideological grounds.
Economic development and policymaking, 1952–73 5

Perhaps the biggest indicator of the change in the government attitudetoward the private sector was the introduction of wide-ranging economicplanning. The restrictions placed on private economic activity appear tobe closely related to successive efforts to make the planning process morecomprehensive. Although the biggest waves of nationalization did notoccur until 1961, even during the late 1950s the government began to feelthat a high rate of planned investment could not be attained with a pre-dominantly private sector economy. Moreover, as O’Brien (1966: 103)suggests, the introduction of a comprehensive five-year plan in 1960 com-pelled the policymakers to become much more specific about the kind ofeconomic system they wished to create. All in all, looking at the funda-mental changes that followed in the wake of the Suez war, it can beargued that 1956, the year of the Suez Canal war, was more of a turningpoint for Egypt’s economy than was 1952, the year of the Revolution.
Nationalization and increasing government control,1961–73
The first harbinger of the government’s new direction in policy came onFebruary 13, 1960, when Bank Misr and the National Bank were takeninto public ownership. The step was significant because, whereas previousnationalizations had been of foreign firms, these banks were ownedchiefly by Egyptian nationals. The National Bank, although privatelyowned, performed all the normal functions of a central bank; forexample, it had a monopoly of the note issue, it was the lender of lastresort, and it had control of the bank rate.
Bank Misr was not only the largest commercial bank left in the privatesector, but also a most important holding company, whose 29 affiliatedcompanies accounted for an estimated 20 percent of Egypt’s industrialoutput, including half of all textile production. The precise reasons for thenationalization are not clear – some of the explanations provided by offi-cials and reported in Wahba (1994: 80–1) are convoluted and self-contradictory. At issue appear to have been differences between thegovernment and the Bank Misr group concerning the targets allocated toMisr companies under the first industrial plan. The Misr group wantedto focus largely on the textile industry, while the government wanted it toinvest in other sectors. Given the importance of the group (it had beenmade responsible for nearly half of all activity undertaken by private enter-prises), possibly the government felt more secure about attaining its eco-nomic targets if it directly controlled the Misr enterprises; see Hansen andMarzouk (1965: 171), O’Brien (1966: 92–3, 125), and Amin (1968: 41).
The biggest waves of nationalization occurred in June and July 1961 inwhat has come to be called in Egypt the “Socialist Revolution.” First, theAlexandria cotton futures market was closed and the state Cotton Author-ity given the exclusive right to purchase cotton; subsequent laws Egyptian-
6 Economic development and policymaking, 1952–73
ized all companies dealing with the cotton trade and brought all firmsengaged in external trade under state control. Second, in the most wide-ranging of the nationalization measures, the remaining banks and insur-ance companies were taken over, as were 44 companies in basic industries(such as cement, electricity, and copper); half the capital of 86 firms,mainly in commerce and light manufacturing, was expropriated; and theshareholders of another 147 firms were dispossessed of a large part oftheir assets by a law that limited individual holdings to a market value ofLE 10,000 – all shares in excess of that amount passed into public owner-ship. According to Issawi (1963: 60), O’Brien (1966: 130–1, 153), thenominal capital of the companies affected by the nationalization laws of1961 was put at LE 258 million (about two-thirds of the total share capitalof companies then registered in Egypt), of which the state acquired LE124 million. Third, after the secession of Syria from the United ArabRepublic, in October the property of 167 wealthy Egyptians was seques-trated for political reasons, and in November that of about 500 others.
After the 1961 nationalizations, the private sector was relegated to arelatively minor role. Private property was not abolished, but the opportun-ities for private economic activity and decision-making, especially in invest-ment and production, were severely circumscribed. The takeovers werelater justified as part of the “Arab Socialism” that was a cardinal element ofthe National Charter (al-Mithaq al-Watany) presented by President Abd el-Nasser in May 1962 to the National Congress of the Popular Powers.7
According to the Charter, economic development could not be left toindividual efforts motivated by private profit, but must be based on social-ism. The Charter outlined the framework for the conduct of economicactivity. The main provisions were the following:
• The economic infrastructure should be publicly owned, as should themajority of heavy and medium industries and mining.
• Banks and insurance companies should be only in the public sector.• The entire import trade should be in the public sector, as should
three-quarters of the export trade; the private sector could be respons-ible for the rest.
• The ownership and control of internal trade could be in the privatesector, but the public sector should take charge of at least one-quarterof internal trade over the following eight years.
• Apart from internal trade, the sphere of private ownership andcontrol was defined as land, buildings, construction, and light indus-try. The application of land reforms, rent control legislation, and taxa-tion measures would help to prevent any “exploitation.”
• The Charter also spelled out the “basic rights” of citizens to socialwelfare that the state would provide. The framework included medicalcare, education, employment, minimum wages, and insurance bene-fits in old age and sickness.
Economic development and policymaking, 1952–73 7

Thus, in the decade after assuming power, the Egyptian governmentmoved successively from encouragement of the private sector, to a gradualincrease in restrictions and controls, and finally to massive nationaliza-tions and state intervention throughout the economy. Although this waslater justified as “Arab Socialism,” the ideological basis was rather tenuous.The process was frequently hesitant and often ad hoc; in the words ofHansen and Marzouk (1965: 169), much of it “just happened.” TheNational Charter did, however, fix the main lines of economic structure andpolicy direction until the next major turning, the infitah of PresidentSadat.
These years also saw the first efforts at central planning in Egypt. In theFirst Five-Year General Plan, the public sector accounted for some 90percent of total monetized investment throughout the 1960s and until1973. This proportion did not decline very significantly, even after the lib-eralization measures of 1974, until the early 1990s. From 1965, annualinvestment programs became increasingly important as the main publicinvestment planning instrument. The public sector continued to ownmost of modern industry; all banks, insurance companies, and financialintermediaries; and a large proportion of construction firms, moderntransport, and wholesale trade. The bulk of foreign trade operationsremained in the public sector. In agriculture, old land remained privatelyowned within the ceilings defined by the agrarian reform laws, but thenew land was largely in public ownership.
This chapter does not attempt to give a comprehensive description ofdevelopments during 1952–73; rather, it aims only to provide a back-ground, concentrating on issues that continued to resonate beyond thatperiod. In this spirit, an overall view of the years 1952–73 would highlightthe following features of the economic system:
1 The state maintained considerable influence in agriculture, not onlybecause of its traditional responsibilities for the hydraulic system, butalso because of the cooperative system and the control it exercised inselling inputs and buying the major crops. In the 1960s, the privatesector also retained ownership of both rural and urban dwellings,small-scale industry, most of the retail trade, certain transport, con-struction, and manufacturing activities, and part of wholesale trade. Inpetroleum, the state continued for some time in partnership withforeign oil companies.
2 An important feature of the economic system was an extensive systemof cost and price controls. Price control originated during World WarII but covered few commodities; it became extensive in the 1960s.Thereafter, price administration affected all the major sectors of theeconomy, such as agriculture, housing, and industry. The statedobjectives of price administration were to improve income distribu-tion and resource mobilization. But these goals were sometimes
8 Economic development and policymaking, 1952–73
contradictory. Price controls and subsidies were used to check pos-sible rises in the cost of living, but price administration was also usedas a form of excise on certain necessities to raise revenues for theTreasury. In the industrial public sector, prices were usually calculatedon a cost-plus basis, but they were varied for many reasons – toincrease revenues, to clear stocks, or to depress demand. Price admin-istration had important implications for both the budget and thebalance of payments.
3 The welfare-oriented policies of the first two decades of the revolutionhad two broad aims: greater equity in the distribution of income andwealth, and increased consumption of goods and services. The prin-cipal measure for redistributing wealth was the land reform law ofSeptember 1952. President Sadat (1977: 130) later described the landreform as the measure which, more than any other, gave the FreeOfficers’ movement the character of a genuine revolution rather thana mere coup d’état. Just before the reform, approximately 2,000 owners(out of a total of about 2.8 million) held nearly 20 percent of theland; at the other end of the spectrum, more than 2.6 million owners(about 94 percent of the total) held 36 percent of the land. In 1965,at the highest end of the scale, about 4,000 owners (out of 3.2million) held about 7 percent of the land, while at the lowest endabout three million (about 95 percent of the total) held 57 percent ofthe land.
The land reform achieved a number of results. The average size ofsmall properties increased from 0.8 to 1.2 feddans in 1965; the verylarge estates (which had covered about 20 percent of the area in1952) disappeared; and the medium-size landowners retained theirshare of the cultivated area. However, Mabro (1974: 72–3) points outthat reform did not aim to satisfy the land hunger of all tenants andlandless workers. The scarcity of land, and the rather limited amountsinvolved in the redistribution, would have made such an aim impracti-cable. Waterbury (1983: 266–7) estimates that the various landreforms involved at most 16 percent of Egypt’s cultivated land, leadingto the distribution of 13 percent of that land to about 10 percent ofthe country’s rural families. He calculates that if every rural family hadreceived an equal share of Egypt’s cultivated land in 1965, its plotwould have amounted to 1.8 feddans, a holding well below thatrequired for subsistence. And with population growth and the inheri-tance laws, even this size would quickly be diminished. Mabro (1974:73) argues similarly that: “The Egyptian land reform sought limitedimprovements in the distribution of wealth, and benefited the uppersection of the low-income group.” Baker (1978: 205) concurs, sayingthat Egyptian land reform primarily benefited those who already hada stake in village society.
The other major factor in improving the distribution of wealth was
Economic development and policymaking, 1952–73 9

the nationalization of the large industrial enterprises. Nationalizationdid not, in itself, increase the wealth of the poorer groups; in Mabro’s(1974: 222) phrase, the measure was “privative rather than distribu-tive.” However, it reduced the concentration at the upper end of thespectrum, opened up opportunities for promotion, and allowed widerparticipation by those who had hitherto been excluded. Nationaliza-tion also enabled the government to legislate substantial benefits toworkers and to police the legislation.
Most commentators agree that the reforms contributed to equity.Hansen (1975: 210–11) concludes that the reforms succeeded incutting off the upper tail of the distribution of both income andwealth, but the equalization of personal distribution was far from com-plete. Even by 1973, large differences existed between the incomes oflandless laborers and owner-cultivators with the maximum holding of50 feddans, and “a certain exploitation of the peasants in favor ofworkers in modern enterprises had taken place.” Moreover, severalwriters – for example, Nutting (1972), Mabro (1974), Waterbury(1983) – argue that the primary reason for the reforms was to under-mine the power of groups that might have opposed the revolutionaryregime. Hansen (1991: 250) sums up this view as follows: “Importantthough they were from an equity point of view, land reform, national-izations, and sequestrations were primarily actions aimed at neutraliz-ing or destroying actual or potential, real or imagined, politicalopponents or power contenders.”
4 Other socialist reforms of the government were in labor legislation,education, health, and employment. The minimum wage in industrywas raised from LE 0.125 a day to LE 0.250 in 1953, but it was seri-ously enforced only from the early 1960s; until then real wages wereraised mainly by increasing fringe benefits. Strikes were made illegal,but labor conditions were improved by an insurance scheme forindustrial workers financed by contributions from the employer,profit-sharing schemes whereby 25 percent of the net profit was dis-tributed among the workers and employees, increased sickness leaveand higher sick pay, and constraints on the employer’s ability todismiss workers.
Public education expanded rapidly after the revolution. Govern-ment expenditure on education rose from about 3 percent of GDP in1953 to about 5 percent in 1970, despite the increased diversion ofresources to defense following the 1967 war. Public investment in edu-cation increased from approximately 2 percent of total investment in1953 to about 6 percent in 1973.
With these increased expenditures the number of students rosesharply. Twenty years after the revolution, the number of primary andpreparatory students had tripled, secondary students had increased byabout 165 percent, and the number of university students had more
10 Economic development and policymaking, 1952–73

than quadrupled. (The population increase during this period wasabout 62 percent.) The expansion of the student body, however, ledto significantly increased pupil:teacher and pupil:classroom ratios anda worsening of educational quality.
Expenditures on health rose from about 0.5 percent of GDP in1953 to about 1.9 percent in 1975. The number of hospital beds morethan doubled, from a little less than 36,000 in 1952 to about 77,000 in1975; the ratio of beds to a thousand of the population thus increasedfrom about 1.7 to nearly 2.1 over the period. The availability of medi-cine at subsidized prices and the number of pharmacies and publichealth centers steadily increased, but all these were far more access-ible in urban than in rural areas.
Westley (1999) estimates that real GDP during 1952–74 grew at arate of about 3.5 percent a year, with per capita income rising by alittle over 1 percent annually. The rate of economic growth coupledwith the distributive policies permitted the per capita consumption ofthe main staples to increase. Thus, the per capita consumption ofcalories increased from about 2,300 a day in 1952 to nearly 2,60020 years later; that of protein from 35 to 45 grams a day; and of cottontextiles from 2kg to 3kg a year.
5 For most of the two decades, the economy faced a shortage of foreignexchange and an insufficiency of domestic resources with which tofinance its policy goals. Since the end of World War II, Egypt more orless continuously ran a deficit in its balance of payments. This deficitwas financed at first by drawing down sterling reserves accumulatedduring the war. After the reserves had been spent, Egypt began toaccumulate foreign debt.
The foreign exchange problem was made worse by the cessation ofassistance from the West. Aid from the United States was subject tofluctuations and was discontinued in June 1966. Problems of compen-sation for the nationalized foreign enterprises stood in the way ofassistance from the World Bank after 1959. Similar problems arosewith most of the potential aid-giving countries of Western Europe.Egypt came to rely increasingly on supplier credits, so that annualdebt service payments rose rapidly. Egypt’s foreign exchange problemessentially arose from the attempt to run a balance of payments deficitin excess of the available foreign aid.
The foreign exchange situation deteriorated further after the warwith Israel in 1967. In general, the government attempted to deal withbalance of payments difficulties by restricting imports; there was nosystematic attempt to increase exports. At times the compression ofimports could be quite drastic – for example, imports were reduced bynearly 20 percent between 1966 and 1967, and in the first six monthsafter the war they were another 17 percent less than in the corre-sponding period a year earlier. Such fluctuations played havoc with
Economic development and policymaking, 1952–73 11
capacity utilization and were a major reason for increasing unit costsin industry.
6 The pressure on domestic savings arose from the budget deficits.During the 1960s the deficit arose because, although revenue growthoutpaced that of nominal GDP, current expenditures grew evenfaster. The rise in expenditure was greatly influenced by expenditureon defense, which according to the published figures increased from27 to 35 percent of total current expenditure. These figures, nodoubt, understated the true position. But even non-defense expendi-tures grew significantly faster than revenues, owing principally to thelarger provisions for the social services. The decline in savingsimpacted chiefly on public investment, which dropped by one-thirdbetween 1964 and 1968.
7 The economic system was characterized by increasing inefficiency.Examining the agricultural sector, Hansen and Nashashibi (1975:158–94; Appendix A) estimated the separate impact of price distor-tions, of direct government intervention with acreages, and of theimperfection of market forces for 1962–68 on the deviation of actualacreage from optimal acreage of the main crops. They found that,overall, 7.9 percent of the total acreage was planted with the wrongcrops. Of this, 3.5 percentage points were attributable to farmers’imperfect response to prices and 4.4 points to government interfer-ence. In manufacturing, Hansen and Nashashibi (1975: 203–316)found that resource use in the ten major industries showed increasingeffective rates of protection and rising domestic resource costs ofearning/saving a unit of foreign exchange. Moreover, from a socialpoint of view, investment in many of these activities was inefficientlyallocated. Large amounts of investment had been channeled intobranches of manufacturing industry with low social profitability, whileat the same time activities with higher social profitabilities had beendenied the necessary capital for investment.
8 As Wahba (1994: 97) argues, a major source of the difficulties faced bythe state in the implementation of its economic, and particularlyindustrialization, policies was the schizophrenic strategy concerningdevelopment. On the one hand, the state’s goal of rapid economicgrowth necessitated a high level of investment, and therefore ofsavings. However, this was contradicted by the simultaneous pursuit ofanother goal, namely, increasing the consumption level of the popu-lation. This latter goal was supported by a policy of guaranteedemployment and rising wages, which worked against the pursuit of thefirst goal. These inconsistencies became especially critical whenresources were straitened because of decreasing foreign inflows andincreasing military expenditures.
By the end of the period, it was clear that Egypt’s aims greatlyexceeded its means. It could not afford to maintain a military con-
12 Economic development and policymaking, 1952–73
frontation with Israel, to prosecute a war in Yemen, to act as a leaderof the “nonaligned” group of countries, to champion the anti-colonialmovement in Africa, to set up a welfare state with guaranteed employ-ment and free access to education and healthcare, and at the sametime to antagonize the Western countries and the West-dominatedinternational financial institutions that were the chief sources of con-cessional capital and of modern technology.
Something would have to give. The economic situation did notallow much room for maneuver. Even before the October 1973 warwith Israel, President Sadat had graphically spelled out the seriousnessof Egypt’s economic plight:
Let me tell you that our economy has fallen below zero. We havecommitments (to the banks, and so on), which we should butcannot meet by the end of the year. In three months’ time, by,say, 1974 we shan’t have enough bread in the pantry!8
and:
I wanted to tell them [the National Security Council] that we hadreached the “zero stage” economically (marhalat alsifr) in everysense of the term. . . . I could not have paid a penny toward ourdebt installments falling due on January 1, 1974, nor could I havebought a grain of wheat in 1974. There would not have beenbread for the people.9
In the event, Egypt jettisoned the philosophy of a centralized economyand political dependence on the communist bloc.
The economic situation in 1974
In order to understand the impetus behind the infitah, it would be usefulto consider how the economic situation in 1974 and the immediate eco-nomic future appeared to Egypt’s policymakers after the 1973 war.
The picture in 1974 was of a general slowdown in the economy. Theconstant price GDP series showed that after two years of expanding atroughly 4 percent annually, the growth rate dropped to about 3 percentin 1973. The deceleration was brought about by a fall in value-added inthe mining sector of 9.8 percent (caused largely by a drop in crude oilextraction) and a decrease of nearly 15 percent in construction. Industrialgrowth in 1973 was estimated at 3 percent, agricultural growth at 2.4percent, i.e. just about in line with the increase in population.
The civilian labor force numbered about ten million in 1973, of which89 percent was officially estimated to be employed. The actual extent ofunemployment and underemployment is difficult to quantify. World Bank
Economic development and policymaking, 1952–73 13

missions of that period judged that there did not appear to be any appre-ciable degree of open unemployment in rural areas during peak seasons,but seasonal underemployment might be quite significant. In urban areas,and particularly in the services sector, there appeared to be a considerableamount of underemployment and low productivity employment. The driftof labor towards the towns accentuated this tendency. The touchyproblem of “educated unemployment” had been partially defused by auto-matically providing jobs in the government sector to all graduates. Othermeasures that had eased the employment problem in the short-run werethe expansion of the defense forces and a much more liberal attitudetowards emigration.
An issue that was becoming politically important was that of inflation.Largely as a result of controls, Egypt had experienced stable prices formany years. However, the situation began to change rapidly in 1973,chiefly because of rising import prices for food and other items, and thedislocations caused by the October war. The official consumer price indexrose by 7 percent, the food and beverages component increasing 11percent. The authorities sought to damp down the increases by reducingthe size of the subsidized loaf of bread and by adopting a “two-tier” pricesystem for some commodities; for example, the price of sugar in excess ofthe basic ration was raised from 15 piasters to 25 piasters per kilogram.10
However, the cost of maintaining a stable domestic price level for thebasic commodities in the face of rising import prices increased substan-tially: the General Authority for Supply Commodities registered a tradingloss of $228 million in 1973, over eight times the loss of $28 millionincurred in 1972.11
This trend intensified in 1974. The consumer price index rose by 10percent, with the food and beverage sub-index increasing by about 15percent. Much of the increase in the latter was caused by the spurt inprices of the non-controlled items, such as vegetables, fruits, and livestockproducts. Moreover, the official price indices greatly understated thedegree of inflation; unofficial estimates put the general price rise in 1974at between 20 and 25 percent.12
The cost of subsidizing domestic prices again rose sharply: the tradingloss of the General Authority for Supply Commodities almost quadrupled,rising to $845 million (27 percent of total current expenditures in thebudget), while for 1975 it was projected to increase by another 50 percent,to $1.26 billion (29 percent of budgetary current expenditures). The fore-going refers only to the cost of living subsidies; the total subsidy bill waslarger. Figures for earlier years are not readily available, but the consoli-dated amount for 1974 was estimated at $890 million and for the follow-ing year at $1.64 billion. And even these figures do not include the“implicit subsidies” provided by selling items, for example gasoline, at wellbelow international prices. These subsidies could be very considerable: theweighted average of domestic Egyptian prices for petroleum products in
14 Economic development and policymaking, 1952–73

1979 was less than 20 percent of world prices. The World Bank estimatedthe implicit subsidy in 1979 to users of petroleum products at LE 1.5billion, which was as large as the combined subsidy bill arising out of allexplicit consumer subsidies and public authority deficits. This fact tendedto be overlooked since the low energy prices did not imply any explicittransfer payment, because Egypt produced its own petroleum and prices,low as they were, did cover production costs as conventionally measured.
Even the explicit subsidy increases translated into substantial pressureon the budget. The overall budgetary deficit in 1974 was estimated at 17percent of GNP at market prices (substantially up from 11 percent in theprevious year) and for 1975 it was projected at 22 percent. This resultedfrom expenditures rising distinctly faster than resources: total receipts in1974 were 12 percent higher than in 1973, while total expenditures hadrisen by 28 percent.
The drag on revenues came essentially from two sources: a lack of buoy-ancy in a group of taxes, such as the property tax, the personal incometax, and especially customs duties, in all of which collections grew propor-tionately slower than the growth in the tax base, and the relatively lowlevel of transfers to the budget from profits of the public enterprises. Thelow transfers resulted largely from price controls and also from misdi-rected investments. The World Bank (1975: 124) estimated the rate ofreturn on assets for the public sector industrial units as a whole in 1973 atonly 11 percent, and remarked that international data would indicatesomething of the order of 20 percent as more appropriate.
The increasing budget deficits inevitably raised problems of financing.In 1974 the authorities resorted to substantial amounts of borrowing, bothfrom abroad and from the domestic banking system; these amounted torespectively 12 percent and 48 percent of the overall deficit (the bulk ofthe remaining amount was borrowed from social insurance and pensionfunds). This method of financing impacted on the money supply. Moneyand quasi-money rose by 29 percent in 1974 when output in real termsincreased by only 4 percent. This increase in domestic liquidity, followingan increase of approximately 40 percent in 1973, built up severe inflation-ary pressures.
The squeeze on the budget, the mode of financing the deficit, and theresultant inflationary pressures had consequences for real wages. TheEgyptian wage structure rested on legislated minimum wage rates – at thattime about LE 12 (approximately $31) per month – in both the publicand private sectors. These wages were supplemented by fringe benefits,bonuses, and profit sharing, which were particularly important in thepublic industrial sector. Wage increases were not formally linked toincreases in productivity, but were generally awarded to help keep up withthe rising cost of living. Thus, in 1972–74, when price rises had acceler-ated, wage increases were more readily granted. The rise was especiallylarge in 1974, and was particularly marked in some sectors, such as
Economic development and policymaking, 1952–73 15
construction. However, if the more realistic estimates of inflation are con-sidered, there is little doubt that real wages in Egypt were being squeezedduring this period.
In 1974, Egypt’s balance of payments came under even greater pressurefrom sharp increases in the international prices of Egypt’s imports,particularly foodstuffs; depressed demand for Egypt’s imports in Westerncountries; and slow disbursement of foreign assistance. The deficit oncommodity trade amounted to $1.75 billion in 1974 (more than twice thatin 1973). Exports increased to $1.67 billion, but fell far short of theincrease in imports. Even substantially increased Arab grants, amountingto $1.2 billion, did not suffice to fill the gap and a shortfall of $510 millionemerged, which was met chiefly through the use of bank credit facilities(with an average maturity of 180 days).
The balance of payments projected for 1975 indicated a further deteri-oration – a current account deficit of about $1.4 billion (compared with$326 million in 1974). The higher gap resulted largely from the worseningof the merchandise trade deficit, from $1.75 billion in 1974 to an esti-mated $2.5 billion in 1975. The gap on the balance of payments indicatesthe magnitude of resources required for Egypt to balance its externalaccounts. The amount of resources was only one aspect of the problem.The other, and more urgent, was that a large part of these resources wasrequired in the form of cash to repay the considerable amount of short-term bankers’ facilities that were falling due and to service the remainderof the debt.
The heavy use of these bankers’ facilities created acute problems ofliquidity, which reached crisis proportions in late 1974 and early 1975.The government’s 1974 foreign exchange budget projected total debt ser-vicing falling due in 1975 at LE 1,036 million ($2,650 million, of whichshort-term bank credit facilities amounted to $2,050 million). Foreigndebt liabilities expected to mature in 1975 were so large that the entireproceeds of Egypt’s estimated exports and “normal” grant aid expectedfrom Arab countries (about $1 billion) were deemed inadequate to servicethese obligations; the resources needed to finance imports would be anadditional requirement.13
The pressures created by the large volume of short-term debt hadbedeviled Egypt’s balance of payments for several years, and it was clearthat the country’s own efforts would not suffice to deal with this problem.To run a little ahead of the story, the crisis was resolved in 1976–77 only bythe intervention of a deus ex machina in the form of a newly created GulfOrganization for the Development of Egypt (GODE) set up by SaudiArabia, Kuwait, Abu Dhabi, and Qatar. This body quickly disbursed suffi-cient amounts (in the form of grants) to pay off the short-term debt, andalso to permit the freer import of vital intermediate goods.
The position of the major sectors was somber. Agriculture had beenlosing ground in the planners’ priorities; investment in the sector since
16 Economic development and policymaking, 1952–73
1970 averaged only 14 percent of total public investment, compared with18–20 percent in the late 1960s. Cotton output had leveled off since 1970and there had been little improvement in cotton yields since that time.Wheat output was increasing as a result of a combination of higheracreage and the introduction of higher-yielding varieties. However, wheatyields were still significantly lower than international levels and wheat andflour imports provided nearly 60 percent of current consumption.
Industrial production was plagued by capacity underutilization, whichwas getting worse. The extent and distribution of capacity underutilizationamong industry groups was evaluated in July 1973 and February 1974 bythe government, and reviewed in May 1974 by the World Bank. Thestudies estimated capacity underutilization in 1973 at 14 percent, risingsharply to 32 percent in 1974; in fact, underutilization was probably evenhigher, because “capacity” had been rather conservatively estimated.
In sum, the economic situation in 1974 was bleak. The growth of GDPhad slowed; the budget was under pressure and the deficit was increas-ingly being financed through borrowing from the banking system; themoney supply was increasing much faster than the real output of goodsand services; inflation was rising; real wages were being squeezed; thedeficit on the current account of the balance of payments was rising; theexternal debt was increasing; the composition of this debt meant thatEgypt required large and immediate cash resources in order to service it,and the country was becoming more vulnerable to external events.
At the same time, it was also clear to policymakers that the political andeconomic milieu – within Egypt, in the region, and internationally – hadchanged sharply after the October war. In order to take advantage of thealtered environment, a new economic approach had to be articulated.
The infitah
President Sadat offered such an approach in the October Paper, which waspresented to the People’s Assembly in April 1974 and approved in May. Itoutlined the case for a major redirection of policies in both political andeconomic spheres. The argument was essentially as follows:14
• After the war of October 1973, Egypt had to gird itself for the “con-struction battle,” which had as its aim the modernization of Egyptiansociety by the year 2000. The basic element in the modernizationprocess was an acceleration of economic growth. This would requireconsiderable assistance from abroad, and Egypt would have to adoptan “outward looking” economic policy.
• The role of the sectors would have to change. In the future, the publicsector would serve as the primary instrument for carrying out thedevelopment plan; undertake basic projects which other sectors wouldnot or could not; and provide essential services to private and foreign
Economic development and policymaking, 1952–73 17
investment. The private sector had been neutralized as a productiveagent owing to a number of “contradictory policies” in the past. It wasnow time to discard those conditions, and to provide the privatesector with stability and encourage it to maximize production.
• The changed conditions in the world made it extremely likely that,given a proper response, the necessary amounts of external capitalwould be forthcoming, especially from the vast increase in the finan-cial power of the Arab world. To avail of this opportunity, Egypt wasprepared to provide foreign investors with all the necessary legislativeguarantees.
The infitah or “open-door strategy” enunciated in the October Paper hasattracted much attention as representing a decisive break with the Egypt-ian economy’s public-sector-dominated past and providing a comprehen-sive guide to the future direction of the economy. While it did give asignal that henceforth the private sector would be a much more active par-ticipant in the economic process and that foreign investment would bewelcomed, the actual impact in terms of a significant change in the struc-ture of the economy remained limited.
For more than a decade and a half after the pronouncement of the newdirection, few ancillary actions were taken to buttress the new approach.Public enterprises continued to dominate the commanding heights of theeconomy – in manufacturing, petroleum production, imports, exports,infrastructure, as well as in large areas of distribution and other services.Their viability remained assured through the retention of officially-sanctioned monopoly power. The government did not attempt a seriousmove towards privatization of these enterprises until the 1990s, nor did itpass any legislation to create more competition. The banking sector con-tinued to be dominated by the big four public sector banks; even at thebeginning of the Third Millennium, 25 years after the pronouncement ofthe infitah, they provided nearly 60 percent of total credit from thebanking system. The policy of guaranteed employment in the governmentsector to graduates of universities and other institutions continued and, ifanything, expanded – Commander (1987: 26) estimated that the portionof the labor force in government employment rose from 9 percent in theearly 1960s to 27 percent in 1976 to about 32 percent in 1981. In acomment on the infitah Owen and Pamuk (1998: 137) claimed, with somejustice, that “economists remain puzzled about the basic thrust of Egypt’sliberalization.”
But perhaps they should not be. I.A. Richards famously cautionedcritics not to beat the cat for being the wrong sort of dog. Discussions withsome of the policymakers who were in key positions at the time of theinfitah suggest that one should not assess the infitah as if it had beendesigned to provoke a tectonic shift in Egyptian economic policy. Themotivation behind the “opening” was considerably more modest than its
18 Economic development and policymaking, 1952–73

rather grandiose billing might suggest. These policymakers argued thatthe infitah was not in fact a strategy, if by “strategy” is meant a coherentplan of action, including the passage of suitable legislation, the restructur-ing of institutions, and the adoption of integrated policies. The infitah wasprincipally an opportunistic tactic intended to facilitate the inflow of Arabfunds.
The story of the movement towards economic reform appears to be asfollows. The first stirrings in favor of reexamining Egypt’s economic strat-egy came after the military defeat of 1967. President Abd el-Nasser askedsome of his advisors to put forward their ideas on the long-term directionof the economy. According to Ismail Sabri Abdallah (Deputy Minister ofPlanning 1971, Minister of Planning 1972–75), a paper on a newapproach was presented by Abdel Moneim El Kaissouni, the Minister ofPlanning. This favored a larger role for the private sector and greater facil-ities for investment by Arab countries.15 Advisors from different parts ofthe economic and political spectrum commented upon the paper, forexample, Ismail Sabri Abdallah, Hassan Abbas Zaki (the Minister ofEconomy and Foreign Trade), and Fuad Morsi (Minister of Supply andInternal Trade 1972–73) provided comments as “socialist economists” andwere critical of the Kaissouni approach.
After reviewing all the (inevitably somewhat conflicting) advice, Presid-ent Abd el-Nasser decided that he was not prepared to undertake a funda-mental change of direction on the economic front, particularly as he wasfully engrossed in rebuilding the armed forces after the defeat of 1967. Hewould, however, present his own views on economic strategy.
The President’s response was conveyed in the 30 March 1968 Paper,which sketched out the principles of his economic strategy for the imme-diate future. This strategy rested on three pillars: (a) resource allocationwould give priority to defense; (b) development would be maintained at areasonable rate; and (c) subsidies and the policy of guaranteeing govern-ment employment to graduates would continue. The economic team waschanged in March 1968, with Said Gaballah being brought in as the Minis-ter of Planning. However, Dr Abdel Aziz Hegazy stressed that PresidentNasser did not close the door to a policy shift; from 1969, in particular, hebegan asking serious questions about the performance of the publicsector.16
After the 1973 war, President Sadat asked his economic advisors toprepare a paper on prospects for the future and the options open toEgypt. By this time the consensus among the counselors was that Egyptneeded a more mixed economy. There were, of course, some dissentingvoices; for example, Aziz Sidqi (Minister of Industry, Petroleum and Min-erals) was one of the prominent opponents of the “opening.” Commentstrickled in in a desultory manner; and according to both Dr Hegazy andIsmail Sabri Abdallah, the Cabinet held no systematic discussion of majorchanges in economic strategy.
Economic development and policymaking, 1952–73 19

Dr Hegazy maintains that the open-door policy was intended moreas an “investment promotion program” than as a blue-print for afree economy. Sentiment for a modification of the socialistic economicpolicies had increased among President Sadat’s advisors, but Cabinetdiscussions of reform remained perfunctory. However, a number ofimportant arguments had surfaced in Cabinet briefs and in Ministerialmeetings. Dr Hegazy identified the following as having carried the mostweight:
1 Most Egyptian exports were to Eastern Europe, while most imports(including wheat and other food items) were from the West. Thisimbalance created a serious shortage of hard currency, and had to beredressed if Egypt was not to continually suffer from balance of pay-ments pressures, and thus be vulnerable to external events.
2 The technology that Egypt obtained from the Soviet bloc wasmediocre. In order to become internationally competitive, Egyptwould have to procure more technology from the West. Unless financ-ing were obtained from somewhere on suitable terms, obtaining theseimports would further exacerbate the hard currency problem.
3 After the Nixon–Brezhnev meeting of May 1972, it appeared that theSoviets were opening up to Western investment and there was the pos-sibility that this might lead to a political rapprochement between thetwo superpowers. Egyptian policymakers feared that a casualty of thisdetente might be the strength of Soviet support for Egypt. “You mustnot put all your eggs in one basket” was the advisors’ sentiment, andthey recommended that Egypt make its own opening towards theWest. In pursuit of this diversification, Egypt canceled two significantprojects with the Soviet Union (import of 500,000 textile looms and aphosphate project) and attempted to acquire the capital equipmentfrom Western sources.
4 Egypt was now more prepared for trade with the West since, perhapssomewhat paradoxically, commercial dealings with the Soviet bloc hadcreated a new generation of entrepreneurs who had made money andacquired a measure of business skills from the export–import tradewith the Soviet Union. This new generation would step into the shoesof the former entrepreneurs, who had largely been eliminated duringthe nationalization period.
5 After the oil price increase of 1973, many Arab countries hadacquired a considerable amount of wealth. In view of the sacrificesthat Egypt had made for the Arab cause, it should be possible to findways in which some of this additional wealth could be translated intoinvestment in Egypt. Moreover, an estimated two million Egyptianswere working in these Arab countries, but the larger part of theirsavings was deposited in the West rather than repatriated to Egypt.This potential resource could also be tapped.
20 Economic development and policymaking, 1952–73

The immediate aim of the October Paper was to set up a mechanism thatwould encourage an inflow of capital from the Arab countries and therepatriation of additional amounts of the savings of Egyptians working inthose countries into Egypt. These considerations provided the stimuli forenacting Law 43 of 1974, which eased the path for Arab and other foreigninvestment.
As a measure of the success of the policies in attracting funds, DrHegazy cited studies for the Cabinet which calculated that between 1974and 1990 capital transfers attributable to the open-door policy increasedby about 65 percent. These studies further estimated that about 75percent of these transfers came from Egyptians who had invested theirmoney abroad and were now repatriating it to Egypt; 15 percent fromArab countries (the expectation had been higher, but between 1979–89Egypt had been boycotted as a result of its peace agreement with Israel);and about 10 percent from European countries.
The implementation of the “open-door” strategy was in part watereddown because key Ministers remained opposed to the new direction orwere only half-hearted converts. This lack of clarity within the Cabinetconcerning the vigor with which the new route ought to be followed isreflected in the manner in which for several years the policy was portrayedin official pronouncements as being compatible with socialism. The dis-cussion in Ministry of Planning (1977b: 7–13) offers a good example, andDessouki (1982: 75) reminds us that it was only in 1979 that PresidentSadat felt able to tell representatives of industry and commerce thatcapitalism was no longer a crime in Egypt. These facts perhaps also eluci-date why the other measures that would have been required to support afull-fledged strategy for liberalizing the economy were not developed.
There is further evidence that the country’s economic managers con-sidered the ills of the economy to be short-term and not structural, and assuch could speedily be cured by an infusion of financial resources. Thisalso explains the emphasis on aiming for Arab funds. Such funds werelikely to be mobilized more quickly than those from other sources, andwere less likely to require institutional and other changes by Egypt. Thus,in spite of the strategic rhetoric attending upon the infitah strategy, policy-makers actually thought:
[I]n early 1975 that the crisis of the Egyptian economy was temporary,resulting from insufficient liquidity and a temporary deficit in thebalance of payments. . . . From this point of view it was logical thatefforts should be concentrated on seeking liquid resources from abroadwithout changes in domestic economic structure and general policy.17
It is therefore not surprising that in the years immediately following theOctober Paper, the economic problem was viewed principally as a stabiliza-tion issue to be addressed through demand-management procedures.
Economic development and policymaking, 1952–73 21

It was not until deficits continued to mount, debt to increase, and infla-tion to soar that the imperative of structural reform began to be recog-nized. As the Five-Year Plan for 1978–82 put it:
Until recently, economic policies have emphasized foreign aid andthe reduction of spending instead of regulating and reorganizing theeconomic structure of the society.18
The immediate results of the open-door policy probably dismayed even itsstaunchest supporters. The first and most visible result was the rapidexpansion in consumption, which increased from 63 percent of GDP in1973 to 75 percent in 1975. Between the same years imports almostquadrupled, rising from about 10 percent of GDP to over 30 percent. Thebiggest increases in imports came in consumer goods (largely becauseboth the price of wheat and the quantities imported increased sharply)and consumer durables. The latter increased from 0.3 percent of GDP to1.3 percent; Cooper (1982: 115) observed that more cars, televisions, andrefrigerators were imported into Egypt in 1975 than in the previous fouryears, and he commented that “commerce had truly become the focalpoint of liberalization.” Weinbaum (1986: 40–1) saw Egypt’s foreignexchange earnings “severely drained for imports, much of it for luxuryitems,” and reported that a large share of US-supplied low-interest busi-ness loans went to Egyptian importers, “many of whom were unnecessarymiddlemen, reselling the goods they purchased to the Egyptian govern-ment.”
It was not that President Sadat had not been cautioned about the con-sequences of too rapid a liberalization. Several quarters, private and offi-cial, had expressed apprehension about the manner in which the opendoor policy was being implemented. Ahmed Baha El Din, a well-knownwriter, had dismissed the policy as “infitah sadah madah” – a play on wordsthat, in addition to its dictionary meaning of a state of utter confusion,suggests not only an open door, but also no windows, walls, or any bound-aries whatever. President Sadat’s own Prime Minister, Dr Hegazy, haddrawn attention to the experience of the United Kingdom immediatelyafter World War II and explained in some detail to the President howcarefully a post-war economy had to be eased back towards normality.
Dr Hegazy felt that the situation in Egypt after the October 1973 warneeded a cautious loosening of restrictions on consumption while at thesame time encouraging the movement of resources towards civilian invest-ment and increasing productivity. However, another group in the Cabinetdemanded an immediate increase in consumption to compensate thepopulation for the years of privation before the October war. Dr Hegazysaid that whenever he tried to apply the brakes on consumption increases,rivals within the Cabinet created street demonstrations against the pro-posed measures.19 President Sadat was unwilling to risk any possibility of
22 Economic development and policymaking, 1952–73

political disquiet, and sided with the “immediate peace dividend” factionin the Cabinet. Thus, at a critical juncture in Egypt’s economic history, theinternal dynamics of the Cabinet, coupled with the President’s preferencefor the soft option, made it impossible to limit the consumption binge,particularly by the higher income groups (as they were the ones with thepurchasing power).
Economic development and policymaking, 1952–73 23

2 Economic development andpolicymaking, 1973–87
What was the impact of the new economic strategy and how did theeconomy perform in the decade after 1973? The second question is easierto answer than the first. Ikram (1980) and Handoussa (1990) describeareas in which economic performance improved sharply. The growth ofGDP in 1975–86 averaged over 9 percent a year in real terms; even in theface of an annual population growth rate of 2.8 percent between 1976 and1986, real per capita incomes increased at an average of 6 percent a year.The investment rate doubled from 13.7 percent of GDP in 1973 to28.7 percent in 1985. The growth in investment was paralleled by a rise ingross domestic savings from 8.3 percent of GDP to 17.8 percent in the twoyears.
Social indicators also progressed. The number of absolute poor ruralhouseholds declined from 51 percent in the early 1970s to 30 percent bythe early 1980s; the infant mortality rate declined from 117 per thousandto 93; life expectancy at birth rose from 50 to 58 years; the average caloricintake per capita increased from 100 to 128 percent of minimum standardrequirements; and the primary school enrollment ratio improved from 72to 78 percent.
However, these improvements owed little to policy changes informedby the infitah. The economic resurgence was based on a combination ofserendipitous events that enabled Egypt to access a much larger volume ofresources. This made possible a simultaneous increase in investment andimports, both for consumption and for intermediates that permitted fullerutilization of installed capacity. But fundamental structural issuesremained unaddressed.
There was an absence of policies that would have increased competi-tiveness, or which would have improved the economic rationality ofdecisions by correcting distorted price signals. Nor was there a pursuit ofinstitutional changes that would have reduced transactions costs. Theenlargement of the economic cake by the fortuitous inflow of resources(oil exports, Suez Canal earnings, worker remittances, tourism receipts,and external assistance) masked serious rigidities in the economic struc-ture. Bruton (1983: 682) argued that the foreign exchange windfall did

little to affect the productivity of the “real” Egyptian economy, and thatthe elimination of the foreign exchange constraint enabled the govern-ment to avoid taking the difficult decisions that were necessary to raise theefficiency of resource use. The cost to the economy of such rigiditiesbecame especially marked after 1982, when falling oil prices causedforeign exchange earnings to decline, but the overvalued exchange rateand the price distortions continued the bias towards nontradables.
Some commentators contend that the sudden growth in foreignexchange availability created a variant of the “Dutch disease” phenome-non. “Dutch disease” models predict that a heavy influx of foreign cur-rency (generally caused by sharp increases in primary product or naturalresource export prices) can put upward pressure on the exchange rateand erode the competitiveness of industrial exports. Because means ofproduction do not have to be allocated to earning them, revenues fromworker remittances, foreign aid, and oil can produce a similar effect. Ithas been held that the surge of such windfall resources during this periodwas particularly damaging to the competitiveness of Egyptian industry.
An alternative view is that of Cottenet (2003), who argues that thebehavior of the industrial sector during this period can better beexplained by an “allocation of talents” mechanism. The boom attendingupon the infitah created a politico-institutional environment that maderent-seeking activities more profitable than productive activities, and thusattracted the best talents towards the former. Under either explanation,access to a large amount of resources not related to the productivity of theeconomy created serious distortions in the incentive structure.
The GDP increased rapidly during 1974–87, but these years are bestdivided into two subperiods, because of important differences underlyingthe growth. In the first subperiod (1974–81), the growth rate averagedover 9 percent a year, and was based on a conjuncture of three events.
First, the return of oil fields and the increase of international oil pricesin 1973 and 1979 provided Egypt with large windfalls in foreign exchangeearnings. The main oil fields in the Gulf of Suez resumed production afterthe 1973 war, and revenues from oil exports in 1981 reached $3,013million compared with $44.8 million in 1972. In 1974 oil had accountedfor less than 3 percent of GDP, 11 percent of exports, and less than 1percent of government revenue; in 1981 it reached nearly 13 percent, 59percent, and 20 percent respectively. Concurrently, non-oil exportsdropped because the demand generated by rising oil incomes and theexpansionary fiscal stance diverted commodities from the foreign to thedomestic market. Thus, the value of cotton exports dropped by 50 percentin constant prices over the 1974–81 period, textiles by 40 percent, andmanufactured exports as a whole by 46 percent. As a result, the Gini indexof the concentration of exports increased from 0.442 to 0.483 (a value of1.0 shows maximum concentration), suggesting an increased exposure ofexport earnings to external shocks.
Economic development and policymaking, 1973–87 25
Second, the vast increase in purchasing power that higher oil revenuesgave to the Arab oil producers created an enormous demand for Egyptianworkers in all fields. This not only eased the unemployment problem inEgypt, but also led to a very substantial flow of remittances from theseexpatriate workers. The flow of remittances surged from $189 million in1974 to $2,855 million in 1981.
Third, there was a rapid escalation in external assistance. Arab coun-tries, which had already provided major support, stepped up their aid pro-grams. An immediate effect was the formation of the Gulf Organizationfor the Development of Egypt (consisting of Saudi Arabia, Kuwait, Qatar,and the United Arab Emirates) in April 1976, which quickly disbursedabout $2 billion to pay off most of Egypt’s short-term debt and to permitthe freer import of consumer and intermediate goods. As part of theirsupport of movement towards peace in the Middle East, the main Westerncountries (particularly the United States) and Japan commenced very sub-stantial programs of economic assistance to Egypt. A large pipeline of aidcommitments was soon built up, and in 1981 the total disbursement ofofficial loans and grants into Egypt was put at $1,602 million, or 7 percentof GDP.
While this deluge of funds radically eased the foreign exchange con-straint, it did nothing to ensure a more effective use of resources. Owenand Pamuk (1998: 137) remarked that “Once the regime found itself inpossession of huge new funds towards the end of the 1970s, all pressurefor public sector reform evaporated.” Serious structural reform did notbegin until the 1990s.
The period immediately after the announcement of the “open-door”policy was particularly difficult for policymakers, who had little experiencein managing a market economy. They did have access to analyticalsupport from institutions such as the World Bank, the International Mon-etary Fund (IMF), and the USAID, but some degree of wariness in therelationship between the Egyptian authorities and the donor agencies wasonly to be expected.
Egyptian ministers repeatedly voiced the opinion that outside advisorsdid not quite understand the Egyptian situation and were unrealistic intheir expectations, particularly concerning the pace at which reformscould be undertaken. There was also the feeling that the internationalagencies could be insensitive: as one minister said, “They are too eager toannounce the crime and to pronounce the sentence.” These remarksapplied more to the IMF and the World Bank; the USAID appeared to bemore circumspect in pressing for economic reforms because its business,quite patently, was to provide financial assistance in exchange for politicalsupport. For their part, the international financial institutions (IFIs)expressed frustration with what they politely termed “missed opportun-ities.” To the IFIs, it appeared that the Egyptian authorities accepted theiranalyses of the problems, but did not want to follow through on the
26 Economic development and policymaking, 1973–87

required policies. “They [the Egyptians] wanted simply to waive thepenalty, not to rescind the judgment,” minuted an IFI discussant.
For a variety of reasons, the World Bank was constrained in pressing forwide-ranging reforms. Over 80 percent of the Bank’s lending to Egypt atthis time was for specific projects; this type of financial support permittedthe Bank to propose conditions on that particular project or at times forthe sector in which the project was located, but did not give it much scopefor requiring economy-wide conditions. Moreover, the World Bank hadalready come in for a great deal of criticism in Egypt because of its role inthe Aswan High Dam incident. The Bank was therefore anxious to mini-mize friction when it resumed lending to Egypt in 1973. Thus, of the bilat-eral and international organizations, the IMF remained the most active inproposing conditions on macroeconomic policy.
The political economy of decision-making during this period is thestory of a complex interaction between the views of the Egyptian govern-ment, of bilateral donors, and the multilateral agencies. World Bank andIMF reports of this time highlighted three weaknesses in Egypt’s economicmanagement. First, the lengthy period of socialistic control and centraldirection had left few officials in senior positions who were wholly com-fortable with the functioning of a modern market economy; there werejust not enough persons qualified to devise policies for and to manage thechanged economy. Second, the coordination of policies between the dif-ferent ministries remained unsatisfactory, and on more than one occasionthe international agencies proposed that a unit be set up in the PrimeMinister’s Secretariat to harmonize economic policies. Third, perhaps as aresult of the first two inadequacies, Egypt had not managed to articulate aclear economic strategy, and its thinking and actions tended to be reactiverather than proactive. In the view of international agencies, this created acertain defensiveness in the Egyptian response to donors’ recommenda-tions, and tended to make negotiations more difficult than they need havebeen.
An economic issue with important political overtones cropped up quiteearly after Egypt’s opening to the West, and highlighted the effects of theforegoing weaknesses. Since this incident – the handling of policies thatled to the bread riots of January 1977 – continues to resonate even todaywith policymakers, it might be worthwhile to look behind the scenes at thepolitical economy of the decisions leading to it and the dynamics of thepolicymaking process.
Egypt required a substantial infusion of external funds and the IMFand the World Bank were prime candidates for providing much of theseresources. However, the resource transfer from these institutions isaccompanied by policy conditions. Broadly speaking, the reasoning is thatin the absence of some unavoidable shock, a country’s predicament is theresult of poor policies. A new set of policies is therefore recommended tomove the country out from its difficulties. The IMF imposes economy-wide
Economic development and policymaking, 1973–87 27

conditions on its lending, because it is responsible for helping countriesto maintain macroeconomic balance. In the nature of things, it is quitelikely that the policies recommended by the IMF lead to greater austerityand hardship before they begin to improve matters. However, no politi-cian wins kudos for imposing austerity, even if it is intended only for theshort run. Soon after the reactivization of links between Egypt and theinternational financial institutions, a critical issue faced by the Cabinet wasthe classic one of how to obtain the maximum resources from the Fundwhile minimizing the accompanying policy conditions.1
For most of 1975 and 1976, the IMF’s attention centered on the budgetdeficit and especially the weight of the cost of living subsidies. The Fund’smain condition for agreeing to a program was a reduction in subsidies.This prescription was resisted by the Egyptians, but by July 1976 the bud-getary situation had deteriorated to an extent that it appeared impossiblefor the country to hold out any further. It became known in Cairo thatEgypt was about ready to sign an agreement with the Fund. It also wasknown that substantive differences existed in the Cabinet on the merits ofcompleting the agreement. The Ministry of Economy was said to beleaning towards an agreement while some other ministries, notablyFinance, had serious reservations.
The Ministry of Economy’s position was based on three main considera-tions. First, Egypt needed the Fund’s resources to plug the gap in thecountry’s budget. Second, the Ministry reckoned that under the spur ofFund-recommended policies, Egypt could make quicker progress in redu-cing its reliance on external funds and it would thus be able to lessen itsvulnerability to external donors (even though in the immediate term, ofcourse, it would have to borrow more from the IMF). Third, the Ministryfelt that Egypt required the Fund’s “good housekeeping seal of approval”in order to reassure foreign investors; it preferred foreign investment toEgypt’s borrowing from abroad.
The Ministry of Finance emphasized a different set of concerns. In itsview, the terms of the agreement would adversely affect growth, impactharshly on the poorer sections of society, and mire the government inpolitical difficulties. The Ministry contended that the budget deficit couldbe brought down gradually by eliminating the more egregious subsidies,reducing some of the others in a phased manner, and increasing revenuesby improving the efficiency of tax administration. The Minister (Dr AhmedAbou Ismail) pointed out that this process had already begun: he had can-celled the subsidy on halaawa (a dessert) amounting to about $45 million,and had made other cuts that had reduced the subsidy bill by some $185million. He was as keen as the Minister of Economy (Dr Zaki Shafei) to seea lessening of Egypt’s vulnerability to external pressure; the issue was ofattaining this goal while minimizing risks to the country’s stability.
Dr Abou Ismail argued that after 1973 Egypt had made a politicalchoice in deliberately orienting its foreign policy towards countries that
28 Economic development and policymaking, 1973–87
were economically much stronger than the Soviet Union. These countrieswere willing to support a measured restructuring of Egypt’s policies andinstitutions. In his view, it would be irresponsible for an Egyptian policy-maker not to call on these countries for assistance so that change could bebrought about at a socially tolerable pace. He was also skeptical aboutwhether the Fund’s policy package would actually encourage foreigninvestment; such investors would be unlikely to derive much cheer fromthe “revolution” (his word) that was certain to follow an abrupt reductionin food subsidies.2
These two positions reflected very different assessments of the impactof the Fund’s proposals on the economy and of the actions that ought tobe taken to deal with the budgetary problems. However, the Cabinetdebate on these issues did not remain confined within an economicframework.
Dr Ahmed Abou Ismail and his Undersecretary showed me the letter ofpolicy drafted by the Fund that Egypt would have to sign. They askedwhether the terms looked reasonable, or whether Egypt should press theFund for adjustments, especially to the credit ceilings, the interest rate,and the actions expected on subsidies. The Finance Ministry was alsointerested in examining whether an exchange rate adjustment would bebetter handled as an across-the-board devaluation, or whether a system ofdual exchange rates would better suit Egypt’s circumstances. The idea wasthat one of these rates would be more depreciated and flexible and applyto exports, such as manufactures, that were supposed to be price-elastic,while the other would be retained for exports that conventional wisdomregarded as less responsive to exchange rate changes.
I replied that, first, the agreement was between Egypt and the Fund,and thus the World Bank could not properly take a position on it. I alsosought to discourage the view that simply because a proposal originatedfrom the Fund, it must inevitably be silly or necessarily inimical to Egypt’sinterests. Second, I did not see much merit in a system of dual exchangerates. Experience had shown that irresistible pressures would rapidly buildup to move items to the more favorable rate and to create intermediaterates, and a dual system would soon become hopelessly multiple.
Third, there was little point in parsing the draft policy letter for loop-holes. The more effective course was for Egypt to formulate a coherentposition reflecting its own priorities, such as reducing poverty and increas-ing employment. This would have implications for the growth of the GDPto absorb labor, the level of investment needed to produce this growth,and the policies that would create an environment most likely to elicit thisinvestment. Furthermore, the impact of cuts in food subsidies on the realincomes of the poor would have to be examined. Egypt might be able toaccept a selective modification of the system while resisting proposals forsweeping or untargeted reductions. Research by the Bank suggested thatfor the poorest groups the subsidy system augmented family incomes by
Economic development and policymaking, 1973–87 29
about 15 percent. Cuts of the magnitude implied by the Fund’s Letter ofIntent could devastate families at the lower ends of the income distribu-tion. Once the Egyptian authorities had developed their own perspective,it could be compared with the Fund’s recommendations and an exchangeinitiated on the merits of the rival approaches.
The officials responded that the schedule of negotiations with the Fundhad been accelerated and did not allow time for Egypt to develop a com-prehensive position. The Cabinet was to finalize matters that afternoon.The Ministries of Economy and Finance would submit their contrastingevaluations of the Fund’s proposals and present their recommendations,and the Cabinet would have to adjudicate the disjunction between the tworeadings. Dr Ismail recognized that there were cogent arguments insupport of both positions, but he was apprehensive that a debate focusingexclusively on economic costs and benefits would miss the really import-ant issues. His Ministry opposed the Fund’s proposals because they werelikely to create serious political problems for the country. Since the eco-nomic content of the Fund proposals was inseparable from its politicalimplications, the latter should be explicitly discussed at the Cabinetmeeting.
The Ministry of Finance had three main concerns. First, a calculationby the Ministry of Planning showed that the Fund’s package was likely toincrease consumer prices by at least 30 percent. (I had these estimatesexamined by Professor Lance Taylor of the Massachusetts Institute ofTechnology and by the World Bank’s economic mission, who both broadlyaccepted the Ministry of Planning’s conclusions.) Was the Prime Ministerprepared to take the government into an election in three months’ timewith a 30 percent increase in the price level? Second, President Sadat’smajor achievement was to change Egypt’s alliances from the communistbloc to the West. The Fund was seen as a Western institution and the con-sequences of its policies would be visited upon Western countries. If thepublic viewed these policies as impoverishing the common man, supportfor the President’s strategy would wither. Was the Cabinet ready to acceptresponsibility for undercutting the President’s global strategy? Third,given the probable level of public dissatisfaction, would the Cabinet andthe President have the stomach to pursue further economic reforms?
It was obvious that once the economic arguments were recast in a polit-ical lexicon, the prospects of an immediate agreement with the Fundwould evaporate. Indeed, after the Cabinet meeting, the IMF representat-ive was informed that several further studies would be required before adecision on the subsidy question could be reached. This put paid to anagreement with the Fund.
Subsequent events conformed more closely to the Ministry of Finance’sunderstanding than that of the Ministry of Economy. The denouementarrived in January 1977 after a new Cabinet had taken office in November1976. Early in January, rumors were making the rounds of Cairo that
30 Economic development and policymaking, 1973–87
major price increases would be announced in the forthcoming budget. Indiscussion with different sources, it was made apparent to me that anabrupt reduction in cost of living subsidies was likely to carry the mostsevere consequences. I telephoned Vinod Dubey, the chief economist ofthe World Bank’s Middle East region and presented an analysis of thestate of affairs. I insisted that the Bank would be doing Egypt a very seriousdisservice if it were to join the Fund in pressuring the country into impos-ing swingeing cuts in cost of living subsidies. I recommended, rather, thatif Egypt continued on the path of reform, the Bank should remain sup-portive and open to discussions regarding its pace. The next day Dubeytelephoned me to say that the region’s management and the WorldBank’s President, Robert McNamara, had accepted my assessment of thesituation and recommendations on the Bank’s response. I was authorizedto inform the government that the Bank would separate its approach fromthat of the Fund if the latter continued to insist on an immediate andmajor reduction of cost of living subsidies. I was also asked to notify theCabinet that the Bank would hold the first meeting of the ConsultativeGroup of aid donors if Egypt continued to move on reform, even if Egyptand the Fund failed to conclude an agreement.
I briefed Dr Hamed El Sayeh, the Minister of Economy, on these devel-opments. In turn, he gave me a detailed account of where Egypt and theFund stood in their negotiations, and arranged a meeting with Dr AbdelMoneim El Kaissouni, the Deputy Prime Minister, and some ministersfrom the economic group of the Cabinet. I presented the Bank’s views,and was asked to argue the pros of the Fund’s position (there was noshortage of advocates of the cons). However, the next day Dr El Sayeh toldme that the ministers agreed to the reforms outlined by the Bank, butwere willing to go some distance with the Fund in order to ensure a “goodstatement” from it at the Consultative Group meeting.
The budget announced on January 17, 1977 proposed price increasesfor several widely-consumed commodities: rice 16 percent, gasoline 31percent, cigarettes 12 percent, household cooking gas 46 percent, sugar3.3 percent. Cooper (1982: 236) reports estimates of the subsidy cutsincreasing the cost of living by at least 15 percent for someone with anaverage income. The public’s reaction was immediate and violent. Seriousriots erupted on the 18th and 19th; the first that Cairo had witnessed since1952. The official toll was 73 dead, nearly 800 injured, and 1,270 arrested.The army was called in, curfew was imposed, but the violence did notabate until the afternoon of the 20th, when it was announced that theprice increases had been rescinded. The United States ambassador, adiplomat with outstanding experience in the Middle East and with excep-tionally well-informed sources, told me that an acrimonious debate haderupted in the Cabinet over who should be blamed for the fiasco. Hisjudgment was that, on this occasion, the President would put the blameon the ministers responsible for internal security; however, ministers in
Economic development and policymaking, 1973–87 31

the economic group would also feel the pressure and major reformswould be unlikely for perhaps the next 12 months. He was proved correct– the Minister of Interior was replaced about three weeks later and aneven greater degree of circumspection descended on economic policy-making.
Ministers in the economic group came under much criticism frompolitical circles. Members of the budget and planning committee of thePeople’s Assembly told me that they were not satisfied that the impact ofthe price increase on family budgets had been adequately considered bythe exchequer. They also thought that the differential impact of the pricerise between urban and rural families had been overlooked. Outside themain urban areas it was difficult to obtain subsidized commodities atprices fixed by the government; a premium often had to be paid. Theentire structure of pricing (including the premium) would now be movedupward quite sharply and rural families, who were among the poorerclasses in Egypt, would suffer disproportionately. Finally, the politicalimplications of the price rise had not been adequately weighed. In theview of committee members, the budget’s actions on subsidies hadresulted not so much from “so-called economic rationality” as from polit-ical naiveté. Other politicians told me that the country had paid a highprice merely to relearn a rather well-known lesson, namely, that peopleget very upset when their lunch is put at risk.
This was perhaps too harsh a judgment. My discussions with a numberof Cabinet members in 1977 clearly indicated that the economic ministershad tried to ascertain the views of the different factions within theCabinet. There had also been a comprehensive discussion concerning thenumber of commodities whose prices would be raised. The difficulty, asDr Salah Hamed (the Finance Minister in January 1977) reiterated, wasthat the Fund had mandated a target for the overall budget deficit, andacting on a smaller number of items meant that the price increases forsuch items would have to be much steeper.3 He further maintained thatno minister at these Cabinet discussions had disagreed with the decision.He confirmed that the night before the budget announcement, the rulingparty’s caucus in the National Assembly had conferred its blessing on thecourse adopted. President Sadat had given oral approval to the PrimeMinister. Dr Salah Hamed contends that the critics of the January 1977budget were carping only with hindsight, and that no one had offered anypractical suggestions at the time on how to tackle the budgetary problem,which essentially resulted from sharply rising expenditures on consumersubsidies and government salaries. The Cabinet had tried to cut someadministrative expenditures and to hold back salary increases, but hadbeen overruled by President Sadat. The President may have taken this intoaccount in the aftermath of the riots. The economic ministers tenderedtheir resignations, but the President did not permit them to stand downand put the blame on the Ministry of Interior.
32 Economic development and policymaking, 1973–87
The riots and subsequent rescission of price increases inevitably hadserious consequences for the budget and for the conduct of economicpolicymaking. In the initial budget for 1977 the authorities had under-taken policy actions toward improving the fiscal position; taking all themeasures into account they had forecast an improvement in the budget ofLE 280 million. The measures finally approved in the budget submitted tothe People’s Assembly after the civil disturbances were expected to yieldan improvement of only about LE 45 million. This naturally meant thatthe share of foreign financing in the budget was likely to increase.
The actual outcome was rather worse. The financial program for 1977had envisaged a bank-financed deficit of approximately LE 400 millionwith additional measures to be taken during the year to bring this figurewithin the ceiling of LE 350 million agreed with the Fund. Developmentssince the standby arrangement was approved showed that the overalldeficit was likely to be about LE 300 million greater than projected earlierin the year, and no new measures had been taken to improve the fiscalsituation. The government resorted to net external borrowing greaterthan originally projected and with a higher level of domestic non-bankborrowing, the revised estimate for government borrowing from thebanking system would be LE 125 million above the ceiling.
A further consequence was that both the IMF and the Egyptian authori-ties became more guarded on the question of subsidies. The draft Letterof Intent dated May 13, 1976, which was prepared when it appeared thatEgypt might be moving towards an agreement with the Fund, specificallymentioned the elimination of subsidies on a number of items and thereduction of food subsidies by LE 100 million annually. This letter wasnever signed; the food riots of January 1977 supervened, and negotiationswith the Fund were put on hold. In March 1977 the Egyptian authoritiesrequested a one-year stand-by arrangement from the Fund. The letterrequesting this arrangement spoke vaguely of an intention “to introducefurther measures during the year,” but was silent on the question of subsi-dies. In the following year a revised Letter of Intent (dated June 10, 1978)was signed. This made no mention of decreasing the absolute level of sub-sidies, but merely affirmed the government’s intention of reducing theirrate of growth.
At this time, Egypt and its principal advocates realized that the scale ofexternal financing required by the country made it imperative to enlargethe number of donors and to coordinate their efforts. The World Bankthus set up a Consultative Group of aid donors, the first meeting of whichwas held in Paris in May 1977. The donors’ primary interest was to mini-mize the duplication of efforts; another major aim of the joint action wasto set conditions that would prevent Western assistance from being recy-cled by Egypt to repay its debt to the Soviet Union.
The Egyptian government’s instructions to its delegation emphasizedfour objectives for the Consultative Group meeting. The first was largely
Economic development and policymaking, 1973–87 33

political: it was to demonstrate to potential investors and to the Egyptianpublic the wide range of support that Egypt was able to attract. Second, itwas to get at a single meeting an estimate of the external resources avail-able to Egypt. This would facilitate planning and budget preparation byreducing the delay and uncertainty from having to negotiate aid commit-ments with each donor bilaterally; a process that could occupy severalmonths. Third, it was to try to obtain as large a portion of the assistance aspossible in a quick-disbursing form. But fourth, and very importantly, itwas to make a case for assistance in the form of grants rather than loans.As Dr Kaissouni, the leader of the Egyptian delegation, put it, his directivefrom President Sadat was “to ensure that Egypt’s past does not become itsfuture.”
The government also sought to widen the sources of economic advice.In 1976, President Sadat turned to Germany’s Chancellor HelmutSchmidt for high-ranking advice on economic and financial policy. Inresponse the Chancellor sent a team of German experts led by formerFinance Minister Alex Möller. The report was completed in June 1977 andsubmitted to President Sadat in September. A sanitized version, excising adiscussion of reforms to the decision-making process, was published inBerlin in 1980.
The Möller report covered many of the structural features of theeconomy and offered practical advice. It recognized that Egypt mightnever be able to forgo the subsidization of the most important food items,but described mechanisms (such as a “foodgrain compensation fund”)whereby the impact on the budget over the long-term could be moder-ated. The report also provided one of the earliest public recommenda-tions for the project that was commenced in the late 1990s and has cometo be known as the “Toshka” project. The report recommended that “allpossibilities to create development regions outside the Nile Valley and theNile delta should be exploited right now,” and went on to specify as one ofthese regions “the New Valley, whose agricultural potential can be used ifa canal link to Lake Nasser is established.”4
However, the report did not have much impact on policies and theCabinet never discussed the proposals in any depth. Indeed, even in mid-1978, a number of ministers who would have been responsible for imple-menting the recommendations of the report had not seen the document.It is possible that the President’s primary motive for soliciting the reportmay have been simply to demonstrate that Egypt was not dependent foreconomic advice exclusively on the United States, or on internationalorganizations in which the USA occupied a dominant position.
The rapid expansion in external economic assistance raised fresh ques-tions for policymakers on how most effectively to utilize these resources. Itis convenient to discuss the major policy issues connected with externalaid at this point, even though they were raised by policymakers at some-what different times. Five broad issues recurred with sufficient frequency
34 Economic development and policymaking, 1973–87
to warrant serious discussions in Cabinet and with the international agen-cies and bilateral donors.
The first was the question of project versus program (i.e. for balance ofpayments support) assistance. Egypt argued for a relatively larger propor-tion of cash transfers or of program assistance in the total volume of aid,especially from the United States.
The economic reasons for seeking a relatively larger amount of suchassistance were:
1 This type of assistance disbursed very quickly. Studies by the WorldBank showed that between 50–60 percent of the amount committedwas likely to be disbursed in the 12 months following commitment,compared with only about 3–5 percent of the commitment of projectaid. Moreover, the emphasis on project assistance implied muchgreater involvement by the donors, especially the United States(because it was the largest provider of aid by far), in identification mis-sions, feasibility studies, reviews, and prolonged contracting processes,all of which contributed to delays, and were resented by the Egyptiansbecause, as Weinbaum (1986: 102) judged, of the “comparisonbetween the supervision of US-sponsored projects in Egypt and USeconomic assistance to Israel that is delivered without an AID mission.”
2 Program assistance provided more flexibility for implementing prior-ities determined by Egypt. A Ministry of Planning paper argued that iftotal resources, including aid, were insufficient for all of a group ofpossible projects, the choice of projects implemented with a givenamount of program aid could include a larger number of projects towhich Egypt attached higher priority than might be possible from thesame volume of project assistance in which the donor determined thechoice of projects.
The paper argued along the following lines. Suppose that Egypt’sdesired portfolio consisted of 20 possible projects, but resources (bothfrom domestic sources and from external donors) were available foronly 15. Suppose also that Egypt’s rank order of priorities for all 20projects was the opposite to that of the donors; i.e. for the donors, pro-jects from best to worst would be those numbered 1, 2, . . . 19, 20, whilefor Egypt the ranking from best to worst would be 20, 19, . . . 2, 1. If thedonors provided project aid for, say, five of the projects, they wouldselect the five to which they attached the highest priority, namely,numbers 1–5. But these would be the lowest five in Egypt’s priorities;hence, the composition would be sub-optimal from Egypt’s point ofview. However, if the assistance was provided by way of program aid,the aggregate amount of resources would enable Egypt to execute itsset of 15 priority projects. The example was admittedly artificial, in thata completely reversed ordering of preferences between Egypt and thedonors was most unlikely, but the paper made a point.
Economic development and policymaking, 1973–87 35

3 Project assistance to Egypt was heavily concentrated in infrastructureand strengthened the tendency (initially created by an overvaluedexchange rate) for resources to move out of the tradable into the non-tradable sectors of the economy – a point stressed especially by theMinistry of Economy (1981) and Handoussa (1991c).
4 Egyptian policymakers thought that donors preferred project assis-tance because a physical project was more politically rewarding fordonors, since it enabled them to point to something visible that theyhad done for Egypt. However, this predilection for projects encour-aged donors to go on financing new investments, while at the sametime capacity already installed remained under-utilized for lack offoreign exchange to buy raw materials or essential parts.
Program aid, on the other hand, would not only enable existing capac-ity to be utilized more fully, but it would also increase the Egyptiangovernment’s ability to implement projects by enabling the government toraise domestic resources by selling some of the commodities importedunder program aid to the private sector. This was not a negligible benefit.The government’s budget was always strained, and the implementation ofprojects was frequently slowed by a shortage of domestic resources.Indeed, a common complaint among Egypt’s policymakers at this timewas that donors provided only the foreign exchange component of aproject, leaving a large domestic resource component (averaging at thattime around 70 percent of the total cost) to be found by the government.The sudden availability of foreign exchange in an environment that hadbeen severely deprived of this resource encouraged government agenciesto push projects for which donors were likely to provide support, withouttaking into account the effort that Egypt would have to make to mobilizethe complementary domestic resources. Dr Mahmoud El Imam, the Minis-ter of Planning, expressed it succinctly to me: “They bring me a buttonfrom abroad and expect me to provide a coat to sew on to it.”
The second area that gave rise to concern among policymakers was thecosts of tied aid. Studies pioneered by Haq (1967) and Bhagwati (1967) hadshown that tying aid to procurement in donor countries could very sub-stantially raise the cost of the commodities purchased compared with inter-national prices. Since the United States was by far the biggest aid donor forEgypt, the concern with aid-tying related largely to actions by that country.
Let me paraphrase the findings and the argument of a rather lengthypaper for the Cabinet on this subject. The study found that many itemsprocured from the United States were indeed more expensive, often30–50 percent higher and at times even more, than in the open inter-national market. This, however, was not because the United States fol-lowed a predatory pricing policy for items financed under aid, butbecause of a mismatch between the items required by Egypt and the areasof the United States’ competitiveness.
36 Economic development and policymaking, 1973–87

The United States’ comparative advantage lay in the production of themost “modern” products – the more technologically advanced theproduct, the more competitive the United States. Thus, the United Stateswas a more efficient producer of bicycles than of donkey carts, of motorcars than of bicycles, of jet aircraft than of motor cars, of space rocketsthan of jet aircraft, and so on. Unfortunately, much of Egypt’s demandwas for commodities that lay closer to the donkey cart than to the spacerocket end of the technological spectrum. Hence Egypt was locked intoprocuring items from the United States of which the latter was not themost efficient producer.5 The effect was that the nominal value of aidoverstated the real amount (in terms of purchasing power). And whileEgypt received only 50–70 percent of the nominal value, for the non-grantportion it of course had to repay 100 percent. The study also pointed outthat the excess cost of the goods imported under tied aid represented aform of subsidy paid by Egypt to the donor country, since in the absenceof aid-tying the donor government itself would have had to provide asubsidy to its exporters in order to maintain their competitiveness.
The third problem that concerned policymakers was the conditionalityattached to some forms of external inflows. In the case of internationalorganizations, such as the IMF and the World Bank, policymakers knewthat conditions would invariably accompany the financial transfer. Indeed,at times they voiced the suspicion that some aid providers were lenientwith the conditions of their bilateral aid because they could accomplishtheir agenda through the multilateral agencies. However, while discus-sions between Egypt and the multilateral agencies might on occasionbecome quite robust, only rarely did policymakers reject conditions out-right. The favored approach was to argue for more gradually phasedimplementation so as to provide time to ensure public understanding andacceptance. With bilateral donors, Egypt’s problem was different, and thedilemma is well captured by Weinbaum (1986: 120): “Egyptian policy-makers often express confusion as to why the United States, in an aidprogram that is admittedly so political, insists on employing predomi-nantly economic criteria to decide what to finance.”
Two further issues related to conditionality must be mentioned. Thefirst was the speed with which the conditions had to be enforced. This wasoften a more important matter than the totality of the conditions, becauseit decided the immediacy and the intensity of the pain that would beinflicted on the economy. The pace of reforms therefore gave rise to aconsiderable amount of heat, sometimes at the highest levels of govern-ment. Sadowski (1991: 253) quotes some remarks that President Mubarakmade in 1988 regarding the IMF’s prescriptions. After likening the Fundto a quack doctor, the President went on to say:
A patient, for example, needs a treatment for one month. Instead ofthis doctor telling the patient to take the medicine daily for one
Economic development and policymaking, 1973–87 37
month, he tells him to take all the medicine today and tomorrow andthat he will recover the day after. Of course, he will take the medicineto go to sleep at night and will not wake up in the morning. He dies.This is the IMF. It writes a prescription for those who require pro-longed treatment, just as for those who require short treatment. . . . Itell the IMF that economic reform should proceed according to thesocial and economic situation in the state and according to thepeople’s standard of living. One should not come and say increasethe price by 40 percent. Surely, no one will be able to live. This willnot be an IMF process: it will be a slaughter.
The second contentious issue was whether the policy conditions wouldactually achieve their aims. Empirical studies such as Cornia et al. (1987,1988), Harrigan and Mosley (1991), and some from the World Bank itself– e.g. World Bank (1990b), Corbo et al. (1992) – had shown that whilestructural adjustment programs had some effect in improving the balanceof payments of borrowing countries, they had much less impact in increas-ing investment or in accelerating GDP growth. The inference that Egypt-ian policymakers drew was that the durable benefits to be obtained byfollowing the policy conditions were not likely to be commensurate withthe pain imposed on the economy.
Fourth, over time, particularly after the debt crises of the late 1980s andearly 1990s, the terms of aid emerged as an important concern. At the startof the aid relationship, the authorities tended to regard only grants as“true aid.” Loans were of course accepted, but for a long time policy-makers did not define systematic criteria for discriminating between themin order to decide which to accept and which to reject.
The criteria evolved over a lengthy period, and took three principalforms:
1 A more sophisticated analysis was undertaken of the prospects of thecurrency in which the loan was valued; this concern was spurred bythe rapid appreciation (in terms of Egyptian pounds) of loans fromJapan denominated in yen. These loans had originally appeared tobe very attractive because of the low interest rate they carried, but theescalation in the value of the yen by almost 70 percent against the USdollar (the currency in which much of Egypt’s foreign exchangeearnings was designated) drastically increased the cost of servicingthem.
2 The phasing of repayments began to attract ministerial attention. Inthe mid-1990s, Zafer El Bishry, the Minister of International Coopera-tion, began to require an examination of the time profile of the loan’sservicing and its comparison with projections of Egypt’s foreignexchange earnings, so as to avoid an unmanageable “bunching” ofdebt service payments.
38 Economic development and policymaking, 1973–87

3 A common measure began to be adopted for comparing the conces-sionality of loans. The next Minister of International Cooperation,Ahmed El Dersh, laid down conditions for the minimum concession-ality of a loan: in order to be acceptable, it was to have a grantelement of at least 40 percent when the stream of repayments was dis-counted at 10 percent per annum.6
Fifth, one may briefly mention two problems that bilateral donorsraised concerning the aid relationship:
1 Especially in the earlier years of bilateral aid relations, the question oflimited “absorptive capacity” tended to be brought up. This conceptwas never clearly defined, but appeared to mean that bilateral donors,especially the United States, could not find a sufficient number ofviable projects on which aid funds could be disbursed quickly. Giventhe bureaucratic pressure on USAID to disburse the large amountsbudgeted for assistance to Egypt, it is not surprising that a considerableamount of assistance was directed towards non-project ends. In theperiod 1974–86, the Commodity Import Program was able to disburseabout 80 percent and the PL 480 program almost 100 percent of theamounts allocated, while project aid was able to use barely 40 percentof allocated funds. Indeed, Weinbaum (1986: 111) suggests that evenattaining this level of performance required the USAID mission to seekapproval from Washington for costly, expanded infrastructure projectsand to provide support for several peripheral programs.
2 Bilateral donors frequently complained about a disconnect betweenthe objectives of their aid programs and the expectations on theEgyptian side, a mismatch that appeared to arise from – for want of abetter expression – cultural attitudes. At its most basic level, donorsthought that their Egyptian counterparts seemed to feel that mostobjectives could be realized simply by getting the donors to providemore resources. As Weinbaum (1986: 121) put it, “This notion ofdevelopment during much of the history of the program expresseditself in ‘build us this.’ ” What made this grate more on foreign donorswas described by US Ambassador Eilts (1985: xv) as an attitude byEgyptian officials “as though there were some kind of an obligationon the part of foreign donors to provide them with economic help.”He added that there was “usually little sign of appreciation on the partof Egyptian officials and an obvious reluctance to give public credit tothe foreign donor for the burden borne by the latter’s taxpayers,” andthat “their [the officials’] attitude often brought to mind Pharaonicfriezes showing subject peoples bringing tribute to Egyptian rulers.”
An issue that was related to aid, but applied more generally to the use offoreign resources, emerged in the 1990s. This problem became particularly
Economic development and policymaking, 1973–87 39
important after the debt rescheduling of 1991–96 and the success of the sta-bilization program had eased the foreign exchange situation and enlargedthe options for policymakers. The issue generated a considerable amount ofdiscussions between the Egyptian authorities and the World Bank, andboiled down to two broad questions: (1) should Egypt borrow on noncon-cessional terms to finance its development? and (2) if Egypt did borrow onnonconcessional terms, how much would it be prudent to borrow?
The case against borrowing on nonconcessional terms rested essentiallyon a political attitude that did not wish to see a significant increase inexternal debt, because a heavily indebted Egypt might again be vulnerableto pressure from donors. According to the proponents of this position,external resources should be accepted only if they were offered as grants.This view had some strong advocates within the Cabinet and the Presi-dency and, given Egypt’s experience with external debt, was not one thatcould be dismissed lightly. However, there were also voices that wonderedwhether a policy of zero nonconcessional borrowing would cause Egypt toforgo a golden opportunity, when the constellation of international polit-ical circumstances was in Egypt’s favor, to obtain substantial amounts ofadditional resources.
The case for borrowing nonconcessional funds accepted that a decisionto borrow such resources could only be justified if these helped thecountry to attain its key economic and social goals. The most critical socialand economic problems confronting Egypt for the next two decades wereidentified as:
• The provision of employment to the rapidly growing labor force andreduction of the backlog of unemployment.
• The reduction of poverty and the creation of substantial social safetynets.
• The modernization of the economy so as to enable it to meet thechallenge of joining the European market, and of globalizationgenerally.
The critical assumption underlying the push for borrowing was that Egyptcould overcome these problems only if its economy grew at a much fasterrate than it had in the last several years.
The key to economic growth and modernization was investment: ininfrastructure, in human resources, in technology, and in productive facil-ities. The investment requirements of meeting Egypt’s goals would be verysubstantial. In order to generate labor demand of the necessary magni-tude, real GDP growth would have to average about 7 percent annually forperhaps the next two decades (see Chapter 10 for a more detailed discus-sion of sustained growth). Such a growth rate would require substantialincreases in the investment/GDP ratio, which would have to rise toaround 25–28 percent of GDP.
40 Economic development and policymaking, 1973–87

The increase was especially likely because the increasingly sophisticatedstructure required to compete with European economies would implyhigh capital:output ratios. The experience of fast-growing economies boreout this analysis. For example, five major East Asian economies hadenjoyed average annual growth rates of over 7.5 percent during the five-year period 1990–94: Malaysia 8.4 percent, Thailand 8.2 percent, Indone-sia 7.6 percent, Taiwan 8.0 percent, and Korea 8.1 percent. These growthrates were driven by investment/GDP ratios of 39 percent, 40 percent, 33percent, 37 percent, and 38 percent respectively. As a point of reference,the incremental capital:output ratios (ICOR) for these countries were 4.6,4.9, 3.8, 4.7, and 4.9 respectively. The 1992–96 average ICOR for Egyptwas about 4.4, and the experience of fast-growing economies suggestedthat the ratio might go higher before productivity gains succeeded inmoderating it.
On the other hand, financing the investment was problematic –domestic savings were only 12–13 percent of GDP. While savings could beexpected to increase with the growth in incomes and as a result of policymeasures, they were still likely to fall well short of the investment require-ments. Moreover, in the 1990s Egypt had pursued an extremely conservat-ive borrowing strategy. New commitments of external loans had fallenfrom $2.2 billion in 1992 to $900 million in 1993, $500 million in 1994,and $300 million in 1995. Net borrowing (disbursements minus principalpayments) was only $75 million in 1994. What was worse, net inflows (dis-bursements minus both principal and interest payments) had been negat-ive for several years, averaging more than (minus) $1 billion in 1993–95.Thus, at a time when critical development needs remained to beaddressed at home, Egypt was exporting capital to the rest of the worldand forgoing domestic investments needed to maintain a high growthtrajectory.
Another reason for including the option of borrowing in the govern-ment’s financial arsenal was that it gave Egypt a measure of strategic flexi-bility when dealing with other types of capital inflows. For example, one ofthe alternative methods of external financing was direct foreign invest-ment. The appeal of this resource was that it did not add to externalindebtedness. However, direct foreign investment would be attracted onlyif it could earn substantial returns, which would have to be repatriatedfrom the country’s foreign exchange. The return on foreign direct invest-ment in the fast-growing East Asian countries during a several-year periodhad averaged over 15 percent. Investors were likely to demand evenhigher returns on investments in Egypt because of the perceived higherrisks in the region. By retaining the option of borrowing, and thus demon-strating that Egypt was prepared to turn to other forms of finance, theauthorities could strengthen their negotiating position vis-à-vis foreigninvestors and thereby be better placed to moderate the demands of suchinvestors.
Economic development and policymaking, 1973–87 41
The next logical question was that if Egypt should indeed opt to utilizenonconcessional funds, what would be the prudent limits of borrowing?
A World Bank simulation explored this question. It found that if realGDP grew at 7 percent a year and exports of goods and services, includingworker remittances, increased at 8 percent annually, Egypt could morethan double its then amount of nonconcessional borrowing – to levelsbetween $2 billion in 1996 rising to $3.1 billion ten years later – while stillcomfortably maintaining its status as a “moderately indebted” country.7
This would indicate a prudent level of borrowing, especially since thegrowth of foreign exchange earnings assumed by the study was less thanthat projected by the authorities. Borrowing at this level would leave ade-quate scope for other types of financing, such as concessional aid anddirect foreign investment, and would be sufficient, in conjunction with theother available resources, to raise investment to the required level.
The authorities opted for a cautious middle ground. Their strategicdecision was to admit nonconcessional borrowing but to limit it to theamount repaid in that year, thus keeping constant the outstandingamount of external debt. Various other criteria (described above) werealso laid down as conditions for accepting a loan.
A question frequently asked is whether foreign aid has had a beneficialor a baleful effect on the Egyptian economy. This is not a question towhich an irrefutable answer can be provided, not least because it is diffi-cult to frame a universally endorsed counterfactual. There is a consider-able literature on the general question of whether aid supplements ordisplaces domestic efforts, but a settled conclusion has not been reached.Recent large-scale studies by Burnside and Dollar (2000) and by theWorld Bank (1998b) concluded that, on average, aid had a rather minorimpact on the growth of GDP per capita (partly because aid itselfaccounted on average for no more than 0.5 percent of GDP), and that itwas most effective in promoting growth in countries with good gover-nance and sound macroeconomic policies (especially low budget deficit,low inflation, and open to international trade). Examining the data for 56developing countries over a 24-year period, World Bank (1998b: 2, 123)found that in countries with sound management at both the macroeco-nomic and institutional levels, 1 percent of GDP in aid raised the growthrate by about 0.5 percent and reduced poverty by 1 percent. Indeed, thereport (p. 33) spoke of poor countries being held back not by a financinggap, but by an “institutions gap” and a “policy gap.”
Findings of the impact of aid on the performance of the Egyptianeconomy have been inconclusive. Critics of foreign aid argued that largedonors imposed their own preferences on Egypt’s development patternand distorted Egypt’s priorities. Even writers sympathetic to the cause ofexternal aid admitted to instances where aid was likely to have done harmto areas of the Egyptian economy; thus, Weinbaum (1986: 52) reportsUSAID officials in Cairo acknowledging privately that their analyses
42 Economic development and policymaking, 1973–87
showed that food aid had a negative impact on domestic Egyptian wheatproduction. Critics also claimed that inadequate donor funds were com-mitted to industrial investment, that too small a contribution was made tobuilding up Egypt’s productive capacity, and that the deluge of conces-sional funds enabled policymakers to abstain from structural reforms thatwould have improved the efficiency of the Egyptian economy.
Supporters of foreign aid argue that it is difficult to provide a categori-cal assessment of the foregoing objections, because they contrast actualevents with a hypothetical situation, the outcome of which can only beconjectural. On the other hand, the availability of additional financingand modern technology indisputably made a vital difference to the pro-ductivity of the Egyptian economy; for example, through the expansion ofthe infrastructure.
The idea of a significant distortion of Egypt’s investment patternbecause of a mismatch between the priorities of donors and those ofEgypt also tends to get short shrift from aid advocates. They point out thatwhether or not to accept aid for a particular activity, project, or sector wasultimately an Egyptian decision. Moreover, there is no necessary reasonwhy total investment in the presence of foreign assistance should be lessthan in its absence, and there was nothing to prevent Egypt from using itsown resources to support its priorities. If total investment from Egypt’sown resources plus the very substantial foreign assistance was still inade-quate for Egypt’s aims, it must raise questions about the vigor of thecountry’s efforts to mobilize domestic savings. The modest rates of thelatter throughout 1960–2000 suggest that in the preferences of policy-makers, consumption counted for more than savings.
Moreover, it is not at all evident that policymakers would have gone infor painful structural reforms had concessional assistance not been avail-able. Little in the experience of Egypt during 1960–90 suggests that struc-tural reform was a priority, no matter whether resources were expandingrapidly (for example, as in 1975–81), or whether they were being com-pressed (as after 1982 because of falling oil prices). Until the 1990s, thereappeared to be little urgency to make public sector enterprises more effi-cient or to privatize them, to reduce explicit and implicit consumer subsi-dies, to increase the buoyancy of budget revenues, to correct anovervalued exchange rate, to remove the anti-export bias of the trade pro-tection system, to make the banking system more efficient and lower thecosts of intermediation, to reduce monopolistic influences in theeconomy and increase competition, to reform the bureaucracy in order tospeed up decision-making and reduce transactions costs, and so on. A per-ceived shortage of resources was chiefly addressed by increasing externalborrowing, even on hard commercial terms. It is not surprising that in1960–90 the country witnessed a cycle of high borrowing, followed by adebt crisis, followed by the intervention of various dei ex machina, such asthe Paris Club or the GODE, to bail out the economy.8
Economic development and policymaking, 1973–87 43
The experience of these decades cannot but nourish the suspicion thatless concessional assistance would only have provoked more commercialborrowing, not economic restructuring. But the lack of agreement onwhat might have happened in the absence of aid makes it impossible torender a definitive judgment on the extent to which external assistancehelped or hindered Egypt’s development. Handoussa (1991c: 223)describes the effects of the massive aid flows as “a mixed blessing.” Indeed,the assistance has not been an undiluted godsend, but the proportionswithin the mixture are likely to be tilted heavily towards the positive.
It might be useful to pause at this stage and to consider the state of theeconomy and the policymaking process at the end of what might betermed the first phase of the open door period, that is, about the middleof 1982. Despite the improvement in the aggregate growth rate and of anumber of sectoral indicators since 1974, the economy continued tocontain many structural rigidities. The most important were the following.
The system of prices and incentives was seriously distorted and resultedin many uneconomic allocations of investment and waste of resources
“The distortions characterizing prices and incentives in Egypt are of a stag-gering magnitude,” commented the World Bank (1983: 385–6). Theprices of most inputs and outputs were fixed by the government. Thisoften gave out faulty signals concerning the economics of the activitiesand hence vitiated the basis for decisions on investment and production.Moreover, as a result of the previous shortages of foreign exchange andthe imperatives of political relationships, Egypt had been more or lesslocked into acquiring technology from the communist countries, whichfrequently had been developed without reference to its economic merits.
The combinations of arbitrary prices, segmented decision-making, andrestrictions on the country’s access to technology led to some very per-verse results. A World Bank study (1983: 293–5) reported several instancesof industries in which value-added was negative when computed at inter-national prices; major sectors included chemicals, basic metals, transportequipment, and china and glass. This meant that large numbers of estab-lishments in these sectors used more foreign exchange to purchase theintermediate materials that they used in production than they generatedor saved in foreign exchange from the output produced. The same report(360–2) also identified a number of activities whose private profitabilitywas substantial even though their social profitability (i.e. measured at eco-nomic or shadow prices) was negative; these included artificial fibers, alu-minum, nonferrous metals, steel pipes, motor vehicles, consumerelectronics, and china and glass. The social and private profitabilitiesdiverged because of the inconsistent pricing of foreign exchange andinputs such as energy, as well as of outputs, and occurred in both industryand agriculture. In the latter sector, the divergence chiefly resulted
44 Economic development and policymaking, 1973–87

because to farmers, water was a free good, even though for the country itwas the resource in shortest supply.9
For many years, Egypt’s basic economic strategy was one of import-substitution, and the philosophy was to produce everything that could beproduced within the country, often without much concern for costs.Tariffs and trade barriers ensured that public sector enterprises enjoyednear absolute freedom from import competition. The distorted economicsignals and segmented decision-making had important microeconomicconsequences. They encouraged a narrow approach to project selection,in which the ability to produce a particular commodity could be allimportant, while the economic costs of producing it received only cursoryattention. Such an attitude could justify the use of very inefficient tech-nologies. An examination by the World Bank of a draft input–output tablein the late 1970s raised a concern that, if the document’s figures weretaken seriously, some production activities might not even satisfy theHawkins–Simon conditions. These conditions on the Leontief input–output system stipulate that the production of one unit of a good must notrequire, directly and indirectly, more than one unit of itself. The violationof these conditions obviously means that the activity is not sustainable. AsDorfman et al. (1958: 211) remark, “A production process in which it tookmore than 1 ton of [say] coal to make 1 ton of coal . . . is not a method ofproduction at all, but just a hard way of running down preexisting stocksof coal.”
The exchange rate and the structure of protection favored imports ratherthan exports, and distorted investment allocations
This inhibited the development of non-traditional exports and resulted inEgypt’s suffering from a persistent deficit on the balance of payments. Inturn, the financing of this deficit required borrowing from abroad, part ofwhich took the form of short-term credits. Moreover, these short-termcredits were obtained from Western banks, but exports to the West werelagging because of poor technology and an overvalued exchange rate.
The exchange rate was affected by the surge in receipts from the “BigFive” (petroleum, Suez Canal dues, worker remittances, tourism, andforeign aid), which together accounted for well over 80 percent of totalforeign exchange earnings. The performance of these inflows, especiallyof receipts from Suez Canal dues, oil exports, worker remittances, andforeign aid, was largely independent of the productivity in the rest of theeconomy, and yet their growth provided the main support to the Egyptianbalance of payments. These four windfall items brought Egypt about $1.8billion in 1975; in 1981, receipts from them approached $7 billion. Thecontribution of these items soon dominated Egypt’s foreign exchangeearnings. For example, oil exports rose sharply from 10 percent of totalmerchandise exports in 1975 to 73 percent in 1982; for this period as a
Economic development and policymaking, 1973–87 45
whole, earnings from petroleum provided 47 percent of total merchandiseearnings; for the five-year period up to 1982 they accounted for nearly 63percent. Similarly, worker remittances for the period 1975 to 1982accounted for 43 percent of receipts from services; for the most recent fiveyears the figure was 53 percent. Taken together, the share of petroleumexports and worker remittances in total foreign exchange earnings aver-aged 45 percent between 1975 and 1982; for the last five years theyamounted to nearly 58 percent. The exchange rate that could be sup-ported by the available supply of foreign exchange (given existing tariffsand other barriers to imports) from the Big Five over-valued the Egyptianpound relative to the productivity of the rest of the economy. And thisover-valued exchange rate made it very difficult to increase non-traditionalexports.
The over-valued exchange rate also distorted the profitability betweendifferent investments. It made investment in nontradables more profitablethan in tradables. A study by Egypt’s Ministry of Economy (1981: 80–1)accepted that the existing mix of exchange rate and monetary policy hadproduced negative real interest rates and encouraged investment inconstruction, especially of high-rise apartments and office buildings. Thedistorted exchange rate, by favoring capital-intensive rather than labor-intensive projects, also kept employment lower than it need have beenand thus hindered the country’s efforts to reduce poverty.
The exchange and trade system remained highly complex andfragmented
Exchange transactions took place in three pools: the Central Bank, thecommercial bank, and the “own exchange” market. The last of these wascreated in 1976 through legislation permitting residents to hold foreignexchange and to engage in any transaction, provided that they took placethrough commercial bank accounts. The principal source of supply forthis market was remittances from Egyptians working abroad. The CentralBank pool was reserved for transactions by the central government andcertain government authorities, while all the remaining transactionscovered by the foreign exchange budget (mainly by public sector com-panies) took place through the commercial banks. The operation of theexchange system was characterized by infrequent and small adjustment ofthe officially set exchange rates, which resulted in large differentials for asustained period, between those rates and the “own exchange market”rate.10
The exchange rate applying to transactions through the Central Bankhad been unchanged since January 1, 1979 (at which time the buying andselling rates for the US dollar had been set at LE 0.700 and LE 0.707respectively, per US$). This rate applied to proceeds from exports of petro-leum, cotton, and rice, as well as from Suez Canal dues, and to payments
46 Economic development and policymaking, 1973–87
for imports of five essential foodstuffs (including wheat), insecticides, andfertilizers, as well as for public sector external debt servicing. A differentrate applied to transactions through the commercial banks, notably thosein respect of workers’ remittances, tourist receipts, and some exports. Thecommercial bank exchange rate was also established by the authorities, andremained unadjusted for substantial periods (at the end of 1981 it stood atLE 0.79 for buying and LE 0.80 for selling per US$). Most private sectorimports took place in the “own exchange” market at a freely fluctuatingexchange rate, which had depreciated sharply from LE 0.77�US$1 inJanuary 1979 to LE 1.06�US$1 at the end of 1981.
The budget contained many structural rigidities
Three features dominated fiscal trends: (1) the increase in total govern-ment expenditure as a proportion of GDP; (2) the high levels of overallbudget deficit; and (3) the vulnerability of the budget to external forces.Total expenditure increased from 48 percent of GDP in 1974 to 63percent in 1982. The overall fiscal deficit averaged about 20 percent ofGDP, but the year-to-year fluctuations were considerable, ranging from alow of 17 percent of GDP in 1977 to 27 percent in 1979. Moreover, the rel-ative variability of the income and expenditure streams (as measured bythe coefficient of variation) differed sharply.
As Chapter 6 discusses in more detail, the high deficit and the budgetinstability resulted from a basic structural weakness, namely, budgetaryrevenues were susceptible to exogenous influences while expendituresmoved closely in line with domestic inflation. The exogenous influenceswere transmitted through the growing dependence of the budget onpetroleum and Suez Canal revenues. The increased availability of theprofits and taxes from these two activities enabled the government toavoid raising other taxes and public sector prices, with the consequenterosion in the government’s ability to mobilize public sector savings fromthe domestic economy. The ratio of exogenous revenue to total revenueincreased from less than 10 percent to over 35 percent during the periodunder review; more importantly, the ratio fluctuated widely, jumping from15 percent in 1979 to 35 percent in 1981 and dropping to 27 percent in1982. The budget’s vulnerability to very different factors on the revenueand expenditure sides, and to the very different amplitude and timing ofthe fluctuations in the two series, created serious problems for short-termeconomic management.
These difficulties were compounded by the relative inflexibility ofdomestic non-bank and external financing sources. Consequently, thedeficits were largely accommodated by the domestic banking system.Between 1975 and 1981 the overall deficit averaged nearly 23 percent andits financing from the banking system about 14 percent of GDP. As aresult, liquidity expanded and prices steadily rose.
Economic development and policymaking, 1973–87 47

The economy was dominated by the government’s activities, and bypublic enterprises that were sheltered from competition
The government’s dominant presence in the economy hardly changed.The World Bank (1983: ii) estimated that even by 1981, i.e. seven yearsafter the introduction of the infitah, the public sector accounted for 40percent of total employment, 54 percent of value-added, over 60 percentof total expenditure, and 70 percent of total investment.
In general, public enterprises suffered from over-staffing, poor techno-logy, nonprofessional management, and were structured as monopolieswith no incentive to improve efficiency. Their deficits continued to befinanced from the budget or at low rates of interest from the public sectorbanks. They also suffered little penalty if they did not repay their debts tothe banks or to other government entities (e.g. there were large arrearsfrom many public enterprises to the public authority for electricity) andthus constituted a drag on the financial system.
There was little pressure to improve the efficiency with which capitalwas used, particularly in the sectors in which public enterprises playedthe major role
A study for the Ministry of Economy (1981: 18–19) estimated the incre-mental capital:output ratio (ICOR) for manufacturing between 1974 and1979 at 5.56; even after correcting for depreciation the figure would beabout 5.0. This is very high by international standards for manufacturing;the study concluded that even after recognizing weaknesses in the data,the low productivity of capital in Egyptian manufacturing was incontro-vertible. For agriculture the ICOR was 3.96, for the commodity sectors as awhole it was 4.75; again both were high by international standards.11
The economy was being managed by tools that did not respond quicklyto changing circumstances
1 Despite the preponderance of the public sector in the economy, fiscalpolicy was not used actively as an instrument of stabilization policy.For example, in attempting to control inflation the authorities reliedheavily on direct price controls, effected mainly through direct subsi-dies and policies that regulated the prices of the output of publicenterprises. Fiscal developments consequently tended simply toreflect other government policies (such as those relating to pricing,employment, and investment), as well as exogenous factors (such asinternational price movements and defence requirements).
2 Monetary policy was hamstrung by other factors. New issues of govern-ment securities sold to commercial banks generally carried low ratesof interest and since the banks had the right to discount them with
48 Economic development and policymaking, 1973–87
the Central Bank, they promptly did so. Therefore, the initial pur-chases by the banks had only a momentary impact on their liquidity,and the accumulation of government securities with the Central Bankprecluded the development of a secondary market and eliminated thepossibility of open-market operations.
3 The combination of fragmented exchange markets and the govern-ment’s rigid pricing policy hampered the use of the exchange rate asan instrument of policy. It was difficult to compute indices of realeffective exchange rates, and thus to judge competitiveness. The diffi-culty arose because, in addition to the problems of selecting theappropriate weight, one also had to choose between the threeexchange rates that existed for most of the period, none of whichmight be the appropriate one for this purpose.
The rigid pricing structure also prevented a large proportion of com-mercial transactions from responding quickly to changes in the exchangerate. For example, most exchange transactions through the Central Bankwere insensitive to the exchange rate either because of the nature of therelated economic activity (e.g. Suez Canal dues) or because an exchangerate change would not be directly reflected in domestic prices (this wouldapply to commodities such as petroleum, cotton, rice, and imported food-stuffs).
Transactions through the commercial banks were sensitive to theexchange rate, as a change in the latter would normally be reflected indomestic prices. But many of the transactions through the commercialbanks could be diverted to the own-exchange market, the amount of suchdiversion depending on the exchange spread between the two markets.Owing to this close interrelationship between the two markets, a failure toadjust the commercial bank rate in line with the depreciating own-exchange market rate reduced the inflow of foreign exchange into com-mercial banks. Until the end of 1982, receipts from non-oil exports (otherthan cotton and rice) had to be surrendered to the Central Bank of Egyptat the commercial bank rate. When a large differential arose between thecommercial bank rate and the own-exchange market rate, this arrange-ment discriminated in favor of import-competing activities and againstexports.
The framework for policy-making and economic management was notcongruent with the requirements of the new economic structure
The most important discrepancy applied to the system of economic plan-ning. The strategy outlined in the plans from 1975 was intended to recog-nize the new direction of economic policy, the infitah, by projectingprivate investment at much higher levels than in previous plans. However,such projections overlooked an important asymmetry in dealing with the
Economic development and policymaking, 1973–87 49
private sector – the authorities could easily prevent the private sector fromdoing something (by passing a law or by administratively denying it accessto some vital input), but it was much more difficult to make the privatesector do something. The authorities could only provide incentives, whichmight or might not be sufficient to prompt the desired response. More-over, the financial incentives offered might be swamped by more import-ant disincentives, such as the fear of nationalization or confiscation ofassets.
To sum up, while according to the “open door” pronouncements theeconomy was supposed to behave like a free market economy, govern-ment interventions continued to create serious distortions. Moreover, thetools for managing a liberal economy were missing or their functioningonly imperfectly comprehended.
While some of these shortcomings might be shrugged off as mere tech-nical matters that would be corrected as more experience was gained, thebasic weakness in policy guidance came from a lack of clarity about thedirection that the economy should take. The government went far towardsaccepting this as a source of confusion; the prologue to the 1978–82 Planexpressed the dilemma very forcefully:
More and more young people and workers perceive the contradic-tions of a socialist society which thinks with a capitalist mind, whichtakes from socialism and communism the concepts of public owner-ship, dominance of the public sector, guaranteed employment, educa-tion, services and social security, but neglects to take firmenforcement of civil authority or condemnation of the carelessnesswhich decreases productivity. Similarly, the government has takenfrom capitalism the features of consumption and interclass mobility,the concept of the importance of the individual and of historical tra-dition. But it has not adopted from the capitalist system the stringencyof market competition or the responsibility of the firm for qualitycontrol, upon which depends the success or failure of the firm.
The end result is a society lacking discipline or supervision, distrib-ution without production, promises without obligations, freedomwithout responsibility.12
The authorities’ response to the resource pressures and structural rigiditiesemphasized gradualism. In part, this arose from a concern about thestrains that too rapid a change in the economic structure would impose onthe social fabric; the lessons of the 1977 budget measures and the sub-sequent riots were only too deeply etched into the psyches of the policy-makers. Cabinet discussions on reducing subsidies or otherwise adjustingprices towards market levels were invariably dominated by concerns aboutthe effects of such measures on the country’s internal stability. And it didnot seem to matter much which subsidies were under review (even ciga-
50 Economic development and policymaking, 1973–87

rettes were subsidized). Whenever the rationalization of subsidies camebefore Cabinet, “Up would go the Minister of Interior’s hand and hewould insist that he could not be responsible for the security situation insuch circumstances,” said Ali Lotfi, a former Finance and Prime Minister.13
In part, however, it was made possible by Egypt’s relationship with themajor Western powers. This relationship had two results. First, it gaveEgypt access to large amounts of financial resources that were to be repaidin a political, and not economic, coin. The political nature of the aid rela-tionship was stressed by several writers. Thus, for example, after detailingthe amounts of US aid and investment, Dessouki (1996: 164–6) concludedthat “These amounts cannot be justified in economic terms alone.” Hequoted a report of the US General Accounting Office submitted to theCongress in 1989 that stated bluntly, “If aid to Egypt were consideredpurely on economic or developmental grounds, Egypt would havereceived annual obligations of not more than $100–200 million.”14 At thetime, US aid to Egypt amounted annually to $815 million in economicand $1.3 billion in military assistance. Very substantial amounts of assis-tance were also offered by Japan, the European Union, individual Euro-pean countries, and, of course, Arab countries and institutions. This largevolume of soft money could have been used to cushion the more painfulaspects of structural reform and thus made such reform more palatable,but apparently the necessity of economic restructuring did not bulk largein the thinking of either the Egyptian authorities or the donors. The lattercalled for reform, but continued to support unreformed policies andshowed little urgency to repair this incongruity. In this sense, the leadingaid donors must be seen as contributors to the slow pace of structuralreform.
Second, the political relationship gave Egypt the opportunity to “playthe American card” in its dealings with other donors. This was especiallyeffective with the IMF and the World Bank, in which the United States wasthe principal shareholder. Several examples of Egypt’s co-opting theUnited States to pressure the Fund are documented by Richards (1991)and in various issues of the Middle East Economic Digest.15 Another goodexample is furnished by the experience of the Consultative Group for1979. In September 1979 it appeared that the World Bank was reluctant tohold a meeting of the Consultative Group for Egypt. Dr Hamed El Sayeh(the Minister of Economy and International Cooperation) asked theUnited States ambassador to have Robert Strauss (at the time PresidentCarter’s special representative for the Middle East) call on the WorldBank’s President, Robert McNamara, and prevail on him to hold ameeting of the Consultative Group within that calendar year. The Ministerargued that meetings of the Group had been held in 1977 and 1978. Notholding one in 1979, after President Sadat had visited Jerusalem andthereby incurred the hostility of the Arab countries, would send an unfor-tunate political signal, namely, that the West also had abandoned Egypt.
Economic development and policymaking, 1973–87 51
In the event, intervention by Robert Strauss proved unnecessary; an assis-tant Secretary of State telephoned McNamara and was assured that ameeting of the Consultative Group would take place before the end of theyear. The meeting was held in Aswan on December 20th.
Commentators generally blamed tardy policy response and lack of aneffective champion (whether individual or group) for the lacklusterperformance of the economy. The structure and dynamics of economicdecision-making thus came in for a considerable amount of discussion.Some writers – for example, Cooper (1982), Richards (1984) – pointed tofeatures embedded in Egypt’s political and economic system that stood inthe way of major policy changes. Richards argued that:
It is increasingly clear why the state persists with its current set of inef-ficient and inequitable policies, and why it can get away with it: Theclass structure engenders policy stasis, while international rentspermit the state to avoid the balance of payments crises and otherpressures for change which would otherwise result from such inac-tion.
He identified the class that most stood in the way of change as being com-posed of the old elites who had intermingled with the upper layers of thetechnocracy. The rents that had rescued Egypt from the worst pressures ofeconomic problems were: (1) oil rents, either directly in the form ofpetroleum exports, or indirectly as worker remittances and Suez Canalrevenues; and (2) locational rents, in the form of tourist receipts or asinternational aid provided to Egypt because of its strategic location.
Other commentators elaborated this basic argument, sometimes withadditional distinctions. Weiss and Wurzel (1998: 169) charged that theruling elite was not unambiguously supportive of economic reform,because basic changes in the economy would require greater political lib-eralization than those in power were prepared to concede. Therefore,they argued, “There [was] no broad political coalition in favor of reformand international competitiveness,” and that Egypt’s political and adminis-trative culture remained dominated by a pattern of “neo-pharaoniccontrol.”
Mason (1984: 10–11) contended that the most important factor affect-ing the economic growth of Egypt was the position that the goal of devel-opment actually occupied in the priorities of the policymakers. Hepointed out that Korea and Egypt were two countries with, in 1979, similarsize of population, endowment of arable land, structure of production,and authoritarian nature of government, but had had very contrastingexperience of economic growth since the 1960s. Mason highlighted thereason as being differences in the objectives of the two governments. InKorea, the primary purpose of government was to facilitate economicgrowth; he quoted President Park, who initiated Korea’s development
52 Economic development and policymaking, 1973–87
drive: “In human life, economics precedes politics or culture.” In Mason’sview, the primary objective of the Egyptian government was not economicdevelopment. President Nasser’s purpose in his early years was to lead theArab world; President Sadat’s primary attention was devoted to foreignaffairs and security. This led to very different results in the conduct ofpolicy in the two countries. In economic policy, Egypt was inward-looking,while the primary political objectives of government concerned theoutside world. In Korea, economic policy was outward-looking, while itsprimary political concern was with internal development.
Hansen (1991: 250–4) argued that the authorities relied on an implicitsocial compact between the government and the populace, with “the latteroffering acquiescence and surrender of political rights in return for ladolce vita.” Comparing the impact of exogenous factors on the Egyptianeconomy and of the country’s own policies, he concluded that “Egypt’smain enemy has been Egypt.”
Holt and Roe (1993: 216–21) assigned the main responsibility for hesi-tant economic policymaking to the governments’ lack of political legiti-macy. Not having a popular mandate, Egyptian regimes were disinclinedto call for sacrifices that might benefit the country in the long run. Gov-ernments therefore lacked the will to act decisively. Holt and Roe arguedfurther that the Egyptian government consisted of a set of powerful min-istries, each of which had strong vested interests that would be hurt by oneor other element of a comprehensive reform package. Any general reformpackage would face the opposition of a sufficient number of powerfulministries to frustrate action. Governments thus lacked the capacity to actexpeditiously.
No doubt such structural tensions played an important role, but equallycritical was the environment in which policies were made. A major factorresponsible for the cautious and hesitant policymaking was the rapidturnover of ministers in the economic team. The following incident mightillustrate the problem. In early 1981 the Deputy Prime Minister for Eco-nomic Affairs, Dr Abdel Meguid, tabled at a Cabinet meeting a wide rangeof issues, including the exchange rate, subsidies, the restructuring of loss-making public enterprises, and the introduction of competition into thebanking sector. This meeting came after a long process of consultation,and he appeared optimistic of getting support from his colleagues foraction in these areas. However, after the meeting he told me that theCabinet had not managed to reach any decisions. “It was the usual thing,”he said, “everyone wanted to go to heaven, but no one was prepared todie.” After a pause he added, “I suppose the most sobering thought forany politician is that he should die, and that because of this his successorshould be able to go to heaven.”
And therein lay the rub. Ministers were prepared to support measuresthat created austerity only if they could be certain of still being in officewhen the benefits of these policies arrived. But no one could guarantee
Economic development and policymaking, 1973–87 53
that this would be the case. One can hardly blame ministers for wanting toavoid certain and immediate criticism for the sake of some uncertain felic-ity in the future when the evidence pointed to a rather short ministerialshelf life. Between 1973 and 1980 there were seven changes of FinanceMinisters, seven of Planning Ministers, five of Ministers of Economy, andfour of Ministers of International Trade.16 This mortality rate did nothingto encourage ministers to take the long view. As a former Minister ofEconomy remarked: “[Ministers] do not necessarily support reform; theyjust want the results of reform.”
Perhaps the ministers’ fears of acting on sensitive subjects, such as thecost of living subsidies and the exchange rate, were not without founda-tion. In a classic examination of 24 devaluations between 1953 and 1966,Cooper (1971: 28–9) found that in about 30 percent of the cases thegovernment fell within one year, compared with only 14 percent in arandom control group of similar countries that did not devalue. Therewere also some important near misses, where the government came underintense criticism for its decision to devalue, but survived for more than ayear. Ministers of Finance did much worse: nearly 60 percent of them losttheir jobs in the year following devaluation, compared with 18 percent inthe control group.
Some observers, for example Weiss (1993), attributed the hesitancy ofEgyptian policymaking to institutional tensions that they saw as inherentin the political structure. “Any successes are the President’s. Mistakes arethe Prime Minister’s.” In Weiss’s view, the President would be reluctant tosee an overly successful Prime Minister in case the latter developed into apotential rival. Inertia in policymaking was guaranteed by the dilemmathat:
On the one hand, the President would be more than reluctant to seean effective reform structure become established in the Prime Minis-ter’s office [for fear that it would become too successful]. On theother hand, the President himself would not assume this task [for fearthat it would fail].17
It should be noted that Weiss made these remarks on the turnover of min-isters and on the institutional tensions between the Presidency and thePrime Minister in the context of President Sadat’s governments. UnderPresident Hosni Mubarak the incumbency of ministers became muchmore stable.
External debt-based growth, 1982–87
The story of macroeconomic performance in 1982–87 is largely that of asharp drop in oil prices and of the authorities’ attempts to continue rapidGDP growth in the face of falling oil revenues. Oil exports had come to
54 Economic development and policymaking, 1973–87

account for a very substantial weight in the Egyptian economy, affectingnot only foreign exchange earnings and the domestic budget, but alsocontributing in substantial measure to the GDP and its constituents.18
Fluctuations in earnings from oil, therefore, created instability in severalkey economic variables.
Petroleum export prices plummeted from an average of $33.60 perbarrel (weighted according to the prices received and the shares con-tributed by each oilfield in exports) in 1981 to $14.29 per barrel in 1987;in real terms the decrease of course was even worse. The collapse in rev-enues from petroleum resulted in the share of oil in GDP rapidly dwin-dling from 16.6 percent in 1981 to 5.4 percent in 1987, in exports from 74percent to 37 percent, and in government revenues from over 20 percentto 9 percent. The fall in oil prices caused Egypt’s terms of trade to deterio-rate by nearly 40 percent between 1982 and 1987; the World Bank esti-mated the income effect of this deterioration at 11 percent of GDP and39 percent of exports. Egypt’s total foreign exchange earnings in 1987were 2 percent lower than in 1981 expressed in current dollars and nearly12 percent lower expressed in real import capacity.
This rapid contraction in resources called for an equally swift policyresponse to mobilize alternative sources of finance to maintain the desiredlevel of investment. However, the economy was not sufficiently flexible togenerate a due measure of additional savings (e.g. from more exports),nor did policies try to increase productivity so as to generate the same rateof GDP growth from a lower level of investment. The government, never-theless, continued to maintain expansionary economic policies.
The incentive system continued to discriminate against exports.Between 1982 and 1987, the real effective exchange rate appreciated by 32percent.19 This was over and above the nearly 28 percent appreciationalready registered between 1970 and 1982 and resulted from the opera-tion of the “Big Five” discussed earlier. As a result, Egyptian non-oilexports were severely discouraged. The disincentive was heightened by thetariff structure and the domestic price control and tax systems, whichfavored domestic sales over exports. As if that were not enough, the WorldBank lamented that export-oriented firms had to navigate through numer-ous administrative encumbrances, complicated duty drawback schemes,bank guarantees, travel allowances, export credit insurance, and proce-dures for transfer of export proceeds.
The overvalued exchange rate made capital artificially cheaper andincreased the bias towards capital-intensive projects. The increasingcapital intensity of projects is illustrated by the worsening of the economy-wide incremental capital:output ratio (ICOR) from 2.5 in 1976–81 to 6.5in 1984–88. This also suggests substantial inefficiency of investment, as thisrapidly increasing capital:output ratio was not commensurate with the rateof GDP growth. The seriously overvalued exchange rate, the system oftight import controls, the extremely low domestic energy prices, the low
Economic development and policymaking, 1973–87 55

interest rates, and the tight import controls delivered price signals thatdid not reflect the country’s comparative advantage. The result was subop-timal investment allocations, which stressed capital- and energy-intensiveprojects, while neglecting labor-intensive investments in agriculture and inthe processing of domestic raw materials.
The GDP continued to grow at an average annual rate of about 6percent in 1982–85, but investment was increasingly financed by externalborrowing, both long- and short-term. With interest payments on externaldebt tripling between 1982 and 1987 and declining worker remittances,net factor service incomes turned negative in 1986, bringing the currentaccount deficit to a peak of more than (minus) 15 percent of GDP. Evenwith official capital grants averaging nearly $1.2 billion and an increase inspecial cash grants from the United States, the financing gap became toolarge for Egypt to maintain its debt-servicing obligations. In 1984–87,arrears increased by an average of $1.7 billion a year. Total debt outstand-ing exceeded $40 billion by June 1987, equivalent to 112 percent of GDP.This last figure is calculated using the official exchange rate; it works outat about 184 percent if calculated at the prevailing free market rate, whichwould have made Egypt the most heavily indebted major debtor countryin the world.20 The total debt service due continued to mount, and in1986 reached 114 percent of current account receipts and over 7 percentof GDP. Egypt was in no position to pay these amounts and its foreigndebt arrears increased further. By June 1986, arrears had risen to $4.3billion, of which 47 percent represented interest payments. The situationwas only brought under control, temporarily, by a Paris Club reschedulingin May 1987.
56 Economic development and policymaking, 1973–87
3 Economic development andpolicymaking, 1987–2000
The period started with a crisis and was punctuated by financial difficultiesthat were only resolved through extensive debt forgiveness and rearrange-ment. These years were also notable for the implementation of a majorstabilization program and for a start on some important aspects of struc-tural reform.
Egypt’s debt crisis of 1987 was not caused by a sudden or unexpectedshock. There was not the sudden collapse of a fault line; rather, the cumu-lative effects of the heavy external borrowing that the country hadengaged in since 1975 began to dominate the economic landscape. Theapproach of a climacteric had been recognized for some time – a multina-tional bank monitoring the Egyptian economy described the event as “oneof the slowest train wrecks in history.” The crisis resulted from a loss ofconfidence on the part of Egypt’s creditors and the inadequate growth ofthe country’s foreign exchange earnings. Non-oil exports did not increasesufficiently to compensate for falling oil revenues, and this set in motion arelentless increase in indebtedness and debt service obligations. Foreigncreditors lost confidence and cut back new commitments, particularly ofsupplier credits.
Egypt found itself in a debt trap in which capital inflows were increas-ingly consumed by debt servicing. In 1979, nearly 40 percent of gross dis-bursement of foreign civilian loans and credits was used to finance newinvestments, while about 60 percent went to service the foreign debt(interest and amortization). With gross disbursements declining and debtservice payments increasing sharply, in 1982 virtually all new borrowingwas used to finance the debt service. By 1987, the gross inflow of newloans had declined to nearly half its peak five years earlier, and coveredless than half the debt service actually paid, which in turn was less thantwo-thirds of the debt service payments falling due. Large arrears accumu-lated and shut Egypt out of international capital markets.
Under the auspices of the Paris Club, in May 1987 Egypt and the majorbilateral donor countries reached a rescheduling agreement. Total arrearsof $6.9 billion outstanding at that time were rescheduled, plus all interestand amortization payments (amounting to $4.4 billion) on medium- and

long-term loans falling due until June 30, 1988. These debts were resched-uled over ten years, including a five-year grace period.
The agreement only palliated the problem, rather than resolve it. Eventhe partial debt service paid amounted to 36 percent of current accountreceipts – well beyond the ratio of 25 percent after which the World Banknormally becomes concerned about a country’s creditworthiness. Somecalculations by the World Bank indicated that even after excluding futurefinancing needs, the debt stock at the end of June 1988 would haverequired debt service payments of almost $5.6 billion annually in 1989–92.Including projected financing needs, these payments were likely to rise to$9 billion, corresponding to nearly 45 percent of Egypt’s projected exportearnings in 1995, when the rescheduling period ended.
The main cause of rising external debt was the expansionary policy,exemplified by high budget deficits and a relaxed monetary stance. Theconsolidated budget deficit of the government, excluding debt and amor-tization, reached 23 percent of GDP in 1986. These deficits were causedprimarily by declining revenues, which fell from 40 percent of GDP in1982 to 24 percent in 1988. About half the decline was directly attribut-able to oil revenues (including tax and transferred profits), whichdropped from 7.9 percent of GDP in 1982 to 2.5 percent in 1987.
The authorities tried to limit the deficit by cutting expenditures,particularly on explicit subsidies, which at the end of this periodaccounted for a little over 5 percent of GDP, compared with more than 13percent only five years earlier. However, the implicit subsidies, especiallythe very low retail prices for energy and power in the domestic market andthe overvalued exchange rate used to import most basic foodstuffs, mustbe added to the explicit ones. Both these implicit subsidies representedrevenues forgone by the government and together they accounted fornearly 15 percent of GDP.1 Thus the total subsidy burden remained large,and during this sub-period the government spent about as much on subsi-dies as on investments. Unfortunately, the bulk of these subsidies did notbenefit the poorest strata of society. The World Bank estimated that onlyabout 17 percent of the flow of subsidies benefited the poorest 20 percentof the population; in 1988, nearly one-fourth of the subsidies, principallythe implicit, went to the richest 20 percent of the population.
Interest rates (both lending and deposit) were kept low and remainedmostly negative in real terms for the entire sub-period. Low interest ratesdiscouraged enterprises from self-financing and thus lowered businesssavings. A World Bank study concluded that a major factor in the financialdifficulties experienced by Egyptian public enterprises was the inappropri-ate financial base caused by high debt:equity ratios – a consequence ofmaking debt artificially cheap. Even more harmful were the low depositrates which depressed domestic savings, especially workers’ remittances. Afurther drawback to mobilizing resources was the relatively free system ofcapital transfers, which encouraged Egyptians to hold deposits in foreign
58 Economic development and policymaking, 1987–2000
currency. Holders of foreign currency accounts could expect a returnequivalent to the international rate of interest plus a margin for theexpected depreciation of the Egyptian pound. Given the wide differencebetween domestic and international interest rates, the incentive to holdforeign currency accounts was very strong.
Low interest rates and high budget deficits contributed to the expan-sionary credit and monetary policies during these years. The large budgetdeficits also led to the crowding out of credit to the private sector, ham-pering overall economic growth. The method of financing the deficits,with nearly half the amounts being provided by the domestic bankingsystem, fuelled the excessive expansion of liquidity. Between 1982 and1986 the money supply expanded on average in excess of 22 percent perannum while nominal GDP increased by only 16 percent. Despite exten-sive price controls, which implied fixed prices for staple products and cost-plus pricing for most public manufacturing goods and services, theconsumer and wholesale price indexes both rose sharply after 1982;annual increases in the index of consumer prices for the urban popu-lation consistently remained above 16 percent. Even these figuresrepresented a significant underestimate, both because of the methodologyof the index’s construction and of the growing importance in consump-tion of the free market in which prices were substantially higher than inthe official.
Developments in the main causal factors determining the behavior ofprivate sector liquidity can be seen from changes in reserve money (cur-rency in circulation and Egyptian pound bank reserves) of the CentralBank and the money multiplier (the multiple between the Egyptianpound component of private sector liquidity and reserve money). Themajor factor determining reserve money was Central Bank financing ofthe fiscal deficit. In response to the increasing budget deficits, reservemoney increased from about 3 percent of GDP in 1981 to 5.8 percent in1986, and the money multiplier moved up from about 1.22 in June 1980to 1.44 in February 1986. The IMF attributed the upward trend in themoney multiplier to the decline in the currency:deposit ratio from 1.44 inJune 1980 to 0.74 in February 1986, with variations about the trend deter-mined by developments in the ratio of bank reserves to deposits.
Policy adjustment during the earlier part of the period (1987–91) washesitant and piecemeal. Critics cast doubts on Egypt’s commitment toreform, with Richards (1991: 1727) particularly scathing on Egypt’s nego-tiating tactics with international agencies:
Several tactics supported this strategy [of dilatory reform]. One tacticwas to promise much and to deliver little: The GOE constantly pro-claimed “bold new reforms” throughout the economy, it actually didlittle in comparison with the IMF’s recommendations and even less incomparison with the magnitude of the economic problems facing the
Economic development and policymaking, 1987–2000 59

country in the 1990s. Negotiating tactics included “numbers games,”“smokescreens,” and “musical ministers.” Calculations of inflationrates, the GDP, and government revenues and spending can be dis-torted, concealed, and simply falsified. . . . The government createdinterministerial committees with overlapping jurisdictions to confuseoutsiders – no one knew who was really in charge (if, indeed, anyonewas). . . . Finally, World Bank and IMF teams often met with the GOEnegotiating team composed of four or five ministers, all of whom dis-agreed with each other; the composition of the team changed fromday-to-day, as “important business” took one member away, leading tohis temporary replacement with someone else. Such tactics helped topostpone a break with the IMF, buying time for Mr Mubarak to per-suade Mr Bush to call Mr Camdessus [the Managing Director of theIMF].
Richards clearly expected this state of affairs to continue long into thefuture. He likened Egypt’s acting on economic reform to the final scenefrom Samuel Beckett’s Waiting for Godot, where the characters must resignthemselves to accepting that they face a wait of an unknown, and possiblyindefinite, duration.
In view of what happened with later rounds of reforms, this judgmentmay have been a little hasty. At the time of the 1987 negotiations, thedemons of the 1977 bread riots had not yet been exorcized; policymakerswere uncertain of the public’s reaction to the reforms proposed by themultilateral agencies, and felt compelled to proceed with caution. Thisbetter explains the drawn-out negotiations and the delaying tactics thatwere bound to frustrate the no doubt well-intentioned urgings of inter-national institutions and to drive to distraction equally well-meaningcommentators. Indeed, at the end of a lengthy report on the negotiations,a representative of the international financial institutions wrote that themost suitable encapsulation of their feelings during the process was pro-vided by some lines of Rudyard Kipling in The Naulakha, to the effect thattheir epitaphs would describe them as fools who tried to hurry the East.
After 1987 the shortfall in resources began to take its toll on the GDPgrowth rate, which began to slow steadily; by 1991 real growth haddropped to 3.7 percent. The rising budget deficits, the accumulating debt,and the rising debt service were exacerbated by the Gulf crisis of 1990.Estimates of the direct economic loss to Egypt of that crisis ranged from$2.5 billion upwards.
The situation was unsustainable. By 1991 the budget deficit hadreached 15.3 percent of GDP; the money supply had increased in one yearby 27.5 percent, and inflation was running at an annual rate of 14.7percent. Confidence in the domestic currency was ebbing; the “dollariza-tion ratio” (the share of total liquidity accounted for by foreign currencydeposits) increased to nearly 50 percent. The external picture was equally
60 Economic development and policymaking, 1987–2000

difficult: balance of payments deficits continued; foreign exchangereserves had dropped to $3.9 billion (providing cover for only 3 �� monthsof foreign exchange payments); external debt in that year reached $31.1billion, or 28 percent of GDP;2 more pertinently, the ratio of debt servic-ing to foreign exchange earnings climbed to nearly 55 percent. Thisamount could not be paid without substantially cutting imports, withsevere consequences for production, investment, and per capita consump-tion. Accumulated debt service not paid in 1991 amounted to $3,855million, about 10 percent of GDP. With arrears again mounting rapidly,Egypt’s creditworthiness suffered further blows.
At this time the authorities made a determined bid to rectify the situ-ation. Egypt entered into negotiations with the International MonetaryFund and the World Bank. The Egyptian negotiating team (Kemal El Gan-zoury, Atef Ebeid, Mohammed Ahmed El Razaz, Salah Hamed, YoussefBoutros Ghali) was technically strong and politically adept, and had thefirm backing of the President and the Prime Minister. The negotiationswere prolonged, but it was evident that the government was serious abouttrying to break the cycle of continuing crises. According to YoussefBoutros-Ghali (who was responsible for much of the technical work on theEgyptian side), the overriding instruction from President Hosni Mubarakto the team was to reach an agreement that would quickly trigger the debtrelief arrangements offered by the Paris Club.3 The Bank and the Fundwere equally serious about supporting a program that would deal not onlywith the immediate difficulties, but would also create a basis for sustainedgrowth. Fortuitously, Egypt’s role in the Gulf war had inclined the majordonors to look favorably on attempts to resuscitate the economy. They notonly seconded the efforts of the international organizations, but alsoundertook bilateral actions, especially in the form of write-offs andreschedulings of Egypt’s external debt.
The Bank and the Fund were concerned with two overarching aspectsof Egypt’s economic problems. The first was the immediate issue of stabi-lizing the economy and bringing into balance the main macroeconomicindicators. Second, structural reforms had to be undertaken that wouldminimize rigidities and free up the economy. In order to do this, theauthorities would have to commit to visible actions demonstrating theirdetermination to move towards a market economy. Only this would dissi-pate the ambiguity engendered by what the 1978–82 Plan had labeled “asocialist society that thinks with a capitalist mind.”
The core of the discussions between the Bank/Fund and the Egyptianauthorities comprised four strategic issues.
The first was the sequencing of reforms. A consensus was reached thatstabilization would be coupled with a clear signal that the private sectorwould increasingly be provided a level field on which to compete with thepublic sector. Therefore, in addition to the usual measures associated withstabilization, a simultaneous move towards privatizing public enterprises,
Economic development and policymaking, 1987–2000 61
especially those in the areas of production, distribution, and serviceswould be made. The privatization measures were to exclude the “Eco-nomic Authorities” (such as the Suez Canal, the General Authority forSupply Commodities, etc.) from their ambit. It was hoped that the com-mencement of privatization in a vigorous manner would clearly signal thatEgypt was looking to the private sector as the future engine of growth,while the preservation of Economic Authorities in the public sector wouldreassure the public that the country’s key assets would not be turned intoprivate monopolies.
The second issue was the speed of the transition, sometimes expressedas a “big bang” versus gradualism. Several voices in the Bank and the Fundargued for shock therapy on the grounds that this was more likely tocommit Egypt to a durable acquiescence in the new strategy. However,given the previous experience with the country, this was surely an unrealis-tic expectation; “make haste slowly” was the best that could be expected.The only area in which a big bang, in the sense of an abrupt and drasticchange, might have been felt was budgetary expenditure on governmentinvestment, which in fact imploded from about 11.5 percent of GDP to 5.4percent in the space of four years. But perhaps this should more properlybe called a “big whimper.”
The third issue concerned the reform of the banking and financialsector. The outcome of this particular discussion remained muddled. TheBank and the Fund pushed for the early privatization of at least one of thepublic sector banks, and provided the authorities with some very detailedanalyses of the financial sector to justify their concerns and to facilitatethe formulation of the authorities’ policies. In the event, the governmentmoved to gradually privatize only the joint venture banks. It was con-sidered too sensitive to act on the major commercial banks, which even in2000 remained wholly in the public domain.
The fourth major issue that had to be tackled was a realistic alignmentof the exchange rate. For at least a decade and a half the authorities hadresisted a meaningful devaluation of the exchange rate. The authoritiesoffered various objections to devaluation, prime among which were thefollowing:
• Devaluation would be inflationary. Devaluation would increase thecost of imported food, and thus require further budgetary allocationsfor subsidies (which had already reached 19 percent of total currentexpenditure in 1991). Moreover, public enterprise pricing was not ona cost-plus basis, so increases in the domestic prices of imported rawmaterials would decrease profits or increase losses. Devaluation wouldalso require the government to generate more local currency toservice the external debt. The foregoing outcomes would all increasethe budget deficit. Egypt was already mobilizing a high level ofresources through taxation; thus the increased budget deficits
62 Economic development and policymaking, 1987–2000

might have to be financed through increased seigniorage and theinflation tax.
• Devaluation would lower future growth by increasing the price ofinvestment, and would thus make it more difficult to meet the socialand political targets for employment.
• The structure of Egypt’s production was dominated by items for whichworld demand was not growing, while the country’s consumptionpattern was heavily weighted by necessities. Thus the elasticity of foreigndemand for Egypt’s exports, and Egypt’s demand for imports were bothlow; hence, devaluation would neither increase exports nor reduceimports sufficiently to materially improve the balance of payments.
• A variant of the foregoing “elasticity pessimism” argument was thatdevaluation would not work because the pervasive system of controlsand institutional impediments would weaken the supply response.According to this argument, devaluation was likely to succeed only if itformed part of a comprehensive package that liberalized large parts ofthe economy simultaneously with the exchange rate depreciation. Butsuch a package was likely to require draconian measures and to carrytoo many politically unpalatable side-effects to be acceptable.
The foregoing points dominated the technical exchanges between Egyptand the international agencies. However, behind the technical façade,there lingered a memory from 1977 of the political consequences ofpushing reform at too rapid a pace.
Egypt’s experience under the program of stabilization and structuralreform will now be examined in more detail.
The stabilization program
The Egyptian authorities concluded a standby agreement with the IMF inMay 1991 and a program with the World Bank in November 1991. Thisarrangement, the Economic Reform and Structural Adjustment Program(ERSAP), aimed at stabilizing the economy and starting structural reform.
The program aimed at both the external accounts and the budgetarydeficit, focusing especially on the links between the two. It sought to stabi-lize the external accounts by correcting and unifying the exchange rate.This, in turn, would help the budget by valuing imports at higher prices interms of Egyptian currency and consequently increasing the revenuesfrom import duties; in a like manner the measure increased the contribu-tion of earnings from the Suez Canal. Again, cutting government expendi-tures would not only reduce the budget deficit, but would also reduce thedemand for imports and thus move the external position closer intobalance. The debt relief package would similarly ameliorate both externaland internal balances, by reducing the foreign exchange requirements aswell as the budgetary appropriations for debt servicing.
Economic development and policymaking, 1987–2000 63

The correction of the fiscal imbalance employed all the standard toolsof adjustment. The policy package comprised (1) demand managementmeasures, including fiscal policies (such as widening the sales tax andreducing government investment expenditures), monetary policies (suchas raising nominal interest rates to over 20 percent so as to make thempositive in real terms); (2) expenditure switching measures, accomplishedchiefly through exchange rate changes, which encouraged expendituresto be redirected from external to domestic markets; (3) financing meas-ures, effected by creating a large differential between Egyptian interestrates and those available on US Treasury bills and Euromarket instru-ments, so as to attract higher capital inflows; and (4) structural measuresthat would stimulate improvements in productivity.
The last were particularly important if the package was not to turn intojust another temporary analgesic. Extended discussions between theEgyptian authorities and the international financial institutions hadcreated a consensus that Egypt’s future lay in a competitive, marketeconomy that was integrated into the global economic system.
A primary condition for the successful creation of a market-basedeconomy was to give a clear signal that the private sector would hence-forth be the leading sector. The duties of the public sector in theeconomy would be more clearly laid out – the Economic Authoritieswould continue to play a key role but, generally speaking, in matters ofindustry and services the public sector would no longer occupy a privi-leged position. The logical concomitant of this strategy was a decision toprivatize most of the public sector enterprises engaged in industry andservices, including financial services. Such a measure would at once givethe apposite signal, transfer assets to the private sector where they werelikely to be used more efficiently, and raise additional resources for thebudget.
It was recognized that in the near-term these measures could have anegative impact on some groups; for example, a part of the labor force inpublic enterprises that were privatized would likely be made redundant. ASocial Fund for Development was therefore set up to provide resources forretraining labor, for constructing public works with labor-intensivemethods, and for extending credit to microenterprises. This wouldexpand job opportunities and mitigate some of the negative impact of thereforms.
Action on the exchange rate involved unifying the multiple rates thatexisted in early 1991 and later adjusting them to correspond closer tomarket realities. The authorities, in fact, replaced the multiple rates into adual exchange rate system before the agreement with the IMF. The newsystem became effective from February 27, 1991 and involved a devalu-ation of about 25 percent. Full unification of the exchange rate arrived onOctober 8, 1991; at that time the Egyptian pound was pegged to the USdollar.
64 Economic development and policymaking, 1987–2000
The government also liberalized interest rates, effective from January 3,1991. Initially, there was a minimum charge of 12 percent per annum onthree-month deposits; this was dropped from 1993. In view of the tightmonetary policy followed by the Central Bank of Egypt, the rate on three-month pound deposits climbed from an annualized 8.5 percent at the endof December 1990 to 17.2 percent at the end of January 1992. Accordingto Abdel-Khalek (1998: 45), when compared with the London Inter-BankOffered Rate (LIBOR), the interest differential jumped from 0.59 per-centage points at the end of December 1990 to 13.02 points at the end ofJanuary 1992; the World Bank reported that compared with the yield on90-day Certificates of Deposit in the USA, the differential was nearly 15percentage points.
Experience under the stabilization program (1992–97)
The key imbalance in the economy was the budget deficit, which in thedecade 1981–90 had averaged nearly 18 percent of GDP at current marketprices. The dangers of excessive fiscal deficits were frequently raised in thenegotiations between the Fund, the Bank, and the Egyptian government.The discussions ranged over several points, but the following tended torecur, and helped to shape the stabilization program.
1 Egypt had to face the issue of sustainability, i.e. how long could thesedeficits be financed? Deficits can be financed by printing money or byborrowing, domestically or internationally. In the view of the inter-national agencies, Egypt had already used each of these methods to thepoint of a potential crisis. By printing money in excess of the demandfor it generated by the growth of real GDP, the government had beenlevying an inflation tax on the populace. But the revenue from this taxis subject to a maximum set by the rate of inflation that the populationconsiders “acceptable.” The inflation tax is discussed further in thechapter on public finance, which shows that the rate of the inflation taxhad reached over 10 percent of GDP in some years, and was well abovethe average rate in developed and in most developing countries. Bor-rowing from abroad had already created a crisis in Egypt’s ability toservice the debt; arrears had accumulated and Egypt had lost access toprivate capital markets. Debt rearrangements in 1987 had bought thecountry some time, but did not offer a long-term solution.
Moreover, Domar (1944) has shown that financing fiscal deficits byborrowing is unsustainable if the interest rate exceeds the growth rateof the GDP. In such cases, any primary deficits (the budget deficitexcluding interest payments) net of the inflation tax would lead to anexplosive ratio of debt to GDP. Egypt would then have to default onthe debt, either explicitly, or implicitly through monetization andinflation.
Economic development and policymaking, 1987–2000 65
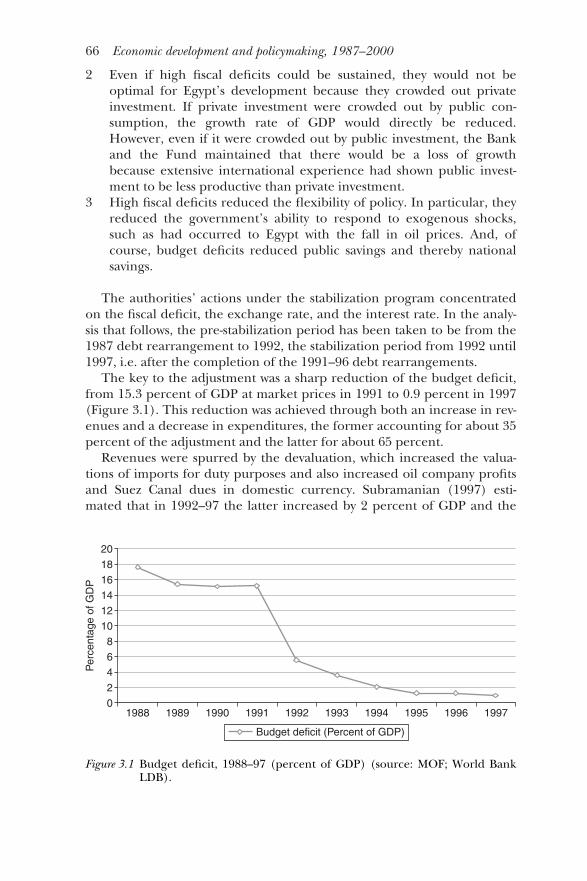
2 Even if high fiscal deficits could be sustained, they would not beoptimal for Egypt’s development because they crowded out privateinvestment. If private investment were crowded out by public con-sumption, the growth rate of GDP would directly be reduced.However, even if it were crowded out by public investment, the Bankand the Fund maintained that there would be a loss of growthbecause extensive international experience had shown public invest-ment to be less productive than private investment.
3 High fiscal deficits reduced the flexibility of policy. In particular, theyreduced the government’s ability to respond to exogenous shocks,such as had occurred to Egypt with the fall in oil prices. And, ofcourse, budget deficits reduced public savings and thereby nationalsavings.
The authorities’ actions under the stabilization program concentratedon the fiscal deficit, the exchange rate, and the interest rate. In the analy-sis that follows, the pre-stabilization period has been taken to be from the1987 debt rearrangement to 1992, the stabilization period from 1992 until1997, i.e. after the completion of the 1991–96 debt rearrangements.
The key to the adjustment was a sharp reduction of the budget deficit,from 15.3 percent of GDP at market prices in 1991 to 0.9 percent in 1997(Figure 3.1). This reduction was achieved through both an increase in rev-enues and a decrease in expenditures, the former accounting for about 35percent of the adjustment and the latter for about 65 percent.
Revenues were spurred by the devaluation, which increased the valua-tions of imports for duty purposes and also increased oil company profitsand Suez Canal dues in domestic currency. Subramanian (1997) esti-mated that in 1992–97 the latter increased by 2 percent of GDP and the
66 Economic development and policymaking, 1987–2000
Per
cent
age
of G
DP
20
0
2
4
6
8
10
12
14
16
18
1988 1989 1990 1991 1992 1993 1994 1995 1996 1997
Budget deficit (Percent of GDP)
Figure 3.1 Budget deficit, 1988–97 (percent of GDP) (source: MOF; World BankLDB).

former by 1 percent. In addition, the introduction of the sales tax in 1991and the widening of its ambit during the period to 1997 contributedanother 1.4 percent. Budgetary expenditures were cut by 7.5 percent ofGDP between 1992 and 1997. The main items of reduced expenditureswere public investment, subsidies, and interest on foreign loans. Theitems on which expenditures continued to rise were wages and salaries,and interest on domestic borrowing.
The biggest reduction was borne by expenditure on government invest-ment, which fell from 11.5 percent to 5.4 percent of GDP. This was inkeeping with the government’s strategy of relying increasingly on theprivate sector for investment. The reasoning was that if the governmentcut public investment, but at the same time permitted the private sector toinvest in areas (such as infrastructure) from which it had hitherto beenexcluded, overall investment would not suffer. The government realizedthat this strategy might offer hostages to fortune – public sector invest-ment would definitely be cut, but the private sector might not respondcommensurately. Unfortunately, this is exactly what happened. Althoughthe private sector took up some opportunities in infrastructure, such asBuild-Own-Operate-Transfer (BOOT) projects in power generation, for avariety of largely institutional reasons (discussed in Chapter 10), itsresponse remained muted.
Another important item of expenditure reduction was on subsidies,which were cut from 5.2 to 1.6 percent of GDP, and were limited to fouritems (compared with 18 items in 1980): bread, wheat flour, sugar, andcooking oil. This was a more carefully prepared step than that of January1977 that had led to widespread riots and forced the restoration of thesubsidies. Some studies – e.g. Ali and Adams (1996) – indicated that thesubsidies that remained were effective, in that they were “self-targeted”towards the poor, and that eliminating them would significantly worsenthe distribution of income, especially in urban but also in rural areas.
The authorities also made some important changes to the fiscal andmonetary system. Zaki (2001: 1876) summarizes them as: (1) terminatingmany policies (such as interest rate ceilings, compulsory credit allocations,high liquidity ratios, etc.) that distorted capital markets; (2) strengtheningthe financial system by recapitalizing public sector banks (at a cost of 5.5percent of GDP), permitting more competition, and improving prudentialmeasures; and (3) developing a market for government securities (Treas-ury bills) which not only created an important substitute for Treasury bor-rowing from the Central Bank of Egypt, but also provided an additionaltool for monetary control by the Bank and allowed it scope for a moreactive monetary policy.
Added to the deliberate acts of policy was another intervention exmachina with fortunate consequences for both the budget and the balanceof payments. On May 25, 1991, Egypt concluded an agreement to reorga-nize and reduce its debt to the 17 members of the Paris Club. Debt service
Economic development and policymaking, 1987–2000 67

obligations were locked in at a reduced level for the first three years, provid-ing a minimum of 15 percent (net present value) relief. The full implemen-tation of debt-restructuring/rescheduling had to achieve the equivalent of50 percent reduction (net present value) of the entire schedule of debtservice payments on eligible debts. To achieve the full benefit of the agree-ment, Egypt was required to have an agreed program with the IMF and tokeep closely to its IMF targets; to remain current during 1991–94 withrespect to payments due under the terms of the agreement; and to obtaincomparable terms of debt relief from non-Paris Club creditors.
Overall, the 1991 Paris Club agreement involved a total of $19.6 billion,excluding debt owed to the United States. There was also a very large can-cellation of debt by Arab countries. At the beginning of the 1990s, Egypt’scontinued problems because of the debt overhang were intensified by thecost associated with the military build-up and the war in the Gulf. InOctober 1990, Kuwait, the United Arab Emirates, and Qatar forgave $2billion, $255 million, and $121 million respectively. In December 1990,the United States canceled military debt with a face value of US$7.1billion; in December 1991, GODE and Saudi Arabia canceled $2.7 and$1.1 billion, respectively.
The May 1991 Paris Club general agreement comprised an immediateand a final debt reduction and reorganization. The benefits were substan-tial. The first two stages, each comprising a reduction of 15 percent of thenet present value, were accomplished in July 1991 and October 1993respectively; the third stage comprising a reduction of 20 percent wascompleted in 1996. The debt arrangements involved a total reduction of50 percent of the net present value of debt service payments on eligibledebt.
The scope of the debt relief was wide. The debt eligible for reschedul-ing covered: (1) all concessional public and publicly guaranteed debtowed to the participating Paris Club creditors contracted prior to October31, 1986 and having an original maturity of more than one year; (2)medium- and long-term commercial credit insured by the participatingcreditor countries contracted prior to the same cut-off date; (3) noncon-cessional medium and long-term bilateral debt owed to participatingcountries; and (4) repayments due under the previously rescheduled debtdated May 22, 1987. Overall, the 1991 Paris Club debt relief packageinvolved a total of $19.6 billion, and enabled Egypt to save an average ofover 2 percentage points of GDP a year in debt service payments from1992–97 on debt owed to Paris Club creditors. Additional savings on theservicing due to Arab countries and institutions and on US military debtmeant that the benefits from the debt rearrangement could be conserva-tively put at about 4 percent of GDP annually in the 1992–97 period. Theimpact of the debt reduction on Egypt’s external position was very consid-erable: Subramanian (1997) estimated that the debt relief provided thebalance of payments with an improvement of $2.2 billion, and that it
68 Economic development and policymaking, 1987–2000
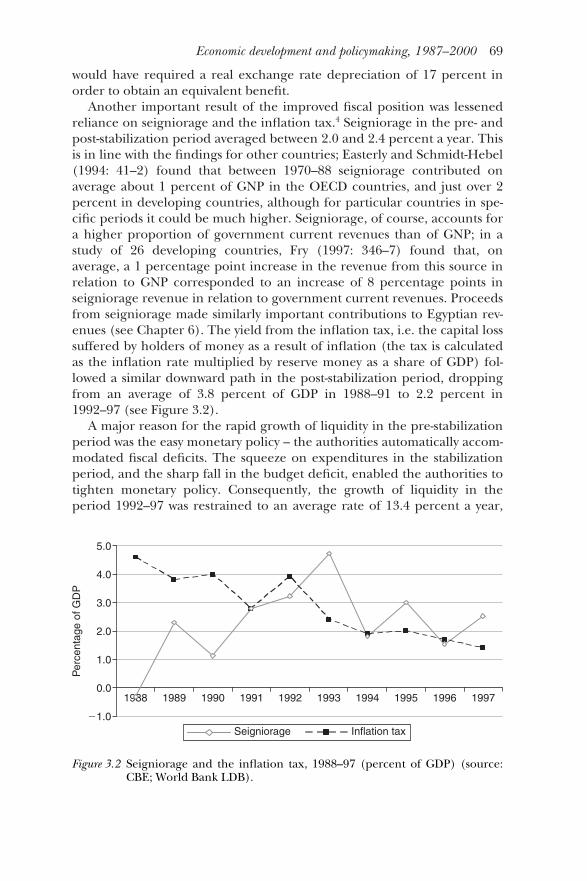
would have required a real exchange rate depreciation of 17 percent inorder to obtain an equivalent benefit.
Another important result of the improved fiscal position was lessenedreliance on seigniorage and the inflation tax.4 Seigniorage in the pre- andpost-stabilization period averaged between 2.0 and 2.4 percent a year. Thisis in line with the findings for other countries; Easterly and Schmidt-Hebel(1994: 41–2) found that between 1970–88 seigniorage contributed onaverage about 1 percent of GNP in the OECD countries, and just over 2percent in developing countries, although for particular countries in spe-cific periods it could be much higher. Seigniorage, of course, accounts fora higher proportion of government current revenues than of GNP; in astudy of 26 developing countries, Fry (1997: 346–7) found that, onaverage, a 1 percentage point increase in the revenue from this source inrelation to GNP corresponded to an increase of 8 percentage points inseigniorage revenue in relation to government current revenues. Proceedsfrom seigniorage made similarly important contributions to Egyptian rev-enues (see Chapter 6). The yield from the inflation tax, i.e. the capital losssuffered by holders of money as a result of inflation (the tax is calculatedas the inflation rate multiplied by reserve money as a share of GDP) fol-lowed a similar downward path in the post-stabilization period, droppingfrom an average of 3.8 percent of GDP in 1988–91 to 2.2 percent in1992–97 (see Figure 3.2).
A major reason for the rapid growth of liquidity in the pre-stabilizationperiod was the easy monetary policy – the authorities automatically accom-modated fiscal deficits. The squeeze on expenditures in the stabilizationperiod, and the sharp fall in the budget deficit, enabled the authorities totighten monetary policy. Consequently, the growth of liquidity in theperiod 1992–97 was restrained to an average rate of 13.4 percent a year,
Economic development and policymaking, 1987–2000 69
1988
Per
cent
age
of G
DP
5.0
4.0
3.0
2.0
1.0
0.0
�1.0
1989 1990 1991 1992 1993 1994 1995 1996 1997
Seigniorage Inflation tax
Figure 3.2 Seigniorage and the inflation tax, 1988–97 (percent of GDP) (source:CBE; World Bank LDB).
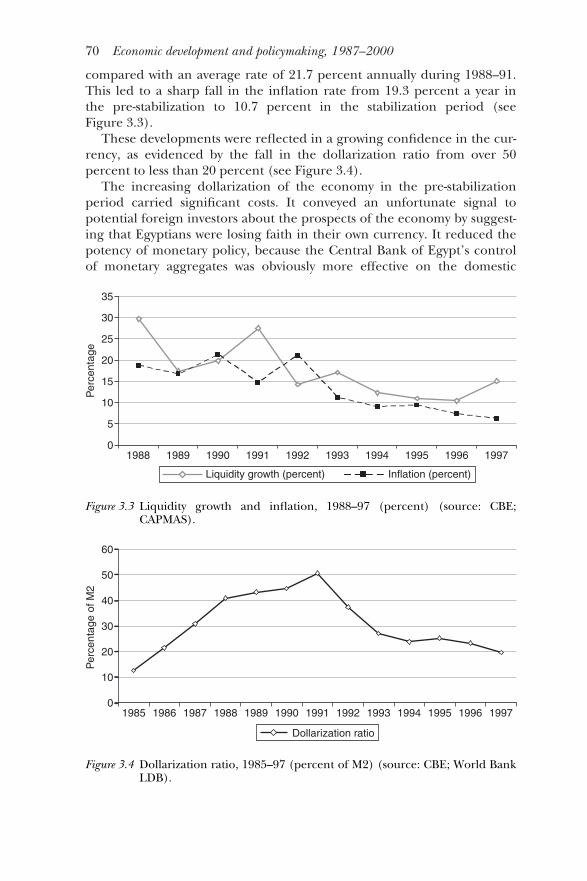
compared with an average rate of 21.7 percent annually during 1988–91.This led to a sharp fall in the inflation rate from 19.3 percent a year inthe pre-stabilization to 10.7 percent in the stabilization period (seeFigure 3.3).
These developments were reflected in a growing confidence in the cur-rency, as evidenced by the fall in the dollarization ratio from over 50percent to less than 20 percent (see Figure 3.4).
The increasing dollarization of the economy in the pre-stabilizationperiod carried significant costs. It conveyed an unfortunate signal topotential foreign investors about the prospects of the economy by suggest-ing that Egyptians were losing faith in their own currency. It reduced thepotency of monetary policy, because the Central Bank of Egypt’s controlof monetary aggregates was obviously more effective on the domestic
70 Economic development and policymaking, 1987–2000
Per
cent
age
35
30
25
20
15
10
5
01988
Liquidity growth (percent) Inflation (percent)
1989 1990 1991 1992 1993 1994 1995 1996 1997
Figure 3.3 Liquidity growth and inflation, 1988–97 (percent) (source: CBE;CAPMAS).
60
Per
cent
age
of M
2
50
40
30
20
10
01985 1986 1987 1988 1989 1990 1991 1992 1993 1994 1995 1996 1997
Dollarization ratio
Figure 3.4 Dollarization ratio, 1985–97 (percent of M2) (source: CBE; World BankLDB).
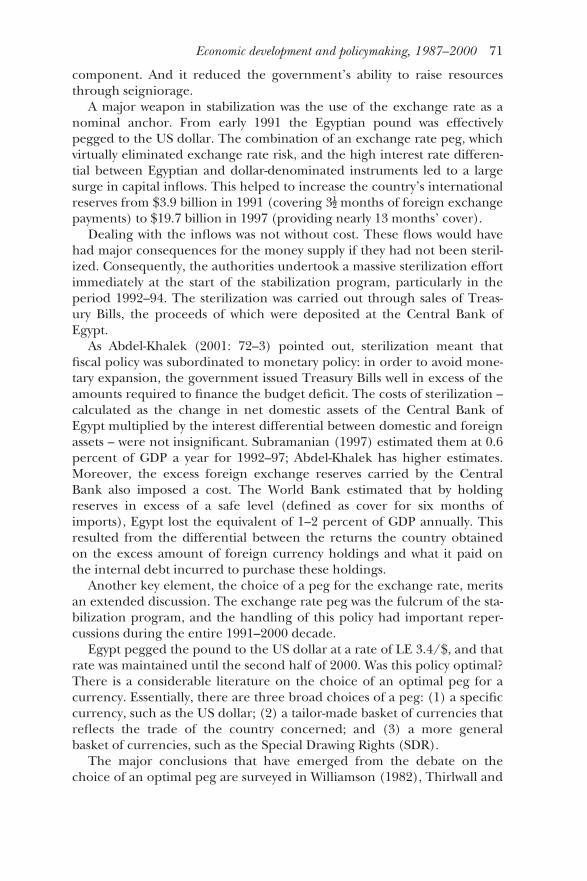
component. And it reduced the government’s ability to raise resourcesthrough seigniorage.
A major weapon in stabilization was the use of the exchange rate as anominal anchor. From early 1991 the Egyptian pound was effectivelypegged to the US dollar. The combination of an exchange rate peg, whichvirtually eliminated exchange rate risk, and the high interest rate differen-tial between Egyptian and dollar-denominated instruments led to a largesurge in capital inflows. This helped to increase the country’s internationalreserves from $3.9 billion in 1991 (covering 3�� months of foreign exchangepayments) to $19.7 billion in 1997 (providing nearly 13 months’ cover).
Dealing with the inflows was not without cost. These flows would havehad major consequences for the money supply if they had not been steril-ized. Consequently, the authorities undertook a massive sterilization effortimmediately at the start of the stabilization program, particularly in theperiod 1992–94. The sterilization was carried out through sales of Treas-ury Bills, the proceeds of which were deposited at the Central Bank ofEgypt.
As Abdel-Khalek (2001: 72–3) pointed out, sterilization meant thatfiscal policy was subordinated to monetary policy: in order to avoid mone-tary expansion, the government issued Treasury Bills well in excess of theamounts required to finance the budget deficit. The costs of sterilization –calculated as the change in net domestic assets of the Central Bank ofEgypt multiplied by the interest differential between domestic and foreignassets – were not insignificant. Subramanian (1997) estimated them at 0.6percent of GDP a year for 1992–97; Abdel-Khalek has higher estimates.Moreover, the excess foreign exchange reserves carried by the CentralBank also imposed a cost. The World Bank estimated that by holdingreserves in excess of a safe level (defined as cover for six months ofimports), Egypt lost the equivalent of 1–2 percent of GDP annually. Thisresulted from the differential between the returns the country obtainedon the excess amount of foreign currency holdings and what it paid onthe internal debt incurred to purchase these holdings.
Another key element, the choice of a peg for the exchange rate, meritsan extended discussion. The exchange rate peg was the fulcrum of the sta-bilization program, and the handling of this policy had important reper-cussions during the entire 1991–2000 decade.
Egypt pegged the pound to the US dollar at a rate of LE 3.4/$, and thatrate was maintained until the second half of 2000. Was this policy optimal?There is a considerable literature on the choice of an optimal peg for acurrency. Essentially, there are three broad choices of a peg: (1) a specificcurrency, such as the US dollar; (2) a tailor-made basket of currencies thatreflects the trade of the country concerned; and (3) a more generalbasket of currencies, such as the Special Drawing Rights (SDR).
The major conclusions that have emerged from the debate on thechoice of an optimal peg are surveyed in Williamson (1982), Thirlwall and
Economic development and policymaking, 1987–2000 71

Gibson (1992), and Edwards (1993b), among others. The following dis-cussion draws primarily on Williamson.
First, there is a consensus that the most feasible aim of policy should beto stabilize something rather than to optimize (whether maximizing or mini-mizing) anything. What should be stabilized? Williamson argues that thereis a strong case for countries taking as their objective the maintenance of acontinuous internal balance, while being content with ensuring that exter-nal balance is satisfied on average over the medium term. His argument forthis asymmetry is that departures from internal balance always involve awelfare cost, while temporary departures from external balance can behandled through variations in reserves and/or foreign borrowing, withalmost negligible welfare costs. Thus, departures from internal balance,for example in the form of higher unemployment than necessary to main-tain a specified rate of inflation, involve a waste of resources that cannever be fully recouped; as Williamson (1982: 54) puts it, “Today’s unem-ployed cannot do today’s work tomorrow.” Lower unemployment mightaccelerate inflation, the reversal of which will cost more in terms of lostoutput in the future than the benefits gained today.
The operational implication of choosing the foregoing objective func-tion is that the peg should be chosen to stabilize the effective exchangerate (EER), i.e. a trade-weighted average of the bilateral exchange rateswith a country’s trading partners. Stabilizing the effective exchange ratewill balance out the effect of individual bilateral exchange rate changesover the economy as a whole, and thus leave macroeconomic equilibriumundisturbed.
Second, pegging against a single currency produces less macroeco-nomic stability than pegging against a basket of currencies. Egypt chose topeg its currency to the United States dollar. A country that pegs its cur-rency to the dollar is, in effect, tying its monetary and exchange rate pol-icies wholly to US policies. This makes sense only if US exchange rate andmonetary policy are wholly appropriate for the pegging country’s nationaleconomy. This was not the case for Egypt. During much of the periodafter 1991 the US dollar appreciated, which forced the Egyptian pound toappreciate against other currencies as well. The loss of export competitive-ness and the consequent balance of payments deficits did not muchmatter to the United States, because the world showed an almost insa-tiable appetite for holding US dollars. However, it did matter to Egypt,because the world showed no comparable enthusiasm for accumulatingEgyptian pounds. Moreover, in order to maintain the fixed parity, Egypthad to prevent an outflow of foreign funds; this meant keeping interestrates in Egypt at much higher levels than in the United States. This wasagain suboptimal for the Egyptian economy which, with substantial under-employed resources, generally required a more expansionary stance.
Williamson shows that the least exchange instability is generated bypegging to an individually tailored basket of currencies. The consensus
72 Economic development and policymaking, 1987–2000

appears to be that the weights in the basket should reflect the directionand elasticity of total trade (i.e. taking both imports and exports intoaccount) between the country and its trading partners. However, therecould be some problems with using such a basket. The pegging countrymust have the capacity to acquire information on the foreign exchangescontinuously and to make rapid and frequent calculations, and it wouldhave to develop a forward market. Moreover, a country could not inter-vene in a “basket,” but would have to acquire the constituent currencies(and incur the cost of doing so) in order to intervene.
Nevertheless, it is somewhat surprising that neither Egypt nor the Bankand the Fund gave more thought to adopting the SDR as a peg. The SDRis itself a basket of the principal currencies more or less weighted accord-ing to their importance in world trade. A number of studies conducted inthe IMF, UNCTAD, and elsewhere have concluded that for the vast major-ity of developing countries, an SDR peg would have produced somewhatmore instability of the effective exchange rate than a tailored peg, butnoticeably less than any single currency peg. Egypt’s foreign trade wasquite diversified; hence, it would clearly have benefited from an SDR peg.However, members of the Egyptian and IMF teams negotiating the struc-tural adjustment program of 1991 told me that the idea of the SDR pegwas never seriously examined.
Third, Williamson argues that longer-term questions, such as neutraliz-ing the effect of inflation differentials, promoting payments adjustment,and imposing an external discipline (if this is desired) are betteraddressed by changing the value of the peg rather than by influencing theunit to which the currency is pegged. Thus, Egypt could have pegged itscurrency to the dollar, but committed itself to a “crawling” appreciation ordepreciation. In the light of this, Egypt’s decision to peg to a single cur-rency did not constitute the main difficulty; it was the failure to adjust thevalue of the peg in response to changing economic realities that imposeda straitjacket on important aspects of policymaking. The striking stabilityof the exchange rate after 1991 would repudiate the authorities’ pro-nouncements that the rate was market-determined. Calvo and Reinhart(2002: 386) found that for the period February 1991–December 1998 theprobability that the monthly change in the rate would lie only within avery narrow 2.5 percent band was 98.9 percent, suggesting that the paritywas, in fact, rigidly controlled.5
An argument frequently advanced by Egypt in support of maintainingthis degree of rigidity in the exchange rate was that it reduced uncertaintyand therefore encouraged foreign investment. However, most foreigninvestors are aware that a pegged exchange rate is a conditional promise,not an absolute guarantee; in Edwards’s (1993b: 20) words, it is “acommitment with escape clauses.” The pegged value is conditional uponthe country’s having sufficient reserves of foreign exchange to defendthe parity. The exchange rate might collapse, even if the country does
Economic development and policymaking, 1987–2000 73

everything that it reasonably can to prevent that from happening. Indeed,that is what occurred in the second half of 2000, after the Central Bank ofEgypt lost a substantial part of its foreign exchange reserves in an unsuc-cessful attempt to maintain the exchange rate at LE 3.40/$. It is thus notclear how important the maintenance of a “fixed” rate actually was forinvestors.
Even at the risk of some oversimplification, we can sum up the discus-sion on the choice of an optimal peg as follows. The variance in the realeffective exchange rate (REER) can be decomposed into a part due tochanges in the EER, a part stemming from differential inflation (some-times termed “relative prices”), and a term representing the interactionbetween the two.6 The recommendation emerging from (in particular)Williamson’s discussion is that the overall exchange rate policy shouldseek to preserve the constancy of the REER, except when it must bechanged in order to promote payments adjustment. The choice of the pegshould be guided by the objective of stabilizing the nominal EER, whilethe relative price part of the REER should be handled by crawling changesin the value of the peg. The peg that produces the least volatility in theREER (in some sense the “best” peg) would be a basket of currencies withweights reflecting the direction and elasticity of total trade between thecountry and its trading partners. The SDR would also lead to less variabil-ity than would a single-currency peg.
The analysis of an optimal currency peg and of the experience of theEgyptian economy over the decade 1991–2000 suggests that Egypt wouldhave been better served by choosing a more diversified peg and to haveshown greater flexibility in adjusting the value of the peg.
Another weakness in the IMF/World Bank program was the inconsis-tency between some important structural and stabilization elements. Thestructural adjustment recommended for Egypt essentially consisted ofshrinking the space for the public sector and attempting to substantiallyenlarge that for the private. Such a strategy rests on two main assump-tions. First, it assumes that the private sector is able to fill in the gap causedby the shrinking of the public sector, i.e. that the private sector possessesthe necessary resources. Second, it assumes that the private sector is willingto fill in the gap, i.e. that the private sector will consider it profitable toengage in a much higher rate of investment once the public sector hasretreated from the scene. Neither of these stylized facts may be true.
Public sector investment dropped, but the private sector did not step into make up the deficiency. It is unlikely that this occurred because of ashortage of resources in the private sector; after all, there was a spectacu-lar inflow of foreign exchange, and most of these resources appeared tohave been the repatriation of balances held abroad by the Egyptianprivate sector. It is therefore more likely that the shortfall occurredbecause the private sector was hesitant to undertake new capital formationand to engage in productive activities.
74 Economic development and policymaking, 1987–2000

This view derives a measure of support from Dr Atef Ebeid.7 He putforward two reasons for the private sector’s not filling in the gap createdby the public sector’s withdrawal. The first was the absence of institutionalinvestors and financial institutions, with the consequence that the equitymarket was thin, especially for new investors. The second was that most ofEgypt’s entrepreneurs came from trading families (because 30 years ofsocialism had prevented the growth of a substantial entrepreneurial class)who tended to be quite cautious about venturing into new activities.
The reasons might not be far to seek. As part of the structural adjust-ment program, the authorities had raised nominal interest rates to 22percent; soon thereafter the inflation rate came down quite rapidly, butinterest rates followed only after sizeable lags. As a result, for significantperiods real interest rates on financial assets (including bank deposits andgovernment paper) remained in excess of 8–10 percent, and the incomefrom which was not taxed. If private investors could obtain real returns ofthis magnitude without making any effort or incurring any risk, the realnet return on capital invested in entrepreneurial activities would have tobe much higher in order to tempt businessmen to put up with the hasslesof the bureaucracy and the tax authorities and to submit to the vagaries ofthe market. The behavior of real interest rates had drastically raised theopportunity cost of productive investment. Consultations with Egyptianbusinessmen by the World Bank suggested that during this period busi-nesses were looking for minimum real rates of return on capital of 25percent a year and more. Not many activities readily offered such returns,and it was thus quite rational for private investors to eschew the toil andthe hazard involved in applying their resources to new capital formation.
Soon after the stabilization was completed, the Egyptian economy washit by a combination of serious events. The first of these was the onset of afinancial crisis in East Asia, beginning with the banking sector in Thai-land. As this crisis generalized through most of the formerly fast-growingeconomies of East Asia (especially Korea, Indonesia, and the Philippines),these countries sought to protect their balances of payments by rapidlydepreciating their currencies. However, Egypt did not follow suit; its cur-rency remained tied to the dollar, which kept appreciating against theEast Asian currencies. The average devaluation against the Egyptianpound by 1998 (a year after the onset of the crisis) was 73 percent for theIndonesian rupiah, 42 percent for the Korean won, 36 percent forMalaysia’s ringgit, and 46 percent for the Thai baht.
The devaluations made exports from the East Asian countries to thirdmarkets more competitive than those from Egypt, impacting particularlyon the growth of non-traditional exports. They also made imports fromEast Asia into Egypt cheaper in dollar terms. This created a substantialsurge in imports and added to the pressures on the balance of payments.
The second serious event was an attack on tourists on November 18, 1997in the town of Luxor in which 58 foreign tourists and four Egyptians were
Economic development and policymaking, 1987–2000 75

killed. This incident led to an immediate and sharp fall in tourism, whichfurther cut into foreign exchange receipts. The slowness with which theexchange peg was adjusted in response to these events (it was not changeduntil 2000) added to Egypt’s difficulty in dealing with these challenges.
The attempt simultaneously to raise the interest rate to unprecedentedlevels, to liberalize the economy, and to fix the exchange rate brought tothe fore another conundrum that was novel for Egyptian policymakers.They had to confront what is sometimes described in the literature as the“impossible trinity” or the “inconsistent trilogy.” The impossible trinityprinciple says that it is impossible simultaneously to achieve a fixed(managed) exchange rate, free capital movement, and an independentmonetary policy. Any pair of these goals can be achieved, but the third willhave to be relinquished.
Jan Tinbergen (1952: 27–30) has shown that a necessary condition foreconomic policy to be effective is that there should be as many independ-ent instruments of policy as the number of objectives to be attained. Infact, several writers recommend that because the effects of policy instru-ments are uncertain and may be associated with significant time-lags, it isbetter to deploy more instruments than there are targets.
So long as Egypt’s economic strategy was based on an exchange ratepeg, monetary policy had to be subordinated to the needs of maintainingthe peg. The interest rate had to be set at whatever level was necessary toprevent an outflow of funds, because a loss of funds would have put pres-sure on the exchange rate. Thus monetary policy did not exist as anindependent instrument; an independent monetary policy would haverequired a floating exchange rate. When the authorities attempted toattain all three goals simultaneously, it only led to a hemorrhage offoreign exchange reserves (e.g. from 1998). Ultimately, the policymakersopted for an intermediate regime, one that aimed at a de facto fixedexchange rate, monetary independence, and various measures to restraincapital outflows. This helped to square the circle because capital controlspermit the monetary policy and exchange rate policy to act as separateinstruments (capital controls can restrict the outflow of funds, and thusavoid the pressure on the exchange rate).
Structural reform
Concomitantly with the stabilization program, some measures of struc-tural reform were introduced. These measures related to reforms of thetariff structure and pricing policies, but the most fundamental issue con-cerned the privatization of state-owned enterprises. It had been evidentfor a considerable time that the performance of such enterprises leftmuch to be desired and constituted a major drag on the country’s eco-nomic performance.
The financial and production efficiency of the public enterprise sector
76 Economic development and policymaking, 1987–2000

was the subject of several inquiries – for example, Mabro (1974), Hansenand Nashashibi (1975), Waterbury (1983) – and in studies by multilateraland bilateral donors. The findings of a study by the World Bank (1987)best sum up the problem. The Bank examined the performance of 366public companies and 37 Economic Authorities in the non-financial sectorfrom 1973 to 1984. It found that while some of the Economic Authorities(particularly the Suez Canal Authority and the Egyptian General Petro-leum Company) made surpluses, the financial and productive perform-ance of the public enterprise sector as a whole was dismal. This wasbecause of the particularly weak performance of the public companies.
The financial indicators for the sector painted a bleak picture. Deficitswere large and growing – the overall deficits increased from 3.9 percent ofGDP in 1973 to 8.4 percent in 1984). Financial rates of return were lowand falling – the net rate of return on book values dropped from9 percent to 4.8 percent. Capital invested in the industrial public sectorearned a negative rate of return on revalued assets in the years covered bythe study – the figure dropped to minus 5.7 percent in 1984. The sectorimposed a very substantial burden on the national budget – except for1981, in each year between 1973 and 1984 the aggregate deficit of thepublic companies and economic authorities accounted from 17 to 37percent of the total government budgetary deficit, and was a much higherpercentage than accounted for by the public enterprise sector in a sampleof about 20 countries at a comparable level of development. The WorldBank cautioned that even the foregoing figures might not have fullycaptured the situation, because of the somewhat opaque accountingprocedures employed by the public enterprises.
Indicators of productivity painted the same picture. Between the periods1973–79 and 1979–83, total factor productivity fell sharply. The marginalproductivity of capital dropped from 15 percent to 5 percent, while mar-ginal labor productivity in the second period was less than 15 percent thanin the first. The growth rate of value-added dropped from 11.7 percent in1973–79 to 1.2 percent in 1979–83. These developments impacted on thecompetitiveness of Egyptian industry. A World Bank (1983) report showedthat the domestic resource costs (DRC) for several industries was greaterthan unity; a product with a DRC greater than unity indicates that it wouldbe better to import that item than to produce it domestically. Moreover, asOtt (1993: 208) pointed out, resources were not redirected from industrieswith comparative disadvantages to those with clear advantages; publicinvestment continued to increase in non-competitive sectors.
The picture had not improved in subsequent years. A later World Bank(1991) investigation found that 35 out of out of 397 state-owned enter-prises in 1989 regularly made returns on assets of zero or negative per-centages, and were extant only because the government continued toinject liquidity. Another 162 state enterprises had returns on assets of lessthan 5 percent.
Economic development and policymaking, 1987–2000 77
A reform of the sector was essential to the long-term viability of theEgyptian economy. The discussions between the Egyptian authorities andthe Bank in 1991 focused on an early reform of state-owned enterprises.The discussions covered much of the usual grounds that have beenbrought up in other countries. The international organizations identifiedprivatization as the key instrument in the reform. Both sides understoodthat privatization could have many aims; the memoranda between theBank and Egypt touched on increasing competition for producers; redu-cing public sector borrowing; widening share ownership; allowing firms tocompete more freely for funds in the capital market; redistributingincome and wealth; and freeing producers from frequent and detailedgovernment intervention.
The discussions narrowed down to four items: the financial gains to thegovernment from disinvestment; the easing of pressure on the budgetbecause it would no longer be necessary to inject public funds into loss-making enterprises; the more efficient use of privatized assets because ofincreased competition; and the freeing of producers from incessant govern-ment interference. However, significant as these advantages might be, themost fundamental issue was a non-tangible one – it was that in future theprivate sector would be the main engine of growth for the economy, andthat it would no longer be disadvantaged vis-à-vis the public sector.
The importance of this last factor partly explains the vehemence of thedebate within Egypt. While the recommendations of the internationalorganizations were seemingly concerned with means, their most potentimpact was likely to be on ends. Privatization on the scale proposed wasnot simply a financial exercise, but rather the abandonment of a model ofdevelopment that had shaped Egyptian society for a generation. More-over, privatization was to proceed concomitantly with a relaxation of con-trols in several areas of industry and trade. Controls generated rents,whether monopoly profits or guaranteed public sector incomes, and therecipients had a powerful interest in the continuation of the system. Thechanges were bound to throw up a different set of winners and losers thanthose produced by the existing system. Thus the seemingly straightforwardtechnical issue of privatizing some 300-odd enterprises might be the thinedge of a wedge that could initiate far-reaching changes in Egyptiansociety. The Egyptian authorities in 1991 accepted this possibility. Thecentral question then became how to manage the change while minimiz-ing its worst effects on the losers.
Some policymakers viewed the change in the relative roles of the publicand private sectors as a logical progression. Dr Kemal El Ganzoury (Minis-ter of Planning 1982–85, Deputy Prime Minister 1985–96, Prime Minister1996–99) presented the change as a pragmatic response to evolving eco-nomic and international conditions. In his view, immediately after the1973 war the main task facing the Egyptian economy was the rebuilding ofa large amount of infrastructure. The domestic private sector did not have
78 Economic development and policymaking, 1987–2000

the resources to undertake this task, while foreign investors were wary ofthe situation in the Middle East and reluctant to invest substantialamounts in the region. Therefore, it was left to the Egyptian public sectorto carry out this responsibility.
However, by the 1990s a large part of the infrastructure had been builtand the more immediate challenge for the economy was the provision ofproductive employment. This could be created much more efficiently bythe private sector. Moreover, the private sector was now much larger andwas able to undertake projects requiring sizeable amounts of capital; itcould be encouraged to undertake substantial infrastructure projects.Finally, the changed situation in the Middle East had reassured foreigninvestors. It was time to reformulate strategy to take advantage of all thesechanges. In Dr Ganzoury’s view, therefore, the redirection of strategy wassimply a necessary step in the process of making the Egyptian economyviable for the twenty-first century. Indeed, despite Dr Ganzoury’s reputa-tion as an advocate of the public sector, privatization accelerated duringhis tenure as Prime Minister (1996–99).
His successor, Dr Atef Ebeid, had to wrestle with two major problemswhile continuing the process. One, the economy and the stock markethad slowed, making it difficult to sell off enterprises at prices the Ministryconsidered appropriate. Two, the earlier buyers had bought up the moreprofitable enterprises, leaving the Ministry to dispose of a less attractiveportfolio.
A review of the documentation and extended discussions with the mainactors indicate that, for both sides, acceptance of the philosophicalchange was seen to be the crucial matter; ironing out the technical detailswas regarded as secondary. This would explain why not much attentionwas devoted to questions of how the sale price of assets would be deter-mined; of the different methods of selling the assets; or of the uses towhich the proceeds from privatization should be put.
Before discussing progress on privatization, it may be useful to lookbriefly at the structure of the economic activities of the public sector.
Four major types of public institutions (in addition, of course, to thegovernment) are involved in economic activities: (1) local governmentproductive enterprises; (2) service authorities; (3) Economic Authorities;and (4) public enterprises. The last two are the main public sector eco-nomic agents in Egypt.
There are somewhat more than 60 Economic Authorities, which coverthe most important sectors of the economy: the utilities (such as telecom-munications, electricity, railways, the postal system, etc.), the Suez Canaland the Petroleum Company, the General Authority for Supply (whichcontrols the import and distribution of the basic subsidized commodities),social and health insurance, etc. They are organized as semi-autonomouscorporations, and in the beginning of the 1990s employed some 3 percentof the labor force and produced about 20 percent of the GDP.
Economic development and policymaking, 1987–2000 79
In the early 1990s, the public enterprises produced around 10 percentof the GDP and employed about 6 percent of the labor force.8 They oper-ated in virtually all sectors of the economy, their activities ranging fromthe production of iron and steel to soap, cement to movies, phosphates,ceramics, beer, hotels, and so on. They also dominated the banking andinsurance sectors.
As part of its structural reform program, the government committeditself to privatizing public enterprises, but not the Economic Authorities.The first step was the passage of Law 203 in July 1991 by which 314 nonfi-nancial public economic enterprises were grouped under 27 new holdingcompanies; in 1993 these were reorganized into 17 holding companies.The 314 affiliated companies were distributed in a manner as to preventundue sectoral concentration under any single holding company. Anindependent body, the Public Enterprise Office, was set up in November1991 under the Ministry of Public Enterprise Sector in order to advise onissues related to the privatization of state-owned enterprises (SOEs).
The affiliated companies were given greater autonomy in matters ofmanagement, pricing, and finance. However, questions of employmentremained tightly regulated. The holding companies were responsible forinitiating plans for the privatization of their constituent affiliated com-panies. Five methods of diluting public ownership have been used: sales toanchor investors, sales through the stock market, sales to Employee Share-holder Associations, sales of companies’ assets, and liquidations.
How successful was the first decade of the privatization program? It isnot possible to provide a unique litmus test, because the goals of privatiza-tion and the criteria for judging its success were never unambiguouslyidentified. However, some comments can be offered which, takentogether, can provide a basis for judgment.
First, one may look at how many companies out of the original portfo-lio of 314 had been divested. As of June 2000, the government had soldthe controlling interest in 118 enterprises, with a sales value of about LE12.3 billion; it had sold a minority interest in another 16 companies, witha sales value of about LE 1.87 billion. In terms of privatization receipts peryear as a share of GDP, the Egyptian program was rated by the IMF(1998a: 52) as the fourth most successful program in the world. Of thetotal sales proceeds, half was transferred to the Ministry of Finance toreduce the budget deficit, nearly 30 percent was allocated to settle debtsof the privatized companies to the commercial banks, and about 17percent was used to finance early-retirement schemes for labor in the pri-vatizing enterprises.
Second, using profitability as a measure of efficiency, the second half ofthe 1990s witnessed, on average, an improvement in the performance ofLaw 203 companies. The return on investment increased from 0.72 in1996 to 3.54 percent in 1999, while the net profit margin in the latter yearreached 8.1 percent compared to 1.20 percent in 1996. These average
80 Economic development and policymaking, 1987–2000

results, of course, concealed substantial variations in individual perform-ance. Moreover, these comparisons are not without their own problems;for example, an increase in profitability might simply reflect the exerciseof market power by a newly-privatized monopolist or oligopolist. This isespecially possible since the Egyptian reform program has not encom-passed laws to increase competition, and much of the empirical evidence– surveyed, for example, in Megginson and Netter (1999) – suggests that itis ownership together with competition and managerial freedom (e.g. inrespect of hiring and firing labor) that favors private over public owner-ship of business enterprise on efficiency and profitability grounds.
Third, a main reason for the government’s hesitation in launching theprivatization program was the effect that this would have on the laboremployed in the privatized enterprises. It was no secret that public enter-prises suffered from a surfeit of labor. Khattab (1999: 12–13) reportedthat in 1996 (i.e. before the main restructuring began), public enterprisescovered by Law 203/1991 employed 932,404 workers, and that theMinistry of the Public Enterprise Sector estimated that about 300,000 ofthem were redundant. It was inevitable that if these enterprises were to bemade attractive to the private sector, the excess labor would have to beshed.
Several measures were adopted to help cushion the impact. One wasthe creation of the Social Fund for Development which had as its prin-cipal aims the retraining of redundant labor so as to provide it withemployment opportunities in other sectors; the extension of credit andmarket information to permit some of the redundant workers to begintheir own small enterprises; and the construction and refurbishing ofinfrastructure through labor-intensive methods. Another importantmethod was the offer of early retirement packages. By the year 2000,approximately 110,000 employees had chosen to take these packages,which in general provided benefits equal to three years’ compensation.The total outlay on such packages from 1993 to 2000 was about LE 2.7billion, at an average cost of LE 25,000. Of course, what made the retire-ment packages affordable from the government’s point of view was thelow wages and benefits paid in the public sector. The IMF (1998: 55) cal-culated that reducing the labor force in the public enterprise sector by300,000 workers would require only a once-for-all payment of 2.5 percentof the GDP. Moreover, Egypt would not have to bear the entire burden, asinternational donors had offered to assist with part of the compensation.
The Public Enterprise Office estimated that total labor in public enter-prises dropped from just over one million in 1993 to under 600,000 by themiddle of 2000. This reduction resulted from: 220,000 workers transfer-ring to the private sector because their enterprises were privatized; about110,000 workers taking early retirement packages; and about 150,000being lost through normal attrition of leaving at full retirement age, ordeath.9
Economic development and policymaking, 1987–2000 81
Fourth, very little progress was made in privatizing the financial sector.The Egyptian financial system remained dominated by the banking sector, inparticular the four public sector commercial banks. These banks accountedfor 70 percent of total assets of the banking sector in 1990, and even by theend of the decade represented about 60 percent. Their portfolios wereheavily weighted by loans to the public sector and were judged to contain asubstantial proportion of weak or non-performing loans; Roe (1998: 5) putthe figure as high as 40–45 percent of the total portfolio. In 1991 the banksrequired a capital injection of LE 3.1 billion from the government in orderto meet the minimum capital adequacy ratio of 8 percent in relation to risk-weighted assets mandated by the Bank for International Settlements. At theend of the government’s fiscal year 2000, none of these four commercialbanks had been privatized, even partially. Similarly, the privatizationprogram had not touched any of the four public sector insurance com-panies, which accounted for over 90 percent of the market.
Fifth, because the more profitable enterprises were the first to be priva-tized, by 1997 loss-making enterprises accounted for one-third of the port-folio. This reduced the average profitability of the portfolio, slowed downthe pace of privatization, and compelled the authorities to look for differ-ent methods of divestiture. The preferred alternative for the governmentwas to sell to “anchor investors” who would invest resources in improvingthe performance of the company and increasing its attractiveness for salethrough the stock exchange or some other means. But finding suchinvestors and negotiating suitable terms with them was a time-consumingbusiness. The rate and method of privatization between 1993 and 2000 isshown in Table 3.1.
Sixth, despite the moves on privatization, by the end of the decade therate of private sector investment had hardly changed. Private investmentamounted to about 15 percent of GDP in 1987; it was about the same in2000. Public investment, on the other hand, dropped quite sharply fromover 12 percent of GDP in 1987 to 6 percent in 1994; even by 2000 it hadonly recovered to just over 7 percent. However, with the private sector notfilling in the gap, aggregate investment dropped from over 27 percent ofGDP in 1987 to 16 percent in 1993, and in 2000 was still only about 20percent.
Privatization was insufficient to call forth the investment expected fromthe private sector. This was a matter of some concern, because it frustratedthe ends of the government’s restructuring strategy. That strategy was toreduce the budgetary burden by cutting down sharply on public invest-ment, while at the same time encouraging the private sector to take up theslack, by giving it evidence of better treatment and by permitting it entryinto areas that previously had been off-limits. Of course, there was no wayto precisely synchronize the timing of the fiscal contraction with the privatesector response, but the absence of any significant response for a decademust prompt some questions about the assumptions of the strategy.
82 Economic development and policymaking, 1987–2000
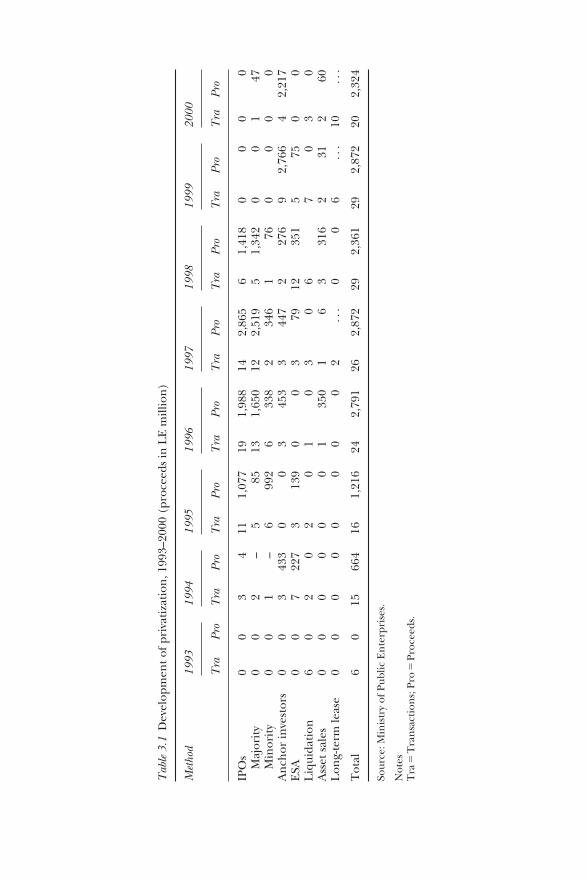
Tab
le 3
.1D
evel
opm
ent o
f pri
vati
zati
on, 1
993–
2000
(pr
ocee
ds in
LE
mill
ion
)
Met
hod
1993
1994
1995
1996
1997
1998
1999
2000
Tra
Pro
Tra
Pro
Tra
Pro
T
raPr
oT
raPr
oT
raPr
o
Tra
Pro
Tra
Pro
IPO
s0
03
411
1,07
719
1,98
814
2,86
56
1,41
80
00
0M
ajor
ity
00
2–
585
131,
650
122,
519
51,
342
00
147
Min
orit
y0
01
–6
992
633
82
346
176
00
00
An
chor
inve
stor
s0
03
433
00
345
33
447
227
69
2,76
64
2,21
7E
SA0
07
227
313
90
03
7912
351
575
00
Liq
uida
tion
60
20
20
10
30
67
03
0A
sset
sal
es0
00
00
01
350
16
331
62
312
60L
ong-
term
leas
e0
00
00
00
02
...
00
6..
.10
...
Tot
al6
015
664
161,
216
242,
791
262,
872
292,
361
292,
872
202,
324
Sour
ce: M
inis
try
of P
ublic
En
terp
rise
s.
Not
esT
ra�
Tra
nsa
ctio
ns;
Pro
�Pr
ocee
ds.
Nevertheless, the shares of value-added originating in the public andprivate sectors changed over the decade. According to the Ministry ofPlanning’s figures, the contribution of the public sector to GDP droppedfrom about 39 percent in 1992 to a little over 28 percent in 2000. Theshare of the private sector rose correspondingly. Some part of this changeresulted from a semantic sleight of hand, because from 1993 the com-panies about to be privatized under Law 203/1991 were classified as“private,” even while they remained in the public sector.
The 1991 program displayed a curious degree of one-sidedness wherestructural reform was concerned. A great deal of emphasis was put on theprivatization of public sector enterprises, and much of the subsequentevaluation of the program by the World Bank appeared to regard struc-tural reform as almost synonymous with privatization. This was unfortu-nate. While privatization was undoubtedly a crucial signal of thegovernment’s intent for the future direction of the economy, it could notby itself guarantee a more efficient use of resources; there was always thedanger that it could end up simply replacing public monopolies withprivate monopolies. The program thus overlooked a crucial lesson fromthe privatization experience of other countries, namely, that it is thecompetitive environment in which a firm operates, rather than whetherthe firm is publicly or privately owned, that is the more important factorin performance. It would therefore be overly simplistic to equate privatiza-tion with assured improvements in efficiency. The program proposed bythe international organizations would have been more effective had ittaken a broader approach to private sector development, in which privati-zation would play a key, but not virtually exclusive, role. Other crucial ele-ments of such a program would be institutional reform, especially theimplementation of a legal framework to strengthen competition withinthe private sector and between the private and public sectors. The absenceof such elements meant that the impact of the 1991 program on the struc-ture of the economy and on the vigor of its functioning would remainpartial and uneven.
84 Economic development and policymaking, 1987–2000

4 Growth, productivity, andstructural change, 1960–2000
The geographic and demographic characteristics of Egypt define its basiceconomic problem. Although the country comprises nearly 386,000square miles, only a narrow strip of 15,000 square miles in the Nile Valleyand the Delta is usable. Crammed into the habitable area is 98 percent ofthe population, estimated in mid-2000 at nearly 64 million, giving adensity of more than 4,000 per square mile.
The population of Egypt more than tripled from 19 million in 1947 tothe estimated 64 million in 2000.1 Population growth reached itsmaximum between 1976–86, when it touched 2.8 percent per annum;thereafter the rate fell, but by 2000 was still estimated at about 2 percent ayear. Urbanization increased rapidly, but appears to have leveled offtowards the end of the twentieth century, so that the proportion of thepopulation said to live in urban areas had actually decreased. However,the definition of “urban” in Egypt is somewhat arbitrary, and depends lessupon predictable criteria such as the pattern of land use or on the size ofthe population in the agglomeration, and more on administrativedecisions, the application of which is not always consistent (Table 4.1).
Despite land reclamation, the cultivated area increased by only about20 percent between 1947 and 2000. Intensive cultivation has to someextent moderated the effects of the deterioration in the man–land ratio,but even so the cropped area (the cultivated area times the croppingintensity) has increased only from 9.1 million feddans to about 12.8million.2 A feddan in 2000 was expected to support nearly five persons,compared with 2.1 in 1947. These two themes – the relative fixity of theusable land and the rapidly growing population – resonate as leitmotivs inany discussion of Egypt’s economic development, and fix a lower limit tothe increase in factor productivity required for the country to attain ameaningful level of per capita income growth.
Long-term trends in GDP
Any attempt to work with long-term data series is fraught with difficul-ties and the Egyptian case is no exception.3 Attempts at constructing
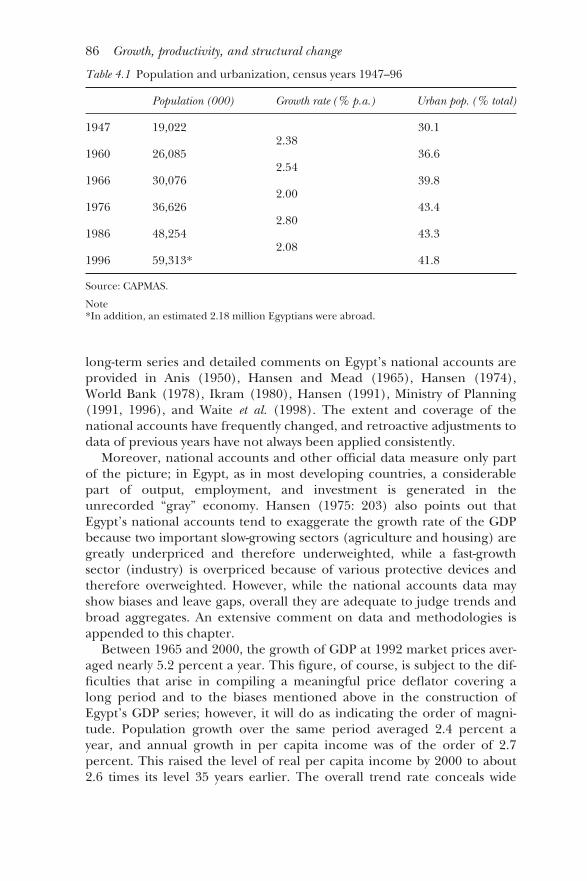
long-term series and detailed comments on Egypt’s national accounts areprovided in Anis (1950), Hansen and Mead (1965), Hansen (1974),World Bank (1978), Ikram (1980), Hansen (1991), Ministry of Planning(1991, 1996), and Waite et al. (1998). The extent and coverage of thenational accounts have frequently changed, and retroactive adjustments todata of previous years have not always been applied consistently.
Moreover, national accounts and other official data measure only partof the picture; in Egypt, as in most developing countries, a considerablepart of output, employment, and investment is generated in theunrecorded “gray” economy. Hansen (1975: 203) also points out thatEgypt’s national accounts tend to exaggerate the growth rate of the GDPbecause two important slow-growing sectors (agriculture and housing) aregreatly underpriced and therefore underweighted, while a fast-growthsector (industry) is overpriced because of various protective devices andtherefore overweighted. However, while the national accounts data mayshow biases and leave gaps, overall they are adequate to judge trends andbroad aggregates. An extensive comment on data and methodologies isappended to this chapter.
Between 1965 and 2000, the growth of GDP at 1992 market prices aver-aged nearly 5.2 percent a year. This figure, of course, is subject to the dif-ficulties that arise in compiling a meaningful price deflator covering along period and to the biases mentioned above in the construction ofEgypt’s GDP series; however, it will do as indicating the order of magni-tude. Population growth over the same period averaged 2.4 percent ayear, and annual growth in per capita income was of the order of 2.7percent. This raised the level of real per capita income by 2000 to about2.6 times its level 35 years earlier. The overall trend rate conceals wide
86 Growth, productivity, and structural change
Table 4.1 Population and urbanization, census years 1947–96
Population (000) Growth rate (% p.a.) Urban pop. (% total)
1947 19,022 30.12.38
1960 26,085 36.62.54
1966 30,076 39.82.00
1976 36,626 43.42.80
1986 48,254 43.32.08
1996 59,313* 41.8
Source: CAPMAS.
Note*In addition, an estimated 2.18 million Egyptians were abroad.
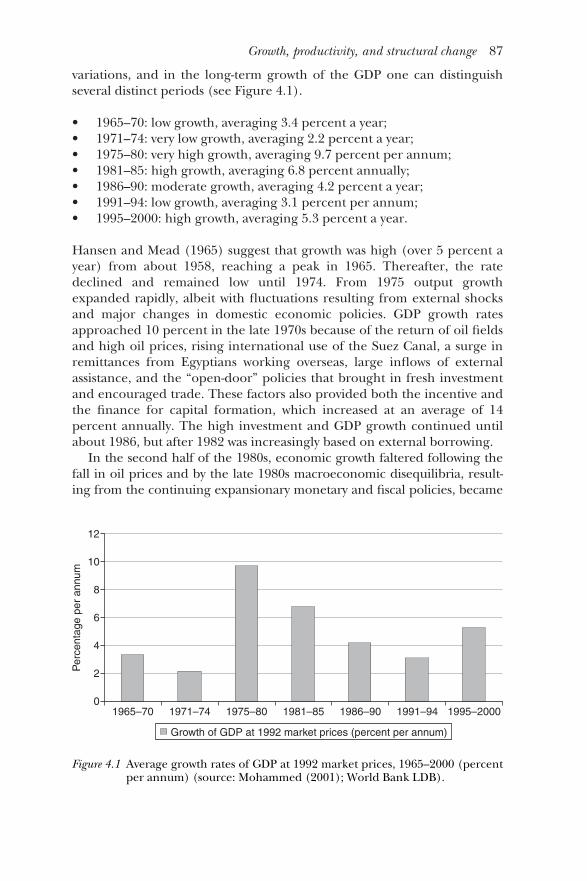
variations, and in the long-term growth of the GDP one can distinguishseveral distinct periods (see Figure 4.1).
• 1965–70: low growth, averaging 3.4 percent a year;• 1971–74: very low growth, averaging 2.2 percent a year;• 1975–80: very high growth, averaging 9.7 percent per annum;• 1981–85: high growth, averaging 6.8 percent annually;• 1986–90: moderate growth, averaging 4.2 percent a year;• 1991–94: low growth, averaging 3.1 percent per annum;• 1995–2000: high growth, averaging 5.3 percent a year.
Hansen and Mead (1965) suggest that growth was high (over 5 percent ayear) from about 1958, reaching a peak in 1965. Thereafter, the ratedeclined and remained low until 1974. From 1975 output growthexpanded rapidly, albeit with fluctuations resulting from external shocksand major changes in domestic economic policies. GDP growth ratesapproached 10 percent in the late 1970s because of the return of oil fieldsand high oil prices, rising international use of the Suez Canal, a surge inremittances from Egyptians working overseas, large inflows of externalassistance, and the “open-door” policies that brought in fresh investmentand encouraged trade. These factors also provided both the incentive andthe finance for capital formation, which increased at an average of 14percent annually. The high investment and GDP growth continued untilabout 1986, but after 1982 was increasingly based on external borrowing.
In the second half of the 1980s, economic growth faltered following thefall in oil prices and by the late 1980s macroeconomic disequilibria, result-ing from the continuing expansionary monetary and fiscal policies, became
Growth, productivity, and structural change 87
Per
cent
age
per
annu
m
12
0
2
4
6
8
10
Growth of GDP at 1992 market prices (percent per annum)
1965–70 1971–74 1975–80 1981–85 1986–90 1991–94 1995–2000
Figure 4.1 Average growth rates of GDP at 1992 market prices, 1965–2000 (percentper annum) (source: Mohammed (2001); World Bank LDB).

apparent. The government addressed these difficulties through a programof stabilization and structural reform beginning in 1991. After a slowdownin economic activity in the early 1990s, growth resumed in the mid-1990s.
Subsequent sections in this chapter identify the factors that under-pinned Egypt’s growth trajectory by analyzing the sectoral, factor, anddemand contribution to growth.
Structural changes in GDP
Economic growth in Egypt has been associated with significant changes inthe structure of the economy and the relative importance of the variouseconomic sectors; these are shown in Figure 4.2. Throughout 1965–2000,the services sector accounted for at least about 50 percent of GDP and itscontribution to GDP growth was more than commensurate with its size.Within the services sector, trade, government and personal services, trans-portation, and tourism were the most dynamic sub-sectors. The share ofagriculture declined steadily. The contribution of manufacturing movedaround, but did not exceed 20 percent of GDP. The share of the petro-leum sector fluctuated widely, depending on movements in world oilprices.
The national accounts probably understate the size of the services sectorin the economy, in particular by not fully reflecting the contribution of thetourism component to total output. Value-added in tourism is measured inthe national accounts by the contribution of hotels and restaurants. Com-puted according to this methodology, tourism is estimated to contribute 1percent of GDP, 1 percent of total employment, and 28 percent of foreignexchange earnings. More detailed investigations by Tohamy and Swinscoe(2000) showed that when the indirect effects of the sub-sector were
88 Growth, productivity, and structural change
70
Per
cent
age
60
50
40
30
20
10
01965 1970 1980 1990 2000
ServicesManufacturing PetroleumAgriculture
Figure 4.2 Structure of GDP, 1965–2000 (percent) (source: World Bank LDB).

included, the contribution of tourism spending exceeded 4 percent ofGDP and in certain years reached nearly 10 percent of GDP.
The share of the industrial sector in Egypt’s total output remained con-stant – at about a third of GDP – throughout the last four decades. Withinthat sector, however, the share of manufacturing increased to 18.5 percentof GDP in 2000 from less than 15 percent in the early 1980s. The contri-bution of the manufacturing sector to GDP growth has been more com-mensurate with its share in total output. The oil and construction sectorseach contributed about 6 percent of GDP in the late 1990s.
The share of petroleum in GDP after the return of the oil fields in Sinaiand the Gulf of Suez after the 1973 war was modest in the first years.However, it rose sharply and peaked in the early 1980s, when it reachedmore than 18 percent of GDP. Oil prices fell from 1982; this was not com-pensated for by increased production and the share of the sector con-tinued to decline in the subsequent period. It fell to about 4 percent inthe late 1980s; recovered slightly in the early 1990s, and again started todecline from 1993, reaching about 5 percent of GDP in 2000.
The importance of oil to the economy of Egypt, especially after about1976 when production had reached a significant level, can be seen inFigure 4.3, which shows how closely movements in the growth of GDPtracked movements in oil prices.
As in many other middle-income countries, the contribution of agricul-ture in Egypt’s total output continued to decline, dropping to about 15percent in the late 1990s from about a third of GDP in the 1960s. Agricul-ture’s contribution to GDP growth also declined to about 10 percent,mainly as a result of the slow growth of the sector. Agricultural growthaveraged only 2.7 percent annually during 1965–2000, just a little ahead ofthe population growth. Much of the expansion in agricultural value-addedresulted from intensive cultivation, although land reclamation did some-what extend the boundaries of the cultivated area. Total area under culti-vation represents about 4 percent of the total land area of Egypt.
Growth, productivity, and structural change 89
Gro
wth
rat
es (
perc
enta
ge) 16 O
il prices (US
$ per barrel)
4014121086420 0
5101520253035GDP growth rates (percentage)
Oil prices (US$ per barrel)
1974 1976 1978 1980 1982 1984 1986 1988 1990 1992 1994 1996 1998 2000
Figure 4.3 GDP growth and oil prices, 1974–2000 (source: World Bank LDB. Oilprices (Gulf of Suez Mix crude) from the Egyptian General PetroleumCorporation).
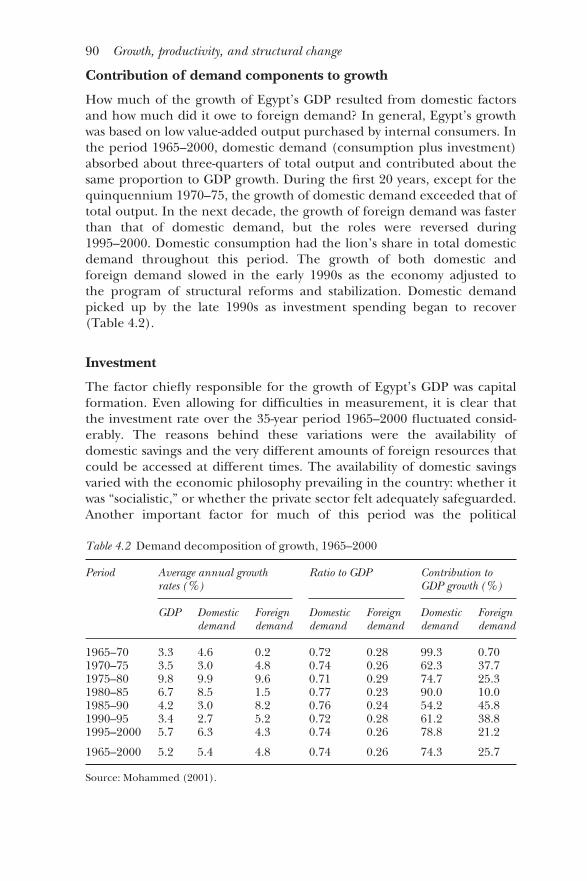
Contribution of demand components to growth
How much of the growth of Egypt’s GDP resulted from domestic factorsand how much did it owe to foreign demand? In general, Egypt’s growthwas based on low value-added output purchased by internal consumers. Inthe period 1965–2000, domestic demand (consumption plus investment)absorbed about three-quarters of total output and contributed about thesame proportion to GDP growth. During the first 20 years, except for thequinquennium 1970–75, the growth of domestic demand exceeded that oftotal output. In the next decade, the growth of foreign demand was fasterthan that of domestic demand, but the roles were reversed during1995–2000. Domestic consumption had the lion’s share in total domesticdemand throughout this period. The growth of both domestic andforeign demand slowed in the early 1990s as the economy adjusted tothe program of structural reforms and stabilization. Domestic demandpicked up by the late 1990s as investment spending began to recover(Table 4.2).
Investment
The factor chiefly responsible for the growth of Egypt’s GDP was capitalformation. Even allowing for difficulties in measurement, it is clear thatthe investment rate over the 35-year period 1965–2000 fluctuated consid-erably. The reasons behind these variations were the availability ofdomestic savings and the very different amounts of foreign resources thatcould be accessed at different times. The availability of domestic savingsvaried with the economic philosophy prevailing in the country: whether itwas “socialistic,” or whether the private sector felt adequately safeguarded.Another important factor for much of this period was the political
90 Growth, productivity, and structural change
Table 4.2 Demand decomposition of growth, 1965–2000
Period Average annual growth Ratio to GDP Contribution to rates (%) GDP growth (%)
GDP Domestic Foreign Domestic Foreign Domestic Foreign demand demand demand demand demand demand
1965–70 3.3 4.6 0.2 0.72 0.28 99.3 0.701970–75 3.5 3.0 4.8 0.74 0.26 62.3 37.71975–80 9.8 9.9 9.6 0.71 0.29 74.7 25.31980–85 6.7 8.5 1.5 0.77 0.23 90.0 10.01985–90 4.2 3.0 8.2 0.76 0.24 54.2 45.81990–95 3.4 2.7 5.2 0.72 0.28 61.2 38.81995–2000 5.7 6.3 4.3 0.74 0.26 78.8 21.2
1965–2000 5.2 5.4 4.8 0.74 0.26 74.3 25.7
Source: Mohammed (2001).

situation in the Middle East, which determined the amount of resourcesdevoted to defence (which meant increases in government consumption).
Variations in the investment rate during 1965–2000 are shown inFigure 4.4. For the most, investment hovered at around 17–20 percent ofGDP. Immediately after the opening of the economy in 1973 by the rapidinflow of foreign aid, worker remittances, and earnings from oil exportssharply raised gross investment so that it touched 35 percent of the GDP.Even after international oil prices began dropping from 1982, the invest-ment rate remained high, but especially after 1987 was increasinglyfinanced by external borrowing. By the early 1990s the situation could notbe sustained and the investment rate declined sharply. By 2000, invest-ment had recovered somewhat but was still well below its earlier heights.
A caution is in order when considering rates of investment. Bruton(1983: 684–5) argues that (a) a significant part of what is described as“investment” in Egypt would be classified as “maintenance” in other coun-tries; and (b) that investment in the 1970s was heavily concentrated in asmall number of projects, and that net investment, over much of theeconomy, was negative for many years before and after 1974.
Decomposing the investment series into fixed investment and changesin inventories shows that the spike in aggregate investment in 1975–76resulted partly from a surge in inventory accumulation following theopening up of the economy. Another boost in inventory accumulationoccurred in 1997–99. During the latter period, inventories initially wereincreased as a deliberate measure with importers taking advantage ofexchange rate devaluations by the East Asian countries hit by a financialcrisis in July 1997. Towards the end of the Millennium, Egypt wentthrough a liquidity squeeze; this reduced aggregate demand, and by 2000much inventory accumulation was involuntary. I need hardly warn thatfigures for changes in inventories need to be viewed with even greatercaution than those for fixed investment.
Growth, productivity, and structural change 91
Per
cent
age
of G
DP
mar
ket p
rices 40
0
5
10
15
20
25
30
35
1965 1967 1969 1971 1973 1975 1977 1979 1981 1983 1985 1987 1989 1991 1993 1995 19991997
GDI/GDP (market prices) GDS/GDP (market prices)
Figure 4.4 Investment and savings, 1965–2000 (percent of GDP) (source: WorldBank LDB).

The gap between investment and savings observed in Figure 4.4 under-lines the role of external resources. During the entire period 1965–2000,the investment rate was higher than the savings rate – at times verymarkedly. The overall domestic savings rate seldom exceeded 20 percentof GDP, mainly because the public sector saved very little or was a net dis-saver. Private savings over the 35-year period fluctuated between 10 and 30percent of GDP.
During 1965–2000, the relative shares of private and public investmentchanged significantly. Not surprisingly, the period of Arab socialism saw asubstantial increase in the share of public investment in the total. Privateinvestment increased with the liberalization of the economy after 1973,and assumed the dominant role following the structural adjustmentreforms of 1991. These developments are illustrated in Figure 4.5.
The foregoing discussion must be regarded only as indicating theapproximate trend. Egypt’s national accounts do not disaggregate invest-ment into private and public components; hence, capital expendituresfrom government finance statistics must be used as a proxy for publicinvestment. The residual is considered to be private investment, eventhough this may somewhat overstate the actual level. This issue is particu-larly important for the data of the 1990s, because of a semantic confusion.In 1991, the 314 public enterprises that were being prepared for privatiza-tion under Law 203/1991 were classified as “private sector.” By 2000, onlyabout half the enterprises had actually been privatized, but the otherswere still considered as belonging to the private sector even though theyremained in public ownership.
The determinants of private consumption
An investigation by the World Bank (1993a, vol. 1: 57–9; vol. 3: 21–7) ofthe determinants of private consumption behavior in Egypt during
92 Growth, productivity, and structural change
100
Per
cent
age
of G
DF
I
0
20
40
60
80
19701965 1975 1980 1985 1990 1995 2000
Public investment Private investment
Figure 4.5 Public and private investment, 1965–2000 (percent of Gross DomesticFixed Investment) (source: MOP).

1960–90 suggested that private consumption was heavily dependent oncurrent private disposable income (including worker remittances) andrather weakly on permanent private disposable income. Broad moneyholdings exerted a positive and very significant influence. This indicatedthe dominant influence on consumption of liquidity or borrowing con-straints. The availability of foreign saving also played an important role inconstraining private consumption; about 40 percent of any increase inforeign saving went to private consumption, while the remainder went tofinance either government consumption or gross investment.
The study found a strong positive relation between government savingsand private consumption (and hence a strong inverse relation betweengovernment and private savings): private saving declined by LE 0.63 (i.e.private consumption increased) for each additional LE 1 in (permanent)government savings.4 The report attributed this result to a direct “crowd-ing-out” of private savings by public savings because of a combination offinancial repression and controls on consumer imports and on privatecapital outflows. This crowding-out effect was stronger if higher publicsaving came from lower public expenditure. It was weaker when thehigher public saving resulted from higher taxes.
Private consumption did not respond much to domestic inflation,domestic real interest rates, or foreign real interest rates. The non-significance of both domestic and foreign real interest rates was consistentwith other cross-country studies, which showed that consumption in devel-oping countries was interest-insensitive. These findings suggested that afinancial reform that raised domestic real interest rates might not beeffective in raising private saving. The role of interest rates was moreimportant for the better allocation of resources. The study compared theresults for Egypt with those for a representative group of developing coun-tries and found that the marginal propensity to consume out of perman-ent income was slightly lower in Egypt than in other developing countries,while the marginal propensity to consume out of current income wasslightly higher.
The study provided in some measure a test between the Keynesianhypothesis in which only current income determines private consumption,and the Friedman permanent income hypothesis, under which onlypermanent income is relevant for the determination of consumption. Theresult showed that the propensity to consume out of current income wassignificantly higher than out of permanent income. This suggested that con-sumption was not smoothed and that in Egypt, Keynesian-type or liquidity-constrained consumers tended to dominate aggregate consumption.
The study also rejected the presence of strict Ricardian equivalence.5
Under Ricardian equivalence, a rise in public saving will not inducechanges in private consumption if it results from a tax increase, while itwill induce a rise in private consumption if it stems from a reduction ingovernment expenditure. However, as the paper pointed out, if the
Growth, productivity, and structural change 93
government can extract resources from the private sector directly, forexample through financial repression and/or foreign trade restrictions,crowding-out of private consumption will occur directly. The results fromthe model suggested the occurrence of direct crowding-out of privatesaving by public saving, not ultra-rational forward-looking behavior by con-sumers.
Economic growth and employment
The creation of productive employment is the main challenge for eco-nomic policy in developing countries since it is the most effective methodof reducing poverty. However, it is not easy to obtain an accurate pictureof long-term developments in labor force and employment in Egypt. Thedata come from different sources, time periods are not always uniform,and definitions and concepts have changed over the years. A detailedreview of the data and literature will be found in Chapter 8; here only ageneral overview is provided. Developments in population, labor force,and employment between the years 1960–2000 can be seen in Table 4.3.
The broad trends shown in the table are probably accurate, but thedata for specific years (particularly the employment figures for 1976 and1986) might be suspect; some work by Fergany (1991) and Assaad (1997)suggests an unemployment figure of two million in 1986. The data suggestthat open unemployment was not a problem in the sixties (although thismay largely be just a definitional artifact); it then increased steadily, andstarted to come down from about the middle of the 1990s (Figure 4.6).
Between 1960–2000 population increased at a rate of 2.35 percent ayear; the labor force grew marginally slower, averaging 2.28 percent ayear; while employment increased at an even slower average of about 2.10percent a year. At the end of the period, the official figures show thatthere were about 1.3 million persons in the labor force who were notemployed. Official data in Egypt estimated unemployment at 7.4 percentof the labor force in 2000, while independent estimates such as Radwan(1998) would put it at about 10–13 percent. In part these differences arise
94 Growth, productivity, and structural change
Table 4.3 Labor force and employment, 1960–2000 (millions and percent)
1960 1966 1970 1976 1986 1992 1996 2000
Population 26.1 30.1 33.3 36.6 48.3 53.7 59.3 63.3Labor force 7.8 8.4 8.8 11.5 12.9 15.1 17.2 18.9Employment 7.7 8.3 8.4 9.6 12.2 13.7 15.8 17.4Unemployment 0.1 0.1 0.4 1.9 0.7 1.4 1.4 1.5Participation rate (% of pop.) 29.8 27.9 26.4 31.4 26.7 28.1 29.1 29.9Unemployment rate (% of lab. force) 1.3 1.2 4.5 16.5 5.4 9.2 8.1 7.9
Source: MOP; World Bank (1966, 1969).
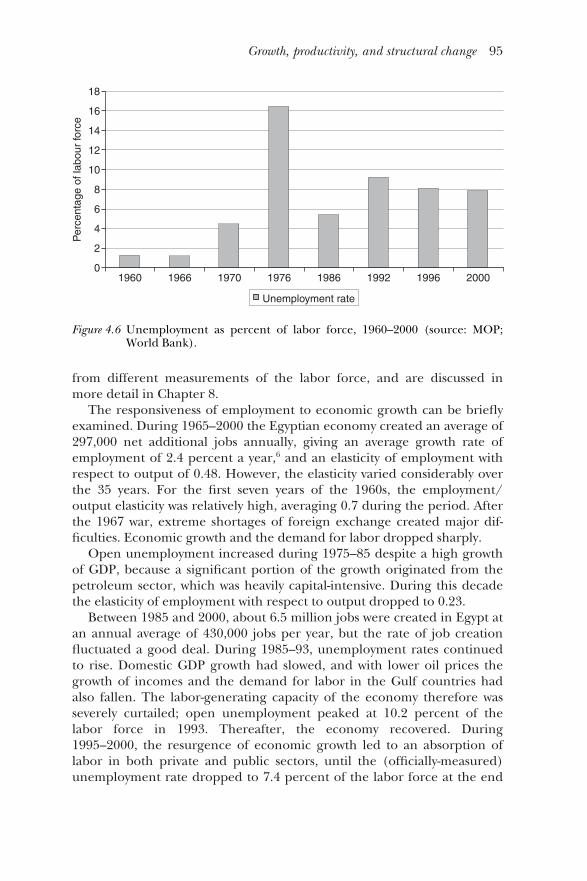
from different measurements of the labor force, and are discussed inmore detail in Chapter 8.
The responsiveness of employment to economic growth can be brieflyexamined. During 1965–2000 the Egyptian economy created an average of297,000 net additional jobs annually, giving an average growth rate ofemployment of 2.4 percent a year,6 and an elasticity of employment withrespect to output of 0.48. However, the elasticity varied considerably overthe 35 years. For the first seven years of the 1960s, the employment/output elasticity was relatively high, averaging 0.7 during the period. Afterthe 1967 war, extreme shortages of foreign exchange created major dif-ficulties. Economic growth and the demand for labor dropped sharply.
Open unemployment increased during 1975–85 despite a high growthof GDP, because a significant portion of the growth originated from thepetroleum sector, which was heavily capital-intensive. During this decadethe elasticity of employment with respect to output dropped to 0.23.
Between 1985 and 2000, about 6.5 million jobs were created in Egypt atan annual average of 430,000 jobs per year, but the rate of job creationfluctuated a good deal. During 1985–93, unemployment rates continuedto rise. Domestic GDP growth had slowed, and with lower oil prices thegrowth of incomes and the demand for labor in the Gulf countries hadalso fallen. The labor-generating capacity of the economy therefore wasseverely curtailed; open unemployment peaked at 10.2 percent of thelabor force in 1993. Thereafter, the economy recovered. During1995–2000, the resurgence of economic growth led to an absorption oflabor in both private and public sectors, until the (officially-measured)unemployment rate dropped to 7.4 percent of the labor force at the end
Growth, productivity, and structural change 95
Per
cent
age
of la
bour
forc
e18
0
2
4
6
8
10
12
14
16
1960 1966 1970 1976 1986 1992 1996 2000
Unemployment rate
Figure 4.6 Unemployment as percent of labor force, 1960–2000 (source: MOP;World Bank).

of the Millennium.7 A substantial part of this growth emanated from theoil industry; reflecting this the elasticity of employment to GDP declinedto 0.56 during the last five years (from 0.79 in 1990–95).
Of those employed, 35 percent were in the public sector (28.6 percentand 6.8 percent in the central government and public enterprises sectorrespectively), while 65 percent of total employment took place in theprivate sector (including agriculture and self-employed). The centralgovernment employed about 1.4 million persons, the public serviceauthorities about 0.5 million, and the regional and local governments 3.1million persons. The rate of growth of public employment declined sub-stantially since 1997, but the share of the government in the total civilianlabor force fell only slightly.
The structural transformation of the economy during 1960–2000, witha decline in the share of agriculture and an increase in that of services inthe GDP, was mirrored in the pattern of employment (Figure 4.7). Mostof the jobs created during this period were in the services sector (61percent) followed by the industrial sector (27 percent), while additionalemployment in agriculture constituted only 12 percent of total employ-ment.
The characteristics of unemployment in Egypt at the end of the Millen-nium revealed important factors in the labor market. First, unemploymentdisproportionately affected the younger age groups. It peaked among theage group of 15–25 years (27.5 percent compared to an overall average of7.4 percent in 2000). This group also remained unemployed for longerthan the average period. Second, and a matter that is of concern, the inci-dence of unemployment was higher among these with intermediate edu-cation (19 percent) and university graduates (12 percent) than amongilliterates, for whom the unemployment rate was only 1 percent. This
96 Growth, productivity, and structural change
100
0
10
20
30
40
50
60
70
80
90
Per
cent
age
of to
tal e
mpl
oym
ent
1960 1965 1970 1975 1980 1985 1990 1995 2000
ServicesAgriculture Industry
Figure 4.7 Structure of employment, 1960–2000 (percent of total employment)(source: CAPMAS; World Bank reports (1960, 1966)).
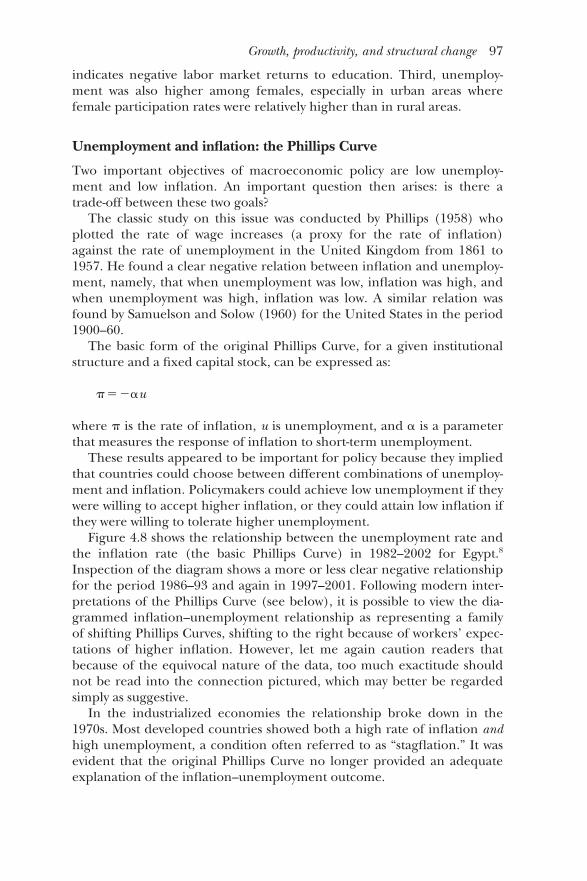
indicates negative labor market returns to education. Third, unemploy-ment was also higher among females, especially in urban areas wherefemale participation rates were relatively higher than in rural areas.
Unemployment and inflation: the Phillips Curve
Two important objectives of macroeconomic policy are low unemploy-ment and low inflation. An important question then arises: is there atrade-off between these two goals?
The classic study on this issue was conducted by Phillips (1958) whoplotted the rate of wage increases (a proxy for the rate of inflation)against the rate of unemployment in the United Kingdom from 1861 to1957. He found a clear negative relation between inflation and unemploy-ment, namely, that when unemployment was low, inflation was high, andwhen unemployment was high, inflation was low. A similar relation wasfound by Samuelson and Solow (1960) for the United States in the period1900–60.
The basic form of the original Phillips Curve, for a given institutionalstructure and a fixed capital stock, can be expressed as:
����u
where � is the rate of inflation, u is unemployment, and � is a parameterthat measures the response of inflation to short-term unemployment.
These results appeared to be important for policy because they impliedthat countries could choose between different combinations of unemploy-ment and inflation. Policymakers could achieve low unemployment if theywere willing to accept higher inflation, or they could attain low inflation ifthey were willing to tolerate higher unemployment.
Figure 4.8 shows the relationship between the unemployment rate andthe inflation rate (the basic Phillips Curve) in 1982–2002 for Egypt.8
Inspection of the diagram shows a more or less clear negative relationshipfor the period 1986–93 and again in 1997–2001. Following modern inter-pretations of the Phillips Curve (see below), it is possible to view the dia-grammed inflation–unemployment relationship as representing a familyof shifting Phillips Curves, shifting to the right because of workers’ expec-tations of higher inflation. However, let me again caution readers thatbecause of the equivocal nature of the data, too much exactitude shouldnot be read into the connection pictured, which may better be regardedsimply as suggestive.
In the industrialized economies the relationship broke down in the1970s. Most developed countries showed both a high rate of inflation andhigh unemployment, a condition often referred to as “stagflation.” It wasevident that the original Phillips Curve no longer provided an adequateexplanation of the inflation–unemployment outcome.
Growth, productivity, and structural change 97

Some economists – notably Friedman (1968) and Phelps (1967) – main-tained that the Phillips Curve represented only a short-term relationship.They argued that a trade-off as described by the curve could exist only ifworkers continually underestimated the future inflation rate and persistedin the belief that their real wages had increased. Under these conditionsmore labor would be offered, and therefore a higher level of nominalwages would be associated with lower unemployment. However, it is unreal-istic to assume that workers would forever fail to notice that the actual infla-tion rate invariably exceeded their prediction. A more realistic assumptionis that workers would learn from their mistakes and keep adjusting theirexpectations of the inflation rate in the coming period until they got itright. More labor would only be offered at higher real wages. Thus thetrade-off between unemployment and the inflation rate would disappear.The long-run Phillips Curve would be vertical and located at the “naturalrate of unemployment,” which Friedman defined as the rate of unemploy-ment at which inflation did not increase – which is why it is frequentlycalled the Non-Accelerating Inflation Rate of Unemployment, or NAIRU –and below which the unemployment rate could not be sustained.
The modern formulation of the short-run Phillips Curve – the “expecta-tions-augmented Phillips curve” – incorporates the role of expectations. Inthis version, the rate of inflation depends upon expected inflation, andthe difference between actual unemployment and the NAIRU (i.e. short-term or cyclical unemployment). Thus a basic form of the equation forthe relation between inflation and unemployment is:
���e ��(u�u*)
98 Growth, productivity, and structural change
Unemployment (percentage)
Infla
tion
(per
cent
age)
30
121086420
25
20
15
10
5
0
84838285
86
8788
8991
90
9293
95 9496
97 98992000 2001
2002
Figure 4.8 Unemployment and inflation in Egypt (The Phillips Curve), 1982–2002(percent) (source: MOP; World Bank LDB).

where � is the inflation rate, �e the expected inflation rate, u actualunemployment, u* the NAIRU, and � is a parameter that measures theresponse of inflation to short-term unemployment. More complex modelsincorporate additional variables to represent import prices, productivitygrowth, real wages, supply shocks, and so on.
In spite of the amount of time and space devoted to discussions andestimates of the NAIRU, its usefulness for directing policy is not settled.Staiger et al. (1997) investigated the precision of estimates of the NAIRUfor the United States and found that the conventional confidence inter-vals were very large – a typical 95 percent confidence interval for theNAIRU in 1990 ranged between 5.1 percent to 7.7 percent. This impreci-sion remained in spite of the natural rate being modeled in several differ-ent ways, using monthly or quarterly data, and using various measures forexpected inflation. The imprecision led the authors to urge caution inusing the NAIRU to guide monetary policy. In another recent review,Atkeson and Ohanian (2001) examined the accuracy of inflation forecastsfrom NAIRU Phillips Curve-based models with a naive forecast by compar-ing the root mean squared error (RMSE) of the two sets of forecasts. Theyfound that over the previous 15 years, most of the major models (includ-ing those used by the Federal Reserve System of the United States) had onaverage been no more accurate than the forecast from a naive modelwhich said that inflation over the next year would be equal to inflationover the previous year. In a similar vein, Pisani-Ferry (2000: 58) pointed tothe uncertainty attending on measurements of the level of the NAIRU forEuropean countries (and in particular for these estimates often to simplyfollow movements of the actual unemployment level), and expressed skep-ticism concerning the operational content of the concept in Europe.9
Pesaran and Smith (1995: 203–4) point out that such models containtwo types of unobservables – the natural rate of unemployment (i.e. theNAIRU) and the expected rate of inflation. To be able to model themempirically, one must make auxiliary assumptions about the determinantsof the natural rate of unemployment and the manner in which inflationexpectations are formed. The manner of dealing with each of these hasbeen contentious. For example, is expected inflation (�e
t) to be formed by“adaptive expectations” (the assumption adopted by Friedman), or by“rational expectations” (as assumed by writers such as Lucas, Sargent, andBarro)? In the case of adaptive expectations, expected inflation is gener-ally modeled as the actual inflation rate in the previous year, i.e. �e
t ��t�1.
Of course, it is not necessary to posit that expectations adapt completelyin one year (or other period chosen). It is also possible to use a laggedadjustment; for example, that the rate of inflation expected by workers isa weighted average of past inflation rates, with the weights decreasingover time (thus giving more importance to inflation rates in morerecent years than to those further away in time). In the case of rationalexpectations, expected inflation is often modeled as the mathematical
Growth, productivity, and structural change 99

expectation of the inflation rate (because this is the best predictor of theinflation rate).10
Following Ball and Mankiw (2002: 134) we can sum up as follows. Theconcept of the NAIRU might be tenable, in that shifts in aggregatedemand (created, for example, by monetary policy) drive inflation andunemployment in opposite directions, and one could believe that, in theshort run at least, there exists an unemployment rate at which inflation isstabilized. However, there are severe practical difficulties in measuring theNAIRU, not least because it changes over time for reasons on which thereis little agreement. This makes it a rather dubious instrument for guidingpolicy. Data limitations and inadequate knowledge of the working of labormarkets (such as the real strength and role of the trade and professionalunions), of the formation of expectations, and of the determinants ofinflation make the use of NAIRU-type analysis even more moot in Egypt.
As if to confirm this, the results of the few experiments with NAIRU-based models for Egypt have been ambiguous. The overall implicationfrom equations estimated by the World Bank (under the assumption ofsimple adaptive expectations, i.e. �e
t ��t�1) was that rather substantialincreases in unemployment would be required for rather modest reduc-tions in inflation. It is possible that the model was misspecified, and hencethe estimator of the coefficients of the included variables was biased; inparticular, the role of the prices of imports in determining domesticprices in Egypt may not have been sufficiently taken into account.However, another serious weakness was that the results were very sensitiveto the choice of years over which the model was estimated, with the steep-ness of the Phillips curve differing sharply depending upon the sub-periodselected. In view of the major responsibility assigned to the Central Bankof Egypt for targeting inflation, a significant amount of work will berequired in the area of unemployment and inflation to develop modelsthat can provide a useful guide to policy.
Economic growth and investment
Economic growth in Egypt was driven chiefly by capital formation. Studiesof the contribution of the different factors of production to output growth(examined later in this chapter) suggest that up to two-thirds of growthwas attributable to physical capital accumulation, one-third to human-capital adjusted labor, and virtually nothing to the growth of total factorproductivity.
Investment rates averaging close to 30 percent of GDP during 1975–85produced a rapid growth of output.11 A sharp decrease in investment toabout 19 percent of GDP after the introduction of the stabilizationprogram in the early 1990s resulted in some years of low economicgrowth. Private investment recovered somewhat in the late 1990s, and withit the GDP growth rate also improved. However, El-Gamal and Bisat
100 Growth, productivity, and structural change

(1999) argue that in the 1990s, private investment targeted sectors withartificially high short-term profitability (high yield but short-lived capital)with increased capital depreciation rates, and that there was a reductionin Total Factor Productivity.
While public investment fell in the post-stabilization period by about 8percent of GDP, private sector investment did not fill the ensuing gap andtotal investment was under 20 percent of GDP during 1990–97. Totalinvestment picked up gradually in 1997–2000. Gross domestic savingsmore or less depicted the same trend as investment, increasing from 9percent of GDP in the early 1970s to 16 percent in the late 1970s and theearly 1980s. Domestic savings remained only about 13–14 percentthroughout 1990–2000. Table 4.4 shows savings and investment ratios forfive-year periods during 1965–2000 (Figure 4.4 shows annual relation-ships).
Economic growth and Total Factor Productivity
Output per head may increase in an economy because of differentreasons. First, firms may be using more capital-intensive methods of pro-duction. Second, capital and labor, the main factors of production, maybe more fully utilized. Third, resources may be used more efficiently.
A crucial question for development policy is: what has each factor ofproduction contributed to the growth of output? Growth in the neoclassi-cal framework stems from two sources: factor accumulation and productiv-ity growth.12 The relative weight of each of these sources carries importantimplications for policy. If growth is largely the result of applying moreinputs of labor and capital, then the authorities should concentrate onone set of policies – for example, encouraging higher participation bywomen in the labor force and permitting quicker write-offs of capitalequipment for tax purposes. If, however, the main driver of economicgrowth is increased productivity, then another set of policies – such as
Growth, productivity, and structural change 101
Table 4.4 Investment and savings ratios, 1965–2000 (percent of GDP)
1966– 1971– 1976– 1981– 1986– 1991– 1996–70 75 80 85 90 95 2000
Gross domestic investment 14.6 19.5 30.2 28.1 29.4 18.8 20.4Gross domestic fixed investment 13.1 15.3 25.5 27.1 28.4 18.7 18.9
Public sector 11.9 13.5 19.6 20.7 14.1 7.4 5.7Private sector 1.3 1.7 5.8 6.6 15.8 11.3 13.2
Change in stocks 1.6 4.2 4.7 1.1 0.9 0.2 1.5Gross domestic savings 11.0 8.5 15.5 15.1 16.1 13.3 14.2
Source: Mohammed (2001), World Bank LDB.
NoteFigures may not add up because of rounding.
greater emphasis on education and more support for research and devel-opment – would be the appropriate choice. Since questions of productiv-ity loom so large in contemporary discussions of sustainable growth, it isworthwhile examining the issue in some detail.
The modern analysis of the contribution of the different factors of pro-duction to output growth was initiated by Solow (1957). He decomposedthe sources of GDP growth into the contributions of capital and labor,and found that these did not account for the entire growth. A substantialresidual remained, and this he identified with “technical progress.” Solowestimated that for the period 1909–49 the average annual growth of totalGDP in the United States was 2.9 percent. Of this, he concluded that 0.32percentage points (i.e. 11 percent) was attributable to capital accumula-tion, 1.09 percentage points (38 percent) to increases in labor, and theremaining 1.49 percentage points (51 percent) came as a result of tech-nical progress. This pattern appears to have stood the test of time reason-ably well; for example, Denison (1985) examining the period 1929–82 forthe United States came to broadly similar conclusions.
The neoclassical model used in these studies relates the level of realoutput to the levels of three inputs – labor, capital, and productivity. Thelatter is assumed to augment both labor and capital equally, essentiallyincreasing their individual productivities, and is thus generally termedTotal Factor Productivity (TFP). The growth of total output depends uponthe rate of productivity growth, the elasticity of output with respect tocapital (i.e. the percentage increase in output resulting from a 1 percentincrease in the capital stock) multiplied by the rate of growth of capital,and the elasticity of output with respect to labor multiplied by the rate oflabor growth. These elasticities can be interpreted as the marginal prod-ucts of the relevant factors, and under the assumptions of constant returnsto scale and perfect competition can be proxied by the share of that factorin GDP. The growth in TFP is defined as a residual, namely, the portion ofgrowth in output not explained by the growth of inputs; it is the increasein output that would occur as a result of improvements in the methods ofproduction, with all inputs unchanged.
Although the measurement of technical progress in this manner isextremely widespread, the assumptions on which it is based should benoted and the results interpreted in the light of the limitations. First, theexercise faces a number of technical and data difficulties. To begin with,the measurement of the capital stock runs into serious conceptual prob-lems; these were the focus of an extensive debate, initiated by theexchanges between Joan Robinson and Robert Solow.13 Once past theconceptual difficulties, data problems are not insignificant; for example,Jorgensen and Griliches (1967) maintained that the residual appearedsimply because inputs, particularly capital, had been poorly measured andthat it disappeared when these inputs were more accurately computed.Labor input also must be measured with some caution. At times, the
102 Growth, productivity, and structural change
growth of the population has been used as a proxy, but in situationswhere, for example, the labor force participation rate has altered signific-antly, the use of the proxy would give erroneous results. The contributionof education and training to the labor input must be carefully quantified –better educated labor is equivalent to more labor.
Second, the model must assume that labor and capital are paid theirmarginal product (i.e. we must assume a competitive economy) and theproduction function must be constant returns to scale, otherwise wecannot use the observed share of the factor in national income as a proxyfor the marginal contribution of the factor to total output.14 We no longerhave the ability to measure these variables because the marginal productsof labor and capital are not observable from macroeconomic data (whilethe shares of these factors are).
Third, as Hahn and Matthews (1965: 47) point out, it is important tohave a definition of “neutral” technical progress that will in some senseleave unchanged the balance between labor and capital, and so willpermit steady growth. Two definitions of “neutrality” have dominated theliterature.
Following Hicks (1932), technical progress is said to be “Hicks-neutral”if the ratio of the marginal product of labor to the marginal product ofcapital is unchanged when the ratio of capital to labor is unchanged.15
Thus, technical progress is Hicks-neutral if it leaves unchanged the mar-ginal rate of substitution between capital and labor, which is the rate atwhich one factor must be substituted for another in order to leave outputunchanged. This view of technical change assumes that the same degreeof technical change affects both capital and labor. Because the same laborand capital inputs produce more output, this type of technical change issometimes called “factor-augmenting technical change”; the effect is as ifthe amount of factors of production had been increased.
An alternative definition is that of Harrod (1948). Technical progress is“Harrod-neutral” if all the techniques in a technology experience thesame degree of labor-saving technical change. Expressed differently, tech-nical progress is said to be Harrod-neutral if it leaves the capital:outputratio unchanged. This type of technical change is sometimes called “labor-augmenting technical change,” because each worker after the change isable to produce more than he could previously; the effect is as if therewere more labor.
For an economy to sustain a steady rate of growth with output andcapital both growing at the same constant rate, technical progress must beHarrod-neutral.16 But in order to decompose the contribution of thefactors so as to estimate the contributions of labor and capital separately,technical change must be Hicks-neutral. Otherwise, in standard growthaccounting, the residual would only determine the weighted (bythe shares of profits and wages in total income) average of capital- andlabor-augmenting rates of technical change.17 Analysts have looked for a
Growth, productivity, and structural change 103

production function in which technical progress is both Hicks-neutral andHarrod-neutral. For this to be the case, the elasticity of substitutionbetween labor and capital in the production function must be unity. Theonly production function with this property is the Cobb–Douglas produc-tion function.18 This property, together with its ease of manipulation, is nodoubt the reason for the widespread use of this production function inTFP studies, including all the estimates for Egypt.
The interpretation of the residual as the contribution of “technicalprogress” also must be nuanced. Some analysts regard the residual asbeing a catch-all item affected by too many factors – such as governmentregulations, changes in managerial competence, the functioning of insti-tutions – that we do not fully understand, and would simply regard it as “ameasure of our ignorance.” Hence the increasingly preferred term in theliterature is the neutral “Total Factor Productivity” (TFP) or the “Solowresidual.” The growth accounting approach also treats the variables in theproduction function as independent of each other, whereas in practicethey may be closely interdependent; thus, for the most part labor andcapital are not substitutes but are complementary, while most technicalprogress must be embodied in physical capital.
The upshot is that the growth accounting approach provides somewhatequivocal results for policy. First, it identifies proximate, not ultimate, causesof economic growth. Moreover, as Matthews et al. (1982: 200) point out, animportant weakness of these models is that no explicit link is establishedbetween economic policy and the rate of technical progress; TFP-generatedoutput growth “is growth due to causes that resemble manna from heaven.”19
This, in part, has led to the current interest in “endogenous growth” models,of which a key feature is that growth depends on the incentives to invest inimproving technology. Once it is accepted that “technical progress” can itselfbe created by investment, it opens up possibilities, such as actions to encour-age innovation, for policy intervention in the growth process.
The theory behind, and the conclusions derived from, work on the con-tribution of productivity to economic growth were further refined in thecontext of research on the experience of the rapidly industrializingeconomies of East Asia. The original view – as expressed, for example, inWorld Bank (1993b) – was that the spectacular performance of thesecountries stemmed chiefly from the manner in which they had absorbednew skills and learned to efficiently use the new technologies that theyhad imported. The converse view is that growth in these countries wasmainly input-driven, resulting more from factor accumulation than fromproductivity increases.20 As Krugman (1997: 27) succinctly put it, growthin these countries was “mainly a matter of perspiration rather than inspira-tion – of working harder, not smarter.”
The foregoing discussion of the rather heavy load of measurementissues and assumptions that validate a growth accounting decompositionof the sources of growth should alert one to the limitations of such an
104 Growth, productivity, and structural change

approach. However, it is widely held that, in principle at least, the decom-position of growth should help policymakers decide the direction thatpolicy could most fruitfully follow. It is therefore understandable thatseveral attempts have been made to estimate the sources of growth in theEgyptian economy – for example, World Bank (1983: Chapter 8); WorldBank (1994: Table 42); IMF (1998: 7–8); Bisat and El Gamal (1999);Mohammed (2000, 2001); Kheir El Din and Moursi (2002). The studiescover different time periods and use differing data sets, thus the details oftheir findings are not always congruent with each other. However, agenerally consistent result is that at least during 1960–90, capital accumu-lation provided the main driving force for the growth of output. For the1990s, the picture becomes especially confused, with Mohammed (2000,2001) finding that TFP growth contributed essentially nothing to thegrowth of GDP in 1990–2000, and Kheir El Din and Moursi (2002: Table2) reporting that TFP growth contributed 44 percent in 1991–98.However, the latter authors comment (p. 35) that the increase in theshare of TFP growth in economic growth during this period resulted morefrom a decline in the rate of capital accumulation than from improve-ments in the management and organization of production.
Rather than becoming enmeshed in the minutiae of methodological,temporal, and data differences between the numerous studies, it might bemore fruitful to look at one of them a little more closely.
Mohammed (2000, 2001) assumed a production function of theCobb–Douglas type and estimated the share of capital and labor in GDPgrowth for the period 1965–2000 at 0.5989 and 0.4011 respectively. Thecontributions of capital, labor, and TFP growth to GDP growth over thisperiod, as well as in different sub-periods, are shown in Table 4.5.
The study found that during 1965–2000 the growth of GDP in Egyptowed much more to the growth of inputs (labor and capital) than to TFP
Growth, productivity, and structural change 105
Table 4.5 Factors’ contribution to GDP growth, 1965–2000
Year Growth rate (%) Contribution to GDP growth (%)
GDP Human capital/ Physical Human capital/ Physical TFPadjusted labor capital adjusted labor capital
1965–70 3.33 3.29 3.80 1.74 1.79 �0.201970–75 3.48 3.04 6.24 1.61 2.93 �1.061975–80 9.80 4.07 13.54 2.16 6.36 �1.281980–85 6.73 2.42 11.89 1.28 5.59 �0.141985–90 4.22 3.37 6.45 1.78 3.03 �0.591990–95 3.39 3.64 3.73 1.93 1.75 �0.291995–2000 5.72 4.65 6.88 2.47 3.23 �0.02
1965–2000 5.22 3.50 7.45 1.85 3.50 �0.13
Source: Mohammed (2001).

growth. While Egypt’s GDP grew by an average rate of 5.2 percent during1965–2000, physical capital grew by about 7.5 percent; human capital-adjusted labor increased by an annual average of 3.5 percent – andemployment by 2.6 percent – during the same period.21 Over the entireperiod 1965–2000, capital accumulation contributed about two-thirds ofthe growth in real GDP, growth in human capital-adjusted labor aboutone-third. TFP contributed virtually nothing for most of the period; it wasonly important during 1975–80, when it was responsible for about 13percent of the growth of GDP. The negative contribution of TFP to GDPgrowth, for example between 1980–85, says that any combination of laborand capital would have produced less output in 1985 than it could have in1980.
During 1965–75, growth of TFP was negative; all the output growthwas contributed by factor accumulation. The public sector dominatedthe economy and low efficiency in public investments may have beenthe main factor behind slow productivity growth. Productivity recoveredin the late 1970s – a period characterized by post-war construction andmajor trade liberalization reforms. However, productivity growth slowedagain in the 1980s and most of the 1990s, recovering only slightly in thelate 1990s.
Parenthetically, one might note an estimate by Maddison (1970: 53) ofthe factors’ contribution to growth in an earlier period. Surveying theyears 1950–65, Maddison calculated that 29 percent of Egypt’s growth wasprovided by growth in human resources, 51 percent by growth in non-residential capital, and about 20 percent by changes in efficiency.However, Maddison assigned weights of 0.5 to both labor and capital. Ifwe substitute the weights estimated from more recent studies into Maddi-son’s data, productivity improvements would account for about 12 percentof the growth of GDP during that period.
Attempts have been made to probe a little deeper into Total FactorProductivity. A recent effort was by Hall and Jones (1999), who decom-posed differences in output per worker across countries into differencesin the capital:output ratio, differences in educational attainment, and dif-ferences in productivity. The contributions from each of these inputs wereexpressed as ratios to US values. Their data showed that output perworker in Egypt was less than one-fifth that in the United States. Theyfound that if Egypt had the same level of TFP and educational achieve-ment as the United States, then its output per worker would be only 45percent of that of the United States. If the only difference between thecountries was in educational achievement, then Egyptian output per headwould be 58 percent of that of the United States. If Egypt had the samecapital stock and educational achievements as the United States, its outputwould be 70 percent of the United States level. Therefore, low output inEgypt was not just due to low factor inputs, but resulted from the relativelylower efficiency with which Egypt used these inputs.
106 Growth, productivity, and structural change
Hall and Jones hypothesized that differences in capital accumulation,productivity, and therefore output per worker were related to differencesin social infrastructure (i.e. the institutions and government policies thatdetermined the economic environment within which individuals func-tioned). A good social infrastructure linked social and private returns, sothat individuals benefited from pursuing activities that also benefitedsociety. Such a social infrastructure would protect the output of individualproducers from diversion to non-producers, i.e. to rent seekers. Hall andJones found a close association between output per worker and measuresof social infrastructure across their sample of 127 countries. Countrieswith policies favorable to productive activities – rather than to diversion –produced much more output per worker.
TFP growth in Egypt also does not compare well with rates of productiv-ity in other middle-income countries in Asia and Latin America. Thus in1973–94, TFP growth contributed about 24 percent and 40 percent ofGDP growth in Malaysia and Thailand respectively. For the period1965–97, it appears that TFP growth in Egypt was negative in 19 yearswhile it was negative in only nine years in Korea, and while TFP growthdid not contribute to growth in Egypt during the whole period, itaccounted for up to 20 percent of GDP growth in Korea. TFP growth inEgypt also lagged behind that in Tunisia.
Some approaches to productivity – for example, Nishimizu and Page(1982), Danilin et al. (1985), Schmidt (1985), Fu et al. (1988) – refine theconcept a little further. They decompose productivity change into twocomponents: technological progress, which corresponds to changes in tech-niques of production, and technical efficiency change, which corresponds tochanges in the efficiency with which existing techniques are employed.22
A World Bank study (1983: 227–64) applied this concept to productivitymovements in Egypt. Although the essay was limited to the industrialsector, the findings may have a more general interest. First, TFP changewas an important element of the rapid rate of industrial growth enjoyedby the Egyptian public sector between 1973 and 1979. This suggests thatthe new policies and the greater access to investment and new technologyintroduced by the infitah had a significant impact on this sector. Second,the gap between the average firm and the “best practice” firm in theindustries studied was widening over time. The average firm was experi-encing productivity improvement, but at a slower rate than the best-practice potential rate. Third, the rates of best-practice TFP changesencountered in Egyptian industry for the 1973–79 period – particularly inindustries such as edible oils, paper, transportation equipment, fabricatedmetals, and electrical machinery – were very high in comparison withlong-term trends in more developed countries. These results most likelyindicated a process of short-term adjustment by best-practice firms ratherthan the effects of technological progress in expanding production possi-bilities. The report concluded that productivity growth in industry would
Growth, productivity, and structural change 107

be more readily sustained by bringing the average and below-average firmcloser to the level of performance of the best-practice firm than wouldinvestment in newer technologies for the highest performing firms. Thepoor performance of productivity in Egyptian industry over longerperiods is confirmed by other studies; for example, Adams (2003) foundthat growth in labor productivity in Egyptian industry during 1984 to 1996averaged only 0.93 percent annually, compared with 5.93 percent for hissample of 22 developing countries.
These implications carry over from the micro- to the macroeconomiclevel. For example, a significant lesson derived from the study of factorproductivity is the importance for developing countries of expending timeand effort to absorb the continuously improving technology that is avail-able through imports. In fact, Young (1995) argued that perhaps the chiefreason for the surprisingly low estimates of TFP growth that he hadobtained for the Singapore economy was that it had been pushed tooquickly into acquiring new technologies without being given time to con-solidate at each stage and realizing the benefits of what Arrow (1962)termed “learning by doing.” Absorbing the best practices means – in addi-tion to enhancing the system of education and labor training – payingattention to learning by doing, improving managerial practices, andstrengthening the functioning of institutions (particularly the legalsystem, the tax system, the trade system, and the financial system) thatenhance competitiveness. It also requires greater transparency in andmore efficient performance by the framework of government. These ele-ments are vital, because the Egyptian economy can only grow as fast as therate of expansion of its factor inputs plus the rate of productivity changeof these inputs. Many of these issues, in the context of Egypt, are discussedin the chapter on sustaining growth.
A note on data
The plural of anecdote is data.George Stigler, Nobel Laureate in Economics 1982
The quality of Egyptian economic data, in common with that in otherdeveloping countries, is quite variable.23 Data on tax collections, themoney supply, payments made for imports, receipts from exports, foreignexchange reserves, and some other monetary and fiscal aggregates aregenerally reliable. However, data on national accounts and its principalcomponents (such as investment, savings, public and private consump-tion) and the data on employment are less firm and are more useful asindicators of trends than of precise magnitudes.
The first modern estimate of the national income for Egypt was by Anis(1950). Since that time many elaborations have taken place, but through-out 1952–2000 the system offered considerable scope for improvement.
108 Growth, productivity, and structural change
Useful comments on national accounts and other data sets are offered byHansen and Mead (1965), Mabro (1974), World Bank (1978), Ikram(1980), Hansen (1991), Ministry of Planning (1991, 1996), and Waite et al.(1998).
These studies point to six principal sources of weaknesses in thenational accounts data. The first is the use of official prices, which distortsthe final outcome. Hansen (1968: 28) cautioned that “current price esti-mates of GDP should always be understood to mean current officialprices.” This warning must be kept in mind because it explains to a largeextent why the GDP implicit deflator appears to be so modest over sub-stantial periods. Price administration has ensured a large measure ofstability in official prices. If the price series were to be adjusted for mani-festations of scarcity – such as queues and rationing – higher figures wouldbe obtained, thereby reducing the level of real GDP. Moreover, the systemof trade protection raises the prices of industrial compared to agriculturalproducts and thus artificially gives industry a relatively bigger weight inthe measured GDP. This not only distorts estimates of the structure of theGDP, but also affects calculations of the growth rate, because it raises theshare of the normally faster-growing sector, industry, and depresses that ofthe slower-growing, namely, agriculture.
Second, data on private sector activities – such as investment, sales,inventories – are especially inadequate, with the service industries beingthe worst affected. This inadequacy becomes a growing handicap as theeconomy becomes increasingly privatized and one in which the servicessector occupies the most important part. The problem is accentuatedbecause the private sector has been growing faster than the economy ingeneral. Moreover, the primary method of estimating GDP is the produc-tion approach, i.e. by using price and quantity data for detailed commodi-ties to estimate gross output, intermediate consumption, and (by residual)value-added. For the expenditure-based GDP estimates, the greatest defi-ciency is the lack of current data on private consumption (because of theabsence of a regular series of household surveys). As Waite et al. (1998:10) emphasize in a comprehensive review of the national accounts, “Mostof the expenditure estimates are tied to various production measures andhence not truly independent estimates.” Measurement of changes ininventories and their values is deficient as there is no regular system ofcollecting information on the book value of inventories; changes in stocksare derived partly from statistics on commodity balances.
Third, the existence of substantial lags between the time period in ques-tion and the publication of the data reduces the usefulness of the informa-tion for analysis or policymaking. Typically, projected estimates of theupcoming fiscal year’s GDP are made in the first half of the calendar year.They are then revised and called “expected estimates” a year later. Furtherdata adjustments are made, and sometimes two and three years from thedate of the projected estimates the “preliminary” and “final” estimates are
Growth, productivity, and structural change 109

issued.24 Thus the GDP for a given year may be projected or estimatedfour times and the final numbers may not be established until three yearsor more after the end of the fiscal year in question. Moreover, because theprojections of the macroeconomic variables and the estimation of theoutcome are both performed by the Ministry of Planning, Waite et al.(1998: 12–13) judge it “highly unlikely that those who project andmonitor GDP for the Plan can avoid all bias when they then compile the‘actual’ estimates,” and they recommend that the two processes be sepa-rated in order to ensure that the estimating procedure is perceived asimpartial and objective by users of the data.
Fourth, the coverage of the statistics has changed a number of times as aresult of changes in definition and of the time period covered (such aschanges in the fiscal year from a July–June basis until 1971/72 to a calen-dar year from 1973 through 1979, and then again back to a July–Juneperiod from 1980/81). These changes complicate the task of analysinglong-term trends.
Fifth, an important shortcoming is the absence of reliable and consis-tent data on a regional basis, particularly that relating to the GDP and itssectoral composition. The available information does not permit a com-parative analysis of productivity developments in the different regions.This becomes particularly critical in the analysis of levels, trends, and thecauses of poverty, which by 2000 had increasingly taken on a regionaldimension.
Sixth, the national accounts and other official data measure only a partof the picture. In Egypt, as in most developing countries, a considerablepart of economic transactions takes place in the unrecorded “gray”economy.25 Individuals and micro-enterprises function in this theater inorder to conceal activities that in themselves may be licit, but which theprotagonists wish to keep hidden in order to avoid paying taxes or toevade the attention of the authorities for other reasons. The criterionused in most Egyptian studies of the informal sector – for example,Fergany (1991, 1996b), Rizk (1991), Assaad (1997) – is the size of theestablishment, and defines the informal sector as economic units employ-ing less than ten workers.26 This rather misses the point. Actors generallyfunction in the gray economy because they wish to “pass under thegovernment radar,” i.e. they want to evade notice. Hence, the more appro-priate criterion would be non-registration of the unit.
No reliable estimate of the contribution of the gray economy in thissense exists for Egypt, although all commentators agree that it could besubstantial. The estimates cover a wide range: Waite et al. (1998: 39) sug-gested that Egypt’s GDP might be understated by as much as 30 percent;Schneider and Enste (2000: 7–8) in a working paper of the IMF estimatedEgypt’s shadow economy in 1989–90 at 68 percent of GDP; while Oweiss(1994: 21) reckoned that the shadow economy provided a contribution “atleast equal to the published figure of the country’s national income.” The
110 Growth, productivity, and structural change

size of the gray economy makes a difference – an increase in this part ofthe economy is likely to decrease government revenues, and this couldreduce the amount and quality of publicly provided goods and services.
The absence of reliable information on the informal economy leavespolicymakers without the wherewithal to answer questions about theactual level of employment in the country, the size of family incomes, andthe extent of poverty. It also leaves open two other particularly importantquestions. First, does the informal part of the economy move pro- orcounter-cyclically with the formal economy? The answer from studies ofother economies – for example, by the Social Policy and DevelopmentCentre (2001) for Pakistan – is that the gray economy largely moves in thesame direction as the formal economy. This means that if the latter facesdifficulties, the authorities cannot assume that the informal part will pickup the slack and that the impact on incomes and employment will becushioned. Second, does the presence of the gray economy imply that thedistribution of income is more or less equal than it would have been in itsabsence? Based on a very detailed study for India, Acharya (1985, 1988:300) concluded that the distribution of actual household income from allsources was likely to be even more skewed in favor of the top decile thanindicated by standard surveys. This would result (a) from the incentivesfor households with a higher proportion of gray income to understatetheir true incomes and to do so to a greater degree than households withlittle or no income from gray sources, and (b) from the greater opportun-ity for the “haves” (such as industrialists, traders, real estate operators,politicians, bureaucrats, etc.) to earn gray incomes than the “have nots”(e.g. small farmers, peasants, rural and casual labor). These reasons applyto Egypt just as strongly as to India. However, for the entire 1952–2000period, Egyptian policymakers were handicapped by the absence of a firmempirical basis for a judgment.
In view of all the omissions and uncertainties in the data, it can be alittle disconcerting to see the doggedness with which some of the inter-national organizations and the Egyptian authorities dispute the decimalpoints of the growth rate.
It will be clear from the foregoing that the data situation poses consid-erable difficulties even for analysing long-term trends. The situation is stillmore challenging for day-to-day policymaking, because the absence ofshort-term (e.g. quarterly) national accounts and other magnitudes makesit very tricky to assess the current state of the economy and to devise suit-able policies. In order to buttress its own analysis, the World Bankattempted to supplement the available official statistics with more timelyproxies. The following short description of the efforts made will give someflavor of what needs to be done.27
The World Bank’s office in Cairo compiled a composite indirect indica-tor of real activity entitled “Resident Mission Real Activity Index.” Thiswas a linear average of the monthly indexes for: (1) dollar imports of
Growth, productivity, and structural change 111

consumer goods, durable and non-durable; (2) net tonnage of cargocrossing the Suez Canal; (3) number of, and nights spent by, tourists visit-ing Egypt; (4) real credit extended by the Principal Bank for Developmentand Agricultural Credit (PBDAC); (5) electricity consumption by indus-trial users (in megawatts); (6) domestic sales of cement (in tons); (7)domestic sales of iron (in tons); (8) number of licenses issued by GOFI fornewly-established industrial companies (capital of LE 100,000 or more);(9) freight transportation (in tons) by the Egyptian National Railways;(10) the real wage bill of the central government; (11) the number ofchecks cleared at the Central Bank’s clearing houses; (12) averagenumber of job advertisements in Al-Ahram newspaper (Friday); and (13)average number of calls for bids (supply and contracting) advertised in Al-Ahram newspaper (Friday).
The Bank also attempted to track private sector performance. Eachmonth it surveyed some 50 private enterprises, local and foreign, fully-private, and asked them (in confidentiality-protecting index terms) abouttheir monthly sales, employment, and inventories of final goods. The dataseries could, of course, be criticized for the biased quality of the respon-dents: they were, after all, English-speaking, World-Bank-connected busi-nesses. Yet it provided a reasonable lower bound in looking to the future –if things appeared bad for these more dynamic enterprises, there could belittle doubt that the economy was likely to be coming in for trouble.
The Bank also built its own “tourism index.” This was a linear averageof the indexes for: (1) tourist arrivals; (2) tourist nights; (3) the averageactual occupancy rate of Cairo’s three largest hotels; (4) sales of bottledwater of the most popular brand; and (5) sales of photograph films(Kodak). The raw data were provided by the Tourism DevelopmentAuthority, the managers of the hotels in question, and the CEOs of thebottled water and film companies.
Data on monthly fiscal accounts were obtained from the IMF’s office inCairo. Monthly balance of payments accounts were estimated both fromCustoms Department data (based on physical crossings of the customsline) and from Central Bank data on foreign payments/receipts and trans-fers. The Central Bank information covered a somewhat different timeperiod vis-à-vis the data on shipments obtained from the Customs authori-ties, so the two series were not congruent. However, the Central Bank datawere available with much smaller time-lags and thus were better for short-term analysis, while the Customs data were more detailed (especially interms of commodity breakdown) and thus more helpful for structuralinvestigations.
Data on inflation were obtained from CAPMAS, and from informationthat embassies and international agencies collected in order to adjust thesalaries of their local employees. The latter, of course, only provided apartial picture because their consumption baskets contained a substantialweight of commodities not consumed by the poorer sections of the popu-
112 Growth, productivity, and structural change

lation. However, some cross-checking of the CAPMAS data was necessary,because that agency surveyed only one-third of the consumer basket eachmonth.
For data on interest rates, the World Bank surveyed five private andjoint-venture banks (as they were more likely to price money freely). Esti-mates of the market foreign exchange rate were obtained from foreignexchange brokers as well as banks. The Stock Brokers Association helpedto point out “regularly traded stocks” (most of the stocks listed on theCairo bourse are closed companies profiting from the tax advantages oflisting). The World Bank then computed its own monthly stock exchangeprice index, mainly to use as a forward indicator.
The foregoing indicators, while helpful in forming judgments and sug-gesting some likely turning points in the economy’s trajectory, were inade-quate substitutes for series based on comprehensive data or on statisticallyrigorous sampling techniques. The World Bank ultimately discontinuedthe exercise because of the amount of time and effort required toproduce even reasonably meaningful results. It is unfortunate that thegovernment did not develop its own bank of reliable short-term data tosupport expeditious macroeconomic policymaking.
A further area in which problems with data could hinder the effective-ness of policymaking concerns fiscal policy and the budget. Fiscal policy isa potent tool for helping guide the economy, particularly so in Egyptwhere for much of 1952–2000 monetary policy was relegated to a sec-ondary role. The state budget covers central government, local govern-ments, the public services authorities, and the investment projects of theeconomic authorities and their financing. Revenue and non-investmentexpenditure are reported in the budget on a cash basis, while investmentexpenditure is reported on an accrual basis, i.e. when a bill is received andthe receipt of the good or service has been verified. However, a number ofentities, principally the National Investment Bank (NIB), the social insur-ance funds, and the Social Fund for Development, whose combined activ-ities were large enough to have substantial macroeconomic consequences,were not treated consistently in the budget. A significant portion of theexpenditures of the Ministry of Defense is also outside the budget.
In the late 1990s, the operations of the NIB were consolidated withthose of the government and the fiscal data for 1999 were reviewed. As aresult of the review, the authorities more than tripled the estimate of thebudget deficit for 1999, from 1.3 percent of GDP to 4.2 percent; indeed, ifthe financing of net lending by the NIB were included, the deficit wouldrise to nearly 6 percent of GDP. Inquiries by international organizationssuggested that data for earlier years were affected by similar discrepancies.Needless to say, such problems with data make it difficult to assess the truefiscal stance and to conduct fiscal policy.
The data on the labor force and employment constitute a majorweakness. This is of particular concern, because providing meaningful
Growth, productivity, and structural change 113

employment to a rapidly growing labor force has risen to top priority inthe agenda of Egyptian policymakers.
The two main sources of data on labor and employment are the decen-nial population census (PC) and the quarterly Labor Force Sample Survey(LFSS) conducted by CAPMAS. Fergany (1991) has pointed to a numberof methodological and definitional problems that limit comparabilityacross the two instruments, as well as within the same instrument overtime. First, the LFSS is not carried out during census years, and thereforeno direct comparison can be made between the two sources. Second, thePC includes army personnel and conscripts in both the population andthe labor force, as opposed to the LFSS, which includes only the civilianpopulation. Third, the reference period for unemployment is one day inthe PC, as opposed to one week in the LFSS; this leads the PC to overesti-mate the magnitude of unemployment. Fourth, until 1986, the PC resultswere produced for employment and unemployment both defined on theage group six-plus. In 1996, these tabulations were produced for the age15-plus, thereby reducing the reliability of trend analysis. On the otherhand, employment in the LFSS is typically defined for the age group six-plus, while unemployment is defined only for the age group 12–64. Fifth,both instruments inadequately measure economic activity, especially offemale informal home-based activities.28 Sixth, both the PC and the LFSS,by requiring “active search” for employment (during a relatively short ref-erence period) as a condition for being included in the labor force, tendto exclude “discouraged unemployment” in periods of high and persistentunemployment.
Owing to the greater frequency with which it is conducted, analystsgenerally place greater reliance on the LFSS. However, this survey suffersfrom two main weaknesses. First, the definition of who is a member of thelabor force poses a serious problem. The question posed in the survey isessentially: Do you work? If not, have you looked for a job during the pastweek? If you have not, you are not in the labor force.
This definition effectively excludes the “discouraged” workers, that is,the ones who would have liked to search for a job, had they had themoney and means to do it, and those who have got so fed up of lookingunsuccessfully for a job that they did not “actively search” for one in thereference period covered by the LFSS. Once (in the third quarter of1988), CAPMAS used an alternative definition in the LFSS: it included inthe labor force those workers who had searched for a job during theentire duration of unemployment. This factored into the labor force the“discouraged unemployment” portion of the population and obviouslygave a higher figure of unemployment as a percentage of the labor forcethan had been provided by the earlier definition.29 CAPMAS has nowreverted to the original definition.
Second, there is a weakness in the measurement of female participationin the labor force. Here, again, the special round of the LFSS in October
114 Growth, productivity, and structural change
1988 marked a change with previous surveys: any individual engaged insubsistence activities either for own or household consumption was con-sidered economically active and hence part of the labor force. This modi-fication alone resulted in a significant increase in the measure of femaleparticipation, especially in rural areas, compared with those reported inearlier surveys. However, Assaad (1999) reported that by 1995, measure-ment practices of participation in informal and home-based activities hadreverted to their pre-1988 standards.
By assuming that the activity rate (i.e. labor force divided by population)of October 1988 remains at least constant (an innocuous assumption in acountry with a fast-growing population and rising education levels) andapplying it to the current population levels that are officially published,researchers can try to estimate the “real” labor force. The differencebetween the “real” and the government’s reported labor force figure is pro-vided by the discouraged, unemployed workers and a higher participationrate for women. That, when added to the unemployment and labor forcefigures published by the authorities, gives the “real” rate of unemploy-ment.30 The application of this (or a similar) procedure is essentially whatproduces most of the differences between estimates of unemployment pro-vided by the government and by independent research workers.
Measurement of the capital stock
The value of fixed assets reported in accounts is based on historical costs.Because of inflation, the book value of assets often grossly understates thereplacement value of those assets. This has two consequences: first, theactual rate of return is overstated; and second, depreciation allowancesare inadequate to maintain the real value of assets. In order to avoid thesedistortions in the measurement of the capital stock, the book value ofcapital estimates is revalued using a methodology known as “perpetualinventory technique.” Under this procedure, the value of the real grosscapital stock at time t is estimated by summing the value of the grossinvestment (measured in constant prices) undertaken each year prior to tand subtracting the value of capital goods that have been scrapped. Thus,provided that we have data on investment extending further back than nyears (n� the fixed life of each piece of capital equipment), we can con-struct a measure of the capital stock without having to obtain a valuationof all the capital stock in existence in the base year. See McCombie andThirlwell (1994: 130–33).
The version of this technique frequently followed is due to Arnold Har-berger (1977). This technique, or a variant of it, has been used by theWorld Bank for deriving the real capital stock and estimating financialand social rates of return for many developing countries.
Harberger’s methodology for measuring the net capital stock essen-tially involves the following procedure:
Growth, productivity, and structural change 115
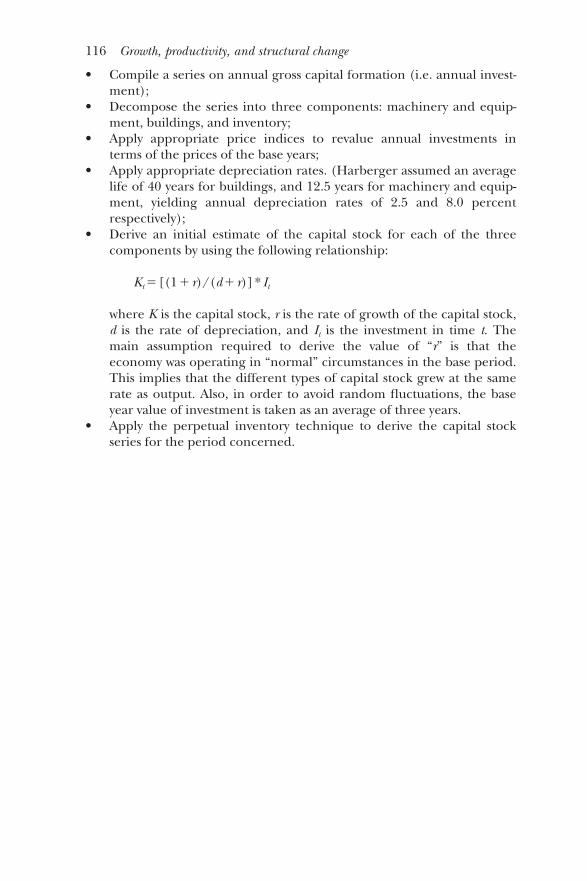
• Compile a series on annual gross capital formation (i.e. annual invest-ment);
• Decompose the series into three components: machinery and equip-ment, buildings, and inventory;
• Apply appropriate price indices to revalue annual investments interms of the prices of the base years;
• Apply appropriate depreciation rates. (Harberger assumed an averagelife of 40 years for buildings, and 12.5 years for machinery and equip-ment, yielding annual depreciation rates of 2.5 and 8.0 percentrespectively);
• Derive an initial estimate of the capital stock for each of the threecomponents by using the following relationship:
Kt �[(1� r)/(d� r)]* It
where K is the capital stock, r is the rate of growth of the capital stock,d is the rate of depreciation, and It is the investment in time t. Themain assumption required to derive the value of “r” is that theeconomy was operating in “normal” circumstances in the base period.This implies that the different types of capital stock grew at the samerate as output. Also, in order to avoid random fluctuations, the baseyear value of investment is taken as an average of three years.
• Apply the perpetual inventory technique to derive the capital stockseries for the period concerned.
116 Growth, productivity, and structural change

5 The external sector
For most of 1960–2000, Egypt struggled to simultaneously achieve bothinternal equilibrium (a balance between domestic demand and supply atan acceptable level of inflation) and external equilibrium (a continuouslyfinanceable level of current account deficit). Growth of the GDP triggeredan earlier and sharper increase in Egypt’s imports than in her foreignexchange earnings, while debt servicing – itself the product of externaldeficits – added to the resource requirements. The external disequilib-rium had to be controlled, because the available financing fell short of thedemands. Egypt sought to contain the disequilibrium chiefly by restrictingimports, but the cost was underutilized capital stock and under- andunemployed labor. Internal equilibrium, thus, was subordinated to theexternal. The balance of payments, therefore, must be seen as the ulti-mate constraint on Egypt’s growth during this period.
Major developments in the balance of payments
During 1965–2000 Egypt’s balance of payments was characterized bysevere structural weaknesses. Foreign exchange earnings were narrowlybased and depended largely on oil, worker remittances, tourism, and theSuez Canal. Imports for the most part remained 2.5 to three times mer-chandise exports, and the resulting gap was financed chiefly throughearnings from services. Income from services (including worker remit-tances) considerably exceeded proceeds from physical exports, andaccounted for about two-thirds of foreign exchange earnings. Interest pay-ments on the country’s external debt constituted a substantial burdenuntil the rearrangements of 1991–96. For most of 1965–2000 the currentaccount balance remained negative, and it was only towards the secondhalf of the 1990s, when debt rearrangements eased the servicing burden,that improvements in the current account balance were not necessarilyrelated to a slowing down of the economy.
Excluding official transfers, the current account balance rangedfrom �6.6 percent to �20.0 percent of GDP at market prices; after takinginto account official transfers, the balance varied from �10.4 percent to

�11.3 percent. The large current deficits were financed mostly by officialtransfers and external borrowing by the public sector, supplemented byprivate capital inflows. Direct foreign investment contributed only minimallyto the country’s financing requirements. The structure of the balance of pay-ments was thus dominated by services, transfers, and capital transactions.
Other notable trends in the balance of payments were the following:
1 For almost the entire 1965–2000 period, Egypt ran a deficit on thecurrent account of the balance of payments. The major cause was apersistent and large excess of merchandise imports over exports. Thedeficits on merchandise trade were to a substantial extent offset bysurpluses on the services account. Egypt’s “invisible” earnings out-weighed expenditures, except for years in which the Suez Canal wasclosed and before worker remittances began rising sharply. The latteroccurred after the oil price increases of 1973, which increasedincomes and the demand for Egyptian labor in the Arab oil-producingcountries. Invisible earnings were crucial for Egypt: during 1965–2000,they accounted for about 69 percent of total foreign exchange earn-ings, compared with 31 percent for merchandise exports. Thus con-sidering the period as a whole, Egypt was principally an exporter ofservices.
2 An important source of foreign exchange for most of 1965–2000 wasforeign assistance. Until 1973, the chief providers of these resourceswere the Arab countries and the Soviet bloc; thereafter the UnitedStates increasingly assumed the dominant role. The purchasing powerconferred in foreign exchange was considerable – during 1970–2000,net official transfers amounted to almost 18 percent of Egypt’s ownforeign exchange earnings from merchandise exports and invisibles.Data on external assistance remain incomplete, but the availableinformation indicates that net official transfers during 1970–2000averaged nearly 6 percent of GDP annually. Without these transfers,aggregate consumption would have been roughly 7 percent, or privateconsumption about 12 percent, or investment almost 30 percent lessthan its actual level. The impact of external aid is likely to have beeneven greater, because the figures do not reflect military assistance,which is known to have been substantial. Thus, during 1984–2000, theUSA provided $1.3 billion a year in military grants, equivalent toabout 8.5 percent of Egypt’s foreign exchange earnings during thatperiod. The trend in the current account balance, with and withoutofficial transfers, can be seen in Figure 5.1.
3 For most of 1965–2000, trade policy failed to significantly acceleratethe growth of non-oil exports. Egypt’s earlier dependence on cottonexports changed after 1975 (with the recovery of the oil fields in1973) to heavy dependence on oil exports, which accounted foralmost half of total merchandise exports.
118 The external sector
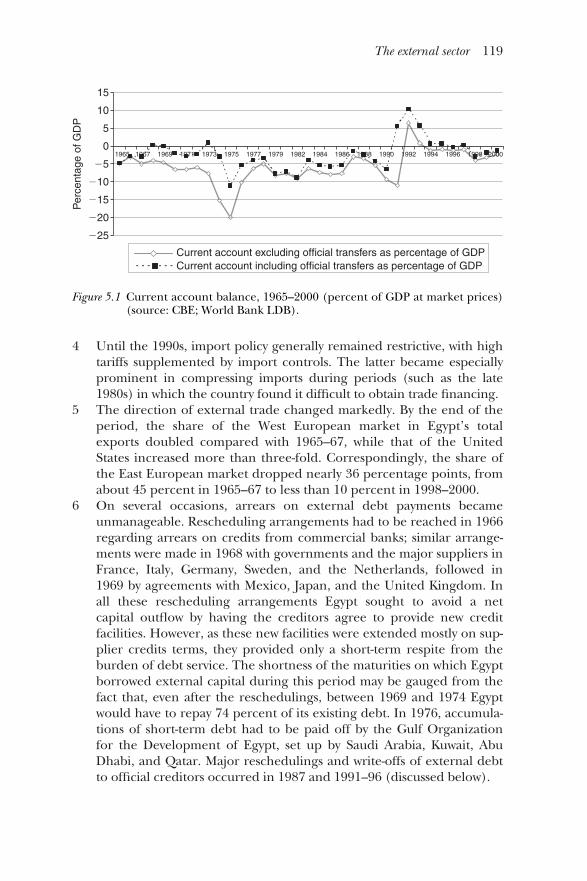
4 Until the 1990s, import policy generally remained restrictive, with hightariffs supplemented by import controls. The latter became especiallyprominent in compressing imports during periods (such as the late1980s) in which the country found it difficult to obtain trade financing.
5 The direction of external trade changed markedly. By the end of theperiod, the share of the West European market in Egypt’s totalexports doubled compared with 1965–67, while that of the UnitedStates increased more than three-fold. Correspondingly, the share ofthe East European market dropped nearly 36 percentage points, fromabout 45 percent in 1965–67 to less than 10 percent in 1998–2000.
6 On several occasions, arrears on external debt payments becameunmanageable. Rescheduling arrangements had to be reached in 1966regarding arrears on credits from commercial banks; similar arrange-ments were made in 1968 with governments and the major suppliers inFrance, Italy, Germany, Sweden, and the Netherlands, followed in1969 by agreements with Mexico, Japan, and the United Kingdom. Inall these rescheduling arrangements Egypt sought to avoid a netcapital outflow by having the creditors agree to provide new creditfacilities. However, as these new facilities were extended mostly on sup-plier credits terms, they provided only a short-term respite from theburden of debt service. The shortness of the maturities on which Egyptborrowed external capital during this period may be gauged from thefact that, even after the reschedulings, between 1969 and 1974 Egyptwould have to repay 74 percent of its existing debt. In 1976, accumula-tions of short-term debt had to be paid off by the Gulf Organizationfor the Development of Egypt, set up by Saudi Arabia, Kuwait, AbuDhabi, and Qatar. Major reschedulings and write-offs of external debtto official creditors occurred in 1987 and 1991–96 (discussed below).
The external sector 119
2000
15
10
5
0
�5
�10
�15
�20
�25
Per
cent
age
of G
DP
19981996199419921990198819861984198219791977197519731971196919671965
Current account excluding official transfers as percentage of GDPCurrent account including official transfers as percentage of GDP
Figure 5.1 Current account balance, 1965–2000 (percent of GDP at market prices)(source: CBE; World Bank LDB).

The broad development of the external position is summarized in Table5.1; a more extended version appears in Table 5.6 at the end of the chapter.
The balance of trade
Within the external sector, the balance of visible trade requires particularattention. During 1965–2000 its most important characteristics were thefollowing:
1 For the entire period, Egypt ran a large deficit on its balance of visibletrade. This deficit increased steadily and by the end of the periodreached 13 percent of GDP.
2 Throughout the period merchandise imports grew much faster, aver-aging 9.6 percent a year in current terms, than merchandise exports,which increased at an average rate of about 6 percent per annum.Since imports from early in the period became substantially higherthan exports and continued to grow at a significantly faster rate, anincreasing discrepancy between the two series was inevitable.
3 The large and increasing divergence between imports and exportsbecame most noticeable after 1974, when the greater availability offoreign aid enabled a larger expansion in the volume of imports(Figure 5.2).
4 Imports fluctuated more widely than exports, with a coefficient ofvariation of 67.2 percent compared with a corresponding coefficientof 54.6 percent for merchandise exports.
5 The composition of imports changed. Imports of intermediate goodsincreased from less than 50 percent of total merchandise imports in1965 to over 60 percent in 2000. Import of capital goods peaked atnearly 30 percent of merchandise imports in 1985, but fell thereafterto 20 percent in 2000. Imports of consumer items shot up during the
120 The external sector
20,000
Exports (fob) Imports (cif)
1965
1967
1969
1971
1973
1975
1977
1979
1981
1983
1985
1987
1989
1991
1993
1995
1997
1999
18,00016,00014,00012,00010,0008,0006,0004,0002,000
0
$ m
illio
n
2000
Figure 5.2 Merchandise exports and imports, 1965–2000 ($ million) (source:World Bank LDB).

Tab
le 5
.1Su
mm
ary
bala
nce
of p
aym
ents
: sel
ecte
d ye
ars,
196
5–20
00 (
$ m
illio
n)
1965
1970
1975
1981
1985
1990
1995
2000
Tra
de b
alan
ce�
382
�37
4�
2,92
8�
5,07
8�
6,63
3�
8,29
7�
7,85
4�
11,4
73.0
Exp
orts
, fob
568
817
1,56
93,
985
3,88
33,
144
4,95
76,
388
(Pet
role
um a
nd
prod
ucts
)–
–(3
37)
(2,8
57)
(2,5
89)
(1,2
29)
(2,1
76)
(2,2
73)
Impo
rts,
cif
�95
0�
1,19
1.0
�4,
497
�9,
063
�10
,516
�11
,441
�12
,811
�17
,861
.0
Serv
ices
bal
ance
129
�88
282
618
�32
686
64,
046
5,62
4R
ecei
pts
358
176
1,25
03,
609
3,98
26,
094
9,56
011
,420
(Sue
z C
anal
due
s)(1
98)
–(8
5)(7
80)
(897
)(1
,472
)(2
,058
)(1
,781
)(T
ouri
sm)
(108
)(1
33)
(�33
2)(5
12)
(410
)(1
,072
)(2
,299
)(4
,314
)Pa
ymen
ts�
229
�26
4�
800
�2,
991
�4,
308
�5,
228
�5,
514
�5,
796
(In
vest
men
t in
com
e)(�
40).
0(�
68)
(�30
9)(�
1,55
0).0
(�2,
486)
.0(�
2,96
0).0
(�1,
237)
.0(6
77)
Tra
nsfe
rs�
308
1,24
52,
855
4,59
44,
837
4,19
84,
679
Offi
cial
–30
81,
079
–1,
097
1,09
491
993
2Pr
ivat
e–
–16
62,
855
3,49
73,
743
3,27
93,
747
Cur
rent
acc
ount
bal
ance
�25
3�
154
�1,
401
�1,
605
�2,
365
�2,
594
390
�1,
171
(exc
ludi
ng o
ffici
al tr
ansf
ers)
�25
3�
462.
0�
2,38
9.0
�1,
605.
0�
3,46
2�
3,68
8�
529
�2,
103.
0
Net
cap
ital a
nd fi
nanc
ial a
ccou
nt18
683
649
1,15
71,
418
471,
346
�1,
199
Net
err
ors
and
omis
sion
s12
13–
315
–1,
336
�65
�65
8
Ove
rall
bala
nce
�55
�58
�75
2�
133
�94
7�
1,21
11,
671
�3,
027
Ext
ern
al a
rrea
rs–
––
–1,
353
2,31
4–
–N
et in
tern
atio
nal r
eser
ves
(��
incr
ease
)55
5875
213
3�
406
�1,
103
�1,
671
3,02
7
Mem
oran
dum
item
sC
urre
nt a
ccou
nt b
alan
ce a
s pe
rcen
t of G
DP
Incl
udin
g of
fici
al tr
ansf
ers
�4.
7�
2.2
�11
.3�
12.9
�10
.1�
11.4
0.6
�1.
2Ex
clud
ing
offic
ial t
rans
fers
�4.
7�
6.6
�19
.2�
12.9
�14
.8�
13.1
�0.
8�
2.3
Fore
ign
ass
ets
of C
entr
al B
ank
of E
gypt
2.
41.
71.
82.
61.
12.
115
.810
.2in
mon
ths
of im
port
s (e
nd
of p
erio
d)
Sour
ce: C
BE
; Wor
ld B
ank
(197
8: V
olum
e V
I); I
kram
(19
80);
IM
F, I
nter
natio
nal F
inan
cial
Sta
tistic
s.
Not
ePe
trol
eum
exp
orts
res
umed
on
ly a
fter
the
reco
very
of t
he
oilfi
elds
follo
win
g th
e 19
73 w
ar.
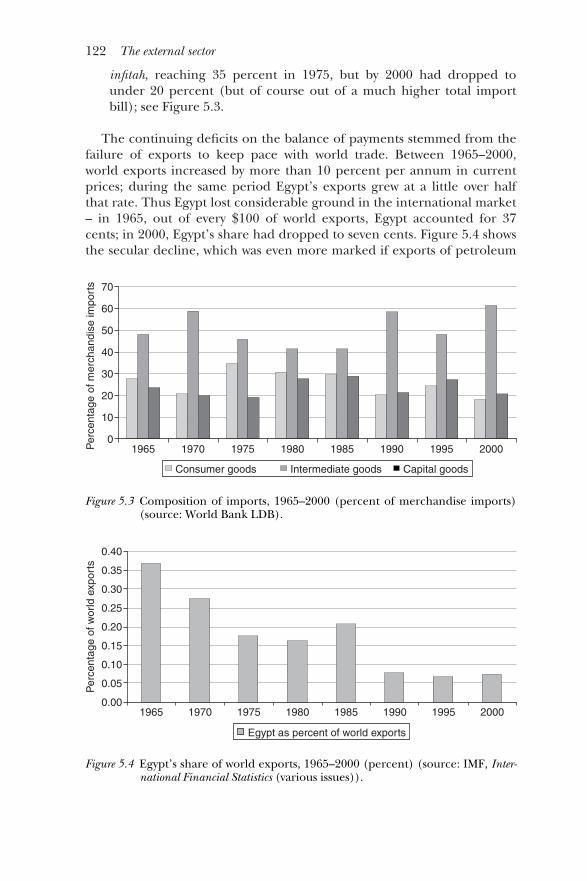
infitah, reaching 35 percent in 1975, but by 2000 had dropped tounder 20 percent (but of course out of a much higher total importbill); see Figure 5.3.
The continuing deficits on the balance of payments stemmed from thefailure of exports to keep pace with world trade. Between 1965–2000,world exports increased by more than 10 percent per annum in currentprices; during the same period Egypt’s exports grew at a little over halfthat rate. Thus Egypt lost considerable ground in the international market– in 1965, out of every $100 of world exports, Egypt accounted for 37cents; in 2000, Egypt’s share had dropped to seven cents. Figure 5.4 showsthe secular decline, which was even more marked if exports of petroleum
122 The external sector
70
Per
cent
age
of m
erch
andi
se im
port
s
1965 1970 1975 1980 1985 1990 1995 2000
60
50
40
30
20
10
0
Consumer goods Intermediate goods Capital goods
Figure 5.3 Composition of imports, 1965–2000 (percent of merchandise imports)(source: World Bank LDB).
Per
cent
age
of w
orld
exp
orts
0.40
0.35
0.30
0.25
0.20
0.15
0.10
0.05
0.001965 1970 1975 1980 1985 1990 1995 2000
Egypt as percent of world exports
Figure 5.4 Egypt’s share of world exports, 1965–2000 (percent) (source: IMF, Inter-national Financial Statistics (various issues)).

are excluded. The reduction internationally was paralleled by the decreas-ing significance of exports in the GDP, dropping from 11.2 percent in1965 to 6.5 percent in 2000. The ratio reflected the performance of oilsales; for example, there was an upward blip to 12.9 percent in 1981 wheninternational oil prices reached their peak.
In itself, a decline in share of world exports might not be crippling.Logically, a declining share of world exports is not necessarily incompati-ble with a healthy balance of payments at a reasonable growth rate.However, in Egypt’s case the continuing pressure on the balance of pay-ments and the measures that the country frequently adopted to holddown imports limited the country’s access to capital goods, technology,and intermediate products to a level below what could have been attainedwith greater availability of foreign exchange. This limited the country’sability to productively absorb its labor force, and thus restricted its capac-ity rate of growth (the Harrodian “natural” rate of growth). More detailedanalyses in this chapter and in Chapter 10 show that the declining sharewas caused by a number of underlying weaknesses, such as the nature ofthe products offered for export.
The loss of share in a growing market resulted from an export structurethat was skewed towards products with low price and income elasticities ofdemand.1 Most econometric and quantitative work in international tradehas emphasized the importance of price elasticities and, indeed, much ofthe argument against exchange rate devaluation in Egypt arose from apessimistic view of the price elasticity of foreign demand for Egypt’sexports. However, an equally, if not more, important reason was that thecomposition of Egypt’s export basket, in terms of commodities andquality, held little appeal to markets in which incomes were rising.
Merchandise exports
A key change in the structure of Egypt’s exports can be seen from Table5.2. In the early part of the period, exports were dominated by raw cotton
The external sector 123
Table 5.2 Composition of merchandise exports, 1965–2000 (percent)
1965 1970 1975 1981 1985 1990 1995 2000
Merchandise exports 100.0 100.0 100.0 100.0 100.0 100.0 100.0 100.0Cotton and textiles 69.9 65.9 56.1 16.1 12.0 27.8 31.1 12.9
Cotton 55.9 49.1 36.7 9.1 7.0 7.0 6.9 2.6Textiles 14.0 16.7 19.4 7.0 4.9 20.8 24.2 10.3
Oil and oil products 8.0 2.1 9.5 75.7 42.9 39.1 36.6 35.8Oil 4.0 1.9 4.2 59.5 35.9 27.6 18.8 19.0Oil products 4.1 0.2 5.3 16.2 7.0 11.5 17.8 16.8
Non-oil exports 92.0 97.9 90.5 24.3 57.1 60.9 63.4 64.2
Source: CBE; IMF, International Financial Statistics.

and some elementary cotton-based manufactures. After 1975, oil exportsrapidly became very important and in 1981 (when oil prices reached theirpeak) accounted for over 75 percent of earnings from merchandiseexports. With the decline in world oil prices from 1982, oil’s share in thecomposition of exports remained important, but not dominant. However,the crucial point is that Egypt’s export trade was vulnerable in the 1960sbecause it relied disproportionately on a single commodity, namely,cotton; towards the end of the twentieth century it remained vulnerablebecause it still relied excessively on a single commodity, namely, oil.
Changes in the composition of merchandise exports, divided betweenoil and non-oil, are shown in Figure 5.5. In the period from 1975 (whenoil exports first became significant) to 2000, earnings from merchandiseexports were almost equally divided between oil and non-oil exports. Thisoverall equality, however, did not translate into a steady division duringthe 25-year period. Fluctuations in the share of oil and its products in totalmerchandise exports were quite significant, with a coefficient of variationof nearly 38 percent.
The main contributors to foreign exchange earnings in 1975–2000 areshown in Figure 5.6.
For much of the entire period 1965–2000, little effort was directedtowards stimulating agricultural exports. Exchange rate and trade policiesdiscriminated against the expansion of farm exports. Policymakersappeared to take as axiomatic that such exports would grow only slowlybecause of the low elasticity of foreign demand. This view was largely shapedby the falling exports of raw cotton. It was accepted that demand for someother agricultural products, such as fruits and vegetables, might be morebuoyant, but earnings were expected to be limited by restrictions imposedby the importing countries as well as by supply elasticities in Egypt.
124 The external sector
Per
cent
age
of m
erch
andi
se e
xpor
ts 90
80
70
60
50
40
30
20
10
01975 1977 1979 1981 1983 1985 1987 1989 1991 1993 1995 1997 1999
Oil Non-oil
Figure 5.5 Oil and non-oil exports, 1975–2000 (percent of merchandise exports)(source: CBE; World Bank LDB).

Major issues
One of the major conclusions of this chapter is that difficulties on Egypt’sbalance of payments were caused to a significant degree by the inadequategrowth of exports, and particularly of non-oil manufactured exports. Theargument for an export-led development strategy and the major issuesrelated to export development are explored in the chapter on sustainabledevelopment. That chapter concentrates on the more recent years andconducts the discussion for the most part in terms of the data, policies,and institutional arrangements of the 1990s. For a more complete under-standing of issues relating to Egypt’s external sector, the relevant sectionof Chapter 10 should be read together with the discussion in the presentchapter.
Throughout 1965–2000, policymakers remained concerned about thegap on the external accounts and on how to finance it. The governmentitself prepared numerous reports, and Egypt’s balance of payments prob-lems were dissected in several studies – for example, Hansen and Marzouk(1965), Mabro (1974), Hansen and Nashashibi (1975), Mabro andRadwan (1976), Ikram (1980); by multilateral and bilateral institutions –in particular, World Bank (1978, 1983, 1995b), Nathan Associates (1997,1999); and from investigations conducted jointly by the Government ofEgypt and international agencies – for instance, GOE/World Bank(2000). This plethora of enquiries focused chiefly on different aspects of asingle underlying problem: the failure of Egypt’s foreign exchange earn-ings, particularly from merchandise exports, to grow at rates that wouldsupport sustained, high-level growth by the economy. A concomitant ofthis problem was the issue of external debt, which resulted because of thecontinuing shortfall in foreign exchange earnings.
The external sector 125
Per
cent
age
of F
EE
35
30
25
20
15
10
5
01975 1977 1979 1982 1984 1986 1988 1990 1992 1994 1996 1998 2000
RemittancesTourismOilSuez
Figure 5.6 Main contributors to foreign exchange earnings, 1975–2000 (percent offoreign exchange earnings) (source: CBE; World Bank LDB).
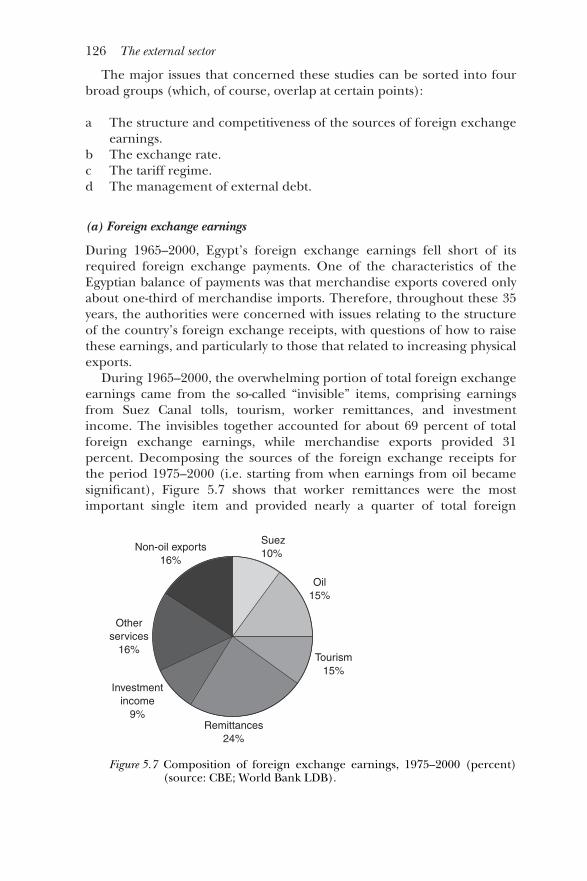
The major issues that concerned these studies can be sorted into fourbroad groups (which, of course, overlap at certain points):
a The structure and competitiveness of the sources of foreign exchangeearnings.
b The exchange rate.c The tariff regime.d The management of external debt.
(a) Foreign exchange earnings
During 1965–2000, Egypt’s foreign exchange earnings fell short of itsrequired foreign exchange payments. One of the characteristics of theEgyptian balance of payments was that merchandise exports covered onlyabout one-third of merchandise imports. Therefore, throughout these 35years, the authorities were concerned with issues relating to the structureof the country’s foreign exchange receipts, with questions of how to raisethese earnings, and particularly to those that related to increasing physicalexports.
During 1965–2000, the overwhelming portion of total foreign exchangeearnings came from the so-called “invisible” items, comprising earningsfrom Suez Canal tolls, tourism, worker remittances, and investmentincome. The invisibles together accounted for about 69 percent of totalforeign exchange earnings, while merchandise exports provided 31percent. Decomposing the sources of the foreign exchange receipts forthe period 1975–2000 (i.e. starting from when earnings from oil becamesignificant), Figure 5.7 shows that worker remittances were the mostimportant single item and provided nearly a quarter of total foreign
126 The external sector
Suez10%
Oil15%
Tourism15%
Remittances24%
Non-oil exports16%
Otherservices
16%
Investmentincome
9%
Figure 5.7 Composition of foreign exchange earnings, 1975–2000 (percent)(source: CBE; World Bank LDB).

exchange earnings; oil exports provided 15 percent; while Suez Canal tollsand tourism contributed 10 percent each.
The earnings responded to different influences:
• Suez Canal dues were sensitive to the level of, and changes in, inter-national trade.
• Oil prices depended on world supply and demand, with an importantdeterminant of supply being the decisions taken by the Organizationof Petroleum Exporting Countries (OPEC). In general, internationalprices for Egyptian oil tended to be somewhat lower (on averageroughly $2 per barrel) than those for Brent marker crude.
• Worker remittances responded to economic conditions in the Gulfcountries, which determined the amount of labor migration to that areaand the incomes received by the workers. The officially measured figurescould be somewhat misleading, as the flow of remittances was sensitiveto the exchange rate and could come into Egypt through both officialand non-official channels. The entire increase in the flow after exchangerate devaluation would not necessarily represent additional amounts forthe country as a whole, but might simply reflect a switch from unofficialto official channels. Increases in the domestic interest rate together withperceptions of greater financial security in the country could also lead toan inflow of earnings previously held abroad; the latter could be consid-erable – Abu Ali (1987) estimated them at $60 billion.
• Tourism receipts were sensitive to the exchange rate and the securitysituation in Egypt and the Middle East region. Tourism revenuesduring the period 1965–2000 were estimated by a variety of methods,none fully satisfactory. Initially, the Ministry of Tourism used aformula in which the average tourist expenditure of $64 a night in1977 was taken as a base. For subsequent years, the average expendi-ture was assumed to have increased by 15 percent per annum; thisaverage was multiplied by the number of registered tourist nightsspent in the country. This procedure was later modified, but asTohamy and Swinscoe (2000: 4–5) point out, because the spending ofthe large number of expatriate Egyptians taking their vacations inEgypt are not included in tourism receipts (contrary to the WorldTourist Organization’s guidelines), the recorded figures mightsignificantly understate the actual revenues.
Most of the sources of foreign exchange earnings were highly volatile.Annual fluctuations in the “Big Four” (Suez Canal, oil, tourism, workerremittances) from 1975–2000 are shown in Figure 5.6. All the itemsdisplay a fair degree of variability, but the most volatile were earningsfrom oil and from tourism, which had coefficients of variation of 47.2 and52.7 percent respectively. These coefficients were roughly twice those ofthe other items.
The external sector 127

Export competitiveness
An indication of export prospects is provided by the index of revealedcomparative advantage. The revealed comparative advantage (RCA) forcountry i for product j is measured by the item’s share in the country’stotal exports relative to its share in world trade. The interpretation is thatif the RCA index is greater than unity, the country possesses a comparativeadvantage in that commodity; if it is less than unity, a comparative disad-vantage. A value of, say, 3.5 for a commodity indicates that its share inexports of country i is 3.5 times its share in world trade.2
The RCA has been estimated for several Egyptian products over differ-ent time periods.3 Table 5.3 summarizes the overall results by broadproduct groups. During the two decades covered by the data, a number ofchanges in revealed comparative advantage occurred.
Generally speaking, the calculations showed that Egypt’s comparativeadvantage lay mainly in sectors related to food (including processed foodssuch as preserved fruits and vegetables, pasta, confectionery, and cheeses),textiles and clothing products (including textile yarn and thread, cottonfabrics, and non-fur clothing). A comparative advantage also existed attimes in aluminum, ferrous metals, and fertilizers. The country’s compara-tive advantage was least in capital-intensive industries, such as machineryand transport equipment; however, some apparently labor-intensivemanufactures, such as furniture and footwear, also (somewhat surpris-ingly) have RCA indexes less than unity.
These conclusions are reinforced by an examination of the type ofcommodities entering into Egypt’s export trade. The analysis shows thatchanges did occur in the pattern and direction of Egypt’s exports, but thechanges did not keep up with the pace of changes globally.
While oil exports represented slightly less than half of total merchan-dise exports, the share of manufactured goods in total merchandiseexports rose considerably (from 11 percent in 1980 to 40 percent by1998), particularly the share of textiles and clothing manufactures that
128 The external sector
Table 5.3 Revealed comparative advantage by product groups, 1970, 1980, 1992
Product groups 1970 1980 1992
Foods and feeds 3.23 2.20 1.07Beverages and tobacco 0.38 0.38 0.10Crude materials 0.21 0.31 0.00Refined fuels 0.13 4.57 9.06Animal and vegetable oils 0.55 0.11 0.00Chemicals 0.72 0.25 0.62Manufactures by material 2.22 1.69 1.75Machinery and transport equipment 0.13 0.25 0.34Miscellaneous manufactures 1.07 0.50 0.87
Source: World Bank (1995b: vol. 2, Table 5.7).

rose from 7 percent of total merchandise exports in 1980 to 24 percent in1998. Furthermore, the importance of Egypt’s trading partners changedsomewhat in the last decade, with the share of the European Uniondecreasing from 59 percent to 48 percent, the share of the USA increasingfrom 9 percent to 13 percent and a strengthening of regional trade withthe share of the Middle East and North Africa sub-region doubling from 6percent to 12 percent.
The effects of these changes can be examined using “constant marketshare analysis,” which decomposes growth in exports into the differentfactors that would affect its loss or gain of market shares.4 The techniqueassumes that a country’s export growth can fall behind the average ofworld export growth for three reasons: (1) its export composition may betoo heavily concentrated in commodities for which world demand isgrowing relatively slowly; (2) its exports may be going disproportionatelyto regions that are growing slowly; and (3) its exports might not be able tocompete with other sources of supply.
An application of this technique to Egypt’s exports at the three-digitlevel for the 1990–2000 decade shows that while during this period worldexports were growing at close to 6 percent a year, Egypt’s export growthaveraged less than 2 percent.5 Egypt was unable to benefit from the buoy-ancy in international trade because her export basket was insufficientlyweighted by the fast-growing commodities, and because she lost groundeven in the export of her traditional commodities as a result of decreasingability to compete with other suppliers of those products; thus the effectsof (1) and (3) above were negative. The direction of exports changedsomewhat, with a decrease in the share of the European Union and anincrease in those of the United States and the Middle East region; thussuch growth as did occur resulted largely from the general expansion ofworld trade and a change in the direction of exports, i.e. the impact offactor (2) was mildly positive.
It is not surprising that a TradeCAN (Trade Competitiveness Analysis ofNations) analysis for the 1990s – breaking down exports into four cate-gories: rising stars, declining stars, missed opportunities, and retreats –confirmed that Egypt’s export composition had a significant percentageof “declining stars.” This not only provides an explanation of pastperformance, but also raises some concerns about future exportpossibilities and missed opportunities. These findings are summarized inTable 5.4.
The basic reason for the lack-luster performance of exports was theincentive framework and deficiencies in the trade-related infrastructureand services. The major impeding factors in the incentive frameworkincluded: (1) an exchange rate regime, tied de facto to the US dollar, thatled to a 70 percent appreciation of the real exchange rate between 1992and 2000, and acted as a significant export tax; (2) high nominal andeffective tariffs, which increased the profitability of producing for the
The external sector 129
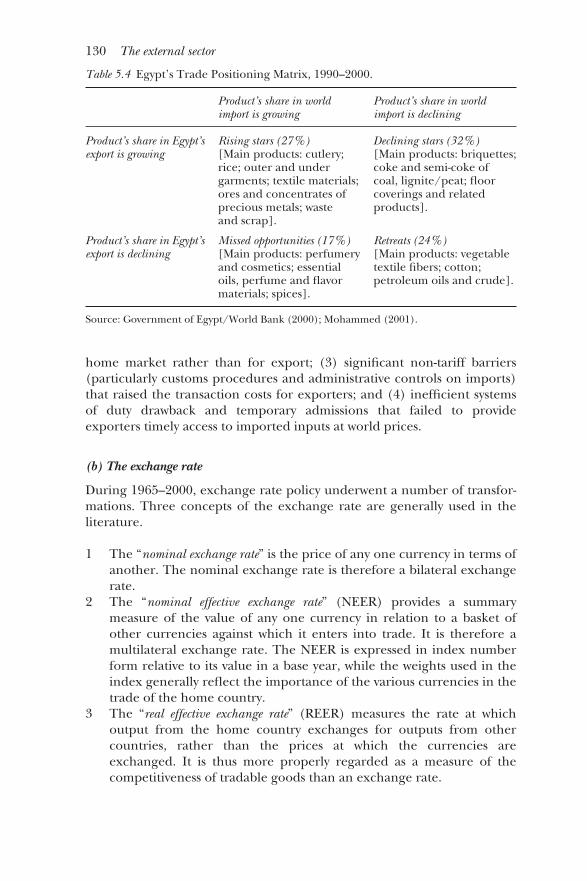
home market rather than for export; (3) significant non-tariff barriers(particularly customs procedures and administrative controls on imports)that raised the transaction costs for exporters; and (4) inefficient systemsof duty drawback and temporary admissions that failed to provideexporters timely access to imported inputs at world prices.
(b) The exchange rate
During 1965–2000, exchange rate policy underwent a number of transfor-mations. Three concepts of the exchange rate are generally used in theliterature.
1 The “nominal exchange rate” is the price of any one currency in terms ofanother. The nominal exchange rate is therefore a bilateral exchangerate.
2 The “nominal effective exchange rate” (NEER) provides a summarymeasure of the value of any one currency in relation to a basket ofother currencies against which it enters into trade. It is therefore amultilateral exchange rate. The NEER is expressed in index numberform relative to its value in a base year, while the weights used in theindex generally reflect the importance of the various currencies in thetrade of the home country.
3 The “real effective exchange rate” (REER) measures the rate at whichoutput from the home country exchanges for outputs from othercountries, rather than the prices at which the currencies areexchanged. It is thus more properly regarded as a measure of thecompetitiveness of tradable goods than an exchange rate.
130 The external sector
Table 5.4 Egypt’s Trade Positioning Matrix, 1990–2000.
Product’s share in world Product’s share in world import is growing import is declining
Product’s share in Egypt’s Rising stars (27%) Declining stars (32%)export is growing [Main products: cutlery; [Main products: briquettes;
rice; outer and under coke and semi-coke of garments; textile materials; coal, lignite/peat; floor ores and concentrates of coverings and related precious metals; waste products].and scrap].
Product’s share in Egypt’s Missed opportunities (17%) Retreats (24%)export is declining [Main products: perfumery [Main products: vegetable
and cosmetics; essential textile fibers; cotton; oils, perfume and flavor petroleum oils and crude].materials; spices].
Source: Government of Egypt/World Bank (2000); Mohammed (2001).

In the context of multilateral Egyptian trade, the REER is defined as thenominal effective exchange rate (NEER) multiplied by the price ratio ofEgyptian, P(EG), to foreign, P(F), goods:
REER � NEER * P(EG)/P(F)
A further concept, the “equilibrium real effective exchange rate” (EREER),measures the REER that would provide equilibrium in both the internaland external markets is sometimes calculated, using econometric models.
Each of these concepts is illustrated in the discussion that follows.The REER is important because trade competitiveness depends not
only on changes in the exchange rate, but also on the relation betweenthe inflation rates in Egypt and in the countries with which it trades.However, more than the usual care is required in interpreting measures ofthe REER in Egypt. The downward bias introduced into Egyptian priceindexes by widespread price controls means that the measurement of theREER in the usual manner (using the consumer price index) is likely toshow competitiveness for the country that might be quite spurious. More-over, measures of the REER during the 1960s and early 1970s are espe-cially shaky, since they do not include trade with the communist countries,which bulked so large in total trade during these years.
The REER can be defined in two principal ways: (1) in external terms, asthe nominal exchange rate adjusted for price level differences betweencountries (as in the equation above); or (2) in internal terms, as the ratioof the domestic price of tradable to nontradable goods within a singlecountry.6 In this book, the REER is defined in external terms.
The nominal exchange rate
The previous chapters described changes in Egypt’s foreign exchangesystem from the 1960s until the early 1980s. The present examinationfocuses on the period since 1987, when a degree of liberalization of theexchange system was introduced. Abdel-Khalek (2001: 61) sums up theoverall experience of Egypt’s exchange rate until 1991 as “one of repeatedfailed attempts at establishing a unified exchange rate.”
Before May 1987, the interbank foreign exchange market was dividedinto two pools. The Central Bank pool was responsible for foreignexchange dealings relating to exports of petroleum, cotton, rice, and theSuez Canal. It also dealt with imports of essential foodstuffs, insecticides,fertilizers, and most public sector capital transactions. The commercialbank pool was fed by receipts from worker remittances, tourism, andexports that were not covered by the Central Bank pool; foreign exchangepayments for the public sector that were not covered by the Central Bankpool were also made through the commercial bank pool. The exchangerate in the Central Bank pool was officially determined and was set for the
The external sector 131

most part at the official rate of LE 0.7 per US dollar. The rate in the com-mercial bank pool (LE 1.36/US$) was closer to a market rate, but was nev-ertheless heavily influenced by official intervention.
In 1985 the rate in the commercial bank pool was devalued by about 60percent. In May 1987 a new bank foreign exchange market (in which allauthorized commercial banks were allowed to operate) was created, withthe exchange rate initially set at LE 2.165/US$. Thereafter, the rate in thismarket was set by a committee on the basis of supply and demand con-ditions in the interbank market, and by the end of 1990 had reached LE3.0/US$. The devaluations of the exchange rate in the Central Bank poolto LE 1.1/US$ in August 1989 and LE 2.0/US$ in July 1990 were not verysignificant, since this rate accounted at the time for barely 15 percent oftotal transactions. Moreover, foreign exchange receipts in this marketwere taxed and users subsidized, so that the rate effectively remained atLE 0.7/US$.
On February 27, 1991 the multiple exchange rate system was replacedby a dual exchange rate system consisting of a primary and a secondarymarket. The original intention was to unify the primary and secondarymarkets after one year. However, the unification was accelerated andoccurred on October 8, 1991; the unified rate involved a further devalu-ation of about 15 percent, to LE 3.3/US$.
The Real Effective Exchange Rate
The REER was not used as a policy instrument but, as Hansen (1991: 204)says, resulted from “the fortuitous outcome of other countries’ exchangerate policies and of price developments outside the control of the Egypt-ian government.” Hansen estimates that the REER appreciated stronglyduring 1965–68. It depreciated thereafter until 1979, with a minor appre-ciation in 1974–76. The main reason for the real effective depreciationwas the depreciation of the nominal exchange rate against the dollar in1973 and again in 1979. In 1973–79, the joint result of developments inthe nominal exchange rate, Egyptian price levels, and changes in inflationrates in partner countries was an estimated real effective depreciation of28 percent.
From 1980 to 2000 movements in the REER again depended more onvariations in partner country prices than on changes in the nominalexchange rate. For virtually the entire decade of the 1980s, the nominalexchange rate remained fixed at LE 0.7/$, and for most of the 1990s ithovered around LE 3.4/$. The REER, on the other hand, appreciatedquite sharply until 1984 and then steadily depreciated until 1991, beforebeginning another appreciation that continued until 2000.
Movements in the Nominal Exchange Rate, the Nominal EffectiveExchange Rate (NEER), and the Real Effective Exchange Rate (REER) forthe period 1980–2000 are shown in Table 5.5.
132 The external sector
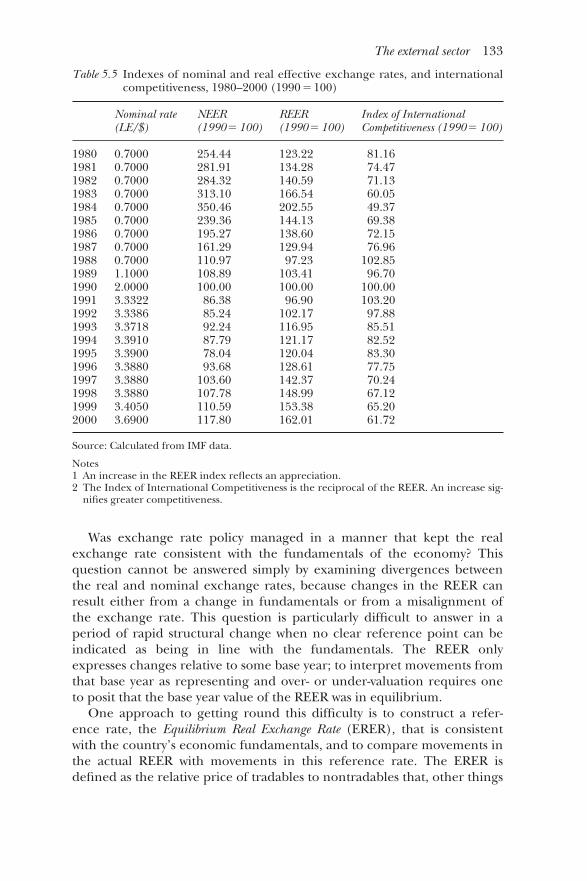
Was exchange rate policy managed in a manner that kept the realexchange rate consistent with the fundamentals of the economy? Thisquestion cannot be answered simply by examining divergences betweenthe real and nominal exchange rates, because changes in the REER canresult either from a change in fundamentals or from a misalignment ofthe exchange rate. This question is particularly difficult to answer in aperiod of rapid structural change when no clear reference point can beindicated as being in line with the fundamentals. The REER onlyexpresses changes relative to some base year; to interpret movements fromthat base year as representing and over- or under-valuation requires oneto posit that the base year value of the REER was in equilibrium.
One approach to getting round this difficulty is to construct a refer-ence rate, the Equilibrium Real Exchange Rate (ERER), that is consistentwith the country’s economic fundamentals, and to compare movements inthe actual REER with movements in this reference rate. The ERER isdefined as the relative price of tradables to nontradables that, other things
The external sector 133
Table 5.5 Indexes of nominal and real effective exchange rates, and internationalcompetitiveness, 1980–2000 (1990�100)
Nominal rate NEER REER Index of International (LE/$) (1990�100) (1990�100) Competitiveness (1990�100)
1980 0.7000 254.44 123.22 81.161981 0.7000 281.91 134.28 74.471982 0.7000 284.32 140.59 71.131983 0.7000 313.10 166.54 60.051984 0.7000 350.46 202.55 49.371985 0.7000 239.36 144.13 69.381986 0.7000 195.27 138.60 72.151987 0.7000 161.29 129.94 76.961988 0.7000 110.97 97.23 102.851989 1.1000 108.89 103.41 96.701990 2.0000 100.00 100.00 100.001991 3.3322 86.38 96.90 103.201992 3.3386 85.24 102.17 97.881993 3.3718 92.24 116.95 85.511994 3.3910 87.79 121.17 82.521995 3.3900 78.04 120.04 83.301996 3.3880 93.68 128.61 77.751997 3.3880 103.60 142.37 70.241998 3.3880 107.78 148.99 67.121999 3.4050 110.59 153.38 65.202000 3.6900 117.80 162.01 61.72
Source: Calculated from IMF data.
Notes1 An increase in the REER index reflects an appreciation.2 The Index of International Competitiveness is the reciprocal of the REER. An increase sig-
nifies greater competitiveness.

being equal, results in the simultaneous attainment of internal and exter-nal equilibrium. Internal equilibrium means that the nontradable goodsmarket is cleared with no unemployment above its “natural” level, i.e. therate of unemployment below which shortages in the labor market will gen-erate wage increases and lead to price inflation. External equilibriummeans that the present and future current account balances are compati-ble with long-term sustainable capital flows. The fundamentals that deter-mine the ERER include international prices; international transfers(including foreign aid flows); external debt relief (which is a form of aid);world real interest rates; import tariffs, quotas, and export taxes; exchangeand capital controls; other taxes and subsidies; the composition of govern-ment expenditure; and technological progress.
In a study for the IMF, Mongardini (1998) compared the path of anestimated ERER with the REER for the period 1987–96. The ERER wasderived from the empirical estimation of a simplified theoretical model ofthe economy originally developed by Edwards (1994). While the resultsultimately depend on the quality of the theoretical model, the comparisonbetween the actual and the equilibrium rate will be independent ofthe base year, because it is the difference between the two rates that isrelevant.
Mongardini concluded that the real exchange rate was substantiallyovervalued during 1987–93, but thereafter moved closer to the equilib-rium rate and by 1996 was only moderately (about 7 percent) over-valued.The REER and the ERER converged during 1991–95 because of theappreciation of the latter rate, and resulted chiefly from the 1991–96 ParisClub debt rearrangements. The debt restructuring caused the debt:serviceratio to fall sharply, which improved the sustainability of the currentaccount and led to an appreciation of the ERER. However, later calcula-tions suggest that after 1996 Egypt’s REER again increased vis-à-vis theequilibrium rate, because the US dollar (to which the Egyptian currencywas pegged) continued to appreciate against most other currencies, andbecause Egypt’s inflation rate was higher than that of the United States.7
Did the appreciation of the REER hinder the growth of exports? Subra-manian (1997: 46–7), in common with the analyses of the IMF, consideredthat increases in the REER had been detrimental to exports. He arguedthat if the appreciation of the REER were caused by productivity improve-ments, then one should expect some gains in the performance of tradablegoods, and particularly that of non-oil exports. He did not find such gains,even though demand conditions in the partner countries remainedbuoyant. He therefore concluded that the explanation for declining mer-chandise exports was likely to be rooted, inter alia, in price increases thatwere not offset by productivity gains.
Some other commentators have been more skeptical of the harmfuleffect on exports of an appreciation in the REER, and the policy prescrip-tion of correcting this by a devaluation of the nominal rate. These views
134 The external sector

reflect two main lines of thought. One is that devaluation would raise thecost of capital, thereby discouraging investment and production; thesecontractionary effects on the supply side are judged to be more damagingto the growth of exports than the expansionary effect generated byforeign demand following a price reduction; see, for example, Abdel-Khalek (1997); Korayem (1997). The other line of enquiry focuses on theelasticities of demand for some Egyptian exports and finds them to be lowor not statistically significant. This suggests that the relationship betweenEgyptian export growth and movements in the REER is weak, and thatdevaluation of the exchange rate would be unlikely to correct the currentaccount deficit.
This elasticity pessimism appears to have arisen, at least in part, becausethe external imbalance did not right itself after the episodic devaluationsthat occurred. But such a view underemphasizes two factors. First, non-oilmanufactured exports (the items most likely to respond to changes inprices via the exchange rate) accounted for only about 30 percent of mer-chandise exports in the decade 1991–2000. Thus even a fairly large growthon the part of these commodities could not be expected to quickly elimi-nate the current account deficit; this is expecting the tail to wag the dog.Second, the authorities paid scant attention to improving the institutionsand structures that would support the export incentive produced by theexchange rate depreciation.8 The caution of policymakers worked againsta multi-pronged approach (such as reforming institutions pari passu withexchange rate adjustments). A World Bank minute reported a Ministersaying that, “You do not test the depth of a river with both feet.” Thisignored the fact that an economy consists of closely interrelated parts, andthat therefore piecemeal reforms have weaker effects, because they do notreinforce each other. The upshot was that opportunities created byexchange rate adjustments were likely to have been significantly abridged,even if not completely annulled.
Proponents of the elasticity pessimism view believed, in effect, that theMarshall–Lerner condition for a devaluation to improve the trade balancewas not met in Egypt.9 Formally, the condition states that if trade is ini-tially balanced and the elasticities of supply of exports and imports areinfinite, devaluation will improve the trade balance if the absolute sum ofthe foreign elasticity of demand for exports and the home elasticity ofdemand for imports (measured in the same currency) exceeds unity. Thatis, devaluation will improve the current account of the balance of pay-ments if:
|Em|� |Ex|�1
where Em is the price elasticity of demand for imports, and Ex is the priceelasticity of demand for exports. The formal Marshall–Lerner condition isbased on the assumptions of perfect competition, one export good and
The external sector 135
one import good, and the maintenance of full employment. The con-dition becomes more complex if trade is not initially in balance.10
Egyptian debates on the effectiveness of exchange rate devaluation mayhave been rendered less than conclusive because elasticities have beenestimated in a manner that is methodologically suspect. This is for anumber of reasons.
A classic paper by Orcutt (1950) demonstrated why the results obtainedin most estimations of trade elasticities had to be viewed with serious reser-vations. He showed that the data and methods employed tended to biasthe estimates downwards. Orcutt provided five reasons for the existence ofa bias towards zero.
IDENTIFICATION
The observed values of the price and quantity of exports result from thesimultaneous interaction of factors affecting both foreign demand anddomestic supply. But if the elasticity is estimated using single equationmodels, demand and supply factors will be mixed up. The estimate of theelasticity will then be the outcome of adding the negative demand elastic-ity to the positive supply elasticity, and will thus be lower than it is inreality. Therefore, Orcutt argued that in order to avoid the “identifica-tion” problem, export demand and supply elasticities must be estimated ina simultaneous equation framework.
AGGREGATION
Orcutt argued that price changes, for example for imports, were largest forgoods with low price elasticities of demand. Thus, when many commoditiesare aggregated together, the biggest weight in the average price index willbe of commodities with inelastic demand. Since the quantity changes forsuch commodities tend to be small, the estimated price elasticity of thetotal aggregate is likely to be low. Because such aggregative indexes mightunderstate the true elasticity by giving undue weight to goods with lowerelasticities, Leamer and Stern (1970: 41–9) argue that price indexes shouldbe reweighted proportionally to the individual demand elasticities.
TIME LAGS
Orcutt demonstrated that long-run price elasticities of imports andexports were likely to be substantially larger than short-run price elastici-ties. However, elasticity estimates frequently relate the volume of currentimports or exports with current prices. If, as the empirical evidence sug-gests, quantity adjustments in response to a price change are spread over anumber of years, then the measured effect of price changes on quantitywill underestimate its actual long-run effect.
136 The external sector

ERRORS OF MEASUREMENT
Orcutt showed that if errors occur in the measurement of price changes,the average estimated response to price changes will be biased downwards.Measurement errors are particularly likely in work on international trade,because elasticity estimates overwhelmingly use unit values and not priceindexes. The use of unit values can create errors because it does not allowfor quality differences; thus changes in the demand for goods of differentquality (within the same overall total) can lead to changes in unit values,even if the prices of the goods demanded have not changed.
THE SIZE EFFECT
Orcutt suggested that the price elasticity of demand for imports or exportsdepends on the size of the change, and is probably much larger for largeprice changes than for small. Exporters and importers will tend to ignoresmall price changes, because they do not wish to lose market shares, andbecause the costs of changing suppliers can be significant. Hence, theelasticity of demand schedules for exports and imports will not beindependent of the size of the price change, and will be more elastic forlarge than for small changes.
Orcutt’s paper gave rise to a large amount of discussion and empiricaltesting in, to cite only some of the best known, Neisser and Modigliani(1953: 226–30), Harberger (1957: 5089), Haberler (1958: 3–9), Klein et al.(1961: 126–36), Prais (1962: 260–70), and more recently Winters (1991:276–8), Thirlwall and Gibson (1992: 166–8), and Joshi and Little (1994:284–91). The conclusion appears to be that some of the reasons advancedby Orcutt for a downward bias (in particular, the size effect) are not veryimportant quantitatively, but his main finding holds, namely, that regressingtotal exports on their average price will in general not give a fair estimate ofthe elasticity of demand. In particular, the downward bias created by notusing a simultaneous equation framework is likely to remain significant, andshort-term elasticities will tend to be lower than their long-term estimates.
Estimates of elasticity for Egypt’s exports (and imports) are prone toone or more of the maladies identified by Orcutt. Virtually all the esti-mates involve the use of single equation models estimated by ordinaryleast squares, and are thus subject to the identification problem. It istherefore likely that the estimates are biased downwards. The estimatesalso suffer from the problems of aggregation and probably from errors ofmeasurement, both of which are again likely to produce a downward biasin the estimate. Finally, the studies have paid only rather cursory attentionto the time-lags between the adoption of the policy and the response ofexports, and to the differences between short- and long-run elasticities.
Apart from the criticisms raised by Orcutt, other weaknesses in most ofthe statistical procedures used in the analysis of Egypt’s foreign trade havebeen pointed out. Perhaps the most important is that the time series have
The external sector 137
not been tested to see if they are “stationary,” i.e. that the key properties(such as the mean and the variance) do not change systematically withtime.11 If the data are “nonstationary,” regression analysis can provide spu-riously inflated values of R 2, the Durbin–Watson, and t statistics of theindependent variable, thereby erroneously suggesting that a meaningfulrelation exists among the regression variables.
An exception to the use of single equation demand estimates wasPearson (1997) who used a simultaneous equation procedure, and whoseapproach explicitly followed Virmani (1991) and Joshi and Little (1994).He found that demand for Egypt’s exports, and for non-resource-basedmanufactured exports (i.e. excluding SITC [Rev 1] categories 0–4, 61, 63,66, 68–69) was reasonably price-sensitive. His estimate of the elasticity ofexport demand with respect to the ratio of export to domestic priceswas �1.03 and to world income �1.05; corresponding figures for manufac-tured exports were �1.09 and �1.06. Import elasticity was estimated at 0.89.
Some caveats apply to the study. The time period covered (1981–94)might be too short. The use of unit values to represent prices is subject tolimitations. Further, the export supply function used here does not takeaccount of export subsidies. Incorporating the effect of subsidies wouldchange the specification of the equation, because the price received by anexporter is not PX, but rather PX(1� s), where s is the rate of exportsubsidy. In recognition of this, several studies, such as Joshi and Little aswell as Virmani, doctor the export price in this manner to reflect thesubsidy. Finally, domestic prices in the export supply equation are betterrepresented by the wholesale rather than the consumer price index,because of the problems with the latter.
An even more methodologically-careful study was carried out byNathan Associates (1999). This study examined the period 1980–98 andestimated both import demand and export demand functions. For bothimports and exports, the average real effective exchange rate elasticitieswere relatively high.
On the import side, income was found to be statistically significant(generally at the 99 percent level of confidence) in explaining thedemand for imports. For income, the unweighted average elasticity was0.95 in the short run and 2.2 in the long run. The average trade-weightedelasticities for 1997 were substantial: 1.1 in the short run and 2.5 in thelong. Thus, in Egypt as in other countries, import demand was income-inelastic for most products in the short run, but income-elastic in thelonger run. The average real effective exchange rate elasticities were alsorelatively high. For all products, the 1997 trade-weighted average elasticitywas 0.7 in the short run and 0.9 in the long run. The study found that,overall, the absolute values of the price and exchange rate elasticities ofEgypt’s import demand were similar to one another, though there wereconsiderable differences for individual products.
On the export side, foreign income was always statistically significant
138 The external sector

(again at the 99 percent confidence level) in explaining demand. Theaverage real effective exchange rate elasticities were also relatively high; fur-thermore, the effective exchange rate had a greater impact on exportmarkets than it did on imports. For all products and markets, the 1997 trade-weighted average elasticity was �0.89 in the short run and �0.81 in the long.In short, the absolute sum of the export and import elasticities was muchlarger than unity, and the Marshall–Lerner condition was comfortably met.
Egypt’s external trade in services is dominated by transportation-relatedactivities and other distributive services on the import side, and by tourismon the export side; these activities responded to the exchange rate. AWorld Bank report found that year-to-year variations in Egypt’s touristarrivals by origin could be associated with variations in the originatingregion’s income and Egypt’s real exchange rate, as well as with proxiesaccounting for the effect of the security situation. As a rough indication, a1 percent increase in world GDP was associated with an increase in touristarrivals of 2.2 percent, and a 1 percent real appreciation in the exchangerate reduced arrivals by 0.4 percent. The security situation (whether exter-nal or internal) obviously played the dominant role; for example, the firstGulf war reduced arrivals by 28 percent in 1990. Another sharp fall intourist arrivals and earnings occurred after 58 tourists and four Egyptianswere killed at Luxor on November 18, 1997.
The Nathan Associates (1999) study found that the elasticity of importservices to the real effective exchange rate was high in the short run. Forexports, the real effective exchange rate elasticity worked out at �0.2 inthe short run (one-period lag) and �0.4 in the long run. Thus, forexample, a 10 percent devaluation in the REER would lead to a 2 percentincrease in export earnings from services after one year, but 4 percentafter a few years.
The study simulated the real effective exchange rate that would yield anoverall balance in the balance of payments in 1998. The results indicatedthat the real effective exchange rate that prevailed in 1998 would need tohave been devalued by 14 percent to eliminate the deficit. According to thesimulation, imports adjusted quickly to the devaluation while exports tookseveral years to adjust fully. However, because exports continued to respondto a one-time devaluation while the import response was completed in amuch shorter period, the cumulative response to the 14 percent devalu-ation ended up by being more than twice as high for exports (8.3 percentexpansion) than for imports (3.5 percent contraction).
Apart from the findings of econometric studies, the experience of high-exporting countries also has not been kind to the notion that fast exportgrowth can be correlated with an appreciating real exchange rate. All theEast Asian high performers (China, Korea, Taiwan, Thailand, Malaysia,Singapore, Hong Kong) followed a conscious policy of keeping theirexchange rates undervalued. But Egypt’s REER appreciated steadily formost of the two final decades of the twentieth century. The effects of the
The external sector 139

appreciation became even more important after the East Asian financialcrisis of 1997, when Egypt’s REER appreciated by over 40 percent againstthe exchange rates of its main East Asian competitors (Korea, Thailand,Malaysia, and Indonesia).
There is no reason to suppose that Egyptian exports are exempt from theconnection between low prices and increased demand. Most of Egypt’sforeign exchange earnings derive from tourism, worker remittances, andother services, and these items have shown themselves sensitive to theexchange rate. Moreover, any export-promotion policy must give clear signalsto entrepreneurs to increase the supply of tradables, and the exchange ratehas been an important source of such signals for investment allocations in thehigh-export countries. Through their reluctance to use the exchange rateactively for managing the balance of payments, Egyptian policymakers deniedthemselves an effective weapon that, used in conjunction with others, hasplayed a major role in the export success of many countries.
However, the elasticities approach to the balance of payments repre-sents a partial equilibrium model that examines the effects of changes inthe exchange rate only on the external balance. It is not complete becauseit does not take into account the macroeconomic effects on domestic eco-nomic activity and the effects that these, in turn, have on the balance ofpayments. An attempt by the World Bank to model the effects of domesticabsorption on exports, in addition to the effects of world demand, foundthat the elasticity of exports with regard to world trade, while significant,was lower than the elasticity with respect to domestic absorption. Periodsof higher export growth rates were associated with periods in which worldtrade had grown and domestic absorption had contracted, and the exportgrowth tended to follow depreciations of the currency with a one-year lag.There is room for a more complete study that would integrate the elastici-ties approach with Alexander’s (1952) “absorption” approach, and alsoincorporate the effects of capital movements, as in the analysis due toMundell (1963) and Fleming (1962).
Even if the Marshall–Lerner condition is met, one must allow for alapse of time before quantities adjust sufficiently to offset the change inthe price of foreign exchange. Thirlwall and Gibson (1992: 166–7)attribute this lapse of time to the longevity of pre-devaluation contracts,and to lags in recognition, decision, production, and delivery on the partof importers and exporters. The time-lags can be substantial – in adetailed analysis of the 1967 devaluation of the British pound, Masera(1974) estimated that it took 18–24 months for the current account tomove into balance. Williamson (1982: 154) reports the evidence asshowing that trade responds within months to changes in income, but rea-sonably complete adjustment to price changes may take three years or so.Some calculations by the World Bank on Egypt’s experience withexchange rate depreciations suggest that it took 12–18 months for non-oilmanufactured exports to rise in a significant manner.
140 The external sector

A number of conclusions follow from this review of the effects ofexchange rate changes on Egypt’s foreign exchange earnings. First, somecareful studies indicate that Egypt’s trade (including the important ser-vices component) is sufficiently responsive to changes in the real effectiveexchange rate as to meet the elasticity conditions for an improvement inthe balance of payments. Second, significant effects from the exchangerate changes begin to show after a lag of at least one year. Third, the pullof the domestic market remains strong, and a successful export policymust include measures to reduce the domestic absorption of exportables.Fourth, exchange rate devaluation may not be sufficient to induce invest-ment in export capacity or in international distribution channels unlessthe devaluation is made durable. This would require the government tocarry out a consistent set of structural and institutional reforms (along thelines discussed in Chapter 10) and thereby reinforce its credibility withthe private sector and strengthen the effectiveness of its policies. If suchreforms are not implemented, experience shows that the effects ofexchange rate depreciation are likely to be erased in two to three years byinflation.
(c) The tariff regime
Tariffs have three main consequences. First, import duties enable finalgoods to be sold at higher-than-world prices, thereby providing largerprofits in the home compared to the international market. This tends todivert production and investment towards serving the domestic market andtowards the production of nontradable items. Moreover, the higher pricesthat can be extracted from consumers may make it profitably feasible toproduce commodities in which the country is not an efficient producer.Tariffs, therefore, form an important part of the incentive system that influ-ences the decisions of entrepreneurs whether to produce for the domesticor the export market. Second, tariffs add to the cost of intermediate inputs.Unless rebated quickly, they will raise production costs for exports andmake them less competitive; indeed, a key element in the Korean exportdrive was the swift rebate of tariffs on imported inputs. Third, tariffs can bemajor sources of revenues for the government – in 1991–2000, for example,customs duties provided over 20 percent of the Egyptian government’s taxrevenues and about 15 percent of its total revenue. They are thus likely tobe retained for revenue reasons, even though the authorities might recog-nize their effects in distorting incentives.
Throughout 1965–2000, Egyptian tariffs remained high and weregenerally higher than those of its neighbors. World Bank studies esti-mated average trade-weighted tariffs in Egypt at about 48 percent in 1976and 45 percent in 1981. In spite of reductions and consolidations, espe-cially in the early 1990s under the restructuring program, the World Bankestimated that in 1996 the trade-weighted average was 31 percent and that
The external sector 141
the rates remained widely dispersed. The overall tariff level significantlyexceeded the world average of 8.2 percent as well as the average for devel-oping countries (21.4 percent).
Madani and Olarreaga (2002) found that the most salient feature ofEgypt’s tariff structure was the degree of tariff escalation, i.e. tariffs werehigher for fully-processed products than for raw materials or semi-processed items. Most distorting tariffs were found in the manufacturingsectors, with tariffs ranging between 0–135 percent (excluding alcoholicbeverages). This has important effects on the effective rate of protection,that is, protection to value-added.
In the analysis of trade protection it is the effective, not simply thenominal, tariff that provides the more relevant measure.12 The nominaltariff rate is the rate announced in the tariff schedule. It is useful in assess-ing the extent to which the price to the consumer is likely to be raised bythe imposition of the tariff, and thus chiefly influences decisions taken bythe consumer. The effective rate of protection, on the other hand, isdefined as the percentage change in domestic value-added that resultsfrom the imposition of the tariff and other protective measures on theproduct and its inputs, as compared with world market value-added. Ittherefore indicates the effects that tariffs on the product and its inputshave on the processing activity, and thus on the choices of producers. Anindustry with an effective protection rate of, say, 50 percent can afford tobe 50 percent less efficient (i.e. use 50 percent more inputs) than itsforeign competitors and still maintain its domestic sales. Moreover, agiven duty on any finished product has a greater protective effect if it iscombined with low tariffs on the inputs of the protected industry than ifthe tariffs on these inputs are high. The tariff escalation found for Egypttherefore meant that the degree of protection provided to manufacturingin Egypt was substantially higher than the published tariff rates, and per-mitted the sector to live with a significant degree of inefficiency vis-à-vis itsexternal rivals.
Effective rates of protection in Egypt have varied significantly betweenagriculture and industry and between different sectors within these activ-ities. Hansen and Nashashibi (1975: 159–62, 309–12) estimated that in theearly 1960s agriculture did not appear to need protection; if anything, theeffective rates of protection and measures of the domestic resource coststo earn a dollar showed a slight negative protection.13 Industry, on theother hand, showed a very mixed picture. Sugar and cement appeared tobe competitive, but most of the others, including cotton textiles, were def-initely noncompetitive at the existing official exchange rate. The latterindustries showed high effective rates of protection as well as highdomestic resource costs to earn a unit of foreign exchange. Hansen (1991:539) also showed that high rates of protection led to significant declinesin competitiveness in both agriculture and industry in 1974–82.
A detailed study of effective rates of protection and domestic resource
142 The external sector

costs by the World Bank (1983) for Egyptian agriculture and industry inthe early 1980s showed several important sectors that were very highly pro-tected. Indeed, a number of these activities – such as chemicals, metals,transport equipment, china, and glass – could not sustain themselves withthe existing techniques and levels of productivity, if their products were tocarry international prices. A number of other sectors also showed highrates of effective protection, ranging up to 89 percent. The relativepattern of effective protection in the private sector was similar to thatencountered in public sector industry.
High effective rates of protection in industry continued until 2000.Nathan Associates (1998: i-ii) reported that the average effective rate ofprotection in manufacturing in the mid-1990s was over 34 percent, withsome rates well over 80 percent. The effective rate was considerably higherthan the nominal rate; thus, producers were able to set domestic priceswell above international prices of the same items, giving them a substan-tial incentive to sell in the home market rather than to export. The studyestimated that the tariff structure provided, on average, a 21.7 percentpremium to potential exporters of manufactured goods for not exporting,but selling domestically.
The Egyptian tariff structure effectively taxed exports at high rates;Nathan Associates (1998: 9) estimated that across the board the average31 percent tariff acted as an export tax of 19.4 percent. Even a substantiallowering of the average tariff would still retain a sizeable anti-export bias.Kheir El Din and El Shawarby (2002: 15–16) estimated that if the averagetariff were reduced to 20 percent, the equivalent export tax would still be13.9 percent. The supplementary import levy of 3–4 percent and theGeneral Sales Tax (GST) must be added to the tariff, thus increasing itsprotective (and anti-export) impact. Moreover, the authors noted that theGST fell on the gross value of exports, not just on profits, and so its effectsin discouraging exports would be magnified. Similar results of high pro-tection against imports, and thus a disincentive to export, were confirmedby other studies. The World Bank (2001: 27) estimated that the combinedcost of fiscal barriers (tariffs and levies) added 32.3 percent ad valorem onaverage to the cost of an import.
But tariffs were not the only source of protection. Throughout1965–2000, Egypt also had an extensive system of non-tariff barriers,generally masquerading as quality control or health protection measures.Even by 1996, over 1,500 tariff lines (about a quarter of the tariff sched-ule) consisted of items that were subject to inspection for quality control,and the Government Organization for Export and Import Control exam-ined a sample of every consignment of such goods. This was said to benecessary to ensure compliance with Egyptian standards. “In practice,however,” commented the World Bank (1998a: 32), “quality control hasbecome [another] means to protect local industry.” Nathan Associates(1998: 5) estimated that in the 1990s, the system of quality control
The external sector 143
increased costs to affected producers and importers by 5 to 90 percent;the latter figure applied to food products and imported consumer goods.As a result of these costs, exports were estimated to decrease by at least 9to 12 percent and GDP reduced by more than 1 percent.
The effects of bureaucratic interventions could be inefficient, andhence costly – the World Bank (1999: 159) estimated that in the mid-1990s each Egyptian customs official cleared an average of $600,000 worthof imports a year, while in Singapore the average was $666 million a year.For the economy as a whole, the World Bank estimated that the delayscaused by bureaucratic and inspection procedures added (conservatively)15 percent to the import cost. CAPMAS (1996) reported that importedintermediate inputs typically accounted for 45 percent of production cost;thus a 15 percent increase in the cost of imported intermediate goodswould by itself add nearly 7 percent to the cost of production.
(d) External debt and its management
Current account deficits have to be financed, and one of the majorsources of financing for Egypt was borrowing from abroad.14
During most of the 1950s, Egypt’s balance of payments was kept veryclose to equilibrium and deficits were generally financed from thecountry’s foreign exchange reserves. At the beginning of 1955, virtually allof Egypt’s external public debt had either been converted into internalissues or paid off through the Debt Conversion Plan of 1943. The onlyamount known to be outstanding was approximately $482,000 due on the4 percent City of Alexandria 1903–63 bonds.
The balance of payments picture began to change in the early 1960swith the introduction of the first Five-Year Plan. The import requirementsof this Plan exceeded the country’s payment capacity and about 30percent of the investment program had to be financed through externalborrowing. Ikram (1980: 356–7) estimated that by the end of 1965, thetotal disbursed and outstanding external debt amounted to $1,516million, with an additional $103 million in short-term liabilities againstbanking facilities. This trend continued: for most of 1965–2000 Egypt rana deficit on the current account, and the use of loans to finance part ofthis deficit was reflected in the country’s growing foreign debt.
The adoption of the infitah led to a surge in imports. In part these addi-tional exports were financed by the growth in exports, but substantialrecourse was had to external credits. From 1975 to 1980, external debtincreased from $6.3 billion to $19 billion, rising to almost 90 percent ofGDP and 207 percent of exports of goods and services in the latter year.
A feature of Egypt’s borrowing between 1970 and mid-1977 was the useof short-term correspondent bank facilities, in the form of trade-relatedlines of credit, for the opening and confirmation of letters of credit andacceptance of drafts arising out of export–import transactions. These were
144 The external sector
normally for periods of 90 to 180 days, but in some cases maturities wereextended for as long as 18 months to two years. The 1973 war, the sharprise in world prices of food and other commodities, and the lack of suffi-cient amounts of quick-disbursing foreign aid all compelled Egypt toresort heavily to borrowing short-term funds to meet the cost of essentialimports. At the end of 1976, disbursed and outstanding banking facilitiesamounted to $1,396 million, i.e. just under 20 percent of the total out-standing debt. Arrears on banking facilities had emerged early in the1970s and continued to increase until they reached a peak of nearly$1,000 million in mid-1977. An impending crisis was only warded off bysizeable inflows of cash aid, principally from the Gulf Organization for theDevelopment of Egypt, comprising Saudi Arabia, Kuwait, Abu Dhabi, andQatar, that enabled the Egyptian authorities to clear all payments arrearsand also to significantly reduce reliance on short-term facilities in thefuture.
Continued heavy external borrowing in the 1980s created a substantialdebt overhang. In general, Egypt received quite favorable terms on itsforeign borrowing through the 1980s. The average maturity on Egyptianloans during the 1980s was over 25 years, more than double those of themain borrowers from Latin America; the grace periods averaged almost 10years; the average interest rate charged on Egyptian loans was substantiallylower than that charged on loans to countries at comparable levels of percapita income. Nevertheless, a sizeable part of Egypt’s external borrowingremained on supplier credit terms, and the stagnation of Egypt’s exportearnings (especially after the fall in oil prices) made it difficult to servicethese credits. Suppliers disbursed significant amounts of credits to Egyptthrough the first half of the 1980s. However, on a net basis (disbursementsminus amortization), such disbursements were largely matched by amorti-zations, so that on a net transfers basis (disbursements minus both amorti-zation and interest payments), suppliers became net takers from themid-1980s.
Medium- and long-term debt peaked in 1988 at about $42 billion, but anear doubling of short-term debt, from $4.5 billion in 1988 to $8.6 billionin 1990, caused total external debt to continue to rise until it reached$46.1 billion in 1990. According to most of the widely used measures,Egypt’s debt burden until 1991 was among the highest in the world. Withdebt to GNP ratios in the 100 to 150 percent range through the 1980s,touching 175 percent in 1988, Egypt was more heavily burdened with debtthan many other, more prominent, debtor countries, including all themajor Latin American countries.
Even more to the point, the servicing of the debt created severe liquid-ity problems. Total debt service (including arrears) due in 1986 exceeded100 percent of current account receipts. As a result, Egypt could notservice the debt and accumulated further arrears. The country becameuncreditworthy and lost access to international capital markets.
The external sector 145
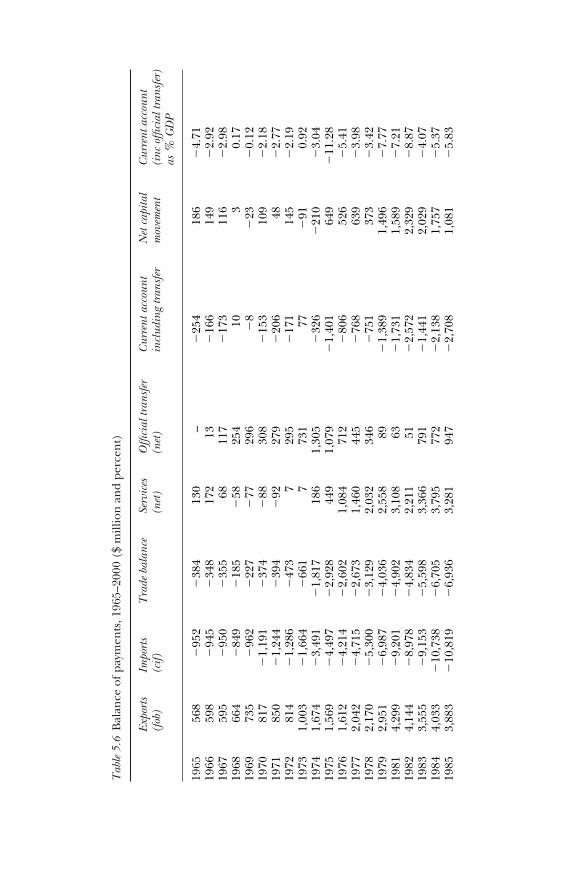
Tab
le 5
.6B
alan
ce o
f pay
men
ts, 1
965–
2000
($
mill
ion
an
d pe
rcen
t)
Expo
rts
Impo
rts
Tra
de b
alan
ceSe
rvic
esO
ffici
al tr
ansf
er
Cur
rent
acc
ount
Net
cap
ital
Cur
rent
acc
ount
(f
ob)
(cif)
(net
)(n
et)
incl
udin
g tr
ansf
erm
ovem
ent
(inc
offi
cial
tran
sfer
)as
% G
DP
1965
1,56
8�
952
�38
413
0–
�25
418
6�
4.71
1966
1,59
8�
945
�34
817
213
�16
614
9�
2.92
1967
1,59
5�
950
�35
568
117
�17
311
6�
2.98
1968
1,66
4�
849
�18
5�
5825
410
30.
1719
691,
735
�96
2�
227
�77
296
�8
�23
�0.
1219
701,
817
�1,
191
�37
4�
8830
8�
153
109
�2.
1819
711,
850
�1,
244
�39
4�
9227
9�
206
48�
2.77
1972
1,81
4�
1,28
6�
473
729
5�
171
145
�2.
1919
731,
003
�1,
664
�66
17
731
77�
910.
9219
741,
674
�3,
491
�1,
817
186
1,30
5�
326
�21
0�
3.04
1975
1,56
9�
4,49
7�
2,92
844
91,
079
�1,
401
649
�11
.28
1976
1,61
2�
4,21
4�
2,60
21,
084
712
�80
652
6�
5.41
1977
2,04
2�
4,71
5�
2,67
31,
460
445
�76
863
9�
3.98
1978
2,17
0�
5,30
0�
3,12
92,
032
346
�75
137
3�
3.42
1979
2,95
1�
6,98
7�
4,03
62,
558
89�
1,38
91,
496
�7.
7719
814,
299
�9,
201
�4,
902
3,10
863
�1,
731
1,58
9�
7.21
1982
4,14
4�
8,97
8�
4,83
42,
211
51�
2,57
22,
329
�8.
8719
833,
555
�9,
153
�5,
598
3,36
679
1�
1,44
12,
029
�4.
0719
844,
033
�10
,738
�6,
705
3,79
577
2�
2,13
81,
757
�5.
3719
853,
883
�10
,819
�6,
936
3,28
194
7�
2,70
81,
081
�5.
83
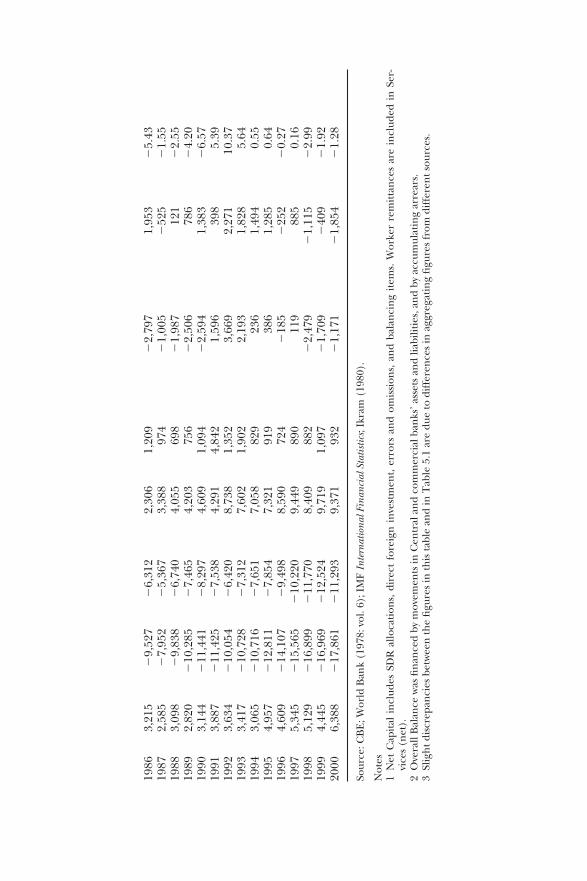
1986
3,21
5�
9,52
7�
6,31
22,
306
1,20
9�
2,79
71,
953
�5.
4319
872,
585
�7,
952
�5,
367
3,38
897
4�
1,00
5�
525
�1.
5519
883,
098
�9,
838
�6,
740
4,05
569
8�
1,98
712
1�
2.55
1989
2,82
0�
10,2
85�
7,46
54,
203
756
�2,
506
786
�4.
2019
903,
144
�11
,441
�8,
297
4,60
91,
094
�2,
594
1,38
3�
6.57
1991
3,88
7�
11,4
25�
7,53
84,
291
4,84
21,
596
398
5.39
1992
3,63
4�
10,0
54�
6,42
08,
738
1,35
23,
669
2,27
110
.37
1993
3,41
7�
10,7
28�
7,31
27,
602
1,90
22,
193
1,82
85.
6419
943,
065
�10
,716
�7,
651
7,05
882
923
61,
494
0.55
1995
4,95
7�
12,8
11�
7,85
47,
321
919
386
1,28
50.
6419
964,
609
�14
,107
�9,
498
8,59
072
4�
185
�25
2�
0.27
1997
5,34
5�
15,5
65�
10,2
209,
449
890
119
885
0.16
1998
5,12
9�
16,8
99�
11,7
708,
409
882
�2,
479
�1,
115
�2.
9919
994,
445
�16
,969
�12
,524
9,71
91,
097
�1,
709
�40
9�
1.92
2000
6,38
8�
17,8
61�
11,2
939,
371
932
�1,
171
�1,
854
�1.
28
Sour
ce: C
BE
; Wor
ld B
ank
(197
8: v
ol. 6
); I
MF
Inte
rnat
iona
l Fin
anci
al S
tatis
tics;
Ikr
am (
1980
).
Not
es1
Net
Cap
ital
in
clud
es S
DR
allo
cati
ons,
dir
ect
fore
ign
in
vest
men
t, er
rors
an
d om
issi
ons,
an
d ba
lan
cin
g it
ems.
Wor
ker
rem
itta
nce
s ar
e in
clud
ed i
n S
er-
vice
s (n
et).
2O
vera
ll B
alan
ce w
as fi
nan
ced
by m
ovem
ents
in C
entr
al a
nd
com
mer
cial
ban
ks’ a
sset
s an
d lia
bilit
ies,
an
d by
acc
umul
atin
g ar
rear
s.3
Slig
ht d
iscr
epan
cies
bet
wee
n th
e fi
gure
s in
this
tabl
e an
d in
Tab
le 5
.1 a
re d
ue to
dif
fere
nce
s in
agg
rega
tin
g fi
gure
s fr
om d
iffe
ren
t sou
rces
.

Debt-servicing due and that actually paid compared with the country’sforeign exchange earnings are displayed in Figure 5.8, while Table 5.7shows the development of total debt and debt-servicing in absoluteamounts.
The table and the figure underscore a number of important pointsregarding Egypt’s external debt and debt-servicing.
1 Over the period 1970–2000 as a whole, external debt grew at a rate of10.2 percent a year. However, this overall figure conceals two differentgrowth paths. Between 1970 and 1989, external debt grew at a rapidpace, averaging 22.0 percent a year. In the second period, 1990–2000,the growth was barely 1 percent a year because of the application ofthe debt rescheduling agreements and Egypt’s policy of holding downfresh borrowings. The apparent leveling off between 1986 and 1987was the result of the debt rescheduling agreement of 1987. The dropin the stock of debt from $45,684 million in 1989 to $33,017 millionin 1990 reflects the effect of the debt forgiveness and reschedulingsthat were finalized in the agreement with the Paris Club in 1991. Thereduction in the debt stock in the next few years resulted from theapplication of the second and third phases of the Paris Club agree-ment.
2 From the early 1980s Egypt began to accumulate arrears on principaland interest related to long-term debt. Most of these arrears wereaccumulated by public sector enterprises whose major share offunding came from supplier credits. Arrears of interest and principalmounted swiftly until they reached $8.7 billion in 1986.
3 The rising stock of debt was a source of disquiet to policymakers, butof even more concern was the rise in the debt service requirements.
148 The external sector
Per
cent
age
of F
EE
120
100
80
60
40
20
01970 1972 1974 1976 1978 1980 1982 1984 1986 1988 1990 1992 1994 1996 1998 2000
Debt service paid/FE earnings (%)Debt service due/FE earnings (%)
Figure 5.8 Debt service due and paid as percent of foreign exchange earnings,1970–2000 (source: World Bank Debtor Reporting System).

The debt service ratio (the annual debt service due as a proportion offoreign exchange earnings) rose steadily and quickly. There are norules to define at what point these ratios become critical, but theWorld Bank for the most part has used a guideline of 25 percent as apoint beyond which special attention needs to be paid.
While the stock of debt grew at a more steady pace (of just over 10percent a year during 1970–2000), the debt service ratio fluctuated
The external sector 149
Table 5.7 External debt and debt servicing, 1970–2000 ($ million and percent)
Debt outstanding ($ million) Debt Debt Debtservice due service due service
Long term Short term Total (including (including paid/XGSarrears) arrears)/ (%)
XGS (%)
1970 1,400.4 1,401.2 1,801.6 356.6 36.0 27.31971 1,570.4 1,478.7 2,049.1 294.9 28.6 21.81972 1,476.3 1,476.2 1,952.4 454.9 40.6 32.51973 1,465.8 1,525.8 1,991.6 466.9 32.9 31.11974 1,614.6 1,594.9 2,209.5 341.1 13.5 11.91975 3,711.3 1,124.1 4,835.4 327.4 11.1 10.31976 4,836.0 1,521.3 6,357.3 391.7 9.4 6.41977 7,385.3 4,348.2 11,733.5 603.7 12.3 10.21978 9,471.4 3,386.5 12,857.8 678.5 11.3 9.71979 11,113.9 3,792.0 14,905.8 864.0 10.6 6.41980 15,103.6 4,027.1 19,130.7 1,691.9 18.4 13.41981 18,437.5 3,640.1 22,077.6 2,193.3 24.1 17.01982 22,263.1 5,068.8 27,331.8 2,691.8 30.3 19.31983 25,031.4 5,203.6 30,235.1 3,563.3 34.5 20.11984 26,419.5 5,783.0 32,202.5 5,143.6 45.4 21.41985 29,940.7 6,196.6 36,137.3 7,393.2 67.6 25.81986 32,772.8 7,123.6 39,896.4 11,409.8 114.1 27.01987 37,785.8 6,361.6 44,147.3 7,402.8 79.7 17.91988 39,273.0 6,873.9 46,146.9 10,848.7 96.6 22.11989 37,790.3 7,893.4 45,683.7 11,466.2 91.9 23.51990 28,563.2 4,453.3 33,016.5 8,056.5 58.9 22.51991 29,509.1 3,121.7 32,630.9 2,719.4 19.5 18.71992 28,611.7 2,517.7 31,129.3 2,701.8 17.9 17.81993 28,562.8 2,004.6 30,567.4 2,221.0 14.0 13.81994 30,446.1 1,932.6 32,378.7 2,244.5 14.7 14.61995 30,964.6 2,372.2 33,336.8 2,529.6 14.2 13.41996 29,017.7 2,348.0 31,365.6 2,477.7 13.7 12.91997 26,935.0 2,992.6 29,927.5 2,143.1 10.8 10.01998 28,006.2 4,261.7 32,267.9 2,046.2 10.6 9.81999 26,507.8 4,294.0 30,801.8 2,252.3 11.7 11.02000 24,852.2 4,104.5 28,956.6 1,959.1 9.1 8.4
Source: World Bank Debtor Reporting System.
NotesXGS�Exports of goods and services; IMF transactions are included in long-term debt.
considerably. These fluctuations had no correspondence with thegrowth of foreign exchange earnings, and created major problemsfor servicing the debt. Over the period 1970–2000 the ratio (dueand including arrears) averaged 32.4 percent, with a coefficient ofvariation of 89.8 percent. The first subperiod (1970–89) showedan average debt service ratio of 40.4 percent, and a coefficient ofvariation of 79.7 percent. In the second subperiod (1991–2000)the debt service ratio was, not surprisingly, much lower at an averageof 17.7 percent, but the coefficient of variation was close to 100percent.
The debt service ratio reached its zenith in 1986, when paying allthe debt servicing and clearing the accumulated arrears would haveconsumed 114 percent of the country’s total foreign exchange earn-ings. The country would therefore have had to use all its foreignexchange earnings and to borrow additional amounts simply in orderto meet its debt obligations; even more borrowing would have beenrequired to pay for imports.
At all times, the authorities sought to limit the amounts actuallypaid. Over the entire period, the (paid) debt service ratio averaged17.1 percent; it was somewhat higher in the first subperiod at 18.9percent, but only 13.9 percent in the second. Drastically limiting thelevels in the first subperiod also, of course, damped down the volatil-ity: the coefficient of variation dropped to 41.8 percent. The greatervariability in the second subperiod did not much matter, because theamounts to be paid were much smaller.
4 The solution to the debt problem of recent times was brought aboutby debt forgiveness, and resulted from the political circumstance ofEgypt’s participating in the Gulf war. Thereafter, controls on borrow-ing prevented it from re-emerging. The 1991 agreement with the ParisClub caused the debt service ratio to drop to 17.9 percent in thefollowing year. The steady decline in the ratio in subsequent yearsresulted from the second and third phases of the Paris Club agree-ment and from a decision by Egypt to restrict the contraction of newdebt – fresh borrowing in any year was not to exceed the amountrepaid in that year. The debt service ratio was also limited by theadoption of strict conditions (couched in terms of the grant element)on the terms of new debt; these issues have been discussed in a previ-ous chapter.
Why did Egypt’s external debt increase relentlessly? Four factorsaccounted for this trend. First, Egypt failed to accelerate the growth ofnon-oil manufactured exports and thus lost the benefits of the expansionof international trade. Second, the pattern of Egypt’s growth was heavilyimport-substituting. This type of strategy tends for considerable periods tobe, in fact, import-intensive, because for several years the country must
150 The external sector
import both the capital goods required to set up the import-substitutingfacilities as well as the finished commodities, until such time as the indus-trial plants are fully functioning. Third, especially after 1973, Egypt had toimport large quantities of equipment in order to refurbish an infrastruc-ture that had almost completely been run down during the war years.Fourth, the growing population and the limited scope for agriculturalexpansion meant that large quantities of food and agricultural items hadto be imported. For all these reasons, Egypt was faced with a growingimport bill that was not covered by the country’s foreign exchange earn-ings, even when these were supplemented by external assistance.
The debt situation remained difficult for most of 1965–91, requiring anumber of debt rearrangements (described at the beginning of thischapter). Major crises erupted in 1987 and 1991. Egypt’s experience withthe two crises differed significantly.
The debt crisis of 1987 was not brought about by a sudden or unex-pected jolt, nor did banks abruptly lose confidence and recall their short-term credits. Rather, it resulted from a circle of gradually increasingindebtedness (total debt outstanding increased by about 50 percentbetween 1982 and 1987), growing debt service obligations (a triplingduring 1982–87), and an inability of the economy to generate sufficientforeign exchange earnings. The problem was not simply that Egypt wasborrowing too much, it was also that it was borrowing on increasinglyharder terms. In 1983–90, the share of debt on concessional terms(defined as providing a grant element of at least 25 percent) had droppedto about one-third of Egypt’s total debt, compared with an average ofnearly half in 1975–82.
The continued squeezing of Egypt’s ability to service its debt leechedaway the confidence of foreign creditors, in particular of those providingsupplier credits. It created a vicious circle by slowing down the pace of newcommitments and disbursements and intensified the pressure on theforeign exchange situation, so that a substantial portion of the foreignresource inflow was diverted to service existing debt. In 1979, foreign debtservice obligations used up about 60 percent of the gross disbursement offoreign loans. With a sharp increase in debt service payments and thecontinuing decline in disbursements from external borrowing, by 1982debt service had reached almost 100 percent of gross new borrowings. Thesituation continued to worsen. In 1987, the gross inflow of new loans haddeclined by nearly half in nominal terms from its peak five years earlier;new loans did not cover even half the debt service payments actually made(and these payments amounted to less than two-thirds of the debt servicedue). By 1987, Egypt had become a net exporter of loan capital.
Although a debt crisis had long been in the making, the process wasgiven a sharp fillip in 1986 and 1987 by a steep fall in oil prices, whichhalved from $26.4/barrel in 1985 to $13.5/barrel in 1986. Prices rosesomewhat in 1987, but at $17/barrel still remained about 35 percent
The external sector 151
lower than in 1985. As a result, earnings from oil exports in 1987 were lessthan half their level in 1985. These losses were compounded by a fall intourism receipts of 23 percent in 1986 (compared with a year earlier), astourists were scared off by riots that occurred in February in which ele-ments of the security forces were involved. The combined receipts fromoil, tourism, and remittances in 1986 and 1987 were respectively 19 and 30percent lower than in 1985, and total foreign exchange earnings hadfallen 15 percent between 1985–87.
Confronting this fall in receipts was a growing bill for debt servicing.The worsening foreign exchange situation had led to a steady build-up ofarrears on debt repayments (both interest and principal). The situationhad reached such a pass in 1986 that had Egypt actually paid all obliga-tions falling due, including accumulated arrears, the payment would haveamounted to 114 percent of the country’s earnings from the export ofgoods and services in that year.
In May 1987, Egypt reached a rescheduling agreement with the ParisClub, whereby outstanding arrears of $6.9 billion were rescheduled,together with all interest and amortization payments on public medium-and long-term loans falling due until June 30, 1988; this amounted to $4.4billion. The Paris Club creditors also agreed, in principle, to meet againwith the Egyptian authorities to consider debt service payments falling dueafter June 1988, provided that Egypt was in compliance with a number ofconditions. These conditions included maintaining an arrangement withthe IMF, signing bilateral agreements with Paris Club creditors in accord-ance with the Paris Club agreement, and securing comparable treatmentfrom other creditors. However, most of these conditions were not fulfilledand the next round of successful negotiations on the debt issue did nottake place until four years later.
The crisis that culminated in 1991 should also have been predictable. Aconnection between the continuing deficits in Egypt’s budget and in itsbalance of payments had not escaped the notice of observers. Hansen(1991: 213), in particular, identified loose budgetary policies and theresulting budget deficits as the “villains” for the country’s persistentbalance of payments problems. Unless the underlying problems wereaddressed by taking measures to rein in the budget deficit (17 percent ofGDP in 1991), or to boost foreign exchange earnings, the 1987 reschedul-ing could serve as only a temporary analgesic. The arrangements hadbought Egypt some time, but this had not been used to attack the struc-tural difficulties. Fortunately for Egypt, the 1991 economic crisis occurredat a time when the donors, because of Egypt’s support in the Gulf war,were inclined to look favorably at a more enduring solution.
On May 25, 1991, Egypt concluded an agreement with members of theParis Club to reorganize and reduce, by up to 50 percent in net presentvalue terms, its debt to the members of the Club. The debt arrangementswere subject to three main conditions. Egypt was required:
152 The external sector

• to have an agreed program with the IMF;• to keep current during 1991–94 with payments due under the terms
of the agreement; and• to obtain comparable terms of debt relief from non-Paris Club credi-
tors.
The Paris Club restructuring took a variety of forms (such as forgivenessof principal, reduction of interest rates, and restructuring of payments),depending upon the preference and legal obligations of the creditor. Thetotal amount covered by the agreement was estimated at $28 billion,including $7 billion of debt cancellation by the United States. The debtreduction or restructuring was to take place in three phases. The initialphase was a 15 percent immediate reduction, with effect from July 1, 1991.The second phase, also incorporating a 15 percent reduction, had to takeplace on completion of the second economic reform agreement with theIMF, by December 31, 1992. In the event, the second phase became effect-ive in October 1993, after the IMF approved the three-year ExtendedArrangement. The third and final phase of a further reduction of 20percent had to be carried out from July 1, 1994, after evaluation of thesecond phase and with the agreement of the IMF. This final phase tookplace in the second half of 1996.
The unprecedented amounts of debt forgiveness from the major bilat-eral donors and the 1991 Paris Club debt-relief package provided Egyptwith an historic opportunity to break the shackles of foreign indebtedness.The Paris Club relief package had a major influence on the balance ofpayments, the fiscal balance, and recovery from the debt hangover. TheWorld Bank estimated that, as a result of the 1991 agreement, Egypt savedan average of nearly 2.5 percent of GDP a year in debt service payments in
The external sector 153
$ m
illio
n
50,000
Percentage
9045,00040,00035,00030,00025,00020,00015,00010,0005,000
0
80
70
60
50
40
30
20
10
0
1970
1972
1974
1976
1978
1980
1982
1984
1986
1988
1990
1992
1994
1996
1998
2000
Debt outstanding ($ million)Concessional debt (percentage of total)
Figure 5.9 Total debt ($ million) outstanding and share of concessional debt(percent), 1970–2000 (source: World Bank Debtor Reporting System).
the five years from 1992–96. The impact on the balance of payments andthe budget was, of course, proportionately greater.
Egypt took advantage of the relief and held down fresh external bor-rowing – for the period 1991–2000 as a whole, Egypt’s net borrowing aver-aged only $339 million a year. With the restrictions on new loans, from1996 Egypt’s repayments exceeded disbursements and net externalmedium- and long-term borrowing became negative. Moreover, from1992, Egypt repaid more than its drawings of medium-term suppliers’credit. As a result of these measures, the stock of debt outstanding fellsteadily. The country also put greater emphasis on securing external fundsin the form of grants and soft loans. The share of concessional debtincreased sharply from about 37 percent of total debt in 1990 to nearly 73percent by 2000. The combination of generous debt arrangements andEgypt’s more careful attitude towards fresh borrowing ensured that thepressure of external debt abated. Figure 5.9 displays developments in theamounts and concessionality of Egypt’s external debt.
154 The external sector

6 The public finances
Public finance policy concerns decisions regarding the revenue, expendi-ture, and debt operations of the government. The importance of publicfinance in the Egyptian economy arises from the overwhelming role of thegovernment in the economic system.
The government’s fiscal and regulatory actions permeated the entireeconomy in 1960–2000. The state’s domination of the economic system isreflected in the proportion of GDP originating in the public sector; thisincreased from an estimated 13 percent in 1952 to about 40 percent in1973 (the eve of the infitah), to 50 percent in 1981, before dropping to34 percent in 1990. As late as 2000 it was still 30 percent. Governmentexpenditure reached nearly 60 percent of GDP in 1982, and even in2000 was nearly 30 percent of GDP. Moreover, government interventionsin some sectors (especially in agriculture) remained so widespread thatthey virtually determined the level and composition of output, eventhough formally these sectors remained in the hands of private decision-makers.
Chapter 1 described how the role of the government increased, espe-cially after 1961. In order to attain its goals, the government made a majoreffort to mobilize resources. Current government revenue, includingreceipts of the social security system, were raised and remained high com-pared with that of other countries of similar per capita income, structure,and degree of openness of the economy. However, because of claims onthe expenditure side, savings generated by the public sector were inade-quate, dropping from 8 percent of GDP in 1967 to �11 percent in 1975,though by 1978 they recovered to about 3 percent. The main reasons forthe decline were the vastly increased allocations for defense after the warof 1967 and the rapid growth of subsidies after 1973.
With the public sector occupying a dominant role in the economy, thegovernment’s budget and fiscal policy was one of the most important toolsof resource allocation and economic management. A further implicationof Egypt’s being a government-controlled economy was that monetarypolicy lost much of its traditional role, thus automatically increasing therole of fiscal policy.

The nonfinancial public sector comprises four major bodies: thecentral government, local and regional government, public enterprises,and a number of extra-budgetary entities.
a The central government includes the central administration andpublic service authorities. The central administration consists of thepresidency, ministries, and the legislature. The public service authori-ties, as distinct from the public economic authorities, are essentiallynonprofit public agencies such as universities, research institutes, andhospitals. Their operations are integrated into the government budget.
b Local and regional government is organized into 26 governorates andthe city of Luxor. Although local and regional government is adminis-tratively separate, it has very limited financial autonomy; its budget ispart of the consolidated government budget and is approved by thenational legislature as part of the state budget. Local government pos-sesses jurisdiction over some types of tax and non-tax revenues, butdepends on central government transfers for financing the bulk of itsexpenditures.
c Public enterprises are grouped into economic authorities and publiccompanies. The public economic authorities consist of about 60 fullyowned public companies, such as the Egyptian General PetroleumCompany (EGPC), the Suez Canal Authority (SCA), various publicutilities, and the General Authority for Supply Commodities (GASC).In 1990 they accounted for about 23 percent of GDP and 3 percent ofthe labor force. Their operating budgets are not included in thegovernment budget, but cash transfers to and from the government,such as tax payments and subsidies, are incorporated into the consoli-dated budget. With the notable exception of the EGPC and the SCA,most of the economic authorities operate at a loss. Investment expen-ditures of the economic authorities and the associated financing arealso part of the consolidated budget. Financing for the economicauthorities comes from internal generation (especially investmentself-financing), foreign economic assistance transferred from thegovernment, and loans from the National Investment Bank.
The public companies are public enterprises engaged in a varietyof processing, manufacturing, or service functions. They constitute amajor presence in the economy; in 1990, on the eve of the structuralreform program under which most of these companies were sched-uled for privatization, their net value-added was 12 percent of GDP,they employed over 6 percent of the labor force, and their tax andprofit transfers amounted to 14 percent of central governmentrevenue. From 1990 their investment budget was removed from thegovernment budget.
d The main extra-budgetary entities are the social insurance funds,the National Investment Bank (NIB), and the Social Fund for
156 The public finances

Development (SFD). Their operations are not consolidated into thegovernment budget.
1 The social insurance system is operated by two funds: the NationalOrganization for Insurance and Pensions, which covers govern-ment workers; and the General Authority for Social Insurance,which covers public and private enterprise workers, farmers, andthe self-employed. The cash surpluses of the social security fundsare invested with the NIB.
2 The National Investment Bank was established in 1980 and isresponsible for financing projects included in the government’sinvestment program. It is financed primarily by the surpluses ofthe social insurance funds, but also from postal savings and thesale of investment certificates.
3 The Social Fund for Development was set up in 1992 to provide asafety net, initially for workers affected by the 1991 stabilizationprogram, and to develop programs aimed at poverty alleviation. Itis funded mainly from foreign aid.
Overall fiscal developments
Until the late 1970s, two major themes ran through Egyptian publicfinances. First, Egypt had been in a state of war for a quarter-centuryafter 1948; this meant heavy expenditures on defense. Second, with theadoption of the National Charter in 1962, Egypt began the largest-scale experiment in “Arab Socialism.” The main objective of this eco-nomic policy was greater equity in the distribution of income and inconsumption capability, which was to be largely effected through fiscalmeasures. Another important goal was increased production. With theeconomy dominated by the government, this meant an increase in publicinvestment.
The relative importance of these factors differed over time. In 1960,defense expenditures accounted for about 5 percent of GDP at marketprices; by 1970 they had increased to 16 percent, and by 1978 they haddropped to about 9 percent.1 With defense and administration costs con-suming so much of the revenues, public investment outlays had largely toadapt themselves to the available resources. The impact of defense spend-ing on the resource allocation process can be seen by the gyrations in therate of public investment (which represented about 80 percent of totalinvestment). In 1960, public investment was about 11 percent of GDP, in1964 it rose to 19 percent, in 1970 it declined to 12 percent, but increasedthereafter to 27 percent in 1978.
In order to achieve greater equity in consumption, many commoditiesconsidered essential were subsidized. These cost-of-living subsidies becamean important item in the budget after the sharp rise in international
The public finances 157

wheat prices in 1973; total subsidies rose from less than 2 percent of GDPin 1971 to about 5 percent in 1973 and 10 percent in 1978. Thus, if duringthe 1960s and early 1970s defense needs had competed with investmentfor resources, after 1973 an aggressive new claimant appeared on thescene.
From 1965 until about 1990, resource allocation could be representedas what Sciolli (1976: 2) called the “three-cornered hat” with defense,investment, and welfare representing the three corners. These cornersaltered somewhat in recent years in response to changes in the inter-national environment and to new directions in economic strategy. Themost important of the changes was the decline in the relative importanceof defense spending following the settlement with Israel, and an easing upof the government’s investment expenditures following the emphasis onthe private sector to furnish the impetus for growth. An increasing role inexpenditure came to be occupied by debt-servicing and payment foradministration, especially salaries and benefits.
Throughout 1965–2000, the overall balance of the budget remained indeficit, the shortfall at times exceeding 25 percent of GDP at currentmarket prices.2 Moreover, the deficit as a proportion of GDP fluctuatedwidely around an average of about 13 percent, varying between 28.6percent in 1975 and 1.2 percent in 1995. Over the entire period, the ratioof total revenue to GDP at market prices averaged 28 percent, that of totalexpenditures to GDP about 41 percent. The overall deficit improvedbetween 1965 and 2000, but the evolution did not follow a consistentpath. The development of revenues, expenditures, and the overall budgetdeficit are shown in Figure 6.1.
158 The public finances
Per
cent
age
of G
DP
70 30
60
50
40
30
20
10
0
25
20
15
10
5
0
1965
1967
1969
1971
1973
1975
1977
1979
1982
1984
1986
1988
1990
1992
1994
1996
1998
2000
Percentage of G
DP
Total revenue/GDP (%)Total expenditure/GDP (%)Overall deficit/GDP (%) [right axis]
Figure 6.1 Revenue, expenditure, and budget deficit, 1965–2000 (percent of GDP)(source: MOF; World Bank LDB).

It is more useful to look at the period in two parts. The first, 1965–91(i.e. before the stabilization program) was dominated by three features:
• an increase in total government expenditure as a proportion of GDP,• a high level of overall budget deficit, and• considerable fluctuations in revenues and expenditures.
The second sub-period, 1992–2000, is distinguished from the first becauseit witnessed a sharp decline in the budget deficit in the 1990s (althoughthe precise extent of the reduction is not clear). This change resultedfrom the implementation of the stabilization and structural adjustmentprogram discussed in Chapter 3.
The overall budget deficit averaged 13 percent of GDP over the entireperiod, with averages of 16 percent and 3 percent in the two sub-periods.Between 1965 and 2000, total expenditure as a percentage of GDP aver-aged 41 percent, but the figure for the first sub-period was 45 percentwhile for the second it was 29 percent. The corresponding performance forrevenues was 28 percent of GDP for the entire period, 29 percent in thefirst part, and 26 percent in the second. A summary of fiscal operations forselected years is shown in Table 6.1 and displayed graphically in Figure 6.1.
The year 1991 saw a number of developments that had substantialrepercussions on public finances. With the 1991 budget, the authoritiesintensified their efforts to control the fiscal deficit and to improve thestructure of revenue. The budget also included a one-time exceptionalexpenditure (equivalent to about 6 percent of GDP) to recapitalize thepublicly owned commercial banks. Three other measures also played animportant role in influencing the fiscal outcome: a substantial deprecia-tion of the exchange rate, the freeing of interest rates, and the debtrearrangements with the Paris Club. The exchange rate depreciationincreased the revenues of the EGPC and the SCA in terms of domesticcurrency and thereby boosted the amounts transferred to the budget. Italso increased the domestic currency value of imports and thus increasedcollections from customs duties. On the expenditure side, the Paris Clubagreement substantially lowered the debt service obligations. Reductionsin food subsidies, begun in 1987, accelerated in 1991 with the removal ofsubsidies on fish, tea, and rice.3 The budget outturn in 1992 was evenbetter, because it was the first full year to benefit from the reforms.
During 1992–2000 total expenditure was kept under stricter controlthan in the preceding period, although the precise extent of the reduc-tion is moot because of ambiguities in the treatment of some items. Itappears that the reduction can almost entirely be explained by lowercapital expenditure. Current expenditure, as a proportion of GDP, con-tinued to increase because of higher domestic interest payments and arising civil service wage bill. The latter was occasioned by the employmentof additional numbers – between 1991 and 2000 the share of government
The public finances 159
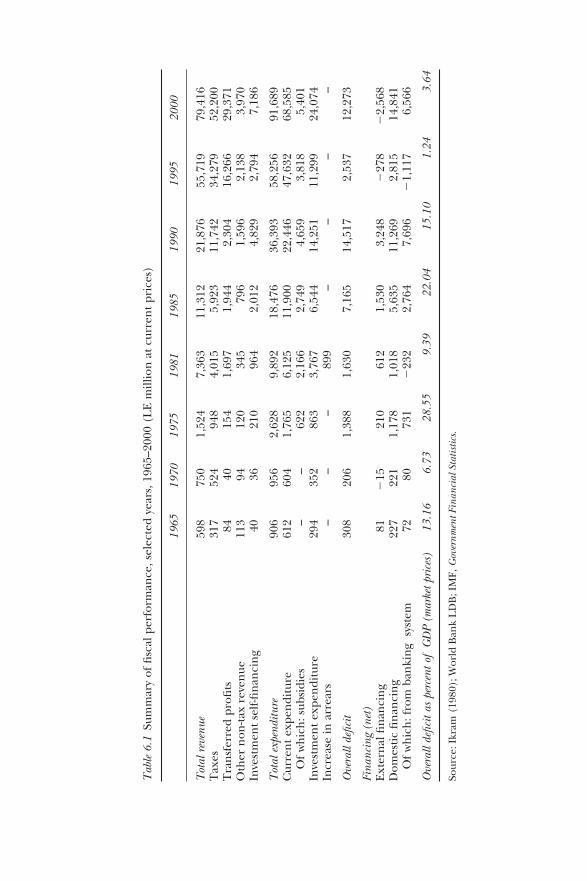
Tab
le 6
.1Su
mm
ary
of fi
scal
per
form
ance
, sel
ecte
d ye
ars,
196
5–20
00 (
LE
mill
ion
at
curr
ent
pric
es)
1965
1970
1975
1981
1985
1990
1995
2000
Tot
al r
even
ue59
875
01,
524
7,36
311
,312
21,8
7655
,719
79,4
16T
axes
317
524
948
4,01
55,
923
11,7
4234
,279
52,2
00T
ran
sfer
red
profi
ts84
4015
41,
697
1,94
42,
304
16,2
6629
,371
Oth
er n
on-ta
x re
ven
ue11
394
120
345
796
1,59
62,
138
3,97
0In
vest
men
t se
lf-fi
nan
cin
g40
3621
096
42,
012
4,82
92,
794
7,18
6
Tot
al e
xpen
ditu
re90
695
62,
628
9,89
218
,476
36,3
9358
,256
91,6
89C
urre
nt
expe
ndi
ture
612
604
1,76
56,
125
11,9
0022
,446
47,6
3268
,585
Of
wh
ich
: sub
sidi
es–
–62
22,
166
2,74
94,
659
3,81
85,
401
Inve
stm
ent
expe
ndi
ture
294
352
863
3,76
76,
544
14,2
5111
,299
24,0
74In
crea
se in
arr
ears
––
–89
9–
––
–
Ove
rall
defic
it30
820
61,
388
1,63
07,
165
14,5
172,
537
12,2
73
Fina
ncin
g (n
et)
Ext
ern
al fi
nan
cin
g81
�15
210
612
1,53
03,
248
�27
8�
2,56
8D
omes
tic
fin
anci
ng
227
221
1,17
81,
018
5,63
511
,269
2,81
514
,841
Of
wh
ich
: fro
m b
anki
ng
sys
tem
7280
731
�23
22,
764
7,69
6�
1,11
76,
566
Ove
rall
defic
it as
per
cent
of
GD
P (m
arke
t pri
ces)
13.1
66.
7328
.55
9.39
22.0
415
.10
1.24
3.64
Sour
ce: I
kram
(19
80);
Wor
ld B
ank
LD
B; I
MF,
Gov
ernm
ent F
inan
cial
Sta
tistic
s.
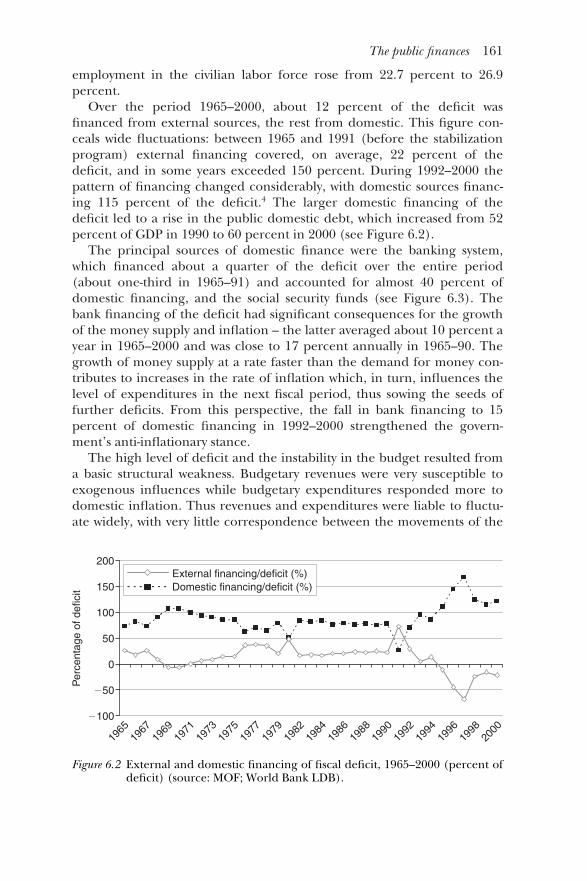
employment in the civilian labor force rose from 22.7 percent to 26.9percent.
Over the period 1965–2000, about 12 percent of the deficit wasfinanced from external sources, the rest from domestic. This figure con-ceals wide fluctuations: between 1965 and 1991 (before the stabilizationprogram) external financing covered, on average, 22 percent of thedeficit, and in some years exceeded 150 percent. During 1992–2000 thepattern of financing changed considerably, with domestic sources financ-ing 115 percent of the deficit.4 The larger domestic financing of thedeficit led to a rise in the public domestic debt, which increased from 52percent of GDP in 1990 to 60 percent in 2000 (see Figure 6.2).
The principal sources of domestic finance were the banking system,which financed about a quarter of the deficit over the entire period(about one-third in 1965–91) and accounted for almost 40 percent ofdomestic financing, and the social security funds (see Figure 6.3). Thebank financing of the deficit had significant consequences for the growthof the money supply and inflation – the latter averaged about 10 percent ayear in 1965–2000 and was close to 17 percent annually in 1965–90. Thegrowth of money supply at a rate faster than the demand for money con-tributes to increases in the rate of inflation which, in turn, influences thelevel of expenditures in the next fiscal period, thus sowing the seeds offurther deficits. From this perspective, the fall in bank financing to 15percent of domestic financing in 1992–2000 strengthened the govern-ment’s anti-inflationary stance.
The high level of deficit and the instability in the budget resulted froma basic structural weakness. Budgetary revenues were very susceptible toexogenous influences while budgetary expenditures responded more todomestic inflation. Thus revenues and expenditures were liable to fluctu-ate widely, with very little correspondence between the movements of the
The public finances 161
200
150
100
50
0
�50
�100
Per
cent
age
of d
efic
it
1965
1967
1969
1971
1973
1975
1977
1979
1982
1984
1986
1988
1990
1992
1994
1996
1998
2000
External financing/deficit (%)Domestic financing/deficit (%)
Figure 6.2 External and domestic financing of fiscal deficit, 1965–2000 (percent ofdeficit) (source: MOF; World Bank LDB).

two series. Over 1965–2000 as a whole, the coefficient of variation ofrevenue as a proportion of GDP was 15.8 percent, while that for expendi-ture as a proportion of GDP was 24.7 percent, indicating that the lattershowed more variability in relation to its mean. However, at times the vari-ability could go the other way; for example, for 1976–86, the coefficient ofvariation for expenditure/GDP was 10 percent while that forrevenue/GDP was nearly 15 percent. The differential fluctuation betweenrevenues and expenditures, both in amplitude and timing, was a majorissue for policymakers throughout 1965–2000.
The external influences impacting on budgetary receipts were fluctua-tions in the international price of oil (and hence in the revenues of theEGPC), and in the levels of economic activity in the industrialized coun-tries (and therefore in international trade and earnings from the SuezCanal). The high volatility of the revenue series in 1976–86 can thus easilybe explained. This period witnessed a steep rise in oil revenues as the oilfields that Egypt had recovered after the Arab–Israel war attained full pro-duction and benefited from the oil price hike of 1973, another sharpincrease in oil prices (in 1979), a slowing down of the internationaleconomy towards the end of 1981 with a consequent decline in oil pricesand in Suez Canal traffic, and then a sharp drop in oil prices in 1986.
The expenditure side was also affected by exogenous influences,principally the price of wheat. These changes were passed on to thebudget in the form of variations in the subsidy bill, because the sellingprice of subsidized commodities remained more stable than the procure-ment price. Added to this was the budget’s response to the domestic rateof inflation. Current expenditure largely became hostage to cost-pushfactors, to the open-ended nature of consumer subsidies, and to guaran-teed employment in the public sector for all persons discharged by the
162 The public finances
Per
cent
age
of d
efic
it200
150
100
50
0
�50
�100
Bank financing of deficit (%)
1965
1967
1969
1971
1973
1975
1977
1979
1982
1984
1986
1988
1990
1992
1994
1996
1998
2000
Figure 6.3 Bank financing of budget deficit, 1965–2000 (percent of deficit)(source: IMF, Government Finance Statistics; World Bank LDB).

armed forces and all university graduates. Given the determination of theauthorities to protect the standard of living, the domestic rate of inflationintroduced a substantial degree of rigidity into the expenditure side of thebudget. This severely cramped the government’s room for maneuver.Some studies – e.g. Ahmed (1984: 13–14) – showed that more than half oftotal government expenditure might be regarded as “autonomous,” in thesense that the degree of discretionary influence over it was very small, andhighly sensitive to domestic inflation. Moreover, control over expenditurewas diffused as a large block of public outlays (for example, by theNational Investment Bank and the Ministry of Defense) was outside thediscretionary control of the Ministry of Finance. These structural differ-ences translated into very different movements of the two sides of thebudget.
Revenue issues
Until the early 1980s, Egypt’s efforts at resource mobilization did notcompare badly with other countries at comparable levels of per capitaincome, structure of production, and openness of economy. Examinationsusing comparable methodology by Chelliah (1971), Tait et al. (1979), andAhmed (1984) of the tax performance of 45 developing countriesbetween 1969–80 showed Egypt to be occupying 3rd to 11th places, exceptfor the period 1972–76 when it fell to 30th place.5 However, expendituresgrew even faster. In 1965–2000, revenues on average accounted for 29percent of GDP, while expenditures averaged 41 percent. Expenditurescontinually outpaced revenues; it was said that Egypt’s fiscal problem wasthat of “earning in Centigrade but spending in Fahrenheit.”
The composition of revenues was dominated by taxes and from profitstransferred by a small number of public organizations, such as the SuezCanal Authority and the Egyptian General Petroleum Company. Othercontributors to revenue were relatively minor (see Figure 6.4). Indirecttaxes, such as import duties and the sales tax, remained much moreimportant than direct taxes, such as income tax.6 This is not surprising.The tax system developed in an uncoordinated manner over the yearswith revenue mobilization as its principal motivation; considerations ofequity, transparency, and efficiency in administration came a distantsecond.
Over the period 1965–2000, the relative contribution of individualtaxes to the total changed. The most important feature was the fall in theshare of taxes on international trade (principally customs duties onimports) as a consequence of gradually lowering import tariffs. While thismeant that additional revenues had to be sought from other sources, itdid push matters in the direction of greater international competition andin helping the country to reap more of the benefits of trade. However, theoverall structure of tax revenue remained skewed towards the external
The public finances 163
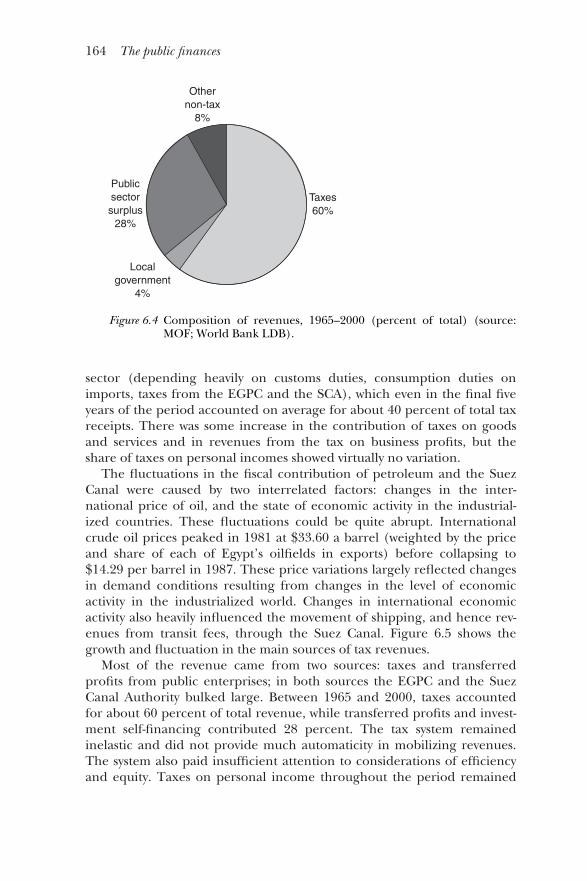
sector (depending heavily on customs duties, consumption duties onimports, taxes from the EGPC and the SCA), which even in the final fiveyears of the period accounted on average for about 40 percent of total taxreceipts. There was some increase in the contribution of taxes on goodsand services and in revenues from the tax on business profits, but theshare of taxes on personal incomes showed virtually no variation.
The fluctuations in the fiscal contribution of petroleum and the SuezCanal were caused by two interrelated factors: changes in the inter-national price of oil, and the state of economic activity in the industrial-ized countries. These fluctuations could be quite abrupt. Internationalcrude oil prices peaked in 1981 at $33.60 a barrel (weighted by the priceand share of each of Egypt’s oilfields in exports) before collapsing to$14.29 per barrel in 1987. These price variations largely reflected changesin demand conditions resulting from changes in the level of economicactivity in the industrialized world. Changes in international economicactivity also heavily influenced the movement of shipping, and hence rev-enues from transit fees, through the Suez Canal. Figure 6.5 shows thegrowth and fluctuation in the main sources of tax revenues.
Most of the revenue came from two sources: taxes and transferredprofits from public enterprises; in both sources the EGPC and the SuezCanal Authority bulked large. Between 1965 and 2000, taxes accountedfor about 60 percent of total revenue, while transferred profits and invest-ment self-financing contributed 28 percent. The tax system remainedinelastic and did not provide much automaticity in mobilizing revenues.The system also paid insufficient attention to considerations of efficiencyand equity. Taxes on personal income throughout the period remained
164 The public finances
Taxes60%
Localgovernment
4%
Othernon-tax
8%
Publicsectorsurplus
28%
Figure 6.4 Composition of revenues, 1965–2000 (percent of total) (source:MOF; World Bank LDB).
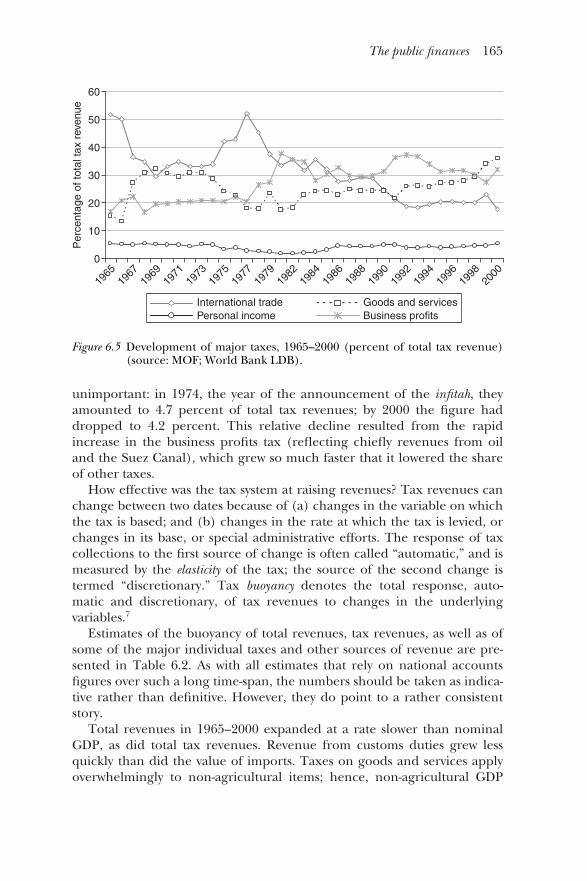
unimportant: in 1974, the year of the announcement of the infitah, theyamounted to 4.7 percent of total tax revenues; by 2000 the figure haddropped to 4.2 percent. This relative decline resulted from the rapidincrease in the business profits tax (reflecting chiefly revenues from oiland the Suez Canal), which grew so much faster that it lowered the shareof other taxes.
How effective was the tax system at raising revenues? Tax revenues canchange between two dates because of (a) changes in the variable on whichthe tax is based; and (b) changes in the rate at which the tax is levied, orchanges in its base, or special administrative efforts. The response of taxcollections to the first source of change is often called “automatic,” and ismeasured by the elasticity of the tax; the source of the second change istermed “discretionary.” Tax buoyancy denotes the total response, auto-matic and discretionary, of tax revenues to changes in the underlyingvariables.7
Estimates of the buoyancy of total revenues, tax revenues, as well as ofsome of the major individual taxes and other sources of revenue are pre-sented in Table 6.2. As with all estimates that rely on national accountsfigures over such a long time-span, the numbers should be taken as indica-tive rather than definitive. However, they do point to a rather consistentstory.
Total revenues in 1965–2000 expanded at a rate slower than nominalGDP, as did total tax revenues. Revenue from customs duties grew lessquickly than did the value of imports. Taxes on goods and services applyoverwhelmingly to non-agricultural items; hence, non-agricultural GDP
The public finances 165
Per
cent
age
of to
tal t
ax r
even
ue
60
50
40
30
20
10
0
1965
1967
1969
1971
1973
1975
1977
1979
1982
1984
1986
1988
1990
1992
1994
1996
1998
2000
International tradePersonal income
Goods and servicesBusiness profits
Figure 6.5 Development of major taxes, 1965–2000 (percent of total tax revenue)(source: MOF; World Bank LDB).

was taken as the determining variable, and the result showed a signific-antly sluggish response. Taxes on personal incomes and business profits,for the same reason, were also compared with non-agricultural GDP, anddemonstrated a similar lack of buoyancy. In fact, if taxes from the EGPCand the SCA are excluded, the buoyancy of total revenue falls to 0.75 andof the profits tax to 0.64. Thus, the overall picture is that revenues,particularly those from taxes, fell short of the growth in the variables onwhich they were based. This can be attributed to exemptions (includingtax holidays), non-compliance, the use of specific as opposed to ad valoremrates, and weaknesses in tax administration that lowered the amountscollected.
Was the tax system effective in promoting equity? The principle ofequitable taxation is that people should contribute to the cost of govern-ment in line with their ability to pay. This raises two considerations. Thefirst, sometimes known as “horizontal equity,” says that people with equalcapacity should pay the same; the second, sometimes termed “verticalequity,” holds that people with greater ability should pay more.8 Ofcourse, the implementation of either rule requires a comprehensivemeasure of “ability to pay.” This, in turn, has sparked a considerable dis-cussion of issues such as the basis on which ability to pay should be meas-ured (should it be income, total expenditure, consumption, or wealth?),how should one include the option of leisure, and so on. In practice,however, annual income has been used as the most widely accepted indexof the ability to pay.
The structure of the Egyptian tax system during 1965–2000 was largelyregressive. Between 50–60 percent of tax revenues came from taxes oncommodities (tariffs and sales taxes). The principal aim of the system wasto raise revenues; considerations of incentive, efficiency, and equity wereless in evidence.
The structure of taxes is shown in Table 6.3, and displayed graphicallyin Figure 6.6. In the period 1965–2000, direct taxes (business income taxand personal income tax) provided about 36 percent of tax revenues,while 64 percent was provided by indirect taxes. The overwhelming part ofdirect taxes came from the taxation of business profits (with the Suez
166 The public finances
Table 6.2 Buoyancy of major revenue sources, 1965–2000
Revenue source Determining variable Buoyancy
Total revenue GDP 0.95Total taxes GDP 0.96Customs duties Imports 0.94Goods and services Non-agricultural GDP 0.81Personal incomes Non-agricultural GDP 0.78Business profits Non-agricultural GDP 0.82
Source: MOF; MOP.
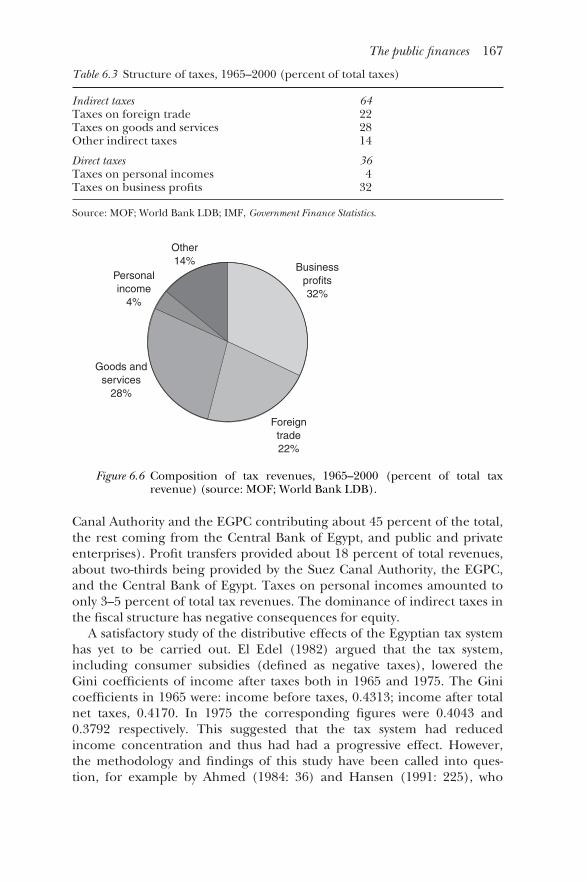
Canal Authority and the EGPC contributing about 45 percent of the total,the rest coming from the Central Bank of Egypt, and public and privateenterprises). Profit transfers provided about 18 percent of total revenues,about two-thirds being provided by the Suez Canal Authority, the EGPC,and the Central Bank of Egypt. Taxes on personal incomes amounted toonly 3–5 percent of total tax revenues. The dominance of indirect taxes inthe fiscal structure has negative consequences for equity.
A satisfactory study of the distributive effects of the Egyptian tax systemhas yet to be carried out. El Edel (1982) argued that the tax system,including consumer subsidies (defined as negative taxes), lowered theGini coefficients of income after taxes both in 1965 and 1975. The Ginicoefficients in 1965 were: income before taxes, 0.4313; income after totalnet taxes, 0.4170. In 1975 the corresponding figures were 0.4043 and0.3792 respectively. This suggested that the tax system had reducedincome concentration and thus had had a progressive effect. However,the methodology and findings of this study have been called into ques-tion, for example by Ahmed (1984: 36) and Hansen (1991: 225), who
The public finances 167
Table 6.3 Structure of taxes, 1965–2000 (percent of total taxes)
Indirect taxes 64Taxes on foreign trade 22Taxes on goods and services 28Other indirect taxes 14
Direct taxes 36Taxes on personal incomes 4Taxes on business profits 32
Source: MOF; World Bank LDB; IMF, Government Finance Statistics.
Businessprofits32%
Foreigntrade22%
Goods andservices
28%
Personalincome
4%
Other14%
Figure 6.6 Composition of tax revenues, 1965–2000 (percent of total taxrevenue) (source: MOF; World Bank LDB).

have disputed the validity of some key assumptions, particularly concern-ing the shifting of taxes.
On other evidence, the Egyptian tax system does not appear to be veryeffective in furthering the government’s equity goals. Ahmed (1984: 36–7)and Dinh and Giugale (1991: 17–18) have pointed out that in order tosatisfy the principle of horizontal equity, the tax rate should vary accord-ing to income levels rather than income sources. But the taxation ofincome in Egypt is largely based on a schedular system with the tax ratevarying according to the source of income: “earned” income (e.g. thatfrom wages and salaries) is taxed at a higher rate than “unearned” income(e.g. that from dividends or bonds), and taxes on property are almost neg-ligible. Moreover, large tax exemptions were granted in order to stimulateprivate investment. These factors, together with the substantial taxevasion, indicate that the tax base for particular income groups has beeneroded. The principle of vertical equity is given more support by the pro-gressive rate structure of the tax system. However, the extremely low col-lections of personal income taxation (between 1965–2000 stagnating at anaverage of 4 percent of total tax revenue) suggest that in practice the taxsystem suffered from considerable weaknesses in terms of vertical equity aswell. Musgrave’s (1959: v) comment that “the effects of a tax depend uponwhat it is, not what it is meant to be,” is particularly relevant in thesecircumstances.
Additional resources were generated through methods that were notentirely transparent, and the burden of which did not necessarily corres-pond to the income of the tax payer. Two such principal sources were the“inflation tax” and the taxation of agriculture.
Keynes (1923: 52) had argued that “what is raised by printing notes isjust as much taken from the public as is a beer duty or an income tax.”Inflation dilutes the real value of the public sector’s domestic debt, andthis erosion of the public debt is equivalent to a tax because, like othertaxes, it lowers the private sector’s real disposable income. Keynes (1923:37) commented further that, “It is the form of taxation that the publicfinds hardest to evade and even the weakest government can enforce,when it can enforce nothing else.” After all, it is a tax that Parliament doesnot have to vote for and it requires no agency to administer.
Throughout much of 1965–2000, the budget ran a substantial deficit.During 1965–90 (i.e. before the stabilization program) the deficit aver-aged nearly 17 percent of GDP, while for the entire period (1965–2000) itaveraged about 12.5 percent. A large part of the deficit (amounting onaverage to 4.7 percent of GDP during 1965–2000, and nearly 6 percent ofGDP in 1965–90) was financed through borrowing from the domesticbanking system. The rate of inflation, as reflected in the growth of theConsumer Price Index, averaged about 10 percent annually over theentire 35-year period, and nearly 14.5 percent during 1965–90. Thesedevelopments permitted the authorities substantial recourse to the infla-
168 The public finances

tion tax, namely, the real revenue obtained by the government when infla-tion erodes the real value of its nominal liabilities, i.e. the money base(the Central Bank of Egypt’s liability) and the domestic public debt (theMinistry of Finance’s liability).9
Studies of inflation in Egypt are handicapped by weaknesses in theConsumer Price Index, which is the measure generally used to indicatemovements in the overall price level. Important problems in the construc-tion of this index are the weight of commodities that are recorded at con-trolled prices (and which may not, in fact, be available at these prices); theinfrequent adjustment to the consumption basket which, given the use ofa Laspeyres type price index, would heavily overweight past consumptionpatterns; and the collection of price data on only a partial basis (forseveral years, only one-third of prices in the consumption basket were sur-veyed each quarter). Further issues arise from splicing together series ofprice indices computed on different base years, and the additional dif-ficulties of allowing for quality changes in the goods included in the con-sumption basket over such a long period. In view of these complications,the following breakdown is offered only as a rather rough summary.
Broadly speaking, inflation during 1965–2000 can be divided into fourperiods:
• from 1965–73 Egypt underwent low inflation, averaging about 5.7percent annually;
• from 1974–86 the inflation rate increased, averaging 12.3 percent ayear;
• between 1987–92 the annual inflation rate spurted to 20.2 percent;• in 1993–2000 the stabilization program brought down the rate to
about 6 percent a year.
Decompositions of the sources of inflation, such as by the IMF (1998:19–23), into the contributions of “broad money” (M2), real activity, andvelocity of circulation, show that the rate of inflation in Egypt for the mostpart has been influenced by the growth in broad money. The major causeof the growth of M2 was growth in credit to the public sector, reflectingbudget deficits. However, between 1993–2000 budget deficits declinedand consequently credit to the public sector became relatively unimpor-tant; the main reason for the increase in the money supply was the surgein credit to the private sector. The second most important factor was thegrowth of real output. The significance of changes in real output in offset-ting the inflationary impact of monetary growth varied; the growth of realGDP made its greatest contribution in the first two periods noted above.Changes in the velocity of broad money consistently made the smallestcontribution to changes in the inflation rate.
Revenue from the inflation tax for the period 1975–91 (when the infla-tion rate was nearly 18 percent annually) averaged over 4 percent of GDP.
The public finances 169

In particular years it was much higher. Dinh and Giugale (1991: 10) foundthat in 1987 it reached 10.6 percent of GDP; this compared with total con-ventional tax revenue in the central government’s budget of that year ofabout 17 percent of GDP.10 As expected, the incidence of this tax fell mostheavily on the household sector and the private business sector. Moreover,a comparison with other countries at the same level of developmentshowed that Egypt managed to extract a higher rate of inflation tax, eventhough the country’s (officially measured) rate of inflation was signific-antly lower. The explanation is that Egypt had the largest base onwhich the tax was levied – during the entire period 1965–91 the ratio ofmoney to GDP was much higher in Egypt than in comparably developedcountries.11
For much of the period 1965–90, Egyptian public finances were a bene-ficiary of inflation. After 1991, the importance of the inflation tax beganto drop as the rate of inflation declined with the implementation of thestabilization program. But it was also becoming more difficult to maintainthe base to which this tax applied. The inflation tax can apply only to thedomestic money base, and this was steadily eroding with the increasingrate of dollarization. As a result of continuing inflation, real interest rateshad turned negative and the expected remuneration on foreign currencydeposits far exceeded that on domestic currency. Dailami and Dinh(1991: 13) calculated that during 1980–89 the mean nominal return ontime deposits in local currency was 10.6 percent, while the correspondingreturn on foreign currency (including the realized devaluation of theEgyptian pound against the US dollar) was 25.6 percent. Nevertheless,Egyptian savers had continued (or been compelled) to accept instru-ments, principally bank deposits, with declining real values. In effect,lenders to banks (i.e. the depositors) were paying for the “privilege” oflending!
The most plausible explanation for this behavior, offered by Dinh andGiugale (1991: 16–17), is that Egyptian savers suffered from a money illu-sion during the beginning of the 1980s. When this waned, alternativeassets were not readily accessible because the most obvious option,namely, holding deposits in foreign exchange accounts, was limited totraceable remittances from bank accounts abroad. Holders of domesticcurrency could not easily convert it into foreign currency. This could notgo on indefinitely. Zaki (2001: 1877) shows that the more seigniorage wasexploited, the more it encouraged the substitution of dollars for domesticcurrency; he describes this process as a sort of “market-enforced monetaryreform.” Over time, an increasing proportion of the money supply was“dollarized”; in 1990 almost 50 percent of money and quasi-money washeld in foreign currency. These developments diminished the base for theinflation tax.
Dinh and Giugale (1991: 20–2) examined the equity impact of theinflation tax paid by the household sector. They found that the magnitude
170 The public finances

of this tax in the 1980s was quite considerable, peaking at 8.3 percent ofGDP in 1987; this compared with 0.5 percent of GDP actually paid as theformal income tax in that year. They concluded that the inflation tax wasmore regressive than other income taxes, because the inflation tax iseffectively a flat rate income tax with no deductions and no exemptions.Because it is a flat rate tax, it is more regressive than other forms ofincome taxes that have progressive rates built in. Moreover, Dinh andGiugale judged that the rich were more able to keep assets in foreign cur-rency, as were workers from abroad. To that extent, it was most likely thatthe middle- and low-income groups paid a high proportion of the infla-tion tax.
The mobilization of revenues from taxes labored under a special dis-ability throughout 1965–2000. Agriculture constituted the largest singleeconomic sector for much of the period, but because of the very largenumber of persons involved with low levels of literacy (and presumablynumeracy), the direct taxation of agriculture could not be cost-effective.Thus the main form of “direct” taxation of agricultural income waseffected through a proxy, namely, a tax on land holdings. The yield fromthis tax was extremely limited, amounting to less than 1 percent of agricul-tural value-added.
Resources from agriculture were therefore extracted through indirectmeans: the compulsory procurement of crops by the government at con-trolled prices that were well below international prices, and the determina-tion of the cropping pattern through area restrictions. This meant that onlya part of the resultant taxation was available to the Treasury as cash revenue(mainly through profits from raw cotton exports); the major part appearedas subsidies on industrial inputs (as in the sale of raw cotton at less-than-world prices to public sector textile mills) and on final consumption goods.
Expenditure issues
Expenditures remained high throughout 1965–2000, at times approach-ing 50 percent of GDP. The expenditure side was dominated by currentexpenditures, which during the period averaged almost 68 percent of thetotal. Most of these expenditures consisted of payments for salaries andcost of living subsidies (Figure 6.7). The government continued to providea large measure of employment: in 2000, employment in central and localgovernments and the public service authorities accounted for nearly one-third of the total labor force. Not surprisingly, expenditure on wages andsalaries accounted for 23 percent of total expenditure during 1965–2000.
The weight of the cost of living subsidies decreased over the period asthe number of subsidized items was brought down from 18 in 1977 to onlyfour by 2000. In 1965–90, i.e. before the stabilization program, subsidiesabsorbed 18 percent of total expenditure; in the next decade the averagefell to 7 percent. Over the entire 1965–2000 period, expenditure on cost
The public finances 171

of living subsidies constituted just over 11 percent of total expenditures.In certain years it could, of course, be very much higher; for example in1975–81 subsidies took about 22 percent of budgetary expenditures.
During 1965–2000, budgetary expenditures on investment accounted onaverage for about 32 percent of total expenditure. With the introduction ofthe stabilization program from 1991 and the necessity of restoring balancein the fiscal accounts, expenditures were held back well below the growth ofGDP. Total budgetary expenditure dropped from 38 percent of GDP in1990 to 29 percent in 1995. The main impact of expenditure cuts fell oninvestment: budgetary expenditures on investment dropped from 39percent of total expenditure in 1990 to 19 percent in 1995. They recoveredsomewhat thereafter, but even in 2000 (at 26 percent of total expenditure)were a substantially smaller proportion than at the start of the decade.
While Figure 6.7 showed the composition of total expenditure during1965–2000, a picture of the annual fluctuations can be obtained fromFigure 6.8.
In addition to the fall in the share of total expenditure on investmentand subsidies, other structural changes occurred on the payments side ofthe budget between 1965 and 2000. The costs of administration, as shownby the figures for central, local, and service agencies, were brought downfrom their levels in the 1960s, even though in 2000 they still consumed 50percent of total expenditure. Another notable change was the sharp risein interest payments on government debt. In the 1990s, about 70 percentof these payments were on domestic debt, reflecting two factors. One, thestock of domestic debt had increased rapidly in the 1980s and early 1990sin order to finance the budget deficits of those years, while the externaldebt stock had been written down in the rearrangements of 1991–96. The
172 The public finances
Central, local andservice agencies
46%
Investment32%
Public economicorganizations and
authorities2%
Subsidies11%
Interest9%
Figure 6.7 Composition of expenditures, 1965–2000 (percent of total expendi-ture) (source: MOF; World Bank LDB).

share of domestic debt had consequently surged from 39 percent of totalgovernment debt in 1990 to 70 percent in 2000. Two, much of the exter-nal debt had been contracted on concessional terms while domestic debthad attracted much harder terms.
Public expenditures were buoyant with respect to the underlying vari-ables. An estimate of the buoyancy of the various heads of expenditure isshown in Table 6.4.
Almost all the expenditure items showed greater buoyancy than thoseon the revenue side. Indeed, the increase in expenditure virtually kept up
The public finances 173
80
Per
cent
age
of to
tal e
xpen
ditu
re 70
60
50
40
30
20
10
0
1965
1967
1969
1971
1973
1975
1977
1979
1982
1984
1986
1988
1990
1992
1994
1996
1998
2000
Central, local, and service agenciesPublic economic organizations’ and authorities’ deficitsSubsidiesInterestInvestment expenditure
Figure 6.8 Development of government expenditures, 1965–2000 (percent of totalexpenditure) (source: MOF; World Bank LDB).
Table 6.4 Buoyancy of major expenditures, 1965–2000
Expenditure Determining variable Buoyancy
Total expenditure GDP 0.99Current expenditure GDP 0.99Current expenditure (1982–2000) Inflation (CPI) 1.02Central, local, and regional GDP 0.98Subsidies GDP 0.94Interest GDP 1.07Interest (1982–2000) Inflation (CPI) 1.08Investment GDP 0.98
Source: MOF; MOP; IMF, Government Finance Statistics.

with the increases in GDP. Special mention must be made of expenditureon interest, which exhibited a buoyancy of greater than unity in relationto GDP. Both current expenditure and interest payments also showedhigh buoyancy with respect to inflation. The consistently higher buoyancyvalues for expenditures tends to confirm that Egypt’s budgetary problemswere largely structural, and arose from the more rapid response of expen-diture items than of revenue sources to the growth of the economy.
Fiscal sustainability
So far the analysis has largely focused on the overall balance, i.e. the dif-ference between total revenues and expenditures. This balance, if indeficit, measures how much the government must borrow in order tocover its total outlay. However, alternative measures of balance may bemore suitable for other aspects of fiscal analysis. Thus the current balance– the difference between the budget’s current revenues and expendi-tures – provides an estimate of the government’s saving (or dissaving).Another measure is the primary balance, which represents the differencebetween total government revenues and outlays, except interest pay-ments.
The concept of the primary deficit is useful for two reasons. First, inter-est payments reflect the consequences of past fiscal policies (i.e. they rep-resent the costs of debt accumulated to finance past overall deficits).Hence, excluding them in computing the primary balance enables one toclarify whether the government can afford its present programs. If theprimary balance is zero, the government is generating just enoughrevenue to cover the costs of its purchases of goods and services and itstransfer payments. If, on the other hand, a primary deficit exists, thenpresent government purchases and social programs cost more thanpresent revenues can cover. Second, the primary balance enables one toaddress the crucial issue of a sustainable fiscal policy.12 A primary balanceindicates that the government is just covering its non-interest expenditure,and it must borrow in order to service past borrowing.
Domar (1944) showed that in the long run the debt:GNP ratio will be sta-bilized if the primary surplus (i.e. a negative primary deficit) at least equalsthe product of the debt:GNP ratio and the difference between the rate ofinterest and the rate of growth of nominal GNP. Following Leddin andWalsh (1992: 102–4) these conditions can be recast so that the primarydeficit required to meet the conditions of stability can be written as:
�p�(r�g)d�0
where p� the primary deficit to GDP ratio [i.e. (total borrowing� interestpayments)/GDP]; r� the rate of interest; g�growth rate of nominal GDP;and d� the ratio of debt at the beginning of the period to GDP.
174 The public finances

For 2000, the debt:GDP ratio was 0.85, the growth rate of nominal GDPabout 11 percent, and the average interest rate on the government’s debtabout 6.9 percent. Inserting these figures into the equation:
p��(6.9�11.0)0.85�3.48
This means that with the foregoing GDP growth rate and interest rate, theEgyptian economy could run a primary deficit of about 3.5 percent ofGDP with a stable debt:GDP ratio. A primary deficit greater than thiswould lead to a rise in the debt:GDP ratio, while a lower deficit woulddecrease the ratio. The primary balance in 2000 was reported as showing amodest surplus of 1.64 percent of GDP, which would lead to a decrease inthe debt:GDP ratio. But a fall in the GDP growth, a rise in the interest rateon government paper, or a shock to the system (such as devaluation) thatincreased the value of the debt stock in Egyptian currency, could substan-tially alter the results. Moreover, given the caveats attached to the fiscalaccounts, I must reiterate that the purpose of the calculation is only tosuggest an approach to thinking about fiscal sustainability.
The crucial numbers are the growth rate of nominal GDP and theinterest rate. If the growth rate of nominal GDP had been, say, 5 percent,the outcome would have been: p��(6.9�5.0)0.85��1.62. The minussign means that Egypt would have to run a primary surplus (since p wasdefined as a primary deficit) of 1.62 percent of GDP in order to stabilizethe debt:GDP ratio. The relatively low actual interest rate reflects theweight in total debt of the country’s external debt, which carried highlyconcessional terms (particularly after the 1991–96 debt rearrangements).The overall interest rate, however, was rising – it was about 5.5 percentin 1991 – reflecting the increasing proportion of domestic debt intotal debt (Figure 6.9). This proportion had increased rapidly from about
The public finances 175
Per
cent
age
of to
tal d
ebt
80
70
60
50
40
30
20
10
01987 1988 1989 1990 1991 1992 1993 1994 1995 1996 1997 1998 1999 2000
Figure 6.9 Domestic debt as percent of total debt, 1987–2000 (source: MOF; WorldBank LDB).
40 percent of the total (carrying an effective interest rate of 8.3 percent)in 1991 to over 70 percent in 2000 with an effective interest rate of 8.9percent (in real terms the difference was even greater, as inflation in 2000was substantially lower than in 1991). Between the same years, the effect-ive interest rate on external debt had dropped from 3.7 percent to 2.2percent.
The foregoing measure of fiscal sustainability, however, shows only apartial picture. A more complete discussion of the issue requires aconsideration of the sources of future fiscal risk and their effects on thedebt:GDP ratio.
Risks to the sustainability of the fiscal equilibrium can arise from anumber of sources. In the case of Egypt, the most likely generators of risksare: a decline in the GDP growth rate; an increase in real domestic inter-est rates; a depreciation of the currency; a decline in fiscal revenues; andan increase in budgetary spending.
Some international organizations, such as the World Bank, have simu-lated the long-term effect on the budget of variations in the foregoing riskgenerators. While the detailed conclusions rely on the validity of theassumptions, some of the more important conclusions can be brieflystated.
The essential variable related to fiscal sustainability and the risk to it isthe debt:GDP ratio. An increase in this ratio beyond a certain point islikely to lead to a crisis of confidence – financing would not be available,the deficit would have to be monetized, thus providing an impetus toinflation. The critical point for the debt:GDP ratio differs between studies,but 60 percent is a commonly used figure; it is, for example, the ceilingfor government debt in the Euro area set by the Maastricht Treaty.Although the ratio of public debt to GDP in Egypt declined rapidly in the1990s, in 2000 it was still close to 85 percent. The simulation exercisesassumed that this should not worsen – with good reason: the IMF (2003:54) reported that about 55 percent of debt defaults that occurred in thelast 30 years were in countries with debt:GDP ratios below 60 percent andabout 35 percent in those with debt:GDP ratios of less than 40 percent.
The simulations estimated that a sustained decline in the 2000 growthrate of GDP by 1 percentage point would increase the debt:GDP ratio byalmost 5 points in 2010. On the other hand, an increase of the GDPgrowth rate to between 6–7 percent during 2000–10 would improve theratio by nearly 6 percentage points at the end of the decade. Domesticinterest rates also had an important impact – an increase of 2 percentagepoints in domestic interest rates would increase the ratio by about 6 per-centage points, and worsen the budget balance:GDP by about 1 percent-age point in 2010.
Depreciation of the pound would have an important effect by raisingthe real external interest rate and hence the cost of servicing externaldebt. A depreciation of 5 percent a year could, in the simulations of the
176 The public finances

model, add more than 10 percentage points to the debt:GDP ratio by2010. Parenthetically, one might note that between 2000 and 2003, theEgyptian pound depreciated by more than 30 percent.
A major fiscal risk in Egypt is the potential for a decline in budgetaryrevenues. This chapter has already highlighted the extent to which Egypt’srevenues are dependent on external sources and the wide fluctuations towhich these revenues are subject. These facts underscore the vulnerabilityof Egypt’s budgetary resources. Moreover, the government might be inthe position of losing a significant source of revenue. As Egypt enters afree-trade agreement with the European Union, tariffs on imports fromEurope will be reduced and finally eliminated. Devarajan et al. (1999) esti-mated the fiscal impact of trade reform in 60 countries. Their results indi-cate that the direction and magnitude of the fiscal consequences dependon the elasticities of substitution and transformation between foreign anddomestic goods. Their empirical estimates suggest that in most cases theseelasticities fall short of the point at which tariff reform could be self-financing. For Egypt, the estimated elasticities were only 0.10 and 0.11,implying that the reduction in tariff rates was likely to lead to a reductionin fiscal revenues. If fiscal equilibrium is to be sustained, Egypt will have toreplace the lost tariff revenues from other sources.
The World Bank simulations found that the major risk to fiscal sustain-ability arose from potential increases in government spending. Anincrease in the expenditure:GDP ratio of 5 percentage points a year hadthe potential of adding almost 50 percentage points to the debt:GDP ratioand almost 10 percentage points to the budget balance:GDP ratio in 2010.An annual increase in the primary expenditure:GDP ratio by 1 percentagepoint would increase debt:GDP and budget balance:GDP ratios by 10 and2 percentage points respectively in 2010 over the levels projected if themodel assumptions obtained.
The foregoing results from the simulations suggest that the fiscal situ-ation, although much improved between 1990 and 2000, was still vulner-able. Two further issues add to the need for watchfulness. First, thesimulations showed that while the effects of changes in each of the riskfactors singly was likely to be significant, the effects of changes in morethan one variable at the same time had disproportionately large effectsand could seriously jeopardize fiscal sustainability. And in Egypt’s situ-ation a simultaneous change in several variables is not at all unlikely.Second, an important potential threat to fiscal sustainability is posed bycontingent liabilities, which under Egyptian fiscal conventions areexcluded from the budget and left unfunded. These are latent risks thatmay or may not occur, but which, if they did occur, would force thegovernment to increase its borrowing and thus its debt burden. Severalsources of contingent liabilities could affect the Egyptian budget: makingup losses of public enterprises; paying on government guarantees of loansto public enterprises and to local governments; making good losses on
The public finances 177

foreign exchange guarantees; paying for bailouts and recapitalizing thebanking system; and increased payouts to the social insurance system asthe demographic structure changes, and as privatization and its associatedretrenchment impacts on the assets of the pension funds. Each of theseareas carries substantial potential risks that might be realized.
Extending the analysis to beyond 2000 confirms the dangers of some ofthese risks. A study by Alba et al. (2004) decomposed the growth of thepublic debt into structural and cyclical components. The study found thatEgypt’s deficits and debt were being pushed up more by structural than bycyclical factors. It found that a cyclically-adjusted (or neutral) fiscal deficitwould have fluctuated between 2.8 percent and 3.2 percent of GDPduring 1999–2003. However, the actual fiscal deficit during this periodvaried between 2.8 percent and 6.5 percent. This suggested to the authorsthat policymakers should not expect to “outgrow” the debt problemduring the next upswing of the business cycle, but that specific actionswould be needed to reduce the structural fiscal deficit. The structuralweaknesses in the fiscal accounts included a declining revenue ratio, adeclining capital expenditure ratio, and a rising current expenditure ratiodominated by wages and interest payments.
The most important effect of deficits in the longer run arises from thereduction in public savings. The conventional view is that private savingrises by less than the fall in public savings, so that aggregate savingdeclines.13 Thus total investment declines as well. The reduced domesticinvestment will result in a smaller domestic capital stock, which in turnimplies lower output and income. Thus the principal long-run effect ofcontinued budget deficits is a reduction in national wealth.
However, another view of the effects of government debt is the so-called “Ricardian equivalence,” which maintains that consumption isindependent of the timing of taxation. According to this view, families arefully aware that government debt that has been issued to finance expendi-ture has to be repaid, and thus represents only a postponement of the taxburden. Families do not increase their consumption in response to abudget deficit, because they recognize that they will be required to payhigher taxes in the future. Therefore, debt finance and tax finance areequivalent, and it is irrelevant whether the government finances its expen-diture through taxes or borrowing.14
Empirical investigations to support or refute this proposition have beeninconclusive. As Elmendorf and Mankiw (1999: 1640–59) point out, this islargely because the Ricardian view makes some fiscal policies irrelevantbut allows other fiscal policies to matter.15 Thus, whether one accepts orrejects the Ricardian hypothesis largely depends on how plausible onebelieves the assumptions underlying the theory to be. And in Elmendorfand Mankiw’s (1999: 1659) summing up of the current state of the debate,“Most economists are incredulous about the assumptions that are neededto support the Ricardian view of government debt.” Indeed, examinations
178 The public finances

by the World Bank (1993a) and by Haque and Montiel (1987) rejectedthe validity of Ricardian equivalence in the context of Egypt.
To briefly sum up the main points in the fiscal area. Progress was madeon structural reform, especially on the revenue side; for example, theGeneral Sales Tax was introduced in 1991 and the Global Income Tax in1993. The expenditure side was also reformed: the food subsidy systemwas restructured, with both the number of items and the cost beingreduced. However, the reliance on rent revenues (from oil and the SuezCanal), the continuing growth of government employment, the risingdomestic debt and the high and rising level of interest payments on it, andthe potential for the realization of contingent liabilities, remained areas ofvulnerability. There are indications that fiscal reforms have not gone farenough. The vulnerability of the budget owes more to structural than tocyclical factors, and the authorities will have to deal with the problem ofsteadily rising public debt.
The public finances 179

7 The financial sector andmonetary policy
The financial sector plays a key role in development by mobilizing savings,by allocating investable resources, and by providing a mechanism formaking payments. Inefficient financial markets are likely to damage theeconomic prospects of a country by increasing the cost of mobilizingsavings, and thus diverting real resources away from investment andgrowth.
The Egyptian financial sector consists of the banking system and thenonbank financial intermediaries. The Central Bank of Egypt (CBE), thecommercial banks, and a number of specialized banks constitute the mainmonetary institutions. The Central Bank of Egypt is the overseer of thebanking sector. Nonbank financial intermediaries chiefly comprise savingsinstitutions and insurance companies. The capital market is dominated bythe Cairo and Alexandria stock exchanges, which are electronically linkedand operate as a single exchange. Other participants are brokers and fundmanagers. The Capital Markets Authority (CMA) is the main supervisor ofthe financial services sector.
The banking sector
Throughout 1960–2000, the financial system was dominated by thebanking sector. At end-2000, total domestic credit was roughly equal toone year’s GDP. By way of comparison, the free-float of equities availablefor trading on the stock exchange at current market prices, and the totalvalue of listed bonds (mainly government bonds) was each less than 3percent of GDP. Similarly, investments by the insurance and private fundsector, the bulk of which was in turn held in the form of bank deposits orlisted shares, amounted to less than 5 percent of GDP.
The main source of funds for the banks during the period was depositsfrom the household sector. In 2000, such deposits accounted for morethan 60 percent of total deposits. Domestic residents continued to holdmuch of their savings in the form of bank deposits, even though real inter-est rates on deposits were consistently negative from 1970 until 1991. Thenegative rates could reach punitive depths; for example, in 1979 and
again in 1985, real deposit interest rates dropped to almost �10 percent.After 1991 they increased, but turned continuously positive only from1995. Foreign exchange-denominated deposits in the banking system fluc-tuated a good deal from the time that the public was permitted to holdsuch deposits. Foreign exchange-denominated deposits (i.e. “dollariza-tion”) in 1991 reached 50 percent of total deposits. They dropped sharplyafter the economic reforms of 1991, falling to 28 percent by 1994 and toabout 20 percent by 2000.
Between 1960 and 2000, the destination of lending changed signific-antly. In 1960, nearly 60 percent of domestic credit constituted netlending to the government; by 2000 the figure had dropped to about25 percent. The remainder went chiefly to the domestic business sector,with significant proportions flowing to the household sector and thepublic enterprise sector; the former component was growing, the latterdeclining.
The structure and operating environment of the banking system alsochanged. Following the nationalization of the major economic units in the1960s, the Egyptian banking system remained small and under the controlof the public sector. In the 1970s the banking system was centralized ineight banks, of which four were commercial banks and the remaining fourspecialized banks. As part of the infitah policy, a banking law was enactedin 1975 (Law 120/1975) that identified three types of banks:
1 Commercial banks, which could accept deposits and provide financefor a wide variety of transactions.
2 Business and investment banks, which carried out medium- and long-term operations, such as the promotion of new businesses and thefinancing of fixed investments. They would also be allowed to acceptdeposits and to finance foreign trade operations.
3 Specialized banks, which would support specific types of economicactivity; for example, the Principal Bank for the Development of Agri-culture and Credit (PBDAC), which was designed to channel credit tothe agricultural sector.
The banking system expanded rapidly and in 1985 consisted of 83 banks,of which 74 were private. The latter included 23 branches of foreign banksand 24 local banks. However, despite this plethora of banks, the systemcontinued to be dominated by the four public sector commercial bankswhich accounted for nearly 75 percent of deposits and about two-thirds ofloans. Starting in 1990, several reforms were introduced that liberalizedmany aspects of the banking sector. During the 1990s, some consolidationof the banking system took place and a number of joint-venture bankswere privatized. As a result, at end-2000 there were 63 banks registeredwith the Central Bank of Egypt. These included 28 commercial banks, 31business and investment banks, and four specialized banks. The four
The financial sector and monetary policy 181
public sector commercial banks continued to dominate the bankingscene, with about 70 percent of deposits and almost 50 percent of loans.
As part of the ERSAP adopted in 1991, Egypt introduced a number ofreforms in the banking sector: The principal measures were the following.
Interest rates on the Egyptian pound were liberalized. Foreignexchange controls were significantly reduced and the different exchangerates were unified at the level of the most devalued rate. Credit ceilingswere abolished in October 1992 for the private sector and in July 1993 forthe public sector. The unremunerated reserve balances held at the CBEwere brought down to 15 percent of a bank’s total Egyptian pounddeposits.1 The required reserve ratio on foreign exchange deposits wasbrought down to 10 percent; moreover, these reserves were remunerated.The liquidity ratio was reduced to 20 percent for local-currency and 25percent for foreign-currency balances. Capital adequacy ratios for bankswere brought into line with the Basel Accord.
Further reforms continued in subsequent years – in 1997 the CentralBank required all banks to publish financial reports on the basis of Inter-national Accounting Standards (IAS), and in 1998 legislation was enactedpermitting the privatization of the public sector banks. The joint-venturebanks started to be privatized. The public sector banks were required toreduce their ownership in joint-venture banks to a maximum of 20percent; by June 2000, state ownership in 15 (out of 23) of such banks haddropped below 20 percent of capital.
Credit facilities granted by commercial banks to public sector com-panies and to the private sector were limited to 65 percent of the total ofdeposit balances and equity (paid-up capital and reserves). Claims of com-mercial banks on the household and trade sectors put together were notpermitted to increase by more than 12 percent a year. Commercial bankswere not allowed to finance the import of consumer durables. However,for several years the effectiveness of these ratios and credit ceilings waslimited because the penalties for their violation were relatively minor.
How did the various groups of banks perform after liberalization? Table7.1 shows some key measures of performance for three groups of banks:the public sector commercial banks, private banks, and specialized banks.The greater each ratio in the table, the more profitable is the bank, otherfactors being equal. In general, private banks performed better than theother bank groups, with the profit margin and the return on equity beingparticularly high. The high profit margin, defined as the ratio of netincome to total operating income, indicated that private banks were moreefficient at controlling expenses. This contributed to the higher return onequity, measured as the ratio of net income to equity. The private banksalso showed a higher return on assets (measured as net income per unit ofassets).
The interest margin (the ratio of net interest income to earning assets),is a summary measure of net interest returns on income-producing assets.
182 The financial sector and monetary policy

El-Shazly (1999, 2001) explained the relatively lower interest margin inprivate banks as being at least partly due to a smaller loan portfolio rela-tive to the deposit base. The low interest margin of the public sector banksreflected nonaccrual of interest on a large volume of non-performingloans to state-owned enterprises. The specialized banks were able to posthigher interest margins because they were able to borrow lower-cost fundsfrom state-owned financial enterprises (i.e. their interest expenses wereartificially lowered).
Major issues
The role and working of the Egyptian financial sector during 1960–2000raises a number of important issues.
How effectively did financial sector policy contribute to the developmentof the economy?
The answer must be: “Only moderately well.” This resulted from fourfactors. First, the relative size of the sector remained limited. Between1960 and 2000, the financial sector developed in complexity and in theabsolute values of its various components. However, by some importantmeasures the growth of the sector fell short of the requirements of theeconomy. For most of the 1990s, money supply broadly defined (i.e. M2)grew more slowly than GDP, so that M2:GDP was falling and the ratio atend-2000 was lower than a decade earlier.
Second, for most of the three decades 1960–90, the Egyptian financialsystem was subject to repressive policies. Financial suppression, sometimestermed “illiberal finance,” is characterized by administrative control onmost interest rates and over the allocation of credit to particular sectors,the taxation of the banking sector through unremunerated reserverequirements that are well in excess of that required on prudentialgrounds, repressive controls on new entry into banking, direct ownershipof banks by the state, and tight controls on external capital movements.
The financial sector and monetary policy 183
Table 7.1 Measures of bank performance, 1991–2000 (period average, in percent)
Public sector Specialized Private commercial banks banks banks
Return on equity 5.6 2.8 18.5Return on assets 0.2 0.2 1.3Profit margin 2.4 2.4 14.4Interest margin 0.7 3.7 1.1(Provisions�equity)/assets 11.1 13.7 17.4Deposit growth 11.9 11.1 12.8
Source: El-Shazly (2001) [updated].
The consequences of such repression have been well documented forEgypt – for example, World Bank (1993a), Mohieldin (1995, 1998), Roe(1998) – and for several other countries, for instance by Fry (1995). Themain results of financial repression in Egypt were that nominal interestrates, both on deposits and lending, remained low (5 percent or below formost of 1960–90) even in the face of high inflation; indeed, from the mid-1970s to 1991 real interest rates were negative. This contributed to distor-tions in resource allocation and on incentives for saving. Moreover,because at the artificially low interest rates set by official intervention, thedemand for funds exceeded the supply, and credit was rationed by admin-istrative mechanisms, such as bank-specific credit ceilings and directionsto banks as to where the credit should go. Under such a centrally directedfinancial regime, the public sector received on average more than 70percent of total credit during 1960–90. With the adoption of the Eco-nomic Reform and Structural Adjustment Program (ERSAP) in 1991 andthe privatization of public enterprises during the 1990s, there was a shifttowards private sector lending by the banks. However, even by end-2000,nearly 20 percent of the aggregate loan portfolio of commercial banks wasstill advanced to state-owned companies.
Interest rates paid to depositors were kept low in order to keep downthe cost of financing the government’s budget deficit. Since for much of1960–2000 inflation remained high, this meant that for extended periodsreal interest rates on deposits were significantly negative. The real returnson Egyptian pound deposits were even lower when the expected rate ofdepreciation of the Egyptian pound against foreign currencies in the freemarket was taken into account. These interest-rate differentials, adjustedfor the expected rate of depreciation of the domestic currency, encour-aged residents to hold foreign exchange receipts as foreign currencydeposits, rather than converting them to Egyptian pounds. Both El-Erian(1988) and Haque (1990), using quarterly data for 1980–86 and 1984–89,respectively, found evidence of significant switching from domestic toforeign money. Both studies related changes in the currency compositionof money to a difference in expected returns on domestic and foreigncomponents, and found evidence that this was an influential factor. Somelater work by the IMF in estimating money demand functions for thedecade of the 1980s also indicated that foreign currency deposits per-formed as close substitutes for domestic money.
The diverging trends in returns on domestic and foreign currenciessharply increased the rate of “dollarization” in the economy; private sectorholdings of foreign currency deposits rose rapidly from about 25 percentof total liquidity in 1981 to 50 percent at the end of the decade. The latterlevel must surely have diluted the effectiveness of domestic monetarypolicy. The negative rates also led to capital flight and to the accumula-tion of large balances abroad. The precise numbers are, of course, notavailable, but all the estimates put the figures in the tens of billions of
184 The financial sector and monetary policy
dollars by the mid- to the late 1980s; for example, Abu Ali (1987) esti-mated these funds in the 1980s at $60 billion, while the upper end ofsome World Bank calculations was as high as $80 billion.
Third, for long periods the segmented structure of the banking systemled to an incongruence between the direction of economic developmentand the flow of resources. The market remained dominated by the largepublic sector banks and their network of branches. The segmentationcarried over into lending. Most bank lending was directed at large enter-prises in both the public and private sectors (in the latter, the smaller thefirm, the less of its financing comes from banks). The public sector bankschiefly provided for the financial needs of public sector companies,although after the reforms of 1991 their role in serving the private sectorincreased. The joint-venture banks specialized in providing finance forlarge and middle-sized companies in the private sector, although they alsodealt with the public sector. This segmentation of the banking market andthe dominance of the public sector banks played a crucial role in the allo-cation of credit; the World Bank (1993a, vol. 2: 28) concluded that itcrowded out the private sector in the credit market. It was estimated thatduring the 1990s, the private sector received less than 40 percent of theresources allocated by the banking system (including the National Invest-ment Bank) even though it produced about 70 percent of the GDP.
For some key sectors, particularly agriculture, the allocation of creditwas inadequate and the cost high. Commercial banks remained concen-trated in urban areas and lending to the agricultural sector in the 1990saveraged only 3–4 percent of their total credit. Moreover, the cost of suchcredit was high, effectively imposing a tax on financing. Based on CBEdata, the World Bank reported that the intermediation costs of the fourstate commercial banks averaged 3.5 percentage points, considerablyabove the norm for an efficient bank. The intermediation costs of thePrincipal Bank for Development and Agricultural Credit (the major spe-cialized bank for the sector) were even higher, averaging about 5.5 per-centage points.
Fourth, an important manner in which a financial sector supportsinvestment is through maturity transformation, i.e. it accepts depositsfrom households and other sources, possibly for short terms, and lendsthem to businesses for the longer periods required for capital formation.But the Egyptian financial sector’s role in this area was at times quiteequivocal; to an extent, it engaged in reverse transformation. In 2000,more than three-quarters of the commercial banking system’s liabilitieshad a maturity in excess of one year, but more than 70 percent of its assetswere shorter term, with maturities of less than one year. Moreover, sinceover one-third of the insurance and private funds’ investments were inbank deposits, in effect much of what should have been (as in other coun-tries) an important supply of long-term funds for the private sector wasnot being passed through as such. In part this arose from reluctance by
The financial sector and monetary policy 185

banks to engage in other than short-term, self-liquidating loans (such asthose to finance trade or working capital) because of difficulties with thejudicial system in enforcing contracts and realizing the collateral ondefaulted loans; in part it reflected the failure of the financial system todevelop suitable instruments.
The relative inefficiency of the public sector banks
Table 7.1 showed that by virtually all measures, public sector banks, whichdominated the banking system, showed a lack-luster performance. Whywas this so? The most important reason was the protection afforded by thegovernment, which shielded the public banks from competition and thusremoved pressures to reduce costs and improve efficiency. This protectiontook the form of barriers to the entry of private banks, restrictions on thelicensing of branches for non-government banks, and at least an implicitunderstanding that the government would protect deposits in these banksin the event of a crisis. The main barriers to the entry of new banks werethe high level of minimum authorized capital and the reluctance of theCBE to license new domestic banks. The World Bank (1993a, vol. 2: 5)found that the amounts required for establishing a new bank in Egyptwere well above those adopted by most developed countries, and wouldserve to dissuade many credible potential applicants. Although after themid-1970s a large number of joint-venture commercial banks and businessand investment banks were licensed, most of them were joint venturesbetween public sector banks and large international or Arab banks. Inreality, therefore, the banking system remained dominated by a smallnumber of banking groups that were linked to the public sector banks andaccounted for nearly 90 percent of the total assets of commercial banks.
The absence of competition permitted the public sector banks to livewith higher costs. The World Bank (1993a, vol. 2: 33) found that in the1990s the public sector banks had about 40 staff per branch. Commercialbanks in Britain, Germany, France, and other OECD countries had about25 staff per branch. However, banks specializing in retail banking in theEuropean countries reported levels of staff of around 10 per branch. Thusthe numbers of staff per branch in Egypt were substantially higher com-pared with the staffing levels of most international banks that had exten-sive retail operations. The study judged that Egyptian banks couldsubstantially extend their branch networks without requiring a propor-tionate expansion of staff.
Second, financial sector policies, knowingly or inadvertently, imposedadditional taxation on the banking system. Commercial banks and busi-ness and investment banks were required to hold 25 percent of their totaldeposit balances in local currency at the CBE as a non-interest-bearingreserve ratio. This effectively acted as a tax and reduced the profitability ofthe banks. The World Bank (1993a, vol. 1: 21–2) estimated that the
186 The financial sector and monetary policy

implicit tax imposed on the banking industry was equivalent to about 0.2percent of GDP in December 1990 (i.e. just before the financial liberaliza-tion), or 1.5 percent of the banks’ capital. With interest rate liberalization,the implicit tax increased. The same World Bank study estimated that thetax rose to 0.35 percent of GDP, or 1.9 percent of the banks’ capital inDecember 1991, even though the capital had almost doubled between thetwo dates. The absence of reserve remuneration also impaired the effec-tiveness of reserve requirements as a tool for liquidity management – theCBE was in effect mopping up liquidity by taxing intermediation throughthe banking system. This made the use of reserve requirements a distor-tionary instrument.
Moreover, the banks sought to make up for this loss of revenue byincreasing the spread between lending and deposit rates – Roe (1998: 89)reported that the interest rate spreads averaged 4.4 percentage pointsafter 1976, rising to 6 percentage points at times. The banks were able todo this because of the oligopolistic nature of the market. The AmericanChamber of Commerce in Egypt (1996: 109) estimated that even by theearly 1990s, the four public sector banks directly and indirectly throughtheir stakes in joint-venture banks accounted for over 90 percent of totalcommercial bank assets.
Interest rates on bank loans and on deposits in local currency were setby the CBE. These rates were generally low and, at times, negative in realterms. Nominal rates were kept low in order to minimize the govern-ment’s interest payments on the amounts it borrowed from the bankingsystem to finance the budget deficit. The implicit “financial repressiontax,” calculated as the difference between the shadow real interest rateand the actual ex post real interest rate paid, could be very substantial. In across-country examination, the World Bank (1993a, vol. 1: 51–2) esti-mated that the revenue from this tax in Egypt averaged 5.7 percent ofGDP during 1989–92, and significantly exceeded the revenue obtainedfrom interest distortions in all the countries in the sample.
Third, El-Shazly (2001) found that the weaker performance of publiccommercial and specialized banks (the latter were all state owned) – asmeasured by the indicators of asset risk, financial solvency, profitability,and so on – was not penalized by depositors in the form of a lower growthof deposits. El-Shazly concluded that this lack of market discipline in thebanking system was largely explained by the government’s implicit depositinsurance scheme which protected state banks from the risk of insolvency;consequently, depositors had no strong incentive to penalize asset risk inthese banks. The implicit protection held out by the government to thepublic sector banks had the potential of creating a moral hazard, by sup-porting possibly imprudent behavior by these banks.
A further issue was (and is) the relative lack of transparency regardingthe banks’ financial position, and the uncertainty of assessing the range inwhich the future performance of the loan portfolio would probably lie.
The financial sector and monetary policy 187
Information on the quality of the loan portfolio has always been difficultto obtain; the World Bank (1993a, vol. 2: 30) complained that “their [thebanking data’s] most important weakness is the lack of information on theextent of non-performing assets.” The available data show that the ratio ofnon-performing to total loans at end-2001 was 16.0 percent, up from 14.6percent a year earlier. However, it was commonly suggested that bad loansat public sector banks were significantly higher than reported, that toomuch of their loan portfolio was concentrated on a small number of bor-rowers of doubtful creditworthiness, and that loan-loss provisioning mightnot be adequate. The aggregate amount of loan-loss provisions establishedin the banks’ accounts at end-2001 amounted to 69 percent of nonper-forming loans. Another measure of the impact of credit quality on thebanking industry’s capital is the ratio of nonperforming loans net of provi-sions to capital. At year-end 2001, this ratio had increased to over 53percent from 16 percent in 1998.
The foregoing discussion of profitability, efficiency, and loan qualityemphasizes that the public sector banks were not operated on a purelycommercial basis. The question whether, and to what extent, public sectorbanks should engage in activities that are not decided on the basis ofprofit maximization is ultimately an issue of governance in its widest sense.This question was answered in the early 1960s by asserting that the role ofthe banking system was to support the economic program charted by thedevelopment plans. It was therefore natural that the banks should channelcredit towards the sectors, projects, and activities that had been assignedhigh priority by the plan. With the new direction for the economy sig-naled in 1974 by the infitah and reiterated by the adoption of the ERSAPin 1991, that the private sector would be the prime engine of growth, theissue must be revisited.
The issue cannot be decided without making available for public discus-sion all relevant information. It has been suggested that one importantpiece of information that commercial bank auditors should make avail-able is the likely risk to the government’s budget created by the banks’engaging in noncommercial activities (thereby possibly requiring a bailoutusing public funds). It is not sufficient merely to examine the risks ofthese activities to the public sector commercial banks themselves; thefinancial risk that their noncommercial behavior creates for Egyptiansociety at large must explicitly be taken into account.
Safety and prudential regulation
A banking system should not only be efficient, it must also be safe. Pruden-tial controls aim at reducing the risk of bank failure. A crisis in the bankingsector could impose costs on the economy as a whole as well as on many ofits components, such as shareholders in the banks, depositors, other credi-tors of the banks, borrowers who may not be able to obtain funds from
188 The financial sector and monetary policy
other sources, and taxpayers who may have to bail out banks. The costscould be very large. Hoggarth et al. (2002) reviewed empirical estimates offiscal costs incurred in resolving banking crises, and estimated outputlosses during 47 crises in 37 countries. They found that the cumulativeresolution costs of banking crises were larger in emerging marketeconomies (on average 17.5 percent of annual GDP) than in developedones (12 percent). However, resolution costs did not always provide a goodmeasure of the costs of crises to the economy, because some part of the res-olution costs might represent a transfer. A better measure of the real costto the economy would be the loss of output attributable to the crisis. Usingdifferent methods of estimating the output loss (the difference betweenactual output and output assuming an absence of crisis) during the crisisperiod, they found that the cumulative decline in output during bankingcrises amounted on average to 15–20 percent of annual GDP.
Bank regulation and prudential measures in Egypt developed consider-ably from 1960 to 2000. In the earlier years, when the banking system con-sisted exclusively of public sector banks, the authorities did not feel theneed for sophisticated supervision of the system; as Roe (1998: 99) put it,“Good bookkeeping skills were all that was required to ensure that banksdid what was asked of them.” There was little need to examine the banks’ability to assess the business risks faced by their clients. These clients weremainly public sector enterprises and it was an article of faith for the banksthat such enterprises would be rescued by the government should theyrun into difficulties. With increasing lending to the private sector and withgreater liberalization of Egypt’s capital accounts, the risks faced by com-mercial banks rose significantly.2 These factors require much greatersophistication on the part of commercial banks to monitor risks and muchgreater knowledge of their clients’ abilities to deal with these risks. Thismeans that the Central Bank must have the competence to judge thedegree to which the commercial banks are able to perform this task, andthe ability to enforce measures that would raise performance to therequired level.
From 1991, banks were required to comply with asset classification andprovisioning in accordance with the Basel Committee’s recommendations.The banks’ minimum capital requirements were raised to 8 percent oftheir risk-weighted assets. The reserve ratios at end-2000 were 15 percentof Egyptian pound deposits and 15 percent of total foreign currencydeposits (the latter earning interest equivalent to LIBOR, the LondonInter-Bank Offered Rate). These ratios were higher than those applied indeveloped countries and also than in many developing countries. Theloan classification and provisioning criteria covered delays in interest orprincipal repayments from three months to over one year, and required acorresponding progression in the amount of provisioning that a bank hadto make (for example, a 100 percent provision was required if the delay inservicing bank debt exceeded one year).
The financial sector and monetary policy 189
Limits on credit concentration, intended to constrain the banks’ expo-sure, were strengthened. Shares or credit to a single customer were not toexceed 30 percent of a commercial bank’s equity. Credit by a bank to asingle customer could not exceed 25 percent of a bank’s paid-up capitaland reserves. A bank’s holding of shares in a single company was limitedto 40 percent of the company’s capital, subject to the condition that thebank’s total holding in companies did not exceed the bank’s own paid-upcapital and reserves.
Various systems are used internationally to monitor the financial con-dition of banks. Perhaps the most widely used system is summarized by theacronym “CAMEL,” which refers to the five components of a bank’s con-dition that are assessed: Capital adequacy, Asset quality, Management,Earnings, and Liquidity. Ratings on a scale of 1 to 5 are assigned for eachcomponent in addition to the overall rating of a bank’s financial con-dition. The highest rating is 1, which shows that the bank presents few, ifany, supervisory concerns; banks with ratings of 3–5 indicate moderate toextreme degrees of supervisory concern. The overall conclusion drawnfrom academic studies is that supervisory information, as summarized byCAMEL ratings, is clearly useful in the monitoring of bank conditions.3 Inthe late 1990s the CBE began to apply the CAMEL rating system, but theprocess has been slow and restricted by a shortage of trained personnel.
Reviews of the banking system by the World Bank in 1993 and jointly bythe IMF and the World Bank in 2002 pointed to an improvement in therange and quality of the announced regulatory measures. However, thereappeared to be some concern about the effectiveness with which the regu-lations were applied. In particular, these agencies expressed doubts ontwo important matters. First, they quoted, with seeming approval, theopinion of market analysts that bad loans at public sector banks weremuch higher than reported. Moreover, they reckoned that the publicsector banks followed a policy of only minimally provisioning againstdelinquent loans, which would increase the vulnerability of these banks inthe event of a deterioration in economic performance or a sudden changein some economic fundamentals, such as the exchange rate. Second, theyquestioned the sufficiency of regulations dealing with “connected expo-sures.” The banking system had still to adopt a clearer definition of “con-nected parties” and of credit exposure to such parties, a limit onconnected exposures, and a system to enable the CBE to monitor com-pliance with the regulations on such exposures. Without these steps, theeffect of the regulations on concentration of credit exposure wouldremain weak.
The conduct of monetary policy
For much of the period 1950–90, the Central Bank of Egypt effectivelyhad no active, independent monetary policy. Zaki (1995) examined the
190 The financial sector and monetary policy

impact of the three main factors – changes in net foreign assets, creditextended to the government, and credit to the private sector – thatimpinged on the monetary base. He found that from 1952–90 the maincontractionary factor on high-powered money was the decline in netforeign assets, while the main expansionary factor was the credit extendedto the central government (including the General Authority SupplyCompany). Both these factors were essentially outside the control of theCentral Bank – the first resulted from variations in the external position ofthe economy, the second from the need to finance the government’s cashdeficit. A second expansionary factor was the credit to the private sector;this was the source of the monetary base over which the Central Bank hadthe most control. However, the absolute changes in the first two sourceswere so large that attempts to offset them by changing the amounts ofcredit extended to the private sector would have resulted in unacceptablylarge fluctuations in credit availability to the private sector and hence inthat sector’s output. In reality, therefore, the Central Bank had verylimited control over the monetary base and the money supply.
Until the 1990s, many of the weaknesses in monetary policy arosebecause of the very limited range of monetary instruments available to theCBE. Banking system liquidity was not regulated by purchases and sales ofgovernment securities or by changes in reserve requirements. New issuesof government securities usually carried low interest rates and banks,when they purchased them, usually discounted them with the CentralBank almost immediately. Thus, no secondary market or open marketoperations developed. The commercial banks’ reserve requirementsremained for long periods unchanged at 25 percent for Egyptian pounddeposits and at 15 percent for foreign currency deposits.
During the 1980s, the traditional monetary policy instruments were aloan-to-deposit ratio and partial credit ceilings for commercial banks.Such techniques had the disadvantage of ignoring market signals. More-over, a shortcoming of the ratio was that it did not cover credit to thegovernment and public authorities. Equally important, however, was thenature of a loan-to-deposit ratio. Such a ratio was similar to a cash reserverequirement, because whatever assets a banks could not hold as loans hadto be held as reserves with the Central Bank (or as foreign assets).4 Anadministered change in the ratio could have had a powerful impactthrough the multiplier effect between the banks’ reserves and theirdeposits; however, an unchanged loan-to-deposit ratio, as was the case inEgypt, is compatible with a wide range of monetary growth rates. In such acase, monetary growth depends largely on the growth of bank reserves.
The loan-to-deposit ratio was not a very precise instrument for eithercontrolling the growth of credit or for setting a predictable maximum tosuch growth. For much of the 1980s the commercial banks did notexpand credit to the level established by the loan-to-deposit ratio, but heldexcess reserves. Several reasons accounted for this. First, the compression
The financial sector and monetary policy 191

of the spread between interest rates on loans and rates on deposits dis-couraged lending. Second, the difficulties experienced by private businessin the 1980s in servicing bank loans created a degree of caution, particu-larly among the public sector commercial banks, in lending to the privatesector. Third, shortages of foreign exchange during this decade led todelays or cancellations of projects, thereby reducing demand for credit inEgyptian pounds to finance the domestic component of these projects.On occasion, however, the actual credit extended grew faster than theceiling. This occurred because if in certain periods the actual creditextended grew more slowly than the growth of the ceiling, it created acushion that enabled a higher expansion of credit in subsequent periods;for example, the actual credit outstanding that was subject to the ceilinggrew by 24 percent in 1985 while the ceiling itself grew by only 17 percent.This illustrates the weaknesses of the loan-to-deposit ratio as an instru-ment of monetary policy.
After 1990 monetary policy began to lose much of its passivity, with theCentral Bank taking a more active role and adding to its arsenal of mone-tary weapons. Weekly Treasury bill auctions were instituted in January 1991,and the Treasury bill rate was regarded as the critical element in the newinterest rate structure and the conduct of monetary policy. Direct creditceilings on the private sector and private sector companies were eliminated,and the CBE began relying mainly on an indirect monetary policy instru-ment (the redemption and sales of Treasury bills) by which to regulatebanks’ reserves, and thereby credit expansion. Changes were introduced inthe reserve requirements policy, in liquidity asset ratios, in exposure regula-tions, and in capital adequacy. The most favored instrument of monetarypolicy, by far, was repurchase operations using Treasury bills.5
Repurchase operations (repos) were introduced in 1993 and involvedthe sale of Treasury bills to the Central Bank with an agreement to repur-chase. The purchase of the bills enabled the Central Bank to inject liquid-ity into the system; however, its capacity to absorb liquidity was morelimited. In practice, the CBE relied on the short maturity of the repos toreduce liquidity by simply letting the outstanding repos mature. By theend of 2000, the Central Bank had still not introduced reverse repurchaseoperations (short-term borrowing from banks, collateralized with Treasurybills), which would provide an instrument for absorbing liquidity moredirectly.6
The quantitative effects of monetary policy in Egypt have been littlestudied. Monetary policy has multiplier effects, but the main problem is toestimate the direct response of investment and consumption expenditureto changes in interest rates. This is not a straightforward multiplierproblem, and the effects are therefore generally estimated from busi-nesses’ responses to questionnaires and by econometric methods. A studyby the World Bank in 1996 obtained responses from businessmen regard-ing the effects on their investment plans of a 1 percent cut in the interest
192 The financial sector and monetary policy

rate. Inserting the results from these responses into an econometricmodel suggested that a 1 percent reduction in interest rates was likely tolead to an increase in the GDP of about 0.35 percent over two years. Thisis not a very strong effect. However, the study in question was on a rathersmall scale, and more work is required before one can be comfortablewith estimates of the relationship between interest rates and investmentand the impact of monetary policy on the growth of Egypt’s GDP.
The role of the Central Bank
In all free-market banking systems a crucial role is played by the moralauthority of the central bank. In order to exercise this authority thecentral bank must demonstrate its independence and its competence. TheCBE was granted an increasing degree of autonomy from the early 1990s.The process reached its apogee in 2003 when a new Central Bank law wasdrafted under which the Central Bank Governor would report to thecountry’s President, and no longer be regarded as simply a satrapy of theMinistry of Finance. The changes in the CBE’s relationship with the MOFhave two broad implications. First, central bank independence does notmean that the institution no longer needs to coordinate its operationswith the fiscal authority. In fact, as numerous studies, for instance Laurensand de la Piedra (1998), have documented, the experience of most coun-tries is that a successful monetary policy based on central bank independ-ence depends critically on the effective coordination of policies betweenthe central bank and the Ministry of Finance.
Coordination is important because fiscal and monetary policies interactin several critical ways. They interact to determine output and interest ratein the short term. Fiscal policy acts directly on aggregate demand, whilemonetary policy affects aggregate demand through the short-term realinterest rate. A second aspect relates to the financing of governmentexpenditure over time. The Egyptian government has financed its budgetdeficit by printing money (seigniorage) and borrowing (issuing T-bills orbonds). The choices have implications for inflation, interest rates, andgovernment finance over time. Fiscal policy determines the size of thepublic debt, but the composition and the cost of debt is decided by mone-tary policy; for example, the financial cost to government of creating thedebt depends to a considerable extent on whether monetary policy isexpansionary or restrictive (e.g. whether interest rates are low or high).
The second major issue in the relationship between the CBE and theMOF concerns the possibility of a conflict between the role of the CBE asthe monetary authority and that as the manager of the government’s debt.Throughout 1960–2000, the Central Bank’s role as the monetary authoritywas subservient to its role as an accessory to the Ministry of Finance. Evenafter the adoption of the ERSAP in the 1990s, the CBE used its authorityto serve fiscal objectives by requiring commercial banks (which in Egypt
The financial sector and monetary policy 193

chiefly meant government-owned banks) to accept government securitiesat less-than-market rates. Handy (2001) furnished an instance from as lateas 2000. Tight money conditions from January 2000 caused interest ratesin the interbank market to escalate to 17 percent; surprisingly, yields onTreasury paper showed no change despite the tight liquidity. The publicsector banks, under the influence of the CBE, showed all the character-istics of a captive market and continued to purchase the bulk of the T-bills. Such intervention insulates the Ministry of Finance from the realitiesof financial stringency, and gives confusing signals as to what monetarypolicy is actually trying to achieve.
This example underlines the point that conflating the debt manage-ment and monetary policy functions of the central bank risks weakeningthe effectiveness of both. The two functions must be kept separate, andthe CBE must not keep interest rates artificially low merely in order toenable the government to finance its budget deficit at the lowest cost.
In addition to requiring coordination with the MOF, the effectivenessof an independent central bank depends on clarity on what constitutes itsmain policy responsibility and how it will implement this policy. Between1990 and 2000, the Central Bank’s monetary policy was to pursue pricestability by targeting M2 growth. The CBE usually aimed for M2 to grow inline with nominal GDP, based on expected developments in the GDP andthe desired level of inflation. Although the operational target was M2, theintermediate target from 1991–2000 (and beyond) was to keep the excessreserves of the banking system as a whole at a fixed percent of domesticdeposits. Initially, the CBE aimed for an excess reserves target of 1 percentof the domestic currency deposit base; in 2000, the target was reduced to0.5 percent.
Since the banking system as a whole can only increase the volume ofloans by the amount of excess reserves multiplied by the money multi-plier, the targeting of excess reserves was designed to provide the CBEwith an instrument with which to control the expansion of lending.During the 1980s and 1990s, the money multiplier (the ratio of the Egypt-ian pound component of private sector liquidity to reserve money) variedbetween 1.17 and 1.89. Although the trend was upward, these values weresignificantly lower than those in Europe, Japan, and the USA. The reasonwas the higher share of currency in the Egyptian money base, whichreduced the reserves available to the banking system. Consequently, themain influence behind the upward trend in the money multiplier was adecline in the currency-to-deposit ratio, while variations about the trendwere largely determined by the ratio of bank reserves to deposits.
A different view of the theory behind the Central Bank’s procedure oftargeting excess reserves is also possible. According to this view, if theBank exactly satisfied the market’s demand for excess reserves, it wouldnot disturb money market interest rates. Moreover, these rates could beadjusted by providing more or less than the demand for excess reserves.
194 The financial sector and monetary policy
In reality, the policy of trying to control inflation by controlling themoney supply, which, in turn, was to be managed through the control ofexcess reserves, was largely ineffective because there was no clear relation-ship linking the CBE’s repo operations to the money supply and inflation.There were three complications. First, there is no evidence that the excessreserves target of 1 or 0.5 percent of domestic deposits was the leveldesired by banks. Second, the targeting of excess reserves appears not tohave worked well in practice. Actual excess reserves each week variedwidely from the presumed target; the IMF even claimed that during the1990s there were periodic stretches of three weeks or more during whichexcess reserves were negative, meaning that the banking system as a wholewas violating the reserve requirement. From the erratic behavior of excessreserves, the IMF inferred the existence of large forecasting errors. Third,the growth of M2 did not show a stable relationship with variations inprices, and consequently even a successful targeting of M2 was likely tohave an unpredictable impact on the price level.
Nonetheless, if in the future exchange rates are to be more flexible(especially following the float of the exchange rate in January 2003), mon-etary policy will have to provide the nominal anchor to inflation expecta-tions. But no clear link has anchored the CBE’s monetary operations tothe money supply and inflation. Moreover, the generally long lags associ-ated with monetary policy mean that policy decisions must be anticipatory– policy measures must be taken in response to projected rather thancurrent inflation. This requires accurate forecasts of inflation. Hence, ifinflationary expectations are to be managed by monetary policy, the CBEwill have to strengthen its liquidity forecasting capabilities, the design anduse of its policy instruments, and will have to support policies that con-tribute to the development of more efficient markets in securities so thatthe transmission of monetary policy can be improved. A good deal of ana-lytical work will be required, because knowledge of the working of mone-tary policy in Egypt is sparse and consequently the uncertainty aboutoutcomes is high.
The experience of monetary targeting in industrialized countries – sur-veyed, for example, in Bernanke et al. (1999), Mishkin (2001a), Loayzaand Soto (2002) – points to a number of serious failures of monetary-targeting policies in controlling inflation. The chief problem arises fromthe unstable relationship between money and nominal income, and there-fore the inability of monetary aggregates to provide a reliable signal aboutthe stance of monetary policy. This led to the abandonment of monetarytargeting in several countries, including the United States, Canada, andthe United Kingdom. Mishkin and Savastano (2000) found evidence ofsimilarly unstable money–inflation relationships in emerging marketcountries. Monetary targeting was somewhat more successful in Germanyand Switzerland, although even in these countries the target was missedon several occasions. Moreover, success depended upon some special
The financial sector and monetary policy 195

features of these countries, such as a sophisticated public and its belief inthe explanations provided by the central bank. And even these countriesabandoned the targeting of monetary aggregates from time to time whenit conflicted with other important objectives, such as the desired behaviorof the exchange rate.
The outcome of the experience gained over two decades was a move byseveral countries (starting with New Zealand in 1990) towards inflationtargeting, rather than monetary targeting. It appears that, with the aban-donment of the exchange rate peg in 2000, inflation targeting maybecome the chief policy objective of the Central Bank of Egypt. The volu-minous literature on the experience with inflation targeting – importantrecent examples are Masson et al. (1997), Svensson (1997, 1999),Bernanke et al. (1999), Mishkin (2000), Mishkin and Schmidt-Hebbel(2001), Loayza and Soto (2002) – emphasizes five key elements:
1 Commitment by the government to price stability as the primary long-term goal of monetary policy. In order to maintain credibility(of sticking to the inflation target) the authorities may have toaccept giving up some discretionary control over policy in other areas.This also means that the central bank will have to forgo targetingother variables, such as the exchange rate, because a multiplicityof targets can give confusing signals on the relative precedence ofeach.
2 Freedom from “fiscal dominance,” i.e. there must be virtually nogovernment borrowing from the central bank, and domestic financialmarkets should have sufficient depth to absorb placements of publicdebt, such as T-bills.
3 Freedom for the central bank in choosing the instruments to achievethe targeted rate of inflation. The central bank enjoys what Svensson(1999) calls “constrained discretion” – the inflation-targeting mechan-ism defines the goals and the responsibilities of the different institu-tions involved, but the central bank is left free to choose whatinstruments to use.
4 Transparency of the monetary strategy through communication withthe public and the markets, including the announcement of a numer-ical target (which may be a range) for inflation, and a clear indicationof where accountability lies. A good model is provided by NewZealand. The primary function of that country’s central bank is toensure price stability, which in 2000 meant restraining underlyinginflation to under 3 percent per annum. This target was set out in aPolicy Target Agreement between the Minister of Finance and thecentral bank governor for the five-year tenure period of the governor,and failure to meet it could put the central bank governor’s job atrisk. Such an explicit and tight inflation target provides both trans-parency and accountability.
196 The financial sector and monetary policy

5 Technical expertise in modeling the behavior of the economy, esti-mating the impact of different variables on inflation, and forecastingthe future course of inflation.
The coordination between the CBE and other elements of the govern-ment more directly responsible for the movements of real variables, suchas the GDP, will also have to be strengthened, because the central bank’sfocus on inflation targeting virtually eliminates its ability to smooth fluctu-ations in real output and employment. A standard example is that of asupply shock that reduces output and raises prices. In such a situation,inflation targeting may lead the central bank to reduce the money supplyat a time when the economy is in recession.
In order to pursue an active monetary policy that successfully targetsinflation, the CBE will also have to review the effectiveness of its instru-ments. Hassan (2003) found that during 1992–2002, the nominal interestrate did not significantly affect real domestic credit going to the privatesector. The bulk of bank credit was extended to large enterprises from bigbanks. Large businesses preferred the use of short-term, continuallyrenewed, debt to raising additional equity, because debt financing did notrisk their own capital or dilute ownership. Big banks preferred it becauseit was easier to obtain information about large businesses than aboutsmall. Both sides could continue their practices because the businesssector was convinced that even under the most dire circumstances thegovernment would not let the banking system fail. An effective monetarypolicy would therefore require a hardening of the budget constraint. Itwould also require the establishment of a more active bond market, toenable the term structure of interest rates to play a more active role andfacilitate the transmission of monetary policy.
The capital market
The Alexandria and Cairo stock exchanges were established in 1883.Corporate financing and stock market activity fluctuated in response tochanging international conditions, especially those affecting the cottontrade that dominated Egypt’s economy. Market activity reached itsheight during the 1950s; in 1955, turnover amounted to LE 115 million,equivalent to 30 percent of the market value of listed securities, withabout 1,000 daily transactions. The nationalization and expropriationmeasures described in earlier chapters drastically changed the structureof the economy, and abruptly abridged the role of the securitiesmarket. However, the stock exchanges were closed only briefly, andthroughout the period of Arab Socialism remained open as private sectorinstitutions.
Before the nationalizations of 1958–61, the Egyptian securities marketprovided between 25–50 percent of new capital raised by the private
The financial sector and monetary policy 197
sector. But the successive waves of Egyptianization, nationalization, seques-tration, and expropriation (described in earlier chapters) radicallychanged the structure of the economy. The number of listed companiesfell from 275 in 1958 to only 55 in 1975. Turnover declined from LE 66.7million in 1958 to about LE 4 million on average between 1963 and 1974.
With the dominance of the public sector in the Egyptian economy, thestate became the leading industrial investor. The state took control ofmost of the resources, financing its investment through the budget, loansfrom the four nationalized commercial banks, external assistance, andfrom nationalized financial institutions (such as the Social InsuranceOrganization and the state pension funds). There was also some publicborrowing, only a small amount of which passed through the securitiesmarket in the form of government development and housing bonds. Thenationalized banking sector, and to some extent the post offices, wereused as the main agents for mobilizing savings. Various changes in tax leg-islation further encouraged savings through banks. The tax system con-tinued to discriminate heavily against corporate securities anddevelopment of the securities market.
The nationalization policy did not extend to small businesses (thosewith less than 50 employees). However, this portion of the private sectorconcentrated on activities that called for only small amounts of capital anddid not require the mobilization of resources on the securities market.Small-scale industries continued to survive during the 1960s and 1970s,but the aggregate share of the private sector in total industrial investmentsteadily dwindled; Ikram (1980: 246–53) estimated that it averaged only 4percent in 1970–74. With the withering away of demand for capital by theprivate sector, the importance of the securities market as a source ofcapital also diminished, falling from 56 percent of net external privatesector capital raised in 1961 to less than 2 percent from that year onwards.The World Bank reported that there was no record of new corporate secu-rities issued during the 1964–74 period, and that stock market capitaliza-tion as a proportion of GDP fell from 12 percent in 1958 to only 1 percentin the 1970s and early 1980s.
The reactivization of the securities market following the infitah policyimproved matters, but for several years did not result in a significantlymore liquid market. Studies by the World Bank attributed this to threemain reasons.
First, the number of large publicly issued companies grew only slowly,from 55 to 155. The economy remained dominated by the public sector,which relied on government-controlled sources of funding. Second,private investors preferred investments that could be owned and managedby an individual or his immediate circle of family and friends. Less than0.1 percent of the companies registered during 1982–90 required a pub-licly recorded capital subscription by more than one person. The amountof equity capital required was also not large – the average capitalization of
198 The financial sector and monetary policy
the more than 1,150 joint-stock companies incorporated in 1982–90 wasonly about one million Egyptian pounds per company. Third, new tax lawsencouraged the formation of “closely held companies” that went in for astock exchange listing not in order to trade, but only to obtain tax bene-fits. About 80 percent of the 418 companies listed in 1980–90 had 15 orless shareholders, and by 1990, in terms of capitalization, closely heldcompanies accounted for 64 percent by value of all listed securities. TheWorld Bank estimated that during the 1980s, only about 20 percent oflisted securities traded in any one year and that in many cases listed shareshad not traded for several years, some as far back as 1959. This resulted ina very narrow base of tradable securities, averaging only 20–30 transac-tions a day.
The tax incentives for corporations to list on the stock exchange wereconsiderable and the conditions for listing not very onerous.7 Companieswith as few as three shareholders were able to apply for stock exchangelisting, pay a small annual listing free, and qualify for substantial taxexemptions. The tax incentives represented a revenue loss to the Treas-ury, but without a corresponding benefit to the economy from the devel-opment of the securities market.
Much the same picture continued until 2001. The total value of equi-ties actually available for trading (the “free-float”) was considerablysmaller than total capitalization. Some careful estimates of the totalmarket value of the free-float at end-2001 put the figure at less than 3percent of GDP. The hundred largest companies by market capitalizationaccounted for almost 75 percent of total equity market capitalization. Butof these, over 60 companies (accounting for about 45 percent of capital-ization) remained almost untraded; in fact, the ten most active companiesrepresented 58 percent of the market’s total value of trading.
Moreover, for many of the listed securities, the trades were artificial.The reason for such artificial trading was that the regulations of theCapital Market Authority (CMA) required the delisting of any firm thathad not been traded for more than six months. However, this regulationcould be evaded by trades by firms’ insiders, a practice that is sometimesdescribed as “cosmetic” trading. The extent of cosmetic trading remainedsubstantial. An IMF study estimated that in 2001 about 40 percent of thefirms were traded normally (i.e. their prices were determined by supplyand demand), while the remaining firms were either not traded or only“cosmetically” traded.
A capital market law was enacted in 1992 (Law 95/1992) to modernize allexisting capital market regulations. This law vested regulatory power in anindependent Capital Market Authority that was charged with enforcing regu-lations, ensuring compliance, and overseeing market performance. The lawprovided full access to foreign investors, and included provisions againstunfair market practices (such as insider trading, price-fixing, and hostiletakeovers). It required publicly-traded companies to abide by international
The financial sector and monetary policy 199
accounting and auditing standards. In order to increase market trans-parency, companies were required to release semi-annual financial state-ments. A summary of stock exchange statistics is shown in Table 7.2.
Until 2000, listing and trading on the stock exchange remained limitedto equities and bonds, both domestic and foreign, as well as shares ofclose-end mutual funds. Securities are listed on the Cairo and AlexandriaStock Exchanges simultaneously and are traded at the same price. Tech-nical improvements have steadily been adopted; for example, the clearingand settlement process has moved from being a manual function to oneperformed electronically.
A picture of the performance of the equity market during the 1990s isprovided by four indicators: market capitalization over GDP, value tradedover GDP, the number of listed companies, and the number of tradedcompanies. Between 1994 and 2000, the nominal capital of listed com-panies increased from 5.1 percent to 20.5 percent of GDP; market capital-ization during the same period increased even more sharply, from 6.5percent to 35.3 percent of GDP. Capitalization in 2000 was dominated bythe financial sector, with a 25 percent share, followed by the cementindustry with 12 percent and the food and beverage industry with 10percent. The value of trading, which was less than 1 percent of GDP in1994, increased to over 15 percent by 2000; the peak value of tradingoccurred in 1998, when it exceeded 29 percent of GDP. The turnoverratio (the value of traded securities relative to market capitalization) alsoincreased sharply from a little over 3 percent in 1992 to nearly 30 percentin 2000. The number of listed companies between 1994 and 2000increased by over 50 percent from 672 to 1,036, while that of traded com-panies jumped from 300 to 545 (an increase of over 80 percent). Foreigninvestors’ participation in the stock market grew briskly. During1997–2000, foreigners’ transactions increased from a little over 30 percentto over 40 percent of the total trading volume of listed securities.
However, these comparisons mask the decline in all market indicators(such as market capitalization, trading volume, securities issues) from1999, because of the slowdown of the economy. Moreover, in terms of therequirements of the economy, the market remained rather small andilliquid. Four reasons, in particular, accounted for the relative lack ofactivity in the market:
1 Most of the listed stocks were simply not intended for sale, but listedon the market merely to gain tax advantages. According to the WorldBank (1993a), trading in the shares of closely-held companies consti-tuted less than 10 percent of total trades in a year. A later studyshowed that in 2001, more than 700 of the over 1,100 companieslisted on the Egyptian Stock Exchange were not actively traded.Huband (1999: 61) reported that the ten most actively traded stocksrepresented an average of nearly 60 percent of trade, while the top 30
200 The financial sector and monetary policy

Tab
le 7
.2Su
mm
ary
stoc
k ex
chan
ge s
tati
stic
s, 1
961–
2001
1961
1975
1980
1985
1990
1995
2001
Lis
ted
com
pan
ies
(num
ber)
261
5561
,31
8,
573
746
1,11
0M
arke
t cap
ital
izat
ion
(L
E m
illio
n)
175
4913
01,
874
5,27
412
7,60
084
,800
Mar
ket t
urn
over
(L
E m
illio
n)
398
11,
63,
342
3,50
016
,600
Tur
nov
er r
atio
(pe
rcen
t)22
.46
16.9
48.
31,
3.36
,6.
482.
7519
.70
Mar
ket c
apit
aliz
atio
n/G
DP
(per
cen
t)11
.99
1.00
0.84
,5.
76,
6.22
60.2
623
.79
Sour
ce: W
orld
Ban
k; C
ASE
.
accounted for 85 percent of the absolute liquidity of the market. Themarket therefore remained shallow and unable to provide easy entryand exit for investors and issuers. It has even been argued that thelisting of such stocks constitutes an obstacle to the long-term growthof the market, because it consumes scarce administrative resourceswithout adding to liquidity.
2 The absence of a well-developed secondary market meant thatinvestors could not easily effect tactical transactions to adjust theirportfolio yields and risks.
3 The absence of market-makers willing to continuously quote buy andsell offers limited the ability of both retail and institutional investorsto buy and sell securities in a timely manner.
4 The nature and scope of services performed by intermediaries waslimited. The capital base of most intermediaries was relatively small,and they were normally unwilling to take positions in which theirlimited capital would be exposed to risk. The lack of an inter-dealersystem among brokers also contributed to the lack of secondarymarket liquidity.
The other major element in the capital market, the bond market,also expanded sharply during the second half of the 1990s, with higherplacements of both government and corporate bonds. Placements ofcorporate bonds on the domestic market increased from LE 30 million in1994 to about LE 4 billion in 2000. Treasury bonds (with maturities offive, seven, and ten years) were first issued in 1995, in order to lengthenthe profile of domestic debt which hitherto had been largely financed byTreasury bills of maturities from three months to one year. This strategywas successful – by the end of the fiscal year 2000, the outstanding bal-ances of Treasury bonds had reached LE 13 billion, the outstanding bal-ances on T-bills having been brought down by almost 30 percent between1994 and 2000.
Even though the markets expanded over time, the equity and bondmarkets developed unevenly. Growth resulted mainly from the sale ofequities of large companies and government bonds; consequently, bothmarkets remained fragmented. In the Egyptian equity market, bothmarket capitalization and trading activity are concentrated in the big com-panies. This might be due, in part, to the restrictions on corporate bondsissues. According to the regulations of the Capital Market Authority, theissuance of corporate bonds required a credit rating of the debt-issuingcompany and guarantees by financial institution of the company’s finan-cial viability. Despite the progress made, the development of Egypt’sequity market lags behind that of several other emerging economies.Market capitalization as a percentage of GDP and the number of listedcompanies is higher in most of the other comparable emerging markets inLatin America, Asia, and Europe.
202 The financial sector and monetary policy

The development of the bond market was considerably helped by theactivity of the public sector. This support was due not only to the volumeof bonds placed in the market. An important advantage derived from thepresence of Treasury issues in the market because it formed a no-risk ref-erence price for a range of maturities, and thereby established a yieldcurve against which other securities could be priced.
Non-bank financial intermediaries
The chief non-bank financial intermediaries in Egypt comprise the socialinsurance and pension funds and the insurance sector. There are otheragents, such as leasing companies, but during the period under studythese remained unimportant. The total assets of the social insurancesystem, private tension funds, and insurance companies rose steadily from1960 and by 2000 amounted to over 42 percent of GDP. Annual inflowsinto the system are large; however, these large net inflows have been offsetby negative real return of nearly 12 percent earned on the system’s assets,particularly in the late 1980s and the early 1990s. This resulted in a reduc-tion in the ratio of accumulated balances to GDP from 38 percent in 1988to 32 percent in 1993. The real rate of return on social insurance balancesimproved thereafter with a reduction in the rate of inflation.
Contractual savings institutions can contribute enormously to the devel-opment of a country’s capital market. The importance of the contributiondepends on the allocation of their assets. Vittas (1998) points to importantdifferences in the investment practices of these in different countries. Inthe United Kingdom, real assets and equities occupy the preponderantshare in the portfolios of pension funds. In continental Europe, pensionfunds and life-insurance companies placed the largest part of their assetsin government, corporate and mortgage bonds, and in long-term loans.However, most investments by Egyptian funds in government securitieswere not market-determined, but were mandatory. The funds of the socialsecurity system were mainly deposited with the National Investment Bank(NIB), which invested them in development projects. But the NIB cred-ited the social security system funds with an overall rate of return that formuch of the 1980s and the early years of the 1990s was negative in realterms. From 1992, the NIB started to pay a rate of 13 percent on socialsecurity funds. This was higher than the prevailing inflation rate, but therevised interest rate applied only to incremental amounts, i.e. new fundsplus reinvested balances. Vittas (1998: 18) calculated the weighted interestrate on all funds at about 8 percent in 1996, still somewhat below the rateof inflation.
Since the public funds deposited the bulk of their resources withthe NIB, only a small portion of these funds reached the privatesector Hence, the Egyptian banking system and the corporate sectordid not benefit much from the development of the contractual savings
The financial sector and monetary policy 203

institutions. Moreover, the economy was not able to profit from a length-ening maturity of corporate debt, as occurs in other countries, againbecause Egyptian contractual savings institutions invest only a small shareof their portfolio in long-term deposits in commercial banks. The patternof investment followed by the contractual savings institutions also meantthat they did not contribute much to the development of the capitalmarket.
The social insurance funds
The Social Insurance System is by far the most important component ofEgypt’s non-bank financial intermediaries sector. Egypt possesses anextensive social insurance system for a developing country. The mostimportant social insurance programs are those providing benefits to civilservants and to wage and salary workers in the formal sector. The SocialInsurance System comprises two main bodies. The first is the GeneralAuthority for Social Insurance (GASI), which administers pensions forworkers in public and private enterprises, employers and certain self-employed workers, Egyptians working abroad, agricultural laborers, anddomestic staff. The second is the National Organization for Insurance andPensions (NOIP), which administers pensions and indemnities foremployees of the state.
During the four decades from 1960, the social insurance system gener-ated large annual operating surpluses. These resulted mainly from thehigh insurance contributions levied on workers. Employees of the stateand of public and private enterprises, together with their employers, paytaxes for social insurance amounting to 35–40 percent of covered wages.Workers themselves pay about one-third of social insurance contributions,with the employers making up the balance. Self-employed workers arerequired to make social insurance contributions equal to 15 percent oftheir self-reported income.
A major difficulty encountered by the social insurance programs wasthe investment of their surpluses. If the surplus of contributions overbenefits and administrative payments had been invested in projectsearning a market rate of return, the social insurance programs would haveearned enormous additional income from interest on its capital reserve.However, with the creation of the National Investment Bank (NIB) in1980, the social insurance programs were required to invest the reservewith this Bank, which offered a very low rate of interest. Indeed, forextended periods the interest was negative in real terms. Throughout the1980s, for example, the GASI received an interest averaging only a littleover 5 percent per annum during a period in which the inflation rate wasnearly 18 percent a year.
Inflation thus substantially eroded the real yield on the investmentsand the reserve of the social insurance programs. The World Bank (1993a,
204 The financial sector and monetary policy
vol. 2: 105–6) calculated that if GASI reserves had earned even a zero realreturn on its trust fund rather than a negative real return, the asset hold-ings in the reserve would have been worth more than twice as much at theend of 1991 than its actual amount. Even if the GASI had received notransfer from the Treasury during the 1980s, the reserve would still haveheld nearly 50 percent more assets at the end of 1991. Clearly, therefore,during this period the social insurance funds provided a substantial netsubsidy to the NIB and the state.
The World Bank (1993a, vol. 2: 106) pointed out two further issuesraised by the low interest rate paid on the social insurance system funds.First, there was no guarantee that the heavily subsidized loans from theNIB were optimally allocated, because projects financed through suchloans did not have to meet the economic test of showing that theirexpected rate of real return was at least equal to the social opportunitycost of capital. Second, the low rate obliged the social insurance authori-ties to impose high tax rates on covered workers. Since the Egyptian socialinsurance program is nominally a capitalized system, the contributionrates necessarily had to be high if the expected rate of return on assets waslow. Moreover, this method of obtaining resources for the NIB raises ques-tions of equity because the tax for social insurance workers was assessedonly on labor earnings below LE 625 per month. Labor earnings in excessof that amount, as well as all earnings from capital, were exempt fromsocial insurance taxes.
The NOIP program also received a very low rate of interest. During the1980s the real interest on NOIP reserves remained negative. For severalyears the civil servants’ insurance and pension fund had net operatingdeficits rather than a surplus. However, the fund remained in overallsurplus because the operating deficit was more than offset by the consider-able amount of income from interest (owing to the large size of the fund)and substantial transfers from the Treasury.
The National Investment Bank
The National Investment Bank (NIB) was set up in 1980 in order to usethe resources of the social insurance system to finance development pro-jects. Over most of the period 1980–2000, these funds amounted to about70 percent of the NIB’s assets. The NIB also receives postal savingsdeposits from the Post Office, and raises additional funds through invest-ment certificates and various other sources. On paper, the NIB is thelargest financial institution in Egypt, with a balance sheet that in mostyears was almost 50 percent larger than that of the largest commercialbank – at end-June 2000, the NIB’s assets were equivalent to 55 percent ofthe combined assets of Egypt’s commercial and investment banks.
However, the actual functions of the NIB had little to do with banking –a World Bank report (1993a, vol. 2: 116) described it as “effectively, an
The financial sector and monetary policy 205

accounting agency responsible for disbursing funds for the implementa-tion of the Government’s investment program.” In addition to disbursingfunds to various public sector entities for development projects, the NIB isresponsible for monitoring the progress of such projects. However, on thebasis of the NIB’s very low overhead costs, the same World Bank reportdoubted that it could play more than a very limited role in assessing thecreditworthiness and economic rationale of projects. The report alsopointed to the limited financial intermediation role of the NIB, judgingfrom its very low level of capital, reserves, and provisions, which amountedto less than 1.4 percent of total assets in 1990.
The NIB’s impact on the functioning of the financial system came fromthe large amount of resources it mobilized from the social insurancesystem and the highly negative rates of return it paid on social insurancereserves. This was particularly the case during the 1980s. From 1992 theNIB began to pay the social security system a substantially higher nominalrate of 13 percent on incremental funds. This was a marked improvement,but according to Vittas (1998: 18) the overall rate was still slightly negativein real terms even as late as 1996. However, with continually decreasinginflation, the real interest rate turned positive.
Lending rates were also negative in real terms for many years. Theinterest rate on its long-term loans was set at 9 percent until 1989, when itwas increased by a half percentage point; this compared with long-termrates to industry from commercial banks of 15–17 percent per annumduring the same period.8 From 1998 the NIB lent funds to the govern-ment at a fixed rate of 12 percent with a maturity of 15 years. This rate wasabove what the government paid on market borrowings in 2000. A reportby the IMF and the World Bank described this arrangement as “doublyunfortunate,” because it added to the budgetary cost of the pensionscheme in a non-transparent manner and also missed an opportunity fordeveloping the capital market through the investment of the social secur-ity surpluses.
Insurance
The first insurance company to be established in Egypt was set up in 1900.By the time of the 1952 revolution, over 100 companies operated in theEgyptian market. In 1957 the insurance industry was Egyptianized, and in1961 it was nationalized. It was not until the infitah policy that foreigninsurance companies were permitted to enter the market, initially in jointventures, but from 1998 they were permitted to own 100 percent of Egypt-ian insurance companies.
Nationalization of the industry in 1961 was followed by a wave ofmergers which left the sector dominated by three state-owned companies.The entry of the joint venture companies after 1974 did not change thisdominance – in 2000, the three public sector companies commanded a 75
206 The financial sector and monetary policy

percent share of the market, leaving the joint venture companies with amarket share of 25 percent.
The insurance sector represents another potentially importantnonbank financial intermediary because it has the capacity to accumulatereserves and other funds to meet its obligations from claims in the future.However, even by 2001 the insurance industry collected less than 1percent of GDP in premiums, and the total investments of the industryamounted to only 3 percent of GDP. As such, the importance of the insur-ance sector in the financial system fell far short of its potential.
The sector can be divided into general (or nonlife insurance) and lifeinsurance. Each of these makes a different contribution to the develop-ment of the financial sector.
General insurance provides coverage for relatively short periods,usually of not more than one year. Because of the short-term nature oftheir policies, general insurance companies tend to make little contribu-tion to the country’s long-term financial savings. The importance of thesecompanies to the financial sector comes from the support that theyprovide to money markets. Life insurance, on the other hand, covers risksthat generally extend over a long period. Such companies have to matchthese risks with long-term reserves, collected both from premia and fromreinvestment of profits. Thus life-insurance companies are more likely tocontribute to the development of markets in long-term bonds (govern-ment, corporate, and mortgage).
The Egyptian insurance market is very underdeveloped. Total assets forall insurance companies in 2001 amounted to less than 5 percent of GDP,while total direct insurance premiums were less than 1 percent of GDP.These were considerably short of the insurance sector’s potential. Huband(1999: 83) reports estimates by the Insurance Federation of Egypt that themarket in fire insurance was 5 percent of what it should be, that less than1 percent of the population was insured against accident liability, and thatonly 7 percent of cars were insured.
The insurance industry is underdeveloped because of both supply anddemand factors. The generally low levels of income and wealth inhibitedthe growth of demand. On the other hand, the regulatory framework wasbiased towards the public sector, and restrained supply by impeding theentry of private firms. The tax treatment of insurance also held back thedevelopment of the sector. Premiums paid to insurance companies werequite heavily taxed, in contrast to deposits in banks (which were nottaxed) or with the purchase of an offshore life-insurance contract. Someobservers pointed out that the use of foreign markets by some, generallypersons of means, could create a problem of adverse selection for thedomestic industry, which might be left covering the high-risk people.
The pattern of investment by insurance companies was not conduciveto building up reserves through earning high returns on assets. Hubandshowed that in 1997 roughly 45 percent of the total amount invested was
The financial sector and monetary policy 207
in fixed deposits, about 20 percent in government bonds, 29 percent insecurities, somewhat over 5 percent in real estate, and the remainingamount in miscellaneous small items. He also highlighted the differentinvestment strategies adopted by the public and private sector companies.The public sector companies continued to invest in shares even duringthe stock market downturn in 1998 when the Egyptian Stock Exchangelost 34 percent of its value. It would appear that they saw themselves asperforming a national investment function rather than acting simply as aninsurance company; this is analogous to the behavior of public sectorbanks discussed earlier in this chapter. The private sector companies, onthe other hand, stopped buying shares altogether, although prior to 1998they had been investing in a wide range of companies on the stockexchange. Clearly, the private sector companies were driven by a profitmotive whereas the public sector companies were not.
Enterprise finance
The available data on finance for Egyptian enterprises show that thelarger Egyptian firms (those listed on the securities market) on averageare not highly leveraged by international standards. It is not clear whetherfor large firms the low leveraging occurs because they do not wish toborrow larger amounts, or whether the financial system does not permitthem access to larger amounts. However, there is considerable evidencethat smaller firms have difficulty in accessing bank credit. Accordingto estimates by the Ministry of Economy and Foreign Trade (2001), in2000 only about 10 percent of micro and SMEs’ financing needs weresatisfied.9
A study by the IMF/World Bank estimated that the ratio of current lia-bilities to total liabilities for the larger Egyptian firms was much higherthan that in other countries in the sample. The study found that in 1999the median firm in Egypt had almost no long-term debt (i.e. maturityexceeding one year), which in turn prompted the suggestion that thefirms were constrained in their access to long-term debt. The reportpointed out that over-reliance on short-term liabilities could be potentiallydangerous for the corporate sector, because it exposed enterprises to asudden shortage of financing if creditors refused to roll over the debt.
Leverage in Egypt was lower than in most other countries in thesample. For Egyptian firms the ratio of total liabilities to total assets had amedian of 0.51, while the median for the other countries studied was 0.57.Moreover, the interest coverage ratio (earnings before interest and taxesdivided by the interest payments) was much higher than the median inthe other countries. Taken together, these two findings suggested thatEgyptian firms found it difficult to raise debt finance.
The study also compared the ratio of market value of assets to theirbook value (Tobin’s Q-ratios) for firms in Egypt with those in other coun-
208 The financial sector and monetary policy

tries. It found that market valuations of firms in Egypt were a much lowermultiple of book value than the median for the other countries examined.
A distinct pattern emerged between the outcomes by size of firm. Prof-itability and retained earnings declined significantly for smaller firms ascompared with the larger. Leverage patterns also differed by size. Smallerfirms reported significantly lower ratios of debt to equity and of total lia-bilities to total assets, implying that they may have experienced relativelymore problems in accessing debt finance. Smaller- and medium-sizedfirms also relied significantly less on long-term finance. Paid-in capital as ashare of total assets was much larger for smaller firms and was increasingover time. The data suggested that most of the financing for smaller firmscame from their owners, which was another indication of the firms’limited access to external finance. From all these findings, it appearedthat long-term debt was readily accessible by only a few large firms. More-over, because the ratios discussed here had remained stable over time,these problems in differential access to financing seemed to be a struc-tural matter.
The foregoing studies were based on the records of firms quoted onthe securities market. The same details are not available for the micro andSMEs (M/SMEs). However, the data that are available suggest that thefinancing problems of micro and SMEs are even more acute than those ofthe smaller quoted firms. Micro and SMEs are virtually shut out fromaccess to bank credit. Although M/SMEs accounted for more than 95percent of all enterprises and over 75 percent of employment, theyreceived only about 5 percent of bank credit in 2000. The maturity struc-ture of bank lending to M/SMEs was also shorter than that of creditextended to larger firms. The main reasons given by financial sources forthe reluctance to lend to SMEs was the lack of information about the bor-rowing firms, and the difficulties of taking possession of collateral in caseof a default.
The financial sector and monetary policy 209

8 Labor force and employment*
In a modern economy, employment is the most important means ofearning income; questions relating to the labor force and employmentthus constitute perhaps the most important issues facing policymakers.Unfortunately, the study of unemployment in Egypt is freighted withproblems arising from inconsistencies of definition, coverage, measure-ment, and interpretation, both within and between the different dataseries.1
Data on labor in Egypt derive from two principal sources: the Popu-lation Census (PC) and the Labor Force Sample Survey (LFSS). Both ref-erences suffer from shortcomings in design and methodology thatpreclude strict comparability between the two sources, as well as within thesame source over time. A third source that can be used for particularperiods is the data produced by scholars – especially Samir Radwan, NaderFergany, and Ragui Assaad – who have adjusted the first two sources invarious ways in an attempt to obtain a greater degree of coherence.
The discordance between and within the data sources means that it isnot possible to rely uniquely on any of them as a definitive basis for long-term analysis; one is compelled to move between different data sets. Thisexplains Fergany’s (1995) remark that monitoring changes in unemploy-ment in Egypt bordered on detective work, and also why analyses of theEgyptian labor market are messier and more equivocal than one wouldlike. Table 8.1 provides an example of the inconsistencies and of the diffi-culty created for meaningful trend analysis. The table highlights threepoints:
1 According to the PC, the unemployment rate fell from 11.1 percent in1986 to 8.2 percent in 1996.
2 According to the unadjusted LFSS data, the labor force appears to be“shrinking” between 1988 and 1995 (despite a growing population),but the unemployment rate rose from 7.1 percent in 1988 to 10.2percent in 1995.
3 According to the adjusted LFSS, the unemployment rate increasedfrom 7.5 percent in 1988 to 13.5 percent in 1993.

Tab
le 8
.1L
abor
forc
e gr
owth
, em
ploy
men
t, an
d un
empl
oym
ent,
1986
–96
aT
he
popu
lati
on c
ensu
s
1986
1996
Gro
wth
rat
e 19
86–9
6 (%
)
Tot
alU
rban
Rur
alT
otal
Urb
anR
ural
Tot
alU
rban
Rur
al
TM
FT
MF
TM
FT
MF
TM
FT
MF
Popu
lati
on (
mn
)48
.321
.210
.910
.327
.013
.813
.259
.325
.312
.912
.334
.019
.416
.62.
11.
81.
71.
82.
32.
32.
3L
abor
forc
e (m
n)1
12.9
6.3
5.2
1.1
6.6
6.3
0.4
17.2
7.9
6.4
1.6
9.3
8.2
1.0
2.9
2.3
1.9
3.9
3.4
2.8
10.5
Part
icip
atio
n r
ate
(%)
26.8
29.7
47.9
10.4
24.5
45.4
2.7
29.1
31.5
49.1
12.9
27.3
47.4
6.2
––
––
––
–E
mpl
oym
ent (
mn
)12
.25.
74.
90.
86.
56.
20.
315
.87.
35.
91.
48.
57.
70.
82.
52.
41.
94.
82.
62.
19.
8U
nem
ploy
ed (
mn
)2.
021.
00.
60.
51.
00.
60.
41.
5n
.a.
n.a
.n
.a.
n.a
.n
.a.
n.a
.�
2.7
––
––
––
Un
empl
oym
ent r
ate
(%)
14.7
315
.810
.934
.813
.79.
350
.48.
2n
.a.
n.a
.n
.a.
n.a
.n
.a.
n.a
.–
––
––
––
Un
empl
. rat
e (1
2–64
) (%
)11
.14
12.6
10.6
22.6
9.6
8.3
32.9
––
––
––
––
––
––
––
bT
he
labo
ur fo
rce
sam
ple
surv
ey (
LFS
S) –
un
adju
sted
Oct
198
8M
ay 1
995
Gro
wth
rat
e 19
88–9
5 (%
)
Tot
alU
rban
Rur
alT
otal
Urb
anR
ural
Tot
alU
rban
Rur
al
TM
FT
MF
TM
FT
MF
TM
FT
MF
Popu
lati
on (
mn
)550
.922
.411
.510
.928
.514
.613
.959
.325
.312
.912
.334
.019
.416
.61.
91.
51.
5�1.
62.
22.
22.
2L
abor
forc
e (m
n)
18.6
7.2
5.2
2.0
11.4
6.7
4.8
17.5
7.6
5.9
1.7
9.8
7.6
2.3
�0.
820.
71.
8�2.
7�
1.9
1.6
�9.
2Pa
rtic
ipat
ion
rat
e (%
)36
.632
.345
.018
.840
.045
.834
.029
.430
.246
.213
.428
.943
.513
.7–
––
––
––
Em
ploy
men
t (m
n)
17.3
6.4
4.8
1.6
10.9
6.4
4.5
15.7
6.8
5.5
1.2
8.9
7.1
1.8
�1.
20.
71.
9�3.
6�
2.5
1.2
�11
.1U
nem
ploy
ed (
mn
)1.
30.
80.
40.
40.
50.
20.
31.
80.
90.
40.
40.
90.
50.
43.
80.
50.
6�0.
57.
99.
36.
5U
nem
ploy
men
t rat
e (%
)7.
111
.68.
120
.54.
23.
45.
310
.211
.47.
326
.49.
26.
418
.6–
––
––
––
cont
inue
d
cT
he
labo
ur fo
rce
sam
ple
surv
ey (
LFS
S) –
adj
uste
d6
Oct
198
8M
ay 1
993
Gro
wth
rat
e 19
88–9
3 (%
)
Tot
alU
rban
Rur
alT
otal
Urb
anR
ural
Tot
alU
rban
Rur
al
TM
FT
MF
TM
FT
MF
TM
FT
MF
Popu
lati
on (
mn
)750
.922
.411
.510
.928
.514
.613
.956
.724
.212
.411
.832
.516
.615
.92.
21.
61.
51.
62.
62.
72.
6L
abor
forc
e (m
n)
17.7
7.1
5.2
1.9
10.6
6.7
3.9
21.2
8.5
6.4
2.1
12.7
8.2
4.5
3.7
3.6
4.1
2.3
3.7
4.2
2.8
Part
icip
atio
n r
ate
(%)
34.7
31.7
45.0
17.6
37.1
45.8
27.9
37.4
35.2
51.3
18.2
39.1
49.5
28.2
––
––
––
–E
mpl
oym
ent (
mn
)16
.36.
34.
81.
510
.16.
43.
718
.37.
25.
71.
511
.17.
63.
62.
32.
93.
70.
041.
93.
2�
0.6
Un
empl
oyed
(m
n)
1.3
0.8
0.4
0.4
0.5
0.2
0.3
2.9
1.3
0.6
0.6
1.6
0.7
0.9
15.6
8.4
7.9
8.7
24.1
21.4
26.3
Un
empl
oym
ent r
ate
(%)
7.5
11.8
8.1
21.9
4.5
3.4
6.4
13.5
14.9
9.8
30.2
12.6
8.1
20.8
––
––
––
–
Sour
ce: P
C fr
om C
APM
AS,
Sta
tist
ical
Yea
rboo
k 19
97 a
nd
1999
; LFS
S (r
epor
ted
and
adju
sted
) fr
om F
erga
ny
1995
an
d 19
96a.
Not
esFi
gure
s m
ay n
ot a
dd u
p du
e to
rou
ndi
ng.
1L
abor
forc
e fo
r 19
86 d
efin
ed fo
r po
pula
tion
6�
, 199
6 fo
r po
pula
tion
15�
.2
Inte
rnal
con
sist
ency
of t
he
tabl
e ba
sed
on th
e PC
for
1986
impl
ies
a to
tal n
umbe
r of
un
empl
oyed
of 0
.7 m
illio
n, e
quiv
alen
t to
an u
nem
ploy
men
t rat
e of
5.4
perc
ent
only
. T
his
rat
e is
sub
stan
tial
ly l
ower
th
an t
he
figu
res
repo
rted
by
oth
er s
tudi
es.
We
ther
efor
e re
ly o
n u
nem
ploy
men
t ra
tes
repo
rted
by
Ferg
any
(199
1) a
nd
Ass
aad
(199
7).
3So
urce
: Fer
gan
y (1
991)
, bas
ed o
n p
relim
inar
y C
ensu
s re
sult
s.4
Sour
ce: A
ssaa
d (1
997)
, bas
ed o
n fi
nal
Cen
sus
resu
lts
for
popu
lati
on (
12–6
2).
5T
otal
pop
ulat
ion
figu
re f
or 1
988
as r
epor
ted
in A
ssaa
d (1
999)
; urb
an/r
ural
an
d m
ale/
fem
ale
dist
ribu
tion
for
198
8 ba
sed
on p
ropo
rtio
ns
in P
C 1
986;
popu
lati
on fi
gure
s fo
r 19
95 a
re th
ose
of P
C 1
996.
6A
djus
tmen
ts in
Fer
gan
y (1
995)
bas
ed o
n p
aram
eter
s an
chor
ed in
th
e O
ctob
er 1
988
LFS
S ro
und,
rel
atin
g to
fem
ale
empl
oym
ent
in u
npa
id h
ouse
hol
dac
tivi
ties
(ex
clud
ing
enga
gem
ents
of l
ess
than
15
hou
rs p
er w
eek)
an
d to
un
empl
oym
ent,
by fa
ctor
ing
in d
isco
urag
ed u
nem
ploy
men
t.7
Tot
al p
opul
atio
n i
n 1
993
esti
mat
ed a
ssum
ing
con
stan
t 19
91–9
2 po
pula
tion
gro
wth
rat
e; u
rban
/rur
al a
nd
mal
e/fe
mal
e di
stri
buti
on b
ased
on
pro
por-
tion
s in
PC
198
6 fo
r 19
88 a
nd
PC 1
996
for
1993
.

Reconciliation of different data sources suggests that the labor force grewfaster than the population did between 1986 and 1996. Depending on thesource, employment either shrank or grew at a much slower rate than thatof the labor force, with a resulting increase in overall unemploymentrates. Fergany (1999) estimated open unemployment at 12–15 percent inthe mid-1990s, or at 2.0–2.5 million persons. Using an “extended” defini-tion of the labor force, which included the large number of womenengaged in subsistence activities, Assaad (2000) put open unemploymentin 1998 at 7.9 percent, or 1.72 million persons. The decline in the unem-ployment rate for 1996 reported by the PC is unlikely in view of the rela-tive stagnation of the economy during the first half of the 1990s.
Geographic and gender patterns are changing – unemployment isincreasingly being ruralized and feminized. Open unemployment in Egyptis concentrated among educated youth in their early twenties, first-timejob seekers, and graduates of intermediate (secondary and vocational)and university education – a pattern that has been emerging since 1976.And while young graduates constitute the bulk of open unemployment,unskilled and less educated individuals suffer from visible underemploy-ment (willingness to work more hours than they already do) and invisibleunderemployment (apparently fully employed but at low levels of produc-tivity and real wages). Visible underemployment is essentially a rural phe-nomenon of agricultural and casual workers, and its implications onpoverty levels are a cause for concern. Studies on poverty – such as El-Leithy et al. (1999), UNDP (1996) – find a strong link between casualemployment of unskilled laborers and poverty.
A number of economic and institutional factors combined to producethe observed patterns of unemployment and labor market rigidities inEgypt. This chapter starts by providing an analysis of the political economyunderlying the evolution of the labor market between 1960 and 2000. Theanalysis points to two factors: (1) growth over the period was labor-sparseas a result of the bias towards capital-intensity of the import substitutionstrategies pursued during the late 1970s and early 1980s; and (2) becauseof its dominant size in the market, government employment policies, interms of wage setting and stringent labor regulations, acted as a bench-mark that overburdened the private sector and curtailed its ability to gen-erate employment. The chapter then discusses the evolution of the laborforce by looking at population and participation growth, followed by ananalysis of unemployment trends and patterns of employment growth.The impact of the government’s employment guaranteed program is alsodiscussed, and is shown to have segmented the labor market: the govern-ment, as a dominant player, influenced the reservation wage for both thepublic and private sectors. Some concluding remarks follow.
Labor force and employment 213

Economic growth and employment in Egypt
An historical framework for examining the unemployment problem inEgypt over the past four decades was proposed by Radwan (1997). Heregards developments in terms of three sub-periods: (1) the 1960s, the“labor surplus economy”; (2) 1975–85, the decade of “jobless growth”; and(3) 1985–95, which might be extended to 2000, as a largely “slow growth,high unemployment” era. Employment performance is explained in termsof three determinants: the rate of growth of GDP, the management oflabor demand, and the extent of labor market flexibility or regulation.
The 1960s
The period of the “labor surplus economy” coincided with the nationaliza-tion drive and sizeable state-led import-substituting investments, especiallyin manufacturing, which produced an upsurge in the demand for labor.The economy grew at an average of 5–6 percent per year, and was able togenerate the employment opportunities required by the government’semployment guarantee program (EGP) for graduates, especially in urbanareas. Radwan (1997) points out that through the EGP the state was ableto pursue a “full employment” policy while maintaining a low-wage infla-tion system. Large labor shifts from agriculture into the booming con-struction sector in both urban and rural areas resulted in rural-to-urbanmigration and partially compensated for the slowdown of job creation inagriculture during 1960–76. There was not much demographic pressureon the employment generating capacities of the economy, as populationand the labor force grew at roughly the same rate during that period.Assaad et al. (1999) judge unemployment to be negligible, standing atabout 2 percent of the labor force, and concentrated mainly among illiter-ate workers. However, the government employment drive became unsus-tainable once the capacity of the state to finance investments was reducedas a result of the 1967 war and its political aftermath, which constrainedthe inflow of foreign exchange.
1975–85
The decade of “jobless growth” coincided with the launching of the infitahpolicy and massive inflows of external resources that boosted economicgrowth to an average of over 8 percent per year. Growth, however,occurred to a large extent in the non-tradable sectors, namely construc-tion and financial services, which did not generate sufficient demand forlabor (together they accounted for less than 30 percent of employmentgrowth between 1976 and 1986). And while migration provided a partialrelief to some 10–15 percent of the labor force, the market became tight,as shortages of particular skills co-existed with rising rates of open unem-
214 Labor force and employment
ployment. The pattern of sectoral growth and employment performancethat emerged during and after the economic boom was largely shaped bygovernment policies regarding two issues:
1 Management of the massive inflow of external revenues
A large portion of these revenues accrued to the government. This led toa surge in government spending that paid little attention to the employ-ment component of the investments. Handoussa (1991a) estimates thatexternal revenues as a share of total government revenue increased fromless than 5 percent in 1975 to over 30 percent by 1982, and consisted pri-marily of Suez Canal revenues, oil exports, workers’ remittances, and rev-enues from tourism. This was associated with a rise in governmentexpenditures as a proportion of GDP from 49 percent to nearly 64percent between 1975 and 1982, exceeding its revenues, which only rosefrom 29 percent to 42 percent over the same period. Gross domesticinvestment increased at an average of 12 percent per year.
Underlying this growth was an increasing bias towards capital andmachinery. This was especially evident in the manufacturing sector – thesector responsible for the highest proportion of total employment growth(25 percent) during the preceding period. Resource inflows led to risingprices, to an appreciation of the real exchange rate by almost 50 percent,and to negative real interest rates. These two factors lowered the relativeprice of capital and industrial imports and thus encouraged capital intens-ity of industrial production, which restricted the creation of employmentin the public enterprise sector. Productivity increased in the manufactur-ing sector, but this improvement resulted from greater mechanization inboth the public and private sectors, raising the capital:labor ratio by anaverage of 10 percent per year during 1970–81. The rising trend of mech-anization was also attributed to the rise in wages, because of the emigra-tion that took place in the mid-1970s, and to the growing scarcity ofskilled technicians and industrial specialists, coupled with wage rigidities:Handoussa (1991b). The public enterprise sector also generated loweremployment, partly because it was permitted greater flexibility in hiringafter 1978 by being freed from the scope of the EGP. Manufacturing pro-vided only 8 percent of employment growth between 1976 and 1986.
2 Government employment policies
With increased resources at its disposal, the government employmentprogram gained further impetus. Employment in the civil service (i.e.government excluding public sector enterprises) grew faster than in anyother sector in the economy, accounting for over 20 percent of employ-ment in 1986. Assaad (1995) argues that the emergence of the state as theprimary employer in the economy had two mutually reinforcing effects.
Labor force and employment 215

First, it segmented the labor market along educational and gender lines;second, it strongly influenced the level of wages throughout the economy.By 1986 the government sector was responsible for the employment ofalmost 75 percent of all graduates and 60 percent of females. The size ofthe sector ensured that the level of government wages would significantlyaffect wages offered by the private sector, in that the (non-market-related)floor for the pay of graduates in government raised the relative cost ofgraduate labor to other sectors of the economy by setting a minimumexpected level. This reduced the employability of graduates in the privatesector.
The fall in oil prices in 1982 marked the end of the economic boom inEgypt. GDP growth and investment slowed, and the government’s abilityto finance its employment program became severely constrained. Thewaiting period for appointment under the EGP steadily lengthened, withgraduates having to queue for several years before receiving an appoint-ment. The queuing continued because of the high premium that gradu-ates attached to the job security provided in the government, and becausetaking any employment in the private sector resulted in the removal of agraduate’s name from the Ministry of Manpower’s appointment lists. Thelonger wait and the reluctance to accept a private sector job increased themeasured rate of unemployment among graduates.
Other government policies also slowed employment growth. Stringentlabor codes and protection policies instituted in the government sectorfrom the mid-1960s and extended to the private sector from 1981 raisedthe cost of hiring for private employers. The latter sought to circumventthe legal requirements by offering unprotected employment (without acontract) that deprived workers of any form of insurance or benefits. Therelatively generous benefits to females mandated by the labor law furtherdiscouraged private employers from hiring women, especially young edu-cated women, thus exacerbating unemployment among this group in thelabor force.
The higher resource inflows supported growth in the non-tradablesectors of the economy: construction and services. The booming construc-tion sector absorbed labor shed by agriculture, whose share in employ-ment decreased throughout the 1980s. Once the construction boomsubsided, migration to Arab countries took over, absorbing about 10–15percent of the labor force. In the early 1980s, this led to labor shortages inagriculture and construction (and an attendant rise in wages).
1985–2000
The period of slow growth and higher unemployment resulted largelyfrom the erosion of sources that drove the high growth performance ofthe previous decade and a net return migration following the Gulf War in1991. Economic growth declined between 1987 and 1993, curtailing the
216 Labor force and employment
employment-generating capacity of the economy. While growth in themanufacturing sector resumed, industrial efficiency suffered because ofthe inward-oriented bias, the lack of exposure to competitive pressures inthe domestic market, and the price and other distortions resulting fromgovernment intervention.
Open unemployment hit peaks of 10.2 percent in 1993 based on theLFSS, or 11.1 percent in 1986 based on the PC, and increasingly consistedof educated youth in their twenties entering the labor force for the firsttime. This was associated with a growing incidence of underemploymentin the rural areas in general, and in agriculture and construction inparticular, because of the net return migration and the end of the boomin the rural non-agricultural sector. While the informal sector appeared asan important source of employment in the 1990s (accounting for over 20percent of employment), it was not sufficient to absorb successive cohortsjoining the labor force.2 Inflationary pressures that had arisen during theprevious period eroded gains in real wages achieved during the economicboom, leading to further deterioration in living standards and an increasein the incidence of poverty until 1995.
Economic growth picked up after 1993, but in 1997 the economy wasstruck two major blows. The financial crisis that started in Thailand in Julyand then spread to much of East Asia seriously impacted on Egypt’s tradeand investment inflows. Then an attack on tourists in November in Luxorled to a precipitous drop in tourism and large-scale losses of employmentin the sector. Towards the end of the century the economy recoveredsomewhat, but a liquidity shortage continued to hold back job creation toa level less than what was required to absorb the additions to the laborforce.
The preceding analysis points to the importance of the composition ofgrowth, and not only its rate. While skills mismatch in the demand andsupply for labor may still be at work, it is not the main reason for theunemployment problem in Egypt.3 Nor is it a problem of inflexible wages.Real wages, in both the public and private sector, declined after the eco-nomic boom of the early 1980s. As several studies – Fergany (1999),Radwan (1997), Karshenas (1994) – point out, the primary cause forunemployment in Egypt is deficient demand for labor, resulting largelyfrom the capital-intensive character of economic growth during 1975–85.This change is captured in estimates of the employment elasticity ofoutput growth in Egypt’s manufacturing, which declined from 0.43 in1975 to 0.28 in 1992, and was generally lower than in other countries suchas Malaysia, Indonesia, or Jordan, where the elasticity was 0.84, 0.66, and1.04, respectively. These high employment elasticities reflect the success-ful export-oriented industrialization pursued by countries in East Asia,which embodied a high degree of labor intensity.
Radwan (1997) estimated the economy-wide employment elasticity ofoutput growth at 0.61 between 1983 and 1995, with the highest elasticity
Labor force and employment 217

recorded for the manufacturing sector (0.74). However, the choice oftime period significantly affects the measure; World Bank (2001: 12) esti-mated the (economy-wide) elasticity at 0.47 for 1960–90 and 0.64 for1991–99, while MOP/World Bank (2002: 40) put it at 0.5 for 1995–99.According to some estimates, employment intensity dropped substantiallyin the early 1990s. Fergany’s (1998b, 1999) calculations put the economy-wide constant prices employment elasticity at only 0.054 between 1990and 1995, and 0.12 in manufacturing. This implied that over the sameperiod, LE 1 million of output growth produced only eight job opportun-ities.
Trends in population, participation, and labor force growth
Three factors chiefly determine the evolution of the labor force: the popu-lation growth rate, the changing age structure of the population, andchanges in age-specific participation. The latter result from changes inbehavior patterns, such as higher school enrolment, retirement, changesin female participation in the labor force (because, for instance, ofdelayed marriage), and so on.
The PC recorded a total population of 59.3 million and a labor force of17.2 million in 1996. Between 1986 and 1996, the labor force grew at 2.9percent a year compared to 2.1 percent for population. Unadjusted esti-mates of the LFSS show a “shrinking” labor force between 1988 and 1995.The primary source of this unusual result is error in accounting for femaleparticipation after the special round of the LFSS in October 1988.Adjusted LFSS data imply an even higher growth rate of the labor forcecompared to the PC, because of higher participation rates. Assaad (1999)estimates the overall participation rate to have increased by almost 9percent between 1986 and 1996, varying between 30 percent in 1996based on the PC and defined for age groups 15 and over, and 47 percentin 1995 based on the LFSS and defined for age groups 15–64.
Despite incongruities between the PC and the LFSS (see Table 8.1), anumber of patterns are discernible. The first is a declining trend in maleparticipation aged 15–64 (based on the LFSS) up to 1995, because ofhigher enrolment in basic education and earlier retirement of olderworkers. The second is a likely increasing trend in female participation,based on the PC and the ELMS 1998. Higher female educational attain-ment, delayed marriage, and increased economic hardship are all likely toincrease female participation in economic activity, and not reduce it, asrecorded by the LFSS. The third pattern is a substantial increase in overallrural participation rates during 1988–98 (by nearly 12 percent), comparedwith urban rates (by only 6 percent), mainly because of the rise in ruralfemale participation.
Reliable time series on labor force participation are difficult to obtain.Estimates of labor force size, and hence of participation rates, are very sen-
218 Labor force and employment

sitive to the definition used and to the extent that these definitions areadhered to during data collection. Participation rates recorded by the PCare generally lower than those of the LFSS.4 Fergany (1991) attributes thisdiscrepancy to two reasons. First, the reference period to establish employ-ment in the PC is one day, which would capture only individuals employedon a regular basis and those seeking work on the reference day. There is atendency, therefore, to under-report both employment and unemploy-ment. Second, the PC tends to undercount the activity of women and chil-dren in informal home-based (and unpaid) activities.
Given the imperfections in the data, adjustments are often made torender it consistent with patterns that labor specialists deem closer to eco-nomic reality; the main work in this area is by Fergany (1996a), andAssaad (1997).5 It is not easy to reconcile the different estimates andtrends on labor phenomena reported in different studies. This chaptertherefore reviews the statistics and trends as reported, and concludes witha judgment on a likely range or magnitude of the labor phenomena thatare discussed.
To assess the differences between the two sources, one can computecrude and refined participation rates for specific years using the LFSS stat-istics reported in Assaad (1997) (see Table 8.2). The 1986 PC figure forthe non-age-restricted labor force is clearly understated compared to theLFSS series after 1984. The 1988 LFSS estimates the labor force at 18.6million, compared to 13.3 million only two years earlier – a difference thatis too large to ascribe to demographic growth. This is almost entirelycaused by fluctuations in the measurements of female participation.6 Withthe exception of 1981, participation rates throughout the LFSS series areconsistently higher than those reported in the 1986 PC, except for 1995,when the figure is almost identical to PC 1996. Allowing for the differentreference points used, estimated population and manpower growth ratesare very close to those reported by the PC.
However, the LFSS presents a number of unusual results, especiallywhen compared to the PC. The first is the shrinking of the labor forcerecorded by the LFSS after 1988, despite a growing working age popu-lation; and the second is the declining trend in female participation. Afterexamining the results from the special round of LFSS in October 1988,Fergany (1995, 1996a) and Assaad (1999) attribute this anomaly almostentirely to errors in measuring female participation. The observed declinein the overall labor force in general, and female participation in particu-lar, is almost entirely accounted for by biases in measuring rural femaleparticipation. In 1995, if the LFSS is to be believed, the urban femalelabor force had declined to 1.6 million from a little over 2.0 million in1988, whereas the rural female labor force had been reduced to almosthalf its level in 1988 (2.3 million in 1995 versus 4.8 million in 1988).
To underscore the magnitude of error in reporting female participa-tion, Table 8.3 compares estimates provided by different data sources. The
Labor force and employment 219

Tab
le 8
.2Po
pula
tion
, lab
or fo
rce,
an
d ec
onom
ic a
ctiv
ity,
197
7–98
(m
illio
ns
and
perc
ent)
Num
ber
of p
erso
ns (
mill
ions
)
1977
1981
1984
1986
1988
1990
1991
1992
1995
1998
Popu
lati
on1
36.7
41.4
45.0
48.1
50.9
53.6
54.7
55.7
59.2
–M
anpo
wer
bas
is2
29.5
33.4
36.6
37.2
39.8
42.0
43.3
44.9
48.8
–M
anpo
wer
bas
is (
12–6
4)23
.827
.229
.530
.331
.733
.735
.136
.539
.9–
Lab
or fo
rce3
10.4
11.5
14.4
13.3
18.6
16.4
16.5
16.3
17.5
–L
abor
forc
e (1
2–64
)9.
510
.512
.619
.9 4
17.6
15.7
15.9
15.8
17.0
21.7
5
Cru
de a
ctiv
ity
rate
(%
)628
.327
.832
.027
.736
.530
.630
.229
.329
.6–
Refi
ned
act
ivit
y ra
te (
%)6
35.3
34.4
39.3
35.8
46.7
39.1
38.1
36.3
35.9
–E
mpl
oym
ent (
12–6
4)3
9.2
9.9
11.8
11.4
16.3
14.4
14.5
14.4
15.2
–U
nem
ploy
men
t rat
e3.
15.
46.
011
.17.
38.
68.
89.
010
.4–
Ave
rage
gro
wth
rat
e (p
erce
nt)
1977
–81
1981
–84
1986
–90
1991
–95
1977
–88
1988
–95
1977
–95
Popu
lati
on1
3.0
2.7
�2.
82.
02.
97�
2.16
2.66
Man
pow
er b
asis
23.
13.
1�
3.0
3.0
2.72
�2.
912.
74M
anpo
wer
bas
is (
12–6
4)3.
32.
7�
2.7
3.2
2.61
�3.
292.
87L
abor
forc
e32.
57.
4�
5.3
1.7
5.29
�0.
872.
89L
abor
forc
e (1
2–64
)2.
66.
0�
5.1
1.8
5.61
�0.
503.
23E
mpl
oym
ent (
12–6
4)3
2.0
5.7
�5.
81.
45.
20�
1.00
2.79
Un
empl
oym
ent r
ate
13.9
3.3
�3.
54.
613
.33
�4.
659.
95

first column reports participation rates that related male and female laborforces to the respective populations of all ages. Subsequent columnsrestrict these indicators to the population aged 15–64. Naturally, age-restricted participation measures are higher because of the smallerdenominator, which captures participation for the working age popu-lation only. Female participation measures varied considerably across thethree sources.
Analysis of participation trends by gender and geographic classifica-tions was also affected by the error in measuring the size of the laborforce. Using age-specific participation rates based on the LFSS, Assaad(1999) shows a drop in overall participation rates over 1990–95 whendefined for the age group 15–64, with female rates declining much morethan male participation rates. Rural participation rates also decline faster
Labor force and employment 221
Source: Population from CAPMAS; LFSS data from Assaad (1997).
NotesCrude activity rate is labor force as a proportion of population of all age groups, whilerefined activity rate is labor force as a proportion of the manpower basis; growth rates initalics (for 1977–88, 1988–95, and 1977–95) are author’s own calculations.1 Does not include Egyptians abroad.2 Manpower is population aged 6–64, including employed persons 65� but excluding dis-
abled persons.3 Individuals 6 and over actually employed and individuals 12–64 seeking work, excluding
foreigners; reference period is one day for LFSS in May 1977, 1981, and 1984, and oneweek for LFSS 1988, 1990, 1991, and 1995.
4 This figure is probably a printing error, and hence the PC 1986 has been excluded as a ref-erence point in estimating broader sub-period average growth rates.
5 Figure for 1988 estimated from Assaad (1999) as the sum of 1.72 million unemploymentand 20 million employment based on the extended definition of the labor force.
6 Defined for the broader labor force as defined by 3.
Table 8.3 Participation rates by data source, ages 15–64 (percent)
Assaad et al. Fergany Assaad (1999)(1999) (1996)
LFSS 1988 LFSS 1995 1 LFSS 1995 PC 1996 2 EIHS 1997 3
Male Urban 75.0 45.7 69.9 77.1 72.8Rural 79.2 44.4 76.3 83.4 75.4
Female Urban 29.3 13.0 19.5 20.4 26.2Rural 53.9 13.8 23.0 10.9 17.3
Source: Assaad et al. (1999), Fergany (1996a), and Assaad (1999).
Notes1 Estimates from Fergany (1996); participation rate defined for labor force over population
6�.2 Participation rate defined as labor force (15–64) as a proportion of population (15–64),
and therefore different from corresponding figures in Table 2.2.3 Participation based on a definition of economic activity only for the purpose of market
exchange.

than urban rates, largely because of the drop in rural female participation.Fergany (1995) attributes the drop in male participation rates observed in1988 compared to 1984 to the surge of emigration to oil-producing coun-tries in the late 1980s. Emigration is unlikely to be responsible for thesimilar trend observed in the early 1990s; a more likely reason for thedeclining trend in overall participation is a rise in discouraged unemploy-ment, which affected rural males more than urban, and older males morethan younger (Fergany, 1995).7 Assaad (1999) attributes the decline inmale participation rates to a combination of higher school enrolmentamong younger males and earlier retirement of older segments of themale population from the labor force.
Age-specific patterns of participation also appear to be sensitive to thetime interval used. Overall participation rates, based on the extendedlabor force definition used in 1988, are relatively stable at 59 percent.Underlying this relative stability is a clear decline in male participationrates and a corresponding increase in female rates. The geographic pat-terns are also slightly reversed, with urban participation rising and ruralparticipation declining, and with a more rapid growth of female participa-tion in urban areas.
Female participation rates are very sensitive to the definition used.When the market definition of the labor force is used (i.e. which essen-tially excludes persons engaged in subsistence activities) female participa-tion rates fall by 50 percent compared to the extended definition (whichincludes persons engaged in subsistence activities), almost entirelyaccounted for by the drop in rural participation rates. This is notsurprising since most women in rural areas engage in unpaid subsistenceactivities, and therefore drop out when the market definition is applied.This difference is in sharp contrast to the stability of male participationrates across the two definitions.
The figures provided so far present us with a number of contradictoryand somewhat perverse patterns of labor force participation. The follow-ing conclusions may be ventured.
First, having a labor force that is growing at, or slightly above, the popu-lation growth rate implies that LFSS estimates of a “shrinking” labor forceare likely to be the result of poor measurement of economic activity. Consid-erable fluctuation in female participation figures after 1988 indicates errorsin accounting for female activities in general, and in rural areas in particular,to be the principal source of this inconsistency. Under-enumeration offemale activity results in under-estimation of the size of the female laborforce, thus affecting all statistics and indicators pertinent to female activity.
Second, as Assaad (1999) points out, the set of economic, educational,and behavioral factors operating in Egypt seems to imply a rising, not adeclining, trend of female participation. Rising female school attainment,delayed marriage ages, as well as economic hardship, combine to increasethe participation of women in economic activity.
222 Labor force and employment

Third, the observed decline in male participation also probably resultsfrom a combination of behavioral and statistical factors. Whereas higherschool enrolments are likely to underlie the drop in male participation atthe earlier tail of the age distribution, rising discouraged unemployment(and thus retirement from the labor force), especially among older malesin both urban and rural areas, is likely to underlie the overall decline inmale participation.
Finally, the studies tended to consider the PC as the most consistentsource in portraying very broad and aggregate employment trends, at leastup to 1986. For instance, the PC shows rising participation for both urbanand rural areas, and for both males and females – a logical outcome giventhe observed population and labor force growth rates. One is thereforeinclined to use the figures reported by the PC as “conservative” or “lowerbound” estimates of broad labor phenomena in the economy. Participa-tion rates, as of 1995, therefore were in the range of 30 percent, definedfor the population aged 6�, and 47 percent defined for the population15–64.
Adjustments to the LFSS also result in more tractable participationtrends. Fergany (1995) adjusts for the bias in the LFSS by correcting theseries based on parameters anchored in the special round of the LFSS1988.8 These adjustments resulted in a smaller female labor force in 1988,but a steadily growing labor force, both male and female, up to May 1993,with an overall labor force of 21.2 million, as opposed to 17.5 millionaccording to LFSS 1995.
Trends and structure of unemployment
Trends in unemployment
Official estimates of unemployment placed it at 8.2 percent in 1996, downfrom 11.1 percent in 1986. However, both this level and the direction runcounter to the LFSS and the adjusted estimates of Fergany (1999) andAssaad (1999). The picture that emerges from these studies is one of risingopen unemployment between 1988 and 1998.
According to the PC, the open unemployment rate defined for indi-viduals 6� increased from 7.7 percent in 1976 to 14.7 percent in 1986,corresponding to 2 million unemployed individuals in 1986 (Table 8.4).The 1996 PC reported a (much contended) rate of unemployment of lessthan 9 percent, defined for the reduced age bracket 15�, which corres-ponds to 1.54 million individuals. Adjusting for differences in censusversus LFSS reference periods and for the underestimation of unemploy-ment in the LFSS (by requiring active search and therefore excluding dis-couraged unemployment) led Fergany (1999) to an unemployment rateof 14–15 percent for 1996. At 15 percent of the labor force, the number ofunemployed would rise to 2.5 million instead of the reported 1.5 million.
Labor force and employment 223

The unemployment rate reported by the 1996 PC represents a break fromthe historical trend in the census series, and is difficult to explain in viewof other indicators of economic performance during this period.
Excluding the 1996 figures, the census series reveals a rising trend inthe unemployment rate, with rural unemployment growing at a muchfaster rate than urban unemployment. Male unemployment rates doubledbetween 1976 and 1986, with rural males bearing the brunt of thisincrease. Female unemployment rates also increased significantly. Ruralfemales experienced the highest incidence of unemployment in 1986,when half the female labor force was unemployed. The gap between maleand female unemployment was higher in rural than in urban areas, andwas increasing with time.
224 Labor force and employment
Table 8.4 Unemployment level and rate, population censuses, 1960–96 (thousandsand percent)
Fergany (1991) Assaad Fergany(1997) (1999)
1960 1976 1986 1 1986 2 1996
Number of unemployed (thousands)Urban Male 93 297 563 – –
Female 26 157 464 – –Total 119 454 1,027 – –
Rural Male 46 261 596 – –Female 10 136 388 – –Total 56 397 984 – –
Total Male 139 558 1,159 – –Female 36 293 852 – –Total 175 851 2,011 – 1.54
Unemployment rate (%)Urban Male 3.8 7.2 10.9 10.6 –
Female 9.1 25.0 34.8 22.6 –Total 4.3 9.5 15.8 12.6 –
Rural Male 1.0 4.5 9.3 8.3 –Female 3.0 38.0 50.4 32.9 –Total 1.1 6.4 13.7 9.6 –
Total Male 1.9 5.6 10.0 9.3 –Female 5.8 29.7 40.6 25.2 –Total 2.2 7.7 14.7 11.1 8.2
Source: Fergany (1991, 1999), Assaad (1997).
NotesUnemployment defined for individuals 6� in PC 1960, 1976, 1986, and for individuals 15�in PC 1996.1 Preliminary results of PC 1986.2 Unemployment defined for individuals (12–64).
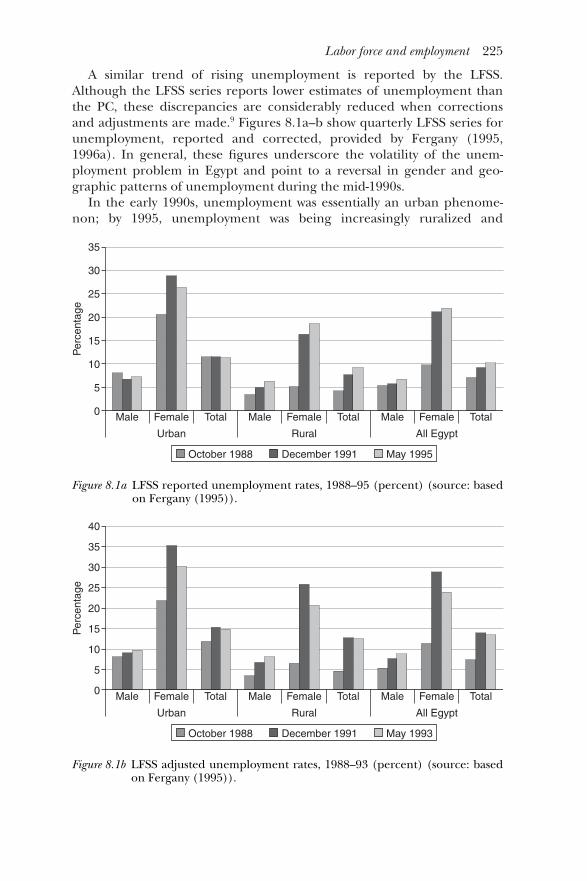
A similar trend of rising unemployment is reported by the LFSS.Although the LFSS series reports lower estimates of unemployment thanthe PC, these discrepancies are considerably reduced when correctionsand adjustments are made.9 Figures 8.1a–b show quarterly LFSS series forunemployment, reported and corrected, provided by Fergany (1995,1996a). In general, these figures underscore the volatility of the unem-ployment problem in Egypt and point to a reversal in gender and geo-graphic patterns of unemployment during the mid-1990s.
In the early 1990s, unemployment was essentially an urban phenome-non; by 1995, unemployment was being increasingly ruralized and
Labor force and employment 225
Per
cent
age
35
30
25
20
15
10
5
0 Male Female Total Male Female Total Male Female Total
Urban Rural All Egypt
May 1995December 1991October 1988
Figure 8.1a LFSS reported unemployment rates, 1988–95 (percent) (source: basedon Fergany (1995)).
Per
cent
age
40
35
25
20
15
10
5
0 Male Female Total Male Female Total Male Female Total
Urban Rural All Egypt
May 1993December 1991October 1988
30
Figure 8.1b LFSS adjusted unemployment rates, 1988–93 (percent) (source: basedon Fergany (1995)).
feminized. In 1988, the number of urban unemployed was twice that oftheir rural counterparts; in 1995, the number of unemployed in ruralareas exceeded that in urban areas. Although still lower than the urbanrate, rural unemployment rates doubled between 1988 and 1995 (seeTable 8.1). Moreover, and contrary to the census, LFSS estimates show theunemployment rate (both reported and corrected) for urban females tobe consistently higher than for rural females, although the latter grew at amuch faster pace. Not only did urban females experience higher unem-ployment rates throughout the period, the gap with their male counter-parts was also larger than in rural areas and was growing with time.
Unlike the PC, unemployment rates based on the LFSS are less sensi-tive to the age bracket used, implying that the bulk of the unemployed arein fact in the working age population 12–64 (indeed in the 25–30 yearsage group). According to the LFSS, the reported unemployment rate in1995 was in the vicinity of 10 percent of the labor force, with urban unem-ployment rates consistently higher than rural rates during 1988–95. Withonly slight periodic fluctuations, the urban unemployment rate hoveredaround 11 percent throughout the period 1988–95, while the rural unem-ployment rate showed a marked increase, more than doubling to 9percent in 1995. And while male unemployment rates in urban areasslightly declined between 1988 and 1995, rural male unemployment ratesdoubled over the same period. Females in both urban and rural areashave seen their unemployment rates increase between 1988 and 1995,with a faster growth in rural female unemployment rates.
To sum up, the LFSS data indicate unemployment to have increasedbetween 1988 and 1995 to about 10 percent of the labor force; someadjustments put this figure at 13 percent.10 Unemployment in rural areas,for both males and females, rose faster than in urban areas, albeit at lowerlevels. The results of the ELMS 1998, discussed in Assaad (1999), also con-tradict the decline in unemployment reported by the 1996 PC.11 Theoverall unemployment rate, based on the extended labor force and searchdefinitions, increased from 5.4 percent in 1988 to 7.9 percent in 1998.These rates corresponded to 1.72 million unemployed individuals in 1998,up from 0.89 million in 1988, equivalent to an average rate of increase of6.6 percent per year, which is 2.5 times that of the labor force or workingage population. When the market definition of the labor force is used,Assaad (1999) showed that the average rate of increase in unemploymentrose to 11.7 percent per year, with almost all the difference accounted forby the change in the female unemployment rate, which increased from9.4 percent according to the extended definition to 27.6 percent based onthe market definition. Notwithstanding the contradicting trends in genderunemployment rates displayed by the ELMS data, the general trend wasone of rising open unemployment between 1988 and 1998.
226 Labor force and employment
Structure of unemployment
The composition of open unemployment in Egypt has remained virtuallyunchanged over the past two decades, indicating the causes to be mainlystructural. Fergany (1996b, 1999) and Assaad (1999) have shown thatunemployment is still highest among the age group 20–25, and amonggraduates of intermediate education (secondary and vocational technicaltraining). Open unemployment is highest in Lower Egypt, while visibleunderemployment is a major problem in Upper Egypt. A profile of unem-ployment in terms of socio-demographic characteristics is sketched below.
Unemployment by gender and urban/rural residence
The LFSS data underscore the acuteness of the unemployment problemin rural areas. Unemployment in rural areas was composed almost entirelyof new entrants to the labor market, or first-time job seekers, who experi-enced the longest durations of unemployment (up to 47 months).Females in general and rural females in particular, were disproportion-ately affected by these conditions. While the proportion of first-time jobseekers among unemployed females remained at 98 percent, the gap inthe duration of unemployment compared to their male counterpartsincreased. Despite a slight decline in urban male unemployment ratesover the two-year period, the pressure of an increasing proportion of first-time job seekers pushed up the unemployment duration for urban malesbetween 1993 and 1995, who nevertheless faced the shortest durationspells (38 months) while rural women suffered the longest unemploymentdurations (51 months). This was a direct outcome of the slower growth ingovernment employment, which represented the only socially acceptableform of employment for educated rural females. The total duration ofunemployment was almost entirely determined by first-time job seekers.For both males and females in urban and rural areas, unemployed indi-viduals with previous work experience suffered employment spells thatwere less than half as long as those of new entrants.
Unemployment by region
The Lower Delta was the area most affected by unemployment. Theunemployment rate was highest in the Western governorates of the Delta:at 19 percent it was almost double the aggregate level of unemploymentand triple the rate in Greater Cairo. Almost all of the unemployed werefirst-time job seekers who experienced extended spells of unemploymentof more than four years. However, an unusual result was the relatively lowunemployment rate in the northern governorates of Upper Egypt, similarto that in Greater Cairo, but of much longer duration. This pattern seemsto have continued through 1998. Assaad (1999) showed that most of the
Labor force and employment 227

increase in unemployment in rural areas over the period 1988–98occurred in Lower Egypt, where both male and female unemploymentrose more than in rural Upper Egypt. The PC 1996 also recorded thehighest rates of unemployment for governorates in Lower Egypt.
Unemployment by age groups
Almost all data sources report the highest unemployment rates to be foryouth in their early twenties, especially females. Unemployment hithardest at youth in their early twenties, reaching almost 40 percent amongthe age group 20–24, although individuals in the age group 25–39 experi-enced the longest spells of unemployment, ranging between five and sixyears (see Table 8.5). The majority of individuals below 30 years of agewere first-time job seekers, probably holding out for regular wagedemployment in the government sector. A pronounced rate of unemploy-ment among youth is a pattern that can be traced back to 1976 (bylooking at the PC 1986) and appears to persist throughout 1986–95 (seeFigure 8.2). The proportion of unemployed individuals in the age groups20–29 fluctuated around 76 percent of the total unemployed for mostyears during 1986–95.
This pattern was reflected in the 1996 PC. According to Fergany(1999), almost all the unemployed in 1996 were first-time job seekers, buta shift occurred in the age structure over the intercensual period, withunemployment rates for individuals below the age of 30 declining andthose in the early 30s increasing. This probably indicated a lengtheningof the unemployment period, which lasted more than five years forthis group according to LFSS 1995. The high incidence of first-timejob seekers among such older age groups indicated the stock of the
228 Labor force and employment
Per
cent
age
60
50
40
30
20
10
012–14 15–19 20–24 25–29 30–39 40–64
1986 1995
Figure 8.2 Unemployment rates by age, 1986 and 1995 (percent) (source: Gautier(1997).

Tab
le 8
.5U
nem
ploy
men
t by
age
cate
gori
es, L
FSS
1995
(th
ousa
nds
an
d pe
rcen
t)
6–12
–15
–20
–25
–30
–40
–50
–60
–65
�
Em
ploy
ed (
’000
s)70
.026
7.0
1,04
0.0
1,36
0.0
1,94
0.0
4,28
0.0
3,58
9.0
2,19
3.0
538.
041
0.0
Wag
ed e
mpl
oym
ent (
%)
34.3
37.1
43.1
54.3
63.4
64.4
58.0
52.6
20.6
10.0
Un
empl
oym
ent r
ate
(%)
1.5
2.4
21.5
39.0
20.4
2.4
0.2
0.1
0.1
0.1
of w
hich
:Fi
rst-t
ime
wor
k se
eker
(%
)10
0.0
71.4
96.1
97.9
94.8
84.1
0.0
0.0
0.0
0.0
Ave
rage
dur
atio
n o
f un
empl
. (m
ths)
*–.
020
.218
.437
.765
.368
.516
.349
.590
.0–.
0
Sour
ce: F
erga
ny
(199
6).
Not
e*D
efin
ed fo
r th
e ag
e gr
oup
12–6
4.

unemployed to be increasingly formed of individuals in older unemploy-ment cohorts still searching for their first job.
Unemployment by educational attainment
To an important degree, unemployment towards the end of the twentiethcentury was a phenomenon of graduates of intermediate and above inter-mediate education (Table 8.6). The position of these groups appeared tohave worsened since 1986. (see Figure 8.3). In 1995, holders of intermedi-ate diplomas suffered unemployment rates three times the aggregate rate,with spells of unemployment of up to four years. Almost all of them were
230 Labor force and employment
Table 8.6 Unemployment by educational attainment (ages 12–64), 1986–95(percent)
1986 1987 1988 1990 1991 1992 1995
Illiterate 10.5 3.1 21.9 12.9 3.7 1.2 1.6Reads and writes 4.9 3.2 8.5 4.1 1.7 1.0 1.4Below intermediate 3.9 2.8 12.5 8.4 3.5 1.2 1.4Intermediate 57.3 57.3 40.0 53.3 66.8 70.4 74.6Above intermediate 5.3 7.7 4.7 6.8 8.2 9.1 8.4University 18.0 25.9 12.4 14.6 16.0 17.0 12.6
All (’000s) 1,426.0 1,354.0 1,303.0 1,345.0 1,397.0 1,416.0 1,774.0
Source: Assaad (1997).
Notes1988 data refer to unemployed 10� rather than 12–64. The total number of unemployedbelow age 12 and above 64 is 37,000.
80
70
60
50
40
30
20
10
0
Per
cent
age
Illiterate Reads andwrites
Less thanintermediate
Intermediate Aboveintermediate
University
1986 1995
Figure 8.3 Unemployment rate by educational attainment, 1986 and 1995(percent) (source: Table 8.6).

first-time job seekers. The proportion of holders of intermediate degreesamong the unemployed increased from 53 percent in 1990 to nearly 75percent in 1995. This was in sharp contrast to the almost negligible unem-ployment rates for individuals with little or no education and suggests anegative correlation between education and unemployment, at leastwithin a certain range, referred to in studies such as Fergany (1992). Thiscontrasts with the almost negligible incidence of illiterates and low-leveleducation holders among the unemployed.
Based on the ELMS 1998, Assaad (1999) reported a substantial increasein unemployment rates for educated rural males, especially at the inter-mediate and above intermediate levels, while urban males at all educa-tional levels saw virtually no change in unemployment rates between 1988and 1998. A similar pattern was discernible for rural women as their malecounterparts, albeit at higher levels of unemployment, and with peakincreases in unemployment occurring at the post-secondary and universitylevels, instead of the intermediate level.
Underemployment and discouraged unemployment
Data on open unemployment in Egypt appear to capture employmentinadequacy mainly among young educated individuals. Individuals withlittle education, skills, or qualifications often suffer from another type ofemployment inadequacy, namely underemployment, visible or invisible.Underemployment is a more difficult concept to measure directly, andproxy indicators are therefore used.
Based on the 1988 LFSS, Fergany (1996a) found a net visible underem-ployment of 1.6 percent of the norm to exist in 1988, but with stronggender and geographic differentials.12 Whereas males were visibly overem-ployed by about 12 percent, females were visibly underemployed by morethan 24 percent. Moreover, workers in rural areas were as much visiblyunderemployed as urban workers were overemployed, with rural femalesbeing 30 percent visibly underemployed compared to urban males whowere 17 percent overemployed. Male overemployment increased steadilywith age after 15 years, and although overemployment was manifest at alleducational levels, it was highest for unqualified males. Female underem-ployment, on the other hand, declined significantly with educationalattainment, the turning point being intermediate education.
Using the ELMS 1998, Assaad (1999) measured underemployment anddiscouraged unemployment using a composite index, the underemploy-ment ratio13 (see Table 8.7). At the overall level, about 7.5 percent of theworking age population was underemployed in both 1988 and 1998.However, there was a shift in underemployment from involuntary part-time employment in 1988 to open unemployment in 1998. Discouragedunemployment increased between 1988 and 1998, but only for males inboth urban and rural areas, although the rates for females were higher on
Labor force and employment 231

average. Assaad also found involuntary part-time work (IPT) to be moreassociated with men than with women, because more men tended to becasual workers. This category of workers is typically uneducated and mostlikely to suffer from underemployment. The significant drop in the IPTrate for males in urban and rural areas between 1988 and 1998 was takenas an indication of improved employment conditions for male casualworkers. Coupled with the observed declining trend in open unemploy-ment rates registered for individuals with little education (Table 8.6), thisseems a reasonable interpretation.
However, other factors may be at work. The concurrent rise in openunemployment during the same period may be an indication of the inabil-ity of the labor market to provide productive employment opportunities,even through part-time work arrangements. Individuals unable to findproductive part-time employment opportunities either move to the ranksof the openly unemployed, or become “discouraged unemployed.” Therise in discouraged unemployment during the same period, especially formales, and the relatively high and sustained rates for females, suggeststhat this may indeed be the case. Moreover, the rise in discouraged unem-ployment among males, compared to its stability for females, supportFergany’s (1995) view about rising discouraged unemployment to under-lie the declining trend in male participation observed over the past fewyears. The rise in open and discouraged unemployment and the decline
232 Labor force and employment
Table 8.7 Underemployment ratio by gender, urban/rural residence, 1988 and1998 (percent of working age population 15–64)
Urban Rural Total
1988 1998 1988 1998 1988 1998
Male U 4.4 4.9 1.9 5.3 3.1 5.1DU 0.4 0.8 0.3 0.9 0.3 0.8IPT 4.3 1.9 8.0 5.0 6.3 3.6Total 9.0 7.6 10.2 11.2 9.6 9.6
Female U 4.9 5.3 1.9 3.6 3.3 4.3DU 0.8 0.8 0.5 0.6 0.7 0.7IPT 0.7 0.2 2.8 0.6 1.8 0.4Total 6.3 6.3 5.1 4.7 5.7 5.4
Total U 4.6 5.1 1.9 4.5 3.2 4.7DU 0.6 0.8 0.4 0.7 0.5 0.8IPT 2.5 1.1 5.4 2.8 4.0 2.0Total 7.7 6.9 7.6 7.9 7.6 7.5
Source: Assaad (1999) based on LFSS 1988 and ELMS 1998.
NotesU�open unemploymentDU�discouraged unemploymentIPT� involuntary part-time work, available
in IPT combined to produce a slightly lower overall underemploymentratio in urban areas in 1998 and a higher ratio in rural areas, comparedwith 1988.
The LFSS 1988 also provided information on factors affecting employ-ment decisions, specifically those related to desire to change the main job.Less than 10 percent of respondents reported a desire to change theirmain job, with the percentage being higher among males in urban areas(12 percent) and lowest among rural females (only 2 percent). A “moresecure future” topped the list of reasons for desire to change, followed bya “less tiring” job, which were both more frequent in rural than in urbanareas. In the third and fourth places came reasons of “raising income” andattaining a better “correspondence” between qualification and work.
This evidence also points to the importance, if not predominance, ofjob security in making employment decisions among workers in Egypt.The long queues of young graduates for government jobs are thereforenot surprising. What is more troubling, however, is the expectation of lowwork effort, or low productivity, associated with a presumably securegovernment job (the “less tiring” job reason). Such non-pecuniary aspectsof government jobs create a wedge between private and public wages inthe economy by raising the effective level of real wages above those of theprivate sector.
Unemployment and demographic pressure
Pressure on employment is likely to continue from demographic factors,more so for rural areas than for urban, where fertility declines set inearlier. Demographic data from CAPMAS (1999) show the cohort of10–19 year olds to be at historical highs, experiencing the fastest growthrate (3.3 percent per annum) between 1986 and 1996. Once this groupcompletes its transition to the 20� age group, the age of labor marketentry, it will put additional pressure on the employment-generating capac-ity of the economy. Thereafter, labor pressures are expected to subside, asthe share of the younger cohort of individuals less than ten years of age isdeclining.
Assaad (1999) reports a similar pattern of age cohorts in rural andurban areas, suggesting that over the next decade or so demographicfactors would continue to generate pressures on employment in ruralareas. However, as a result of the increasing educational attainment of newentrants, it is possible that current demographic pressures might translateinto open unemployment, since educated workers are more likely to holdout for regular salaried employment, and remain unemployed, comparedwith their uneducated counterparts, for whom labor surplus is manifestedin underemployment rather than open unemployment.
In sum, open unemployment continued to be concentrated amongeducated youth under the age of 30, most of whom were new entrants to
Labor force and employment 233

the labor market, with holders of intermediate diplomas experiencing thehighest unemployment rates. Urban unemployment was fairly stable, butrural unemployment increased substantially, especially in Lower Egyptand for educated females. The longest spells of unemployment were foreducated youth aged 25–30 in rural areas. For governorates in UpperEgypt, underemployment was a major problem.
A number of interrelated factors have translated past government pol-icies into the perverse unemployment patterns that characterized Egypt’slabor market at the end of the twentieth century. Referring to LFSS 1961,Assaad et al. (1999) pointed out that at least at the beginning of the 1960s,unemployment was inversely related to education. Unemployment rateswere highest for illiterates, followed by those with intermediate (sec-ondary) education (6 percent) and least among university graduates (3percent). By 1975, with the inception of the open-door policy, the currentpattern of unemployment had emerged. Government employment pol-icies, especially the employment guarantee programs for graduates ofintermediate and university education, seems to have influenced the edu-cational threshold at which the open unemployment bottleneck appears,namely, intermediate education. The indirect suspension of this programsince the early 1990s through the lengthening of the waiting period forappointment has led to young graduates queuing for periods of up to sixyears, with a resulting increase in their measured unemployment rates.While a portion of unemployed males in urban areas was absorbed intothe private sector, educated females had a harder time. A set of social,institutional, and behavioral factors have combined to make the privatesector virtually inaccessible to women, especially in rural areas. The slow-down in the growth of government employment therefore seems to havedisproportionately affected young educated females in rural areas, whoseunemployment rates soared in the mid-1990s.
Trends and patterns in employment growth, 1960–2000
This section examines trends and patterns in the evolution of employ-ment over the past four decades. Owing to inconsistencies between theemployment figures from the PC and unemployment figures and laborforce sizes from other sources, the present analysis concentrates on broadtrends (rather than on sub-sectoral details) in the evolution of employ-ment between 1960 and 2000.
Employment growth by sector of economic activity and sector of owner-ship are considered first, with specific attention to the composition of sec-toral employment growth, especially that of the informal sector. Theimpact of the government’s policies of guaranteed employment onobserved employment outcomes is then discussed.
234 Labor force and employment
Trends in employment
Employment growth by sector of economic activity
Based on the PC, employment in 1996 stood at 15.8 million, up from 7.7million in 1960, 10.3 million in 1976, and 12.2 million in 1986 (see Table8.2). Employment grew at a rate of 1.77 percent over 1976–86 and acceler-ated to 2.54 percent over 1986–96 (with most growth occurring in1986–90), but was still below the growth rate of the labor force for bothintercensual periods (on average 2.9 percent per year). The sectorsdriving the growth employment in 1986–96 were manufacturing, followedby financial services and construction.14
During the period 1960–86, growth in employment was accounted forprimarily by urban employment, which increased at almost twice thenational average. This pattern was reversed in 1986–96 and rural employ-ment grew slightly faster than the aggregate rate. In both 1986 and 1996,the major part of employment (54 percent) remained in rural areas.Employment data from the LFSS are generally consistent with the PC after1986. Data from Fergany (1996a) and Assaad (1997) show overall employ-ment in 1995 at 15.2 million for individuals aged 12–64 and 15.7 millionfor non-age-restricted individuals (6�). With the exception of 1986–90,the growth rate of employment consistently fell short of the growth rate ofthe labor force. Employment grew by only 1.4 percent during 1991–95,because of poor economic performance of the early 1990s, which con-sequently saw an escalation of the unemployment rate.
Female employment grew rapidly in both urban and rural areas, but ofcourse from a much smaller base. Female employment represented only15 percent of total urban employment in 1986 and 18 percent in 1996; forrural females these shares were even smaller: only 4 percent and 9percent, respectively.
Figure 8.4 shows the evolution of shares of main economic activitiesover the period 1960–96. In 1996, agriculture accounted for 31 percent ofemployment – dropping from 60 percent in 1960 – and was still the mostimportant activity, followed by services (24 percent), manufacturing (14percent), commerce and tourism services (10 percent), and construction(8 percent).
AGRICULTURE
Despite its decline in the share of employment, agriculture still providedjobs to over half the male population and almost 30 percent of the femalepopulation in rural areas in 2000. The growth rate of agricultural employ-ment was negative for rural males during 1976–86 because of migration tourban areas in the construction sector or to Arab oil-producing countries,with a slight rebound during the following ten-year period. Radwan
Labor force and employment 235

(1997) attributes this increase in agricultural employment to the shift tohigh-value, labor-intensive crops (such as vegetables and fruits) thatoccurred in the early 1990s, and the re-emergence of family farms, result-ing from a favorable shift in agricultural terms of trade. The data showhuge fluctuations in growth rates of female agricultural employment inrural areas (from a negative 3.8 percent in 1976–86 to a positive 7.8percent in 1986–96), reflecting measurement issues referred to earlier.
MANUFACTURING
This was an important generator of employment, accounting for morethan 25 percent of jobs created during 1960–76 and almost 20 percentduring 1986–96. This sector grew at a rate of over 4 percent per yearduring 1960–76, reflecting the huge injections of public investmentduring the Nasserist era and the early years of the “open-door” policy.Growth in manufacturing slowed down during 1976–86 to a little over1 percent per year. Handoussa (1991a) ascribes two reasons for this slow-down.
The first was the government’s relaxation of hiring policies in thepublic enterprise sector, which eventually enabled it to start sheddingsurplus labor.15 The second was the increasing mechanization in industrydriven by the sharp rise in wages relative to other factors of production.The wage increases resulted from the growing scarcity of skilled industriallabor caused by the emigration of such workers to the Arab countries,together with rigid wage policies in the public sector. These two factorsencouraged the adoption, especially by new establishments, of machinerythat reduced dependence on labor. Growth in manufacturing picked upto an average of 3.6 percent a year during 1986–96.
236 Labor force and employment
Tho
usan
ds6,000
5,000
4,000
3,000
2,000
1,000
0Agriculture Manufacturing Construction Comm/
hotelsFinance/R.E.B.
Socialservices
1996198619761960
Figure 8.4 Employment growth by sector, 1960–96 (thousands) (source: based onPopulation Census 1960, 1976, 1986 and 1996 in CAPMAS, StatisticalYearbook 1997 and 1999).

CONSTRUCTION
This was another important sector, growing at an average rate of over 7percent per year during 1976–86 and accounting for nearly a quarter oftotal employment created during this period. Growth in this sector wasdriven by the construction boom of the early 1980s, which also absorbedlabor shed by agriculture. As the construction boom subsided, the sectorgrew at a more modest pace of 4 percent per year during 1986–96. Never-theless, the share of construction in total employment grew steadily from2 percent in 1960 to 8 percent in 1996.
FINANCE AND BUSINESS SERVICES
The finance and business services sector’s growth rate of 10 percent a yearduring 1976–96 made it the second largest contributor (after manufactur-ing) to total employment created during 1986–96, even though it stillrepresented only 5 percent of total employment in the latter year. Womenaccounted for 31 percent of total employment in this sector in 1996, asopposed to only 9 percent in manufacturing.
COMMERCIAL SECTOR
An assessment of the performance of the commercial sector (commerce,restaurants, and hotels) based on the PC is more ambiguous, becauseadditional categories of classification were introduced in 1996. Despite thelarge increase in this sector’s share in total employment during 1986–96,Radwan (1997) reported a negligible contribution of the tourism sector toemployment generated between 1990 and 1996. He attributed this resultto a measurement bias towards formal types of employment, whichignored the huge numbers informally employed in the tourism sector.
The distribution of employment by economic activity in 1995 based onthe LFSS largely mirrored that of the PC (Figure 8.5). Agricultureaccounted for a third of total employment, followed by services(26 percent) and manufacturing (14 percent). The figure also shows thepredominance of waged employment in certain sectors, such as electricity,mining, and services, which are most likely to be government-owned orpublicly run. The proportion of waged employment was lowest in sectorssuch as trade (only 31 percent), which are most likely to comprise privateself-employed and small-scale activities in the informal sector.
Employment growth by sector of ownership
The government remained the main generator of non-agriculturalemployment in the economy. According to the PC, government share intotal employment increased from 17.7 percent in 1976 to 22.0 percent in
Labor force and employment 237
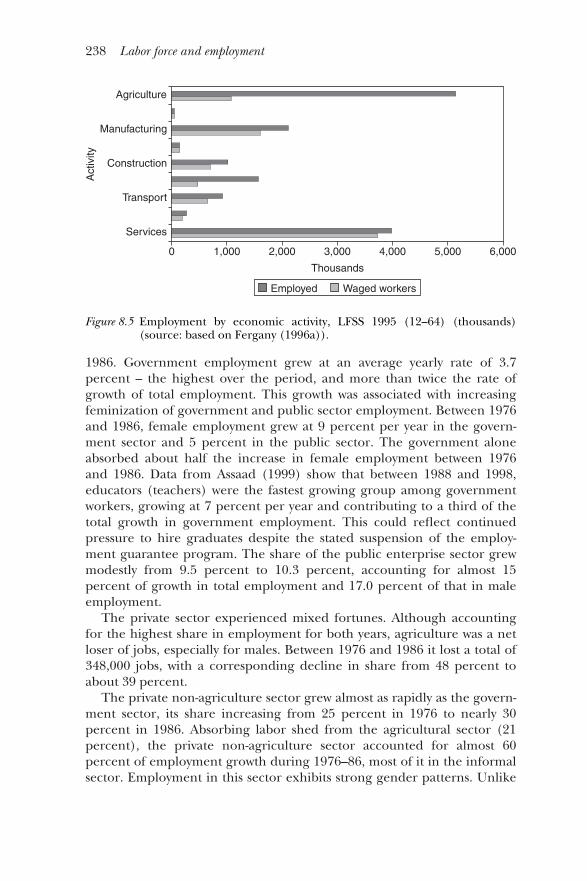
1986. Government employment grew at an average yearly rate of 3.7percent – the highest over the period, and more than twice the rate ofgrowth of total employment. This growth was associated with increasingfeminization of government and public sector employment. Between 1976and 1986, female employment grew at 9 percent per year in the govern-ment sector and 5 percent in the public sector. The government aloneabsorbed about half the increase in female employment between 1976and 1986. Data from Assaad (1999) show that between 1988 and 1998,educators (teachers) were the fastest growing group among governmentworkers, growing at 7 percent per year and contributing to a third of thetotal growth in government employment. This could reflect continuedpressure to hire graduates despite the stated suspension of the employ-ment guarantee program. The share of the public enterprise sector grewmodestly from 9.5 percent to 10.3 percent, accounting for almost 15percent of growth in total employment and 17.0 percent of that in maleemployment.
The private sector experienced mixed fortunes. Although accountingfor the highest share in employment for both years, agriculture was a netloser of jobs, especially for males. Between 1976 and 1986 it lost a total of348,000 jobs, with a corresponding decline in share from 48 percent toabout 39 percent.
The private non-agriculture sector grew almost as rapidly as the govern-ment sector, its share increasing from 25 percent in 1976 to nearly 30percent in 1986. Absorbing labor shed from the agricultural sector (21percent), the private non-agriculture sector accounted for almost 60percent of employment growth during 1976–86, most of it in the informalsector. Employment in this sector exhibits strong gender patterns. Unlike
238 Labor force and employment
Thousands
Act
ivity
Agriculture
Manufacturing
Construction
Transport
Services
0 6,0001,000 3,000 5,0004,0002,000
Employed Waged workers
Figure 8.5 Employment by economic activity, LFSS 1995 (12–64) (thousands)(source: based on Fergany (1996a)).

the government sector, male employment dominated the private non-agri-cultural sector, which accounted for 30 percent of total male employmentin 1986 and almost 75 percent of the growth in male employmentbetween 1976 and 1986. Male employment grew at three times the rate offemale employment (4.7 percent and 1.6 percent, respectively) and wasmore evenly distributed across the different activities. Female employ-ment, on the other hand, was concentrated in manufacturing, trade andtourism, and finance and insurance activities.
The gender bias carried over to the type of job protection associatedwith employment in this sector.16 The majority of jobs created between1988 and 1998 were not legally protected (66 percent), and if the irregu-lar jobs are added, this proportion rises to 80 percent. Regular protectedemployment grew much faster for males than for females (5.6 percent and1.1. percent, respectively). In fact, unprotected regular employmentdominated the pattern of female employment growth (93 percent) duringthe ten-year period (Assaad 1999). Growth in the private sector is there-fore more likely to be associated with a rise in unprotected employment.
Table 8.8 documents the growing role of government employment(including public sector enterprises) in the economy. Government admin-istration, public sector enterprises, and the informal sector were the mainsources of labor absorption in the economy during the 1980s and up tothe early 1990s. Migration was also an important vent for labor surplus atthe time, accounting for (according to the CAPMAS 1985 emigrationsurvey) about 1.2 million workers, or almost 9 percent of the labor force.Domestically, government employment grew at an average of 8 percentduring 1977–84, and together with the public enterprise sector, accountedfor 54 percent of total non-agricultural employment and a third of totalemployment in the economy in 1984. The government sector grew at aconsiderably lower rate during 1984–92, reflecting the general slowdownin the economy. But at 4 percent per year, employment in this sector grewat double the overall growth in employment (2 percent), with governmentemployment maintaining its shares in overall employment in 1992. Thepublic enterprise sector grew rapidly between 1977 and 1981, but employ-ment in the sector slowed down considerably thereafter, as the publicenterprises were removed from the centralized manpower allocationsystem in 1978 and given the right to set their own employment levels.This was reinforced by the downsizing of the sector in the economicadjustment program of the early 1990s.
More importantly, the table indicates the inadequacy of the privateformal sector as a generator of employment, with the burden placed, bydefault, on the informal sector. Although the private formal sector, com-posed of establishments employing ten or more people, expanded atimpressive rates during 1977–92, it accounted for only 3.4 percent of totalemployment and 5.6 percent of non-agricultural employment in 1992. Onthe other hand, the informal sector, which includes establishments with
Labor force and employment 239

Tab
le 8
.8Se
ctor
al s
truc
ture
of e
mpl
oym
ent,1
1977
–92,
age
s 12
–64
(mill
ion
s an
d pe
rcen
t)
Sect
orM
illio
nsSt
ruct
ure
(%)
Av.
ann
ual g
row
th r
ate
(%)
1977
1981
1984
1992
1977
1981
1984
1992
19
77–8
119
81–8
419
84–9
2
Agr
icul
ture
repo
rted
4.2
4.0
4.8
5.5
––
––
––
–ad
just
ed2
5.3
5.4
5.4
5.8
51.5
47.5
43.5
39.6
0.2
0.1
0.9
Man
ufac
turi
ng,
min
ing,
an
d ut
iliti
es1.
41.
71.
82.
213
.814
.714
.215
.03.
91.
92.
8O
f wh
ich
pub
lic e
nte
rpri
se0.
70.
70.
70.
8(6
.4)
(6.2
)(5
.8)
(5.7
)1.
60.
61.
8O
f wh
ich
pri
vate
10�
0.1
0.2
0.2
0.3
(1.4
)(1
.4)
(1.5
)(2
.0)
2.2
4.7
6.0
Res
idua
l (in
form
al s
ecto
r)0.
60.
80.
91.
1(6
.0)
(7.1
)(7
.0)
(7.4
)6.
52.
52.
8C
onst
ruct
ion
0.3
0.5
0.6
0.9
3.2
4.6
4.9
6.0
10.8
5.6
4.6
Serv
ices
3.2
3.6
4.3
5.8
31.4
31.6
34.5
39.3
2.4
6.0
3.7
Non
-agr
icul
tura
l em
ploy
men
t5.
05.
97.
08.
948
.552
.556
.560
.44.
35.
62.
9O
f wh
ich
gov
ern
men
t1.
52.
02.
53.
5(1
4.2)
(17.
5)(2
0.4)
(23.
7)7.
48.
24.
0O
f wh
ich
pub
lic e
nte
rpri
se1.
01.
21.
31.
4(1
0.1)
(10.
7)(9
.6)
(9.6
)3.
62.
90.
8O
f wh
ich
pri
vate
10�
0.2
0.2
0.3
0.5
(2.1
)(2
.2)
(3.2
)(3
.2)
3.1
7.8
5.1
Res
idua
l (in
form
al s
ecto
r)2.
32.
52.
93.
5(2
2.0)
(22.
1)(2
3.9)
(23.
9)2.
54.
42.
5
Tot
al d
omes
tic
empl
oym
ent
repo
rted
9.2
9.9
11.8
14.4
2.5
––
––
––
adju
sted
10.3
11.3
12.4
14.7
100.
010
0.0
100.
010
0.0
2.3
3.1
2.1
Un
empl
oym
ent
0.3
0.6
0.8
1.4
2.8
4.8
5.7
8.8
16.5
9.3
7.8
Tot
al d
omes
tic
labo
r fo
rce
repo
rted
9.5
10.5
12.6
15.8
––
––
––
2.9
adju
sted
10.6
11.9
13.2
16.1
––
––
2.8
3.4
2.5
Sour
ce: A
ssaa
d (1
997)
usi
ng
the
follo
win
g st
atis
tical
sou
rces
: Mai
n s
ourc
e: C
APM
AS,
LFS
S (1
977,
198
1, 1
984,
199
2); e
xcep
tion
incl
udes
:•
Gov
ern
men
t em
ploy
men
t for
197
7 is
est
imat
ed b
ased
on
sh
are
in 1
976
cen
sus.
•Pu
blic
en
terp
rise
em
ploy
men
t fo
r 19
77,
1981
, 19
84 i
s fr
om Z
ayto
un (
1991
) an
d is
bas
ed o
n fi
gure
s fr
om t
he
Publ
ic E
nte
rpri
se I
nfo
rmat
ion
Cen
ter
(PE
IC).
Est
imat
e fo
r 19
92 is
from
LFS
S.•
Man
ufac
turi
ng
empl
oym
ent
in P
ublic
En
terp
rise
s is
fro
m H
ando
ussa
(19
91a)
an
d is
bas
ed o
n d
ata
from
PE
IC. E
stim
ate
for
1992
is
base
d on
sh
are
ofm
anuf
actu
rin
g ca
lcul
ated
from
PE
IC d
ata.
•Pr
ivat
e 10
�em
ploy
men
t is
from
CA
PMA
S, E
mpl
oym
ent,
Wag
es a
nd
Hou
rs o
f Wor
k B
ulle
tin
(va
riou
s ye
ars)
. Fig
ures
for
1981
wer
e in
terp
olat
ed.
N.B
. Sev
eral
sou
rces
wer
e us
ed to
com
pile
this
tabl
e. D
ue to
pos
sibl
e in
con
sist
enci
es b
etw
een
sou
rces
, est
imat
es a
re o
nly
indi
cati
ve o
f un
derl
yin
g tr
ends
.
Not
es1
As
a pr
opor
tion
of a
djus
ted
tota
l em
ploy
men
t, ex
cept
for
unem
ploy
men
t wh
ich
is g
iven
as
a pr
opor
tion
of a
djus
ted
labo
r fo
rce.
2A
gric
ultu
ral e
mpl
oym
ent w
as a
djus
ted,
set
tin
g th
e ra
tio
of fe
mal
e em
ploy
men
t to
the
fem
ale
man
pow
er b
asis
(12
–64)
at t
he
1991
leve
l.
less than ten workers and employment outside establishments, has beenan important sector for labor absorption, especially since the mid-1980s,accounting for almost a quarter of total employment and over 40 percentof non-agricultural employment in 1992. Indeed, the informal sector hasaccounted for nearly as many jobs as the government sector (excludingthe public enterprises) both in 1984 and 1992 (almost 24 percent).17
The slowdown in the growth of this sector in the early 1990s may be anindication of saturation, and expectations of the informal sector as a mainabsorber of labor in the future may be misplaced.
Table 8.9 updates the distribution of employment growth up to 1998.Assaad (1999) reports that the government sector was still the fastestgrowing and largest contributor to employment creation. Between 1988and 1998, while the public enterprise sector divested itself of labor,government employment continued to grow at 4.8 percent per year –double the rate of growth of overall employment. Female governmentemployment grew at higher rates than male employment. Growth in agri-cultural employment was slower than in any other sector during 1988–98,while growth in private non-agricultural employment was maintained atroughly 3 percent per annum, and was confined almost exclusively tomales. Male wage employment in this sector grew at a faster rate thanemployment in the rapidly growing government sector, while the declinein female employment occurred in the non-wage part of the sector.
The foregoing pattern of sectoral and gender employment indicatesthat the private non-agricultural sector has offered employment over-whelmingly to the male portion of the labor force. Educated females relyincreasingly on government employment. Assaad et al. (1999) discuss anumber of factors that curtail women’s employment in the private non-agricultural sector. First, Egypt has had limited success with the promotionof labor-intensive export industries, which have absorbed young femalelabor in other countries. Second, labor laws in Egypt impose a number offemale-specific mandates on employers, including generous maternityleaves and child care provisions, which increase the costs of hiring women.Third, private employers commonly perceive women to be less attached tojobs, pointing to high rates of absenteeism and a lack of willingness towork long hours. Fourth, a variety of social norms prevent women fromengaging in casual wage labor or self-employment. These factors raise thebarriers to entry of females into the private sector, and make governmentthe employer of last resort for young educated women. With the effectivesuspension of the program of guaranteed employment since the mid-1980s, educated females find it increasingly difficult to find suitable wageemployment. Those who cannot find suitable employment in the govern-ment sector join the ranks of the open unemployed.
Labor force and employment 241

Tab
le 8
.9Se
ctor
al d
istr
ibut
ion
of e
mpl
oym
ent g
row
th b
y ge
nde
r, 1
988–
98 (
perc
ent)
Sect
orM
ale
Fem
ale
Tot
al
Shar
e of
gro
wth
Ann
ual r
ate
Shar
e of
gro
wth
Ann
ual r
ate
Shar
e of
gro
wth
Ann
ual r
ate
of g
row
thof
gro
wth
of g
row
th
Publ
ic s
ecto
rG
over
nm
ent
55.6
�4.
528
.1�
5.4
41.8
�4.
8Pu
blic
en
terp
rise
s�
11.2
�2.
3�
2.9
�4.
1�
7.0
�2.
6Su
b-to
tal p
ublic
sec
tor
44.4
�2.
625
.2�
4.3
34.7
�3.
0
Priv
ate
agri
cultu
reW
age
wor
k2.
7�
0.6
�3.
5�
6.3
�0.
04�
0.2
Non
-wag
e w
ork
�28
.6�
3.1
82.4
�4.
427
.4�
1.9
Sub-
tota
l pri
vate
agr
icul
ture
�25
.9�
1.9
78.9
�4.
126
.9�
1.6
Priv
ate
non-
agri
cultu
reW
age
wor
k61
.0�
4.7
2.6
�1.
631
.6�
4.3
Non
-wag
e w
ork
20.5
�2.
6�
6.8
�2.
76.
7�
1.3
Sub-
tota
l pri
vate
non
-agr
.81
.5�
3.9
�4.
1�
1.0
38.3
�3.
0
Tot
al10
0.0
�1.
910
0.0
�3.
410
0.0
�2.
5
Sour
ce: A
ssaa
d (1
999)
; sta
tist
ical
sou
rces
: LFS
S (1
988)
an
d E
LM
S (1
998)
.

The government employment guarantee program
The government has been an important generator of employment in theEgyptian economy since the early 1960s, and its policy of providingemployment for university graduates has had a far-reaching impact on theworkings of the labor market. Several writers – e.g. Handoussa (1991a),Radwan (1997), Assaad (1995, 1997, 1999), Fergany (1991), Karshenas(1994) – have identified government employment policies as the rootcauses for various phenomena observed in the labor market today, such asthe mismatch between educational outcomes and skills, inefficiencies inproduction in both public and private sectors, and patterns and levels ofunemployment. The following account of the government’s employmentguarantee program and its development within the broader economicframework over the past three decades or so owes much to Assaad’s(1995) important study, which models the effects of public sector hiringpractices on employment and wage setting in the labor market.
The employment guarantee program (EGP) began in 1961 as part ofthe extensive nationalization and employment drives of the Nasserregime, essentially guaranteeing employment to university graduates. Thisguarantee was later extended in 1964 to include graduates of vocationalsecondary school and technical institutes. These policies were matched byefforts to expand access to higher education, in an attempt to replaceexpatriate labor that left the country after the Suez Crisis in 1956.Coupled with the abolition of fees for higher education in 1963, the EGPled to a surge in the demand for education in general, and higher educa-tion in particular. Assaad (1995) reports that enrolment in higher educa-tion increased from 50,000 in 1953 to over 97,000 in 1962. Moreover,since establishing a university place in science or engineering cost aboutfive to six times that of a place in general arts subjects, the bulk of admis-sions occurred in the latter fields. Graduates applied to the Ministry ofManpower and Training, which then allocated them to different govern-ment authorities, including public sector enterprises. In 1978, the publicenterprise sector was divorced from this policy and was allowed more flexi-bility in hiring practices. Thereafter, the brunt of the graduate employ-ment scheme fell entirely on the government (civil service).
The government employment drive was sustained by huge inflows ofrevenues in the 1970s and early 1980s from the Suez Canal, oil exports,workers’ remittances, and tourism, which together accounted for about 45percent of GDP in the early 1980s. Government employment in 1976–86grew faster than any other sector and at more than twice the overallgrowth rate of employment. The result was overstaffing of the governmentbureaucracy, and a skewing of the mixture towards graduates of interme-diate education, with unfortunate consequences for productivity. In fact,Assaad (1996b) estimated marginal productivity in the governmentas negative, or at best zero. While there appeared to be a “shortage” of
Labor force and employment 243

university graduates for government appointments between 1976 and1983, appointments of applicants with intermediate education consistentlyexceeded the numbers requested by the different government depart-ments; Fergany (1991) calculates that the number of appointments in1982 was 2.6 times the number requested.
The economic burden of such a policy was unsustainable, and while thegovernment did not publicly announce a suspension of the EGP, it did soin practice by prolonging the waiting period for appointment. Assaad(1995) reports that in 1995, the last cohorts of graduates appointed in thegovernment were those of 1983 university graduates and 1982 of voca-tional secondary and technical institute graduates, with a waiting period ofat least five years for the first group and six years for the second.
Assaad (1995) contends that such a policy resulted in two undesirableoutcomes. The first was the long queuing by graduates for governmentemployment. In order to be eligible for government employment underthe EGP, a graduate was required to be unemployed.18 Those in the queuefor government jobs, therefore, had necessarily to list themselves as unem-ployed, thus elevating the observed unemployment rates among gradu-ates. The second was adverse selection into government employmentbecause of the first-come-first-served hiring practice. With longer waitingperiods, the better qualified graduates were more likely to find employ-ment in the private sector and drop out of the queue, leaving for thegovernment only those who were not able to secure a job elsewhere. Theresult was a systematic overstaffing of government bureaucracy at lowlevels of skills and productivity. There are indications, however, that somegraduates retained their position in the queue while working in theprivate sector, in order to qualify for the more secure employment in thegovernment sector.
The EGP also contributed to a higher feminization of the governmentworkforce. This may reflect discrimination against educated women in theprivate non-agricultural sector, but it may also reflect a greater preferenceamong females for the stable and protected jobs in the government. Thisis evidenced by the impressive growth rate of female government employ-ment during 1976–86 and the significant share of government in overallfemale employment. Educated females are also more likely to remain inthe job queue, which is reflected in the higher open unemployment ratesrecorded for females. Among educated females, those with vocational sec-ondary education (especially those with diplomas in commerce) were theleast able to find employment.
Government employment policies distorted wage-setting mechanismsin the labor market. Assaad (1995) argues that the magnitude of govern-ment sector employment, coupled with the non-market determination ofpublic sector wages, affected wages in the private sector in two ways. First,wages and benefits set for government employees acted as a floor forwages expected by graduates in other sectors in the economy, which artifi-
244 Labor force and employment

cially raised the relative cost of their labor and reduced their employabilityin the private sector. Second, by setting a wage floor for graduates in thepublic sector, the demand for intermediate and university education wasartificially inflated, encouraging a shift of resources to these educationallevels at the expense of basic education.
Zaytoun (1991) showed that, with the exception of manufacturing andservices, government wages were lower than wages in the private sector.However, after correcting for observed and unobserved differences inwages and properly accounting for non-pecuniary benefits, Assaad (1995)estimated that government wages could be comparable with, and mighteven exceed, private sector wages.19 Non-wage benefits included lower workeffort, access to subsidized commodities and housing, access to rents, andopportunities for moonlighting – practices tacitly tolerated as a means ofsupplementing falling real government wages.20 Coupled with thepremium on job security, as well as pension and disability benefits, theattraction of a government job to a graduate becomes evident. While wagesin the private sector were higher for males at all education levels, empiricaland econometric studies suggest that the premium received by privatesector workers was insufficient to offset the margin in non-wage benefits.
The story was slightly different for females, who faced larger genderwage gaps in the private sector. Given more egalitarian wage-setting prac-tices in the government sector, females with secondary and vocationaleducation developed a preference for government employment, andhence their overrepresentation in this sector, while females with universityeducation and higher faced fewer discriminatory barriers in the privatesector. The private–public wage gap was largest for graduates of secondaryand vocational education, which induced more of them to queue andhence explains the higher unemployment rates observed for this category.The sizeable proportion of non-pecuniary benefits of government wages,through its effects on wages in the economy at large, further acted toreduce estimated overall rates of return to education in Egypt, reported instudies such as Radwan (1997). The returns to primary and lower educa-tion were estimated at 5 percent, those to university education at 2percent, while those for technical and vocational (intermediate) educa-tion were negative. Intermediate education therefore appears to be thethreshold at which the government employment guarantee program hasits greatest distortionary effects.
The unemployment problem in Egypt: policy failures or institutionalconstraints?
Unemployment in Egypt in 2000 was characterized by four features. First,it was essentially a problem of the youth, with unemployment for the15–29 age group standing at 84 percent, the majority of them beingfirst-time job seekers. Second, unemployment was concentrated among
Labor force and employment 245

graduates of intermediate education, who accounted for nearly 55 percentof total unemployment. Third, unemployment remained more of a ruralthan an urban problem, with 52 percent of total unemployment beingattributed to the rural areas. Fourth, a severe gender bias existed, with theunemployment rate among women being double the national average andalmost 3.5 times that of males.
Identifying the primary causes of unemployment in Egypt is necessaryfor the formulation of an appropriate policy to resolve it. While govern-ment employment policies have contributed to the observed pattern ofunemployment, the growing consensus is that the chief problem is insuffi-cient demand for labor (Radwan 1997, 2002). As suggested by Galal(2002) and Radwan (2002), addressing the unemployment problem inEgypt requires reform of the broader economy by focusing on three mainareas. First, the demand for labor must be expanded by promoting labor-intensive growth. This requires maintaining a realistic exchange rate,improving the incentive structure to encourage investment and businessgrowth, removing the anti-export bias that results from high tariff rates,and simplifying labor regulations (the last two factors both tend to favorcapital-intensive techniques and therefore reduce the demand for labor).Second, the skills mismatch must be abridged and the supply of laborbetter aligned with market demand through education reform and effect-ive training. Third, the segmentation of and the rigidities in the labormarket must be reduced. These may have artificially raised the reservationwage and made nominal wages sticky downwards, although some evidenceby Radwan (1997) suggests that real wages are relatively flexible. A criticalissue for job creation in the immediate future is that of labor regulations,which raise the cost of employment but fail to provide protected employ-ment to a large and growing segment of the economy, namely the privatenon-agricultural and informal sectors.
246 Labor force and employment

9 Poverty and income distribution*
Modern investigations of poverty and income distribution in Egypt goback to 1977 and have proliferated in recent years. The principal analysesinclude Radwan and Lee (1977), Ikram (1980), Ibrahim (1982), Abdel-Khalek and Tignor (1982), World Bank (1991), Korayem (1996), UNDP(1996), El-Leithy and Osman (1996), Cardiff (1997), Radwan (1997), El-Leithy et al. (1999), Datt et al. (1997, 1999), Haddad and Ahmed (1999),MOP/World Bank (2002), Haddad and Ahmed (2003), and MOP/WorldBank (2004).
Each of these studies offers useful insights. However, they frequentlydiffer in approach and methodology, and thus their findings are notalways comparable. Nevertheless, some broad conclusions can be derived.
• Poverty increased between 1982 and 1996 and then decreased some-what by 2000.
• Poverty was relatively “shallow,” meaning that a large number ofhouseholds were clustered around the commonly used poverty lines.Hence, small differences in the level of the line could significantlychange the numerical estimate of the poor.
• The incidence of poverty was greater in rural than in urban areas, andthe incidence in Upper Egypt was substantially greater than in LowerEgypt.
• Poverty was associated with self-employment and employment incasual and unclassified activities. Wages were the most importantsource of income for the poor in both urban and rural areas, followedby agricultural income in rural areas.
• Poverty in rural areas was closely linked to lack of access and/orownership of productive assets, especially agricultural land, and toagricultural infrastructure services, such as irrigation. Income fromtransfers, including outside-village remittances, was an importantsource, especially in rural areas between the mid-1970s and the late1980s.
• The most important determinant of poverty was education, whichwas also the most important influence in the intergenerational

transmission of poverty. Demographic factors, especially family size,dependency ratios, and gender of household heads, also contributedsignificantly to poverty.
• Poverty in terms of capability deprivation worsened pari passu withincome deprivation. However, subjective interpretations of povertyshowed that the poor identified their status more with income short-falls than with capability shortfalls.
• Poverty characteristics remained relatively unchanged during1982–96. This led some observers to suggest that poverty in Egypt waschronic rather than transitory.
Trends in poverty, 1982–2000
While the estimates, especially for the earlier years, are not all derivedfrom exactly comparable methodologies, the trend indicates that povertyincreased between 1982 and 1996, and then decreased between 1997 and2000. An idea of the progression is provided by El-Leithy et al. (1999),which indicates that the incidence of poverty, using the upper definitionof poverty lines, increased from 24 percent in 1982 to 39 percent in 1991to 43 percent in 1996. Thereafter, according to MOP/World Bank (2002),it dropped to about 17 percent.1 Since the estimates for 2000 reflect asudden reversal of a longstanding trend, the two periods, 1982–96 and1997–2000, are examined separately.
Poverty trends, 1982–96
Although earlier years will be discussed, the main focus of this chapter willbe on the period 1991–2000. Most of the studies during this period reliedon the Household Income and Expenditure Surveys (HIES) of 1991,1996, and 2000; and their methodologies, although differing in details,showed more similarities of approach with each other than with theearlier group of studies. The insights of the 1997 survey carried out underthe auspices of the Ministry of Agriculture and IFPRI, and the 1999 panelstudy conducted by the latter organization, will also be used. Table 9.1summarizes the broad findings of the different studies.
Income/expenditure-based poverty measurements
Poverty estimates have proved sensitive to the poverty line used. However,the evidence is that poverty in Egypt increased between 1982 and 1996(Table 9.2 and Figures 9.1 and 9.2). El-Leithy et al. (1999) estimatepoverty incidence to have increased from 23.7 percent to 42.5 percent ofindividuals between the two dates. Poverty appears to have grown fasterover the first half of the 1990s than it did between 1982 and 1991. Ruralpoverty was higher than urban poverty, although urban poverty was
248 Poverty and income distribution

Poverty and income distribution 249
Table 9.1 Estimates of poverty in Egypt, 1959–96 (percent)1
Unit 1959 1975 1977 1982 1991 1996 1997
Urban areasWorld Bank (1990)2 indiv – – – 21.0 – – –World Bank (1995) indiv 30.0 34.5 – 22.5 – – –Korayem (1994)3 hhld – – – 30.4 35.9 – –El-Leithy (1994)2 hhld – 44.0 – 30.0 35.9 – –Cardiff (1997) hhld – – – – 12.6 30.8 –EHDR (1996) indiv – – – 33.5 39.0 45.0 –El-Leithy et al. (1999) indiv – – – 26.0 36.8 42.9 –Datt et al. (1999) indiv – – – – – – 23.1
Rural areasRadwan and Lee (1977) indiv – – 56 – – – –World Bank (1990)2 indiv – – – 25.0 – – –World Bank (1995) indiv 35.0 44.0 – 24.2 – – –Korayem (1994) hhld – 50.9 – 29.7 56.4 – –El-Leithy (1994)2 hhld – 41.9 – 27.8 34.1 – –Cardiff (1997) hhld – – – – 32.2 55.2 –EHDR (1996) indiv – – – 26.9 39.2 50.2 –El-Leithy et al. (1999) indiv – – – 23.0 41.3 41.9 –Datt et al. (1999) indiv – – – – – – 29.1
All EgyptCardiff (1997) hhld – – – – 20.7 44.3 –EHDR (1996) indiv – – – – – 48.0 –El-Leithy et al. (1999) indiv – – – 23.7 39.1 42.5 –Datt et al. (1999) indiv – – – – – – 26.5
Source: See references within table.
Notes1 Poverty estimates based on upper expenditure-based poverty lines, unless otherwise stated.2 Poverty estimates as presented in El-Leithy et al. (1999).3 Poverty measurements for 1981/82 are based on income poverty lines.
Per
cent
age
50
45
40
35
30
25
20
15
101974–75 1981–82 1990–91 1995–96
Card97EHDR96K96L94WB95 LKR99
Figure 9.1 Incidence of urban poverty, 1975–96 (percent) (source: based on El-Leithy et al. (1999) and UNDP (1996)).

deeper. Estimates of rural poverty in 1996 ranged between 42 percent byEl-Leithy et al. (1999) and 55 percent by Cardiff (1997), while urbanpoverty ranged between 31 percent (Cardiff) and 45 percent (UNDP1996). The figures must be taken as indicative of the trend; the preciseincrease across the two points, especially by urban/rural distribution, isnot easy to determine because of the different starting levels of povertyestimated by the different studies.
In studies that provided poverty estimates according to upper andlower poverty lines, such as UNDP (1996) and El-Leithy et al. (1999), theurban/rural gap in poverty measurements was generally bigger when theupper poverty line was used (see Table 9.2). The expenditure distribution
250 Poverty and income distribution
Table 9.2 Poverty measurements, 1982–96 (percent)
1981/82 1990/91 1995/96
Urban Rural Urban Rural Urban Rural
Lower poverty lineHeadcount (P0) , 18.2 16.1 , 20.3 28.6 ,22.5 23.3Poverty gap (P1) , 3.5 3.1 , 4.3 4.5 , 4.9 4.3Poverty severity (P2) , 0.9 0.8 , 1.1 1.4 , 1.6 1.2Poverty line at current prices (LE) ,138.6 109.7 ,556.0 423.0 ,968.4 696.2Poverty line at 1990/91 prices (LE) ,555.0 422.0 ,556.0 423.0 ,549.4 430.9Real per capita expenditure (LE) 1,107.0 733.0 1,088.0 724.0 1,002.0 639.0
Upper poverty lineHeadcount (P0) , 33.5 26.9 , 39.0 39.2 , 45.0 50.2Poverty gap (P1) , 6.5 4.2 , 10.8 12.0 , 12.8 12.5Poverty severity (P2) , 3.5 1.6 , 4.0 4.5 , 4.9 4.2Poverty line at current prices (LE) ,182.0 122.0 ,739.0 502.0 1,326.0 924.0Poverty line at 1990/91 prices (LE) ,729.0 472.0 ,739.0 502.0 ,743.0 568.0
Source: UNDP (1996).
Per
cent
age
60555045
3530252015
1974–75 1981–82 1990–91 1995–96
Card97EHDR96K96L94WB95 LKR99
40
Figure 9.2 Incidence of rural poverty, 1975–96 (percent) (source: based on El-Leithy et al. (1999) and UNDP (1996)).

in 1996 was relatively flatter, or more equitably dispersed, compared with1991. Indeed, despite an unambiguous increase in overall povertybetween 1991 and 1996, Cardiff (1997), El-Leithy and Osman (1996), andEl-Leithy et al. (1999) reported an improvement in distribution over thesame period, as measured by the Gini index. Lorenz curves and the associ-ated Gini indexes between 1982 and 1996 are shown in Figure 9.3(a–c).
Cardiff reported an overall improvement in the income distributionbetween 1991 and 1996, with greater improvement in urban areas than inrural, which, however, was attributed more to a decline in the share of thetop quintile than to an increase in the share of the lowest distribution. El-Leithy et al. (1999) found that, based on expenditure distribution, the urbandistribution remained relatively stable during 1982–96, with a Gini coeffi-cient at about 0.34. Rural inequality seems to have considerably worsenedbetween 1982 and 1991 (Gini of 0.26 and 0.37, respectively), butimproved between 1991 and 1996. These figures and other studies suggestthat rural poverty (using the lower poverty line) tends to decrease orworsen more in line with improvements or deterioration in distributionthan with decreases or increases in per capita consumption levels. In con-trast, in urban areas, where inequality is generally higher but hasremained fairly unchanged, increases in poverty levels are more likely toresult from declines in per capita consumption levels.
The lack of consensus on the magnitudes and location of an improve-ment in distribution requires some discussion. In addition to the higherrural representation in the 1996 HIES sample, the distributional patternsdisplayed by the HIES for both data points have been criticized. Korayem(1992), Bartsch (1997), and Fergany (1998a) have pointed to discrepan-cies between income and expenditure data provided by the HIES and thenational income accounts. When aggregated to the national level, incomeand expenditure figures provided by the HIES are generally lower thanthose provided through national income accounts.
Fergany (1999) attributes this primarily to the truncation of the distrib-ution at its upper end – richer households frequently are excluded fromthe survey, either because they refuse to participate or because of under-reporting. The exclusion of the rich from the survey therefore results ingreater homogeneity in income and expenditure levels among the non-rich, or a more equitable distribution that is skewed towards lower expen-diture levels. This is precisely what is captured by the data in Cardiff(1997), UNDP (1996), and El-Leithy et al. (1999).
The picture is significantly altered if the rich are included in theinformation base. Using the 1991 HIES, Bartsch (1997) attempted to rec-oncile the survey estimates with national accounts figures by augmentingthe expenditure of the highest expenditure brackets, so that total house-hold expenditure as implied by the HIES was consistent with householdconsumption in the national accounts. This procedure ensured thatexpenditures at the lower brackets were unchanged.2 The resulting
Poverty and income distribution 251
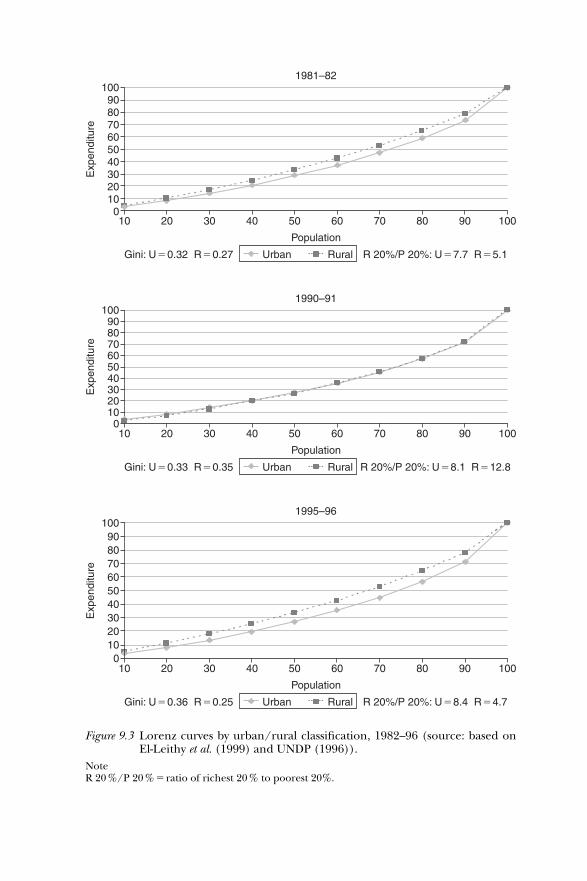
Exp
endi
ture
100
100
9080706050403020100
1981–82
908070605040302010
Population
Gini: U�0.32 R�0.27 R 20%/P 20%: U�7.7 R�5.1RuralUrban
1990–91
Exp
endi
ture
1009080706050403020100
100908070605040302010
Population
Gini: U�0.33 R�0.35 R 20%/P 20%: U�8.1 R�12.8RuralUrban
1995–96
Exp
endi
ture
1009080706050403020100
100908070605040302010
Population
Gini: U�0.36 R�0.25 R 20%/P 20%: U�8.4 R�4.7RuralUrban
Figure 9.3 Lorenz curves by urban/rural classification, 1982–96 (source: based onEl-Leithy et al. (1999) and UNDP (1996)).
NoteR 20%/P 20% � ratio of richest 20% to poorest 20%.

Lorenz curve was much flatter than that produced by the unadjustedHIES data, implying a worse (more unequal) distribution, especially at thetails. Analyses involving distributionally sensitive measures in rural areasshould therefore be interpreted with caution.
The relatively flatter distribution of the HIES 1996, or the apparentclustering of households around the poverty line, has resulted in anumber of rank reversals in poverty trends over time. Dominance analysiscan help to determine the robustness of poverty measurements to thepoverty line used.3
Both the UNDP (1996) and El-Leithy et al. (1999) confirmed the exist-ence of trend reversal in rural areas between 1991 and 1996. Specifically,El-Leithy et al. (1999) show that the curve for the headcount index inurban areas for 1996 is everywhere above that of 1991 and 1982, whichimplies that poverty in urban areas rose steadily between 1982 and 1996.In rural areas, however, the curves for the headcount index in 1991 and1996 crossed at the poverty line value of LE 507.4 Thus, for any povertyline below this figure rural poverty in 1996 was lower, and for any povertyline above it rural poverty in 1996 was higher, than in 1991. Conversely,the 1991 line is everywhere above the 1982 line, implying that poverty in1991 was unambiguously higher than in 1982.
Other indicators of poverty also register an increase in poverty in thefirst half of the 1990s. For instance, using the World Bank measure of $1per day (at 1985 purchasing power parity) per capita, the proportion ofpoor people in 1994 was estimated at 6.1 percent of the population, upfrom 5.6 percent in 1990. The World Bank measure is close to the ultrapoverty lines developed in UNDP (1996), El-Leithy et al. (1999) and Dattet al. (1999).
Capability deprivation in the 1990s
Owing particularly to the work of Amartya Sen (1984, 1985, 1992, 1997,1999) it is now recognized that income deprivation is but one aspect ofpoverty. A more comprehensive measure would take account of otherfactors – such as access to education, health care, nutrition, and, indeed,the freedom to make choices – that abridge the capabilities of individuals.As Sen puts it:
A society’s standard of living should be judged not by the average levelof income, but by people’s capabilities to lead the lives they value. Norshould commodities be valued in their own right – they shouldinstead be seen as ways of enhancing such capabilities as health, know-ledge, self-respect, and the ability to participate in community life.5
If income poverty deteriorated between 1982 and 1996, poverty in termsof capability deprivation fared even worse. The UNDP (1996) estimated a
Poverty and income distribution 253

Capability Poverty Measure for Egypt in 1995 based on: (1) the proportionof children under five who were underweight; (2) the proportion of birthsunattended by a doctor and/or trained nurse/midwife; and (3) the pro-portion of female household population age six and over with no educa-tion. On the basis of these indices, as can be seen from the last twocolumns of Table 9.3, Egypt performed worse in terms of human povertythan income poverty.
The figures in Table 9.3 underscore the gravity of the situation in ruralareas. The prevalence of chronic undernutrition, reflected by stuntingand/or wasting and low height for age, was particularly high among ruralchildren. Access to basic health care services was also severely lacking, withthe proportion of unattended births in rural areas more than double thatin urban areas. Moreover, the high incidence of female illiteracy reflecteddeprivation from the means that enable command over resources, whichwas particularly acute in rural areas. All three measures pointed to aserious shortfall in human capability in rural areas when compared withthe income shortfall. On the other hand, relatively greater access to edu-cation and basic health services in urban areas contributed to a relativelyhigh capability measure (low capability shortfall). The urban poor suf-fered more from income shortfalls than from capability deficits.
The Human Development Index (HDI) and Human Poverty Index(HPI), published in the UNDP’s Human Development Report for 1997 and2000, further underscore the shortfall in human capital-related indicators.In 1994, the HPI ranked Egypt 44th among 78 countries; on the HumanDevelopment Index (HDI), Egypt ranked 109th among 175 countries.While income-based measures of poverty (US$1 per day in 1985 PPP$)placed 8 percent of the population under the poverty line, almost 35percent of the population suffered from human poverty. In 1998, Egypt
254 Poverty and income distribution
Table 9.3 Capability poverty and income poverty, 1995 (percent)
Underweight Unattended Females Proportion Proportionchildren births with no people people
education capability income poor poor
Urban 9.9 32.1 20.8 33.9 22.5Rural 14.1 67.2 47.8 20.9 23.3Egypt 12.5 53.7 35.4 43.0 22.9Metropolitan gov.tes 9.1 30.8 20.4 20.1 16.0Lower Egypt 9.6 48.6 33.0 30.4 17.1
Urban 8.8 24.9 18.8 17.5 21.7Rural 9.9 56.1 38.9 35.0 15.4
Upper Egypt 16.1 67.8 48.3 44.1 34.1Urban 11.0 40.4 24.1 25.2 35.0Rural 17.8 77.1 59.1 51.3 33.7
Source: UNDP (1996).
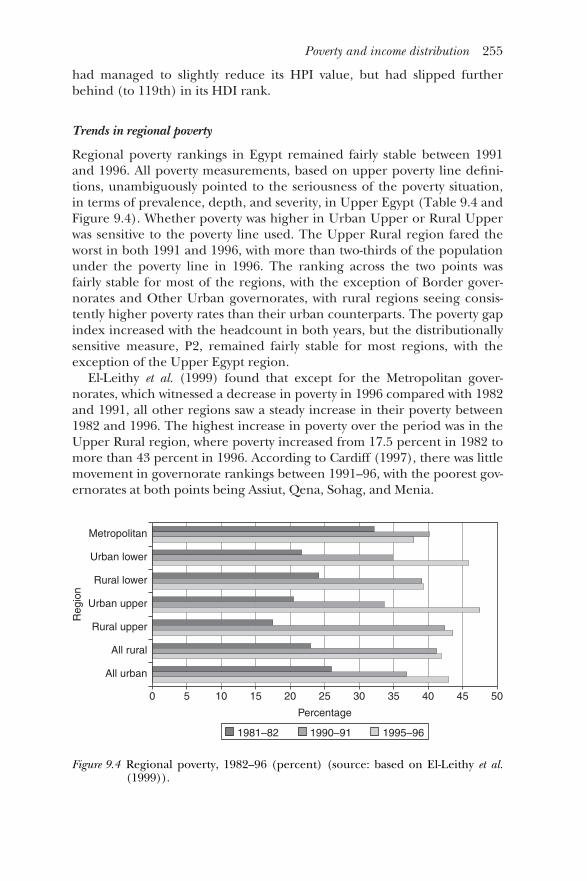
had managed to slightly reduce its HPI value, but had slipped furtherbehind (to 119th) in its HDI rank.
Trends in regional poverty
Regional poverty rankings in Egypt remained fairly stable between 1991and 1996. All poverty measurements, based on upper poverty line defini-tions, unambiguously pointed to the seriousness of the poverty situation,in terms of prevalence, depth, and severity, in Upper Egypt (Table 9.4 andFigure 9.4). Whether poverty was higher in Urban Upper or Rural Upperwas sensitive to the poverty line used. The Upper Rural region fared theworst in both 1991 and 1996, with more than two-thirds of the populationunder the poverty line in 1996. The ranking across the two points wasfairly stable for most of the regions, with the exception of Border gover-norates and Other Urban governorates, with rural regions seeing consis-tently higher poverty rates than their urban counterparts. The poverty gapindex increased with the headcount in both years, but the distributionallysensitive measure, P2, remained fairly stable for most regions, with theexception of the Upper Egypt region.
El-Leithy et al. (1999) found that except for the Metropolitan gover-norates, which witnessed a decrease in poverty in 1996 compared with 1982and 1991, all other regions saw a steady increase in their poverty between1982 and 1996. The highest increase in poverty over the period was in theUpper Rural region, where poverty increased from 17.5 percent in 1982 tomore than 43 percent in 1996. According to Cardiff (1997), there was littlemovement in governorate rankings between 1991–96, with the poorest gov-ernorates at both points being Assiut, Qena, Sohag, and Menia.
Poverty and income distribution 255
Reg
ion
Metropolitan
Urban lower
Rural lower
Urban upper
Rural upper
All rural
All urban
50454035302520151050
Percentage
1981–82 1990–91 1995–96
Figure 9.4 Regional poverty, 1982–96 (percent) (source: based on El-Leithy et al.(1999)).

Tab
le 9
.4R
egio
nal
inci
den
ce o
f pov
erty
(P 0
), 1
982–
96 (
perc
ent)
Reg
ion
1981
–82
1990
–91
1995
–96
1997
El-L
eith
yet
al.2
Kor
ayem
C
ardi
ff El
-Lei
thy
et a
l.2C
ardi
ff El
-Lei
thy
et a
l.2D
att e
t al.2
(199
9)(1
994)
(199
7)(1
999)
(199
7)(1
999)
(199
9)
Met
ropo
litan
32.2
46.6
–40
.2–
37.9
26.1
of w
hich
:C
airo
––
8.3
–20
.0–
–A
lexa
ndr
ia–
–18
.6–
40.5
––
Oth
er u
rban
––
9.4
–4.
2–
–L
ower
urb
an21
.651
.411
.634
.832
.745
.824
.2L
ower
rur
al20
.547
.522
.533
.646
.439
.326
.9U
pper
urb
an24
.261
.115
.839
.140
.347
.617
.1U
pper
rur
al17
.582
.444
.942
.467
.543
.631
.7B
orde
r ur
ban
–28
.319
.41
–30
.41
––
Bor
der
rura
l–
81.1
––
––
–A
ll ur
ban
25.9
–12
.6–
30.8
42.9
23.1
All
rura
l22
.9–
32.2
–55
.241
.929
.1A
ll E
gypt
23.6
–20
.7–
44.3
42.5
26.5
Sour
ce: S
ee r
efer
ence
s w
ith
in ta
ble.
Not
es1
Est
imat
es a
re fo
r bo
th u
rban
an
d ru
ral b
orde
r.2
Bas
ed o
n u
pper
defi
nit
ion
of t
he
pove
rty
line.

Characteristics of the poor: poverty profiles
Poverty is often associated with a number of socio-demographic and eco-nomic characteristics that are used to construct a poverty profile. Compar-isons of poverty profiles over time can provide some insights into thesocial and economic dynamics of poverty.
Amidst evidence of rising poverty in Egypt, the poverty profileremained virtually unchanged between 1982 and 1996, indicating a persis-tence of the socio-economic correlates of poverty in influencing povertylevels and dynamics. The poor remained closely associated with largerhouseholds, a larger proportion of the young population to support peradult working member, illiteracy and low education levels, employment incasual and informal activities in agriculture and construction sectors, andwith female headship of the household. The poor typically faced higherprices and had fewer sources of income than the non-poor.
The design and format of the 1991 and 1996 HIES allowed the con-struction of fairly informative poverty profiles at both the national andregional levels. Information to gauge some characteristics of the poorprior to 1990 was limited either in scope (such as the 1982 HouseholdBudget Survey) or coverage (such as the ILO 1977 rural survey). Yet someof the poverty correlates suggested by these early surveys continued to beidentified by more recent investigations, including the IFPRI/EIHS 1997.
Poverty profiles: 1977–82
Radwan and Lee (1977) provided the earliest reference to a rural povertyprofile. In 1977, the chronically poor in rural Egypt (the bottom 10percent of the income distribution) depended heavily on transfer pay-ments and remittances, had a high proportion of disabled people, higherdependency ratios, and a higher proportion of single-member householdsheaded by old persons. In addition, the poor were mostly landless andwith limited access to productive assets.
In 1982, urban poverty was associated with industrial and services occu-pations, while rural poverty was closely linked to agricultural employmentand self-employment. Poverty in both urban and rural areas was alsohigher among households whose head was out of the labor force or inunclassified occupations.
Poverty profiles: 1991–97
Household composition
Poverty was positively related to household size and dependency ratios. Poorpeople lived in large households of 6.2 members in 1996, compared to 4.4for the non-poor. Ultra-poor individuals in 1997 lived in families of 8members, compared to 5.4 members for the non-poor. Household size for
Poverty and income distribution 257

the poor was higher in rural than in urban areas (6.8 and 5.4 members,respectively). Poor households also had a higher proportion of dependants.In 1996, the dependency ratio was 72 percent for poor households and 51percent for non-poor households, i.e. on average, every 100 workingmembers in poor households supported 72 individuals, while every 100working members in non-poor households supported only 51 individuals.Higher dependency was a cause of poverty because it implied a higher con-sumer:earner ratio. The situation was particularly acute in Rural UpperEgypt, where the dependency ratio for the poor exceeded 100 percent.
The dependency in poor households was chiefly accounted for by chil-dren less than 12 years of age; thus Datt et al. (1999) reported that in1997, children accounted for almost 90 percent of dependency in bothurban and rural poor households. Poverty in both 1991 and 1996 variedpositively with the number of children in the household, despite the rankreversal in 1996 observed for very large households (6� children).6
Moreover, poverty was higher for households whose heads were at thetails of the age distribution and for female-headed households. Poorhouseholds in both 1991 and 1996 had very old and very young householdheads (Cardiff 1997). Poverty was also higher for female-headed house-holds, especially in urban areas. Poverty incidence, depth, and severitywere greater for female-headed compared with male-headed householdsin both urban and rural areas, despite the near equality of average realper capita consumption across the two groups. However, Datt et al. (1999)found that the gender difference was statistically significant only in urbanareas, implying a higher degree of income inequality among urbanfemale-headed households.
Educational characteristics
Education was the most influential determinant of poverty. Poverty wasinversely related to educational attainment. Households whose heads wereilliterate or with little education fared worst in both data points and sawtheir poverty rates double between 1991 and 1996. Even a minimum ofeducation impacted on the household’s vulnerability to poverty. In both1991 and 1996, the poverty rates for the category “reads and writes” werehigh but still below the national average. However, poverty also started toappear among university graduates, probably because of the persistentand high unemployment rates affecting this group since the early 1990s(see Chapter 8). The appearance of income poverty among this groupunderlined the extent of distortions in the Egyptian economy in generaland the labor market in particular, wherein wealth in human capital andcapability received poor economic rewards.
Education was a more important determinant in escaping poverty inurban areas than in rural. In all urban regions in 1996, the incidence ofilliteracy and lower educational attainments among poor household heads
258 Poverty and income distribution
was double the levels for the non-poor, with a relatively smaller gap in therural regions between poverty groups. The situation was worst in theUpper Rural region, where over 88 percent of poor household heads hadless than primary education, if any.
Datt et al. (1999) discuss gender and geographic disparities in educa-tional attainments of poverty groups. Poor individuals on averageachieved 4.4 years of schooling compared to seven years for the non-poor.Moreover, within poverty groups, the urban poor attained 5.6 years ofschooling compared to only 3.5 years for the rural poor, and poor malesattained 5.7 years of education compared to only 3.1 for females.
Educational attainment of the household head had important inter-generational consequences on the dynamics of poverty. El-Leithy et al.(1999) found a strong relationship between the educational attainment ofthe household head and that of the household members. In 1996, forinstance, 74 percent of illiterate individuals in Egypt belonged to house-holds whose head was also illiterate, with the incidence larger in urbanthan in rural areas. Datt et al. (1999) reported that in 1997, about 64percent of poor individuals, and 76 percent of ultra poor individuals,above 15 years had not completed primary schooling, compared to anational average of 48 percent. Failure to complete primary education wasworse for poor women and the rural poor. This failure is partly corrobo-rated by evidence from El-Leithy et al. (1999), where the percentage ofnon-enrolment among poor children in Metropolitan areas was morethan four times the level for the non-poor, and where non-enrolmentamong poor children in rural areas was more than twice the proportion inurban areas. Not surprisingly, the poorest region, Rural Upper Egypt, hadthe highest incidence of non-enrolment (35 percent compared with anational average of 21 percent).
Several factors underlie the decision whether or not to enroll childrenin schools and, conditional upon enrolment, whether or not to continue.Datt et al. (1999) showed that the principal reasons among poor indi-viduals for dropping out of school, as well as never attending school, werefinancial considerations and lack of desire to continue.7 Financial consid-erations reflected the increasing opportunity cost of education experi-enced by poor people in the face of rising costs of education anddiminished opportunities for gainful employment once education wascompleted. El-Leithy et al. (1999) found that the rising costs of educationdisproportionately affected the poor in both urban and rural areas.Between 1991 and 1996, the real expenditure per capita on education forthe poor increased by 102 percent in urban areas and by 210 percent inrural areas. This compared with an increase for the non-poor of only 34percent in urban and 43 percent in rural areas.
The lack of desire to continue could also reflect the effect of poor acad-emic progress for poor children on their decision to continue enrolling.High repeater rates, particularly at the end of each cycle, tend to increase
Poverty and income distribution 259
the opportunity for school drop-out and child labor. In the face of risingcosts, poor families found it increasingly difficult to put up with pro-longed education cycles due to high repetition. Child drop-out because ofpoverty was therefore closely associated with child labor. In fact, in 1996,the proportion of working children (aged 6–15 years) among the poorwas three times higher than the non-poor in urban regions, and 1.5 timeshigher in rural regions.
Employment characteristics
Poverty was associated with self-employment and employment in casualand unclassified activities. Poverty was further associated with agriculturalactivities in rural areas and trade, construction, and transportation activ-ities in urban areas. Cardiff (1997) showed that the employmentcharacteristics of the poor remained fairly stable between 1991 and 1996.Poverty rates were least among wage earners in both 1991 and 1996 andhigher than the national average for the self-employed working alone. Asin 1991, poverty in 1996 was highest for households whose head was in the“unclassified” category, which comprised the 1991 groups of “unemployedadult” and “out of the labor force.”
Poverty rates were also highest for individuals in construction, agricul-ture, and trade and services. The poor were primarily engaged in agricul-tural and construction activities in both urban and rural areas, and inmanufacturing, trade, and transportation in urban areas.
Along gender lines, Datt et al. (1999) found salaried employment tobe the most important source of income for poor females in urbanareas but not in rural areas. They also found much higher poverty amongself-employed males in urban areas compared with rural areas. Self-employment was often associated with the informal sector, which wasmore prevalent in urban areas.
Income-earning characteristics
Poverty was inversely related to the number of income earners in thehousehold. Poverty was highest among single earner families in both 1991and 1996. The data for 1996 showed an interesting rank reversal that maysuggest some diseconomy from increasing earners. Cardiff (1997) suggeststhat the data perhaps capture a breakdown in the relationship betweenpotential income contributors and household economic well-being, asindividuals rely less on the extended family as a mechanism to cope withpoverty.
Wages were the most important source of income for the poor in bothurban and rural areas, followed by agricultural income in rural areas. In1996, income from transfers and receipts made up more than a third oftotal income of the poor in urban areas and almost a quarter in rural
260 Poverty and income distribution

areas. According to the UNDP (1996), outside-village remittances were animportant source of income for both landless and landed households inrural areas between mid-1970s and late 1980s. There was a considerabledecline in the flow of these remittances starting in the early 1990s becauseof the Gulf war on the one hand, and increased unemployment in urbanareas on the other. Unfortunately, the income section of the HIES in bothyears does not allow for a proper analysis of the sources of income of thepoor. Transfer receipts and remittances, particularly important for thepoor, are lumped with income sources in the “others” category. Accordingto El-Leithy et al. (1999), average yearly per capita income from wages andtransfers in 1996 for the urban poor was LE 1,105 and LE 900, respec-tively. In rural areas, average yearly per capita income for the poor fromwages, agricultural income, and transfers was, respectively, LE 788, LE558, and LE 509.
Consumption patterns
Household budgets were largely consistent with “Engel’s Law,” in thatfood took up a larger share of the budgets of poor households. In 1991the urban poor spent 58 percent of their budget on food, compared with46 percent by the non-poor; in 1996 the respective figures were 53 percentand 43 percent. In rural areas, the poor in 1991 devoted 63 percent oftheir total expenditures to food, compared with 57 percent by the non-poor; in 1996, the respective shares were 60 and 53 percent. Moreover,while average total expenditure per capita in real terms for both the poorand non-poor declined in urban areas between 1991 and 1996, itincreased for the poor and declined for the non-poor in rural areas.These patterns reflect the improved distributional characteristics of therural sample in 1996 referred to earlier.
Expenditure patterns reflected the rising costs of living in urban areas,especially that of education. Whereas real total per capita expenditures forthe poor declined by 6 percent between 1991 and 1996, real averageexpenditure on education increased by more than 100 percent for thepoor and only 34 percent for the non-poor. A similar pattern was observedin rural areas, with real average expenditures on education for the poorincreasing by 210 percent compared to 43 percent for the non-poor.Rising education expenditures in urban areas were matched with reduc-tions in expenditures on items such as housing, transportation, health,and food.
Poor individuals in both urban and rural areas allocated larger expen-diture shares on cheaper food items, such as grains and starch (cereals),vegetables, and dry pulses, and smaller shares to more expensive fooditems such as fish, fruits, dairy products, or meat and poultry. Food subsi-dies played an important role in securing minimum caloric intakes for thepoor in both urban and rural areas. The food subsidy in Egypt in 2000
Poverty and income distribution 261
included four foods: baladi bread, baladi wheat flour, sugar, and oil.Baladi bread and wheat flour were universal, while oil and sugar wereavailable in restricted quotas to households with ration cards. Baladi breadwas the most important source of calories, providing almost 33 percent oftotal calories for the lowest expenditure quintile, and almost half of totalcalories from cereals in urban areas. In rural areas, subsidized baladibread and baladi wheat flour provided about 40–50 percent of total calo-ries. In both urban and rural areas, subsidized baladi bread and wheatflour are the cheapest sources of calories among the cereals group. Baladibread and wheat flour were also inferior commodities in urban areas, andto a lesser extent in rural areas. All four subsidized foods provided 44percent of total calorie availability for the lowest 20 percent of the expen-diture distribution.
Per capita income transfers because of subsidies on baladi bread andwheat flour amounted to LE 1.7 per week in urban areas and LE 1.4 inrural areas, with transfers declining in absolute terms with increasingincomes. Subsidies on these items therefore seem to have substantiallymitigated the adverse effects of deterioration in consumption on the poorin Egypt compared to other developing countries. Simulations involvingalternative scenarios for removing the food subsidies imply significantlosses to the poor, with implied savings in government expenditure insuffi-cient to offset the associated adverse effects on the poor. For instance,doubling the price of baladi bread would lead to a decline in the totalcosts of subsidizing all four goods by 47 percent, but it would also entail adecline of more than 60 percent in the value of income transfers providedby all four food subsidies in urban areas (with a smaller effect in ruralareas owing to their higher consumption of subsidized baladi wheat flourinstead of baladi bread). The institution of an alternative targeted systemwould entail higher costs of administration and geographic targeting,which may not justify the removal of the current subsidy system (Bouisand Ahmed 1999).
Ownership of productive assets and agricultural land
Poverty, in all its counts, was associated with landlessness and variedinversely with the size of landholding. Datt et al. (1999) showed thatpoverty in rural Egypt was highest among non-cultivators (35 percent com-pared with a total rural poverty incidence of 29 percent). Poverty inci-dence and severity also fell substantially with larger farm size. Poverty fellfrom a high of 35 percent for small farm cultivators to 7 percent for largefarm cultivators. Access to agricultural land therefore remained animportant determinant of the well-being of rural households.
The pronounced incidence of poverty among the landless was relatedto several socioeconomic characteristics of rural areas. The problemsarising from the limited amount of agricultural land in Egypt were
262 Poverty and income distribution

aggravated by an unequal distribution of landholdings and excessive landfragmentation at the low end of the size distribution. Per capita cultivatedarea was only 3.1 kirats in 1981 and further declined to 2.7 kirats in 1994.8
Moreover, UNDP (1996) reported that in 1990 almost 70 percent (2.7million) of land owners possessed land that was less than one feddan insize, and together they owned only 18 percent of total cultivated land. Inaddition, diverse forms of arrangements, including formal and informalrental contracts, as well as monetary and crop-sharing arrangements, gov-erned access to this land. Limited agricultural land and farm sizes farbelow those required by modern agriculture were therefore major con-tributors to rural poverty in Egypt. At the other end of the scale, 0.25percent of land owners (numbering about 9,000) possessed 15 percent ofthe total cultivated area.
Access to community facilities
Datt et al. (1999) found no statistically significant differences between thepoor and non-poor in access to community services, but did find that theultra poor were severely limited in their access to facilities such as school,hospitals, and markets.
How the poor perceived poverty
Through a Semi-Participatory Poverty Assessment approach, the UNDP(1996) was able to gauge people’s perceptions (both poor and non-poor)of poverty, and focus on how poor households lived and coped withpoverty. There was considerable convergence of views of both poor andnon-poor people on the meaning of poverty. Both groups associatedpoverty primarily with inadequate income, which led to depressed levelsof living on the one hand, and to frequent borrowing and begging on theother. Moreover, many poor households also identified insufficiency ofincome with the instability in its sources. This last element of poverty wasmotivated by the temporary types of employment typically associated withthe poor, such as casual labor and employment in informal activities.
In general, poor people identified themselves as poor when confrontedby a material criterion of well-being. For instance, when the poor weredirectly asked if they labeled themselves as “poor,” about 24 percent of allrespondents classified themselves as poor (16 percent in urban areas and31 percent in rural areas). When indirectly approached to define theirpoverty status in terms of their wealth ranking, more respondents identi-fied themselves as poor. The overall response was 36 percent, with urbanresponses of 23 percent and rural responses of 48 percent. The predomi-nance of rural poverty, both as a perception and a deprivation, is obvious.
In terms of how the poor perceived changes in poverty, only 23 percentof the poor reported an improvement in their living conditions between
Poverty and income distribution 263
1991 and 1996 – the percentage was higher in rural areas (24 percent)than in urban (20 percent). Of these 23 percent, the majority attributedthe improvement to factors such as improved general economic con-ditions and better employment opportunities. On the other hand, themajority of the non-poor attributed improved living standards to house-hold-specific factors such as reduced dependency, due to entrance bysome family members to the labor market, marriage, or migration.
However, 76 percent of the poor still reported a worsening in theirliving standards over the same period, with urban households reportedlybeing more adversely affected by the structural adjustment program thanrural households. Both the poor and non-poor attributed the deteriora-tion in living standards to causes such as inflation, unemployment, andeconomic stagnation. Nearly 25 percent of both poor and non-poor attri-buted this deterioration to family-specific causes such as retirement, oldage, sickness, or an increase in household size.
To sum up, the results indicate a distinct sectoral difference in povertylevels and attributes along an urban/rural classification, rather thanacross a regional classification. The results also indicate that poverty inUpper Egypt was substantially worse than in Lower Egypt. Significant dif-ferences existed in the schooling and education attainment levels betweenthe poor and non-poor. In fact, education emerged as the most importantdeterminant discriminating against the poor and influencing the inter-generational transmission of poverty. Demographic factors were alsoimportant in averting poverty, especially dependency ratios. Poverty inrural areas was closely linked with lack of access to, and/or ownership of,productive assets, especially agricultural land, and to adequate agriculturalinfrastructure services, such as irrigation. Despite observable shortfalls inhuman capability measures among the poor, subjective interpretations ofpoverty showed the poor to identify their status with income shortfallsrather than capability shortfalls. Poverty characteristics have remainedfairly unchanged over the past 25 years or so. The aggregate evidencetherefore suggests poverty in Egypt to be chronic in nature.
The determinants and sources of poverty
While poverty profiles are useful for policy purposes such as targetinginterventions, it is desirable to know the impact of proposed policy inter-ventions on poverty rates and dynamics. Some studies have gone beyondthe traditional poverty profile to provide “conditional” poverty analysis ofpolicy interventions. These studies typically assess the effect of policy on aparticular poverty correlate, given the other potential poverty correlates asidentified by the poverty profile.
The preceding analysis suggested that the chief correlates of poverty inEgypt had remained unchanged for at least two decades. This led somecommentators – e.g. Haddad and Ahmed (1999, 2003) – to suggest that
264 Poverty and income distribution
poverty in Egypt was “chronic” rather than “transient.” This has twoimportant implications. The first concerns our understanding of thecauses of poverty. The virtually unchanged nature of the poverty profileover two decades suggested that there were important social, economic,and demographic factors operating to reinforce, and sometimes aggra-vate, poverty trends and to favor the intergenerational transmission ofpoverty. In a study that included a panel survey in 1999 of households thathad previously been surveyed in 1997, Haddad and Ahmed (1999) foundthat households had had very limited mobility between consumptiongroups, and that almost half of the poor households in the panelremained below the poverty line across the two survey points. They identi-fied education and unemployment as critical factors perpetuating theeffects of poverty in Egypt.
The second implication concerns the type of policy intervention usedto target poverty groups. As argued by Haddad and Ahmed (1999), ifpoverty in Egypt is predominantly chronic in nature, then public policyneeds to address the fundamental determinants of economic growth,especially the provision of adequate and remunerative employmentopportunities. Chronic poverty also reinforces the case for targetedantipoverty interventions, such as food subsidies. If poverty in Egypt weretransient, the target would be shifting, and the appropriate policy wouldbe to aim at better smoothing of consumption for the poor, for example,through micro-credit programs or insurance instruments that the poorcould access.
The determinants of poverty in Egypt
Examination of the determinants of poverty typically involves simulationsdescribing the effects of a change in the level of one poverty-specific vari-able, conditional on other poverty correlates, on observed poverty rates.Two studies, El-Leithy et al. (1999) and Datt et al. (1999), included suchsimulations for Egypt. Their findings underline that the poor are not ahomogeneous group; rather, poverty groups are differentiated along edu-cation, employment, and dependency characteristics.
Guided by the poverty profiles, these studies attempted to gauge theprobability of being poor in terms of a number of socioeconomic andhousehold characteristics. In modeling the probability of being poor, El-Leithy et al. (1999) used two approaches. The first includes a set of socio-demographic characteristics and the second includes a set of housingcharacteristics.9 The performance of the models in correctly identifyingthe poor was modest, but nevertheless provided some interesting findings.
First, geographic location appears to have an impact on welfare, espe-cially in urban areas. Other things equal, being situated in Upper Egyptreduces per capita consumption levels by almost 20 percent.
Second, household size has a substantial negative effect on living
Poverty and income distribution 265

standards in both urban and rural areas. In El-Leithy et al. (1999), an addi-tional unit in the dependency ratio was estimated to increase the probab-ility of being poor by 44 percent in urban areas and 52 percent in ruralareas. The effect was equally large in Datt et al.’s (1999) results. Increasinghousehold size by one member reduces per capita consumption by nearly30 percent in urban areas and 12 percent in rural areas. The turningpoints at which household-scale economies become significant are 15members in urban areas and 10 members in rural areas which, however,constituted less than 2 percent of the respective geographic samples.
Third, household composition is also important. In rural areas only, fora given household size, increasing the number of children less than 15years of age reduces per capita consumption by nearly 4 percent. In bothurban and rural areas, welfare increases with the age of household head,up to 74 years in urban areas and 62 years in rural areas, after whichwelfare level declines but only in rural areas. Female-headed householdsare also more prone to poverty. Female headship has the effect of redu-cing per capita consumption by almost 8 percent in rural areas.
Fourth, education is a powerful determinant of living standards in bothurban and rural areas. Even a minimum amount of education has a posit-ive effect on poverty rates especially in urban areas. El-Leithy et al. (1999)showed that, maintaining all other variables at their national mean, inurban areas the proportion of the poor would rise to 59 percent if thewhole population were illiterate, but decrease to 17 percent if the wholepopulation attained at least secondary education. The effects are similarin rural areas but the impact is much smaller. Simulations by Datt et al.(1999) further show that increasing the number of years of schooling forthe household by one year raises per capita consumption by nearly 6percent in urban areas and 3 percent in rural areas. The effects are evengreater when either parent in the household is assumed to have com-pleted primary education (10 percent and 13 percent in urban and ruralareas, respectively). The substantial reductions in the distribution-sensitivemeasures in urban areas in Datt et al.’s (1999) simulations further indicatethe important distributional effects of educational attainment. Forinstance, other things equal, increasing household average schooling inurban areas by two years reduces the predicted values for poverty inci-dence by 23 percent, poverty depth by 28 percent, and poverty severity by31 percent. The respective measures for rural areas are, 14, 18, and 21percent.
Fifth, employment status and occupation also matter. If all the popu-lation were unemployed, other variables unchanged, the proportion ofthe poor would rise to almost 70 percent in urban areas and 54 percent inrural areas. In fact, unemployment has the largest (marginal) impact onpoverty incidence in urban areas. Also increasing the probability of beingpoor is employment in construction and manufacturing in urban areasand employment in agriculture in rural areas. Similarly, female unemploy-
266 Poverty and income distribution

ment substantially reduces welfare levels, especially in urban areas, whilemale unemployment is significant only in rural areas. Simulations by Dattet al. (1999) show that decreasing by one the number of unemployedfemales in the household reduces the predicted incidence of poverty bynearly 4 percent in urban and 2 percent in rural areas, compared to 3.5percent and 1.7 percent, respectively, for unemployed males. At the meanvalue of land owned and for households with no schooling, female unem-ployment reduces per capita consumption by 20 percent in urban areasand by 14 percent in rural areas.
Sixth, ownership of productive assets and access to agricultural land arepositively correlated with consumption. Ownership of cultivated landimproves living standards in rural areas by a sizeable degree. Consump-tion also increases with the value of livestock owned by the household inboth rural and urban areas. Increasing access to physical capital, however,provided somewhat ambiguous results. Datt et al. (1999) found thatincreasing the area of land owned and cultivated by 20 percent in ruralareas would reduce the incidence of poverty by only 1.5 percent. However,the effect on poverty rates is greater if one considers only those indi-viduals whose land area was less than the mean value in the model.
Seventh, access to community services, such as distance to railroad orsupply of irrigation, is statistically insignificant on its own, but is significantwhen interacted with other determinants. In rural areas, there are positiveeffects of shorter distance to railroad and better supply of irrigation wheninteracted with average years of schooling. In simulations that shortenedthe distance to the nearest railroad (to less than 4 km), the impact onpoverty reduction was small (only 3 percent). However, the effect ofimproving irrigation was substantial; it would reduce the predicted inci-dence of poverty by 12 percent in Rural Lower Egypt and by 8 percent inRural Upper Egypt.
The evidence from surveys pointed to the significance of education andemployment in differentiating between poverty groups, with more pro-nounced effects in urban than in rural areas. In the latter, additionalfactors are important in increasing poverty, such as household size anddependency, access to arable land, and access to specific community ser-vices. The effect of these factors on poverty measures is further supportedby results of the simulations. In general, the results for the education sim-ulations generate the largest impacts on all poverty measurements, with aparticularly pronounced impact on the distributionally-sensitive measure-ments (such as depth and severity). Moreover, the effects of education onpoverty are stronger than even those resulting from the sector of employ-ment. Thus, when employment in the construction sector (one of thesectors most associated with urban poverty) is interacted with illiteracy,while maintaining all other variables at their national means, povertyincidence increases to nearly 62 percent in urban areas. Alternately,when employment in the construction sector is interacted with secondary
Poverty and income distribution 267

education (i.e. if all those employed in construction had at least secondaryeducation), poverty incidence falls to less than 20 percent.
“Chronic” versus “transitory” poverty in Egypt
Haddad and Ahmed (1999, 2003) carried the analysis a step further.Using a panel of households in 1999 that had been surveyed in 1997, theyexamined the change in observed living standards in terms of the abovesocioeconomic variables and assess their relative contribution to chronic,transitory, and total poverty.10 Their assessment of changes in living stand-ards was based on changes in average per capita consumption between1997 and 1999. They found (2003: 71) that over this period, about two-thirds of overall poverty was chronic (average consumption over time wasbelow the poverty line), and almost half the poor were always poor.
Their panel results showed a significant deterioration in living stand-ards between 1997 and 1999. Average per capita consumption declined byalmost 8 percent in 1999 with a downward shift in the entire distributionin 1999 compared to 1997. In preserving consumption levels, the LowerRural region did best while the Upper Rural region fared worse. More-over, the results indicate poverty in Egypt to be mostly chronic in natureand associated with rather limited mobility across consumption groups(Table 9.5). For instance, while 6 percent of surveyed households wereable to climb out of poverty in 1999, a further 14 percent fell into poverty.
268 Poverty and income distribution
Table 9.5 Households by chronic, transitory, and total poverty status, 1999(number and percent)
Poverty status Urban Rural Total
Number Percent Number Percent Number Percent
Chronic – persistent 23 14.2 43 23.1 66 18.9Chronic – not persistent 9 5.6 17 9.1 26 7.5Transitory 20 12.3 25 13.4 45 12.9Never 110 67.9 101 54.3 211 60.6
Total 162 100.0 186 100.0 348 100.0
Source: Haddad and Ahmed (1999).
Notes1 Chronic poor, persistent: households that have per capita consumption is below the
poverty line in both years.2 Chronic poor, not persistent: households with average per capita consumption over the
two years is below the poverty line, but in one of the years per capita consumption wasabove the poverty line.
3 Transitory poor: households with average per capita consumption over the two years isabove the poverty line, but in one of the years per capita consumption was above thepoverty line.
4 Never poor: households with per capita consumption that is above the poverty line in bothyears.
Almost 20 percent of the sampled households were persistently poor (i.e.their consumption levels were consistently below the poverty line in bothyears), the proportion being higher in rural (23 percent) than in urbanareas (14 percent). Using per capita poverty measures, almost two-thirdsof total poverty in Egypt was to be regarded as chronic, and this rises to 73percent in the Upper Urban region followed by 69 percent in the UpperRural region.
In explaining the changes in consumption between 1997 and 1999,Haddad and Ahmed (1999) found education, represented by the averageyears of schooling, to be important in increasing per capita consumptionin rural areas, but not in urban areas; in the latter, female unemploymentwas an important determinant reducing consumption. None of the otherpoverty correlates was statistically significant. The authors concluded thatupward mobility resulting from education was limited in urban areas. Thisview is reinforced by the elevated unemployment rates among graduatesin urban areas.
Nevertheless, education emerged as an important factor in averting therisk of both chronic and transitory poverty in urban areas, and onlychronic poverty in rural areas. Additional factors increasing the risk ofchronic poverty included large households and age of household head inurban areas, and the number of children below age 15, female headshipand ownership of agricultural land in rural areas.
In general, the results suggest that of all the socioeconomic character-istics, education was the most discriminating between poverty groups.While it may not contribute to increases in per capita consumption in theshort run, possibly because of labor market rigidities that prevented thereflection of higher education in greater labor returns, education had apowerful distributional impact in the long run. This made it important foraverting the risk of chronic, and sometimes transitory, poverty. Otherfactors, such as female unemployment, female household headship,dependency, and access to agricultural land were also important in attain-ing a certain consumption level, but their distributional effects were muchsmaller.
Growth and redistribution effects of poverty changes
In a somewhat similar exercise, El-Leithy et al. (1999) decomposed povertychanges between 1991 and 1996 into growth and redistribution effects.They analyzed changes in poverty rates in terms of changes in the redistri-bution of living standards, as distinct from growth in living standards. Theanalysis showed that increases in poverty levels at the national level and inurban areas were mainly attributed to reductions in per capita expendi-tures, whereas improved redistribution mitigated the adverse effects offalling per capita expenditures in rural areas. Improvements in distribu-tion, however, were not always strong enough to offset the negative impact
Poverty and income distribution 269
of reduced per capita expenditures, so that even in cases where the coeffi-cient on the redistribution component exceeded that on growth (such asin Lower Rural and Upper Rural regions), the incidence of poverty stillincreased, although by much smaller magnitudes than in urban regions.Given the expenditure distribution in 1996, El-Leithy et al. (1999) sug-gested that the elasticity of poverty rates to growth was quite significant.
Poverty in 2000
The most recent study of poverty was based on the Household Incomeand Expenditure Survey of 2000. The HIES 2000 raised four importantpoints: (1) it reported that, for the first time since 1982, overall povertydropped in Egypt; (2) poverty fell even though inequality increased; (3)even though overall poverty decreased, poverty in both urban and (espe-cially) in rural Upper Egypt increased; and (4) unemployment was not anexceptional cause of poverty.
On the basis of the lower poverty line, the study – MOP/World Bank(2002) – concluded that poverty had fallen to 16.7 percent of the popu-lation compared with 19.4 percent in 1996. This means that 10.7 millionpersons in 2000 were unable to obtain their basic nutritional require-ments and non-food items, compared with 11.5 million in 1996 – a reduc-tion of 800,000 individuals. The use of the upper poverty line showed asimilar change; the incidence of poverty in 2000 dropped to 42.6 percent,compared with 51.4 percent in 1996. This represents the first change inthe trend of poverty incidence since the early 1980s.
A caution should be entered at this point. The results of the HIES 2000have given rise to two main comments. The first queries the emphasisplaced by the HIES 2000 on the lower poverty line, and is skeptical aboutits importance for policy in the Egyptian context. In an increasinglymiddle-income country, such as Egypt, one would not expect to find largenumbers of the utterly destitute; hence, the focus of the HIES 2000 on thelower poverty line obscures the more relevant problem, which is the largenumber of persons still below the higher poverty line.
The second raises concerns about apparent inconsistencies in theresults of the HIES 2000. Thus, Adams and Page (2003) point out thatbetween 1981 and 2000, real mean per capita expenditures as measuredby the household surveys fell by 14 percent and 31 percent in urban andrural areas respectively. Such substantial declines can be expected to leadto increases in poverty. However, the HIES data suggest that while theincidence of poverty rose in rural Egypt, it fell in urban Egypt and for thecountry as a whole. Moreover, while real mean household expendituresdeclined by 14 and 31 percent for urban and rural households, real GDPper capita for the country as a whole was reported to increase by 54percent. Adams and Page term these results “puzzling,” and requiringfurther examination. Another such result was that decreasing poverty in
270 Poverty and income distribution

urban Egypt was associated with a significant worsening of the income dis-tribution (the Gini increased by 8.3 percent). The findings of the HIES2000 that follow should be read in the light of the foregoing comments.
The chief characteristics of poverty in Egypt as the country entered thetwenty-first century can be briefly summarized. Of the poor, 8.2 millionwere located in rural areas and 2.5 million in urban areas. The incidence ofpoverty was strongly dependent on the growth of the economy, and particu-larly on the sectoral composition of growth. In 1996–2000, economicgrowth in Egypt was driven largely by domestic demand and impactedchiefly on construction, import-substituting manufacturing, financial ser-vices, and tourism. Agriculture grew modestly (less than 3.5 percent a year)and contributed only about half a percentage point to GDP growth.
By the late 1990s the regional distribution of poverty had become amajor issue. Between 1996 and 2000, poverty declined rapidly in the fourmetropolitan governorates (Cairo, Alexandria, Port Said, and Suez), mod-erately in Lower Egypt, but actually rose in Upper Egypt11 (see Figure 9.5).This was in line with the regional growth in productivity and incomes. Thedata do not permit a precise analysis of differential productivity growthbetween Upper Egypt and the rest of the country. However, the informa-tion available – for example, in INP (1996, 2002) – suggests that UpperEgypt was less well endowed in activities in which productivity increased,such as manufacturing, and that it also lagged behind Metropolitan andLower Egypt in productivity growth in activities, such as agriculture, thatwere common to both regions. GNP per capita in the Metropolitanareas grew by 8.9 percent a year, in Lower Egypt by 5 percent, and inUpper Egypt by only 0.5 percent annually. While rural areas in generalexhibited a greater degree of poverty than urban areas, the situation was
Poverty and income distribution 271
Percentage
Reg
ion
Metropolitan
Urban lower
Rural lower
Urban upper
Rural upper
All rural
All urban
4035302520151050
1990–91 1995–96 1999–2000
Figure 9.5 Regional poverty, 1991–2000 (source: based on El-Leithy et al. (1999)for 1990–91 and 1995–96; MOP/WB (2002) for 1999/2000).
systematically worse between Upper Egypt and the rest of the country.MOP/World Bank (2002: v) found that two-thirds of the 10.7 millionpersons classified as “poor” in 2000 were located in Upper Egypt – 5.8million in rural Upper Egypt, and another 1.4 million in the urban partsof Upper Egypt. The number of poor people and the share of people whowere poor both increased in Upper Egypt between 1996 and 2000.
Poverty in Egypt continued to be relatively shallow; thus even smallmovements in incomes could shift a significant number of persons aboveor below the line. This also means that, with proper targeting, relativelysmall transfers of income could raise substantial numbers of the poorabove the poverty line. In fact, MOP/World Bank (2002: 13) estimatedthat if perfect targeting of poverty-alleviating transfers were possible, itwould have required only about LE 350 million per year, i.e. about 0.1percent of GDP in 2000, to lift everyone out of poverty.
MOP/World Bank (2002: 17–19) found that between 1996 and 2000,three different regional patterns of equity emerged. At the national level,growth was not pro-poor, and the Gini coefficient increased from 0.345 to0.378. A similar pattern was observed in the Metropolitan region, with theGini rising from 0.374 to 0.396. Lower Egypt, however, combined highincreases in per capita expenditure with a better income distribution; infact, the Gini for rural Lower Egypt dropped to 0.248. The third pattern,for Upper Egypt, combined decreases in per capita expenditures with aworsening of the income distribution, so that both factors contributed toincreasing poverty. The Gini coefficient for urban Upper Egypt at 0.406showed the highest inegalitarianism in the country (but that for ruralUpper Egypt remained around 0.27). Inequality in Egypt in 2000, there-fore, resulted mainly from inequality within regions rather than betweenregions. Computations using the Theil index showed that 82.1 percent ofthe inequality in 2000 resulted from intra-region variation, while 17.5percent would be explained by inter-region variation. The correspondingfigures for 1996 were 87.2 and 13.2 percent.
Consistent with the findings of earlier studies, the most important corre-late of poverty was with education; out of every ten Egyptians, three wereilliterate, while out of every ten poor persons, five were illiterate. Similarly,out of every ten Egyptians, four lived in a household of which the head wasilliterate; out of every ten poor persons, six lived in a household with anilliterate head. The presence of education enabled individuals to accessemployment opportunities, and even a moderate improvement in educa-tional attainment could substantially reduce the ranks of the poor. More-over, the lack of education set up a vicious circle – individuals withouteducation tended to be poor, and the poor were less able to afford educa-tion. Education thus becomes doubly critical, affecting not only the presentgeneration, but also in transmitting poverty across generations.
Other correlates of poverty also remained consistent with previous find-ings. Demographic factors, such as the size of the household, were import-
272 Poverty and income distribution
ant; for example, while out of every ten people in Egypt three had morethan three children, out of every ten poor people five had more thanthree children. The rural–urban divide was significant – six out of tenEgyptians lived in rural areas, but eight out of ten poor people lived insuch areas. The slower growth of productivity and value-added in agricul-ture took its toll on those who were employed in that sector – four out ofevery ten people in Egypt worked in agriculture, but for poor persons thefigure was six out of every ten.
Annex: conceptual issues in measuring poverty
Poverty estimates are sensitive to several methodological choices, such asthe welfare indicator, the units of measurement (e.g. household versusindividual, or income versus expenditure), or the adjustment of povertylines over time. This annex addresses some of the main conceptual issuesthat arise in the measurement of poverty.12
1 Welfare indicators
Poverty comparisons are typically defined in terms of a pre-specified stan-dard of well-being (Ravallion 1992, 1994). The most commonly usedapproach is to define as “poor” those individuals or groups whose incomeis inadequate to provide them with the level of nutrition, clothing, andshelter deemed as the minimum by the norms of that society. A broaderinterpretation of this concept would approach Sen’s (1981) notion of“capability deprivation,” wherein the definition of poverty is extended toembrace non-material aspects, such as inadequate access to education andhealth services – factors that improve the capabilities of individuals andexpand their command over resources.
A single universally-accepted indicator of non-material well-being ordeprivation does not exist. Measures of human (capability) poverty haveundergone several revisions. In 1995, the UNDP HDR introduced theconcept of capability poverty, defining this in terms of deprivation inthree basic capabilities – the capability to be healthy and well nourished;the capability for healthy reproduction; and the capability to beeducated.13 These were incorporated into a single index – the CapabilityPoverty Measure (CPM). The UNDP HDR 1997 refined this into theHuman Poverty Index (HPI), which combined deprivation in three ele-ments: survival (deprivation in longevity), knowledge, and adequate stand-ards of living in terms of overall economic provisioning.14
2 Units of measurement
Poverty comparisons are based on poverty lines where the unit of mea-surement is either the household or the individual. Individual-based
Poverty and income distribution 273
poverty lines are preferred to household-based ones. Household-denotedyardsticks of expenditure or income might be misleading, since for agiven level of per capita consumption, larger households would be placedabove the poverty line while smaller households would be placed below it(Lanjouw and Ravallion, 1996). This approach, however, does not capturethe effect of scale economies or the demographic composition of house-holds, and could therefore overstate poverty. Hence, adult equivalencescales are often applied to adjust the individual welfare measure to reflectdifferences in age and gender patterns of households15 (Ravallion 1992).
The most important source of information for poverty assessments ishousehold budget surveys, which provide detailed information on house-hold incomes and expenditures. Cardiff (1997) and El-Leithy et al. (1999)provide a number of conceptual and empirical considerations that seemto favor expenditure- over income-based poverty lines. First, expenditurebetter reflects “realized opportunities,” especially in environments wherethe poor are credit-constrained and savings are negative. Second, incomestreams for the poor are typically fluctuating and derive from a multiplic-ity of sources, which makes it hard to obtain accurate information onincome. Third, while income streams may be variable, the poor tend tosmooth consumption over time, which makes expenditure a better indica-tor of longer run living standards than is current income. Althoughexpenditure-based poverty lines fail to account for consumption of publicgoods, they constitute a useful monetary aggregate that reflects individualpreferences, given a set of prices and incomes.
3 Poverty lines
Poverty lines can be absolute, relative, or subjective. Absolute poverty linesare anchored in a cost-of-basic-needs concept. The usual approach is todefine an absolute food poverty line in terms of the estimated cost of afood bundle that provides a stipulated energy intake, deemed essential orminimum, by the standards of a given society and is based on consump-tion patterns of the lower expenditure groups in that society. The foodpoverty line is then augmented by an allowance for non-food consump-tion.16 Two questions can be asked. First, how much do households whoare capable of meeting nutritional requirements and choose not to (i.e.those whose total expenditures are just equal to the cost of the foodbasket) spend on nonfood items? Second, how much non-food spendingis done by households whose food expenditures are just equal to the costof the food basket? The former procedure yields a lower (sometimestermed an ultra poverty line) because it defines the poverty line in terms ofthose households who had to displace minimum food consumption inorder to purchase essential non-food items; the latter an upper poverty line.
The non-food spending associated with spending displacement isobtained by regressing food share on the log of the ratio of total spending
274 Poverty and income distribution

to the food poverty line, and household composition variables. A model(Engels curves) commonly fitted is: FSi ���� log (TSi/FP)��i, where FSi isthe food share of the i-th household, TSi is total spending, and FP the foodpoverty line. A variable representing household size is often added. Theintercept represents the average food share of households who can affordthe food poverty line. Since the total poverty line is the sum of the foodpoverty line and non-food spending at the food poverty line, it can beobtained by multiplying the food poverty line by a factor equal to 2 ��.17
The non-food component associated with actual non-food spending ofhouseholds who reach the food poverty line is obtained by using thefollowing formula, along with intercept and slope coefficients estimatedearlier: FS�(�i ��i)/(1��i). The total poverty line is then obtained bydividing the food poverty line by the final estimate from this equation.
Relative poverty lines recognize the interdependence between the povertyline and the rest of the income distribution. As Fields (2001: 91–3) pointsout, this concept covers two separate ideas. In the first type of relativepoverty measures, a relative poverty line is the income level that cuts offthe lowest x percent of the population in the national income distribu-tion; the World Bank, for example, uses the lowest 40 percent. Anand(1997: 244–5) raises two objections to this method of defining the poor:(1) it prejudges the extent of poverty (it is x percent by definition); (2)poverty in this sense can never be eradicated, because there will always bea lowest x percent in the income distribution. In the second sense of rela-tive poverty, the higher the poverty line used the richer is the country inwhich poverty is being measured. Examples of such relative poverty linesare half the mean income (as used by the European Union) or two-thirdsof the median income (as used occasionally by the World Bank). With rel-ative poverty lines specified in this manner, it is no longer true that thepoverty cannot be eliminated.
Subjective poverty lines define poverty in terms of individual perceptionsof what constitutes a socially acceptable minimum standard of living inthat society. Poverty measures according to this approach tend to be anincreasing function of income, because individuals with higher incomesset higher thresholds for minimum standards of living.
4 Poverty measurements
In addition to the Headcount Index, the Foster–Greer–Thorbecke (1984)class of decomposable poverty measurements is increasingly used. Thisincludes three indices: the headcount index, the poverty gap index, andthe poverty severity index.
The decomposable poverty measure may be defined as:
P� � �n
1��
q
i�1
[(z� yi)/z]�
Poverty and income distribution 275

where P is the poverty measure, � is the weight attached to the normalizedgap function [(z� yi)/z] of each individual, yi is the income of the i-th indi-vidual, z is the poverty line, and q is the total population below the povertyline. Fields (2001: 84–5) points out that this measure essentially weightseach individual’s normalized gap function by itself, so that the income ofan individual whose income is 10 percent below the poverty line isweighted by 10 percent, one whose income is 50 percent below thepoverty line by 50 percent, and so on.18 For individuals whose income is ator above the poverty line the gap is zero, and hence the weight is zero.
The most commonly used weights are 0, 1, and 2. When ��0, themeasure reduces to the “headcount ratio” or the headcount index (P0),which gives the percentage of households or individuals who fall belowthe poverty line. However, this measure is insensitive to the depth ofpoverty, or the distribution of the poor below the poverty line. The lattercan be captured by setting ��1, thus obtaining the poverty gap index (P1),which measures the gap between the observed expenditure levels of poorindividuals and the poverty line. Under the assumption of perfect target-ing, the poverty gap index denotes the amount of resources needed toraise the consumption of the poor to the poverty line. To obtain estimatesof consumption shortfalls, the poverty gap index is first multiplied by theinverse of the headcount index. For instance, the UNDP’s (1996) estimateof a poverty gap of 12.8 percent in urban areas in 1996 and a headcountindex of 45.0 percent implies that the average consumption of the poorwas 28.4 percent below the poverty line.
This measure, however, still misses the distributional effects of transfersbetween individuals below the poverty line. For instance, a transfer from apoorer to a relatively less poor individual (but still below the poverty line)would leave both the headcount and poverty gap indices unchanged, eventhough the former individual is now worse off. Hence, the “squaredpoverty gap,” or the poverty severity index (P2) is computed by setting ��2;this measures the inequality of distribution below the poverty line. Thismeasure gives more weight to individuals who are further away from thepoverty line; thus, the higher the index, the greater the extent of poverty.
276 Poverty and income distribution
10 Toward sustainable growthStrategic and institutional issues
What are the key issues that Egypt must address in order to sustain agrowing level of prosperity in the next two decades and beyond? Thematters to be tackled comprise the economic as well as the broader institu-tional and behavioral. This chapter provides a framework for thinkingabout these questions.
First, consider the broad societal challenge that Egypt faces. For mostsocieties, a basic aim is to offer a better life to its citizens. A starting point(but only a starting point) towards that aim would be the provision of ade-quate income, which means creating a sufficient number of productivejobs. The contours of this task are set by the size and growth of thecountry’s population. For several years Egypt’s population increased atmore than 2.5 percent a year, and this rapid growth has left a legacy in theshape of a large and young population. Such a population structure willcontinue to generate a rapid increase in the labor force – although thepopulation growth had dropped to about 2 percent a year by 2000, thelabor force was still growing at 2.7 percent a year. Given a labor force ofabout 19 million in 2000 (of which 1.3 million were said to be unem-ployed), this implies a labor force in 2010 of about 25 million.
“Full employment,” however, does not necessarily mean that everyoneis employed at any given moment. Lord Beveridge, whose Full Employmentin a Free Society (1944) established the guidelines for the full employmentstrategy of the British Labour Party, defined “full employment” as compat-ible with 3 percent unemployment, allowing 1 percent each for frictionalunemployment, seasonal unemployment, and overseas factors. Nor doesthe United States equate full employment with 100 percent employmentof the labor force. In its Economic Report for 1962, President Kennedy’sCouncil of Economic Advisors accepted 4 percent unemployment as con-stituting full employment. In 1977, the administration of President Fordchanged the full-employment benchmark to incorporate 4.9 percentunemployment in the calculation of the full-employment GDP. In 1979,the Carter administration adjusted it further to 5.1 percent. Other coun-tries also appear to use a similar approach; in a recent report on fullemployment for the Prime Minister of France, Pisani-Ferry (2000: 52–3)

argues that an unemployment rate of 5 percent would not significantlydiffer from that to which more elaborate definitions of “full employment”would lead, and uses this as the basis of his analysis and recommendations.
If “full employment” in Egypt is taken to accept that 5 percent of thelabor force will remain unemployed because of frictional and structuralreasons, then employment in 2010 must be about 24 million. This willrequire the creation on average of about 620,000 new jobs a year in orderto employ all the new entrants into the labor force and to steadily reducethe numbers of the presently unemployed so that full employment isattained in ten years.1
In a market economy the demand for labor is generated by economicgrowth. The World Bank (2001: 12) reported that in 1991–2000 theeconomy created 436,000 jobs annually. In order to create the numberof jobs required for full employment, the economy has to generate ahigher demand for labor by growing noticeably faster than it did in1991–2000.
How much faster must it grow? Mohammed (2001: 11) estimated theelasticity of employment creation with respect to real GDP growth at 0.53for the period 1990–97, while MOP/World Bank (2002: 40) put it at 0.5for 1995–99. An annual increase of 620,000 jobs is roughly a 3.2 percent ayear increase in employment. On the basis of the more recent estimate ofemployment elasticity, the economy would need to grow at around 6.4percent a year in real terms in order to reach full employment (as definedabove) by 2010. And if one adjusted the labor force figures in order toreflect more fully the participation of discouraged workers and womenand for reducing underemployment, a required growth of real GDP in theneighborhood of 7 percent a year would not be unreasonable.
As against this requirement, what is the long-term potential growth ratefor the Egyptian economy? We can approach the question in a number ofways.
First, the potential growth rate for any country is given by the growth ofthe fully employed labor force plus the growth of labor productivity. In2000 the Egyptian labor force was growing at an annual rate of 2.7percent, while Radwan (2002) and Nassar and El-Leithy (2003) estimatedthe growth of labor productivity in 1988–98 at 1.6 percent a year. Thisgives a potential growth rate for the Egyptian economy of 4.3 percent perannum (if the entire increase in the labor force is assumed to beemployed).
Second, another view of the long-term possibility is suggested by whatthe economy has actually been able to do over an extended period. Overthe three and a half decades, 1965–2000, the growth of real GDP is esti-mated at 5.2 percent a year. However, this figure is inflated, because thenational accounts overstate the weight of industry, the faster growingsector, and understate that of agriculture, the slower growing. Correctingfor this bias would give a growth rate of 4.5–4.7 percent a year.
278 Toward sustainable growth

A third view of potential GDP, following Backhouse (1991: 100–1), canbe obtained by inserting into a Cobb–Douglas production function theparameters for capital and labor productivity from Mohammed (2001),increasing the capital stock by assuming steadily rising investment untilthe investment/GDP ratio reaches 28 percent, and replacing the laboractually employed by the “fully employed labor force” (95 percent of thelabor force in our case). This procedure provides a figure of 4.4 percent ayear as an approximation of the “full-employment output.”2
A fourth calculation is provided by Alba et al. (2004) who used aHodrick–Prescott filter (a smoothing technique that removes low-frequency variation in a time series in order to obtain a trend component)of real GDP level data to estimate potential GDP and variations from thepotential during the period 1960–2003. Their estimates showed thegrowth rate of potential GDP reaching a high of 7 percent in the mid-1970s and dropping steadily thereafter to a little over 4 percent in the1990s.
These different approaches thus converge towards rather similarresults: in round numbers and given the existing institutional structure,the potential growth rate of the Egyptian economy is about 4–5 percentper annum. At the risk of some oversimplification, then, one might say that a basiccondition for Egypt to meet the societal challenge is to raise the growth rate of theeconomy from its present potential of 4–5 percent a year to 6.5–7 percent annuallyfor at least two decades.3
How did actual GDP growth in the recent past compare with the poten-tial? The actual growth rate of the GDP in 1992–2002, about 4.6 percent ayear, did not fall far short of the potential. However, it began from a lowerlevel of GDP, and the continuous compounding of even a relatively smalldifference in growth rates can have quite a substantial cumulative effectover a ten-year period. By the end of the period, the persistent “outputgap” resulted in a cumulative loss of about LE 140,000 million in 1992prices, meaning that Egypt lost more than 75 percent of one (average)year’s output in 1992–2002.
Two conclusions follow. The potential GDP growth rate is less than thatrequired for Egypt to attain its employment goals, and the actual GDPgrowth fell short of even this insufficient potential. Figure 10.1 also showsthat, except for 1994–95 and 1998, the unemployment rate and the GDPmoved in the same direction. Therefore, the basic task for Egypt is to raisethe potential growth rate and to perform to the higher potential in a sus-tained manner. The critical issues that Egypt will have to address inaccomplishing this task are examined in this chapter.
The prime mover of GDP growth is investment. This, of course, doesnot mean that investment is the only factor that drives growth; improvedlabor training, better management, and more efficient organization con-tribute in significant measure. However, no country has managed tosustain growth over a multi-decade period without a substantial increase in
Toward sustainable growth 279

the investment:GDP ratio. Moreover, investment also acts as the mainvehicle of technological change, because technology most often comesembedded in new capital equipment. Thus, both because it adds to pro-ductive capacity and because it serves as a major conduit for transferringadvances in productivity, investment must be seen as the single mostimportant factor for Egypt’s growth. To sustain a growth rate of 7 percenta year, the economy is likely to require an investment rate of perhaps25–28 percent of GDP (assuming an investment:output ratio approaching4:1, which is in fact lower than in the “East Asian miracle” countries), com-pared with an average of 19 percent in 1995–2000. The first critical devel-opment concern for Egypt, therefore, is the set of issues relating to theinvestment rate: how to raise the rate, and why in the decade of the 1990s itdid not respond to the incentives provided.
Investments must be financed. Egypt has a variety of financing options:domestic savings, external assistance, foreign direct investment, and bor-rowing from abroad. While the optimal mix will depend on a number offactors, the bulk of sustainable financing will have to depend upondomestic sources. The second critical development issue, therefore, is howto raise the domestic savings rate from its present 16 percent of GDP toaround 22–25 percent. This is a significant, but feasible, aim. It may helpto put matters in perspective by reflecting that for more than threedecades the fast-growing economies of East Asia have routinely postedsavings rates in excess of 35 percent of GDP.
An important consideration for policy is that the areas of growth and ofefficient job creation will be more restricted than in the past. The agricul-tural sector cannot absorb a substantial number of additional workers, thepublic sector should not take on extra labor. Moreover, the demand for
280 Toward sustainable growth
Per
cent
age
pote
ntia
l GD
P10 Percentage unem
ployment rate
10.2
10.0
9.8
9.6
9.4
9.2
9.0
8.8
8.6
8.4
8.2
9
8
7
6
5
4
3
2
1
01992 1993 1994 1995 1996 1997 1998 1999 2000 2001 2002
Output gap as percent potential GDP Unemployment rate (%)
Figure 10.1 Unemployment and shortfall between potential and actual GDP,1992–2002 (percent) (source: MOP; World Bank LDB).
labor in the main destinations for Egyptians working overseas is largely sat-isfied; hence emigration does not offer a solution to Egypt’s employmentproblem. This means that the space for action by the policymakers islimited – the additional employment must nearly all be created in theprivate non-agricultural sector of the domestic economy. This constraint isliable to raise some problems. First, employment growth in this sector hasbeen predominantly for males: between 1976 and 2000, male employmentgrowth was almost three times that of female. Second, the vast majority ofjobs in this area of the economy are not legally protected. These considera-tions will have to be borne in mind when developing employment policies.
Between 1992 and 2002 this subsector grew at an approximate real rateof 8.5 percent annually, while employment in this sector is likely to havebeen growing at about 3–4 percent. Policies to strengthen the businessenvironment thus form the third broad set of issues. This must cover astrengthening of the institutions supporting the private sector’s function-ing, in particular the bureaucracy, the commercial judicial system, the taxadministration, the financial sector, and the educational and labor train-ing systems. It will also require special attention to the problems of smalland medium enterprises.
Sustained real growth of 7 percent a year will require the creation of alarger demand than can be generated through domestic efforts; thus,Egypt will have to make greater efforts to access the international market.This will call for major changes in some key institutions, such as the incen-tives for import-substitution versus those for exports. It will also requirethe economy to become more competitive, particularly in view of theincreasing trends towards globalization. Moreover, an important concernfor Egypt is food security. Given the size and growth of the country’spopulation on the one hand, and the increasing constraints on water andland on the other, it does not appear likely that “food security” can mean“food self-sufficiency.” As usual, Richards (1993: 244) offers an incisiveinsight, namely, that food security for Egypt must increasingly meanforeign exchange security, and that Egypt must perforce become a moreefficient participant in the international economy simply in order toassure its food supply.
The fourth major development issue is thus a reorientation of thedevelopment strategy in the direction of rapidly boosting exports (whichwill also increase domestic savings).
The growth of GDP will be meaningless as a guide to the well-being ofthe population unless the issue of poverty is squarely faced. A sustainablelong-term development strategy must also focus attention on disparities inregional and gender rates of poverty.
Growth cannot be sustainable if it degrades the quality of life, a keyingredient of which is the condition of the environment. This is all themore important in Egypt, where 98 percent of the population is packedinto 4 percent of the land area.
Toward sustainable growth 281

Finally, any discussion of sustainable growth in Egypt must confront thequestion of water. The increasing demands on the Nile’s water from all theriparian countries, and the strategies that can help satisfy these require-ments, must be addressed.
Investment
The principal difficulty in raising growth to the levels required is that theinvestment rate dropped sharply after 1988 and has remained at about 20percent of GDP. The rate must be raised to 25–28 percent of GDP; this is notimpossible, indeed, the country attained even higher rates in the late 1980s.
What pulled down the investment:GDP ratio? The fall in aggregateinvestment resulted from the cuts in public investment after 1990 thatwere effected as part of the stabilization measures of 1991. The authori-ties’ thinking was that if public investment were cut back, but at the sametime the private sector was permitted to enter fields (such as infrastruc-ture) from which it had hitherto been excluded, aggregate investmentwould not suffer. However, while public investment fell as a result of thebudgetary cuts, private investment did not rise commensurately. There-fore, aggregate investment fell almost 10 percentage points of GDPbetween 1990 and 2000. If Egypt is not to revert to the public sector todrive growth, then it has to devise measures to address the reasons for thelethargic response by the private sector. The critical measures that need tobe addressed in order to stimulate the private business environment arediscussed later in this chapter.
Savings
In the second half of the 1990s, Egypt attained a sort of balance betweensavings and investment. However, as can be seen from Figure 4.4, this
282 Toward sustainable growth
Per
cent
age
of G
DP
4035302520151050
1965
1967
1969
1971
1973
1975
1977
1979
1981
1983
1985
1987
1989
1991
1993
1995
1997
1999
Gross domestic fixed investment/GDP (%) Public investment/GDP (%)
Figure 10.2 Gross domestic fixed and public investment, 1965–2000 (percent ofGDP) (source: MOP; World Bank LDB).
equilibrium was brought about by reducing investment, not by raisingsavings. In order to accelerate the growth rate of its GDP, Egypt must raisethe level of productive investment. In order to make the growth rate sus-tainable, Egypt must raise the level of domestic savings and increase thecompetitiveness of its production. The fundamentals of Egypt’s economicproblem have not altered in four decades.
In order to finance investment in a sustainable manner, Egypt will haveto raise the domestic rate of savings from about 16 percent of GDP in2000 to the neighborhood of 22–25 percent. This will still leave foreignsavings to provide around 3–4 percent of GDP.
How can Egypt attain higher rates of domestic saving? The factorsbehind an enhanced savings performance are not fully understood byeconomists, but the experience of fast-growing countries suggests fouravenues that Egypt could pursue.
These comprise faster growth (which would raise incomes and thereforesavings); accelerated privatization (which would utilize assets more effi-ciently); financial sector reform (which could increase the surpluses ofthe pensions funds by investing them at market rates rather than ingovernment projects, and mobilize more resources through an expandedinsurance industry); and the improvement of government finances, particularlyby holding down current expenditures through a reform of the civilservice.
The development strategy
In 1965–2000, Egypt’s growth was constrained principally by the balanceof payments. The constraint arose because the country could not run anexternal deficit indefinitely. Lenders lost confidence and refused toprovide more funds, or only offered them at usurious rates of interest oron other objectionable conditions. In the meantime, the country had totransfer substantial amounts of resources abroad in the shape of interestand amortization payments, thereby further reducing its ability to importcapital goods and intermediate products. Egypt’s balance of payments dif-ficulties resulted largely from devoting insufficient attention to expandingexports. This chapter argues that Egypt must follow an export-led strategyfor at least the next two decades or so.
A key question that Egypt must face in devising a development strategy isto identify, at least broadly, the sources that can support faster growth. Thediscussion in Chapter 4 showed that much of the growth that Egypt experi-enced in the past 35 years resulted more from the greater employment ofcapital and labor than from improvements in productivity. While it isobvious that the investment rate must be increased, it is also clear that suchincreases must be accompanied by significant progress in productivity.
An important reason for the lack of productivity improvement isthe protection from competition provided to Egyptian industry. An
Toward sustainable growth 283

outward-looking strategy will be needed to spur productivity increases andto make firms move up to the “best practice” frontier. In addition to com-pelling firms to compete, both domestically and internationally, it wouldappear that Egypt’s strengths lie in some clearly defined areas. On theexternal side, areas offering a potential for sustained growth could betourism, high-value agricultural products (such as fruits and horticulture),natural gas, and industries that take advantage of Egypt’s associate mem-bership in the European Union and serve as “feeders” into major Euro-pean industries. However, Egypt’s ability to export industrial products,whether to the European Union or to other countries, will not happenautomatically. Sustained export success will depend upon increases in com-petitiveness, generated by improvements in productivity, which, in turn,will depend upon conscious efforts at institutional and other changes.
There is an urgency to implement an export-led strategy based largelyon manufactures. Such a strategy is being urged on almost all developingcountries by bilateral and multilateral organizations. However, as Blecker(2000) points out, under a given set of international demand conditions,the market for developing countries’ exports is limited by the capacity ofthe industrialized world to absorb these imports. Consequently, an export-led strategy is likely to work for only a limited number of countries at atime, particularly as many developing countries produce virtually the samerange of manufactured items. The attempt by all developing countries toexpand their manufactured exports at the same time might just lead toexcess industrial capacity and falling prices. If Egypt is to prosecute a suc-cessful export-led strategy, it must acquire an early start.
An export-led strategy does not imply that Egypt should forgo access toforeign savings. The foregoing figures on investment and domestic savingssuggest an annual inflow of foreign savings of between 3 and 4 percent ofGDP, which would finance about 10–15 percent of the required invest-ment. Completely eliminating the external deficit would impose anunnecessary burden on the economy; a few back-of-the-envelope calcula-tions in an annex to this chapter provide some indication of these effects.Some issues that are crucial to developing a successful export-led led strat-egy for Egypt are discussed in the following section.
Export development
The relationship between the growth of an economy and its openness toforeign trade in goods and services, investment, and technology has beenthe subject of almost continual analysis and empirical testing in recentyears. One of the most wide-ranging and ambitious of these studies was bySachs and Warner (1995), which measured the “openness” of an economyusing five criteria: tariff rates, non-tariff barriers, black market premia overthe official exchange rate, state monopolies on major exports, andwhether the economic system was socialistic. The main findings were:
284 Toward sustainable growth

• During 1970–89 open developing economies grew at a rate of 4.49percent a year, while closed economies grew at only 0.74 percentannually.
• Trade policy and openness to trade was an important factor enablingthe incomes of developing countries to “converge” with those of thedeveloped.
• Openness decreased the likelihood of severe macroeconomic crises(defined as the necessity to reschedule external debt, the existence ofexternal payments arrears, and an inflation rate over 100 percent).
Several other studies have reinforced the finding of a strong and signific-ant effect of openness to trade and investment on the growth of acountry’s GDP.4 Viewed within this perspective, Egypt’s export perform-ance has fallen well short of its potential to contribute to the developmentof the economy.
The failure to increase exports rapidly arose more from Egypt’s failure toincrease its competitiveness than from limitations of external demand. Acareful examination by Kheir El Din (2000: 8–10) of the sources of Egyptianexport growth over the period 1980–95 concluded that external demandconditions constrained Egyptian exports only during the 1980–85 period; forthe rest, the constraints were imposed by supply factors affecting the com-petitiveness of export products. A decomposition of the trade performanceby Kouamé (2000) showed that Egypt failed to benefit from the surginginternational economy because it did not trade sufficiently in products forwhich global demand was increasing, and it also lost market share in its tradi-tional exports. The study showed that Egypt did diversify its export basket,but not towards the products with the fastest rising international demand.
A World Bank study in 1997 calculated that if Egypt’s exports hadgrown at world rates from 1983 through 1993, then exports should havereached $6.3 billion rather than $3.1 billion. The causes of this “loss” of$3.2 billion annually in 1993 were: (1) a failure to redirect exports towardsmarkets that were growing rapidly (this represented a loss of $0.7 billion);(2) a failure to adapt the composition of exports towards the faster-growing items (a loss of $2.3 billion); and (3) a residual that measured theloss of international competitiveness ($0.2 billion).
What held Egypt back from exporting products with higher inter-national demand and penetrating the faster-growing markets? The answeris that the structure of incentives and the institutional impediments thatraise the cost of doing business in Egypt impacted with particular severityon exports, and made it more profitable to produce for the home thanthe international market.
Three elements chiefly shaped this asymmetry:
• The effective exchange rate.• The tariff regime.
Toward sustainable growth 285

• Production and transactions costs (including from institutionaldelays).
Issues connected with the exchange rate and the tariff regime were exam-ined in Chapter 5. The impact of institutional behavior on costs will bediscussed here.
Production and transaction costs
Tariffs and non-tariff barriers are but part of the mélange of taxes andinterventions that increase the costs of production and of exports and thattilt the balance between domestic and international prices in favor of pro-ducing for the home market. Several other factors increase transactioncosts, such as the General Sales Tax, bureaucratic delays in rebating dutypaid on the imported component of exports, port handling services,freight rates, and import clearances.
A fiscal measure that increases the cost of exports is the General SalesTax (GST), which is levied on both domestically produced and importedmanufactured goods (and some services) at rates ranging from 5–25percent, with the standard rate on goods being 10 percent. However, thistax has a multiplier effect because it is applied on the value including theimport duty; the effect thus is to raise the cost of the imported inputs bythe applicable rate of the GST multiplied by the tariff-augmented value ofthe imported item.
A rebate and duty drawback scheme has been available for some yearsin order to provide exporters with imported inputs at world prices.However, the system suffers from two major deficiencies. First, it is time-consuming and cumbersome. The Stanford Research Institute (1995: V-9)listed eight time-consuming steps that an exporter had to complete inorder to obtain a refund. Second, the rebate is available only to firms thatdirectly import the intermediate component and export the processedproduct; it is not available for intermediate goods bought on the domesticmarket. This provides much less advantage than the system used in someof the East Asian countries, for example, Rhee et al. (1984: 12–13) pointout that Korea offered duty-free access to imported intermediate inputswhether they were imported directly or purchased locally, and also madethe rebate available to Korean manufacturers who exported indirectlythrough other Korean firms. The scope of this incentive and the speedwith which it was executed constituted major benefits.
There are also other limitations, for example, local content require-ments – only if the local content of a final product reached 20 percentwould the exporter be eligible for the rebate. A World Bank reportdescribed these export-promoting schemes as having become anotherform of transaction cost. It added that these measures only partially allevi-ated import duties and remained insurmountable for small enterprises.
286 Toward sustainable growth
The delays and costs of movement through the ports further reducecompetitiveness. Egypt’s ports are essentially state-owned monopoliescharacterized by high handling charges, poor service quality, and longdelays. Hoekman (1996) found that, in general, Egypt’s seaport chargesfor imports were triple those of competitors and increased CIF charges forimports to Egypt by over 10 percent. Container freight rates to Alexandriaran 15–20 percent higher than to other Mediterranean destinations; con-tainer handling costs were 60–80 percent higher than in nearby foreignports; terminal handling charges showed similar excesses. Long turn-around times of ships added to demurrage costs; 7–8 days for freighters toturn around in Alexandria were not uncommon, compared with 7–8 hoursin South-East Asian ports.
To sum up: Egyptian manufactured exports are likely to be more price-sensitive than the available measurements indicate (see Chapter 5).However, producers have also been disadvantaged by institutional andpolicy impediments that deter investment and make production for thedomestic market more attractive than for the international. Adjustment ofthe exchange rate, while necessary to compensate for the disincentives, willnot in itself suffice to sustain an export-driven development strategy; it mustbe used as part of a package comprising fiscal and monetary policies, andreforms to some major institutions. If the impediments discussed in thischapter are not addressed, it is likely that the price advantage conferred byexchange rate depreciation will be transitory, and a policy to maintain com-petitiveness might simply degenerate into a policy of serial devaluations.
The business environment
In order that Egypt attain and sustain a high rate of investment andgrowth delivered by a private-sector-led economy, the environment inwhich business is conducted will require a good deal of attention. Much ofthis attention will have to take the form of developing and strengtheningsome key institutions.
The word “institution” in this context primarily refers to an establishedlaw or custom, such as contracts or property rights. More formally, North(1991: 97) defines institutions as “the humanly devised constraints thatstructure political, economic, and social interactions. They consist of bothinformal constraints (sanctions, taboos, customs, traditions, and codes ofconduct), and formal rules and regulations (constitution, laws, propertyrights).” The impact of institutional issues on the costs of transacting andon the growth of an economy has been highlighted in the body of worksometimes referred to as the “new institutional economics.” Indeed, forNorth (1981: 24–25) an “efficient system” of property rights is one that“maximizes social output,” or reduces transactions costs and “encourageseconomic growth.” Lack of economic growth is attributed to “inefficientproperty rights.”
Toward sustainable growth 287

But it is important that these rights do not exist simply on paper; theauthorities must be able to enforce them in practice. In fact, North (1990:54) asserts that “the inability of societies to develop effective, low costenforcement of contracts is the most important source of both historicalstagnation and contemporary underdevelopment in the Third World.”The performance of organizations (such as the bureaucracy and the judi-cial system) that carry out these functions must, therefore, be scrutinized.
A caveat is in order. Rutherford (1994: 160–1) points out that the con-tribution of the new institutional economics is not free from ambiguity.Many references to “improved economic efficiency” in their writings referto reductions in production or transactions costs, but their relation towelfare is left unclear. Thus, “efficient” institutional changes that reducetransactions costs or promote productivity or economic growth might doso only by affecting the distribution of income and welfare, or at theexpense of important non-material values.
That said, the literature on the relationship between institutions andeconomic growth draws attention to an important point. In order tosustain a high level of economic growth over the next, say, twenty years,Egypt will have to give thought not only to the obvious economic levers –such as the fiscal deficit, the interest rate, the exchange rate – but willhave also to attend to the underlying issues of social rules (propertyrights), their enforcement, the impact of these on transactions costs, andthe functioning of organizations that enforce these rights and make thema reality.
An efficient and inexpensive determination of a clear set of rightsgoverning property is fundamental to any market economy. However,establishing property rights in Egypt can be enormously complex, time-consuming, and costly. De Soto (2000: 20–1) describes how obtaining thenecessary permission to build on formerly agricultural land can requiresix to more than 11 years of wrestling with bureaucratic procedures.Trying to acquire and legally register a lot on desert land is no better; itcan take at least 77 bureaucratic procedures at 31 public and private agen-cies, and consume between five and 14 years. The time, costs, and effort ingoing through these processes has led to about 4.7 million dwellings beingerected illegally. Moreover, if the settler subsequently tries to legalize hisposition by purchasing the rights to his dwelling, he runs a risk of havingit demolished, paying a steep fine, and serving up to ten years in prison.This provides an incentive to avoid registration and thus evade detectionby the authorities. Helmy (2004) reports a survey of the property marketby the Egyptian Center for Economic Studies which estimated that thereal estate assets of a staggering 92 percent of Egyptian property ownerswere unregistered and untitled.
But that means that the property owner cannot use the savings embod-ied in the dwelling as collateral for a loan, or as a share against an invest-ment, or to trade these assets outside a very narrow circle. This so-called
288 Toward sustainable growth
“dead capital” (because it cannot be used to generate fresh assets) can bevery substantial; De Soto (2000: 34) estimated such dead capital in Egypt-ian real estate at $240 billion, which was thirty times the total value of allshares at that time on the Cairo Stock Exchange. The inaccessibility of thiscapital for productive purposes results from the absence of legally enforce-able transactions on property rights.
The working of the institutional structure has a very different impact oneconomic enterprises, depending upon their size. The Egyptian privatesector is segmented into two very different groups of participants.5 On oneend are the largely family-owned formal medium and large enterprises(MLEs) that enjoy a high degree of tariff and non-tariff protection, haveaccess to all the institutional private credit, use relatively modern technolo-gies, make most of the country’s private investment, generate most of itsprivate exports, and pay higher salaries. Numerically, the medium andlarge enterprise sector accounts for only about 10 percent of private non-agricultural establishments; however, they are by far the principal benefi-ciaries of government support. It is for them that most policies aredeveloped, at whom most incentives are directed, who are the most activepartners in the government’s dialogue and interaction, and to whom thegovernment looks to provide the drive towards private sector development.
On the other end are the micro and small enterprises employing lessthan ten workers each, that often are informally organized – the Alexan-dria Businessmen’s Association (1996) quoted an estimate of the numberof informal sector enterprises of 2.28 million in 1991. Despite being con-strained financially and in other ways, micro and small enterprisesaccount for over 90 percent of private non-agricultural establishments,produce nearly 80 percent of the country’s private value-added (75percent if agriculture is excluded), and account for about three-quartersof its private non-agricultural jobs. These enterprises find it difficult orundesirable to expand beyond their current sizes, largely because of thedifficulties of obtaining finance; for example, Nathan Associates (1997)estimated that in 1997 lending to the micro and small enterprises by theentire banking sector was only 5–6 percent of bank lending. They aretherefore forced into the informal credit market, in which interest ratescan run as high as 100 percent, compared with 12–15 percent from banks.Moreover, informal assets cannot be used as collateral or in other legallysecured market transactions; De Soto’s estimate of such “dead capital” inEgypt was quoted earlier. It is true that informal assets can be used ininformal markets (and then reinvested in the formal arena), but becausethese transactions take place outside the legal structures they tend to bevery risky and therefore small and high-cost. Even when property rightsexisted, Cadwell (1999: 48) found significant shortcomings regarding thedefinition of property that might be pledged, the system of registeringand giving notice of the pledge, and enforcing a pledge if a credit con-tract were breached.
Toward sustainable growth 289
In view of the putative advantages from acting in the formal sector, whydo entrepreneurs choose to remain informal? The answer lies in the costsof becoming formal. Galal (2004) found that formalization under theexisting regulatory framework would make the entrepreneur worse off bynearly LE 15,000 annually. These losses would accrue from the additionalcost of abiding by the legal and regulatory procedures in the formal sectorregarding entry, operation, and exit. Galal estimated that incorporating asole proprietorship could take up to 91 steps over 232 days and involve 43entities, at a cost of over LE 8,000, which was more than the per capitaincome in Egypt in 2002. The exit procedures were equally cumbersomeand costly: bankruptcy procedures could take up to 53 steps over 635 daysand involve 14 entities, costing entrepreneurs about LE 9,000 in cash andLE 19,000 in opportunity cost. Aggregating the results across all firms inthe informal sector would provide a loss of resources to society equal toLE 6.5 billion, or 1 percent of GDP every single year.
However, if the business environment were reformed in a manner thatsimplified all rules and procedures regarding entry, operation, expansion,and exit of firms, the results could be quite different. Depending uponthe precise reforms included in such a package – and Galal cautioned thatpartial reforms were not likely to be effective – the cost of establishing andoperating businesses could be reduced by 90 percent, access to mortgageby 91 percent, and enforcement of pledges by 77 percent. Under such anenvironment, Galal found that the private value of a formalized firm couldincrease by 1.5 times the per capita income of Egypt in 2002. Aggregatedacross all firms in the informal sector, formalization under such con-ditions could generate an annual increase of 1.3 percent of GDP everyyear.
The Egyptian private sector thus remains structurally imbalanced. Theincentive and protection structures have consistently been targetedtowards the MLEs; micro and small enterprises have effectively beenignored and consequently have remained with only weak linkages to therest of the private sector. The gulf between the micro and small enter-prises and the large-scale sector is perpetuated by the lack of subcontract-ing from the large firms to the small; the World Bank (1994) found thatonly about 25 percent of large Egyptian firms subcontracted to smallerfirms – very unlike the situation in East Asian countries.
The legal status of firms reflects the dichotomy between the large andthe small. Fawzy (1999: 15) found that only about 5 percent of privateestablishments in non-agricultural activities consisted of joint-stock firms;the rest were established either as individual entrepreneurships (47percent) or partnerships (48 percent). A healthy development of theprivate sector will (in addition to reducing the costs of formalization)require measures to expand the size of the micro and small enterprisessub-sector, to increase its links with the larger firms, and to provide it withgreater access to technology and market information, while at the same
290 Toward sustainable growth
time reorienting the activities of the family-based enterprises increasinglytowards the export market.
After a prolonged period of socialistic policies and of, at least, coverthostility on the part of the government towards private enterprise, it is butnatural that building up the private sector’s confidence and encouragingit to invest would take time. Broadly speaking, this requires movement ontwo fronts. First, it would require special efforts to build up the privatesector, by improving the legal system, making transactions between thegovernment and business more transparent, providing more relevanttraining for labor, improving access to finance, facilitating the acquisitionof technology, and so on. Second, it would entail convincing the privatesector that the playing field had now been made level, and that thepublic sector would no longer be given preferential treatment. In theprivate sector’s view, a large public sector would have the power to extractcontinuing concessions from the government; a credible policy of fairtreatment would therefore require a downsizing of the public sector.
Empirical findings confirm that the private sector considers regulatoryprocesses and procedures to be significant issues affecting the effective-ness of their operations, although the perception of the relative weight ofthe different impediments has changed over the past decade. Theresponses to a survey conducted in 1991 showed that the private sectorregarded uncertainty about government policies to be the most bindingconstraint on the sector’s growth; the next most serious were taxes and taxadministration, access to and the cost of finance, and the availability ofmaterial inputs.6 Surprisingly, labor regulations, while still significant,ranked much lower.
The seriousness of the regulatory obstacles varied by sector and by sizeof enterprise. For example, engineering and textile firms found taxes andtax administration to be the most binding constraints; they were less so forthe food sector. The difficulty of access to finance was very important inthe engineering industry, while labor regulations and the availability ofinputs were considered more critical impediments in the textile. Virtuallyall the constraints (the chief exception was labor regulations) fell moreheavily on small firms; the most important burdens being taxes and taxadministration.
Subsequent studies, for example World Bank (1994: 19–20 and AnnexC), reiterated many of the earlier findings, especially as regards the levelof taxes and the complexity of tax administration, access to and the cost offinance, bureaucratic procedures, and the high cost of inputs. The pre-dictability of government policies was a significant factor, but less so thanin the earlier survey. As before, the smaller firms felt most constraintsmore sharply than did larger enterprises. Galal (1995: 12–15) showed asimilar pattern. Moreover, he found that the severity of institutional con-straints varied with the size of firms, the general rule being that thesmaller the firm, the more binding the constraint. This was especially
Toward sustainable growth 291

apparent in relation to tax administration and in access to finance andintermediate inputs.
A more recent survey by Fawzy (1999: 22–3) in 1998 found that prob-lems of tax administration, dispute settlement, and inadequately trainedlabor remained as major constraints on the efficient functioning of privateenterprise. The severity of some impediments, especially access to and costof finance, and uncertainty regarding the government’s policies hadslipped lower down the scale of concerns. Again, small firms on averagesuffered more from the institutional constraints, especially related to taxesand tax administration. Many of these findings, especially those con-cerned with the enforceability of laws and regulations and with the neces-sity of keeping discretionary decisions to a minimum (so as to avoid losingtransparency, credibility, and consistency), were further confirmed in asurvey by Ghoneim (2002: 105–32).
Several of the constraints result from institutional structures that aredeeply embedded in Egyptian society. Nevertheless, the issues must beaddressed. Indeed, it is becoming increasingly evident that Egypt will haveto undertake the “second generation reforms” if it is to sustain rapidgrowth in the future. As El-Ghonemy (2003: 98) puts it, the focus of thedevelopment strategy will have to change from “getting prices and themonetary system right (interest and exchange rates) to getting institutionsright.” The following sections discuss the principal areas for reform inorder to produce a more efficient business environment.
The bureaucracy
Egyptians frequently joke that, “Egypt did not invent bureaucracy, but ithas had 7,000 years in which to perfect it.” Indeed, paeans to the advan-tages of bureaucratic service and exhortations to be a scribe have beenfound on papyri and ostraca dating to the Ramesside era. The motivationsfor entering this profession appear to have changed little during 3,200years. Palmer et al. (1988: 38–9) report that over 50 percent of theirrespondents cited security of tenure, steady income, and high prestige asthe chief attractions, which are precisely those highlighted in the PapyrusLansing composed during the Twentieth Dynasty.7
The size and structure of Egypt’s bureaucracy has a major impact onthe private sector environment. It slows decision-making, requires higherlevels of government expenditure and hence taxation to maintain, andincreases the cost of doing business.
From the viewpoint of its effects on the economy, the impact of thebureaucracy is chiefly felt in three areas: the direct budgetary cost, theaddition to transactions costs, and the quality and efficiency of service. Sixissues must be considered.
292 Toward sustainable growth
The size of the bureaucracy
In modern times, public sector employment and the bureaucracy havegrown rapidly. Ayubi (1980: 243, Table 4) estimated that in 1952 about350,000 persons were employed in the civilian public bureaucracy; by2000 the figure had risen to over five million. Of course, the populationhad increased in the intervening years, but even on a per capita basis theincrease was from about two bureaucrats per 100 of the population tonearly eight per 100, and the latter figure does not include workers inpublic enterprises.
The rapid expansion of public sector employment commenced in 1956with the nationalization of French and British enterprises and acceleratedwith the nationalization of most major sectors of the economy in 1960–64.The ranks of the bureaucracy were swelled by the laws guaranteeingemployment to all graduates of certain types of institutions. This law hadlittle to do with the requirements of the state; rather, by providing employ-ment, it served as a sort of social safety net. The numbers employed in thepublic service continued to grow, and by 2000 the public sector employedabout one-third of the labor force.
In view of the size and growth of the bureaucracy, it is not surprisingthat efforts at reform have been more or less ongoing. Ayubi (1980:302–13) describes significant measures being initiated in 1881, 1915,1920, 1922, 1931, 1951, 1964, 1970, etc. Another major initiative waslaunched in 1994 as part of Egypt’s efforts at restructuring its economy ina more market-oriented direction.
However, the authorities have not succeeded in holding down thegrowth of government employment; in fact, the largest contributor toemployment growth during 1991–2000 was the government. Employmentin the government sector grew at nearly 5 percent per annum, almosttwice as fast as total employment, and contributed over 40 percent of thenet job creation during this decade. The continued expansion of govern-ment employment can be attributed to the increasing proportion ofpersons with higher education in the population and the pressure exertedby these groups. Over 400,000 graduates are added to the labor marketeach year, with perhaps half of them not possessing skills required in theprivate sector. Thus, in the 1990s the government sector employed 55percent of the university graduates and 47 percent of intermediate gradu-ates; when the public enterprise sector is added, the respective figuresbecome 70 and 63 percent.
Assaad (2000: 23) found that the biggest share of growth (34 percent)in government employment in 1988–98 was of educators. However, thenext biggest expansion was that of clerical staff, which grew at a rate ofalmost 6 percent per annum during this period and accounted for about27 percent of the expansion in government employment. Assaad pointedout that the growth in clerical workers could not be associated as easily
Toward sustainable growth 293

with the growth in government output as could be done in the case ofeducators. He attributed the continued hiring of clerical staff to the pres-sure to hire graduates, even though the graduate employment guaranteesystem was effectively suspended. Controlling the expansion of thebureaucracy still poses a challenge.
The structure of the bureaucracy
The bureaucracy is very hierarchical and marked by highly centralizeddecision-making. Even simple decisions are referred to senior levels withinMinistries and there is little delegation of authority. Weinbaum (1986:114) wrote that, “Government ministers resist delegating authority to theirdeputies who they perceive more in staff than line relationships and who,in most instances, are none too anxious to assume responsibility.” Theoften overlapping structure means that it is frequently necessary to obtainmultiple clearances and approvals, thus increasing delays and adding tocosts.
The complexity and inflexibility of administrative procedures and theslow working of the bureaucracy are evident in the time taken to completeroutine commercial tasks. A study by Djankov et al. (2000) examiningentry regulations in 75 countries ranked Egypt at the bottom of the list,using as criteria the number of administrative procedures, the timeneeded to establish a firm, and the cost involved. In Egypt an entrant wasrequired to complete 17 procedures regulating entry compared with 20 inBolivia (the largest number in the sample) and two in Canada (the small-est). It took 132 days in Egypt to establish a firm, compared with 172 daysin Mozambique (the worst case) and again two in Canada. The proce-dures cost an average of 2.2 times per capita GDP in Egypt, compared with2.6 times in Bolivia (the worst case) and 0.0096 times per capita GDPin the USA (the best case). Indeed, MOP/World Bank (2004) reportsthat Egypt ranked in the top 25 percent of countries in terms of cost ofregistration.
An idea of the costs imposed on the economy by such procedures canbe gauged from the benefits of reducing their number. Hoekman et al.(2001) estimated that if Egypt were to reduce the number of proceduresto 13 (as in Tunisia), industry markups would be reduced by 18 percent,because of the increased intensity of domestic competition. The reductionof the number to 11 (as in Korea) would further lower markups by 38percent.
Remuneration and incentives
The pay of civil servants has remained low and is not linked to productiv-ity. As a percent of GDP, budgetary expenditure on wages and salaries fellsomewhat after 1982, although in 2000 it still accounted for 32 percent of
294 Toward sustainable growth

current budgetary spending.8 This movement, while contributing to areduction in the budget deficit, has not been without negative effects.Handoussa and El Oraby (2004: Tables 3 and 4) report that the top of thesalary for the highest grade (First Under Secretary) increased only fromLE 2,000 in 1964 to LE 2,600 in 1999, an increase of 30 percent innominal terms over a period of 35 years. They calculate that in 1964prices, the 1999 salary works out to a mere LE 73.51. Similarly, in 1964prices, the salary range for Grade 6 (the lowest grade after 1978) droppedto LE 11.86–21.01 in 1999 from LE 330–600 in 1964. Even allowing for thevagaries of the price indices used in the calculation and the presence ofsupplementary benefits in 1999 that might cushion the pinch, the changemust represent a brutal compression.
The low pay of the civil service destroys morale – a study by the AlAhram Center in 1983 showed it to be, by far, the most important sourceof job dissatisfaction among civil servants – and encourages working at twoor more different jobs. Despite the legal prohibition against governmentofficials’ holding second jobs, Palmer et al. (1988: 61) reported that 89percent of their respondents acknowledged holding such second jobs.Moreover, 84 percent of those respondents holding second jobs devotedbetween 3–5 hours a day (i.e. half a normal working day) to the supple-mental job.
The inadequate salaries and the resulting low morale of the bureau-cracy could be a major impediment to fulfilling Egypt’s developmentaims. Ayubi (1980: 507) points out that government officials are not tech-nically ignorant of how to do something; rather, they are not sociallymotivated as to why they should do it. And Weinbaum (1986: 115) tellinglycomments that, “[The] same ministry employees who sit idly most of thedays . . . are examples of industriousness in hustling to make extra cashonce off the job.” The inadequate pay obviously also increases the dangerof a bureaucrat’s succumbing to illegal temptations. However, increasingthe pay to realistic levels for the numbers presently employed in publicservice would play havoc with the budget.
Productivity
Palmer et al. (1988: 45–71) found that productivity in Egyptian bureau-cracy was very low, when measured against a variety of indicators. Thereasons for the low productivity covered a wide range, with red tape (i.e.the rigid rules and regulations that had to be followed), apathy (resultinglargely from low pay), and inadequate training being the most significant.Moreover, as these writers comment (p. 62), “The multidimensionality ofthe problem suggests that major increases in worker productivity areunlikely to be achieved overnight.”
Toward sustainable growth 295
Quality
Studies have also demonstrated a significant connection between bureau-cratic efficiency and growth; in fact, Rodrik (1997) showed that differ-ences in the quality of the bureaucracy largely explained the divergence inperformance between the most and least successful East Asian economies.It is likely that the quality of the Egyptian bureaucracy is becoming dilutedthrough a process of adverse selection. A feature of Egypt’s labor market isthe “guaranteed employment scheme.” Under this scheme, graduates ofhigher educational institutions are guaranteed a job in the government.However, the average period between graduation and entry into govern-ment employment steadily lengthened, and by 2000 it exceeded six years.During this interval, the better-qualified graduates found higher paidemployment in the private sector, increasingly leaving public sectoremployment to the less well qualified.
The mismatch of skills between the requirements of public service andthose produced by the education system are staggering and persistent,and affect both the overstaffing of the government services and thequality. Waterbury (1983: 246) quotes an official report on this problemwhich noted that in 1975 the Ministry of Human Resources asked the Min-istry of Agriculture for the number of graduates that it would need in thefollowing year. The answer was 261 university graduates and 495 with sec-ondary agricultural diplomas. Facing this demand was a supply of 8,000graduates of agriculture faculties and higher institutes, and 11,000 holdersof agricultural secondary school diplomas. As Waterbury (1983: 234)noted, “The ills of the educational system have been visited upon the civilservice.”
Lest anyone think the foregoing example outdated, recent instances arereadily available. Nearly a quarter of a century after the incident describedby Waterbury, the Egyptian Mail (December 5, 1998: 2) headlined that,“Three million employees get paid for doing nothing.” The report quotedthe State Minister of Administrative Development as saying that, “Thereare five million [public] employees in Egypt, but there are only two millionjobs. It means that three million employees are doing nothing, not tomention that they can slow down the progress of the work.” He went on tosay that the country had to stop the habit of appointing ten persons to dothe job of one. As another instance, Galal (2002) reported that the govern-ment’s announcement in 2001 of the availability of 170,000 job openingswas met by a deluge of over five million applications.
An efficient bureaucracy is essential to moving the country expedi-tiously towards a market economy. Several suggestions for reform havebeen put forward. The general strategy proposed by nearly all of them hasbeen to “rationalize” (other euphemisms for “reduce” are not unknown)the numbers so that the available budgetary resources could pay theremaining civil servants a reasonable salary. A variant is the suggestion to
296 Toward sustainable growth
create élite, and higher paid, units for decisions that have a crucialbearing on economic development. An instance of this (proposed in theversion of the Möller report submitted to President Sadat in 1977) was toestablish an advisory and planning unit in the office of the President withsmaller units in the offices of the Prime Minister and other Ministers.These elite units, by-passing the normal civil service, would provide a high-quality group of officials who could react rapidly and who would assist theprincipal policymaker on economic matters.
However, as Dr Atef Ebeid pointed out, élite units would only be ableto play a largely advisory role, and would not be able to handle the nutsand bolts of administrative work, especially as most of this latter workrequired daily interaction with the public.9 Large numbers of civil servantswere involved, and hence there really was no way of avoiding reforms thataffected the bulk of the civil bureaucracy.
The original problem remains. So long as a significant part of publicsector employment functions, de facto, as a social protection mechanism,what will happen to the employees who fall victim to the downsizing? Whowill bear the political and social costs of the bureaucracy’s restructuring?No doubt the most palatable solution would be faster growth of theeconomy, so that many more jobs were created in the private sector.However, credentials that qualified workers for a job in the public sectorwould not necessarily equip them for one in the private. A program ofretraining and an expanded social safety net would thus appear to be crit-ical components of any sustainable reform of the bureaucracy.
Corruption
An issue that arises with the bureaucratic apparatus in many developingcountries is that of corruption. Studies have shown a strong link betweencorruption and investment. Mauro (1995) showed that a one-standarddeviation improvement in his corruption index was associated with anincrease in the investment rate by 2.9 percent of GDP for a large sampleof countries. He also found that a similar improvement in the corruptionindex was associated with an increase of 1.3 percentage points in theannual growth rate of GDP per capita.
Objective indicators of corruption are difficult to obtain. A number oforganizations have attempted to establish subjective indicators, usinggenerally consistent definitions. Mauro (1995) provides estimates by Busi-ness International for the 1980s, using a scale of 1–10 (best), which pro-vided scores for Egypt of 3 for red tape, 3.25 for corruption, and about 4for bureaucratic efficiency. Transparency International (2001) rankedEgypt 54th out of 91 countries in its “Corruption Perceptions Index,” witha score of 3.6. The country that came first (least corrupt) was Finland,with a score of 9.9. Some other countries in the region did better thanEgypt, such as Israel (16th) and Jordan (37th). The United Nations Arab
Toward sustainable growth 297

Human Development Report 2002 (Table 35) estimated the prevalence ofgraft in Egypt in 1998 at about the average for the Middle East region as awhole; this left it worse than in Jordan, Kuwait, Lebanon, Bahrain,Tunisia, the Occupied Palestinian Territory, and some other countries inthe region. Finally, Kaufman et al. (2002) estimated indicators such as“regulatory quality” and “control of corruption” for 2001. Egypt’s positionhad improved slightly from 1998, but was still significantly worse than for anumber of other countries in the Middle East.
The regulatory and judicial system
Two and a half centuries ago Adam Smith observed that “a tolerableadministration of justice” together with the maintenance of peace and lowtaxes was necessary to “carry a state to the highest degree of opulence.”10
The Egyptian legal system has undergone gradual reform during the pasttwo decades. Since the infitah the government has progressively amendedlaws with a view to making the legal system more market-friendly. Thisprocess accelerated after 1990. Several new or revised laws with possiblysignificant effects on the economy were introduced, including: CapitalMarkets Law (1992), Securities and Banking Law (1992), Dispute Settle-ment Law (1994 and amendments 1997), Insurance Law (1995), LeasingLaw (1995), Property for non-Egyptians (1996), and the Law on Invest-ment Guarantees and Incentives (1997). However, by the end of 2000,several important laws remained to be reformed, for example, the Com-mercial Code (1883, amended 1953), the Civil Code (1948), and theCivil/Commercial Procedure Code (1968).
Most criticisms of the Egyptian legal system are leveled at its delays andexpense. These are important weaknesses, because the concept of a free,private-sector-led, market economy is based on the premise of enforceablerights and contracts that are rapidly and efficiently executed.
Studies by USAID, the IMF, and the World Bank have found that inrecent years the average commercial dispute took six years to be decided.The cassation phase (in Egypt’s highest court) normally takes another fiveyears, while enforcement upon immovables can add another two to fiveyears. Substantial delays impinge on even minor commercial transactions.Djankov et al. (2001) showed that, even assuming that a plaintiff had com-plied with all the necessary regulations and was 100 percent right, the col-lection of a dishonored cheque would involve 15 separate proceduralactions and take 202 working days in Egypt, compared with 54 days in theUnited States; while an IMF/World Bank study in 2002 reported theaverage time to collect on a dishonored cheque in Egypt at three years,with cases of five years not unknown. Bentley et al. (1994, vol. 2: 68–9)found that completion of foreclosure under mortgages could easily takefive years. In addition to the problems and costs that these delays imposeon individuals and businesses, the long times required and the high cost
298 Toward sustainable growth

of collecting on securities and collaterals leads the banking system todemand excessive collateral, thereby restricting access, increasing the costof finance, and losing otherwise profitable customers.
The delays in the legal system chiefly result from understaffing, inade-quate litigation procedures, and poor infrastructure. Understaffing hascreated a very heavy and increasing caseload of the judges. Between 1987and 1995 the annual workload of new and pending cases increased bymore than 60 percent. According to the World Bank (1995a: 14), in 1993the average lower court judge received 3,173 new cases during the year,had 9,521 cases in process and reached decisions on 4,475 cases. Anaverage higher court judge received 975 new cases (plus appeals) a year,had 1,715 cases in process, and reached decisions in 806 cases. Overall, ajudge had an average daily docket of around 200 cases. It is estimated thatthe average caseload in Egypt in 2000 was nearly 8,000 cases per judge.Obviously, only a small fraction of this number can be decided, while theremainder goes to swell the backlog. In the mid-1990s the clearance rate(cases resolved as a percent of those filed) in the Egyptian judicial systemwas 36 percent, compared with 80–100 percent in developed countries.
Let me put these matters in international perspective. A study by Dako-lias (1999: 11) of the number of filed cases per judge in eleven countriesfound that in 1995–96 German judges received only 176 cases per year,French about 277, and state court judges in the United States about 1,300(close to the study’s average of 1,400). The Mahbub ul Haq Human Devel-opment Centre (1999: 66, Table 3.8) showed that even South Asian judgesfared better than their Egyptian counterparts: in 1996 the number ofpending cases per judge in Nepal was 314, in Pakistan 454, in India 2,137;the highest, for Bangladesh at 5,142, was still one-third less than thenumber in Egypt.
Litigation procedures are cumbersome and often repetitive; forexample, they allow for the automatic appeal of sentences (nearly 80percent of all cases are appealed) and the use of old evidence, whicheffectively turns the appeal into a second trial. This increases the judges’burden, lengthens the time for the final settlement, and adds to legalcosts.
The judicial system is badly under-funded. It is financed largely fromgeneral budgetary revenues and consistently receives amounts well shortof that required – for example, in 1994 it was allocated only 0.7 percent oftotal budgetary expenditures and on a per capita basis it ranked near thebottom of a sample of 12 developing and developed countries examinedby the World Bank (1995a: 16). This lack of resources is reflected in thelow salaries of judges (which makes it difficult to recruit and retain quali-fied personnel); and in weaknesses in judicial infrastructure, especiallyfacilities for the management of case files. As the overwhelming majorityof cases in Egypt is tried using written case materials, the efficient record-ing, retrieval, and maintenance of case files is vital.
Toward sustainable growth 299

The costs of accessing the judicial system are significant. A wide rangeof fees and charges is levied, and the combination of these prices raisesthe cost of doing business in Egypt. Bentley et al. (1994, vol. 2: 67) esti-mated that court costs associated with settling a commercial disputeamounted on average to about 7�� percent of the judgment amount, andwere very high relative to those in industrialized countries. Giugale andMubarak (1996: 5) point out that these costs were so high because ineffect the commercial legal system is set up to cross-subsidize the criminalbranch of the system. The long time taken by the cases means thatlawyers’ fees also mount up.
In view of the delays and the attendant expense, it is not surprising thatover 65 percent of sampled private firms in a World Bank study (1994: 15)preferred either to negotiate a partial settlement or to write off defaulteddebts completely. Only 25 percent sought court judgment for debt recov-ery; 83 percent had never sued anyone in court, and 47 percent of thosewho did go to court settled before trial. Small businesses suffered most,recording both the lowest rate of resort to the judiciary and the highestrate of unresolved cases.
Adapting the judicial system to the requirements of a market economywill involve recruiting additional judges and paying them sufficiently to bemotivated, trained, and retained. The judicial system also requires addi-tional funding for improving the infrastructure, such as computers foreasier storage and recovery of information, air-conditioners for courts sothat the summer recess could be shortened, and so on.11
It is impossible to overstate the importance of reforming the commer-cial legal system, because the lack of mechanisms for the efficient enforce-ment of contracts limits contestability, inhibits corporatization, increasesproject risk, and restricts technology transfers, especially from foreignpartners. It can also hamper the development of the financial system byraising the cost of collecting on securities and collaterals. A strong legalsystem is essential to the functioning of a market economy, particularly inthe enforcement of contracts. As Thomas Hobbes put it in 1651: “He thatperformeth first has no assurance that the other will perform after,because the bonds of words are too weak to bridle men’s ambitions,avarice, anger, and other passions without the fear of some coercivepower.”12
Apart from improving the functioning of the commercial judicialsystem, Egypt may need to reform the law itself in two areas. First, aneconomy is unlikely to be competitive internationally unless it is kept agileby competition at home. Much of Egypt’s economic system, particularlythe manufacturing sector, is shielded from competition. Import tariffs andnon-tariff barriers kept international competition at bay, while legalmonopolies and impediments to entry and exit ensured that competitionwas minimized domestically. Sustainable growth will require changes inlaw and its implementation in the direction of permitting greater con-
300 Toward sustainable growth
testability, both between enterprises in the private sector as well asbetween those in the private and public sectors.
The second area in which legal reform might be necessary pertains toreductions in the labor force. Egyptian labor, particularly in the publicsector, has long been granted virtually life-time security. Workers can bedismissed only for committing a “grave error,” and the law specifies thetypes of behavior that fall into this category and the procedures that mustbe followed before disciplinary dismissal is permissible. These proceduresare long and complex; moreover, surveys show that much of the privatesector finds ways to evade these regulations.13 This both removes protec-tion from workers and brings the law into disrepute. The job security pro-visions were instituted when the economy was more closed. In aglobalizing economy, Egyptian businesses must be able to respond rapidlyto changing demand conditions by appropriately adjusting the size andskill mix of their labor force. Suggestions for reform include allowinglayoffs with notification, severance pay, and perhaps unemployment insur-ance, in order to provide workers with protection while permitting firmsthe flexibility they need to succeed in an increasingly competitive environ-ment.
The tax system
Surveys have repeatedly shown that the private sector perceives the taxsystem as a major impediment to its efficient functioning. The WorldBank (1995a, vol. 2: 34–6) noted that the key problem was that the taxsystem gave to tax collectors both absolute powers and collection incen-tives. The power arose because tax inspectors were in practice permittedto assess the profitability of a business, and thus its liability to tax, indepen-dently of records. The incentive was provided through the payment of lowbasic salaries and high performance-related bonuses. Moreover, there wasno mechanism for appeal that was independent of the tax authorities. Taxassessments that were not settled on an informal basis became tax dis-putes, to be handled by committees (first an “internal” and then an “exter-nal” appeals committee) which were composed predominantly of taxofficials. If agreement was not reached at the committee level, the matterwent before the courts. Under the law, the taxpayer first has to pay theassessment decided by the external appeals committee; thereafter he cansue for reimbursement. Generally, the financial cost that would beimposed by the leisurely functioning of the judicial system drives the tax-payer to compromise at the stage of one of the committees.
The tax authorities follow a policy of complete auditing of all taxpayers;this imposes a heavy burden on the administration and is frequentlyimpossible to complete punctually. A business might not know until tenyears after submitting a tax declaration how much tax it has to pay.Although there is a five-year limit on claims by tax authorities, the World
Toward sustainable growth 301
Bank (1995a, vol. 2: 31) considered that the necessity of auditing everyform and the limited resources of the authorities “leads to the frequentuse of unfounded claims before the five years elapse in order to trigger asecond, five-year period of tax inspection.”
It is not surprising, therefore, that in order to reduce uncertainty andto avoid the aggravation of prolonged negotiations with the authorities, anestimated half of all taxpayers prefer to seek (or accept) “informal” settle-ments. But this route has a number of unfortunate consequences – thegovernment collects less revenue than would otherwise be due, and itcreates a major barrier to private investment because large corporationswill (a) find it difficult to adopt informal settlements, and (b) generallybalk at projects with uncertain tax costs. Problems with the tax system areespecially burdensome for foreign investors, who are largely unaware ofhow it works and thus are more likely to be deterred by the opacity andarbitrariness of its functioning.
The availability of long-term finance
The private sector’s access to long-term financing, i.e. for seven or moreyears, is quite limited. Three reasons largely explain this state of affairs.First, banks are generally reluctant to extend long-term credit to privatefirms. In part this stems from the banks’ difficulty in matching longer-term maturities with long-term savings, a state of affairs that could be cor-rected if they were allowed to bid freely for social security funds. In part itarises from the weakness of contract enforcement institutions, whichincreases risks for long-term lending. In part it springs from a lack ofcompetition in the banking industry and the dominant role of publicsector banks; it should be noted that public or semi-public firms havemuch easier access to term loans.
Second, the securities market remains thin – the American Chamber ofCommerce in Egypt (1996: 111) reported that during the 1990s less than5 percent of the capital raised by public and private sector firms camefrom the securities market. Most company listings are motivated by taxconsiderations, and their stocks are closed to public trading (usuallythrough rights of first refusal included in the corporate charters).
Third, the potential for leasing remains untapped. Industry sources inEgypt claimed that the chief constraint on the growth of the leasing indus-try was the uncertain enforcement of ownership rights.
Imbalances in the market for skilled labor
The training provided by the public technical and vocational schools wasdesigned for an economy in which growth was led by the public sector.Institutes for technical training were set up in considerable numbers andenrolment in them ballooned over the years: by 1997–98 there were over
302 Toward sustainable growth
1.85 million students in Technical Secondary Schools and over 183,000students in vocational schools. In addition, a survey by CAPMAS (1998)identified over 1,200 vocational training centers that were affiliated tovarious ministries, agencies, and public enterprises that in 1997 producedanother 175,000 graduates. There were also some 3,500 community-basedtraining centers. A capacity to produce substantial numbers of skilledworkers thus exists.
However, there is an evident mismatch between the skills imparted bythese institutions and those in demand in a private-sector-dominatedmarket, especially in the institutions forming part of the system of highereducation. In 2000, the higher education sector in Egypt consisted of 12public universities, four private universities, and 51 public non-universityinstitutions. Of these last-named, 47 were middle technical institutes.It was found that in recent years over 60 percent of the graduates ofthese institutes remained unemployed for at least two years followinggraduation.
There are two main obstacles to building relevant skills in Egypt. Basedon a survey of 208 private firms, World Bank (1995a, vol. 2: 45, Table 3.8)found that, first, many of the technical institutions were market-insensitivein that: (a) they turned out an enormous quantity of graduates relative tomarket needs (about six to seven times more technical and vocationalgraduates per year than the demand); and (b) the job-specific skillsacquired by these graduates were of little use for small enterprises, whichwas the only sector in which evidence of unsatisfied demand for formally-trained technicians was found. Second, the private sector seldom partici-pated in a formal training process; the CAPMAS survey referred to earlierlisted only 15 private sector vocational training centers (in an admittedlyincomplete census, but other evidence also points in the same direction).Larger firms are reluctant to make long-term investments in humancapital because of fears of labor turnover, and micro and small enterprisesgenerally lack the resources to provide training.
The issue is how to produce the skills demanded by the market. Thiswill demand, first, a change in philosophy – away from producing a trainedlabor force drilled in rigid ways in obsolescing technology, towards a con-tinuously trainable labor force that can react more flexibly by understand-ing the principles of the technology and being better skilled atproblem-solving. Second, it will require an involvement of the privatesector in redesigning the curricula for the vocational and technical train-ing institutions, so that the training that is provided is in fact relevant todemand conditions in an increasingly private-sector-led economy. Third,it will call for a significant injection of resources for training the trainers;according to the CAPMAS (1998) survey of 1,237 vocational centers, only35 percent of the trainers had any pedagogical training and only 50percent had attended any advanced practical training.
Toward sustainable growth 303
A strategy for poverty alleviation
It is difficult to see how a strategy for sustained growth that requiressignificant sacrifices from the population can be maintained in the absenceof a visible improvement in the standard of living of the poorest. An earlierchapter described how poverty is estimated to have increased between 1982and 1996 and declined thereafter until 2000. It is beyond the scope of thischapter to prescribe a detailed strategy for poverty alleviation; such anenquiry would have to scrutinize virtually every part of the economy. Thischapter attempts something more modest: an outline of an approach andof policies that would be essential in a program of poverty alleviation.
The salient facts on poverty described in Chapter 9 and the myriad ofstudies on poverty reduction suggest that a strategy for poverty alleviationshould be based on four elements: rapid growth of the economy;emphasis on education and relevant training; an explicit plan for thedevelopment of Upper Egypt; and a reinforced social safety net.
Growth
This chapter has laid out the rationale for rapid economic growth, dis-cussed the main policies required to generate it, and described the institu-tional reforms necessary to support it. The remainder of this section willtherefore concentrate on the other elements of the approach to alleviat-ing poverty.
Education
It was shown in Chapter 9 that education was the most prominent corre-late of poverty; thus it is likely to provide the most promising path out ofit. Figure 10.3 shows the chances of being poor by level of education;these range from 24 percent for the illiterate to 2 percent for those withuniversity education.
The HIES 2000 and MOP/World Bank (2004: 29) point to four majorlinks between poverty and education.
• The poor suffer from high illiteracy: 46 percent of the poor are illiter-ate. The situation is particularly serious because households with illit-erate heads tend to have a higher proportion of illiterate children;illiteracy tends to be perpetuated across generations.
• A person who can read and write, but has no other formal education,earns a much higher income than someone who is illiterate.
• Rates of return are low for basic and secondary education, which sug-gests that the quality of education at these levels is poor. Indeed,MOP/World Bank (2004: 29–30) suggested that moving up fromsimple literacy to completing basic education could produce negativeprivate rates of return. In other words, the higher income earned by
304 Toward sustainable growth

someone completing basic education does not necessarily compensatehim for the income he forgoes while acquiring this education.
• The indirect costs of education, especially the income forgone, can beburdensome for poor families. MOP/World Bank (2004: x) estimatedthe income forgone from attending secondary school at LE 2,615 in2000.
Continued efforts to eradicate illiteracy must form the linchpin of apoverty-alleviation strategy. The government should be able to enroll theassistance of groups from civil society to supplement its own efforts.Second, the distribution of primary school classrooms shows a markedcorrelation with the poverty of the governorate. An accelerated programto expand the number of classrooms in the poor governorates, especiallyin Upper Egypt, is imperative. Third, the enrolment of girls must bestepped up. Fourth, the quality of basic and secondary education must beimproved, because the very low or negative rates of return suggest that theprivate sector is not prepared to pay high wages for the products of theeducational system at these levels. Measures that would help in this direc-tion would be to emphasize performance and link it to awards for schoolsand teachers; to improve teaching skills; and to emphasize technologyskills that would bring education more in line with what the marketdemands. Fifth, special measures will be needed to enhance the access ofthe poor to education. MOP/World Bank (2004: 27) studied the inci-dence of benefits for different income groups from public spending oneducation. It found that the poorest quintile received only 15.6 percent of
Toward sustainable growth 305
Per
cent
age
25
20
15
10
5
0
Illite
rate
Liter
ate
Basic
Secon
dary
Diplom
a
Univer
sity
Post-u
niver
sity
Figure 10.3 Chance of being poor by level of education, 2000 (percent) (source:CAPMAS (2002; MOP/World Bank (2004)).
total public spending on education in 2000, while the richest quintilereceived 21.8 percent. This was largely because (a) enrolment in almost alllevels of education was lower for the poor than for the non-poor; and (b)a significant fraction of public spending went to post-basic education (sec-ondary, university, post-university, and technical institutes) in which theenrolment of the poor was very low. The report suggested that educationspending be reallocated to types of schools where the poor were mostlikely to enroll, i.e. basic education, and to regions in which the poor wereconcentrated.
The special problem of Upper Egypt
A notable finding from the HIES 2000 was that during a period(1996–2000) in which poverty decreased in other parts of the country, itincreased in Upper Egypt. This suggests that a passive “trickle-down”policy is unlikely to work.14 An active policy, targeting the povertycharacteristics of Upper Egypt and tailored to that region’s resourceendowments and social realities, will have to be adopted.
The pattern of regional growth witnessed during the 1990s is notaltogether surprising. The Metropolitan governorates benefit from theirgeographical location, and from their administrative position in an eco-nomic system that requires government permission for the conduct ofmost economic activities – three of these governorates are port cities whilethe fourth is the country’s capital.15 Hence, they have the advantage oflower transport costs which are particularly important when manufactur-ing contains a high import component, as it does in Egypt. They also gainfrom easier access to government officials for obtaining the requisite per-missions and licences. Moreover, because these cities are home to largenumbers of high government officials, the infrastructure and other facili-ties in these areas are substantially better; this acts as a further magnet forindustry and other desirable activities. Not unexpectedly, MOP/WorldBank (2002: 47) found that in 1996–2000, all manufacturing sectoremployment growth and the largest growth in public administrationworkers took place in the Metropolitan/Lower Egypt region.
The facts of geography and administrative structure described abovepose a challenge. While not much can be done to move Upper Egyptcloser to the sea, it should certainly be possible to improve communica-tions between it and the rest of the country, and thereby reduce transportcosts. As part of the institutional reforms, it should be possible to elimi-nate most of the bureaucratic interventions in the economic process, thusremoving several of the most pressing compulsions for locating economicactivities near Cairo. A great deal can also be done to improve the infra-structure, especially educational facilities, in Upper Egypt. A region-specific development strategy for Upper Egypt will have to be prepared. Inthe long run, the development of Upper Egypt may have to concentrate
306 Toward sustainable growth

on the production of high-value, low-weight items, such as computer chipsand electronic items, and on the provision of services (such as account-ing) “out-sourced” for large parts of the domestic and possibly inter-national market (as is already done in India for many US-basedmultinational enterprises). This latter activity will again require invest-ment in education and in better communication facilities, and possiblylegal reform.
Social safety nets
Finally, there will always be individuals who, for reasons of health, educa-tion, location, or some other disadvantage will be unable to benefit fromthe country’s economic growth, and there will always be temporaryperiods when an individual or family requires support in the form of asafety net. Even in its quest for economic efficiency, a humane societymust recognize the need to temper the wind to the shorn lamb.
The existing social safety net consists of three main programs: the con-sumer food subsidies, the cash transfers from the Ministry of Social Affairs,and the Social Fund for Development. In addition, there is the socialinsurance system (described earlier).
The food subsidy program is by far the largest safety nets program,accounting for about 1.5 percent of GDP (nearly LE 75 per capita) in2000. The subsidy on baladi bread was the most effective subsidy in liftingpeople out of poverty.16 MOP/World Bank (2002: 57) estimated thatwithout the bread subsidy 730,000 more people would have been inpoverty in 2000. However, Upper Egypt and rural areas derived lessbenefit from the baladi bread subsidy, because they had fewer outlets. Thisargues for better geographical coverage of the subsidy program.
Because poverty in Egypt is shallow, i.e. most poor people are clusteredjust below the poverty line, a relatively small increase in the income of thepoor can lift a substantial number out of poverty. MOP/World Bank(2002: 58) estimated that if there had been perfect targeting of the socialsecurity transfers of the LE 449 million in 2000, the poverty rate wouldhave been just over 14 percent and 1.9 million persons (18 percent of thepoor) would have come out of poverty. The perfect distribution of eventhis small amount would exceed the impact of a 3 percent annual growthrate of GDP. A strengthening of the social safety nets, involving greaterexpenditures and better targeting, must therefore form an effectiveelement in the poverty-alleviation strategy.
The environment
Egypt’s environmental resources – air, water, and land – are under stress.A report by the World Bank (2002) estimated the damage cost of environ-mental degradation in 1999 at LE 10–19 billion, or 3.2–6.4 percent of
Toward sustainable growth 307
GDP, with a mean estimate of LE 14.5 billion or 4.8 percent of GDP. Thisis a very substantial share of GDP and is about two times higher than inhigh-income countries.17 Applying the same methodology, Sarraf (2004:Table 1) found that the cost of environmental degradation was also sub-stantially higher in Egypt than in other developing countries in theregion. The average cost (as a percentage of GDP) was: Tunisia 2.1; Syria3.3; Lebanon 3.4; Algeria 3.6; and Morocco 3.7.
The cost of air pollution was put at 1.1–3.2 percent, followed by soildegradation (from erosion and salinity) at 1.0–1.4 percent of GDP. Of thetotal damage cost, about two-thirds was from damage to health and one-third from the degradation of natural resources. Moreover, the foregoingestimates were only partial. No costs were attributed to degradation associ-ated with industrial, hazardous, and hospital waste; even though thesecould be substantial. Thus, a study for USAID by PRIDE (1994, vol. 1: III-7) estimated that industry and hospitals in Cairo alone produced up to65,000 tons annually of hazardous and infectious wastes that received nospecial management but were simply dumped. The World Bank reportcould also make only limited estimates of degradation caused by inade-quately treated waste water, but regarded the problem as substantial. Inaddition to the costs to Egypt, there was a further cost to the globalenvironment, which was estimated at 0.6 percent of GDP.
The health and other impact of the environmental degradation wereserious. It is estimated that about 17,000 children die (20 percent of allchild deaths) every year in Egypt from diarrheal diseases caused by sub-standard water quality, and inadequate sanitation and hygienic facili-ties. Apart from death, the degraded environment also leads to highermorbidity, and to other enduring damage. Thus, the PRIDE study(1994, vol. 2: D-28) estimated that because of exposure to lead in Cairo,an average of 4.25 IQ points was lost per child, and that over 11,000heart attacks and premature deaths could be prevented annually inolder adults if the blood lead levels in Cairo were reduced to those inthe United States.
The World Bank’s mean estimates of the annual cost of environmentaldegradation in 1999 are displayed in Table 10.1. The estimates arenecessarily rough but, if anything, probably err on the low side andprovide an interesting first approximation.
Nile water
No exploration of Egypt’s economic future can be complete without dis-cussing the issue of water. Much of the new development that is envisaged– additional cultivated acres, new cities in the desert, self-sufficiency inbasic foodstuffs, population transfers out of the Nile Valley – carriesserious implications for water availability and use. More than 20 years ago,Waterbury (1979: 231) recommended that Egypt weigh all projects in
308 Toward sustainable growth
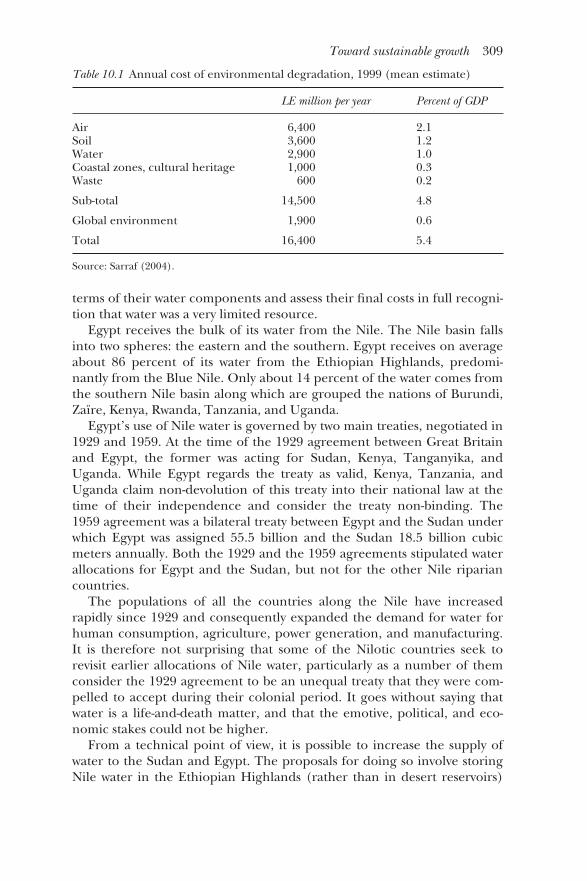
terms of their water components and assess their final costs in full recogni-tion that water was a very limited resource.
Egypt receives the bulk of its water from the Nile. The Nile basin fallsinto two spheres: the eastern and the southern. Egypt receives on averageabout 86 percent of its water from the Ethiopian Highlands, predomi-nantly from the Blue Nile. Only about 14 percent of the water comes fromthe southern Nile basin along which are grouped the nations of Burundi,Zaïre, Kenya, Rwanda, Tanzania, and Uganda.
Egypt’s use of Nile water is governed by two main treaties, negotiated in1929 and 1959. At the time of the 1929 agreement between Great Britainand Egypt, the former was acting for Sudan, Kenya, Tanganyika, andUganda. While Egypt regards the treaty as valid, Kenya, Tanzania, andUganda claim non-devolution of this treaty into their national law at thetime of their independence and consider the treaty non-binding. The1959 agreement was a bilateral treaty between Egypt and the Sudan underwhich Egypt was assigned 55.5 billion and the Sudan 18.5 billion cubicmeters annually. Both the 1929 and the 1959 agreements stipulated waterallocations for Egypt and the Sudan, but not for the other Nile ripariancountries.
The populations of all the countries along the Nile have increasedrapidly since 1929 and consequently expanded the demand for water forhuman consumption, agriculture, power generation, and manufacturing.It is therefore not surprising that some of the Nilotic countries seek torevisit earlier allocations of Nile water, particularly as a number of themconsider the 1929 agreement to be an unequal treaty that they were com-pelled to accept during their colonial period. It goes without saying thatwater is a life-and-death matter, and that the emotive, political, and eco-nomic stakes could not be higher.
From a technical point of view, it is possible to increase the supply ofwater to the Sudan and Egypt. The proposals for doing so involve storingNile water in the Ethiopian Highlands (rather than in desert reservoirs)
Toward sustainable growth 309
Table 10.1 Annual cost of environmental degradation, 1999 (mean estimate)
LE million per year Percent of GDP
Air 6,400 2.1Soil 3,600 1.2Water 2,900 1.0Coastal zones, cultural heritage 1,000 0.3Waste 600 0.2
Sub-total 14,500 4.8
Global environment 1,900 0.6
Total 16,400 5.4
Source: Sarraf (2004).

and draining the giant Sudd swamp in the southern Sudan. Both theseprojects would increase the supply of water by decreasing the huge lossesthat currently occur through evaporation. However, each of theseschemes faces serious difficulties. Egypt is reluctant to risk storing a sub-stantial part of its water in some other country, while draining the Suddcould destroy the livelihood of the population that lives in the region byeliminating the grazing grounds on which the pastoralists of the areadepend, and by adversely affecting the rainfall and climate by reducingthe evaporation to the atmosphere.
Only a cooperative effort by the major affected countries can create a“win-win” outcome. Such an effort will require the building of trustbetween the major riparian countries (a process that would be facilitatedby joint activities beyond those connected exclusively with the use of theriver), a conviction by them of the importance of rational management ofthe entire watershed in order to ensure sufficient water for their develop-ment plans, and a recognition that the greater integration of theireconomies could enable Nile water to be used in a manner that benefitedmore than just the country directly using it.
Planning and economic management
Traditional methods of planning will have only limited efficacy or evenacceptability in the evolving economic environment. A review of the accu-racy of planning projections during the last two decades demonstrates thedifficulty of making such projections in an economy that is becomingincreasingly privatized, decentralized, and globalized. The accuracy offorecasts can be assessed using different indicators, such as the averageerror of the forecast, the mean absolute error of the forecast, and the rootmean squared error (RMSE).18 The method used in the Centraal Planbu-reau of the Netherlands employs a variant of Theil’s “U-statistic,” definedas the quotient of the RMSE of the forecast and the RMSE of the corre-sponding naïve forecast. The naïve forecast is taken to be equal to the esti-mated realization of the variable in the preceding year.19
The U-statistic has a number of properties that make it attractive forassessing the precision of forecasts. The most important are that U�0 ifand only if the forecasts are all perfect (the projected outcome is equal tothe realized outcome); and that U�1 when the projection procedureleads to the same RMSE as the naïve projection. The U-statistic has noupper bound, which means that it is possible to do considerably worse thanby extrapolating on a naïve, no-change basis. Thus, the higher the value ofU, the less precise is the projection, and if U�1, then the projections areon average worse than the naïve forecasts. Theil (1966: 27–8) provides aninterpretation of the U statistic – a value of, say, U�1.25 means that theRMSE is 125 percent of the RMSE that would have been observed if theforecaster had confined himself to a no-change extrapolation.
310 Toward sustainable growth

Table 10.2 displays the value of U for the projected GDP growth rate,for public and private investment, and for employment in each of the five-year plan periods from 1983–2002. It shows that the forecasts of the vastmajority of these variables were less precise than a simple “no-change”extrapolation; the exceptions were the GDP growth rate in the Third Plan,and employment in the Third and Fourth Plans. The performance of theemployment forecast is not surprising: aggregate employment is much lessvolatile than GDP growth or investment. The level of employment in anyyear depends rather strongly on its level in the previous year, and this rela-tionship can make it easier to predict this variable. As might be expected,the projections of private investment were the least satisfactory. Sinceprivate investment now occupies a very large part of the total – the FifthPlan (2003–07) projects it at about two-thirds of total investment – and isexpected to keep increasing, the consequences of imprecision in estimat-ing this variable are bound to become even more important.
Changes in the economic environment mean that in the coming yearsthe methods of planning and economic management will have to befundamentally revised. The altered role of planning is occasioned by twomajor considerations: the increasing privatization of the Egyptianeconomy and the pressures of globalization. These two changes aresteadily diminishing the space within which the government can exercisedirect control over the economy, and increasing the degree of uncertaintyattending on economic decisions. Consequently, an approach to planningthat takes the form of mandating targets for investment, employment,distribution, and so on, is unlikely to work, because the governmentwill lack the tools to ensure compliance. Increasingly, methods ofmanaging the economy will have to be more indirect, and will have to relyon the use of financial incentives and disincentives. The authorities willalso have to focus much more on coordinating the actions of differentdecision makers in the economy in pursuit of goals that are clearly seen tobe beneficial to all parties. Substantive consultations with the privatesector on its plans for investment, production, export, pricing, andemployment will therefore be imperative in the development of futureplans.
Toward sustainable growth 311
Table 10.2 Precision of plan forecasts, 1983–2002 (Theil’s U-statistics)
First plan Second plan Third plan Fourth plan (1983–87) (1988–92) (1993–97) (1998–2002)
GDP growth rate 1.13 1.65 0.91 1.57Public investment 2.02 2.11 3.59 1.97Private investment 4.65 2.33 1.21 2.34Employment 1.09 1.10 0.35 0.68
Source: Computed from Ministry of Planning data.

Reinforcing these factors is a further issue. As Egyptian society becomesmore decentralized and democratic, it might be unduly limiting on anindividual’s freedom of choice to have a central authority continually tellhim or her what is best. In any case, such an approach would becomeincreasingly difficult to implement as the economy became more complexand individuals’ tastes and demands more diverse. In this situation, itwould be more politically responsive to try to ascertain from communitiestheir ordering of preferences from choices that could be made availableto them. Experience (including a pilot exercise in Egypt’s 1978–82 Plan)has shown that this “participatory” approach need not entail a higherfinancial cost to the government than would the allocation of resources byfiat, and brings much higher political dividends because it responds toclearly felt needs.20
The method of planning that has found increasing favor in countrieswith mixed economies is “indicative” planning. This type of planning wasintended to respond to the perceived failure of the market system inattaining socially desirable objectives. It is distinguished from other policyinstruments that deal with market failures in that it focuses on market fail-ures that result from failures in the nature or availability of information.
The basic theory behind indicative planning has been articulated byMeade (1970), Estrin and Holmes (1983), Crémer and Crémer (1994),and others, but perhaps most succinctly by Brada and Estrin (1990). Thelatter argue that since forward markets do not exist for many commoditiesand services, economic agents are forced to make decisions based onincomplete or incorrect information. This lack of coordination is likely toproduce a sub-optimal allocation of resources, which will impact adverselyon saving, investment, and future growth. On the other hand, if credibleforecasts of future production, exports, imports, labor market trends, andso on were available, they would provide much the same information aswould prices generated by a complete system of forward markets. The pro-vision of missing information about the future by means of indicative planswould enable economic actors to share a coherent view of the future. Thisshould lead to more efficient decisions and a more optimal allocation ofresources. The government would reinforce the informational and exhor-tative effects by measures such as taxes, subsidies, and interest rates, topush private decisions in directions that were judged to be socially optimal.
Some concluding remarks
This book has covered too much ground to permit an easy summary, butit may be useful to reiterate some points.
1 Population growth has slowed to about 2 percent per annum, buteven at this rate the population will double in a generation. Moreover,the previous and present growth of population will continue to add
312 Toward sustainable growth

substantial numbers to the labor force, for whom productive employ-ment will have to be created. Thus, Egypt cannot afford to relaxefforts to curb the rate of population growth.
2 The principal impediment to Egypt’s economic growth during1960–2000 was the foreign exchange constraint. Egypt grew when theforeign exchange constraint was lifted, which during this period wasgenerally brought about by extraneous events. In the mid-1970s theconstraint was removed by the fortuitous concurrence of the “BigFive” and the actions of GODE. In the mid-1980s and in the first halfof the 1990s, the constraint was eased by forgiveness and restructuringof external debt. However, these successive dei ex machina disguisedthe problem, rather than correcting it. If Egypt is to become lessvulnerable to the vagaries of external events and to the caprices offoreign donors, it must make a concerted effort to increase its ownforeign exchange earnings.
3 A major barrier to increased investment, and hence to growth, was thelow level of savings. During 1960–2000, domestic savings fell short, attimes seriously short, of investment. This, of course, increased the vul-nerability of the country because the gap had to be filled by foreignsavings.
4 The cost of doing business in Egypt remained high because of inade-quate infrastructure and severe institutional constraints. In order tosustain a real growth in its GDP of around 7 percent a year, thecountry will have to put in place a number of “second generationreforms.” These reforms focus chiefly on institutions such as thebureaucracy, the commercial judicial system, the system of taxation(which affects the incentives to work and to invest), the labor marketand the systems of human resource development, and the financialsystem. The absence of such reforms is likely to severely restrict theeconomy’s trajectory.
5 Policymaking will have to focus more on devising policy packagesrather than concentrating on single policies. For example, the effectsof exchange rate adjustment will be larger and more durable if theyare accompanied by simultaneous reforms to the export creditmechanism and to the working of the ports; changes in tax rates willproduce substantially more revenues if tax administration is strength-ened at the same time as rates are adjusted, and so on.
6 Sustainable growth will require a change in the approach to dealingwith some crucial sectors of the economy. Perhaps the most importantof such philosophical changes is the attitude towards export growth. Alesson for Egypt from the fast-growing economies of East Asia is that aspectacular growth of exports can be founded on imports, and is notlimited by natural resources indigenous to the exporting country.Most of East Asia’s chief exporters – such as Japan, Korea, Taiwan,Hong Kong, Singapore – are poorly endowed with natural resources.
Toward sustainable growth 313
Their striking growth is based on importing raw materials and semi-finished goods, adding value efficiently by a well-trained labor force,and then exporting the final products at a competitive exchange rate.It is important, therefore, to level the playing field as regards Egyptianimport costs with those of competitors. These issues have been dis-cussed in detail in this book, and involve measures such as the lower-ing of import tariffs, the reduction of handling costs, and theexpeditious and costless rebating of import duties on the importedcomponent of exports.
7 The key to Egypt’s accelerating its growth is higher investment andincreased productivity. The reason for harping on improved produc-tivity (apart from questions of competitiveness) is that without animprovement, achieving the required GDP growth rate will require asustained rate of investment that is unlikely to be realized. A back-of-the-envelope calculation can illustrate this.
The Cobb–Douglas production function can be rewritten as:
Y*�A*��LL*��KK*
to show how the growth rate of output depends on the growth rates of theinputs. Y*, A*, L*, and K* are the rates of growth of, respectively, output,total factor productivity, labor, and capital, and �L and �K are weights, theeconomic interpretation of which is the marginal products of labor andcapital. This equation is the standard growth accounting framework foranalyzing the sources of output growth.
The question to be addressed is: how can the output growth beincreased to 7 percent per year? Without productivity growth, the entireoutput growth must come from the growth of labor and capital. The laborforce is projected to increase at an annual rate of 2.7 percent. Mohammed(2001) estimated its weight in the Cobb–Douglas function at 0.4; thus, theexpanding labor force would provide a GDP growth of 1.08 percent a year.
The rest of the growth would have to be provided by increasing the rateof growth of the capital stock. The growth of capital stock (i.e. net invest-ment) gets a weight of 0.6. In order to generate the remaining outputgrowth of about 6 percent a year it would have to grow at an annual rateof nearly 10 percent in real terms – virtually double the 5.3 percent a yearreported for the decade 1990–2000. A significant increase in productivityis necessary so that the required GDP growth can be brought about with agrowth in the capital stock that can realistically be expected.
This chapter has attempted to develop a framework for thinking aboutissues that will be crucial to sustaining a high rate of economic growth inEgypt over the next two or three decades. In highlighting some areas, Iam conscious that I have occluded others. The principal omission is a dis-cussion of sectoral issues.
314 Toward sustainable growth
I must, however, touch upon a vital question. This chapter has exam-ined issues of improving governance, strengthening institutions, and pro-tecting the environment. However, the focus has largely been on whatmust be done to sustain the growth of GDP, because this indisputably isone of the most important means by which Egypt can provide a better lifefor its citizens. But one must not be blinded to the crucial questions of thenature and purpose of this growth.
At the beginning of his Nicomachean Ethics, Aristotle observed that“wealth is evidently not the good that we are seeking, for it is merely usefuland [sought] for the sake of something else.” In modern times, the workof Amartya Sen, Mahbub ul Haq, Paul Streeten, and others has drawnattention to the shortcomings of the GDP as a measure of human welfare,and emphasized the necessity of taking a wider view of the aims and theprocess of development. Thus, Sen, who has elaborated this line of think-ing most fully, writes (1999: 14), “An adequate conception of develop-ment must go much beyond the accumulation of wealth and the growth ofgross national product and other income-related variables. Without ignor-ing the importance of economic growth, we must look well beyond it.”Furthermore (Sen, 1995: 8), “It is crucial to avoid the mistake of takingthe growth rate of GNP to be the ultimate test of success, and of treatingthe removal of illiteracy, ill-health and social deprivation only as possiblemeans to that hallowed end.” Or as Haq (1995: 4) expressed it, “GNP canincrease while human lives shrivel.”
For Sen (1999: 14–15), economic development cannot be an end initself, “but has to be more concerned with enhancing the lives we lead andthe freedoms we enjoy.” Haq (1995: 3) similarly argues that “people areboth the means and the end of economic development,” and develops thispoint in his other writings and in the series of the UNDP’s Human Develop-ment Reports that he pioneered. Economic growth is essential to humandevelopment, but one must pay attention to its quality and distribution, itslink with human lives, and its long-term sustainability.
These writers do not decry GDP growth, but they emphasize it as animportant means of development, not its end. The end of development issomething wider; as Sen (1999: 74) argues, it is the creation of “the sub-stantive freedoms – the capabilities – to choose a life that one has reasonto value.”
It is for these reasons that I said at the beginning of this chapter thatthe provision of an adequate income was only a starting point for Egypt’smeeting its societal challenge. The broader themes of the content of eco-nomic growth, the social and other changes that are its inevitable compan-ions, its distributional and environmental costs, and how all these impacton the lives of Egyptians cannot be isolated from a vision of long-termdevelopment for Egypt, and are crucial issues for societal debate.However, reasons of space preclude a discussion here, and it will have tobe deferred to another work. Insha Allah.
Toward sustainable growth 315

Annex
Some simple calculations are given here to provide an indication of theorders of magnitude that would be involved if the policymakers sought tocompletely eliminate the external deficit at one swoop.
First, if policymakers had wanted to completely eliminate the externaldeficit in 2000 through contractionary macroeconomic policy, by howmuch would income have had to be cut in order to secure the necessaryreduction of imports?
In a simple Keynesian open-economy model that includes both govern-ment and foreign trade, the international trade multiplier can be definedas: k�1/(s�m� t), where s and m are the marginal propensities to saveand import, and t is the marginal rate of taxation.21 Between 1992 and2000, rough estimates for Egypt would be s�0.16, m�0.19, and t�0.09(excluding taxes on the Suez Canal and EGPC).22 The multiplier con-sequently works out to 2.27. This, let it be repeated, is only a rough figureand ignores some complications that a more sophisticated exercise wouldincorporate.
The estimate is lower than the 2.63 calculated by Tsegaye (1981) forEgypt in the 1970s. However, it is not far from careful estimates of themultiplier derived from econometric models for developed countries,which typically range between 1.4–2.0 (although one of the Brookingsmodels for the USA reported a multiplier of 2.79); see Hopkin andGodley (1965), Surrey (1971), Thirlwall (1974), and Church et al. (1995)for the United Kingdom, and Artus (1989: 137) for France, the USA, andCanada. The rough estimate of this chapter is also consistent with Blinderand Solow (1974: 88) who, after summarizing the empirical evidencefor the United States, remark that “a fiscal policy planner will not oftenbe led astray if he uses a multiplier of two in his back of the envelopecalculations.”
In 2000, the overall deficit, excluding official transfers, was estimated atLE 15,265 million, while the current account deficit was LE 7,760 million.If the overall deficit were to be reduced to zero, then GDP would have tobe reduced by �M�m�Y, where M is total imports and Y is the GDP.
i.e. �15265�0.17�Yi.e. �Y��15265/0.17��LE 89,795 million.
GDP at market prices in 2000 was LE 339,000 million, so a reduction ofabout 26 percent in GDP would have been required to reduce imports suf-ficiently to eliminate the overall deficit. A similar calculation shows thatGDP would have to fall by 13.5 percent in order to reduce imports by LE7,760 million, to balance the current account. These are substantial losses,and would require consumption to be squeezed very hard, or investmentand future growth prospects to be severely compromised. It points out a
316 Toward sustainable growth

potential conflict between the attainment of an “internal” target for thecountry, such as poverty reduction, and an “external” target, such as thetotal elimination of a balance of payments deficit.23
Second, what if policymakers wanted to eliminate the deficit by increas-ing foreign exchange earnings, while still maintaining equilibrium innational income? Could they do this by expanding exports (used here as ashorthand for foreign exchange earnings) by LE 15,265 million? Anincrease in exports will increase GDP, but this in turn will also induceadditional imports. Thus, policymakers must aim at increasing exports byLE 15,265 million more than the increase in induced imports, i.e. the aimis �X��M�15,265. The change in M induced by the increase in Y ism�Y; hence, the aim is �X�m�Y�15,265. The change in Y induced bythe export expansion is �X times the multiplier, i.e. k�X. Thus,
i..e �X�mk�X�15,265i.e. �X�0.17[1/(0.16�0.09�0.19)]�X�15,265i.e. �X�0.17(2.27)�X�15,265i.e. �X�LE 25,025 million.
Total earnings (merchandise exports, non-factor services, investment andother income, and workers’ remittances) in 2000 were LE 79,540 million.Hence, eliminating the overall deficit by expanding foreign exchangeearnings would have required the latter to increase by about 32 percent.
The foregoing calculations are intended only to give some indication ofthe orders of magnitude involved in making these policy choices. In prac-tice, more detailed computations would have to be undertaken usinginput–output tables to provide disaggregated import coefficients, and analternative definition of the multiplier might have to be employed. Forexample, Thirlwall and Gibson (1994: 130–9) criticized the traditionalformulation of the multiplier, which relates increases in imports toincome via the marginal propensity to import (as was done here). In theirview, imports should be linked to expenditure, not income, because relat-ing imports to income implicitly assumes that all expenditures have thesame ratio of imports to expenditure. Thirlwall and Gibson show that themultiplier will vary according to the import content of the initialautonomous expenditure change (i.e. depending on whether it is govern-ment investment, private investment, government consumption, privateconsumption, exports, etc.) and that the value of the multiplier that takesthese distinctions into account will, in general, differ from that of the mul-tiplier defined in the usual manner. Thus, Tsegaye (1981) used the 1954input–output table for Egypt to calculate such differentiated multipliers,obtaining values ranging from 5.05 for an increase in private consumptionto 5.47 for an autonomous increase in exports.
Toward sustainable growth 317

Notes
1 Economic development and policymaking, 1952–73
1 Quoted in Baker (1978: 102).2 Until June 1972 the Egyptian fiscal year ran from July 1 to June 30 of the
following year, and was frequently written as a split year; for example, the fiscalyear ending in June 1972 would be written as 1971/72. From 1973 to 1979 thefiscal year was changed to a calendar year basis, but from July 1980 it revertedto a June–July basis. In this book, a simpler transcription has been adopted;thus the fiscal year ending in June 1972 simply appears as 1972. The text willmake clear if a calendar year is meant.
3 Wahba (1994: 54–5); O’Brien (1966: 71–2).4 O’Brien (1966: 85).5 Mead (1967: 272–3); O’Brien (1966: 100, 107), and Mansfield (1965: 136); see
also Wahba (1994: 73) who gives private sector share of GDP in 1961 as 76percent. The figures probably understate the share of government in GDP, buteven after correcting for this, O’Brien (1966: 107–8) concludes that at leasttwo-thirds of GDP took place outside the government’s contribution.
6 Availability of resources�GDP (market prices)� Indirect Taxes� Imports.Resource use�Consumption� Investment�Exports.
7 The Charter (nd: 49–74). For a summary of the economic sections, see O’Brien(1966: 132–6); and Mansfield (1965: 130–2).
8 Sadat (1978: 245).9 Quoted in Scobie (1981: 31).
10 For a brief history and description of Egypt’s food subsidy system see Aldermanet al. (1982: 13–35).
11 Direct subsidies were provided for the so-called “supply commodities,” i.e.certain items of mass consumption – wheat and flour, edible oil, maize, andsugar – and for fertilizers, pesticides, and “utility” (i.e. low-grade) cloth. Since1973, two-tier pricing had been introduced for some commodities: a certainquantity of the rationed items was made available at the subsidized price whileadditional items were sold at prices that yielded a profit to the General Author-ity for Supply Commodities. The difference between the loss on the subsidizedpart and the profit on the rest constituted the net cost of subsidizing the“supply commodities.”
12 The Central Agency for Public Mobilization and Statistics (CAPMAS) uses aLaspeyres-type estimator as the Consumer Price Index. This type of indexnumber assumes that quantities remain fixed from time period to time period,until the weights are revised; at the time under discussion, the index was basedon weights estimated in 1965, i.e. about ten years earlier. There were also ques-tions concerning the coverage of the index, and other technical problems in its

construction that were pointed out by World Bank, IMF, and USAID statisti-cians.
13 The foreign exchange budget estimated that, in addition to the approximately$2.1 billion required to repay the bankers’ facilities falling due in 1975, anadditional $470 million in cash would be needed to pay for services such asshipping and insurance, and to make down-payments on capital goods thatcould not be financed entirely on credit.
14 United Arab Republic (n.d).15 Interviews, December 29, 1999 and July 7, 2001.16 Dr Hegazy was Minister of the Treasury 1968–72, Minister of Finance and
Foreign Trade 1973–74, and Prime Minister 1974–75. He was interviewed onDecember 28, 1999; July 11, 2000; and July 4, 2001.
17 Ministry of Planning (1977a: 5).18 Ministry of Planning (1977a: 5–6).19 Dr Hegazy wryly described how some of the demonstrators marched around
chanting rhyming slogans provided by dissidents in the Cabinet: “Hegazy beh,Hegazy beh/Il lahma ba’a bi gineh”; [Mr Hegazy, Mr Hegazy/Meat has become apound (a kilo)]”; and “Hukuuma Hegazy?/Walla hukuuma Nazi?”; [A Hegazygovernment?/Or a Nazi government?].
2 Economic development and policymaking, 1973–87
1 The dilemma is not new, cf. the remark attributed to Jean Baptiste Colbert(1665), chief financial officer of King Louis XIV of France: “The art of taxationconsists in so plucking the goose as to obtain the largest amount of featherswith the smallest possible amount of hissing.” Quoted in Tripp (1970).
2 In an interview on July 5, 2001, Dr Abou Ismail reconfirmed that in 1975 hehad repeatedly told representatives of the Fund that there would be a “revolu-tion” in Egypt if their proposals on subsidies were accepted. He was glad thatthe Cabinet in which he had served had not accepted the Fund’s terms.
3 Interviews, April 10 and August 27, 2000.4 Möller (1980: 57; 124–5).5 Weinbaum (1986: 51) reports that “US aid programs normally stipulate that
concessional financing be tied to US-made products, regardless of morecompetitive prices elsewhere and irrespective of Egypt’s ability to produce thesame items.”
6 Grant element measures the concessionality of a loan. It is defined as the dif-ference between the face value of a loan and the discounted present value ofthe stream of repayments (including interest) to which it will give rise,expressed as a percentage of the face value. By combining the effects of thevarious elements of the terms into a single measure, the grant element enablesloans with differing terms to be compared. For example, if a set of terms (inter-est, maturity, and grace period) produces a grant element of, say, 30 percent, itessentially means that the recipient of the funds should be indifferent betweenreceiving a grant of 30 percent of the face value, or a loan of 100 percent of theface value on the terms that gave rise to the 30 percent grant element. SeeSchmidt (1964), Pincus (1965), and Ohlin (1966: especially 102–5 for deriva-tion of the relevant formulae).
7 Based on the ratio of present value of total debt service to GNP, and the ratioof present value of total debt service to foreign exchange earnings.
8 For details see Chapter 5.9 Such anomalies continue. The United Nations’ Food and Agriculture Organi-
zation (1999: 32–4) concluded that the cultivation of sugarcane was profitablefor private farmers because they did not have to pay for water, but caused a
Notes 319
substantial economic loss for the country because water was the most bindingconstraint on Egyptian agriculture, and sugarcane is a very water-intensive crop.
10 A detailed description of Egypt’s exchange and trade system as it stood at theend of 1981 can be found in IMF (1982).
11 “Commodity sectors” in the Egyptian national accounts comprised agriculture,industry and mining, oil and oil products, electricity, and construction.
12 Ministry of Planning (1977a, vol. 1: 19).13 Interview, March 27, 2000.14 Similar judgments were voiced by Weinbaum (1986: 3), who also went on to say
(32–3) that, “[T]he level of funding was not . . . based on any careful assess-ment of Egypt’s budgetary and development needs or, for that matter, on whatit could absorb successfully.”
15 For example, March 28, 1987 and May 23, 1987.16 For names and periods of incumbency see Guwwadi (1997). Weiss (1993: 66)
also remarked that during the work of the Möller team “a series of ministerswas replaced every six months on average, and prime ministers changed almostannually.”
17 Weiss (1993: 66).18 Figure 4.3 shows the relationship between GDP growth and oil prices in
1974–2000.19 The real effective exchange rate is defined as the weighted change in nominal
exchange rates, adjusted for changes in the relative retail prices at home andabroad. See Chapter 5 for more discussion.
20 World Bank (1990c, vol. 2: 54). The major debtor countries were defined asthose with outstanding external debt of $9 billion or more.
3 Economic development and policymaking, 1987–2000
1 The implicit exchange rate subsidy was calculated as the difference between theCentral Bank rate (LE 0.7/$) and the official Free Bank’s Market rate (LE2.25/$). By 1988, this implicit subsidy had reached close to LE 5 billion, or 8.3percent of GDP.
2 This comparison is perhaps less meaningful than it appears, because it com-pares a stock (debt) with a flow (GDP) in a single year, and the entire stock doesnot have to be paid off with the flow of a single year. However, the comparisonis given here because it is frequently used in the literature.
3 Interview, July 7, 2003.4 Seigniorage is the revenue generated by the government as a result of its mono-
poly power to print money. The real seigniorage ratio is calculated as the yearlysum of deflated monthly changes in the money base divided by real GDP. Whatthe government receives at any point in time from money creation is not theinflation tax, but rather seigniorage. The role of seigniorage and the inflationtax in Egypt is discussed further in Chapter 6.
5 This compares with a probability of 58.7 percent for the USA. For most develop-ing countries with floating exchange rates, the probability (in percent) of thisdegree of actual rigidity was substantially lower than for Egypt: for example, 63.5for Mexico, 66.2 for South Africa, 71.4 for Peru, 72.2 for Kenya, 74.5 for Nigeria,and 74.9 for the Philippines.
6 Williamson (1982: 45) shows that the variance of the REER can be decomposedinto:
var(REER)�var(EER)�var(RP)�2 cov(EER*RP)
where REER is the real effective exchange rate; EER is the effective exchangerate; and RP is relative prices (i.e. the inflation differential).
320 Notes

7 Prime Minister 1999–2004, and previously Minister of Public Enterprise Sector(Interview, September 9, 2000).
8 The World Bank judged that while the public enterprises might be substantiallyoverstaffed, the Economic Authorities were not excessively so.
9 These are gross figures. The public enterprises were still considered to be over-manned in 2000 because they continued to hire employees even as they laid offother workers.
4 Growth, productivity, and structural change, 1960–2000
1 The first reasonably reliable census of Egypt took place in 1897, and thereaftercensuses were conducted every ten years until 1947. The 1957 census was post-poned until 1960 because of the Suez Canal war and there was a simple enu-meration in 1966, with the next complete census taken in November 1976.
2 A feddan�1.038 acres�0.42 hectares.3 Until June 1972 the Egyptian fiscal year ran from July 1 to June 30 of the
following year, and was frequently written as a split year; for example, the fiscalyear ending in June 1972 would be written as 1971/72. From 1973 to 1979 thefiscal year was changed to coincide with the calendar year, but from July 1980 itreverted to a June–July basis. In this book, a simpler transcription has beenadopted; thus the fiscal year ending in June 1972 simply appears as 1972. Thetext will make clear if a calendar year is meant.
4 Permanent private disposable income and permanent government saving wereestimated by decomposing these variables into a deterministic trend and apurely cyclical random component, and assuming that the permanent elementwas represented by the trend.
5 The proposition that extra domestic borrowing has the same, or “equivalent”effect on the economy as extra taxation. Strong conditions – such as perfectcapital markets, rational expectations, non-distortionary taxes – are requiredfor “Ricardian equivalence” to hold. The equivalence proposition was alsotested by Haque and Montiel (1987) for 16 developing countries, comparingthe effects of taxation and borrowing on aggregate demand. They concludedthat full Ricardian equivalence could be rejected for 15 of the countries,including Egypt.
6 The 1965 figures for labor force and employment (7.9 million and 7.3 millionrespectively) are reported in World Bank (1969: Statistical Annex, Table 14)and are subject to similar qualifications as those attaching to later figures. Seethe comments on data at the end of this chapter and in that on Labor Forceand Employment.
7 But see the discussion of the size of the labor force and the non-enumerationof “discouraged workers” in the chapter on Labor Force and Employment.
8 Mapping unemployment against “anticipated inflation” (using the assumptionof adaptive expectations, i.e. that �e
t ��et�1), did not materially change the rela-
tionship shown in Figure 4.8.9 Bernier and Simon (2001: 337) report that the NAIRU in France was estimated
at 4.4 percent in 1972, but from 1978 to 1994 it was put at 7–8 percent of theactive population.
10 According to the rational expectations hypothesis, expectations are formed byindividuals who understand the working of the economy. They take intoaccount all the information available, and do not commit systematic expecta-tion errors; any systematic deviation will be incorporated into the process bywhich expectations are formed. The only errors possible in their expectationsof inflation are due to random shocks. The rate of expected inflation is thusequal to the actual rate of inflation plus an error term that is on average zero.
Notes 321
(If the random element differs from zero in any systematic fashion, expecta-tions (�e) are not rational.) Therefore, under the rational expectations hypoth-esis, �e ����, where � is a random error term with an expected value of zero.
11 Once again, the caution on figures relating to investment and its components,especially the change in stocks, must be repeated. Moreover, as domesticsavings are generally calculated by subtracting the current account deficit fromthe estimated investment, the savings figure must also be regarded with adegree of circumspection.
12 i.e. Total Factor Productivity, which attempts to measure productivity takinginto account all factors of production.
13 See, for example, Robinson (1953, 1956, 1971); Solow (1956, 1957); Harcourt(1972). In practice, many of the empirical studies use the “perpetual inventorymethod” for calculating the capital stock. See the Annex to this chapter for abrief description of the method.
14 Ray (1998: 118–19).15 The ratio of the marginal products of the factors gives the marginal rate of sub-
stitution between the factors.16 Hahn and Matthews (1965: 51).17 For a derivation see Foley and Michl (1999: 160–2).18 Hahn and Matthews (1965: 52) point out that steady growth is compatible with
other production functions, provided that they are Harrod-neutral.19 However, they add that the import of improved technology can be an import-
ant factor in growth and thus “manna from abroad” can be significant even ifmanna from heaven is not.
20 The earliest proponents of this view were Young (1992, 1995), and Kim andLau (1994); see also Felipe (1999).
21 Human capital-adjusted labor incorporates the contribution of education andsize of the labor force to labor input.
22 Sometimes called changes in the “best practice” production frontier.23 This note refers to data issued during the period 1965–2000; it does not cover
subsequent changes.24 Waite et al. (1998: 12).25 To quote examples from three continents: Portes (1996: 160) estimates
Mexico’s informal economy in 1985 at 26 to 38 percent of official GDP,depending on the methodology used; Chugh and Uppal (1986), after review-ing several studies put the figure for India in the 1980s at around 20 percent ofGDP; while World Bank (1996: Vol. 1, 19) quotes the National Informal SectorSurvey of Tanzania as estimating the size of the informal sector at 32 percent ofofficial GDP in 1991 (other estimates are mentioned that put it even higher).
26 An exception is Galal (2004), the findings of which are discussed in Chapter10.
27 I am indebted to Marcelo Giugale for providing a complete description of theeffort.
28 Fergany (1995, 1996a, 1999); Assaad (1997, 1999).29 This phenomenon is not confined to Egypt. Frank and Bernanke (2001:
147–8) give an example from the United States: in February 2000, the unem-ployment rate was 4.1 percent; when “discouraged” and “involuntary part-time”workers were added, it became 7.6 percent.
30 Of course, mathematically the “real” rate will always be higher than the govern-ment’s, as one is adding the same constant to the numerator and the denomi-nator of a fraction that lies between zero and unity.
322 Notes

5 The external sector
1 See Winters (1991), McCombie and Thirlwall (1994) and the references citedthere. The view of the latter writers (430) is unambiguously that, “The incomeelasticity of demand for exports is, . . . probably the most important determi-nant of comparative export performance.”
2 If xij is the value of country i’s exports of commodity j, and Xtj is the country’stotal exports, its revealed comparative advantage index is:
RCAij�(xij/Xtj)/(Xiw/Xtw)
where the w subscripts refer to world totals.3 See World Bank (1995b: vol. 2, Table 5.7 and Annex, Table 5.1); GOE Ministry
of Economy and International Cooperation (1996); Yeats (1995).4 A clear exposition of this technique is provided in Leamer and Stern (1970:
171–83).5 This and the next paragraph are based on Kouamé (2000).6 Hinkle and Nsengiyumva (1999: 41–111) provide an excellent discussion and
application of the relevant concepts.7 Between 1997 and 2000 the degree of overvaluation against the equilibrium
rate was estimated to have increased by about another 5–7 percentage points.8 Some writers who had reservations about the effectiveness of elasticities – for
instance, Al Shawarby (2000) – did recognize that structural impediments,such as the limited capacity of Egyptian firms (especially in the public sector)to respond to market signals, the slow working of the bureaucracy, the policiesregarding tariffs, and other incentive- and cost-distorting measures diluted theeffects of devaluations.
9 Named after Marshall (1924: Appendix J) and Lerner (1944: 377–9). Some-times the name of Joan Robinson (1937: 138–46) is added.
10 For derivations and elaboration see Stern (1973: 128–39).11 Al-Shawarby (2000) is an exception.12 The nominal tariff rate (t) on an industry is defined as t� (p*�p)/p, where p*
and p are the unit prices of the industry’s output with and without tariffsrespectively. The effective rate of protection (e) is defined as e� (v*�v)/v,where v* and v are the value-added per unit of output with and without protec-tion, respectively. For useful surveys of the main issues see Balassa et al. (1971),Grubel and Johnson (1971), Johnson (1971), and Corden (1971).
13 That is, “taxation” by holding domestic prices below international.14 Amin (1995: 1–21) provides an interesting discussion of issues relating to
Egypt’s external debt since the 1960s. For very readable accounts of earlierperiods, see Landes (1958) and Marlowe (1974).
6 The public finances
1 This refers only to the defense expenditures shown in the budget. It is believedthat a significant amount of defense spending is off-budget.
2 An important qualification must be entered at this point. The activities of theNational Investment Bank and the social security and pension funds have notbeen treated consistently in budgets; correcting for this could significantlychange the details for certain years.
3 However, significant indirect subsidies remained; for example, it was estimatedthat even in 1998 the average price for electricity was 80 percent of long-runmarginal cost (LRMC). Small residential and commercial consumers receiveda cross-subsidy, paying 41 percent of LRMC, while large commercial consumerspaid 132 percent of LRMC.
Notes 323

4 The explanation of the more than 100 percent financing is that domesticfinancing had to cover negative external financing, i.e. amortizations on exter-nal financing exceeded disbursements.
5 But note a certain ambiguity. If the intent is to measure in some sense theburden carried by Egyptians, then the figure can be misleading. A large pro-portion of the taxes represent transfers to the budget from the Egyptian petro-leum company and the Suez Canal Authority, the incomes of both of which areprimarily generated by non-Egyptians. The burden of the taxes, therefore, isborne essentially by foreigners.
6 The General Income Tax was introduced in 1949. The rates were progressivelyincreased until in 1965 the highest rate reached 95 percent. These measureswere not very effective; Sciolli (1976: 62) found an inverse relationshipbetween the increase in the rates and the yield of the tax.
7 Following Thirlwall (2003: 516) one may write the overall buoyancy of a taxsystem as:
(�T/T)/(�T/T)�(�T/T)/(�B/B)*(�B/B)/(�Y/Y)
The expression says that the overall buoyancy of a tax system is measured as theproportional change in total tax revenue (�T/T) with respect to the propor-tional change in national income (�T/T), and is composed of the elasticity oftax revenue with respect to the tax base [(�T/T)/(�B/B)], and the elasticityof the tax base with respect to national income [(�B/B)/(�Y/Y)].
8 For an extended discussion of these concepts see Musgrave (1959: 160–83).9 In real terms, the seigniorage, Rs, is given by Rs ��M/P where � is the money
growth rate, M the money balances, and P the price level. The inflation tax, Ri,on the other hand, is given by Ri �� M/P where � is the rate of inflation. Thisis not a revenue directly received by the government in the period in question,but is a capital loss sustained by the holders of money. Seigniorage is identicalwith the inflation tax only when ���, i.e. if households maintain a constantvalue of real money balances. Since the inflation tax is the product of the infla-tion rate and the demand for real high-powered money (the demand for whichfalls as inflation rises), the inflation tax has a theoretical maximum, dependingupon the interest elasticity of demand for high-powered money (i.e. the mone-tary base, consisting of currency and banks’ deposits with the Central Bank ofEgypt). See the discussion in Burgess and Stern (1993: 768–70).
10 Dinh and Giugale defined the inflation tax to include the erosion of the realvalue of money balances as well as the difference between the inflation rateand the nominal remuneration that the private sector received on its holdingof time and saving deposits.
11 World Bank (1989: 188); IMF, International Financial Statistics (various issues).12 This part follows Leddin and Walsh (1992: 102–4). I am indebted to Professor
Walsh for clarifying some matters in correspondence.13 Consumers have more disposable income (because they paid lower taxes than
they would have had to pay if government expenditure were not partiallyfinanced by borrowing), hence, they consume more.
14 For a balanced review of the theoretical and empirical issues connected withRicardian equivalence see Elmendorf and Mankiw (1999: 1640–59).
15 Elmendorf and Mankiw (1999: 1641) give the following example: “If thegovernment cuts taxes today and households expect this tax cut to be met withfuture cuts in government purchases, then households’ permanent incomedoes rise, which stimulates consumption and reduces national saving. . . . Thereduction in expected future government purchases would alter permanentincome and consumption because they imply lower taxes at some time, even ifcurrent taxes are unchanged.”
324 Notes
7 The financial sector and monetary policy
1 In September 2001 it was further lowered to 14 percent, in order to increaseliquidity.
2 This, combined with the large differential in favor of domestic over inter-national interest rates, encouraged banks to borrow abroad and to on-lend theseto domestic borrowers at the higher rates.
3 For example, Barker and Holdsworth (1993), Cole and Gunther (1998), Hirtleand Lopez (1999).
4 The IMF pointed out that a more stringent loan-to-deposit ratio would render acash reserve requirement redundant. If one minus the loan-to-deposit ratioexceeded the reserve ratio, the loan-to-deposit ratio would be binding and thereserve ratio redundant.
5 A “repo” is a liquidity-injecting operation by which the CBE buys treasury bills froma commercial bank that agrees to repurchase them from the CBE after a statedinterval (usually about one to ten business days). The ratio between the initial andfinal prices determines the interest for the implicit loan. A “reverse repo” is aliquidity-absorbing operation by the CBE in which it sells treasury bills to a com-mercial bank, and agrees to repurchase them from the bank after a stated interval.
6 This would, of course, require the CBE to have available a sufficient stock ofTreasury bills to conduct the operation.
7 The World Bank pointed out that the tax structure created a perverserisks/reward relationship. Income from the least risk-bearing securities (Treas-ury bills and bank deposits) was substantially exempt from tax, while dividendand interest income on higher risk securities, such as corporate bonds andshares, were subject to various kinds of tax. The result was a generally decliningafter-tax yield curve with regard to term and risk.
8 World Bank (1993a, vol. 2: 117).9 The definition of SME used by the Ministry was 1–4 employees for micro enter-
prises, 5–18 for small, and 19–49 for medium enterprises.
8 Labor force and employment
* Nagwa Riad was particularly helpful in the preparation of this chapter.1 See also “A Note on Data,” Chapter 4.2 For a discussion of the conceptual ambiguities of the “informal sector” as
defined in Egypt see Chapter 4 and the discussion later in the present chapter.3 This mismatch was initially suggested by Hansen and Radwan (1982) as the
main problem for the observed pattern of unemployment. Subsequent studiesshowed unemployment to be rooted in a larger problem of insufficient effect-ive demand for labor.
4 Fergany (1991) reports slightly higher participation rates, also using PC data,due to higher labor force figures that are adjusted for migration. The laborforce figures reported for 1960, 1967, and 1986 are respectively, 7.82 million,10.98, and 13.68 million, with corresponding activity rates of 30.1 percent, 30.1percent, and 28.4 percent.
5 For instance, Fergany (1995) adjusts the LFSS series after 1988 based on para-meters anchored in the October 1988 LFSS round. Adjustments are mainlyrelated to female unpaid household employment (excluding those less than 15hours per week) and to unemployment, factoring in the discouraged unem-ployed, which were “definitionally” excluded in the new series. Assaad (1997)adjusts for female employment in agriculture, aged 12–64, in both urban andrural areas by assuming its proportion to the female participation in the sameage group constant at its 1991 level.
6 The 1986 PC reports a female labor force size of 1.1 million and 0.4 million in
Notes 325
urban and rural areas, respectively; the corresponding figures from LFSS 1988are two million and 4.8 million (Fergany 1995).
7 According to Fergany (1995), the proportion of discouraged unemployment,during 1988–93, was highest for rural females (48 percent) and lowest forurban males (16 percent), and for both urban females and rural males it was21 percent. Males in both urban and rural areas, as well as urban females,showed relatively high proportions of discouraged unemployment at old ages.
8 However, there exists a bias in these correction factors, which is greater forwomen in rural areas and increases with time.
9 See footnote to Table 8.1 on adjustments made by Fergany (1995) to the LFSSseries after 1988.
10 Using Fergany’s (1996a) adjusted series, the unemployment rate in 1993 stoodat 13.5 percent, as opposed to a reported 10.3 percent.
11 The ELMS 1998 reports unemployment estimates based on the extended laborforce definition only whereas the LFSS is likely to use an equivalent-to-a-marketdefinition. This is likely to inflate the size of the labor force in the ELMS 1998by including the large number of women engaged in subsistence activities, andtherefore result in estimates of unemployment that are generally lower thanthose regularly reported by the LFSS. The inclusion of the search requirementis likely to further underestimate the magnitude of unemployment.
12 Visible underemployment is measured in terms of actual work hours duringthe reference period compared to some norm. Fergany (1996a) used informa-tion from the 1988 LFSS on time worked during the reference period, and anorm of a 40-hour work-week. Visible underemployment and overemploymentwas estimated by comparing the time actually worked with the norm.
13 The underemployment ratio is a composite index consisting of three componentsexpressed as a proportion of the working age population 15–64: (i) the openlyunemployed; (ii) the visibly underemployed, those working less than 40 hoursper week (part-time) involuntarily and are available for more work; and (iii)the discouraged unemployed, those who have done no work during the refer-ence week, are available and ready to work, but have not actively searched forwork in the 3-month reference period that ends with the reference week.
14 In 1996, further classifications of economic activities were introduced. To allowsome form of trend analysis of employment, the new categories were lumpedwith the relevant or most appropriate “existing” ones. Caution should there-fore be exercised when making inferences about certain sectors in 1996.
15 Assaad (1996a) points out that until 1978 the centralized manpower system,responsible for implementing the employment guarantee scheme for gradu-ates, applied to both the government and public enterprise sectors. After 1978,this system applied only to civil service (government) appointments.
16 A job is classified as protected if it is covered by a legal contract. Permanent ortemporary jobs are further classified as regular while intermittent or seasonaljobs are classified as irregular, the latter typically not covered by a legal contract.
17 Estimates on the magnitude of the informal sector using the size criterion varyacross authors. Fergany (1991) estimates the informal sector to have grownfrom less than one million in 1960 to nearly 2.3 million in 1985. Rizk (1991)estimates the informal sector in 1976 to be around 2.4 million, which rises tothree million in 1985 according to a CAPMAS study. Assaad (1997) reported afigure of 3.5 million in 1992 and Radwan (1997) quoted 3.7 million in 1995(based on LFSS). These estimates in general point to the significant growth ofthis sector over the past three decades or so, to account for over 20 percent oftotal employment in 1995. The definition of informality also varies by author.For instance, a criterion adopted by Wahba and Mokhtar (1999) was the exist-
326 Notes

ence of a job contract in distinguishing formal from informal employment.However, this criterion may be misleading, since most employment in theformal private sector is also not covered by a legal contract.
18 A graduate is classified as unemployed by the Ministry of Manpower and Train-ing if his/her name appears in the register of applicants at a given date.
19 According to Assaad (1995), a lower bound estimate of government non-wagevalue is approximately 50 percent of the observed government wage. In afurther model, Assaad (1996a) estimates the non-wage benefits in the publicenterprise sector to be 86 percent of the monetary wage.
20 Assaad (1996a) estimated rents in the civil service (government) and publicenterprise sector to be nearly similar for workers with lower education, with thegap in favor of the public enterprise sector increasing with education. Theaverage rent of a public enterprise worker was estimated at 100 months’ worthof salary, or LE 16,000.
9 Poverty and income distribution
* Nagwa Riad was particularly helpful in the preparatino of this chapter.1 For an explanation of the concepts, see “Conceptual issues in measuring
poverty” at the end of this chapter.2 To bridge the gap between the survey estimates of per capita expenditure and
those implied by national accounts, Bartsch assumed that the “rich” who hadbeen excluded from the survey account for the magnitude of deviation (LE 45billion) between national accounts and survey data. To estimate the number ofthe rich based from the survey (because they were presumably excluded), thehighest per capita food expenditure brackets of LE 1,400 were classified as“rich.” The gap between national accounts and survey data was then added to thetotal expenditure estimated for this group of 1.6 million individuals in 700,000households (about 5 percent of survey sample). By augmenting the expenditureof the highest per capita expenditure brackets to a level at which total householdexpenditure as implied by the survey equaled that in the national accounts,expenditures in the lower brackets of the distribution were unchanged.
3 In this procedure, poverty measurements, such as the headcount index, areplotted against a wide range of values for the poverty line (in the case of El-Leithy et al. (1999), these were 30 percent to 100 percent of the average percapita expenditure). These curves are then used to rank poverty incidence overthe reference data points. A measurement is said to be robust if for any twogiven years, poverty incidence in one year is consistently above (below) that ofthe other years for the range of poverty lines used.
4 In El-Leithy and Osman (1996), the background paper for the UNDP (1996),the critical value at which poverty lines intersect is LE 470.
5 Quoted in Bhattacharyya (1998).6 Using household data for Pakistan, Lanjouw and Ravallion (1995) have shown
poverty rankings to be reversed, especially for the headcount and poverty gapindices, when household size elasticities are considered. El-Leithy et al. (1999)also show rank reversals of poverty measurements in Egypt when differentassumptions about household sharing of non-food consumptions are made.The impact of these elasticity assumptions is largest on the distributionally sen-sitive measures, i.e. the poverty gap and severity indices.
7 The figures for “never attending school” for the same classification of reasonswere very similar (see Table 13 in Datt et al. 1999).
8 One feddan�24 kirats�4,201 m2 �1.038 acres.9 The socio-demographic characteristics include: dependency ratio, education
level, main occupation or activity, employment status, and age of household
Notes 327
head. The housing characteristics include: dwelling construction material,number of persons per room, access to potable water and to sanitation net-works, and ownership of some durable goods.
10 In Haddad and Ahmed’s (1999, 2003) definition, for two reference periods ordata points, chronic poverty refers to households whose average (per capita)expenditure was below the established poverty line in both periods, whereastransitory poverty refers to households whose average expenditure was abovethe poverty line in one period, but below it in the second.
11 Note that this comparison uses the lower poverty line.12 For a more detailed elaboration of these questions see El-Leithy et al. (1999)
and Fields (2001).13 The three aspects of deprivation are proxied by the following indicators,
respectively: the proportion of children under five who are underweight; theproportion of births unattended by trained health personnel; and female illit-eracy (UNDP, 1996).
14 The first aspect of deprivation is proxied by the percentage of people notexpected to reach age 40; the second by percentage of illiterate adults; and thethird aspect is a composite index of three variables: the percentage of peoplewithout access to safe drinking water, access to health services and the percent-age of moderately and severely malnourished children under five.
15 Adult equivalence scaling assigns each household member a value betweenzero and one, depending on the age and gender. The standard practice is toassign a value of one to adult males and less than one to adult females and chil-dren (Ravallion 1992).
16 See the discussion in World Bank (1995b: Annex 1.1) and Fields (2001: 73–86).17 World Bank (1995b: 119).18 The normalized gap function: p(yi, z)�(z� yi)/z if yi z, and�0 otherwise.
Fields (2001: 77) describes it as a loss function, indicating the loss from havingincome yi when the poverty line is z. To get a poverty measure for the economyas a whole, the individual function is aggregated over the entire population.
10 Towards sustainable growth and institutional issues
1 Radwan (2002: 3) argues that the actual increase in the labor force is likely tobe larger than the demographically-driven increase, because a more carefulmeasure would take into account the output of the educational system and thedropouts who join the labor market every year. Adjusting for these, Radwanestimates the annual number of new job seekers at 896,000 in 2000–10. Eventhough not all these will have to be provided with jobs, because we are definingfull employment as employing 95 percent of the labor force, it is clear that thechallenge of providing full employment is considerable.
2 The usual Cobb–Douglas production function, Y�AentKL1� then becomesYf �Aent KN 1�; i.e. in the expression for the full-employment output, Y f,actual employment, L, is replaced with N, the full-employment labor force.
3 The illustrative calculations in this chapter were based on reaching full employ-ment in 2010, because it was assumed that an appropriate development strat-egy would go into effect from 2000. In fact, a comprehensive strategy had notbeen formulated even by the end of calendar 2004. Moreover, GDP growth inthe fiscal years 2001–03 averaged only 3.5 percent a year and increased thenumber of unemployed, thereby lengthening the period and deferring thedate for attaining full employment.
4 For example, Dollar (1992); Edwards (1993); Baldwin and Seghezza (1996);Harrison (1996); Coe et al. (1997).
5 The following discussion draws on World Bank (1994).
328 Notes

6 World Bank (1992, vol. 2: 32–3 and Annex A); Galal (1995).7 See Lichteim (1976, vol. 2: 167–71).8 This has not changed much over 50 years. Ayubi (1980: 240) reports an estimate
by A.P. Sinker that in 1950 about 35 percent of the budget was spent on salariesand other emoluments of the public service, compared with 9 percent in Britain.
9 Dr Ebeid was Prime Minister from 1999 to 2004, and before that Minister forAdministrative Reform. Interview, February 15, 2001.
10 Quoted in Messick (1999).11 For more details see Shihata (1996).12 Hobbes (1651), quoted in Messick (1999).13 Common methods are to classify workers as “provisional,” “temporary,” or “sea-
sonal”; or to find reasons for not giving them labor contracts; or to obtain fromworkers undated letters of resignation when they are hired.
14 Galbraith (1992) famously had the last word on the “trickle-down” approach,describing it as “the less-than-elegant metaphor that if one feeds the horseenough oats, some will pass through to the road for the sparrows.”
15 Moreover, while the categories “Lower” and “Upper” Egypt represent geo-graphical locations, the category “Metropolitan” Egypt is simply an arbitraryadministrative classification. Administrative entities have to be physicallylocated in some geographical area. Alexandria, Port Said, and Suez (and evenCairo) could be said to be geographically located in Lower Egypt, and thus thedistinction between “Metropolitan” and “Lower Egypt” is largely artificial.
16 The cooking oil subsidy was the least effective, raising less than 170,000 indi-viduals from poverty.
17 For the most part, the health impact of environmental degradation wasexpressed as Disability Adjusted Life Years (DALYs), in which illnesses areweighted by severity. The methodology employed was developed by the WorldHealth Organization (WHO) and has been used in several countries. Thepaucity of specific studies for Egypt required a greater use of a range for mostof the estimates to reflect their uncertainties.
18 The Root Mean Squared Error:
RMSE����(Pi
N
��Ai)��
2
where Pi and Ai are, respectively, the projected and actual values, and N is thenumber of observations.
19 See Donders and Kranendonk (1999), van Welzenis (1999).20 An exploratory project on participatory planning, with the assistance of the
German Technical Assistance Organization (GTZ), has been commenced bythe Ministry of Planning in three urban governorates.
21 Of course, this simplified model ignores some interactions in the real world thatwould reduce the value of the multiplier, for example, that planned investmentis not autonomous, but depends also on the interest rate. And since budgetdeficits have to be financed by borrowing, this may increase interest rates; thecalculation therefore assumes that monetary policy is “accommodating” – thesupply of money is increased in line with the demand – thereby preventing anincrease in rates of interest. However, the intent of this chapter is simply todevelop a framework for thinking about the problems, and ignoring some of theniceties does not do much violence to the estimates that are derived for Egyptwhen these are compared with more precise calculations for other countries.
22 If these taxes are included, the marginal propensity to tax is 0.14 and the multi-plier works out to 2.04.
23 Appleyard and Field (1998: 560–5); Thirlwall and Gibson (1992: 136–48).
Notes 329

Bibliography
Abdel-Fadil, M. (1975) Development, Income Distribution and Social Change in RuralEgypt (1952–70), Cambridge: Cambridge University Press.
Abdel-Khalek, G. (1997) “Stabilization and structural adjustment policies in Egypt:economic reform or Dutch disease?” Paper presented at the Fourth Conferencefor Arab Economic Researchers, Cairo, Dec. 2–3, 1997 (Arabic).
Abdel-Khalek, G. (1998) “Egypt’s Economic Reform and the Challenges of Global-ization,” in D. Heisel (ed.) The Middle East and Development in a Changing World,Cairo Papers in Social Science 20:2, Cairo: American University in Cairo Press.
Abdel-Khalek, G. (2001) Stabilization and Adjustment in Egypt, Cheltenham: EdwardElgar.
Abdel-Khalek, G. and Tignor, R. (1982) The Political Economy of Income Distributionin Egypt, New York: Holmes and Meier.
Abu Ali, Sultan (1987) “A scenario for the next five year plan,” L’Egypte Contempo-raine (Jan.–Apr.): 5–22 (Arabic).
Acharya, S. (1985) Aspects of the Black Economy in India, New Delhi: National Insti-tute of Public Finance and Policy.
Acharya, S (1988) “India’s Fiscal Policy,” in R. Lucas and G. Papanek (eds) TheIndian Economy, Boulder, Co: Westview.
Acharya, S. and Associates (1986) Aspects of the Black Economy in India. New Delhi:National Institute of Public Finance and Policy.
Adams, R.H. “Evaluating Development,” in M. Riad El-Ghonemy (ed.) Egypt in theTwenty-First Century: Challenges for Development, London: Routledge.
Adams, R.H. and Page, J. (2003) “Poverty, inequality and growth in selectedMiddle East and North Africa countries, 1980–2000,” World Development31(12):2027–48.
Ahmed, S. (1984) “Public finance in Egypt,” Staff Working Paper No. 639, Wash-ington, DC: World Bank.
Alba, P., El-Shawarby, S., and Iqbal, F. (2004) “Fiscal and public debt sustainabilityin Egypt,” Egyptian Center for Economic Studies (ECES), Working Paper No.97, Cairo: ECES.
Alderman, H., von Braun, J., and Ahmed Sakr, S. (1982) Egypt’s Food Subsidy andRationing System: A Description, Washington, DC: International Food PolicyResearch Institute.
Alexander, S. (1952) “The effects of devaluation on a trade balance,” IMF StaffPapers 3(1):263–78.
Alexandria Businessmen’s Association (1996) “Small and Micro Enterprises in

Egypt,” in M. Giugale and H. Mubarak (eds) Private Sector Development in Egypt,Cairo: American University in Cairo Press.
Ali, S. and Adams, R.H. (1996) “The Egyptian food subsidy system: operation andeffects on income distribution,” World Development 24(11):1777–91.
Al-Sayyid, A.L. (1969) Egypt and Cromer, New York: Frederick A. Praeger.Al-Shawarby, S. (2000) “Estimating the Impact of the Egyptian Exchange Rate on
Exports,” in H. Nassar and A. Aziz (eds) Egyptian Exports and Challenges of the 21stCentury, Cairo: Center for Economic and Financial Research and Studies, CairoUniversity.
American Chamber of Commerce in Egypt (1996) “Financing Private SectorDevelopment in Egypt,” in M. Giugale and H. Mubarak (eds) Private Sector Devel-opment in Egypt, Cairo: American University in Cairo Press.
Amin, G. (1968) “The Egyptian Economy and the Revolution,” in P.J. Vatikiotis(ed.) Egypt Since the Revolution, New York: Praeger.
Amin, G. (1995) Egypt’s Economic Predicament, Leiden: E.J. Brill.Anand, S. (1997) “The Definition and Measurement of Poverty,” in S. Subraman-
ian (ed.) Measurement of Inequality and Poverty, Delhi: Oxford University Press.Anis, M.A. (1950) “A study of the national income of Egypt,” L’Egypte Contemporaine
261–2, Cairo: SOP Press.Appleyard, D.R. and Field, A.J. (1998) International Economics, 3rd edn, Boston: Irwin.Arrow, K.J. (1962) “The Economic Implications of Learning by Doing,” Review of
Economic Studies 29(3):155–73.Artus, P. (1989) Macroéconomie, Paris: Presses Universitaires de France.Assaad, R. (1995) The Effects of Public Sector Hiring and Compensation Policies on the
Egyptian Labor Market, Cairo: Economic Research Forum.Assaad, R. (1996a) An Analysis of Compensation Programs for Redundant Workers in
Egyptian Public Enterprises, Cairo: Economic Research Forum.Assaad, R. (1996b) “Structural Adjustment and Labor Market Reform in Egypt,” in
H. Hopfinger (ed.) Economic Liberalisation and Privatisation in Socialist Arab Coun-tries, Stuttgart: Justus Perthes Verlag Gotha.
Assaad, R. (1997) “The Employment Crisis in Egypt: Current Trends and FutureProspects,” in Karen Pfeiffer (ed.) Research in Middle East Economics, Vol. 2,Greenwich, Conn.: JAI Press.
Assaad, R. (1999) “The Transformation of the Egyptian Labor Market:1988–1998,” Paper presented at the Conference on Labor Market and HumanResource Development in Egypt, Cairo, November 1999.
Assaad, R. (2000) The Transformation of the Egyptian Labor Market: 1988–1998, Cairo:Economic Research Forum.
Assaad, R. and Rouchdy, M. (1999) “Poverty and poverty alleviation strategies inEgypt,” Cairo Papers in Social Science 22(1), Cairo: American University in Cairo.
Assaad, R., El-Hamdi, F., and Ahmed, A. (1999) The Determinants of EmploymentStatus in Egypt, Washington, DC: International Food Policy Research Institute.
Ayubi, N. (1980) Bureaucracy and Politics in Contemporary Egypt, London: IthacaPress.
Atkeson, A. and Ohanian, L.E. (2001) “Are Phillips curves useful for forecastinginflation?,” Federal Reserve Bank Minneapolis Quarterly (Winter):2–11.
Backhouse, R. (1991) Applied UK Macroeconomics, Oxford: Basil Blackwell.Baer, G. (1962) A History of Landownership in Modern Egypt, 1800–1950, London:
Oxford University Press.
Bibliography 331

Bahaa, E., Ziad, A., and Mohieldin, M. (1998) “On Prudential Regulation inEgypt,” in M. El-Erian and M. Mohieldin (eds) Financial Development in EmergingMarkets: The Egyptian Experience, Cairo: Egyptian Center for Economic Studies.
Baker, R.W. (1978) Egypt’s Uncertain Revolution under Nasser and Sadat, Cambridge,Mass.: Harvard University Press.
Balassa, B. (1965) “Trade liberalization and ‘revealed’ comparative advantage,”The Manchester School of Economic and Social Studies 33(2):99–123.
Balassa, B. and Associates (1971) The Structure of Protection in Developing Countries,Baltimore, Md.: Johns Hopkins University Press.
Baldwin, R.E. and Seghezza, E. (1996) “Testing for trade-induced investmentgrowth,” Discussion Paper 1331, London: Centre for Economic Policy Research.
Ball, L. and Mankiw, N.G. (2002) “The NAIRU in theory and practice,” NBERWorking Paper 8940, New York: National Bureau of Economic Research.
Barker, D. and Holdsworth, D. (1993) “The causes of bank failures in the 1980s,”Research Paper 9325, Federal Reserve Bank of New York.
Barro, R.J. (1995) “Inflation and economic growth,” Bank of England Quarterly Bul-letin 35(2):166–76.
Bartsch, U. (1997) Interpreting Household Budget Surveys: Estimates for Poverty andIncome Distribution in Egypt, Cairo: Economic Research Forum.
Benson, A. (1998) Exports and Imports in Middle East Economies, London: Institute ofGlobal Economics.
Bentley, J., in association with Yehia Kamel, Abul Ela, and Sakr (1994) EgyptianLegal and Judicial Sector Assessment, Cairo: USAID.
Bernanke, B.S., Laubach, T., Posen, A.S., and Mishkin, F.S. (1999) Inflation Targeting:Lessons from the International Experience, Princeton, NJ: Princeton University Press.
Bernier, B. and Simon, Y. (2001) Initiation à la macroéconomie, 8th edn, Paris:Dunod.
Beveridge, W.H. (1944) Full Employyment in a Free Society, Woking, UK: Unwin.Bhagwati, J. (1967) “The Tying of Aid.” UNCTAD Secretariat, TD/7/Suppl. 4,
United Nations; reprinted in J. Bhagwati and R.S. Eckhaus (eds) Foreign Aid,London: Penguin Books, 1970.
Bhattacharyya, A.K. (1998) “Introduction and Overview,” in Combating Poverty,Seoul, Korea: UNDP.
Bisat, A., El-Erian, M.A., and Helbling, T. (1997) Growth, Investment, and Saving inthe Arab Economies, Washington, DC: IMF.
Blecker, R.A. (2000) The Diminishing Returns to Export-Led Growth, New York:Council on Foreign Relations.
Blinder, A.S. and Solow, R.M. (1974) “Analytical Foundations of Fiscal Policy,” inThe Economics of Public Finance, Washington, DC: Brookings Institution.
Bosworth, B., Collins, S., and Chen, Y.-C. (1995) “Accounting for differences ineconomic growth,” Brookings Discussion Papers in International Economics, 115,Washington, DC: Brookings Institution.
Bouis, H. and Ahmed, A. (1999) The Egyptian Food Subsidy System: Impacts on the Poorand an Evaluation of Alternatives for Policy Reforms, Washington, DC: InternationalFood Policy Research Institute.
Bouis, H., Ahmed, A.U., and Hamza, A.S. (1999) Patterns of Food Consumption andNutrition in Egypt, Washington, DC: International Food Policy Research Institute.
Bowman, A.K. and Rogan, E. (1999) Agriculture in Egypt. Oxford: Oxford UniversityPress.
332 Bibliography
Brada, J.C. and Estrin, S. (1990) “Advances in the theory and practice of indicativeplanning,” Journal of Comparative Economics 14(Dec):523–30.
Bruno, M. (1995) “Does inflation really lower growth?,” Finance and Development32(Sep):35–8.
Bruton, H.J. (1983) “Egypt’s development in the seventies,” Economic Developmentand Cultural Change 31(Jul):679–704.
Burgess, R. and Stern, N. (1993) “Taxation and development,” Journal of EconomicLiterature 31(2):762–830.
Burnside, C. and Dollar, D. (2000) “Aid, policies, and growth,” American EconomicReview 90(4):847–68.
Cadwell, C. (1999) “Legal Reform: the Path for Egypt,” in Growth Beyond Stabiliza-tion: Conference Proceedings, Cairo: Egyptian Center for Economic Studies.
Calvo, G.A. and Reinhart, C.M. (2002) “Fear of floating,” Quarterly Journal of Eco-nomics 117(2):379–408.
CAPMAS (Central Agency for Public Mobilization and Statistics) (1996) NationalAccounts, Egypt: Input–Output Table, Cairo.
CAPMAS (1998) Survey of Vocational Training Centres, Cairo: Social Fund for Devel-opment.
CAPMAS (1999) Statistical Yearbooks, 1992–98, Cairo.CAPMAS (2002) Household Income and Expenditure Survey 2000, Cairo: CAPMAS.Cardiff, P. (1997) “Poverty and Inequality in Egypt,” in K. Pfeifer (ed.) Research in
Middle East Economics, Vol. 2, Greenwich, Conn.: JAI Press.Chelliah, R.J. (1971) “Trends in taxation in developing countries,” IMF Staff Papers
18(2):254–331.Chugh, R.L. and Uppal, J.S. (1986) Black Economy in India, New Delhi: Tata
McGraw-Hill.Church, K.B., Mitchell, P.R., Smith, P.N., and Wallis, K.F. (1995) “Comparative
properties of models of the UK economy,” National Institute Economic Review153(Aug):59–72, London: National Institute of Economic and Social Research.
Coe, D.T., Helpman, E., and Hoffmaister, A.W. (1997) “North–south R&Dspillovers,” Economic Journal 107(440):134–49.
Cole, R.A. and Gunther, J.W. (1998) “Predicting bank failures: a comparison of on-and off-site monitoring systems,” Journal of Financial Services Research 13:103–17.
Commander, S. (1987) The State and Agricultural Development in Egypt Since 1973,London: Ithaca Press.
Cooper, M.N. (1982) The Transformation of Egypt, Baltimore, Md.: Johns HopkinsUniversity Press.
Cooper, R.N. (1971) “Currency Devaluation in Developing Countries,” Essays inInternational Finance, 86, Princeton, NJ: Princeton University Press.
Corbo, V., Fischer, S., and Webb, S. (1992) Adjustment Lending Revisited: Policies toRestore Growth, Washington, DC: World Bank.
Corden, W.M. (1971) The Theory of Protection, Oxford: Oxford University Press.Cornia, G., Jolly, R., and Stewart, F. (1987, 1988) Adjustment with a Human Face,
vols 1 and 2, Oxford: Oxford University Press.Cottenet, H. (2003) “Booms de Ressources Exogenes et Developpement Manufac-
turier en Égypte: L’Illusion du Syndrome Hollandais,” Ph.D. diss., Universitéd’Auvergne Clermont-Ferrand I, France.
Crémer, H. and Crémer, J. (1994) “L’apport des théories économiques récentes àla plannification indicative,” Revue Economique, 44 (Numéro hors série): 57–73.
Bibliography 333

Cromer, Earl of (1908) Modern Egypt, London: Macmillan and Co.Dailami, M. and Dinh, H.T. (1991) “Interest rate policy in Egypt: its role in stabi-
lization and adjustment,” Working Paper No. 655, Washington, DC: WorldBank.
Dakolias, M. (1999) “Court performance around the world: a comparativeperspective,” World Bank Technical Paper No. 430, Washington, DC: WorldBank.
Daly, M.W. (1998). “The British occupation,” in M.W. Daly (ed.) The CambridgeHistory of Egypt, Volume Two: Modern Egypt, Cambridge: Cambridge UniversityPress.
Danilin, V.I., Meterov, I., Rosefield, S., and Knox Lovell, C.A. (1985) “Measuringenterprise efficiency in the Soviet Union: a stochastic frontier analysis,” Econom-ica 52(May):57–73.
Datt, G. and Olmsted, J. (1999) Agricultural Wages and Food Prices in Egypt: A Gover-norate-level Analysis for 1976–1993, Washington, DC: International Food PolicyResearch Institute.
Datt, G., Jolliffe, D., and Sharma, M. (1997, 1999) “A Profile of Poverty in Egypt:1997,” Washington, DC: International Food Policy Research Institute.
Demetriades, P. (1998) “Financial Markets and Economic Development,” in M. El-Erian and M. Mohieldin (eds) Financial Markets in Emerging Markets: The EgyptianExperience, Cairo: Egyptian Center for Economic Studies.
Denison, E. (1985) Trends in American Economic Growth, 1929–82, Washington, DC:The Brookings Institution.
Denison, E.F. (1962) The Sources of Economic Growth in the United States and theAlternatives Before Us, New York: Committee for Economic Development.
De Soto, H. (1997) “Dead capital and the poor in Egypt,” Distinguished LectureSeries, 11, Cairo: Egyptian Center for Economic Studies.
De Soto, H. (2000) The Mystery of Capital, New York: Basic Books.Dessouki, A.E.H. (1982) “The Politics of Income Distribution in Egypt,” in G.
Abdel-Khalek and R. Tignor (eds) The Political Economy of Income Distribution inEgypt, New York: Holmes and Meier.
Dessouki, A.E.H. (1996) “External Factors and Development in Egypt,” in D.Tschirgi (ed.) Development in the Age of Liberalization: Egypt and Mexico, Cairo:American University in Cairo Press.
Devarajan, S., Go, D., and Li, H. (1999) “Quantifying the fiscal effects of tradereform: a general equilibrium model estimated for 60 countries,” Washington,DC: World Bank.
Dinh, H.T. and Giugale, M. (1991) “Inflation tax and deficit financing in Egypt,”Working Paper No. 668, Washington, DC: World Bank.
Diwan, I. (1995) Will Arab Workers Prosper or be Left Out in the Twenty-First Century?,Cairo: Economic Research Forum.
Djankov, S. (2000) “The regulation of entry,” NBER Working Paper No. 7892,Cambridge, Mass.: National Bureau of Economic Research.
Djankov, S., La Porta, R., Lopez-de-Silanes, F., and Schleifer, A. (2001) “LegalStructure and Judicial Efficiency: The Lex Mundi Project,” Washington, DC:World Bank.
Dollar, D. (1992) “Outward-oriented economies do grow more rapidly: evidencefrom 95 LDCs, 1976–85,” Economic Development and Cultural Change 40(Apr.):523–44.
334 Bibliography

Domar, E. (1944) “The burden of the debt and national income,” American Eco-nomic Review 34(4):798–827.
Donders, J. and Kranendonk, H. (1999) “The accuracy of CPB forecasts,” CPBReport 2, Netherlands Centraal Planbureau.
Dorfman, R., Samuelson, P.A., and Solow, R.M. (1958) Linear Programming and Eco-nomic Analysis, New York: McGraw-Hill.
Dreze, J. and Sen, A. (1989) Hunger and Public Action, Oxford: Clarendon Press.Easterly, W. and Schmidt-Hebbel, K. (1994) “Fiscal Adjustment and Macroeco-
nomic Performance: A Synthesis,” in W. Easterly, C.A. Rodriguez, and K.Schmidt-Hebbel, Public Sector Deficits and Macroeconomic Performance, New York:Oxford University Press.
Edwards, S. (1989) Real Exchange Rates, Devaluation and Adjustment: Exchange RatePolicies in Developing Countries, Cambridge, Mass.: MIT Press.
Edwards, S. (1993a) “Openness, trade liberalization and growth in developingcountries,” Journal of Economic Literature 31(3):1358–93.
Edwards, S. (1993b) “Exchange rates as nominal anchors,” WeltwirtschaftlichesArchiv/Review of World Economics 129(1):1–32.
Edwards, S. (1994) “Real and Monetary Determinants or Real Exchange RateBehavior; Theory and Evidence from Developing Countries,” in J. Williamson(ed.) Estimating Equilibrium Exchange Rates, Washington, DC: Institute for Inter-national Economics.
Eilts, H.F. (1985) “Foreword,” in W.J. Burns, Economic Aid and American Policytoward Egypt, 1955–1981, Albany, NY: State University of New York Press.
El Edel, M. Reda A. (1982) “Impact of Taxation on Income Distribution: AnExploratory Attempt to Estimate Tax Incidence in Egypt,” in G. Abdel-Khalekand R. Tignor (eds) The Political Economy of Income Distribution in Egypt, New York:Holmes and Meier.
El-Erian, M. (1988) “Currency substitution in Egypt and the Yemen Arab Repub-lic,” IMF Staff Papers 35(1):85–103.
El-Ghonemy, M.R. (2003) “Development Strategies, 1950–2001,” in M.R. El-Ghonemy (ed.) Egypt in the Twenty-First Century: Challenges for Development,London: Routledge.
El-Guwwadi, M. (1997) El wuzra’ 1952–1997, Cairo: Dar el-Shorouq (Arabic).El Kholie, O.A. (1973) “Disparities of Egyptian personal income distribution,”
L’Egypte Contemporaine 34(354):33–56.El-Leithy, H. and Osman, M.O. (1996) Profile and Trend of Poverty and Economic
Growth in Egypt, Cairo: Institute of National Planning and UNDP.El-Leithy, H., El-Khawaga, O., and Riad, N. (1999) “Poverty Assessment in Egypt:
1991–96,” Economic Research Monograph. Cairo: Cairo University.Elmendorf, D.W. and Mankiw, N.G. (1999) “Government Debt,” in J. Taylor and
M. Woodford (eds) Handbook of Macroeconomics, Vol. 1C, Amsterdam: Elsevier.El-Nasser, G.A. (1954) The Philosophy of the Revolution, Cairo: Dar El Maaref.El-Refaie, F. (1998) “Financial Intermediation: The Efficiency of the Egyptian
Banking System,” in M. El-Erian and M. Mohieldin (eds) Financial Development inEmerging Markets: The Egyptian Experience, Cairo: Egyptian Center for EconomicStudies.
El-Refaie, F. (2000) “Monetary and exchange rate policies: options for Egypt,”Paper presented at the Egyptian Center for Economic Studies’ Conference onthe Coordination of Monetary and Fiscal Policy in Egypt, Cairo, Nov. 19–20.
Bibliography 335

El-Sadat, A. (1974) The October Working Paper, Cairo: Arab Republic of Egypt, Min-istry of Information.
El-Sadat, A. (1977) In Search of Identity, New York: Harper and Row.El-Shazly, A. (1999) “The Egyptian Banking System: A Review,” Cairo: World Bank.El-Shazly, A. (2000) “The Banking Sector in Egypt: An Overview,” Cairo: World
Bank.El-Shazly, A. (2001) “Incentive-based regulations and bank restructuring in Egypt,”
Paper presented at the Annual Conference of the Middle East Economic Associ-ation, Cairo, January 2001.
Esfahani, H.S. (1999) “Fiscal Stabilization and Budgetary Institutions in Egypt,”Cairo: Economic Research Forum.
Estrin, S. and Holmes, P. (1983) French Planning in Theory and Practice, London:Allen and Unwin.
Fahmy, K. (1998) “The Era of Muhammad ‘Ali Pasha, 1805–1848,” in M.W. Daly(ed.) The Cambridge History of Egypt, Volume Two: Modern Egypt, Cambridge: Cam-bridge University Press.
FAO (UN, Food and Agriculture Organization) (1999) Comparative Advantage andCompetitiveness of Crops, Crop Rotations, and Livestock Products in Egypt, Cairo: FAORegional Office.
Fawzy, S. (1999) “The Business Environment in Egypt,” in S. Fawzy and A. Galal(eds) Partners for Development, Washington, DC: World Bank.
Fawzy, S. (2000) “Barriers to Egyptian Exports: Institutional Barriers to Exports,” inH. Nassar and A. Aziz (eds) Egyptian Exports and Challenges of the 21st Century, Cairo:Center for Economic and Financial Research and Studies, Cairo University.
Fawzy, S. and Galal, A. (1999) Partners for Development, Washington, DC: WorldBank.
Felipe, J. (1999) “Total factor productivity growth in East Asia: a critical survey,”Journal of Development Studies 35(4):1–41.
Fergany, N. (1991) “A Characterization of the Employment Problem in Egypt,” inH. Handoussa and G. Porter (eds) Employment and Structural Adjustment: Egypt inthe 1990s, Cairo: Economic Research Forum.
Fergany, N. (1992) Poverty and Unemployment Profiles on the Level of AdministrativeUnits, Cairo: Al Mishkat.
Fergany, N. (1995) Recent Trends in Participation in Economic Activity and Open Unem-ployment in Egypt, Cairo: Al Mishkat.
Fergany, N. (1996a) Review of the Labour Force Sample Survey and Basic Measures ofEmployment and Unemployment: Egypt 1990–95, Report prepared for the ILO,Cairo, Egypt.
Fergany, N. (1996b) The challenge for the 21st Century for Egypt: Education and Labor(Arabic), Cairo: Al Mishkat.
Fergany, N. (1998a) The Growth of Poverty in Egypt, Research Notes, Cairo: AlMishkat.
Fergany, N. (1998b) Dynamics of Employment Creation and Destruction: Egypt, 1990–95,Research Notes, Cairo: Al Mishkat.
Fergany, N. (1999) An Assessment of the Unemployment Situation in Egypt, ResearchNotes, Cairo: Al Mishkat.
Fields, G.S. (2001) Distribution and Development, Cambridge, Mass.: MIT Press.Fischer, S. (1993) “The role of macroeconomic factors in growth,” Journal of Mone-
tary Economics 32(3):485–512.
336 Bibliography

Fischer, S. (1994) “Modern Central Banking,” in F. Capie, C. Goodhart, S. Fischer,and N. Schnadt (eds) The Future of Central Banking: The Tercentenary Symposium ofthe Bank of England, Cambridge: Cambridge University Press.
Fleming, J.M. (1962) “Domestic financial policies under fixed and floatingexchange rates,” IMF Staff Papers 9(3):369–79.
Foley, D.K. and Michl, T.R. (1999) Growth and Distribution, Cambridge, Mass.:Harvard University Press.
Foster, J., Greer, J., and Thorbecke, E. (1984) “A class of decomposable povertymeasures,” Econometrica 52(3):761–6.
Frank, C.R. (1970) Debt and Terms of Aid, Washington, DC: Overseas DevelopmentCouncil.
Frank, R. and Bernanke, B. (2001) Principles of Macroeconomics, New York: McGraw-Hill Irwin.
Friedman, M. (1968) “The role of monetary policy,” American Economic Review58(1):1–17.
Fry, M.J. (1995) Money, Interest, and Banking in Economic Development, 2nd edn, Balti-more, Md.: Johns Hopkins University Press.
Fry, M.J. (1997) “The Fiscal Abuse of Central Banks,” in M.I. Blejer and T. Ter-Minassian (eds) Macroeconomic Dimensions of Public Finance, London: Routledge.
Fu, T.-T., Huang, C.J., and Knox Lovell, C.A. (1988) Economic Efficiency and Produc-tivity Growth in the Asia-Pacific Region, Cheltenham: Edward Elgar.
Galal, A. (1995) “Which Institutions Constrain Economic Growth in Egypt theMost?,” Egyptian Center for Economic Studies (ECES), Working Paper No. 1,Cairo: ECES.
Galal, A. (1996) “Savings and Privatization,” Egyptian Center for Economic Studies(ECES), Working Paper No. 8, Cairo: ECES.
Galal, A. (2002) “Employment and Unemployment in Egypt,” Policy Viewpoint 11(Jun), Cairo: ECES.
Galal, A. (2004) “The Economics of Formalization: Potential Winners and Losersfrom Formalization in Egypt,” Egyptian Center for Economic Studies (ECES),Working Paper No. 95, Cairo: ECES.
Galbraith, J.K. (1992) The Culture of Contentment, New York: Houghton Mifflin.Gautier, F. (1997) “Labor markets in the Middle East,” Working Paper for the
World Bank, Washington, DC.Ghoneim, A. (2002) “Institutional Reforms to Promote Exports: Egypt and the
EU,” in N. El-Mikawy and H. Handoussa (eds) Institutional Reform and EconomicDevelopment in Egypt, Cairo: Economic Research Forum.
Giugale, M. and Mubarak, H. (1996) “The Rationale of Private Sector Develop-ment in Egypt,” in M. Giugale and H. Mubara (eds) Private Sector Development inEgypt, Cairo: American University in Cairo.
Government of Egypt/World Bank (2000) Plan of Action for Export Promotion,Report of the Joint Task Force of the Government of Egypt and the World Bank,Cairo: World Bank.
Grubel, H.G. and Johnson, H.G. (1971) Effective Trade Protection, Geneva: GATTand Graduate Institute of International Studies.
Haberler, G. (1958) “Introduction to ‘Problems in International Economics,’ ”Review of Economics and Statistics 40(Supplement):3–9.
Haddad, L. (2003) “Chronic and transitory poverty: evidence from Egypt,1997–99,” World Development 31(1):71–85.
Bibliography 337

Haddad, L. and Ahmed, A. (1999) Poverty Dynamics in Egypt: 1997–1999. Washing-ton, DC: International Food Policy Research Institute.
Hahn, F. and Matthews, R.C.O. (1965) “The Theory of Economic Growth: ASurvey,” in American Economic Association and Royal Economic Society, Surveys in Eco-nomic Theory, Vol. II, London: Macmillan.
Hall, R.E. and Jones, C.I. (1999) “Why do some countries produce so much moreoutput per worker than others?,” Quarterly Journal of Economics 114(1):83–116.
Handoussa, H. (1990) “Egypt’s Investment Strategy, Policies, and Performancesince the Infitah,” in S. El Naggar (ed.) Investment Policies in the Arab Countries,Washington, DC: IMF.
Handoussa, H. (1991a) “A Characterisation of the Employment Problem inEgypt,” in H. Handoussa and G. Potter (eds) Employment and Structural Adjust-ment, Cairo: American University in Cairo Press.
Handoussa, H. (1991b) “Reform Policies for Egypt’s Manufacturing Sector,” in H.Handoussa and G. Potter (eds) Employment and Structural Adjustment, Cairo:American University in Cairo Press.
Handoussa, H. (1991c) “The Impact of Foreign Aid on Egypt’s Economic Develop-ment, 1952–86,” in U. Lele and I. Nabi (eds) Transitions in Development, SanFrancisco: ICS Press.
Handoussa, H. (2002) “A Balance Sheet of Reform in Two Decades,” in N. El-Mikawy and H. Handoussa (eds) Institutional Reform and Economic Development inEgypt, Cairo: Economic Research Forum.
Handoussa, H. and El Oraby, N. (2004) “Civil service wages and reform: the caseof Egypt,” Egyptian Center for Economic Studies (ECES), Working Paper No.98, Cairo: ECES.
Handy, H. (2001) “Monetary policy and financial sector reform in Egypt: therecord and the challenges ahead,” Egyptian Center for Economic Studies(ECES), Working Paper No. 51, Cairo: ECES.
Hansen, B. (1968) “Planning and Economic Growth in the U.A.R. (Egypt),1960–65,” in P.J. Vatikiotis (ed.) Egypt Since the Revolution, London: Allen andUnwin.
Hansen, B. (1974) “Preliminary Report on an Attempt to Estimate NationalProduct and Income for Egypt, ca. 1880–1913,” Berkeley, Calif.: University ofBerkeley, Institute of International Studies.
Hansen, B. (1975) “Arab socialism in Egypt,” World Development 3(4):201–11.Hansen, B. (1991) Egypt and Turkey: The Political Economy of Poverty, Equity, and
Growth, New York: Oxford University Press.Hansen, B. and Marzouk, G. (1965) Development and Economic Policy in the UAR
(Egypt), Amsterdam: North-Holland.Hansen, B. and Mead, D. (1965) “The National Income of the UAR (Egypt),
1939–62,” in S. Goldberg and P. Deane (eds) Studies in Short-Term NationalAccounts and Long-Term Economic Growth, Income and Wealth, Series XI, London:Bowes and Bowes.
Hansen, B. and Nashashibi, K. (1975) Foreign Trade Regimes and Economic Develop-ment: Egypt, New York: National Bureau of Economic Research.
Hansen, B. and Radwan, S. (1982) Employment Opportunities and Equity in Egypt,Geneva: International Labour Office.
Haq, M. ul (1967) “Tied Credits: A Quantitative Analysis,” in J.H. Adler (ed.)Capital Movements and Economic Development, New York: Macmillan.
338 Bibliography
Haq, M. ul (1976) The Poverty Curtain: Choices for the Third World, New York: Colum-bia University Press.
Haq, M. ul (1995) Reflections on Human Development, New York: Oxford UniversityPress.
Haque, N. ul (1990) “Currency Substitution in Egypt,” Washington, DC: Inter-national Monetary Fund.
Haque, N. ul and Montiel, P. (1987) “Ricardian Equivalence, Liquidity Constraintsand the Yaari–Blanchard Effect: Tests for Developing Countries,” DevelopmentResearch Department, Washington, DC: World Bank.
Harberger, A. (1957) “Some evidence on the international price mechanism,”Journal of Political Economy 65(6):506–21.
Harberger, A. (1977) “Perspectives on Capital and Technology in Less DevelopedCountries,” in M.J. Artis and A.R. Nobay (eds) Contemporary Economic Analysis,London: Croome Helm.
Harcourt, G.C. (1972) Some Cambridge Controversies in the Theory of Capital, Cam-bridge: Cambridge University Press.
Harrigan, J. and Mosley, P. (1991) “Evaluating the impact of World Bank struc-tural adjustment lending 1980–87,” Journal of Development Studies 27(3):63–94.
Harrison, A. (1996) “Openness and growth: a time-series, cross-country analysis fordeveloping countries,” Journal of Development Economics 48(2):419–47.
Harrod, R.F. (1948) Towards a Dynamic Economics, London: Macmillan.Hassan, H. (1996) “A PSD-Friendly Tax System,” in M. Giugale and H. Mubarak
(eds) Private Sector Development in Egypt, Cairo: American University in Cairo.Hassan, M. (2003) “Can monetary policy play an effective role in Egypt?,” Egyptian
Center for Economic Studies (ECES), Working Paper No. 84, Cairo: ECES.Helmy, T. (2004) “Empowering the people,” Al-Ahram Weekly, September 3.Hicks, J.R. (1932; 2nd edn, 1963) The Theory of Wages, London: Macmillan.Hinkle, L.E. and Nsengiyumva, F. (1999) “External Exchange Rates: Purchasing
Power Parity, the Mundell–Fleming Model, and Competitiveness in TradedGoods,” in L.E. Hinkle and P.J. Montiel (eds) Exchange Rate Misalignment, NewYork: Oxford University Press.
Hirtle, B.J. and Lopez, J.A. (1999) “Supervisory information and the frequency ofbank examinations,” Federal Reserve Bank of New York, Economic Policy Review(5):1–20.
Hobbes, T. [1651] (1962) Leviathan, New York: Collier Books.Hoekman, B. (1996) Trade and Investment Liberalization: Issues and Options for Egypt,
Washington, DC: World Bank.Hoekman, B. and El-Din, H.K. (2000) Trade Policy Developments in the Middle East
and North Africa, Washington, DC: World Bank.Hoekman, B., Kee, H.L., and Olarreaga, M. (2001) “Markups under domestic and
foreign entry,” Background paper for the World Development Report 2001, Wash-ington, DC: World Bank.
Hoggarth, G., Reis, R., and Saporta, V. (2002) “Costs of banking system instability:some empirical evidence,” Journal of Banking and Finance (26):825–55.
Holt, R. and Roe, T. (1993) “The Political Economy of Reform: Egypt in the1980s,” in R.H. Bates and A.O. Krueger (eds) Political and Economic Interactions inEconomic Policy Reform, Oxford: Blackwell.
Hopkin, W. and Godley, W. (1965) “An analysis of tax changes,” National InstituteEconomic Review 32(May):33–42.
Bibliography 339
Huband, M. (1999) Egypt Leading the Way, London: Euromoney Books.Ibrahim, S.E. (1982) “Social Mobility and Income Distribution in Egypt,
1952–1977,” in G. Abdel-Khalek and R. Tignor (eds) The Political Economy ofIncome Distribution in Egypt, New York: Holmes and Meier.
Ikram, K. (1980) Egypt: Economic Management in a Period of Transition, Baltimore,Md. and London: Johns Hopkins University Press.
Ikram, K. (1981) “Meeting the social contract in Egypt,” Finance and Development18(3):30–33.
IMF (International Monetary Fund) (1982) Annual Report on Exchange Arrangementsand Exchange Restrictions, Washington, DC: IMF.
IMF (1983) Arab Republic of Egypt: Recent Economic Developments, Washington, DC:IMF.
IMF (1998a) Egypt: Beyond Stabilization, Toward a Dynamic Economy, Washington,DC: IMF.
IMF (1998b) “Arab Republic of Egypt: An Agenda for Structural Reform,” Wash-ington, DC: IMF, Middle Eastern Department.
IMF (2003) World Economic Outlook, Washington, DC: IMF.INP (Institute of National Planning) (1996) Egypt: Human Development Report 1996,
Cairo: INP.INP (2002) Egypt: Human Development Report 2002, Cairo: INP.ILO (International Labor Organization) (1996) World Employment Report, 1996/97:
National Policies in a Global Context, Geneva: ILO.ILO (1998) 1998 Yearbook of Labor Statistics, Geneva: ILO.Issawi, C.A. (1963) Egypt in Revolution, London: Oxford University Press.Issawi, C.A. (1990) “Economic Evolution Since 1800,” in I.M. Oweiss (ed.) The
Political Economy of Contemporary Egypt, Washington, DC: Georgetown University,Center for Contemporary Arab Studies.
Johnson, H.G. (1971) Aspects of the Theory of Tariffs, London: Allen and Unwin.Jorgenson, D.W. and Griliches, Z. (1967) “The explanation of productivity
change,” Review of Economic Studies 34(3):249–83.Joshi, V. and Little, I.M.D. (1994) India: Macroeconomics and Political Economy,
1964–1991, Washington, DC: World Bank.Karshenas, M. (1994) “Structural adjustment and employment in the Middle East
and North Africa,” Working Paper, Cairo: Economic Research Forum.Kaufman, D., Kraay, A.. and Zoido-Lobaton, P. (2002) “Governance matters II,”
Policy Research Working Paper No. 2772, Washington, DC: World Bank.Keynes, J.M. (1923) [1971] A Tract on Monetary Reform, London: Macmillan, for
the Royal Economic Society [The Collected Writings of John Maynard Keynes, Vol.IV].
Khattab, M. (1999) “Constraints to privatization: the Egyptian experience,” Egypt-ian Center for Economic Studies (ECES), Working Paper No. 38, Cairo: ECES.
Kheir El Din, H. (2000) “Egypt’s Exports under Liberalization: Performance andConstraints (1980–1998),” in H. Nassar and A. Aziz (eds) Egyptian Exports andChallenges of the 21st Century, Cairo: Center for Economic and Financial Researchand Studies, Cairo University.
Kheir El Din, H. and El Shawarby, S. (2002) “Trade and foreign exchange regimein Egypt,” Paper presented at the Conference on Institutional and PolicyChanges Facing the Egyptian Economy, Cairo University (Center for Economicand Financial Research and Studies) and USAID, May 26–27, 2002, Cairo.
340 Bibliography
Kheir El Din, H. and Moursi, T.A. (2002) “Sources of economic growth and tech-nical progress in Egypt: an aggregate perspective,” Paper presented to the Eco-nomic Research Forum of the Arab Countries, Iran and Turkey, Cairo:Economic Research Forum.
Kheir El Din, H., Moursi, T., and El-Megharbel, N. (1997) “Macroeconomic andSectoral Effects of Trade Liberalization Policies: A General EquilibriumApproach,” in H. Kheir El Din (ed.) Implications of the Uruguay Round on the ArabCountries, Cairo: Dar Al-Mostaqbal Al-Arabi.
Kim, J.-I., and Lau, L. (1994) “The sources of economic growth of the East Asiannewly industrialized countries,” Journal of the Japanese and International Economies8(3):235–71.
Klein, L.R., Ball, R.J., Hazlewood, A., and Vandome, P. (1961) An Econometric Modelof the United Kingdom, Oxford: Basil Blackwell.
Korayem, K. (1992) “Poverty in Egypt: literature review (1985–1991),” Paper sub-mitted to the Third World Forum and UNICEF, Cairo.
Korayem, K. (1994) Poverty and Income Distribution in Egypt, Cairo: Third World Forum.Korayem, K. (1996) “Structural adjustment, stabilization policies and the poor in
Egypt,” Cairo Papers in Social Science 18(4)Winter.Korayem, K. (1997) “Egypt’s Economic Reform and Structural Adjustment
(ERSAP),” Egyptian Center for Economic Studies (ECES), Working Paper No.19, Cairo: ECES.
Kouamé, A.T. (2000) “Egypt: Export Competitiveness Analysis,” Washington, DC:World Bank, MENA Region.
Krugman, P. (1997) “What ever happened to the Asian miracle?,” Fortune13(4):26–7.
Landes, D.M. (1958) Bankers and Pashas, Cambridge, Mass.: Harvard UniversityPress.
Lane, E.W. (1836) The Manners and Customs of the Modern Egyptians, London: J.M.Dent; 1923 (5th edn, 1860) ed. E.S. Poole.
Lanjouw, P. and Ravallion, M. (1995) “Poverty and household size,” EconomicJournal 105(433):1415–34.
Lanjouw, P. (1996) “How Should We Assess Poverty Using Data from DifferentSurveys?,” Washington, DC: World Bank.
Laurens, B. and de la Piedra, E.G. (1998) “Coordination of monetary and fiscalpolicies,” Working Paper, Washington, DC: IMF.
Lavigne, M. (1999) The Economics of Transition, 2nd edn, New York: St. Martin’sPress.
Leamer, E.E. and Stern, R.M. (1970) Quantitative International Economics, Boston:Allyn and Bacon.
Leddin, A.J. and Walsh, B.M. (1992) The Macroeconomy of Ireland, 2nd edn, Dublin:Gill and Macmillan.
Leibenstein, H. (1966) “Allocative efficiency versus ‘x-efficiency,’ ” American Eco-nomic Review 56(3):392–415.
Lerner, A.P. (1944) The Economics of Control, London: Macmillan.Lichtheim, M. (1973, 1976, 1980) Ancient Egyptian Literature, Berkeley: University
of California.Little, T. (1965) High Dam at Aswan, New York: John Day.Loayza, N. and Soto, R. (2002) Inflation Targeting: Design, Performance, Challenges,
Santiago, Chile: Central Bank of Chile.
Bibliography 341

Löfgren, H. (1993) “Economic policy in Egypt: a breakdown in reform resis-tance?,” International Journal of Middle Eastern Studies 25(3):407–21.
Mabro, R. (1974) The Egyptian Economy, 1952–72, Oxford: Clarendon Press.Mabro, R. and Radwan, S. (1976) The Industrialization of Egypt, 1939–73, Oxford:
Clarendon Press.Madani, D. and Olarreaga, M. (2002) “Politically optimal tariffs: an application to
Egypt,” World Bank Policy Research Working Paper, Washington, DC: WorldBank.
Maddison, A. (1970) Economic Progress and Policy in Developing Countries, London:Allen and Unwin.
Mahbub ul Haq Human Development Centre (1999) Human Development in SouthAsia, 1999: The Crisis of Governance, Karachi: Oxford University Press.
Mansfield, P. (1965) Nasser’s Egypt, London: Penguin Books.Marlowe, J. (1974) Spoiling the Egyptians, London: André Deutsche.Marsh, I.W. and Tokarick, S.P. (1994) “Competitiveness indicators: a theoretical
and empirical assessment,” IMF Working Paper No. WP/94/29, Washington,DC: IMF.
Marshall, A. (1924) Money, Credit and Commerce, London: Macmillan.Marsot, A. L. al-Sayyid (1984) Egypt in the Reign of Muhammad Ali, Cambridge: Cam-
bridge University Press.Masera, R. (1974) “The J-curve: UK experience after the 1967 devaluation,” Metro-
economica 26(Jan.–Dec.):40–62.Mason, E.S. (1984) “The Chenery Analysis and Some Other Considerations,” in M.
Syrquin, L. Taylor, and L.E. Westphal (eds) Economic Structure and Performance:Essays in Honor of Hollis B. Chenery, New York: Academic Press.
Mason, E.S. and Asher, R.E. (1973) The World Bank Since Bretton Woods, Washing-ton, DC: Brookings Institution.
Masson, P.R., Savastano, M.A., and Sharma, S.F. (1997) “The scope for inflationtargeting in developing countries,” Working Paper No. 97/130, Washington,DC: IMF.
Matthews, R.C.O., Feinstein, C.H., and Odling-Smee, J.C. (1982) British EconomicGrowth, 1856–1973, Stanford: Stanford University Press.
Mauro, P. (1995) “Corruption and growth,” Quarterly Journal of Economics110(3):681–712.
McCombie, J.S.L. and Thirlwall, A.P. (1994) Economic Growth and the Balance-of-Payments Constraint, London: Macmillan.
Mead, D. (1967) Growth and Structural Change in the Egyptian Economy, Homewood,Ill.: Richard D. Irwin.
Meade, J. (1970) The Theory of Indicative Planning, Manchester: Manchester Univer-sity Press.
Megginson, W.L. and Netter, J.M. (1999) “From state to market: a survey of empir-ical studies on privatization,” Paper presented at Global Equity Markets Confer-ence, Paris, Dec. 10–11, 1998.
Messick, R.E. (1999) “Judicial reform and economic development: a survey of theissues,” The World Bank Research Observer 14(1):117–36.
Ministry of Economy (1981) A Review of Developments in the Egyptian Economy, Cairo:Ministry of Economy.
Ministry of Economy and International Cooperation (1996) Egypt: Economic Profile,Cairo: Ministry of Economy and International Cooperation.
342 Bibliography
Ministry of Economy and Foreign Trade (2001a) “The Status of M/SME Financingin Egypt,” Cairo.
Ministry of Economy and Foreign Trade (2001b) Investing in Egypt, Cairo.Ministry of Planning (1977a) The Five-Year Plan: 1978–82, Vol. 1: The General Strat-
egy for Economic and Social Development, Cairo: Ministry of Planning.Ministry of Planning (1977b) The Five-Year Plan: 1978–82, Vol. 3: Planning the Open
Door Policy, Cairo: Ministry of Planning.Ministry of Planning (1991) Statistical Study on the Evolution of Major Variables in the
Egyptian Economy during the Period 1959/60–1986/87 (Arabic), Cairo: Ministry ofPlanning.
Ministry of Planning (1996, and Suppl. 1997) Total Balance for Resources and Uses1986/87–1994/95 (Arabic), Cairo: Ministry of Planning.
Ministry of Planning/World Bank (2002) Poverty Reduction in Egypt: Diagnosis andStrategy, Washington, DC: World Bank.
Ministry of Planning/World Bank (2004) Arab Republic of Egypt: A Poverty ReductionStrategy for Egypt, Washington, DC: World Bank.
Mishkin, F.S. (2000) “Inflation targeting in emerging countries,” Working PaperNo. 7618, Cambridge, Mass.: National Bureau of Economic Research.
Mishkin, F.S. (2001) “From monetary targeting to inflation targeting: lessons fromindustrialized countries,” Working Paper No. 2684, Financial Sector Strategyand Policy Department, Washington, DC: World Bank.
Mishkin, F.S. and Savastano, M.A. (2000) “Monetary policy strategies for LatinAmerica,” Working Paper No. 7617, Cambridge, Mass.: National Bureau of Eco-nomic Research.
Mishkin, F.S. and Schmidt-Hebbel, K. (2001) “One decade of inflation targeting inthe world: What do we know, and what do we need to know?” Working PaperNo. 8397, Cambridge, Mass.: National Bureau of Economic Research.
Mohammed, N. (2000) “The Sources of Growth in Egypt,” Cairo: World Bank.Mohammed, N. (2001) “Sources of economic growth in Egypt: past experience,
experience of other countries and the way ahead,” Paper prepared for the CairoUniversity Conference on Growth Strategies for Late Comers, with Special Ref-erence to the Arab Region, Cairo, May 12–14, 2001.
Mohieldin, M. (1995) “Causes, measures, and impact of state intervention in thefinancial sector: the Egyptian experience,” Paper presented at a conference onThe Changing Role of the State in Economic Development and Growth, Rabat,Morocco, January.
Mohieldin, M. (1998) “Financial development in Egypt,” Paper prepared for theWorld Bank Resident Mission in Cairo.
Möller, A. (1980) Proposals for the Solution of the Most Important Structural, Economicand Financial Problems of the Arab Republic of Egypt, Occasional Paper No. 63,Berlin: German Development Institute.
Mongardini, J. (1998) “Estimating Egypt’s equilibrium real exchange rate,” IMFWorking Paper, Washington, DC: IMF.
Moursi, T., El-Mossallamy, M., and El-Fatairy, R. (2004) “Inter-temporal and inter-spatial discrepancy in agricultural productivity and income between Upper andLower Egypt,” Background Paper prepared for MOP/World Bank.
Mundell, R.A. (1963) “Capital mobility and stabilization policy under fixed andflexible exchange rates,” Canadian Journal of Economics and Political Science29(4):475–85.
Bibliography 343
Musgrave, R.A. (1959) The Theory of Public Finance, New York: McGraw-Hill.Nassar, H. (2002) “Summary of Existing Knowledge on Micro and Small Enter-
prises,” Cairo: German Technical Cooperation Organization (GTZ)Nassar, H. and Aziz, A. (2000) Egyptian Exports and Challenges of the 21st Century,
Cairo: Center for Economic and Financial Research and Studies, Cairo Univer-sity.
Nassar, H. and El Leithy, H. (2003) “Social risk management under economictransition: formal, informal, and market based arrangements,” Paper deliveredat the Conference on Rising to the Challenge: International Crisis and Eco-nomic Management in Egypt, Cairo: Cairo University Center for Economic andFinancial Research.
Nathan Associates (1996) The Quality Control System in Egypt, Cairo: USAID.Nathan Associates (1997) Financial Reform for Small Business Development in Egypt,
Cairo: USAID.Nathan Associates (1998) Enhancing Egypt’s Exports, Cairo: USAID.Nathan Associates (1999) The Elasticities Approach to Egypt’s Balance of Payments and
Equilibrium Exchange Rate, Cairo: USAID.Neisser, H. and Modigliani, F. (1953) National Incomes and International Trade,
Urbana: University of Illinois Press.Nishimizu, M. and Page, J. (1982) “Total factor productivity growth, technological
progress, and technical efficiency: dimensions of productivity change inYugoslavia, 1965–78,” Economic Journal 92(368):920–36.
North, D.C. (1981) Structure and Change in Economic History, New York: Norton.North, D.C. (1990) Institutions, Institutional Change and Economic Performance, Cam-
bridge: Cambridge University Press.North, D.C. (1991) “Institutions,” Journal of Economic Perspectives 5(1):97–112.Nutting, A. (1972) Nasser, London: Constable.O’Brien, P. (1966) The Revolution in Egypt’s Economic System, London: Oxford Uni-
versity Press.Ohlin, G. (1966) Foreign Aid Policies Reconsidered, Paris: OECD Development
Centre.Orcutt, G.H. (1950) “Measurement of price elasticities in international trade,”
Review of Economics and Statistics 32(2):117–32.Ott, A.F. (1993) “Privatization in Egypt: Reassessing the Role and Size of the
Public Sector,” in A.F. Ott and K. Hartley (eds) Privatization and Economic Effi-ciency, Aldershot: Edward Elgar.
Oweiss, I.M. (1990) The Political Economy of Contemporary Egypt, Washington, DC:Georgetown University, Center for Contemporary Arab Studies.
Oweiss, I.M. (1994) The Underground Economy with Special Reference to the Case ofEgypt, Cairo: National Bank of Egypt.
Owen, E.R.J. (1969) Cotton and the Egyptian Economy, 1820–1914: A Study in Tradeand Development, London: Oxford University Press.
Owen, E.R.J. and Pamuk, S. (1998) A History of Middle East Economies in the TwentiethCentury. London: I.B. Tauris.
Pack, H.M. (2001) “Technological Change and Growth in East Asia: Macro versusMicro Perspectives,” in J.E. Stiglitz and S. Yusuf (eds) Rethinking the East AsianMiracle, Washington, DC: World Bank and Oxford University Press.
Page, J.M. (1996) “A Middle Eastern Miracle?,” Egyptian Center for EconomicStudies (ECES), Distinguished Lecture Series 4, Cairo: ECES.
344 Bibliography

Palmer, M., Leila, A. and Yassin, El S. (1988) The Egyptian Bureaucracy, New York:Syracuse University.
Pearson, D.W. (1997) “Trade Prospects for Egypt,” London: Institute for MiddleEast Studies.
Pesaran, H. and Smith, R. (1995) “The Natural Rate Hypothesis and its TestableImplications,” in R. Cross (ed.) The Natural Rate of Unemployment: Reflections on 25Years of the Hypothesis, Cambridge: Cambridge University Press.
Phelps, E.S. (1967) “Phillips curves, expectations of inflation, and optimal unem-ployment over time,” Economica NS 34(135):254–81.
Phillips, A.W. (1958) “The relation between unemployment and the rate ofchange of money wage rates in the United Kingdom, 1861–1957,” Economica25(Nov.):283–99.
Pincus, J. (1965) Economic Aid and International Cost Sharing, Baltimore, Md.: JohnsHopkins University Press.
Pisani-Ferry, J. (2000) Plein Emploi, Report of the Conseil D’Analyse Economique,Paris: La Documentation Française.
Portes, A. (1996) “The Informal Economy: Perspectives from Latin America,” in S.Pozo (ed.) Exploring the Underground Economy, Kalamazoo, Mich.: W.E. UpjohnInstitute for Employment Research.
Prais, S.J. (1962) “Econometric research in international trade: a review,” Kyklos15(3):560–79.
PRIDE (Project in Development and the Environment) (1994) Comparing HealthRisks in Cairo, Cairo: USAID.
Radwan, S. (1974) Capital Formation in Egyptian Industry and Agriculture, 1882–1967,London: Ithaca Press.
Radwan, S. (1997) Job Creation and Poverty Alleviation in Egypt: Strategy and Pro-grammes, Geneva: ILO.
Radwan, S. (1998) “Towards full employment: Egypt into the 21st century,” Egypt-ian Center for Economic Studies (ECES), Distinguished Lecture Series 10,Cairo: ECES.
Radwan, S. (2002) “Employment and unemployment in Egypt: conventional prob-lems, unconventional remedies,”Egyptian Center for Economic Studies (ECES),Working Paper No. 70, Cairo: ECES.
Radwan, S. and Lee, E. (1977) Job Creation and Poverty Alleviation in Egypt: Strategyand Programmes, Geneva: ILO.
Ravallion, M. (1992) “Poverty comparisons: a guide to concepts and methods,”LSMS Working Paper No. 88, Washington, DC: World Bank.
Ravallion, M. (1994) Poverty Comparisons, New York: Harwood Academic.Ray, D. (1998) Development Economics, Princeton, NJ: Princeton University Press.Refaat, A. (2000) “Egypt: An Assessment of Recent Trade Policy Developments,” in
B. Hoekman and H. Kheir El-Din (eds) Trade Policy Developments in the MiddleEast and North Africa, Washington, DC: World Bank.
Rhee, Y.W., Ross-Larsen, B., and Pursell, G. (1984) Korea’s Competitive Edge, Balti-more, Md. and London: Johns Hopkins University Press.
Richards, A. (1984) “Ten years of Infitah: class, rent, and policy stasis in Egypt,”Journal of Development Studies 20(4):323–38.
Richards, A. (1991) “The political economy of dilatory reform: Egypt in the1980s,” World Development 19(12):1721–30.
Richards, A. (1993) “Food, Jobs, and Water: Participation and Governance for a
Bibliography 345
Sustainable Agriculture in Egypt,” in M.A. Faris and M.H. Khan (eds) SustainableAgriculture in Egypt, Boulder, Col. and London: Lynne Rienner.
Rivlin, H.B. (1961) The Agricultural Policy of Muhammad Ali in Egypt, Cambridge,Mass.: Harvard University Press.
Rivlin, P. (1985) The Dynamics of Economic Policymaking in Egypt, New York: Freder-ick A. Praeger.
Rizk, S.K. (1991) “The Structure and Operation of the Informal Sector in Egypt,”in H. Handoussa and G. Potter (eds) Employment and Structural Adjustment, Cairo:American University in Cairo Press.
Robinson, J. (1937) Essays in the Theory of Employment, Oxford: Blackwell.Robinson, J. (1953) “The production function and the theory of capital,” Review of
Economic Studies 21(2). (Reprinted in J. Robinson (1960) Collected EconomicPapers, Vol. 2, Oxford: Basil Blackwell.)
Robinson, J. (1956) The Accumulation of Capital, London: Macmillan.Robinson, J. (1971) “The measure of capital: the end of the controversy,” Economic
Journal 81(323):597–602.Rodrik, D. (1997) “TPFG controversies, institutions and economic performance in
East Asia,” National Bureau of Economic Research [NBER], Working Paper No.5914, Cambridge, Mass.: NBER.
Roe, A.R. (1998) “The Egyptian Banking System: Liberalization, Competition andPrivatization,” in M. El-Erian and M. Mohieldin (eds) Financial Development inEmerging Markets: The Egyptian Experience, Cairo: Egyptian Center for EconomicStudies.
Roussillon, A. (1998) “Republican Egypt: revolution and beyond,” in M.W. Daly(ed.) The Cambridge History of Egypt, Vol. 2: Modern Egypt, Cambridge: CambridgeUniversity Press.
Russell, J. (1997) Trade Factors in Middle East Economies, London: Institute forGlobal Economics.
Rutherford, M. (1994) Institutions in Economics: The Old and the New Institutionalism,Cambridge: Cambridge University Press.
Sachs, J. (1996) “Achieving rapid growth: the road ahead for Egypt,” EgyptianCenter for Economic Studies (ECES), Distinguished Lecture Series 3, Cairo:ECES.
Sachs, J. and Warner, A. (1995) “Economic reforms and the process of globalintegration,” Brookings Papers on Economic Activity 1:1–118.
Sadowski, Y.M. (1991) Political Vegetables, Washington, DC: Brookings Institution.Samuelson, P.A. and Solow, R.M. (1960) “Analytical aspects of anti-inflation
policy,” American Economic Review, Papers and Proceedings 50(2):177–94.Sarraf, M. (2004) “Assessing the costs of environmental degradation in the Middle
East and North Africa Region,” Environment Strategy Notes No. 9, Washington,DC: World Bank.
Schdlowsky, D.M. (1967) “From import substitution to export promotion for semi-grown-up industries: a policy proposal,” Journal of Development Studies 3(4): 405–13.
Schmidt, P. (1985) “Frontier production functions,” Econometric Reviews 4(2): 156–69.
Schneider, F. and Enste, D. (2000) “Shadow Economies Around the World: Size,Causes, and Consequences,” Working Paper No. WP/00/26, Washington, DC:IMF.
346 Bibliography
Sciolli, G. (1976) “Egypt Public Finances: A Historical View,” Paper prepared forthe World Bank (MENA Region), Washington, DC.
Scobie, G.M. (1981) Government Policy and Food Imports: The Case of Wheat in Egypt,Washington, DC: International Food Policy Research Institute.
Sen, A. (1976) “Poverty: an ordinal approach to measurement,” Econometrica44(2):219–32.
Sen, A. (1981) Poverty and Famines, Oxford: Clarendon Press.Sen, A. (1984) Resources, Values and Development, Cambridge, Mass.: Harvard Uni-
versity Press.Sen, A. (1985) Commodities and Capabilities, Amsterdam: North-Holland.Sen, A. (1992) Inequality Reexamined, Oxford: Clarendon Press.Sen, A. (1995) “Wrongs and rights in development,” Prospect Oct: 6–10.Sen, A. (1997) “From income inequality to economic inequality,” Southern Economic
Journal 64(2):384–401.Sen, A. (1999) Development as Freedom, New York: Alfred A. Knopf.Shihata, I. (1996) “Legal and Regulatory Framework for Private Sector Develop-
ment in Egypt,” in M. Giugale and H. Mubarak (eds) Private Sector Development inEgypt, Cairo: American University in Cairo Press.
Schmidt, W.E. (1964) “The economics of charity,” Journal of Political Economy72(4):387–95.
Social Policy and Development Centre, Pakistan (2001) Social Development in Pak-istan: Towards Poverty Reduction, Karachi: Oxford University Press.
Solow, R.M. (1956) “A contribution to the theory of economic growth,” QuarterlyJournal of Economics 70(1):65–94.
Solow, R.M. (1957) “Technical change and the aggregate production function,”Review of Economics and Statistics 39(3):312–20.
Staiger, D., Stock, J.H., and Watson, M.W. (1997) “The NAIRU, unemploymentand monetary policy,” Journal of Economic Perspectives (Winter):33–49.
Stanford Research Institute (1995) Achieving Egyptian Export Growth, Cairo: USAID.
Stern, R.M. (1973) The Balance of Payments, Chicago, Ill.: Aldine.Subramanian, A. (1997) “The Egyptian stabilization experience,” Egyptian Center
for Economic Studies (ECES), Working Paper No. 18, Cairo: ECES.Surrey, M. (1971) The Analysis and Forecasting of the British Economy, Cambridge:
Cambridge University Press.Svensson, L.E.O. (1997) “Inflation forecast targeting: implementing and monitor-
ing inflation targets,” European Economic Review 41(Jun.):1111–46.Svensson, L.E.O. (1999) “Price level targeting vs. inflation targeting: A free
lunch?” Journal of Money, Credit and Banking 31(Aug.):277–95.Tait, A., Gratz, W.L.M., and Eichengreen, B.J. (1979) “International comparisons
of taxation for selected developing countries, 1972–76,” IMF Staff Papers26(1):123–56.
Theil, H. (1966) Applied Economic Forecasting, Amsterdam: North-Holland Publish-ing Company.
Thirlwall, A.P. (1974) “The Keynesian multiplier with interest rate, redistri-bution and real balance effects,” Oxford Bulletin of Economics and Statistics36(4):235–46.
Thirlwall, A.P. (2003) Growth and Development: With Special Reference to DevelopingCountries, 7th edn, New York: PalgraveMacmillan.
Bibliography 347

Thirlwall, A.P. and Gibson, H. (1992) Balance of Payments Theory and the UnitedKingdom Experience, 4th edn, London: Macmillan.
Tinbergen, J. (1952) On the Theory of Economic Policy, Amsterdam: North-Holland.Tohamy, S. and Swinscoe, A. (2000) “The economic impact of tourism in Egypt,”
Egypt Center for Economic Studies (ECES), Working Paper No. 40, Cairo:ECES.
Toledano, E.R. (1998) “The ‘long nineteenth century,’ ” in M.W. Daly (ed.) TheCambridge History of Egypt, Vol. 2: Modern Egypt, Cambridge: Cambridge UniversityPress.
Transparency International (2001) Global Corruption Report 2001, Berlin: Trans-parency International.
Tripp, R.T. (1970) The International Thesaurus of Quotations, New York: PenguinBooks.
Tsegaye, A. (1981) “The specification of the foreign trade multiplier for a develop-ing country,” Oxford Bulletin of Economics and Statistics 43(3):287–300.
United Arab Republic (n.d.) The Charter, Cairo: Information Department.UNDP (United Nations Development Program) (1996) Egypt: Human Development
Report 1996, Cairo: Institute of National Planning.UNDP (1997) Human Development Report 1997, New York: Oxford.UNDP (2000) Human Development Report 2000, New York: Oxford.UNDP (2002) Egypt: Human Development Report 2002, Cairo: Institute of National
Planning.UNDP/Arab Fund for Economic and Social Development (2002) Arab Human
Development Report, 2002, New York: United Nations Development Programme.United Nations Food and Agriculture Organization (1999) Comparative Advantage
and Competitiveness of Crops, Crop Rotations and Livestock Products in Egypt, Cairo:UN-FAO.
van Welzenis, G. (1999) “The Accuracy of International CPB Forecasts,” CPB Report2, The Hague, The Netherlands: Netherlands Centraal Planbureau.
Vatikiotis, P.J. (1961) The Egyptian Army in Politics, Bloomington, Ind.: Indiana Uni-versity Press.
Vatikiotis, P.J. (1968) Egypt since the Revolution, London: Allen and Unwin.Virmani, A. (1991) “Demand and supply factors in India’s foreign trade,” Economic
and Political Weekly (Bombay, India) 26(6):309–14.Vittas, D. (1998) “The role of non-bank financial intermediaries,” Policy Research
Working Paper No. 1892, Development Research Group, Washington, DC:World Bank.
Wahba, M.M. (1994) The Role of the State in the Egyptian Economy, 1945–81, Reading:Ithaca Press.
Wahba, J. and Mokhtar, M. (1999) “Informalization of labour in Egypt,” Paper pre-pared for a Conference Labour Market and Human Resource Development inEgypt, Cairo, October 1999.
Waite, C.A., Eldridge, D.P., Hill, C.T., Balderston, T., and Green Zeilinger, L.(1998) The Modernization of Egypt’s National Accounts, Miami, Fl.: IMCC forUSAID under contract PCE-0405-Q-00–5016–00.
Waterbury, J. (1979) Hydropolitics of the Nile Valley, Syracuse, NY: Syracuse UniversityPress.
Waterbury, J. (1983) The Egypt of Nasser and Sadat, Princeton, NJ: Princeton Univer-sity Press.
348 Bibliography

Weinbaum, M.G. (1986) Egypt and the Politics of U.S. Economic Aid, Boulder, Col.:Westview.
Weiss, D. (1993) “Institutional obstacles to reform policies: a case study of Egypt,”Economics 47:176–98.
Weiss, D. and Wurzel, U. (1998) The Economics and Politics of Transition to an OpenMarket Economy: Egypt, Paris: OECD Development Centre.
Westley, J. (1999) “Change in the Egyptian Economy, 1977–1997,” in M.C.Kennedy (ed.) Twenty Years of Development in Egypt (1977–1997), Cairo Papers inSocial Sciences, Cairo: American University in Cairo.
Williamson, J. (1982) “A survey of the literature on the optimal peg,” Journal ofDevelopment Economics 11(1):39–62.
Williamson, J. (1994) Estimating Equilibrium Exchange Rates, Washington, DC: Insti-tute for International Economics.
Winters, A. (1991) International Economics, 4th edn, London: HarperCollins.World Bank (1966) Arab Republic of Egypt: Economic Situation and Prospects, Washing-
ton, DC: World Bank.World Bank (1969) Arab Republic of Egypt: Economic Report, Washington, DC: World
Bank.World Bank (1975) Yugoslavia: Development with Decentralization, Baltimore, Md.:
Johns Hopkins University Press.World Bank (1978) Arab Republic of Egypt: Economic Management in a Period of Trans-
ition, Washington, DC: World Bank.World Bank (1983) Egypt: Issues of Trade Strategy and Investment Planning, Washing-
ton, DC: World Bank.World Bank (1987) Egypt: Review of the Finances of the Decentralized Public Sector (2
vols). Washington, DC: World Bank.World Bank (1989) World Development Report 1989: Financial Systems and Development,
New York: Oxford University Press.World Bank (1990a) World Development Report: Poverty, New York: Oxford University
Press.World Bank (1990b) Adjustment Lending: Ten Years of Experience, Washington, DC:
World Bank.World Bank (1990c) Arab Republic of Egypt: Country Economic Memorandum, Economic
Readjustment with Growth, Washington, DC: World Bank.World Bank (1991) Egypt: Alleviating Poverty during Structural Adjustment, Washing-
ton, DC: World Bank.World Bank (1992) Arab Republic of Egypt: Private Sector Regulatory Environment Study,
Washington, DC: World Bank.World Bank (1993a) Egypt: Financial Policies for Adjustment and Growth, Washington,
DC: World Bank.World Bank (1993b) The East Asian Miracle, Washington, DC: World Bank.World Bank (1994) Private Sector Development in Egypt, Cairo: World Bank.World Bank (1995a) Arab Republic of Egypt: Economic Policies for Private Sector Develop-
ment, Washington, DC: World Bank.World Bank (1995b) Viet Nam: Poverty Assessment and Strategy, Washington, DC:
World Bank.World Bank (1996) Tanzania: The Challenge of Reforms, Washington, DC: World Bank.World Bank (1997) Arab Republic of Egypt: Egypt – Issues in Sustaining Economic
Growth, Washington, DC: World Bank.
Bibliography 349

World Bank (1998a) Egypt in the Global Economy, Washington, DC: World Bank.World Bank (1998b) Assessing Aid: What Works, What Doesn’t, and Why, New York:
Oxford University Press.World Bank (1999) World Development Report 1999/2000: Entering the 21st Century,
New York: Oxford University Press.World Bank (2001) World Development Report 2000/2001: Attacking Poverty, New
York: Oxford University Press.World Bank (2001) Egypt: Social and Structural Review, Washington, DC: World
Bank.World Bank (2002) Cost Assessment of Environmental Degradation in Egypt, Washing-
ton, DC: World Bank.Yarrow, G. (1986) “Privatization in theory and practice,” Economic Policy
1(2):323–64.Yeats, A. (1995) “Export prospects of Middle Eastern countries: a post-Uruguay
round analysis,” Policy Research Working Paper No. 1571. Washington, DC:World Bank.
Young, A. (1992) “A tale of two cities: factor accumulation and technical change inHong-Kong and Singapore,” Macroeconomics Annual, Cambridge, Mass.: NationalBureau of Economic Research/MIT Press, pp. 13–24.
Young, A. (1995) “The tyranny of numbers: confronting the statistical realitiesof the East Asian growth experience,” Quarterly Journal of Economics110(Aug.):641–80.
Zaki, M.Y. (1995) “Forecasting the money multiplier and the control of moneysupply in Egypt,” Journal of Development Studies 32(1):97–111.
Zaki, M.Y. (2001) “IMF-supported stabilization programs and their critics: evid-ence from the recent experience of Egypt,” World Development 29(11):1867–83.
Zanello, A. and Desruelle, D. (1997) “A primer on the IMF’s information noticesystem,” IMF Working Paper No. WP/97/71, Washington, DC: IMF.
Zaytoun, M. (1991) “Earnings and the Cost of Living: An Analysis of Recent Devel-opments in the Egyptian Economy,” in H. Handoussa and G. Potter (eds)Employment and Structural Adjustment, Cairo: American University in Cairo Press.
350 Bibliography
Abdallah, Ismail Sabri 19Abdel-Faddil, M. 3Abdel-Khalek, G. 65, 71, 135, 247Abu Ali, Sultan 127, 185Acharya, S. 111Adams, R.H. 67, 108, 270Ahmed, A. 247, 262, 264, 268–9Ahmed, S. 163, 167, 168Alba, P. 178, 279Ali, Muhammad 1Ali, S. 67Al-Shawarby, S. 143, 323Amin, G. 5, 6, 323Anand, S. 275Anis, M.A. 86, 108Aristotle 315Artus, P. 316Asher, R.E. 4Assaad, R. 110, 115, 210, 213–15, 219,
221–3, 227, 231–5, 238, 241, 243, 244,293
Atkeson, A. 99Ayubi, N. 293, 295
Backhouse, R. 278 Baker, R.W. 1, 9 Ball, L. 100Bartsch, U. 251Bentley, J. 298, 300Bernanke, B.S. 195, 196Beveridge, Lord 277Bhagwati, J. 36Bisat, A. 100, 105Blinder, A.S. 316Bouis, H. 262Boutros-Ghali, Youssef 61Brada, J.C. 312
Calvo, G.A. 73Cardiff, P. 247, 250, 251, 253, 260, 274Challiah, R. 163
Church, K.B. 316Cooper, M. 22, 31, 52Cooper, R.N. 54Corbo, V. 38Cornia, G. 38Cottenet, H. 25Crémer, H. 312Crémer, J. 312
Dakolias, M. 299Danilin, V.I. 107Datt, G. 247, 253, 258–60, 263, 266, 267de la Piedra, E.G. 193De Soto, H. 288–9Denison, E. 102Dessouki, A.H. 2, 51Dialami, M. 170Dinh, H.T. 168, 170Djankov, S. 294Domar, E. 65Dorfman, R. 45Dubey, V. 31
Easterly, W. 69Ebeid, Atef 61, 79, 297Edwards, S. 73Eilts, H. 39El-Bishry, Zafer 38El-Dersh, Ahmed 39El-Edel, M. Reda A. 167El-Erian, M. 184El-Gamal 100, 105El-Ganzoury, Kemal 61, 78El-Ghonemy, M.R. 292El-Imam, M. 36El-Kaissouni, A.M. 19, 31, 34El-Leithy, H. 213, 247, 248, 250–3, 255,
259, 261, 265–6, 269, 274, 278Elmendorf, D.W. 178El-Oraby, N. 295El-Razaz, Mohammed Ahmed 61
Name index

El-Sayeh, Hamed 31, 51El-Shazly, A. 183, 187Este, D. 110Estrin, S. 312
Fawzy, S. 290Fergany, N. 110, 114, 210, 213, 217,
219, 222–3, 227–8, 231–2, 235, 243, 251
Fields, G.S. 275, 276Fischer, S. 38Friedman, M. 98Fry, M. 69Fu, T. 107
Galal, A. 246, 290, 291, 296Ghoneim, A. 292Gibson, H. 137, 140, 317Giugale, M. 168, 170, 300Godley, W. 316Griliches, Z. 102
Haberler, G. 137Haddad, L. 247, 264, 268–9Hahn, F. 103Hall, R.E. 106, 107Hamed, Saleh 32, 61Handoussa, H. 24, 36, 44, 215, 236, 243,
295Handy, H. 194Hansen, B. 5, 6, 8, 10, 12, 53, 86, 87, 109,
125, 132, 142, 167Haq, Mahbub ul 36, 315Haque, Nadeem ul 179, 184Harberger, A. 115, 137Harrigan, J. 38Harrod, R. 103Hassan, M. 197Hegazy, Abdel Aziz 19, 20, 21–2Heikal, M. 1Helmy, T. 288 Hicks, J.R. 103Hobbes, T. 300Hoekman, B. 287Hoggarth, G. 189Holmes, P. 312Holt, R. 53Hopkin, W. 316Huband, M. 200
Ibrahim, S.E. 247Ikram, K. 24, 86, 109, 121, 125, 144, 147,
159, 198, 247Ismail, Abou 28, 30Issawi, C.A. 7
Jolly, R. 38Jones, C.I. 106, 107Jorgenson, D.W. 102Joshi, V. 137–8
Karsenhas, M. 217, 243Kaufman, D. 298Keynes, J.M. 168Kheir El-Din, Hanaa 105, 143, 285Klein, L.R. 137Korayem, K. 135, 247Kouamé, A.T. 285Krugman, P. 104
Langouw, P. 274Laurens, B. 193Leddin, A.J. 174Lee, E. 247, 257Little, I.M.D. 137–8Loayza, N. 195, 196Lotfi, Ali 51
Mabro, R. 9, 10, 109, 125McCombie, J.S.L. 115McNamara, Robert 31, 51–2Madani, D. 142Maddison, A. 106Mankiw, N.G. 100, 179Marzouk, G. 6, 8, 125Masera, R. 140Mason, E.S. 4, 52Masson, P.R. 196Matthews, R.C.O. 103Mauro, P. 297Mead, D. 2, 86, 87, 109Meade, J. 312Megginson, W.L. 81Meguid, Abdel Razzaq Abdel 53Mishkin, F.S. 195, 196Modigliani, F. 137Mohammed, N 101, 105, 278, 279Mohieldin, M. 184Mongardini, J. 134Montiel, P. 179Morsi, Fuad 19 Mosley, P. 38Moursi, T. 105Mubarak, Hamed 300Mubarak, President Hosni 37–8, 61
Nashashibi, K. 12, 125, 142Nassar, H. 278Nasser, President Gamal Abdel 19, 47, 53Nathan Associates 125, 138–9, 143, 289Neisser, H.137Netter, J.M. 81
352 Name index

Nishimizu, M. 107North, D.C. 287–8Nutting, A. 10
O’Brien, P. 5, 6, 7Ohanian, L.E. 99Olarreaga, M. 142Orcutt, G. 136–7Osman, M. 247, 251Ott, A. 77Oweiss, I.M. 110Owen, E.R.J. 18, 26
Page, J. 107, 270Palmer, M. 292, 295Pamuk, S. 18, 26Pearson, D.W. 138Pesaran, H. 99Phelps, E.S. 98Phillips, A.W. 97Pisani-Ferry, J. 99, 277Prais, S.J. 137
Radwan, S. 125, 210, 214, 217, 237, 243,245–6, 247, 257
Ravallion, M. 274Reinhart, C.M. 73Riad, N. 335Richards, A. 51, 52, 59, 281Richards, I.A. 18Rizk, S.K. 110Robinson, J. 102Rodrik, D. 296Roe, A.R. 184, 187Roe, T. 53Roussillon, A. 1Rutherford, M. 288
Sachs, J. 284Sadat, President Anwar 9, 13, 17, 20, 21,
22–3, 30, 32, 34, 51Sadowski, Y.M. 37Samuelson, P.A. 45, 97Sarraf, M. 308Savastano, M.A. 195Schmidt, P. 107
Schmidt-Hebbel, K. 69, 196Schneider, F. 110Sciolli, G. 158Sen, A.K. 253, 273, 315Shafei, Zaki 28Sidqi, Aziz 19Smith, R. 99Solow, R. 45, 97, 102, 316Soto, R. 195, 196Stewart, F. 38Streeten, P. 315Subramanian, A. 68, 134Surrey, M.C. 316Svensson, L.E.O. 196Swinscoe, A. 127
Tait, A.163Taylor, L. 30Thirlwall, A.P. 115, 137, 140, 316, 317, 324 Tignor, R. 247Tinbergen, J. 76Tohamy, S. 127Tsegaye, A. 316
Vatikiotis, P.J. 1Virmani, A. 138Vittas, D. 203, 206
Wahba, M. 6, 12Waite, C.A. 109, 110Walsh, B.M. 174Warner, A. 284 Waterbury 4, 9, 10, 296, 308Webb, S. 38Weinbaum, M. G. 22, 35, 37, 39, 42, 294,
295Weiss, D. 52, 54Westley, J. 11Williamson, J. 72, 140Winters, A. 137218, 247, 278, 290, 299Wurzel, U. 52
Zaki, Hassan Abbas 19Zaki, M.Y. 67, 170, 190Zaytoun, M. 245
Name index 353

Subject index
absolute poverty lines 274–5absorptive capacity, loans 39adaptive expectations 99administration: costs 157, 172; procedures
294adult equivalence scales 274age-specific: labor participation 218, 222;
unemployment 228–30agriculture sector: employment 96, 217,
235–6, 241; exports 124; growth 88–9;imports 151; income 171; inefficiencies12; investment 16–17; land 85, 89,262–3, 267; loans to 185; market prices86; protection 142–3; reform 3, 9; stateinfluence 8
air pollution 308Alexandria Businessmen’s Association 289Alexandria stock exchange 197, 200American Chamber of Commerce, Egypt
187annual investment programs 8Arab countries, investment 20–1Arab Human Development Report (2002) 298‘Arab Socialism’ 7, 8, 92, 157Arab–Israeli dispute 4artificial trading 199, 200–2Aswan High Dam 3–4, 27authorized capital, banks 186
balance of payments: developments117–20; issues 125–54; pressures 16
balance of trade 120–3; deficits 316–17bank credit facilities 16–17Bank for International Settlements 82Bank Misr 6banking sector 180–3; reform 5, 6–7, 18,
62; safety and prudential regulations188–90; segmentation 185
Basle Committee 189best-practice 107–8bilateral aid 37, 39
bond market 202–3bread riots (1977) 27, 31–2, 33, 60budget (1977) 31–3budget deficits 12–13, 15, 28, 152, 158–9,
161–2, 168–9; consolidation 58–9;effects 178–9; sustainability 65
budgetary resources, vulnerability of177–8
budgets, structural rigidities 47Build-Own-Operate-Transfer (BOOT)
projects 67bureaucracy see civil servicebusiness: environment 287–303; services
sector 237Business International 297
Cairo: stock exchange 197, 200, 289;unemployment 227
capability deprivation 253–5, 273Capability Poverty Measure 254, 273capital: formation 5; inputs 71, 101–3,
105–6; market 197–203, 208; return on75, 77; stock 115–16, 314; transfers 21,58–9
Capital Market Authority (CMA) 180,199–200, 202
capital-intensive: industries 128;production 215, 217
cash transfers 307Central Bank of Egypt 49, 59, 65, 70–1,
112, 167, 180, 181, 182, 187, 188,190–1; foreign exchange dealings 46–7,131–2; role 193–7
central government 156chronic poverty 268–9civil service 292; corruption 297–8;
efficiency 296–7; elite units 297;employment 215–16; productivity 295;remuneration/incentives 294–5; size293–4; structure 294
class structure 52

clothing sector 128–9Cobb–Douglas production function 104,
105, 279, 314commercial: disputes 298–300; sector 237commercial banks 49, 82, 159, 181–3, 186,
187, 191; foreign exchange dealings46–7, 131–2; risk monitoring 189
Commodity Import Program 39community facilities, access to 263, 267competition, protection from 200–1competitiveness, exports 48, 128–30, 285concessional loans 39–40, 43–4construction sector 216, 217, 237Consumer Price Index 14, 59, 168–9consumption: data 109; determinants of
92–4; expansion 22–3; patterns 257–8,261–2, 268–9
contingent liabilities 177–8contractual savings institutions 203–4corporate bonds 202Corruption Perceptions Index 297cost controls 8–9Cotton Authority 6–7cotton sector 17, 118, 123–4credit: access 208, 289; growth 191–2;
large firms 197; rationing 184current account balances 117–18, 174customs duties 163–4, 165–6;
rebate/drawback scheme 286
data 108–15‘dead’ capital 287–8debt: costs 174–6; crisis (1987) 57–8,
151–2; equity ratios 58; forgiveness 61,68, 148, 150, 153–4; GDP ratio 134,174–7; management 144–54, 193–4;relief 68–9; rescheduling 57–8, 59–63,67–8, 119, 134, 145–50, 152–3; servicing57–8, 119, 158, 172–3, 174
Debt Conversion Plan (1943) 144decomposable poverty measure 275–6defence expenditures 12, 157, 158demand 63, 90, 100, 135–41, 281demographic: characteristics 85, 86, 277,
312–13; pressure, employment 233–4dependency 257–8, 264, 266deposit insurance scheme 187development: aims 315; effect of fiscal
deficits 66; strategy 281, 283–4; UpperEgypt 306–7
direct foreign investment 41discouraged unemployment 231–3disposable income 93distributive services 139dollarization 60, 70–1, 73, 170, 184–5domestic: absorption, exports 140;
finance 161; savings 90, 92, 93, 101,218, 283, 313
domestic resource costs (DRC) 77‘Dutch disease’ phenomenon 25
East Asian economies 104East Asian financial crisis (1997) 75, 91,
140, 217economic: authorities 62, 64, 77, 79–80;
data 108–15; decision making 52;effects of foreign aid 42–3; framework7; goals 40; inefficiency 12–13; reforms61–3, 153
economic growth: demand components90; effects of poverty changes 269–70;and employment 94–7, 214–18; andinvestment 100–1; sectoral composition271; slowdown 13–17; stabilizationprogram 63–76; and total factoryproductivity 101–8
economic management/planning 5–6,27–8, 310–12; framework 49–54; tools48–9
Economic Organization 5Economic Reform and Structural
Adjustment Program (ERSAP) 63–5,182, 184, 188, 193–4
economic structure: requirements of49–54; rigidities in 24–5
education: access 254; effect on outputs106–7; expansion of 10–11; for growth302–3; and poverty 266, 267–8, 269;strategy 304–6; system 296; andunemployment 230–1
educational characteristics 258–60educators, growth of 293effective exchange rate (EER) 72, 74efficiency of bureaucracy 296–7Egyptian Central Petroleum Company
(EGPC) 156, 159, 163, 164, 167Egyptian Mail 296Egyptian National Railways 112Egyptianization policy 3, 5, 6–7elitism 52employment: characteristics 260; cuts 81;
data 113–14, 210; and economic growth94–7, 214–18; effects on poverty 267–8;elasticity 278; goals 279; growth 234–46;policies 215–16; public sector 81, 171,293–4; status 266–7
employment guarantee program (EGP)14, 18, 214, 215, 216, 234, 243–5, 293,294
endogenous growth models 104engineering sector 291enterprise finance 208–9
Subject index 355

entrepreneurs 75environmental issues 281–2, 307–8equilibrium real exchange rate (ERER)
133–4equity: distribution of wealth 10; market
200; regional patterns of 272Europe, pension funds 203European Union: associate membership
284; trade with 129, 177exogenous shocks, responses to 66expectations-augmented Phillips Curve
98–9expenditure: cuts 67; issues 161–3, 171–4;
patterns 261–2expenditure-based poverty measurements
248–53explicit subsidies 58export-led development 283–4export-promoting schemes 286exports 119, 120–3; barriers 286–7;
competitiveness 128–30; demand138–9; development 284–6; growth125–6, 313–14; incentives 55, 129–30,135, 285–6; merchandise 123–5; non-traditional 45–6; services 118
external: aid 26, 118, 145, 152; debt,management of 144–54; debt-basedgrowth 54–6; finance 161; revenues 215
Federation of Egyptian Industries 2female: education 205; employment
114–15, 216, 218, 219, 221, 222, 223,235, 238, 239, 241, 244, 245, 260;illiteracy 254; underemployment 231–3;unemployment 224, 226, 227, 228, 234,266–7
finance, access to 302financial sector: employment 237; non-
bank 203–4; policy 183–6; reform of 62fiscal: accounts data 112; developments
157–63; imbalance, correction of 64;policy 48, 193–4; sustainability 174–9;system, changes to 67; trends 47–8
Five Year Plans 5, 6, 8, 22, 50, 144, 311food: imports 151; poverty lines 274;
sectors 128; security 281foreign: aid, economic effects 42–3;
currency accounts 46, 59, 184–5; debt11–12; savings 283, 284, 313
foreign exchange: accounts 125–6, 170–1;availability 24–5; denominated deposits181; dual rate system 64; earnings126–7, 313, 317; pegging 71–4, 76; rates29, 45–7, 49, 55–6, 62–3, 130–41, 195;reserves 11, 71, 73–4; security 281
formalization of businesses 290
Foster–Greer–Thorbecke index 275France, employment 277–8free trade 1–2; agreements 177Full Employment in a Free Society 277
gender bias, employment 239, 245, 246General Authority for Social Insurance
(GASI) 204–5General Authority for Supply
Commodities (GASX) 14, 79, 156General Sales Tax 143, 179, 286geographic characteristics 85, 86Global Income Tax 179government: borrowing 15–17, 27–34;
control 6–13; intervention 3–6;securities 191
Government Organization for Export andImport Control 143
gradualism 50–1graduate: employment 230–1, 243–5; labor
costs 216; poverty 258; quality 296–7;skills 303; unemployment 234, 245–6
graft 298‘gray economy’ see informal economygross domestic product (GDP): long- term
trends 85–8; potential 278–82;structural changes 88–9
growth accounting approach 104–5Gulf Organization for the Development
of Egypt (GODE) 16, 26, 119, 145Gulf war 60, 61, 68, 139, 150, 152
Harrod-neutral technical progress 103–4Hawkins–Simon conditions 45health: expenditures 11; issues 308;
services 254Hicks-neutral technical progress 103–4higher education 303high-exporting countries 139–40Hodrick–Prescott filter 279horizontal equity, taxation 166, 168household: composition 257–8, 266;
consumption 261–2, 268–9; povertylines 273–4; savings 180–2; size 265–6,272–3
Household Budget Survey (1982) 257household budget surveys 274Household Income and Expenditure
Surveys (HIES) 248, 257, 261, 270–1housing sector 86Human Development Index (HDI)
254–5Human Poverty Index (HPI) 254–5, 274
illiberal finance 183–4illiteracy 254, 258–9, 272, 304–5
356 Subject index
IMF see Internatonal Monetary Fund(IMF)
implicit subsidies 58imports 120–3; demand 22, 138; duties
177; policies 11–12, 45–6, 119; prices 16import-substituting growth 1, 45, 150–1impossible trinity principle 76incentives: civil servants 294–5; distortions
44–5; exports 55, 129–30, 135, 285–6;stock exchange listing 199; tariffs 141
income: characteristics 260–1; asdeterminate of consumption 93;distribution 111
income-based poverty measurements248–53
incremental capital:output ratios (ICOR)41, 48
India, informal economy 111indicative planning 312indirect taxes 163individual-based poverty lines 273–4industrialization policies 12infitah 17–23 24, 25, 26, 49–50, 107, 144,
188, 198, 298inflation 14, 15–17, 161, 162–3; data
112–13; targeting 195–7; tax 65, 69,168–81; and unemployment 97–100
informal assets/credit market 289informal sector:data 110–11; employment
217, 239–41; enterprises 289–90;investment 86
infrastructure: constraints 313; UpperEgypt 306
Institutional: constraints 285–6, 313;structure 287–303
Insurance Federation of Egypt 207insurance sector 203, 206–8interest rates 58–9, 180–1, 184, 187, 205,
206; data on 113; liberalization of 65intermediate inputs, cost of 141internal equilibrium, exchange rates 134International Accounting Standards (IAS)
182international financial institutions (IFIs)
26–7, 37; negotiations with 51–2, 59–63international markets, access to 281International Monetary Fund (IMF) 33,
38, 52; agreement with 263–5; analyticalsupport 26–8; economic reformpackage 29, 68, 153 negotiations with61–3
interventionism 3–6inventory accumulation 91investment: allocations 44–6; Arab
countries 20–1; banks 181–3, 186; andeconomic growth 100–1; expenditures
158, 172; financing 144; and growth90–2; insurance companies 207–8;private sector 82, 84; programs 8; rates282; requirements 40–1; role of NIB206
investment:GDP ratio 279–80, 282–3invisible earnings 118, 126–7involuntary part-time work (IPT) 232
Japan, loans 38job: creation 95–6, 277–8, 280–1; security
233job-specific skills 303joint-venture banks 62, 181, 182, 185, 186judicial system 298–301
Keynesian open-economy model 316Korea, economic growth 52–3
labor: data 113–14; demand 246, 278;inputs 101–3, 105–6; laws 10, 241;market 210–13, 302–3
labor force: growth 218–23; numbers13–14; reductions 301
Labor Force Sample Survey (LFSS) 114,210
labor-intensive production 128, 236, 241,246
Lake Nasser 34land: reclamation 3, 85, 89; registry 288land reform law (1952) 9Law 203 (1991) 80–1, 84Law 43 (1974) 21legal status of businesses 290–1lending, banks 181, 182, 184–5Leontief input-output system 45leverage 208, 209LIBOR (London Inter-Bank Offered
Rate) 65, 180life insurance 207loans: conditions 27–34, 37–40; portfolio,
banks 187–8; volume 194loan-to-deposit ratio 191–2local content requirements, exports 286local government 156; productive
enterprises 79–80long-run price elasticities 136long-term finance, availability of 302Lower Delta, unemployment 227Lower Egypt: poverty 264, 268, 271–2;
unemployment 228, 234
male: employment 218, 221, 223, 235,239, 241, 245, 260; under-employment231–3; unemployment 224, 226, 227,231, 234, 266–7
Subject index 357

manufacturing sector: ‘allocation oftalents’ mechanism 25; capacityunderutilization 17; employment 215,217, 236–7; exports 284; growth 88;inefficiencies 12; nationalization 10;productivity of capital 48; protection45–6, 142–3, 300–1
market prices 86–7market-based economy, creation of 64market-enforced monetary reform 170Marshall–Lerner condition for
devaluations 135–6, 140maturity transformation 185–6medium and larger enterprises (MLEs)
289, 290–1merchandise exports 120, 123–5, 128–9Middle East: political situation 90–1; trade
with 129migration 239; see also rural-to-urban
migrationmilitary aid 118minimum wages 15Möller report (1977) 34, 297monetary: policy 48–9, 69–72, 190–3;
system, changes to 67; targeting 195–6‘moonlighting’, civil servants 295MOP/World Bank 278, 294, 304–6, 307multiplier effects, monetary policy 192–4
National Bank 6National Charter 7–8, 157National Congress of the Popular Powers
(1962) 7national income 108–9National Investment Bank (NIB) 113,
156–7, 185, 203, 204, 205–6National Organization for Insurance and
Pensions (NOIP) 204, 205National Planning Committee 5nationalization 3, 4, 5–13, 198, 206–7new institutional economics 287–8New Zealand, inflation targeting 196Nicomachean Ethics 315Nile Delta/Valley 34, 85Nile water 308–10nominal effective exchange rate (NEER)
130, 131–3nominal interest rates 75, 184, 197non-accelerating inflation rate of
unemployment (NAIRU) 98–9, 100non-agricultural sector, employment
237–8, 281non-bank financial intermediaries 203–4non-concessional loans 40–4non-oil exports 118, 135, 140non-pecuniary benefits 245
non-tariff barriers 143–4North Africa, trade with 129
oil sector: exports 25–6, 54–5, 118, 124;growth 88–9; prices 127, 151–2;revenues 162, 164
‘open door’ policy see Infitahopenness of economies 284–5Organization of Petroleum Exporting
Countries (OPEC) 127outsourcing 307‘own’ exchange market 46
Pakistan, informal economy 111Papyrus Lansing 292Paris Club 57, 61, 67–8, 134, 148, 150,
152–4, 159partial equilibrium, exchange rates 140participation: economic planning 312;
labor market 218–23Permanent Council for the Development
of National Production 3perpetual inventory technique 115–16personal taxation 164–5, 166, 167, 168Petroleum Company 79Phillips Curve 97–100policy: adjustments 59–60; instruments
76; interventions, poverty 265; issues,external aid 34–9; packages 313; publicsector 173–6; see also Infitah
policymaking framework 49–54pollution 307–8Population Census (PC) 114, 210population trends 218–23, 312–13port: charges 287; cities 306poverty: alleviation strategies 304–7;
changes 269–70; determinants andsources 265–8; measurement of 273–6;perceptions of 263–4; profiles 257–73;social safety nets 307; trends 248–56,270–3
price: controls 8–9; distortions 44–5;elasticities 123, 136–8; structure 49
price-led demand 140price-sensitive exports 287primary: balances/deficits 174–5;
education 259–60, 266Principal Bank for Development and
Agricultural Credit (PBDAC) 112, 185private: consumption 92–4, 109;
investment 100–1; investors 198–9;pension funds 203
private–public wage gap 245private sector: data 109; employment
238–42; investment 67, 74–5, 78–9, 282;labor costs 216; liquidity 59;
358 Subject index
predominance of 2–3; segmentation of289
privatisation 62, 76–84, 181–2production costs 286–7productive assets, ownership of 262–3,
267productivity 101–8, 295, 314program assistance 35–6project: assistance 35–6; selection 45Project in Development and the
Environment (PRIDE) 308property rights 287–9prudential regulations, banking systems
188–90public: debt, components of 178;
enterprises 48, 79–80; investment 67,74–5, 92, 101, 157, 282; saving 93–4
Public Enterprise Office 80public sector 155–7; banks 182, 185,
186–8, 190; economic activities 79–80;employment 96, 171, 237–8, 241,243–5, 293–4, 297; privileged positionof 64; role under Infitah 17–18; taxesfrom 164, 167
publicly issues companies 198–203
quality control system 143–4
rational expectations 99–100real effective exchange rate (REER) 74,
130–1, 132–41real interest rates 75, 93, 170, 184, 187real wages 15–16redistribution effects of poverty changes
269–70redundancies, public sector 81regional: data 110; government 156;
growth 306; poverty/equity 255–6,271–2; unemployment 227–8
regulatory: frameworks 291–2; system298–301
relative poverty lines 275remittances 17–18, 46, 118, 126–7, 152,
260–1remuneration, civil servants 294–5rent-seeking 25reserves, banks 189, 194–5Resident Mission Real Activity Index
111–12resources, access to 51revealed comparative advantage (RCA)
index 128revenue issues 66–7, 163–71Revolutionary Command Council 1Ricardian equivalence 93–4, 178–9root mean squared error (RMSE) 99, 310
rural: employment 221–2, 223, 235;poverty 248–53, 254, 257, 258–9, 260–1, 262–4, 266–8, 269, 270–3;underemployment 231–3;unemployment 224, 226, 227, 231,233–4, 246
rural-to-urban migration 214, 235
safety, banking systems 188–90sales tax 67savings 282–3, 313secondary education 267–8sectoral: composition of growth 271;
employment growth 235–42securities market 197–8security issues 139seigniorage 69self-employment 260self-liquidating loans 186Semi-Participatory Poverty Assessment,
UNDP 263sequestration 7, 10service authorities 79–80services sector: data 109; employment 96,
216, 237; exports 118, 139; growth 88–9short-run price elasticities 136Singapore, economy 108single earner families 260skilled labor market 302–3small and medium-sized enterprises
(SMEs) 208–9, 289, 290–1social: compacts 53; goals 40; indicators
24; infrastructure 107; safety nets 307Social Fund for Development (SFD) 64,
81, 113, 156–7social insurance: funds 113, 204–5; system
203social security funds 156–7soil degradation 308Solow residual 104Soviet Union, relations with 20Special Drawing Rights (SDR) 71, 73specialized banks 181–3, 187staffing, banks 186stagflation 97Stanford Research Institute 286Stock Brokers Association 113structural reforms 61–3, 76–84subcontracting 290subjective poverty lines 275subsidies 14–15, 28, 29–30, 32, 34, 58,
67, 157–8, 159, 162, 167, 171–2, 261–2,307
subsistence activities 222Sudd swamp 310Suez Canal: nationalization of 4–5; war 3
Subject index 359

Suez Canal Authority (SCA) 79, 156, 159,163, 164, 166–7; tolls 63,127
supplementary import levy 143supplier credit 151supply elasticities 124, 136
tariff regime 141–4taxation 15, 163–5, 179, 286, 291–2;
banking system 186–7; incentives 199,200–2; sales tax 6; structure 166–8;system 301–2
technical: products 37; progress 102–4,107–8; training 302–3
technology acquisition 20, 44textiles sector 128–9, 291Theil’s ‘U-statistic’ 310tied aid, costs of 36–7Toshka project 34total factor productivity (TFP) 77, 101–8Tourism Development Authority 112tourism sector: decline 75–6; employment
23, 217; growth 88–9; receipts 127, 139,152
trade: elasticities 135–41; growth 88–9;liberalization 22–3; system 46–7
TradeCAN (Trade CompetitivenessAnalysis of Nations) 129
trade-related lines of credit 144–5trade-weighted tariffs 141–2trading partners 129transaction costs 286–7transitory poverty 268–9transport costs 306transport-related services 139Treasury Bills 192, 202
UK: aid 4; employment 277; pensionsfunds 203
ultra poverty lines 274underemployment 213, 217, 231–3; and
demographic pressure 233–4UNDP 247, 250, 251, 253, 261, 263
unemployment 94–5, 213, 214–15,216–17; characteristics 96–7, 245–6;discouraged 231–3; graduates 244; andinflation 97–100; structure 227–34;trends 223–6
Upper Egypt: development 304, 305,306–7; poverty 255–6, 258, 259, 264,265, 268, 269, 270, 271–2;unemployment 227–8, 234
upper poverty lines 274urban: employment 221–2, 223, 235;
poverty 248–53, 257, 258–9, 260–1,263–4, 266–8, 269, 270–1, 272–3;underemployment 231–3;unemployment 224, 225–6, 227, 231,233–4
US: aid 4, 35, 36–7, 118, 153; employment277; pressure on IFIs 51–2; trade 119
USAID 26, 39, 42–3
value-added 44–5vertical equity, taxation 166, 168vested interests, policy makers 53–4visible trade 120–3vocational training 302–3
wage 15–16; rigidities 215; settingmechanisms 244–5
water demand 182, 308–10welfare: indicators 273; measure 315welfare-oriented policies 9–10well-being, material criterion of 263West, trade with 20Western powers, relationships with 51–2Western sources of finance 3–4, 11, 13wholesale price index 59World Bank 3–4, 15, 17, 29–31, 33–4, 38,
42, 44, 45, 48, 51, 58, 92, 125, 143–4,177, 179, 184–9, 204–5, 208, 218, 247,278, 290, 299; agreement with 263–5;analytical support 26–7; negotiationswith 61–3
360 Subject index