kidsafe wa childhood injury bulletin report 2015-2016.pdf · childhood injury bulletin . annual...
TRANSCRIPT

Kidsafe WA Childhood Injury Bulletin ANNUAL REPORT, 2015 - 2016

INJURIES AT A GLANCE 1
INTRODUCTION 2
DEMOGRAPHIC DATA 3 Emergency Department Presentations 3
Age and Gender 3
Area of Residence 4
Ethnicity 4
INJURY DATA 5 Cause 5
Intent 5
Location 5
Sporting Activity 6
Safety Equipment 6
Injury Factor 6
ASSESSMENT AND TREATMENT DATA 7 Time 7
Day of Attendance 7
Triage Category 8
Referral Source 8
Outcome of Attendance 8
DISCUSSION 9 Recommendations 9
ACKNOWLEDGEMENTS 10
CONTENTS

1 | P a g e
19% Of injuries occurred at home.
18,423 Children were seen in the Princess Margaret Hospital Emergency Department (PMH ED) due to injury during the 2015/16 financial year.
50 Children per day were seen in the PMH ED for an injury.
94% Of injury presentations reside in the Metropolitan area.
38% Of injuries were due to a fall.
26% Of injuries were due to a blunt force.
4,455 Injuries were sport-related.
37% Of injuries occurred in children under 5 years.
INJURIES AT A GLANCE
57% Of injured were male.

2 | P a g e
Kidsafe WA Kidsafe WA is the leading independent not-for-profit organisation dedicated to promoting safety and preventing childhood injuries and accidents in Western Australia. Injuries are the leading cause of death in Australian children aged one to fourteen, accounting for nearly half of all deaths in this age group. More children die of injury than die of cancer, asthma and infectious diseases combined. Many of these deaths and injuries can be prevented. Kidsafe WA works in the community to educate and inform parents and children on staying safe at home, at play and on the road. Princess Margaret Hospital Injury Surveillance System Princess Margaret Hospital for Children is the only paediatric hospital in Western Australia and is the referral centre for paediatric illness and injury for the state. On average, 70,000 children per year present to PMH ED. The PMH Injury Surveillance System collects data related to all children presenting to the PMH ED with an injury. A modified version of the International Classification of External Causes of Injury (ICECI), version 1.1a is currently used to code injury presentations. The ICECI is a member of the World Health Organisation’s (WHO) Family of International Classifications. This report provides a summary of all the injury surveillance data collected at PMH ED between June 2015 and July 2016. Data Collection A triage nurse initially assesses children presenting to the PMH ED. All clinical information and basic demographic details are recorded, together with an indication of the clinical urgency of the presentation (Australian Triage Scale). Children who present due to injury have additional injury surveillance data collected, based on the following fields: time of injury, cause, intent, location, activity, safety equipment use, and other injury factors. PMH is committed to the provision of quality data for health professionals and key stakeholders. Daily validation of injury data fields is undertaken by the PMH Injury Surveillance Officer to maintain accuracy and consistency in all recorded fields. This involves checking for missing data fields and identifying misclassified data. Limitations The data contained in this report represents the paediatric population of PMH ED, therefore comparisons made on a state or other basis must be done carefully due to the likelihood of sampling and re-call bias. More acute injuries are seen at PMH ED compared to other health service providers and data accuracy is dependent on re-call by parents, children and those entering the data, as well as overall effectiveness of data cleaning.
INTRODUCTION

3 | P a g e
1,36
7
1,59
8
1,47
9
1,59
5
1,65
4
1,38
3
1,44
3
1,43
1
1,58
3
1,51
8
1,75
6
1,61
6
0
1,000
2,000
3,000
4,000
5,000
6,000
7,000
Num
ber o
f Pre
sent
atio
ns
Month
Figure 1: Total Presentations and Injury Presentations by Month
Injury Presentations Total Presentations
Emergency Department Presentations The 2015/16 financial year saw a total of 62,935 children presenting to PMH ED. Presentations due to injury accounted for 29.3 percent (n=18,423) of all ED presentations. Throughout the year injury presentations are fairly evenly distributed and do not seem to follow a monthly pattern (Figure 1).
Age and Gender Males are over-represented, accounting for 57.3 percent (n=10,552) of all PMH ED injury presentations, with females accounting for the remaining 42.7 percent (n=7,870). More males than females were injured across all age categories (Figure 2). Children under five years of age are at higher risk of injury, accounting for 36.6 percent (n=6,741) of presentations. This is followed by children aged 10 to 14 and 5 to 9 years, accounting for 30.5 percent (n=5,622) and 28.1 percent (n=5,177) of injury presentations respectively. Children aged 15 years and over accounted for only 4.8 percent (n=875) of injury presentations. The low number is likely due to attendance to adult hospitals and overall reluctance to seek medical help in older children.
DEMOGRAPHIC DATA
2,90
3
2,33
7
2,27
8
346
3,83
8
2,84
0
3,34
4
529
0
500
1,000
1,500
2,000
2,500
3,000
3,500
4,000
4,500
0 to 4 years 5 to 9 years 10 to 14 years 15+ years
Num
ber o
f Pre
sent
atio
ns
Age
Figure 2: Injury by Age Group and Gender
Female Male

4 | P a g e
Area of Residence Figure 3 depicts injury presentations by area of residence across Western Australia. Children residing within the Perth Metropolitan Area constituted the majority of injury presentations to the PMH ED, accounting for 93.9 percent (n=17,309). Children from rural and regional Western Australia accounted for 4.7 percent (n=864) of total injury presentations. The remaining 250 injury presentations either resided interstate, overseas or their residence was unkown.
Ethnicity Children of Aboriginal and/or Torres Strait Islander descent represented 3.8 percent (n=701) of injury presentations to the PMH ED during the 2015/16 financial year (Figure 4).
ATSI3.8%
Other Ethnicity95.6%
Unknown0.6%
Figure 4: Injury by Ethnicity
Figure 3: Injury by Area of Residence
67
94
114
60 333
Perth Metro North = 8,285 East = 4,050
South = 4,974 TOTAL = 17,309
Great Southern 60
South West 136

5 | P a g e
Cause The leading cause of injury was falls, accounting for 38.2 percent (n=7,036) of injury presentations (Figure 5). This was followed by blunt force and other cause accounting for 26.0 percent (n=4,782) and 17.7 percent (n=3,269) respectively. Other cause refers to unspecified/unwitnessed injuries or those that do not fit into an existing category. Intent The majority of injury presentations to the PMH ED were due to unintentional circumstances (97.5%, n=17,966). The remaining injuries were due to either self-harm (1.6%, n=297), alleged assault (0.6%, n=105) or were not determined (0.3%, n=55). Location The most common location for injury to occur was other place (57.4%, n=10,580), referring to an unspecified location or one that did not fit an existing category. Aside from other place, the most common location for injury to occur was the home/farm and school/residential institution, accounting for 19.1 percent (n=3,517) and 12.1 percent (n=2,229) respectively (Figure 6a). Within the home, injuries occurred most commonly in the outdoors (18.0%, n=634), followed by living or dining area (12.0%, n=421) and bedroom (9.5%, n=334). A large proportion of injury presentations within the home were unspecified (51.1%, n=1,796) (Figure 6b).
INJURY DATA
Commercial, Industrial,
Medical Area1.2%
Open Nature Area1.4%
Road, Footpath, Cycleway,
Parking2.1%
Sports Area2.6%
Rec/Cultural Area4.1%
School/ Residential Institution
12.1%
Home/Farm19.1%
Other Place57.4%
Figure 6a: Injury by Location
Laundry0.4%
Farm0.5%
Other0.5%
Bathroom3.2%
Kitchen4.9%
Bedroom9.5%
Living/Dining12.0%
Outdoors18.0%
Unspecified51.1%
Figure 6b: Injury within the Home
Animal Bite1.1%
Bicycle Related Injury
2.7%
Blunt Force26.0%
Burns and Scalds2.6%
Cutting/ Piercing
3.7%Drowning
0.2%
Falls38.2%
Insect Sting1.2%
Pedestrian3.5%
Poisoning1.9%
Other Transport
1.3%Other Cause
17.7%
Figure 5: Injury by Cause

6 | P a g e
Sporting Activity Almost a quarter of injury presentations to the PMH ED were sport-related (24.2%, n=4,455). Trampoline was the most common sports injury, accounting for 12.7 percent (n=568) of sports injuries, followed by Australian Rules football (12.2%, n=545), and cycling (11.2%, n= 500) (Figure 7). Safety Equipment Safety equipment like helmets, seatbelts, approved child restraint, life jackets, and sport related guards reduce injury risk and severity. A small portion of children presenting with an injury to PMH ED were recorded as using safety equipment (1.0%, n=192), a further 0.6 percent (n=97) of presentations were recorded as not using safety equipment. The remaining 98.4 percent (n=18,134) accounted for injuries where safety equipment was not applicable or unknown. Injury Factor A large portion of injuries had an associated injury factor (45.1%, n=8,311), with building components like doors, windows, floors, fittings, walls and other structures accounting for 10.2 percent (n=1,882) of the injuries. This was followed by furniture (7.1%, n=1,305) and wheeled equipment (6.5%, n=1,205) (Figure 8).
Baby Equipment1.0%
Bedding2.6% Chairs, Sofa,
Table, Cupboard7.1%
Doors, Windows, Wall
10.2%
Other0.7%
Playground Equipment
4.9%
Poisoning Factor2.2%
Sports/Rec Equipment
4.9%Toy/Play
Equipment1.8%
Trampoline3.0%
Wheeled Equipment
6.5%
Not Applicable54.9%
Figure 8: Injury Factor
568545
500453
277273
263201
193189
0 100 200 300 400 500 600
TrampolineAustralian Rules Football
CyclingSoccer
BasketballScootering
NetballRugby
Other Athletic ActivitySkate Boarding
Number of Presentations
Spor
t
Figure 7: Top 10 Sport-Related Injuries

7 | P a g e
0 500 1,000 1,500 2,000 2,500 3,000 3,500
Monday
Tuesday
Wednesday
Thursday
Friday
Saturday
Sunday
Number of Presentations
Day
of t
he W
eek
Figure 10: Day of Injury and Presentation
Day of Presentation Day of Injury
Time Almost half of injury presentations were recorded as having an unknown time of injury (45.3%, n=8,341) (Figure 9). Where the injury time was known, 27.8 percent (n=5,116) presented between 12:00 to 17:59. The peak presentation time for injury was between 12:00 and 17:59 (41.3%, n= 7,616), followed by 18:00 and 23:59 (33.9%, n=6,245) (Figure 9). Day of Attendance During the 2015/2016 financial year, Saturday and Sunday had the highest injury presentation numbers. Similarly, Saturday and Sunday were over-represented for injury occurrence, accounting for 16.1 percent (n=2,957) and 16.6 percent (n=3,063) respectively (Figure 10), while Tuesday had the lowest proportion of injuries sitting at 12.5 percent (n=2,308).
ASSESSMENT & TREATMENT DATA
8,34
1
91 2,46
7 5,11
6
2,40
8
436 4,
126 7,
616
6,24
5
01,0002,0003,0004,0005,0006,0007,0008,0009,000
Unknown 0:02 to 5:59 6:00 to 11:59 12:00 to 17:59 18:00 to 23:59
Num
ber o
f Pre
sent
atio
ns
Time
Figure 9: Time of Injury and Presentation
Time of Injury Time of Presentation
8 | P a g e
Triage Category The triage category reflects the medical urgency of any given presentation (Table 1). The majority of injuries were either semi-urgent (77.7%, n=14,321) or urgent (18.2%, n=3,355), and only 4.0 percent (n=746) were triaged as an emergency, resus or non-urgent.
Table 1: Triage Category
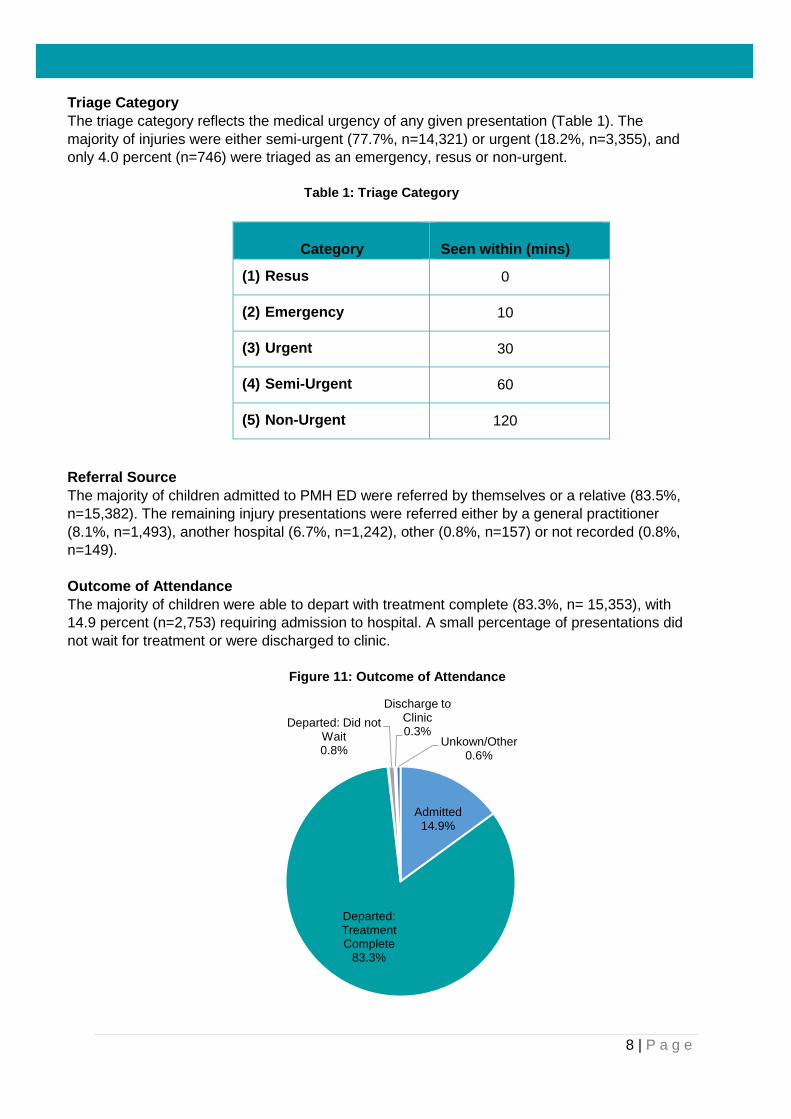
Referral Source The majority of children admitted to PMH ED were referred by themselves or a relative (83.5%, n=15,382). The remaining injury presentations were referred either by a general practitioner (8.1%, n=1,493), another hospital (6.7%, n=1,242), other (0.8%, n=157) or not recorded (0.8%, n=149). Outcome of Attendance The majority of children were able to depart with treatment complete (83.3%, n= 15,353), with 14.9 percent (n=2,753) requiring admission to hospital. A small percentage of presentations did not wait for treatment or were discharged to clinic.
Category
Seen within (mins)
(1) Resus 0
(2) Emergency 10
(3) Urgent 30
(4) Semi-Urgent 60
(5) Non-Urgent 120
Admitted14.9%
Departed: Treatment Complete
83.3%
Departed: Did not Wait0.8%
Discharge to Clinic0.3%
Unkown/Other0.6%
Figure 11: Outcome of Attendance

9 | P a g e
Overall there has been a decrease in the total number of presentations to PMH ED from 68,279 in 2014/15 financial year to 62,935 in the 2015/16 financial year. The reduction in ED presentations is paralleled by a similar reduction in injury presentations from 19,854 to 18,423 over the same time period. The proportion of injuries has remained stable, increasing slightly from 29.1 percent last financial year to 29.3 percent in this financial year. Children under five years of age remain the highest risk group, accounting for more than a third of injuries presenting to PMH ED. Males are at greater risk of injury compared to females across all age brackets, with teen and pre-teen aged children demonstrating the greatest gender difference (>60% male). Falls remain the leading cause of injury (38%), followed by blunt force injuries (26%), referring to collisions with an object or person. Almost a quarter of injury presentations are sports-related, with trampoline injuries (12.8%) overtaking Australian Rules football (11.2%) to be the most common sport-related injury. This may be due to an increase in trampoline popularity among children in conjunction with a lack of awareness for safety measures. Conversely, the reversal may be due to increased awareness and enforcement of injury prevention practices within Australian Rules football. A large portion of the injury data is missing time, location, and safety equipment use. This highlights the importance of ongoing triage nurse education. Kidsafe WA and PMH continue to advocate and support staff in the collecting of data through education seminars. The collection of injury data plays a vital role in the development of interventions designed to prevent or minimise childhood injury. It relies on an efficient and reliable computer system and effective collaboration between nursing, clerical and medical staff within the PMH Emergency Department. Analysis of this collected data can determine current injury trends and the effects of injury prevention programs. Recommendations • Ongoing injury prevention initiatives for all children, with specific focus on parents and carers
of children under five years of age.
• Explore injuries in the pre-teen and teenage groups in order to identify new avenues for injury prevention in this demographic.
• Continue to promote injury prevention initiatives that identify ways to reduce the risk of injury while using trampolines. Kidsafe WA have a number of resources that outline methods for trampoline safety which need to be further promoted to the Western Australian community.
• Further research into childhood sporting injuries, and factors mediating injury severity within
different sports.
• More staff development sessions between Kidsafe WA and PMH triage nurses to raise awareness of the importance of child injury prevention and facilitate better data collection practices.
• Ongoing production and dissemination of Kidsafe WA Childhood Injury Bulletins to support policy and interventions for child injury prevention.
DISCUSSION

10 | P a g e
Injury Surveillance Data is collected by the Emergency Department at Princess Margaret Hospital for children and provided to Kidsafe WA on a quarterly basis for the preparation of the Kidsafe WA Childhood Injury Bulletins. The following Kidsafe WA Childhood Injury Bulletins were prepared by Kidsafe WA in conjunction with Princess Margaret Hospital for 2016. Copies are available on the Kidsafe WA website: www.kidsafewa.com.au
• Button Batteries • Farm Injuries
OUR THANKS GO TO: The staff of Princess Margaret Hospital Emergency Department for their commitment to the collection of injury surveillance data. Dr Meredith Borland, Director of PMH Emergency Department and Dmitry Skarin, PMH Injury Surveillance Officer for their continuing support of this data collection.
The Department of Health, Western Australia for its ongoing financial support.
© Kidsafe WA
Suggested Citation:
Abdulelhadi M, McKenna J, Skarin D. Kidsafe WA Childhood Injury Bulletin: Annual Report 2015-2016. Perth (WA): Kidsafe WA (AUS); 2016 Dec.
ACKNOWLEDGEMENTS
