kimco’s 2020 vision - jefferies.com1).pdf · perception vs. reality: case for kimco 6 mall...
TRANSCRIPT
Jefferies 2017 Global Consumer Conference
KIMCO’S 2020 VISION
The statements in this presentation, including targets and assumptions, state
the Company’s and management’s hopes, intentions, beliefs, expectations or
projections of the future and are forward-looking statements. It is important to
note that the Company’s actual results could differ materially from those
projected in such forward-looking statements. Factors that could cause actual
results to differ materially from current expectations include the key
assumptions contained within this presentation, general economic conditions,
local real estate conditions, increases in interest rates, foreign currency
exchange rates, increases in operating costs and real estate taxes. Additional
information concerning factors that could cause actual results to differ
materially from those forward-looking statements is contained from time to
time in the Company’s SEC filings, including but not limited to the Company’s
Annual Report on Form 10-K. Copies of each filing may be obtained from
http://investors.kimcorealty.com/ or the SEC.
SAFE HARBOR
Suburban Square, Philadelphia, PA Cover: Corsica Square, Miami, FL
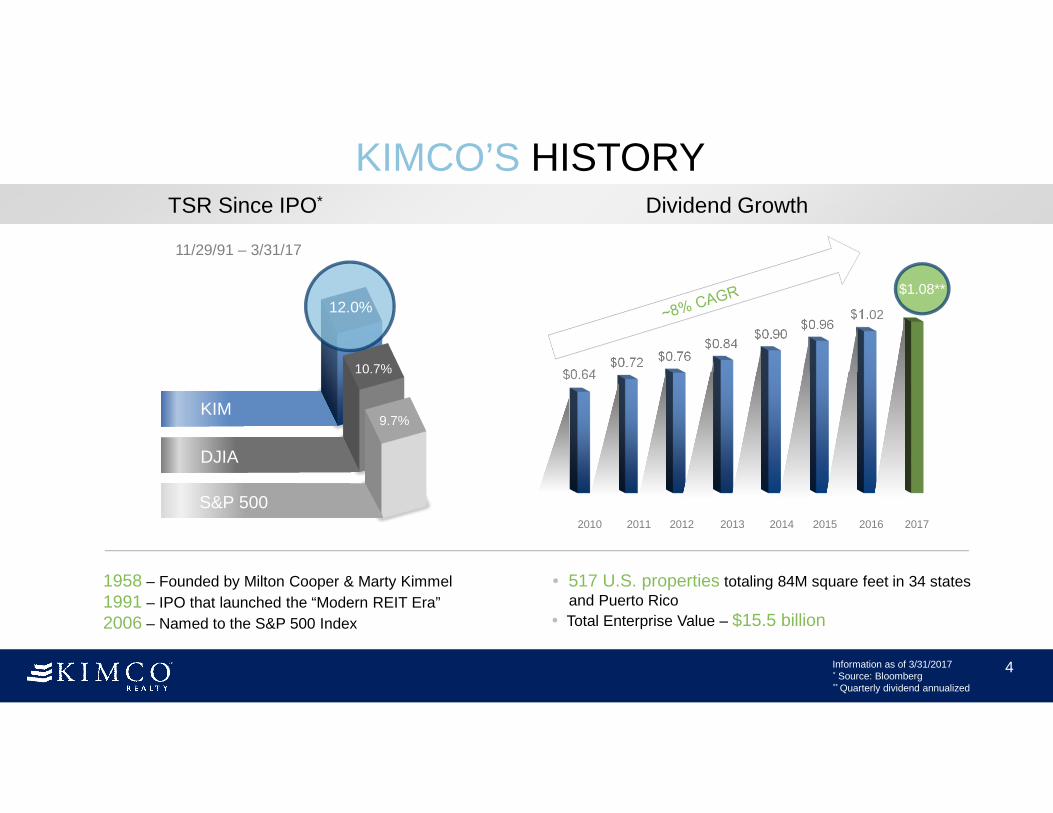
10.7%
9.7%
$0.64$0.72 $0.76
$0.84$0.90
$0.96$1.02
1958 – Founded by Milton Cooper & Marty Kimmel
1991 – IPO that launched the “Modern REIT Era”
2006 – Named to the S&P 500 Index
• 517 U.S. properties totaling 84M square feet in 34 states and Puerto Rico
• Total Enterprise Value – $15.5 billion
KIMCO’S HISTORYTSR Since IPO* Dividend Growth
KIM
DJIA
S&P 500
12.0%
11/29/91 – 3/31/17
2010 2011 2012 2013 2014 2015 2016
Information as of 3/31/2017* Source: Bloomberg** Quarterly dividend annualized
4
2017
$1.08*$1.08**
4
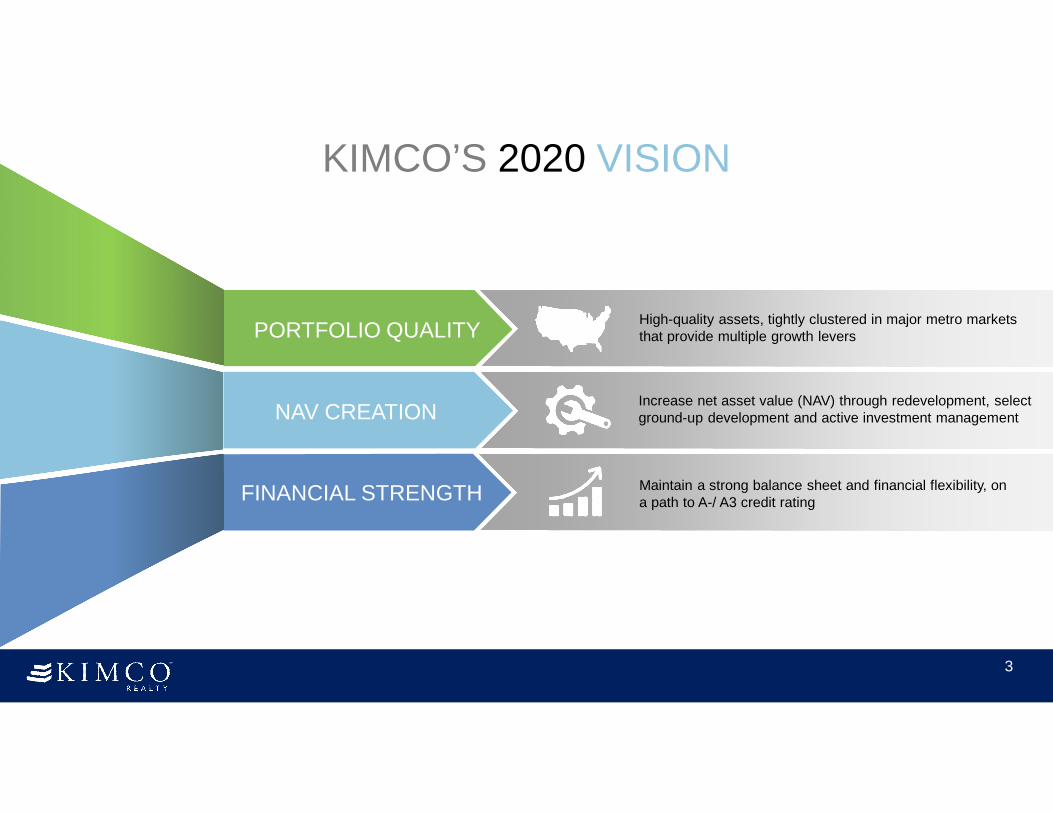
KIMCO’S 2020 VISION
High-quality assets, tightly clustered in major metro markets that provide multiple growth levers
Increase net asset value (NAV) through redevelopment, select ground-up development and active investment management
Maintain a strong balance sheet and financial flexibility, on a path to A-/ A3 credit rating
PORTFOLIO QUALITY
NAV CREATION
FINANCIAL STRENGTH
3
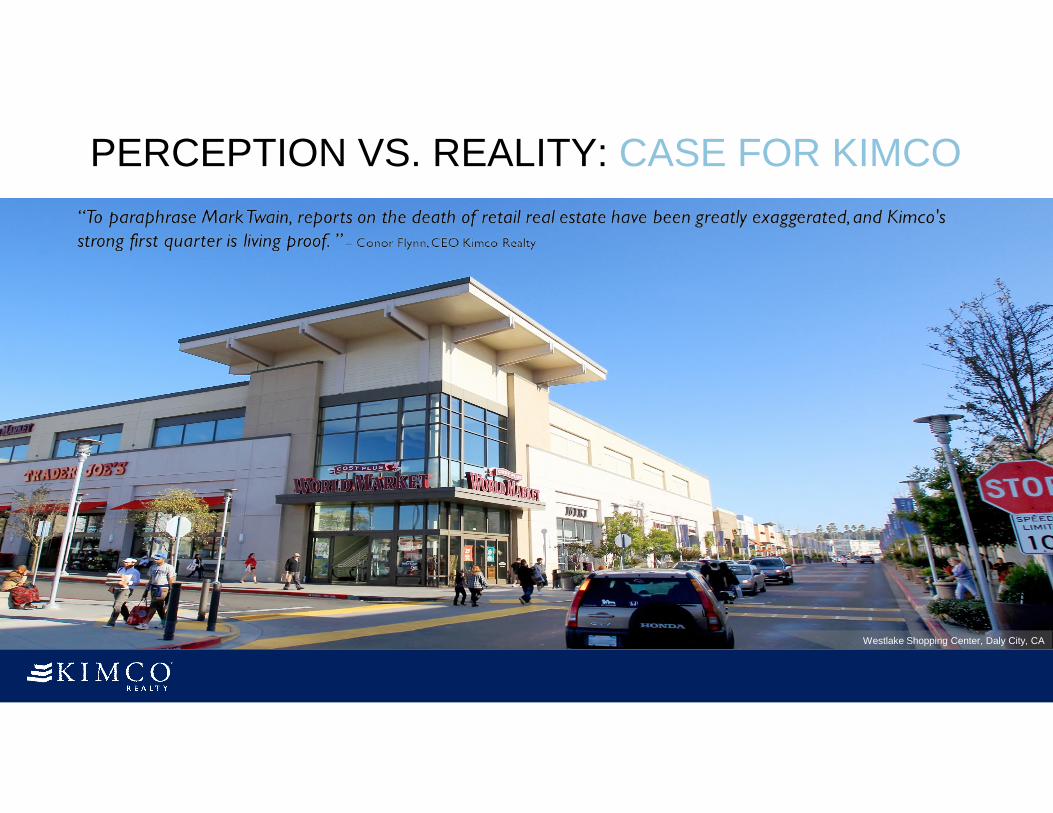
Westlake Shopping Center, Daly City, CA
PERCEPTION VS. REALITY: CASE FOR KIMCO
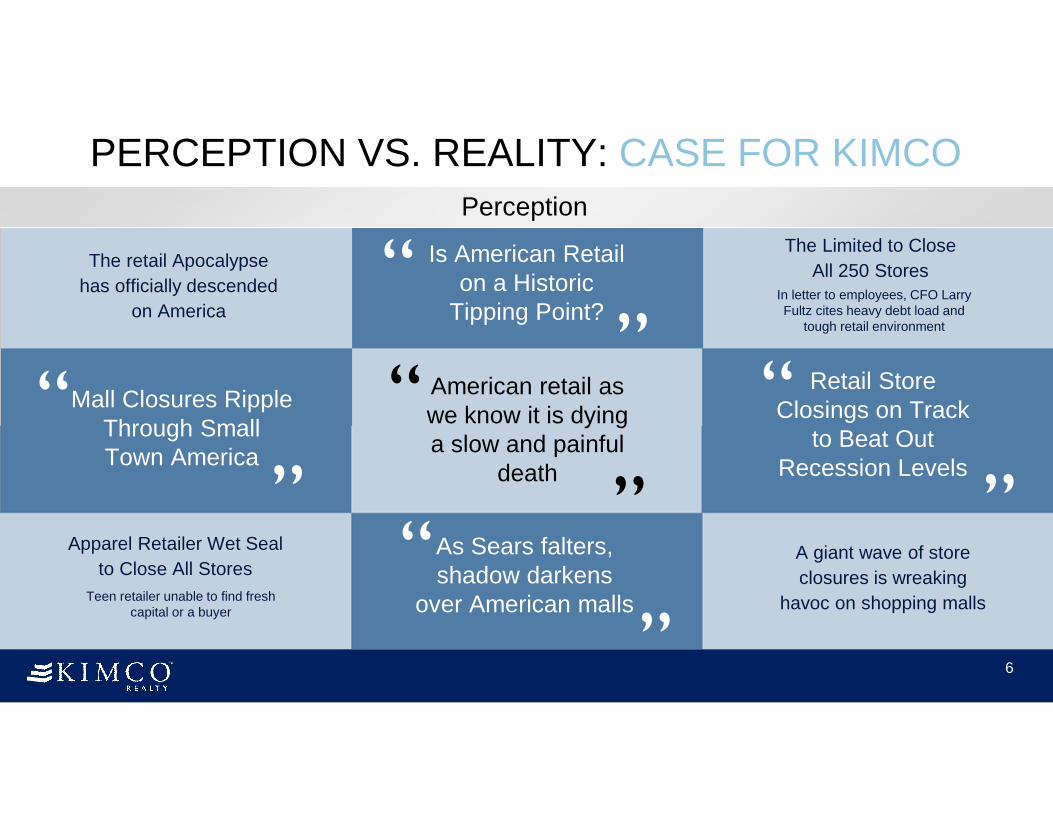
PERCEPTION VS. REALITY: CASE FOR KIMCO
6
Mall Closures Ripple Through Small Town America
“”
Retail Store Closings on Track
to Beat Out Recession Levels
“
”As Sears falters, shadow darkens
over American malls
”“
Is American Retail on a Historic
Tipping Point?“
”
Perception
The Limited to Close
All 250 StoresIn letter to employees, CFO Larry Fultz cites heavy debt load and
tough retail environment
A giant wave of store
closures is wreaking
havoc on shopping malls
Apparel Retailer Wet Seal
to Close All Stores
Teen retailer unable to find fresh capital or a buyer
The retail Apocalypse
has officially descended
on America
American retail as we know it is dying a slow and painful
death
“
”
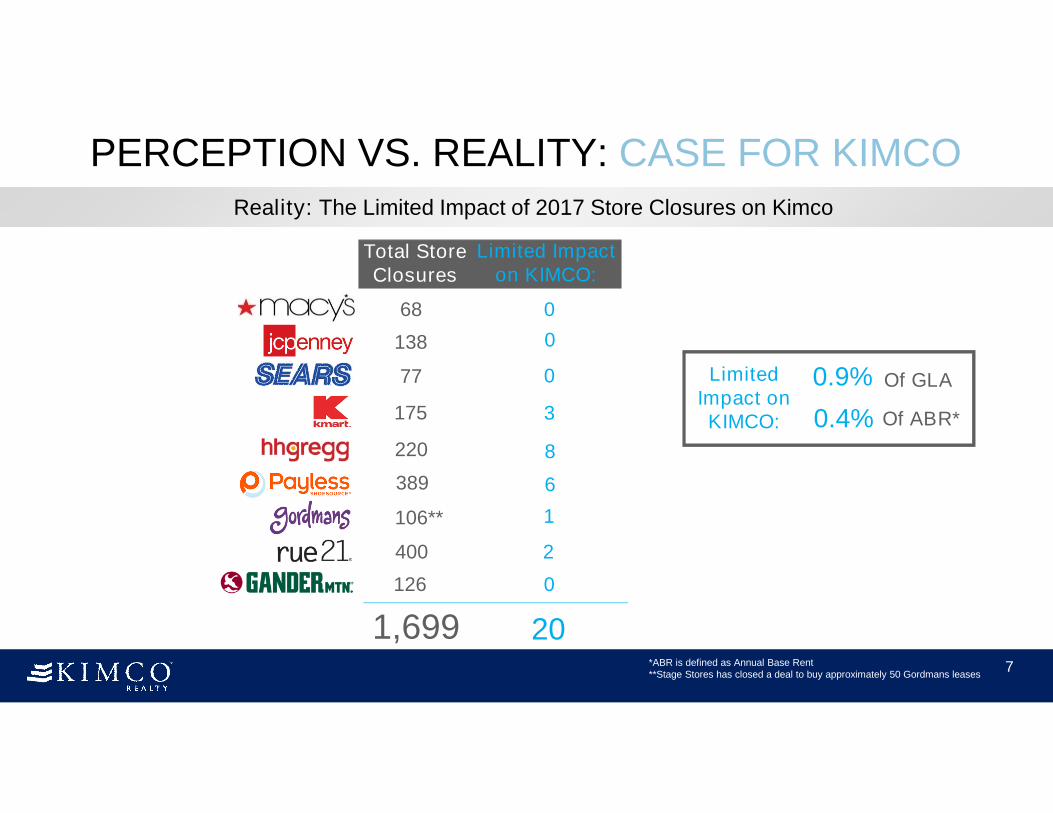
Reality: The Limited Impact of 2017 Store Closures on Kimco
7”1,699
Limited Impact on KIMCO:
20
0.9% Of GLA
0.4% Of ABR*
68 0
138
77
3
8
6
175
220
389
PERCEPTION VS. REALITY: CASE FOR KIMCO
Total Store Closures
0
0 Limited Impact on KIMCO:
*ABR is defined as Annual Base Rent**Stage Stores has closed a deal to buy approximately 50 Gordmans leases
1
2
0126
400
106**
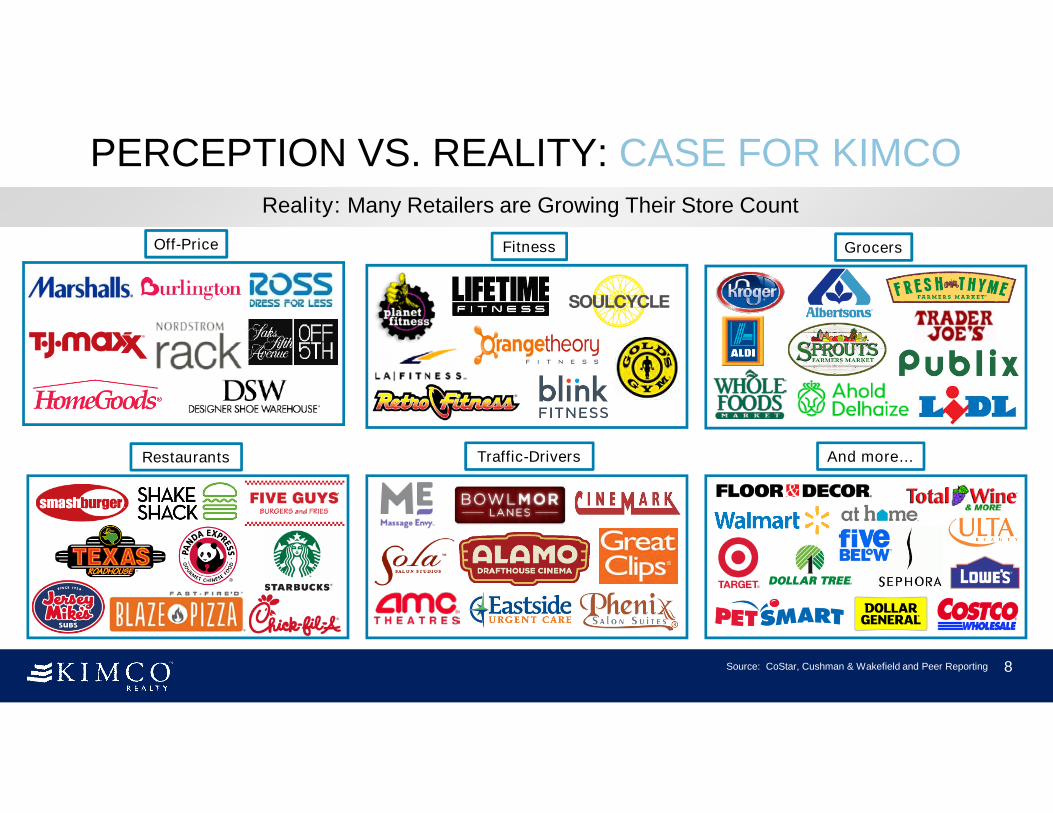
And more…
Reality: Many Retailers are Growing Their Store Count
8
PERCEPTION VS. REALITY: CASE FOR KIMCO
Source: CoStar, Cushman & Wakefield and Peer Reporting
Fitness
Traffic-Drivers
Grocers
Restaurants
Off-Price
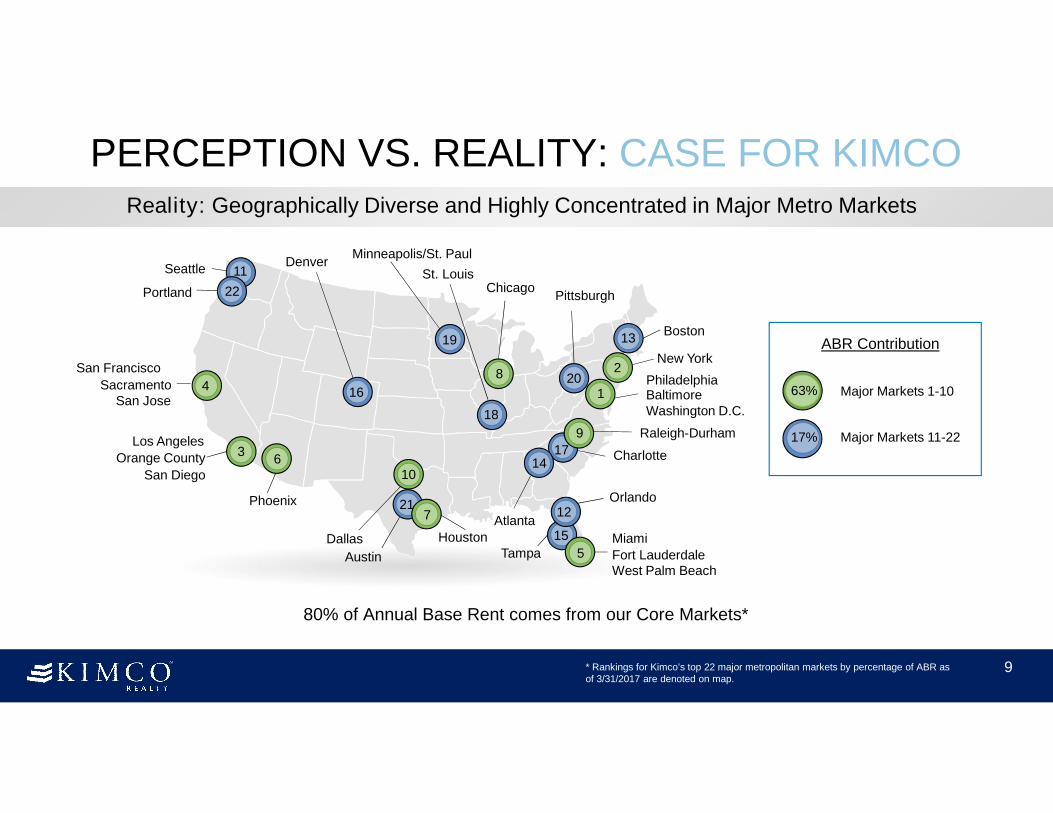
Reality: Geographically Diverse and Highly Concentrated in Major Metro Markets
9* Rankings for Kimco’s top 22 major metropolitan markets by percentage of ABR as of 3/31/2017 are denoted on map.
Seattle
Portland
San Francisco
SacramentoSan Jose
Los Angeles
Orange County
San Diego
Phoenix
DenverMinneapolis/St. Paul
St. LouisChicago
Dallas
Austin
Pittsburgh
HoustonTampa
Atlanta
Miami
Fort LauderdaleWest Palm Beach
Orlando
Charlotte
Boston
New York
PhiladelphiaBaltimoreWashington D.C.
Raleigh-Durham
1
3
5
13
15
202
4
11
12
22
14
16
17
19
21
6
8
7
10
9
80% of Annual Base Rent comes from our Core Markets*
PERCEPTION VS. REALITY: CASE FOR KIMCO
18
Major Markets 11-2217%
63% Major Markets 1-10
ABR Contribution
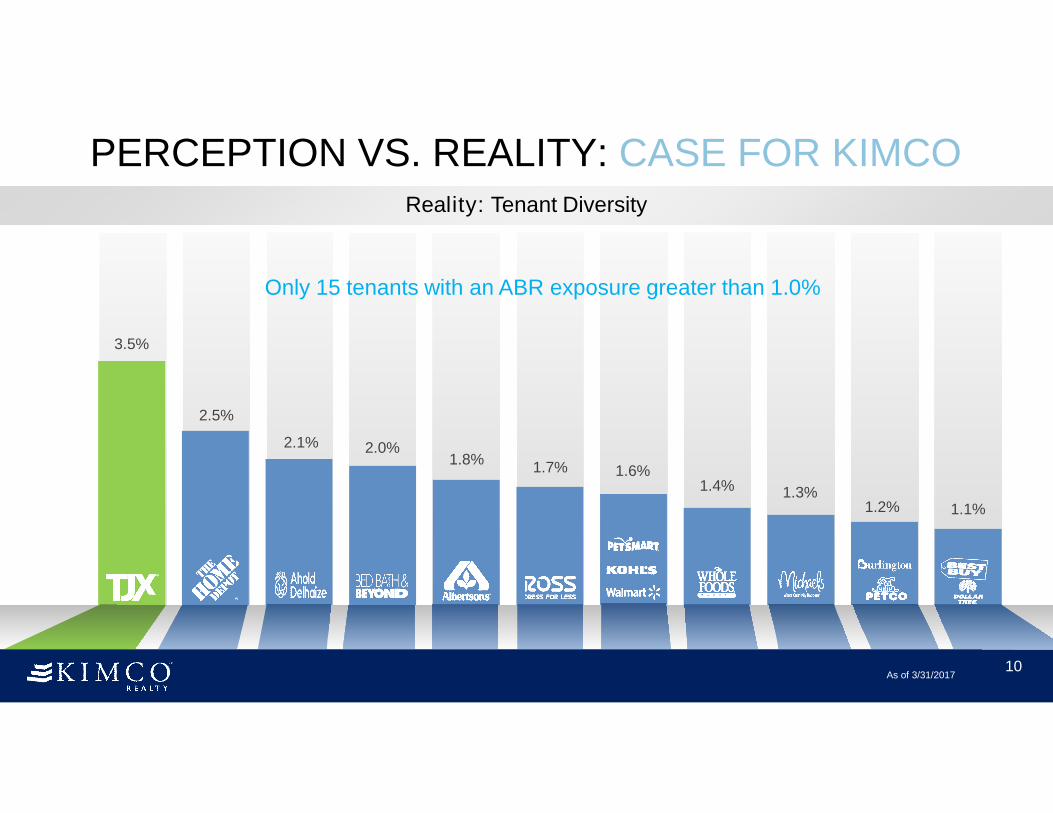
3.5%
2.5%
2.1% 2.0%1.8%
1.7% 1.6%1.4% 1.3%
1.2% 1.1%
As of 3/31/2017
Reality: Tenant Diversity
Only 15 tenants with an ABR exposure greater than 1.0%
10
PERCEPTION VS. REALITY: CASE FOR KIMCO
As of 3/31/2017*excluding options
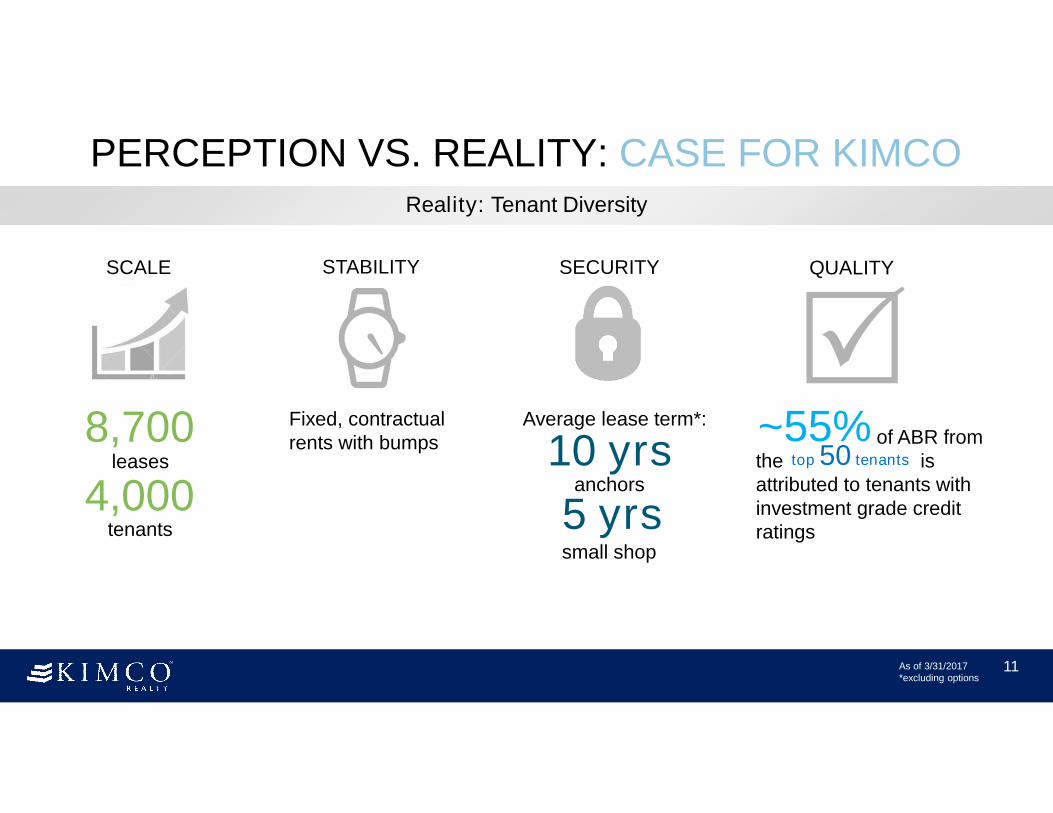
Reality: Tenant Diversity
11
PERCEPTION VS. REALITY: CASE FOR KIMCO
8,700
4,000leases
tenants
SCALE
Average lease term*:
10 yrsanchors
5 yrssmall shop
of ABR from the is attributed to tenants with investment grade credit ratings
QUALITY
top 50 tenants
~55%
STABILITY
Fixed, contractual rents with bumps
SECURITY
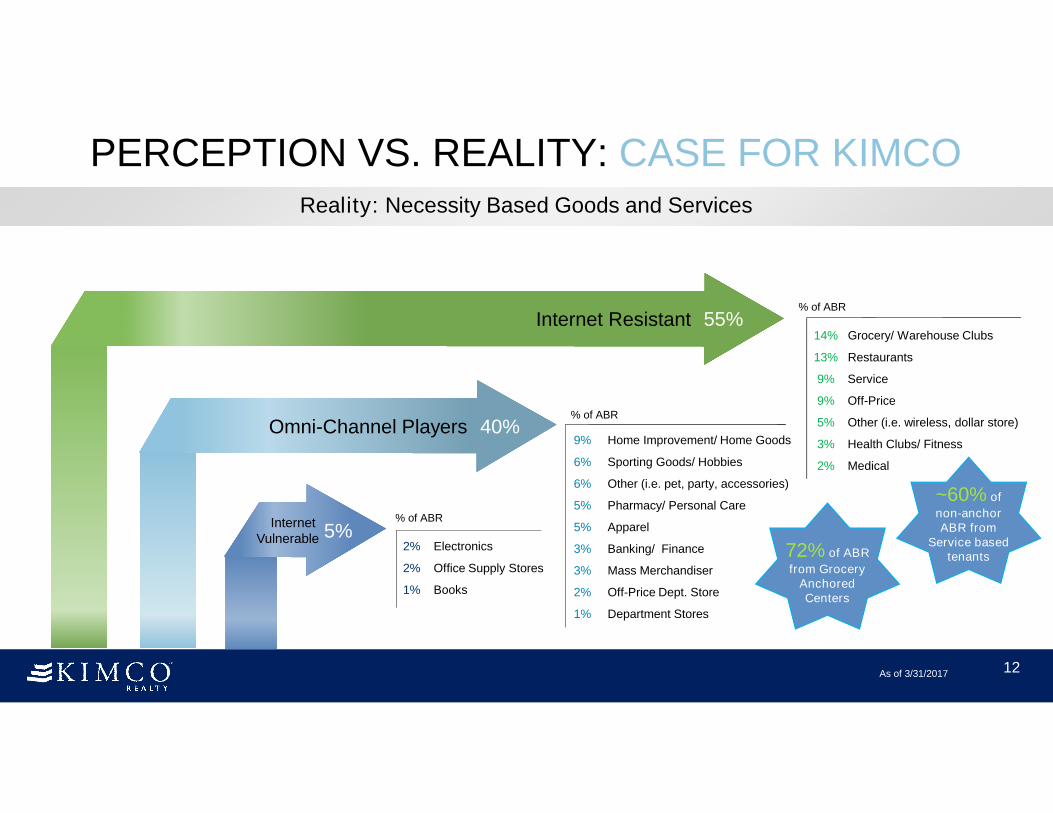
Reality: Necessity Based Goods and Services
12
14% Grocery/ Warehouse Clubs
13% Restaurants
9% Service
9% Off-Price
5% Other (i.e. wireless, dollar store)
3% Health Clubs/ Fitness
2% Medical
Internet Resistant 55%% of ABR
Omni-Channel Players 40%
Internet Vulnerable 5%
9% Home Improvement/ Home Goods
6% Sporting Goods/ Hobbies
6% Other (i.e. pet, party, accessories)
5% Pharmacy/ Personal Care
5% Apparel
3% Banking/ Finance
3% Mass Merchandiser
2% Off-Price Dept. Store
1% Department Stores
2% Electronics
2% Office Supply Stores
1% Books
% of ABR
% of ABR
72% of ABR
from Grocery Anchored Centers
As of 3/31/2017
PERCEPTION VS. REALITY: CASE FOR KIMCO
~60% of
non-anchor ABR from
Service based tenants
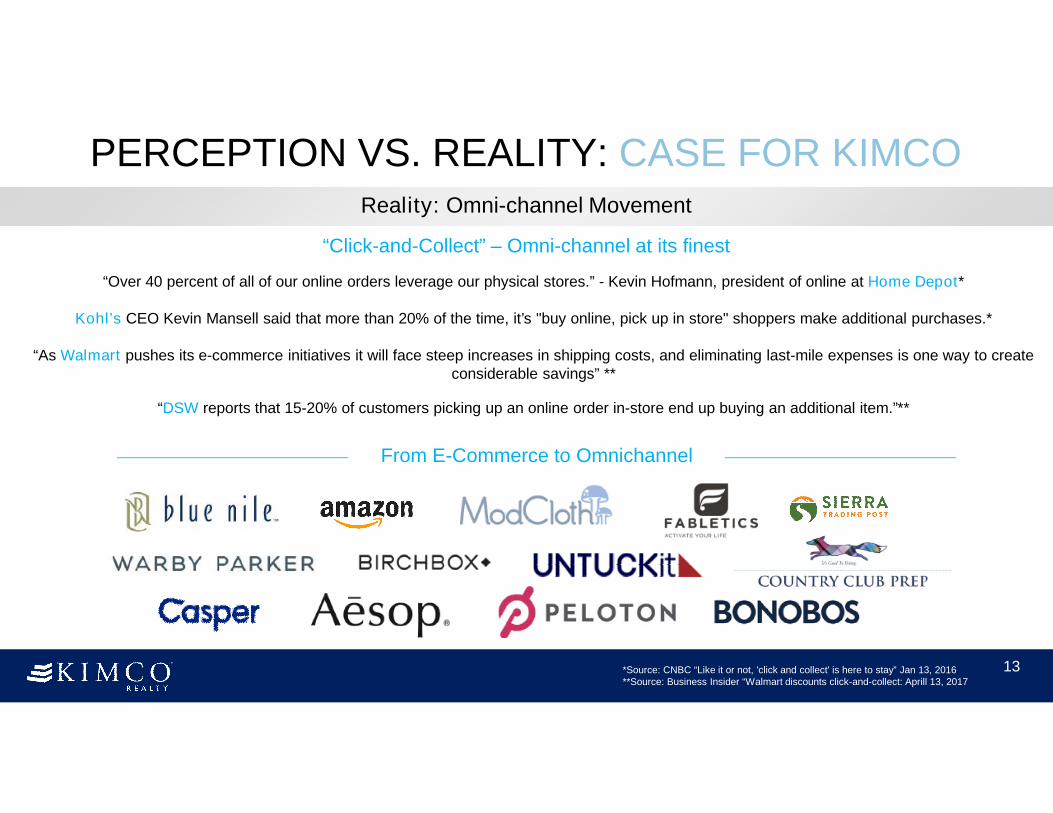
Reality: Omni-channel Movement
13
“Click-and-Collect” – Omni-channel at its finest
From E-Commerce to Omnichannel
“Over 40 percent of all of our online orders leverage our physical stores.” - Kevin Hofmann, president of online at Home Depot*
Kohl’s CEO Kevin Mansell said that more than 20% of the time, it’s "buy online, pick up in store" shoppers make additional purchases.*
“As Walmart pushes its e-commerce initiatives it will face steep increases in shipping costs, and eliminating last-mile expenses is one way to create considerable savings” **
“DSW reports that 15-20% of customers picking up an online order in-store end up buying an additional item.”**
*Source: CNBC “Like it or not, 'click and collect' is here to stay” Jan 13, 2016**Source: Business Insider “Walmart discounts click-and-collect: Aprill 13, 2017
PERCEPTION VS. REALITY: CASE FOR KIMCO
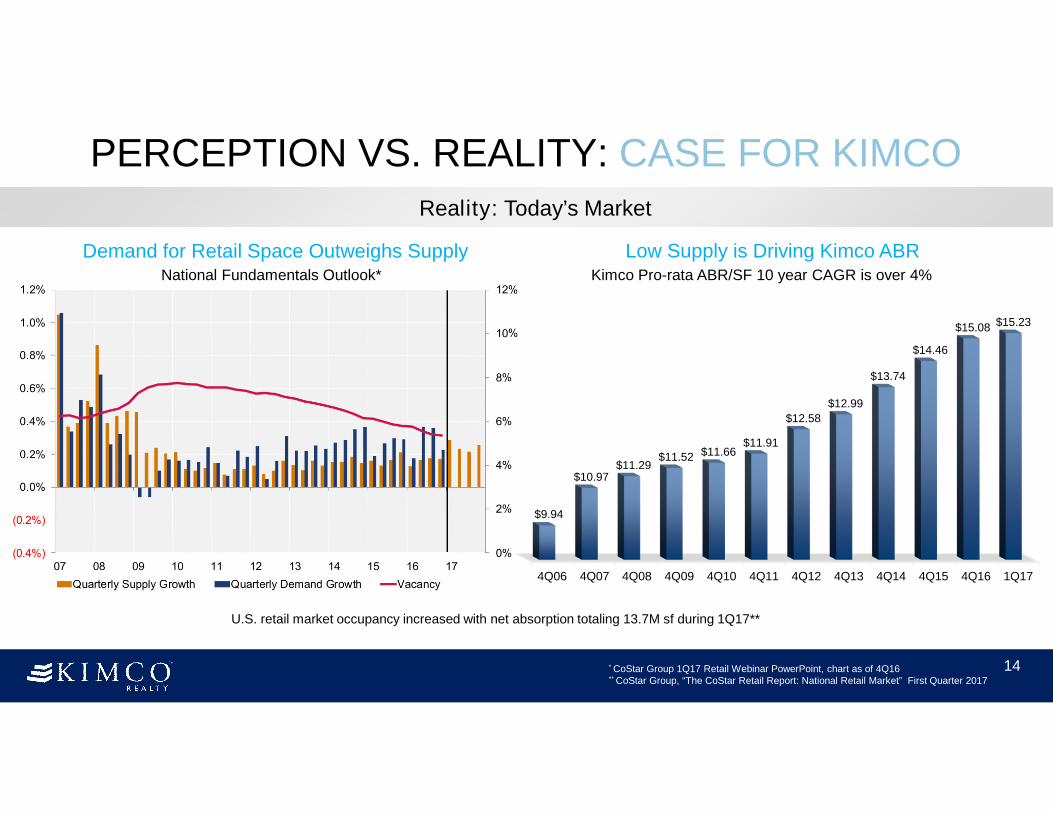
Reality: Today’s Market
* CoStar Group 1Q17 Retail Webinar PowerPoint, chart as of 4Q16** CoStar Group, “The CoStar Retail Report: National Retail Market” First Quarter 2017
Demand for Retail Space Outweighs Supply Low Supply is Driving Kimco ABR
14
Kimco Pro-rata ABR/SF 10 year CAGR is over 4%
4Q06 4Q07 4Q08 4Q09 4Q10 4Q11 4Q12 4Q13 4Q14 4Q15 4Q16 1Q17
$9.94
$10.97 $11.29
$11.52 $11.66 $11.91
$12.58
$12.99
$13.74
$14.46
$15.08 $15.23
National Fundamentals Outlook*
U.S. retail market occupancy increased with net absorption totaling 13.7M sf during 1Q17**
PERCEPTION VS. REALITY: CASE FOR KIMCO
1.1%
2.5%
3.8%
3.3%
3.1%
3.6%
27.8%
15.6%
19.5%
25.0%
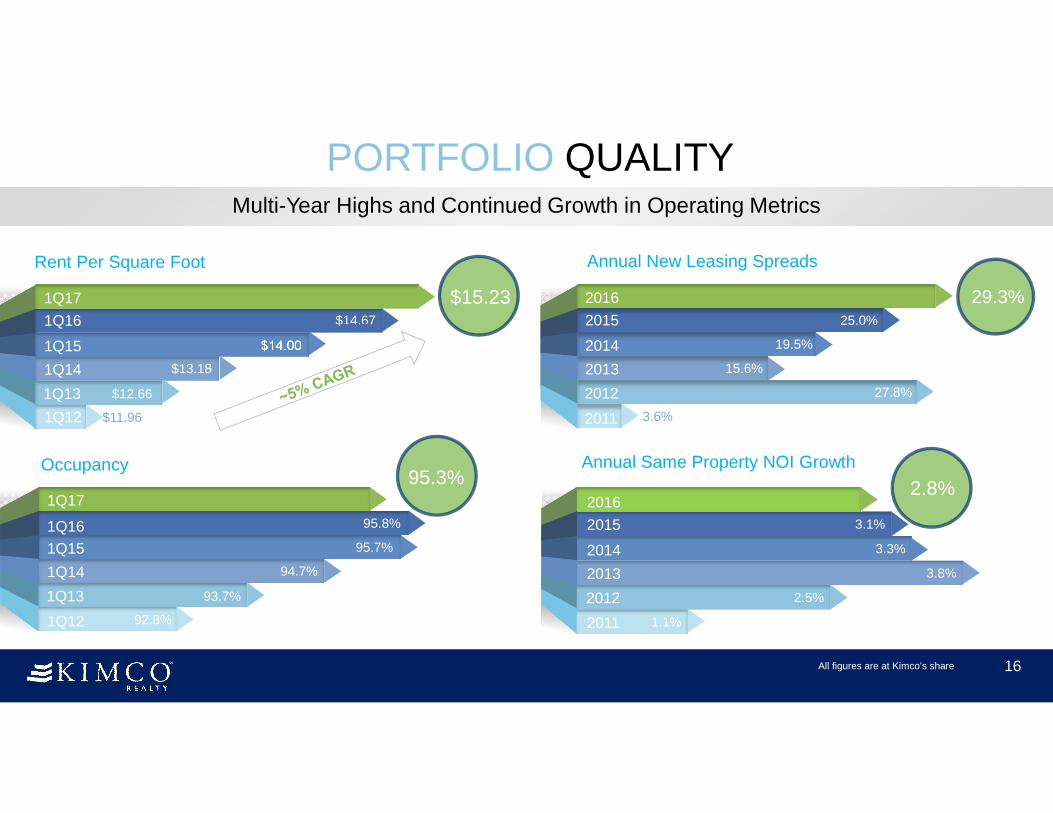
Multi-Year Highs and Continued Growth in Operating Metrics
PORTFOLIO QUALITY
16
Annual New Leasing Spreads
2016
2015
2014
2013
2012
2011
2016
2015
2014
2013
2012
2011
29.3%
Annual Same Property NOI Growth
2.8%
All figures are at Kimco’s share
$14.46
$13.74
$12.99
$12.58
$11.91$11.96
$12.66
$13.18
$14.00
$14.67
Rent Per Square Foot
$15.231Q17
1Q16
1Q15
1Q14
1Q13
1Q12
92.8%
93.7%
94.7%
95.7%
95.8%
1Q17
1Q16
1Q15
1Q14
1Q13
1Q12
95.3%Occupancy

PORTFOLIO QUALITYQuality Leads to Multiple Growth Levers
NOI Growth Walk Through 2020
85 -110 bps
100 -150 bps
110 -160 bps
140 -165 bps
435 -585 bps
Ground-Up Development
Targeted Annual Growth
RateRedevelopment
Leasing & Value Creation
Organic Growth(Rent Bumps)
17
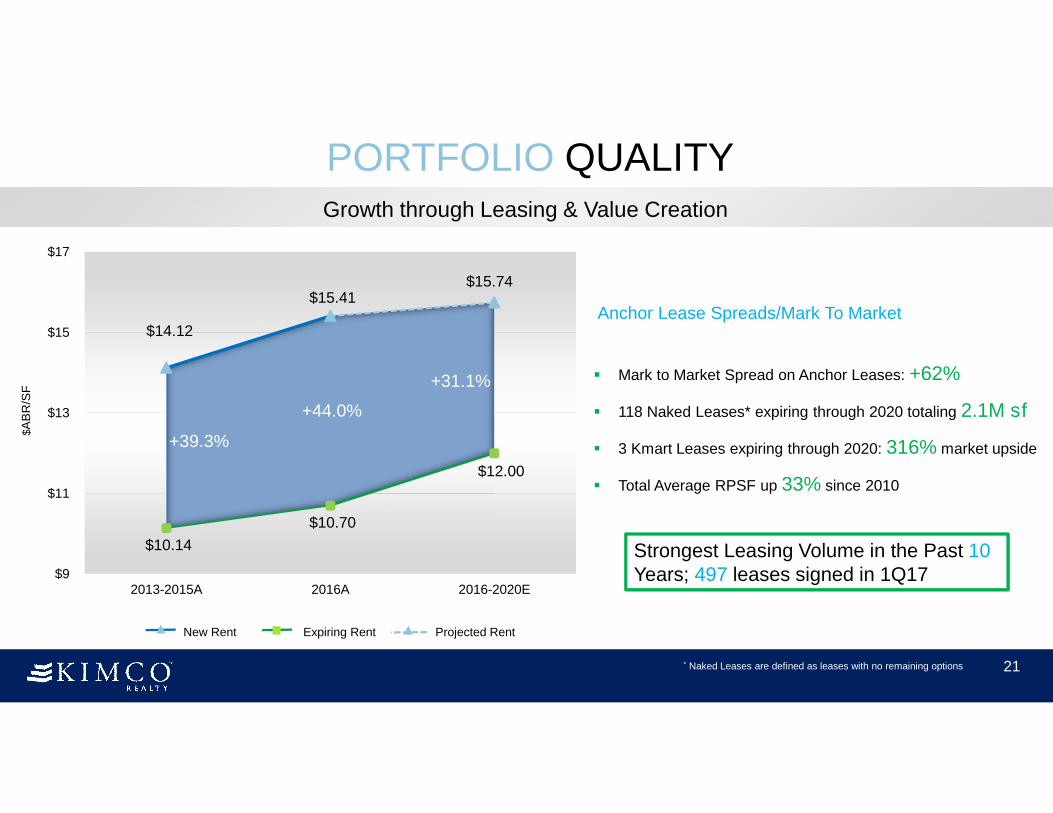
$14.12
$15.41 $15.74
$10.14
$10.70
$12.00
$9
$11
$13
$15
$17
2013-2015A 2016A 2016-2020E
PORTFOLIO QUALITYGrowth through Leasing & Value Creation
21
Anchor Lease Spreads/Mark To Market
Mark to Market Spread on Anchor Leases: +62%
118 Naked Leases* expiring through 2020 totaling 2.1M sf
3 Kmart Leases expiring through 2020: 316% market upside
Total Average RPSF up 33% since 2010
New Rent Expiring Rent Projected Rent
$A
BR
/SF
* Naked Leases are defined as leases with no remaining options
+31.1%
+44.0%
+39.3%
Strongest Leasing Volume in the Past 10Years; 497 leases signed in 1Q17
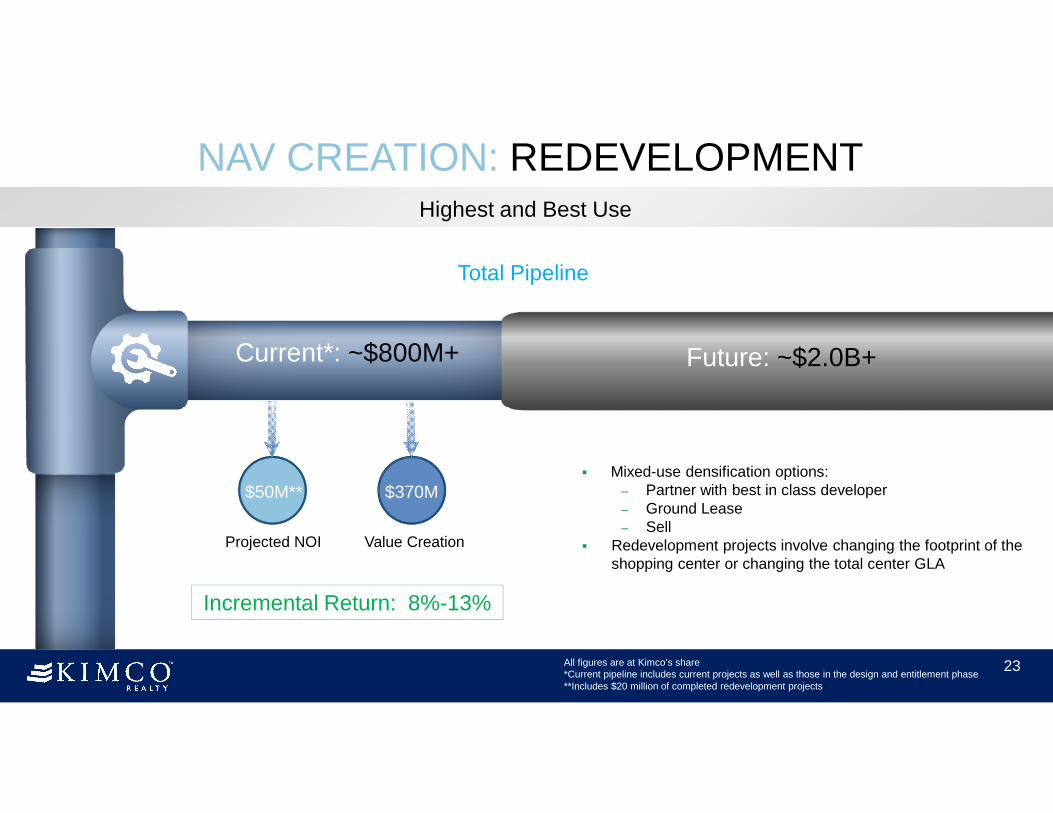
NAV CREATION: REDEVELOPMENTHighest and Best Use
23
Total Pipeline
Future: ~$2.0B+ Current*: ~$800M+
Mixed-use densification options: – Partner with best in class developer– Ground Lease– Sell
Redevelopment projects involve changing the footprint of the shopping center or changing the total center GLA
$370M
Value Creation
$50M**
Projected NOI
All figures are at Kimco’s share*Current pipeline includes current projects as well as those in the design and entitlement phase**Includes $20 million of completed redevelopment projects
Incremental Return: 8%-13%
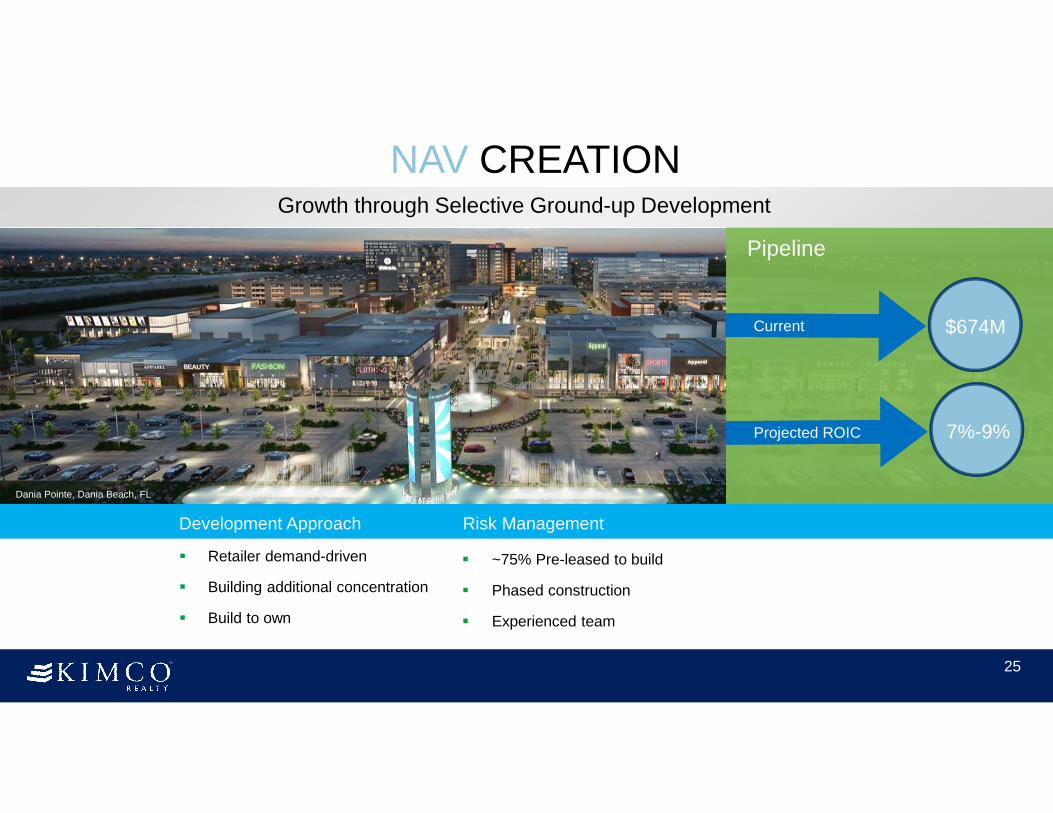
NAV CREATIONGrowth through Selective Ground-up Development
25
Pipeline
$674MCurrent
Dania Pointe, Dania Beach, FL
Development Approach
Retailer demand-driven
Building additional concentration
Build to own
Risk Management
~75% Pre-leased to build
Phased construction
Experienced team
Projected ROIC 7%-9%
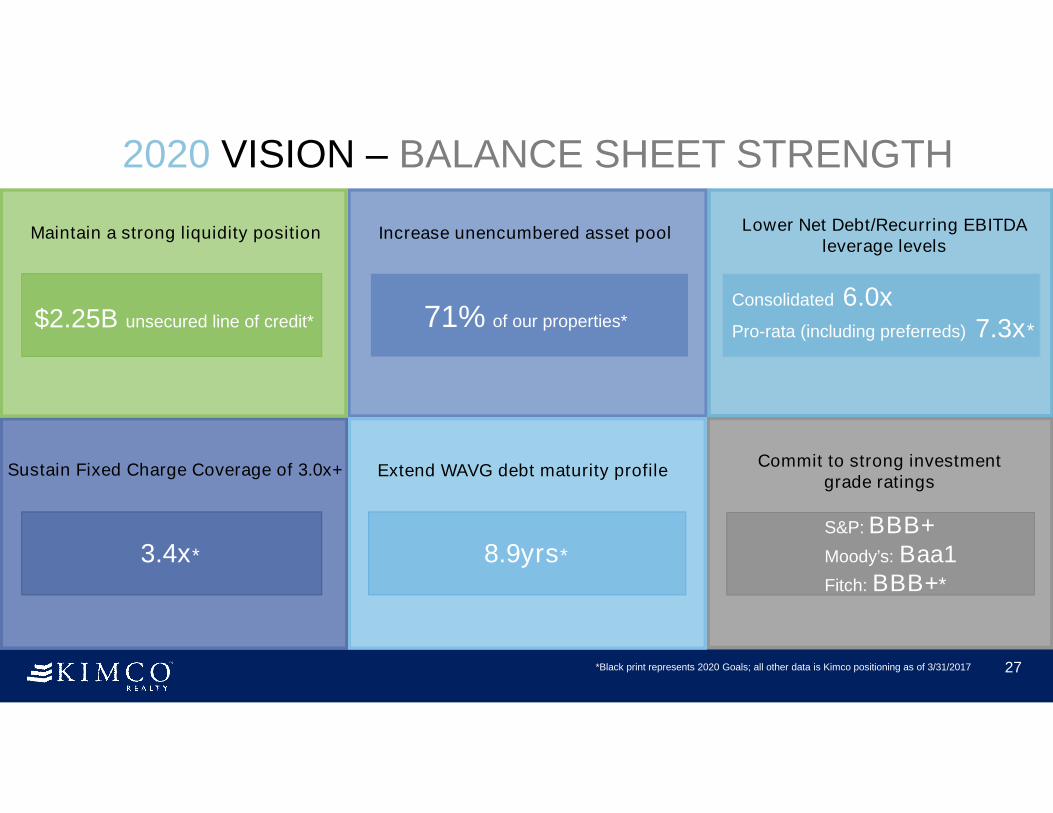
2020 VISION – BALANCE SHEET STRENGTH
Lower Net Debt/Recurring EBITDA leverage levels
Sustain Fixed Charge Coverage of 3.0x+
27
Maintain a strong liquidity position Increase unencumbered asset pool
Extend WAVG debt maturity profileCommit to strong investment
grade ratings
*Black print represents 2020 Goals; all other data is Kimco positioning as of 3/31/2017
$2.25B unsecured line of credit* 71% of our properties*Consolidated 6.0xPro-rata (including preferreds) 7.3x*
3.4x*
S&P: BBB+Moody’s: Baa1 Fitch: BBB+*
8.9yrs*
KIMCO IN SUMMARY2020 VISION
High-quality assets in major metro markets
Solid demographics and operational metrics
Unmatched diversity in geography and tenant base
Growth embedded in portfolio through leasing and redevelopment/ value
creation
Strong balance sheet and related credit ratings with excellent liquidity
50+ years in retail real estate with deep retailer relationships
19

19