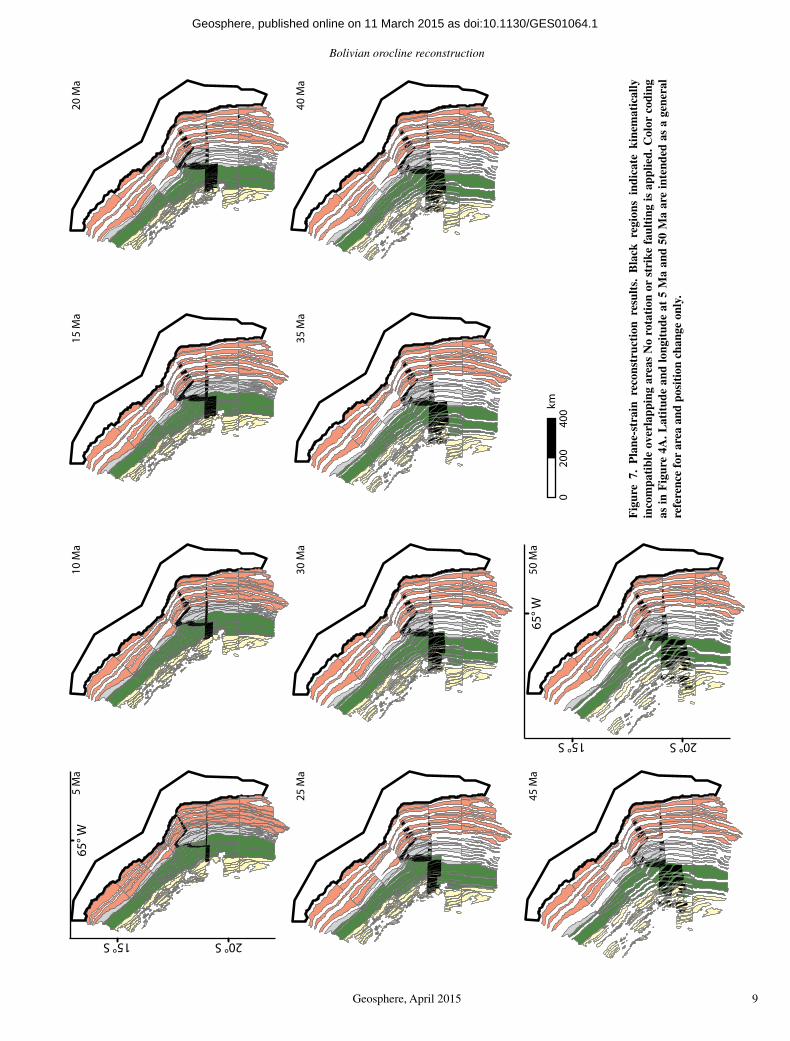
kinematic reconstruction of the bolivian oroclinenmcq/eichelberger_mcquarrie_2015b.pdf · kinematic...
TRANSCRIPT

Bolivian orocline reconstruction
Geosphere, April 2015 1
Kinematic reconstruction of the Bolivian orocline
Nathan Eichelberger1,* and Nadine McQuarrie2
1Department of Geosciences, Princeton University, Princeton, New Jersey 08544, USA2Department of Geology and Planetary Science, University of Pittsburgh, Pittsburgh, Pennsylvania 15260, USA
ABSTRACT
Orogenic curvature is a common feature in many mountain belts and is strongly linked to the magnitude, direction, and mechanics of crustal shortening. Determining how for-mation of the Bolivian orocline infl uenced crustal deformation in the central Andes has direct implications for geodynamics of the high-elevation Altiplano plateau. This study presents new reconstructions of the Bolivian orocline constrained by shortening estimates, thermochronology, regional paleomagnetic data, and strain data from lat 12°S to 22°S. The reconstructions investigate paleomag-netically permissible orocline limb rotations of 0°, 6°, and 13° on the kinematic compat-ibility of shortening constraints. Deformation was restored in 5 m.y. steps from 50 to 0 Ma, and kinematic compatibility was quantifi ed based on the area of map-view overlap at each step. No limb rotation resulted in 14,000 km2 of overlap, while 13° limb rotations and 50 km of orogen-parallel displacement on known strike-slip faults reduce overlap to 3000 km2. The preferred model builds on these results by imposing additional rotations at the oro-cline core and displacement on the Cocha-bamba fault. This model reduces overlap to 1600 km2 but predicts map-view shortening estimates 70–90 km greater in the northern limb and 20–30 km greater in the southern limb than determined from cross sections. Of the modeled increase, ~20 km is due to limb rotation, while the remaining 50–70 km is due to transpressional shortening on the Cocha-bamba and Rio Novillero faults. Total short-ening in the preferred model is 370 km in the northern limb, 380 km at the orocline core, and 300–350 in the southern limb.
INTRODUCTION
Determining the relationship between crustal shortening and surface uplift of orogenic pla-
teaus remains a frontier problem in continen-tal geodynamics. The second-largest modern orogenic plateau in the central Andes has been of particular interest because there is evidence for protracted deformation and crustal short-ening since at least 40 Ma (Elger et al., 2005; Horton, 2005; McQuarrie et al., 2005; Oncken et al., 2006), but also recent surface uplift as young as 10 Ma that would postdate signifi cant shortening (e.g., Gregory-Wodzicki, 2000; Gar-zione et al., 2008; Hoke and Garzione, 2008). From southern Peru to northern Argentina (~14°S–22°S), the Andes feature a high short-ening retroarc fold-thrust belt (123–330 km, 37%–40%; Gotberg et al., 2010; McQuarrie, 2002) with peak elevations to ~5–6 km that form the eastern boundary of the ~3–4-km-high Altiplano plateau (Fig. 1A). In addition, the region is characterized by a prominent bend in both the continental margin and cordillera from Peru to Bolivia that is referred to as the Bolivian orocline (Carey, 1955) (Fig. 1). Work in the Alti-plano–Bolivian orocline area has developed two differing bodies of data that argue for (1) pro-tracted isostatic surface uplift due to tectonic shortening and crustal thickening (e.g., Isacks, 1988) or (2) rapid surface uplift in response to removal of the lower lithosphere (e.g., Garzione et al., 2008). In either case, orogenic shortening should be able to account for both the modern crustal thickness as well as additional material that may have been removed. Available short-ening estimates vary from fully accounting for modern crustal thickness (Müller et al., 2002; McQuarrie, 2002; Elger et al., 2005; McQuarrie et al., 2005) to predicting crustal defi cits (Kley and Monaldi, 1998; Gotberg et al., 2010). How-ever, the application of these two-dimensional (2-D) plane-strain shortening estimates to crustal thickness calculations is complicated by the kinematic system of the Bolivian oro-cline. Lithospheric thickening and delamination events, similar to scenarios proposed for the Altiplano, have been related to the 3-D kine-matic system associated with orocline formation (Gutiérrez-Alonso et al., 2004, 2011).
Unraveling the complex 3-D kinematics of the Bolivian orocline requires accounting
for material displacements parallel to the oro-genic trend (Kley, 1999; Hindle et al., 2005; Arriagada et al., 2008) and vertical axis rota-tions (Arriagada et al., 2006; Roperch et al., 2006) that are not resolved in 2-D cross sections. Internal strain is normally a critical part of the 3-D kinematic system in curved orogens (Yon-kee and Weil, 2010), but has been shown to be negligible in the Bolivian orocline (Eichelberger and McQuarrie, 2015). Considering these fac-tors in addition to age constraints is critical to accurately determining the infl uence of orocline deformation on the evolution of the crust and mantle lithosphere at the Altiplano. To achieve this, we present new high-resolution reconstruc-tions of the Bolivian orocline with the goal of developing a more accurate kinematic model for the central Andes and Andean Plateau.
The reconstructions presented here focus on defi ning the 3-D kinematics of the Bolivian orocline and investigating how out-of-plane displacements have infl uenced crustal short-ening at the central Andes and oroclines in general. Vertical axis rotation and strike-slip faulting have been shown to be the main mech-anisms accommodating out-of-plane motion during the development of orogenic curvature (e.g., Kley, 1999; Arriagada et al., 2008). While the location and sense of offset on faults accom-modating strike-slip displacements are now fairly well defi ned (Dewey and Lamb, 1992; Funning et al., 2005; Eichelberger et al., 2013), there are no direct controls on offset magni-tude (Eichelberger et al., 2013). Permissible fault-parallel displacements can be estimated from reconstructions, but the reliability of these estimates is largely dependent on how well con-strained the surrounding kinematics are. These reconstructions incorporate variable shortening magnitudes and directions; a range of possible limb rotations from global positioning system (GPS) and paleomagnetic data; and timing constraints from geology and thermochronol-ogy into a tightly constrained kinematic frame-work. Based on the results of these models, we can determine the collective effect of rotation and fault parallel motion on shortening at the Bolivian orocline.
*Present address: StructureSolver LLC, Danville, California 94526, USA.
Geosphere; April 2015; v. 11; no. 2; p. 1–18; doi:10.1130/GES01064.1; 14 fi gures; 3 tables.Received 25 April 2014 ♦ Revision received 13 December 2014 ♦ Accepted 2 February 2015 ♦ Published online ___ Month 2015
For permission to copy, contact [email protected]© 2015 Geological Society of America
as doi:10.1130/GES01064.1Geosphere, published online on 11 March 2015

Eichelberger and McQuarrie
2 Geosphere, April 2015
OROCLINE KINEMATICS
Out-of-plane motion has been shown to be a substantial factor in the development of oro-genic curvature (e.g., Hindle and Burkhard, 1999; Yonkee and Weil, 2010). In the central Andes, regional structural trends and paleomag-netic data imply that the Bolivian orocline is no exception. A northwest-southeast–trending structural fabric extending from southern Peru to central Bolivia defi nes the northern limb of the orocline (Fig. 1B). At the orocline axis in central Bolivia, this transitions to a north-south structural fabric that defi nes the southern oro-cline limb southward into Argentina and Chile. Based on geologic map patterns, the principle shortening directions of the limbs predict exten-sion at the orocline core, but none is observed (Figs. 1B and 2A) (Kley, 1999; Eichelberger et al., 2013). Instead, paleomagnetic data and mapped strike-slip displacements indicate that the divergence of shortening directions in the
276 km (40%)1
300 km (40%)2
313 km (36%)3
320 km 5Eastern Cordillera
Altiplano
Interandes
Western Cordillera
326 km (37%) 4
Elevation6549 m
20 m
Subandes
CF
RNF
°
° °
Ch
ile
CF
RNF
Ordovician
Silurian-Devonian
Carboniferous
Cretaceous
Tertiary
Permian
ECAP IA SA
AP
EC
IA SA 1
2
3
4
5
A B
Figure 1. (A) Digital elevation model of the Bolivian orocline region (GTOPO30 1 km; U.S. Geological Survey global digital elevation model, 30 arc seconds, 1 km resolution; data available from the U.S. Geological Survey, https:// lta .cr .usgs .gov /GTOPO30). Dashed lines show the approximate boundaries of the physiographic units. The Western Cordillera is the modern volcanic arc and the Altiplano is the 3–4-km-high, low-relief plateau. The retro-arc fold-thrust belt is composed of the high-elevation Eastern Cordillera (EC); the intermediate Interandean zone (IA); and the low-elevation modern deformation front at the Subandes (SA). Shortening estimates for the fold-thrust belt (AP, EC, IA, SA) are indicated by gray arrows, which point in the principal shortening direction for each section. Shortening magnitudes are reported for each line of section. RNF—Rio Novillero fault; CF—Cochabamba fault. Referenced sections: 1—McQuarrie et al. (2008); 2—McQuarrie (2002); 3—Eichelberger et al. (2013); 4—McQuarrie (2002); 5—Dunn et al. (1995), Kley (1996), Müller et al. (2002), Elger et al. (2005). (B) Simplifi ed geologic map of the central Andean fold-thrust belt in Bolivia. Numbered cross-section lines as in A. Tertiary synorogenic sediments are dominantly exposed across the Altiplano basin and SA. In map view, the IA is characterized by Silurian–Cretaceous strata while the EC features Ordovician strata with Cretaceous–Tertiary preserved in synclinal basins.
φ
s2
e = 2s sin(φ/2)
s1 e
e
φ
s2’
s1’
Northern Limb
So
uth
ern
Limb
Overlap
s2’
s1’
e
Extensio
n
Northern Limb
So
uth
ern
Limb
Shortening
s2
s1
e
A B
Figure 2. Schematic diagrams showing kinematics implied by plane-strain shortening esti-mates from the orocline limbs. (A) Modern case where divergent shortening directions in the orocline limbs imply extension as a function of the divergence in limb displacement directions (φ) and magnitude of limb shortening (s) (modifi ed from Kley, 1996). (B) Diagram of kinematic incompatibility that results from restoring orocline limb displacement based on plane-strain shortening estimates. In this case the magnitude of overlap, or kinematic incompatibility, is approximately equivalent to the magnitude of extension predicted in A.
as doi:10.1130/GES01064.1Geosphere, published online on 11 March 2015
Bolivian orocline reconstruction
Geosphere, April 2015 3
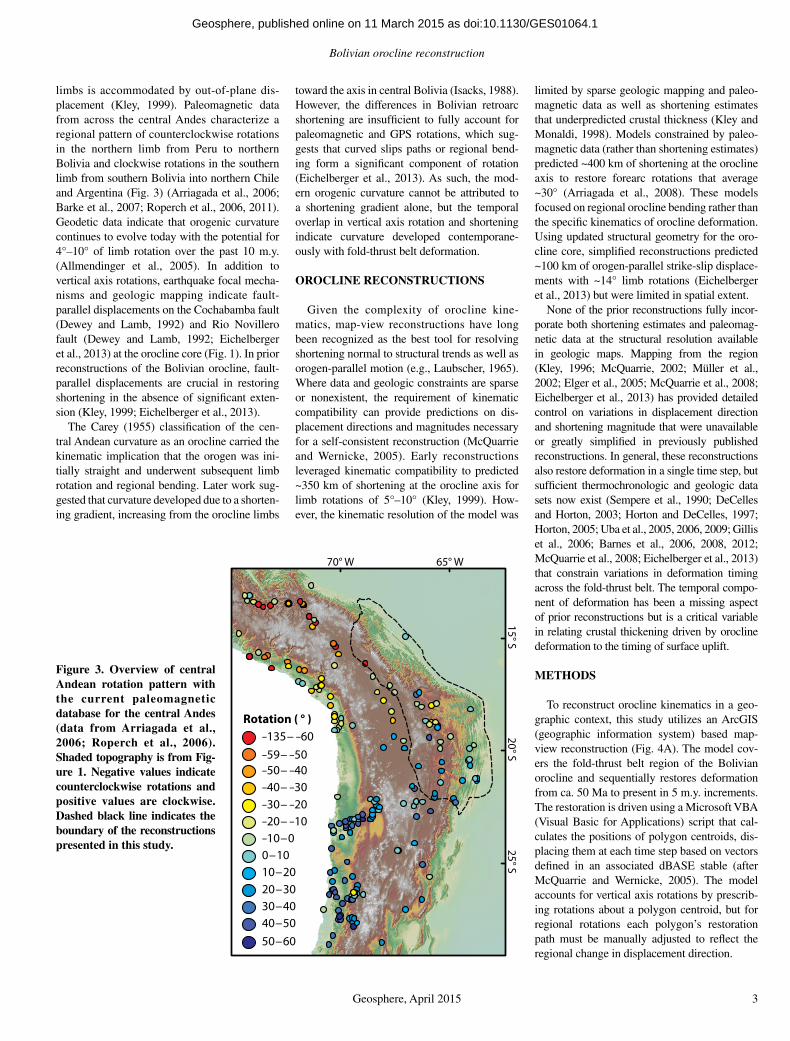
limbs is accommodated by out-of-plane dis-placement (Kley, 1999). Paleomagnetic data from across the central Andes characterize a regional pattern of counterclockwise rotations in the northern limb from Peru to northern Bolivia and clockwise rotations in the southern limb from southern Bolivia into northern Chile and Argentina (Fig. 3) (Arriagada et al., 2006; Barke et al., 2007; Roperch et al., 2006, 2011). Geodetic data indicate that orogenic curvature continues to evolve today with the potential for 4°–10° of limb rotation over the past 10 m.y. (Allmendinger et al., 2005). In addition to verti cal axis rotations, earthquake focal mecha-nisms and geologic mapping indicate fault-parallel displacements on the Cocha bamba fault (Dewey and Lamb, 1992) and Rio Novillero fault (Dewey and Lamb, 1992; Eichelberger et al., 2013) at the orocline core (Fig. 1). In prior reconstructions of the Bolivian orocline, fault-parallel displacements are crucial in restoring shortening in the absence of signifi cant exten-sion (Kley, 1999; Eichelberger et al., 2013).
The Carey (1955) classifi cation of the cen-tral Andean curvature as an orocline carried the kinematic implication that the orogen was ini-tially straight and underwent subsequent limb rotation and regional bending. Later work sug-gested that curvature developed due to a shorten-ing gradient, increasing from the orocline limbs
toward the axis in central Bolivia (Isacks, 1988). However, the differences in Bolivian retro arc shortening are insuffi cient to fully account for paleomagnetic and GPS rotations, which sug-gests that curved slips paths or regional bend-ing form a signifi cant component of rotation (Eichelberger et al., 2013). As such, the mod-ern orogenic curvature cannot be attributed to a shortening gradient alone, but the temporal overlap in vertical axis rotation and shortening indicate curvature developed contemporane-ously with fold-thrust belt deformation.
OROCLINE RECONSTRUCTIONS
Given the complexity of orocline kine-matics, map-view reconstructions have long been recognized as the best tool for resolving shortening normal to structural trends as well as orogen-parallel motion (e.g., Laubscher, 1965). Where data and geologic constraints are sparse or nonexistent, the requirement of kinematic compatibility can provide predictions on dis-placement directions and magnitudes necessary for a self-consistent reconstruction (McQuarrie and Wernicke , 2005). Early reconstructions leveraged kinematic compatibility to predicted ~350 km of shortening at the orocline axis for limb rotations of 5°–10° (Kley, 1999). How-ever, the kinematic resolution of the model was
limited by sparse geologic mapping and paleo-magnetic data as well as shortening estimates that underpredicted crustal thickness (Kley and Monaldi, 1998). Models constrained by paleo-magnetic data (rather than shortening estimates) predicted ~400 km of shortening at the orocline axis to restore forearc rotations that average ~30° (Arriagada et al., 2008). These models focused on regional orocline bending rather than the specifi c kinematics of orocline deformation. Using updated structural geometry for the oro-cline core, simplifi ed reconstructions predicted ~100 km of orogen-parallel strike-slip displace-ments with ~14° limb rotations (Eichelberger et al., 2013) but were limited in spatial extent.
None of the prior reconstructions fully incor-porate both shortening estimates and paleomag-netic data at the structural resolution available in geologic maps. Mapping from the region (Kley, 1996; McQuarrie, 2002; Müller et al., 2002; Elger et al., 2005; McQuarrie et al., 2008; Eichelberger et al., 2013) has provided detailed control on variations in displacement direction and shortening magnitude that were unavailable or greatly simplifi ed in previously published reconstructions. In general, these reconstructions also restore deformation in a single time step, but suffi cient thermochronologic and geologic data sets now exist (Sempere et al., 1990; DeCelles and Horton , 2003; Horton and DeCelles, 1997; Horton , 2005; Uba et al., 2005, 2006, 2009; Gillis et al., 2006; Barnes et al., 2006, 2008, 2012; McQuarrie et al., 2008; Eichelberger et al., 2013) that constrain variations in deformation timing across the fold-thrust belt. The temporal compo-nent of deformation has been a missing aspect of prior reconstructions but is a critical variable in relating crustal thickening driven by orocline deformation to the timing of surface uplift.
METHODS
To reconstruct orocline kinematics in a geo-graphic context, this study utilizes an ArcGIS (geographic information system) based map-view reconstruction (Fig. 4A). The model cov-ers the fold-thrust belt region of the Bolivian orocline and sequentially restores deformation from ca. 50 Ma to present in 5 m.y. increments. The restoration is driven using a Microsoft VBA (Visual Basic for Applications) script that cal-culates the positions of polygon centroids, dis-placing them at each time step based on vectors defi ned in an associated dBASE stable (after McQuarrie and Wernicke, 2005). The model accounts for vertical axis rotations by prescrib-ing rotations about a polygon centroid, but for regional rotations each polygon’s restoration path must be manually adjusted to refl ect the regional change in displacement direction.
65° W70° W
15
° S2
0° S
25
° S
–135– –60
–59– –50
–50– –40
–40– –30
–30– –20
–20– –10
–10–0
0–10
10–20
20–30
30–40
40–50
50–60
Rotation ( ° )
Figure 3. Overview of central Andean rotation pattern with the current paleomagnetic database for the central Andes (data from Arriagada et al., 2006; Roperch et al., 2006). Shaded topography is from Fig-ure 1. Negative values indicate counter clockwise rotations and positive values are clockwise. Dashed black line indicates the boundary of the reconstructions presented in this study.
as doi:10.1130/GES01064.1Geosphere, published online on 11 March 2015

Eichelberger and McQuarrie
4 Geosphere, April 2015
The viability of the proposed restoration paths can be assessed based on the self-con-sistency of the kinematic model through time (McQuarrie and Wernicke, 2005). Polygons that restore to overlapping positions indicate regions that violate strain compatibility due to defi ned restoration paths that are kinematically incompatible (McQuarrie and Wernicke, 2005). In the Bolivian Andes, deformation is princi-pally characterized at both outcrop (McQuarrie and Davis, 2002) and regional scales (e.g., Sheffels, 1990; Kley, 1996; Lamb and Hoke; 1997; McQuarrie, 2002) by structures accom-
modating horizontal shortening perpendicular to structural trend. Balanced cross sections account for this plane-strain shortening; thus restoring Andean shortening estimates in map view requires the displacement direction be parallel to the line of section orientation and perpendicular to structural trend. Consequently, the restoration vectors in our reconstruc-tions are initially defi ned by the magnitude of shortening directed normal to structural trend (Fig. 2A). Given the similarity of shortening estimates in the Bolivian Andes, kinematic incompatibilities largely arise from regional
changes in structural orientation that produce nonparallel restoration paths (Fig. 2B). Here we interpret the locations of kinematic incom-patibilities to indicate regions where plane-strain deformation constraints are insuffi cient and additional components of out-of-plane motion are required (overlap in Fig. 2B). The magnitude of out-of-plane motion is approxi-mately equal to the magnitude of extension pre-dicted by the divergence in limb displacement directions. For the Bolivian orocline, recog-nized mechanisms for out-of-plane motion are regional paleomagnetic rotations and mapped strike-slip displacements along faults (Fig. 4). The objective is to restore both in-plane and out-of-plane deformation while minimizing the total kinematic incompatibility as quantifi ed by the total overlap area at each time step. We test a range of permissible regional rotation mag-nitudes based on uncertainties in the available paleomagnetic and GPS data. Based on those results, additional strike-slip displacements are imposed along structures with geologic evi-dence for fault-parallel motion. The imposed displacements are kept at the minimum mag-nitude necessary to resolve large kinematic incompatibilities given the lack of direct con-straints on strike-slip fault offsets. One limita-tion of the model is that polygon dimensions are fi xed so the fault blocks are assumed to be rigid, ignoring internal strain. While this is a major simplifying assumption, recent work in the central Andes has shown that internal strain is negligible for the model region (Eichelberger and McQuarrie, 2015).
The fault-block boundaries are defined based on fault traces and fold axes from pub-lished geologic maps that range in scale from 1:100,000 to 1:500,000 (Fig. 4A) (e.g., Kley, 1996; Sheffels, 1988; McQuarrie, 2002; Müller et al., 2002; McQuarrie et al., 2008; Eichel-berger et al., 2013). The blocks are regionally grouped into established physiographic zones present at the Bolivian orocline. From west to east, they are the Western Cordillera, Altiplano basin, Eastern Cordillera (EC), Interandean zone (IA), and Subandes (SA) (Fig. 1) (Isacks, 1988; Kley, 1996). The Western Cordillera is the modern volcanic arc with peak elevations of ~6 km and forms the western boundary of the ~3.8-km-high, internally drained Altiplano basin (Isacks, 1988). Due to extensive volcanic cover in the Western Cordillera, shortening is unconstrained and not included in the recon-structions presented here. The eastern limit of the Altiplano basin is defi ned by the EC, which has peak elevations of 5–6 km and is composed primarily of Paleozoic and Mesozoic rocks deformed by west-vergent folds and faults at the Altiplano basin–EC boundary. Structural
CF
RNF
1
2
3
4
5
A
Line of section
Subandes
Interandes
Eastern Cordillera
EC Backthrust
Foreland (fixed)
Transect Boundary
Strike-slip fault
Rotation
−21.5 −21 −20.5 −20 −19.5 −19 −18.5 −18
−10
−5
0
5
10
15
20
25
30
35
Upper limit = 13.6°
Mean = 6.9°
MSWD = 0.11
Sample Position (latitude)
Pa
leo
ma
gn
eti
c R
ota
tio
n (
de
gre
es)
Subandes
South Limb (4, 5) Core (3) North Limb (1, 2)
−22 −21 −20 −19 −18 −17 −16 −15 −14−60
−40
−20
0
20
40
60Central Andean Orocline
SAECAPWC
GPS 0-15 Ma average = 12°
Reconstruction Region
Up
pe
r Li
mit G
PS
Avg
.
B
C
Northern Lim
b
Core
So
uth
ern
Limb
65° W
200 km
20° S
15° S
Figure 4. Reconstruction setup. (A) Model geometry with fault blocks outlined in gray and shaded based on physiographic unit. Blue lines show the location of balanced cross-section transects; numbers are as in Figure 1 and Table 1. Dashed black lines show the artifi cial transect boundaries used to allow for changes in shortening estimates and deformation tim-ing. The locations of the Cochabamba (CF) and Rio Novillero (RNF) strike-slip faults are shown in red; arrows indicate the sense of offset. Rotational symbols show regional changes in rotation direction; solid symbols indicate prescribed rotation directions in the minimum and maximum rotation models while the dashed symbols (core Subandes) are added in the preferred model. EC—Eastern Cordillera. (B) The rotations used in the model are defi ned by paleomagnetic data from the Subandes (data from Roperch et al., 2006). The minimum rotation model is based on the mean of this data while the maximum rotation model is defi ned by the largest possible rotation within uncertainty. Extrapolated global positioning system (GPS) rotations (Allmendinger et al., 2005) are comparable to the upper limit of paleomagnetic rotation. MSWD—mean square of weighted deviates. (C) Plot of regional paleomagnetic data spanning the entire cordillera. The upper rotation limit from B is plot-ted by a solid line with the extrapolated GPS rotations plotted as a dashed line (Avg.—aver-age). The rotations for the maximum rotation model encompass most of the paleomagnetic data from the fold-thrust belt in the reconstruction region. IA—Interandes; EC—Eastern Cordillera; AP—Altiplano basin; WC—Western Cordillera.
as doi:10.1130/GES01064.1Geosphere, published online on 11 March 2015
Bolivian orocline reconstruction
Geosphere, April 2015 5
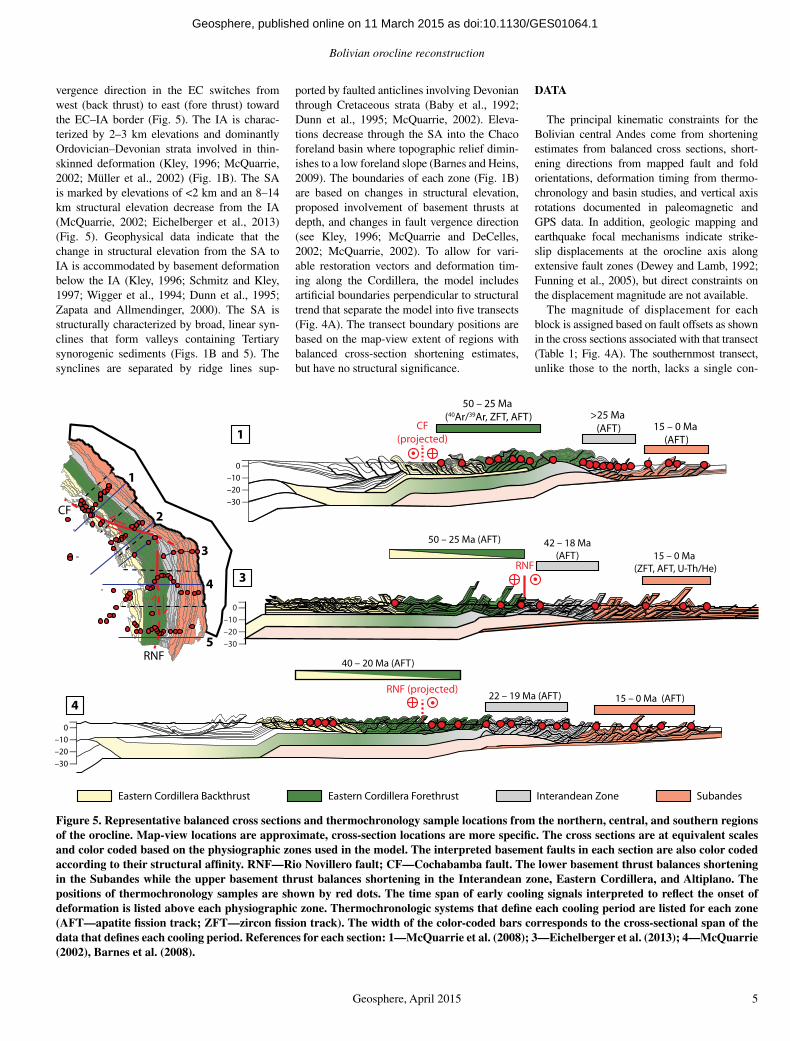
vergence direction in the EC switches from west (back thrust) to east (fore thrust) toward the EC–IA border (Fig. 5). The IA is charac-terized by 2–3 km elevations and dominantly Ordovician–Devonian strata involved in thin-skinned deformation (Kley, 1996; McQuarrie , 2002; Müller et al., 2002) (Fig. 1B). The SA is marked by elevations of <2 km and an 8–14 km structural elevation decrease from the IA (McQuarrie, 2002; Eichelberger et al., 2013) (Fig. 5). Geophysical data indicate that the change in structural elevation from the SA to IA is accommodated by basement deformation below the IA (Kley, 1996; Schmitz and Kley, 1997; Wigger et al., 1994; Dunn et al., 1995; Zapata and Allmendinger, 2000). The SA is structurally characterized by broad, linear syn-clines that form valleys containing Tertiary synorogenic sediments (Figs. 1B and 5). The synclines are separated by ridge lines sup-
ported by faulted anticlines involving Devonian through Cretaceous strata (Baby et al., 1992; Dunn et al., 1995; McQuarrie, 2002). Eleva-tions decrease through the SA into the Chaco foreland basin where topographic relief dimin-ishes to a low foreland slope (Barnes and Heins, 2009). The boundaries of each zone (Fig. 1B) are based on changes in structural elevation, proposed involvement of basement thrusts at depth, and changes in fault vergence direction (see Kley, 1996; McQuarrie and DeCelles, 2002; McQuarrie, 2002). To allow for vari-able restoration vectors and deformation tim-ing along the Cordillera, the model includes artifi cial boundaries perpendicular to structural trend that separate the model into fi ve transects (Fig. 4A). The transect boundary positions are based on the map-view extent of regions with balanced cross-section shortening estimates, but have no structural signifi cance.
DATA
The principal kinematic constraints for the Bolivian central Andes come from shortening estimates from balanced cross sections, short-ening directions from mapped fault and fold orientations, deformation timing from thermo-chronology and basin studies, and vertical axis rotations documented in paleomagnetic and GPS data. In addition, geologic mapping and earthquake focal mechanisms indicate strike-slip displacements at the orocline axis along extensive fault zones (Dewey and Lamb, 1992; Funning et al., 2005), but direct constraints on the displacement magnitude are not available.
The magnitude of displacement for each block is assigned based on fault offsets as shown in the cross sections associated with that transect (Table 1; Fig. 4A). The southernmost transect, unlike those to the north, lacks a single con-
0
–10
–20
–30
22 – 19 Ma (AFT) 15 – 0 Ma (AFT)
40 – 20 Ma (AFT)
RNF (projected)
0
–10
–20
–30
50 – 25 Ma (AFT)
15 – 0 Ma
(ZFT, AFT, U-Th/He)
42 – 18 Ma
(AFT)RNF
0
–10
–20
–30
50 – 25 Ma
(40Ar/39Ar, ZFT, AFT) >25 Ma
(AFT) 15 – 0 Ma
(AFT)
CF
(projected)
3
4
1
Eastern Cordillera Backthrust Eastern Cordillera Forethrust SubandesInterandean Zone
CF
RNF
1
2
3
4
5
Figure 5. Representative balanced cross sections and thermochronology sample locations from the northern, central, and southern regions of the orocline. Map-view locations are approximate, cross-section locations are more specifi c. The cross sections are at equivalent scales and color coded based on the physiographic zones used in the model. The interpreted basement faults in each section are also color coded according to their structural affi nity. RNF—Rio Novillero fault; CF—Cochabamba fault. The lower basement thrust balances shortening in the Subandes while the upper basement thrust balances shortening in the Interandean zone, Eastern Cordillera, and Altiplano. The positions of thermochronology samples are shown by red dots. The time span of early cooling signals interpreted to refl ect the onset of deformation is listed above each physiographic zone. Thermochronologic systems that defi ne each cooling period are listed for each zone (AFT—apatite fi ssion track; ZFT—zircon fi ssion track). The width of the color-coded bars corresponds to the cross-sectional span of the data that defi nes each cooling period. References for each section: 1—McQuarrie et al. (2008); 3—Eichelberger et al. (2013); 4—McQuarrie (2002), Barnes et al. (2008).
as doi:10.1130/GES01064.1Geosphere, published online on 11 March 2015

Eichelberger and McQuarrie
6 Geosphere, April 2015
tinuous line of section across the fold-thrust belt (transect 5, Fig. 4), so the total displacement is based on a composite shortening estimate from structural studies in each of the physiographic units (SA—Dunn et al., 1995; IA—Kley, 1996; EC—Müller et al., 2002). For fault blocks in all six transects, the shortening is restored in sequence, from east (SA) to west (EC). During restoration, active physiographic units are inter-nally restored, indicated by expanding space between fault blocks. Outboard units to the west that have earlier deformation periods (restored in subsequent time steps) are passively dis-placed with no intraunit separation between fault blocks. Once a unit has been fully restored, the constituent fault blocks remain fi xed. The pri-mary challenge in reconstructing the orocline is that the curvature of the fold-thrust belt implies divergent plane-strain displacement paths that intersect as shortening is restored. Shortening magnitude estimates used for the reconstruction are quite similar and range from 276 km (40%) in the distal northern limb (McQuarrie et al., 2008) to 327 km (37%) in the southern limb (Table 1) (McQuarrie, 2002). The northwest-southeast structural fabric of the northern orocline limb implies a northeast principal shortening direc-tion while the southern limb is characterized by a north-south structural fabric and east-directed shortening (Table 1; Fig. 4A).
Timing
Timing of deformation in the model is based on a combination of thermochronologic cool-ing ages from each of the model transects and
geologic constraints from mapping and basin sedimentation histories. The available thermo-chronology data varies by transect, it generally includes 40Ar/39Ar, zircon fi ssion track, zircon (U-Th)/He, apatite fi ssion track, and apatite (U-Th)/He ages from various stratigraphic depths and structural positions across all three major physiographic units (Fig. 5). These cool-ing ages have been used as a timing proxy for central Andes deformation under the assump-tion that cooling is driven by erosional exhuma-tion in response to the relief generated by fault-ing (e.g., Barnes and Ehlers, 2009). Exhumation ages in each physiographic unit often overlap within uncertainty, preventing a fault-by-fault restoration sequence. The broad overlap in exhumation ages has been interpreted to refl ect periods of distributed deformation both within each physiographic unit and across unit bound-aries (Barnes et al., 2006, 2008; McQuarrie et al., 2008; Eichelberger et al., 2013). Rather than assuming a structure-by-structure propaga-tion sequence, fault blocks within each physio-graphic unit are simultaneously restored over the same time period, beginning with the earliest exhumation age in that region (Fig. 5; Table 1). Overall, the oldest exhumation onset ages are found in the EC and generally become younger eastward into the SA (Barnes et al., 2006, 2008, 2012; McQuarrie et al., 2008; Eichelberger et al., 2013). While thermochronology can be used to interpret the onset of deformation within a physiographic region, determining the ages of cessation is more diffi cult. Geologic constraints show that deformation in the northern limb EC had ceased by 25 Ma (Gillis et al., 2006;
Horton , 2005) while GPS data and geomorphol-ogy indicate that the SA is actively deforming today (Brooks et al., 2011). There are no data that directly constrain the termination of IA deformation. However, the kinematic systems proposed in balanced cross sections suggest that IA deformation would have ceased by the time SA deformation was underway, although IA exhumation would continue (McQuarrie et al., 2008) (Fig. 5). In general, deformation in the SA is restored from 15 to 0 Ma across the entire oro-cline. Timing of IA exhumation varies by loca-tion, spanning 30–5 Ma in the northern limb, 40–15 Ma at the orocline axis, and 25–10 Ma in the southern limb. As a result, IA deformation is restored in the model beginning with the earli-est exhumation age and ending at 15 Ma, when SA deformation begins. In the EC, fault blocks are restored over 45–25 Ma in the northern limb, 50–20 Ma at the orocline axis, and 50–20 Ma for the southern limb.
Rotation
At the regional scale, paleomagnetic and GPS data from Peru to Chile resolve the central Andean rotation pattern system of counterclock-wise rotations in the northern limb and clock-wise rotations for the southern limb (Figs. 3 and 4). At smaller scales, the rotations are subject to local structural infl uences, have large uncertain-ties, and were sampled from lithologies older than Late Cretaceous that may record rotations unrelated to Andean deformation. In addition, the data are concentrated in volcanic forearc rocks but sparse in the portion of the retroarc fold-thrust belt covered by the reconstruction. Collectively, these factors make it diffi cult to identify rotations related to the development of orogenic curvature. To determine representative magnitudes of rotation related to recent Andean deformation, we focus on paleomagnetic data from synorogenic sediments located in the SA (compiled by Roperch et al., 2006). The SA defi nitively accommodated the most recent phase of deformation in the central Andes from ca. 15 Ma to present. SA structures are domi-nantly fault-propagation folds with consistently linear local orientations, typical of foothills-style deformation (Dahlstrom, 1969). There is little evidence for structural complexities that could result in local block rotations, suggesting that rotations recorded by Tertiary synorogenic sediments document regional rotation. In addi-tion, GPS data (Allmendinger et al., 2005) pro-vide additional constraints on regional rotations. Extrapolating modern rotations over geologic time assumes constant rotation rates; however, at a regional scale, the convergence direction for the subducting Nazca plate has been constant
TABLE 1. KINEMATIC CONSTRAINTS
Shortening(km)
Rapid cooling (Ma) Reference Time step
Rotation(°)
Min Max PreferredTransect 1a, 1bEC 123 45–25; 15–0 Barnes et al. (2006) 50–25 6 13 13IA 48 before 25; 18–5 Gillis et al. (2006) 45–25 6 13 13SA 66 15–0 McQuarrie et al. (2008) 15–0 6 13 13Transect 2
3131652–0512–55241CEIA 39 18–6 Barnes et al. (2012) 20–10 6 13 13
313160–015–0117ASTransect 3
3131652–0552–05631CEIA 43 42–18 Eichelberger et al. (2013) 45–15 0 0 4
31±000–510–5168ASTransect 4
31–31–6–02–0402–04221CEIA 96 22–19 Barnes et al, (2008) 25–15 –6 –13 –13
31–31–6–0–510–5176ASTransect 5
31–31–6–02–0402–0459CEIA 62 18–9 Ege et al. (2007) 20–10 –6 –13 –13SA 78 10–0 Scheuber et al. (2006);
Uba et al. (2009)15–0 –6 –13 –13
Note: EC—Eastern Cordillera; IA—Interandes; SA—Subandes; Min—minimum; Max—maximum.
as doi:10.1130/GES01064.1Geosphere, published online on 11 March 2015

Bolivian orocline reconstruction
Geosphere, April 2015 7
since SA deformation began ca. 15 Ma (Pardo-Casas and Molnar, 1987; Somoza, 1998). Mod-eling the rotational component of oroclinal bending as contemporaneous with shortening in the SA differs from interpretations that attribute bending of the Andes to regional north-south compression unrelated to fold-thrust belt short-ening (e.g., Johnston et al., 2013). Given that the SA in the model area has been actively exhum-ing since at least 5 Ma (Barnes et al., 2006, 2008, 2012; Eichelberger et al., 2013), continues to shorten today (Brooks et al., 2011), and modern backarc rotation rates are low (≤2° m.y.–1; All-mendinger et al., 2005), it is unlikely that rota-tional bending postdates SA deformation.
Due to the large uncertainties in the paleo-magnetic data, we perform two reconstructions to test minimum and maximum magnitudes of limb rotation. Paleomagnetic rotations in the southern limb SA between 21.5°S and 18°S range from –1.1° ± 14° (counterclockwise) to 11.1° ± 22° (clockwise) (Fig. 3). Two SA data points are available for the northern limb, recording 0.2° ± 21° at 15°S and –7.4° ± 7.2° at 12.7°S. These measurements are statistically equivalent, but within the context of the central Andean rotation pattern, we assume that –7.4° ± 7.2° is consistent with orocline scale deforma-tion and complimentary to south limb rotation. The minimum rotation scenario is based on the mean SA rotation (~7°; Table 1; Fig. 4B). The maximum rotation scenario is based on the maximum permissible rotation within uncer-tainty for the SA paleomagnetic data in the study region. In the reconstruction, the maxi-mum rotation applied to the limbs is 13° (Table 1; Fig. 4B). The rotational range represented by the minimum and maximum rotation scenarios cover retroarc GPS rotations extrapolated over 15–0 Ma (south limb: 12°; north limb: –6°; Allmendinger et al., 2005) as well as the range of EC and Altiplano basin paleomagnetic rota-tions from the reconstruction region (Fig. 4C). Paleomagnetic rotations in the EC region of the orocline core are variable, likely due to the infl u-ence of possible strike-slip faulting in the area of Cochabamba where the available samples are located. Minimal rotations have been predicted for this region (Kley, 1999; Arriagada et al., 2008); however, the northwest-southeast–trend-ing EC structures at the core are continuous with northern limb structures that undergo counter-clockwise rotations. For the initial maximum and minimum limb rotation models, the core EC rotates with the northern limb while the IA and SA do not rotate (Fig. 4B).
The most prominent effect of restoring regional rotations is the progressive impact it has on changing the displacement directions defi ned in each region. The reconstruction assumes that
rotation was a function of SA deformation: blocks that underwent less displacement also underwent a proportionally lower magnitude of rotation. Within the model framework, the magnitude of rotation restored at each time step during SA deformation is scaled by a given fault block’s displacement magnitude. There-fore, as with shortening, rotations are restored in sequence from the SA (recent deformation) back toward the EC (earlier deformation). Addi-tional rotations can be added at earlier time steps to resolve local kinematic incompatibilities, but are not required because SA rotations account for measured EC rotations within uncertainty (Fig. 4C). By the time the SA is fully restored, blocks at the western edge of the SA and beyond undergo the full magnitude of assigned limb rotation. The incremental rotations at each time step then alter fault-block displacement paths in all subsequent time steps. The regional displacement direction in the minimum rota-tion model changes from 270° (west) to 262° (approximately west-southwest) in the south-ern limb and from 229° (approximately south-southwest) to 237° (approximately southwest) in the northern limb. The maximum rotation model displacement directions change to 256° (approximately west-southwest) in the southern limb and from 243° (approximately southwest) in the northern limb. Independently restoring the limb rotations and shortening translations in each transect imposes different poles of rotation for north and south limbs (similar to the exter-nal pivot model of Sussman et al., 2012). The poles are located away from the orocline axis and outside the reconstruction reference frame. Consequently, the only fi xed points in the area of the reconstruction are along the modern fore-land basin.
Strike-Slip Displacements
Of all the kinematic components documented at the Bolivian orocline, the magnitude of lateral displacements approximately parallel to fault trend is the least well constrained. Geologic and seismologic evidence shows that at least two faults have accommodated transpressional deformation in the region of the orocline axis and continue to do so today. The north-south–trending Rio Novillero fault (RNF, Fig. 6) at the orocline core was initially located based on the change from northeast-vergent thrust faults that characterize the north limb structural fab-ric to east-vergent structures characteristic of the south limb (Dewey and Lamb, 1992). This change occurs abruptly across several structures that have accommodated north-south–oriented, right-lateral motion indicated by locally offset lithologic contacts, but no direct constraints on
the total north-south displacement are available (Eichelberger et al., 2013). Recent seismicity in the area also shows that the RNF accom-modates right-lateral motion on nearly vertical faults planes today (Fig. 6) (Dewey and Lamb, 1992; Funning et al., 2005). The Cochabamba fault has been mapped as both a normal and left-lateral fault (Dewey and Lamb, 1992; Kennan et al., 1995; McQuarrie, 2002; Sheffels , 1995) due to the presence of two apparent pull-apart basins with bounding ranges that are 2–3 km higher in elevation (Cochabamba fault, CF, Fig. 6). Earthquake focal mechanisms are consistent with left-lateral fault displacements (Dewey and Lamb, 1992), but there are no geo-logic observations that constrain offset magni-tude. Together the RNF and CF are proposed to form a conjugate fault system (Dewey and Lamb, 1992) that structurally separates the oro-cline core from the limbs, similar to the orocline model of Kley (1999). The extent of both faults beyond the orocline core region is ambiguous, but for different reasons. The regional change in structural trend associated with the RNF is traceable for ~100 km until the structural trend becomes uniformly north-south in the southern limb (Fig. 6). The southern limb extension of RNF in the model follows east-vergent thrust faults where bedding orientations are slightly oblique to fault trend, similar to the structural relationship established to the north (Fig. 4A). The extent of the CF is best defi ned by the west-east–trending pull-apart basins, oblique to the northwest-southeast structural fabric. These features are only discernable over ~50 km, sug-gesting that if the CF extends westward into the northern limb and Altiplano, fault-lateral offsets are probably distributed along the northwest-southeast–trending thrust faults that characterize the region west of the Cochabamba basins. In the model, the CF is extended westward follow-ing mapped thrust faults that are slightly oblique to the dominant trend but become parallel to the regional trend closer to the Altiplano (Fig. 4A). Where the RNF and CF parallel the local fold-thrust belt trend, any lateral displacement would be convolved with fault-normal shortening, making the lateral component of slip diffi cult to detect in the fi eld. Lateral displacements are not mapped in the limbs, which suggests that the total offset on either fault system may be small and distributed over multiple faults.
RESULTS
In all of the reconstructions presented here, the kinematic incompatibility of a given time step is interpreted based on the total overlap-ping polygon area at that time step. The total overlap area at the fi nal time step is the cumula-
as doi:10.1130/GES01064.1Geosphere, published online on 11 March 2015

Eichelberger and McQuarrie
8 Geosphere, April 2015
tive overlap from the entire model. However, for a physiographic region in a given transect, the maximum overlap magnitude may occur at an earlier time step. For example, the magnitudes of SA overlap in each model peaks when SA shortening has been fully restored then remains fi xed in subsequent time steps. Since the IA and EC have concurrent restoration periods (ca. 45–20 Ma, depending on transect), peak over-lap magnitudes may decrease as shortening is restored in adjacent zones and the area between polygons increases. In terms of improving the kinematic model by including fault-parallel displacements to minimize the overlap area, the location and time of overlap is as important as the magnitude. However, changes in a physio-graphic region’s overlap magnitude between time steps can reveal if imposing out-of-plane motions actually improves kinematic compat-ibility or if it simply transfers incompatibilities to other regions. To summarize the results of each reconstruction, we report the total overlap from the fi nal time step as the total kinematic
incompatibility and use it to compare recon-struction results. For regions with imposed fault-parallel displacements, local overlap magnitudes (overlap within a physiographic region of a transect) are compared at individ-ual time steps to analyze whether out-of-plane movement resolves or redistributes kinematic incompatibility.
The magnitude of overlap area produced in a reconstruction using only plane-strain res-toration constraints provides a benchmark for determining relative improvement in kinematic compatibility with increasing kinematic com-plexity (Fig. 7). Without rotation or fault-par-allel displacements, the total kinematic incom-patibility at the fi nal stage of the restoration is 14,160 km2. Of the total overlap, the majority (11,400 km2, 80%) results from the intersection of the southwest-directed restoration path of the core with the west-directed south limb restora-tion path. No kinematic incompatibilities arose in the north limb. There are secondary regions of kinematic incompatibility in the orocline core
that peak prior to the fi nal time step due to the sequence of restoration. SA overlap (1000 km2) peaks at 15 Ma and the EC overlap (2500 km2) peaks at 25 Ma (Fig. 8A). These kinematically incompatible areas at the orocline core are due to internal changes in structural trend that are not found in either of the limbs (Fig. 7).
The minimum limb rotation (±7°) recon-struction (Fig. 9) results in substantially less kinematic incompatibility with the fi nal mag-nitude of overlap dropping to 5300 km2, >60% less overlap area than the plane-strain model (Fig. 8B). The regional reduction in overlap magnitude is largely due to the inclusion of limb rotation, which alters the limb displace-ment paths so that they are closer to parallel. Kinematic compatibility was further improved by imposing ~90 km of south-directed, fault-parallel slip along the RNF over 50–0 Ma to eliminate overlap between the core and south limb EC in transect 4 (Fig. 9; Table 2). However at the local scale, propagating slip on the RNF into the southern limb increases EC overlap in transects 5 and 6 (Figs. 4 and 9). As a result the greatest total overlap (~7000 km2) occurs at 25–20 Ma as the RNF propagates south, but this overlap subsequently decreases as the southern limb EC is restored (Fig. 8B). Over-all, the reduction in overlap from the plane-strain model outweighs any local increases, but the introduction of localized kinematic incompatibilities in the south limb from RNF slip indicates that it may not be kinematically viable for the fault to accommodate ~90 km of north-south slip. Instead, larger limb rotations and/or the inclusion of slip on the CF may be required to resolve the incompatibility of the core and southern limb displacement direc-tions. The kinematic incompatibilities within the orocline core show no reduction in the IA and SA but are reduced in the EC (Fig. 8B). This is because the northwest-southeast–trend-ing EC structures are allowed to rotate with the north limb from 15 to 0 Ma whereas the IA and SA do not rotate. IA and SA overlap at the core both peak at 15 Ma, then IA overlap decreases as deformation is restored from 20 Ma onward (Figs. 4B and 9).
Increasing the magnitude of limb rotation to the upper permissible limit of ~13° further improves kinematic compatibility (Fig. 10) with a fi nal overlap area of 3200 km2, an ~80% decrease over the fi nal overlap in the plane-strain model (Fig. 8C). With the larger limb rotations, ~45 km of north-south slip on the RNF was required to resolve kinematic incompatibilities between the core and southern limb, roughly half the magnitude required by the minimum limb rotation model (Table 2). Lower RNF displacement also introduced less kinematic
RNF
65°W66°W
18
°S
0 20 4010km
5329 km
73 km
Elevation
CFSA
IA
IA
EC
EC
EC
Figure 6. Digital elevation model of the orocline core region (ASTER 30m; Advanced Space-borne Thermal Emission and Refl ection Radiometer, 30 m resolution). The mapped loca-tions of the Cochabamba (CF) and Rio Novillero (RNF) faults are shown in red. Major thrust faults are shown in black to show the changes in fault vergence direction across the RNF. Earthquake focal mechanisms from Dewey and Lamb (1992) are shown in black. The focal mechanism for the 1998 Aiquile Mw 6.6 earthquake is shown in red. InSAR (interfero-metric synthetic aperture radar) preferred fault-plane solution is right-lateral offset (Fun-ning et al., 2005). EC—Eastern Cordillera; IA—Interandes; SA—Subandes.
as doi:10.1130/GES01064.1Geosphere, published online on 11 March 2015
Bolivian orocline reconstruction
Geosphere, April 2015 9
5 M
a
02
00
40
0k
m
10
Ma
15
Ma
20
Ma
25
Ma
30
Ma
35
Ma
40
Ma
45
Ma
50
Ma
20° S15° S6
5°
W
20° S15° S
65
° W
Fig
ure
7. P
lane
-str
ain
reco
nstr
ucti
on r
esul
ts.
Bla
ck r
egio
ns i
ndic
ate
kine
mat
ical
ly
inco
mpa
tibl
e ov
erla
ppin
g ar
eas
No
rota
tion
or
stri
ke f
ault
ing
is a
pplie
d. C
olor
cod
ing
as in
Fig
ure
4A. L
atit
ude
and
long
itud
e at
5 M
a an
d 50
Ma
are
inte
nded
as
a ge
nera
l re
fere
nce
for
area
and
pos
itio
n ch
ange
onl
y.
as doi:10.1130/GES01064.1Geosphere, published online on 11 March 2015

Eichelberger and McQuarrie
10 Geosphere, April 2015
incompatibility in the south limb, as shown by peak south limb EC overlap of 1300 km2 at 20 Ma (Fig. 8C) compared to ~3000 km2 at 35 Ma in the minimum rotation model (Fig. 8B). Overall, the larger limb rotations greatly improved the kinematic compatibility of the core and southern limb while reducing the
magnitude of slip required on the RNF, and by extension, the magnitude of overlap introduced in the southern limb. Within the orocline core, local kinematic incompatibilities related to changes in structural orientation remain unre-solved in this model. The total overlap area for the maximum rotation model peaked at 15 Ma
(~4400 km2), at which time incompatibilities in the core IA and SA account for ~60% (2560 km2) of the total overlap area (Fig. 8C). The next largest overlap component at 15 Ma is related to north-south slip on the RNF in the south limb EC (~1200 km2) and composes 30% of the total 15 Ma overlap (Fig. 8C). Further improving the kinematic compatibility of the reconstruc-tion will require a solution that can account for the changes in structural trend at the orocline core and further reduce the amount of RNF slip required to mitigate overlap between the south-ern limb and orocline core.
DISCUSSION
Overall, the maximum rotation model had the lowest magnitude of overlap at every time step (Fig. 8C) and imposed far lower strike-slip displacements on the RNF. Regional limb rotation resulted in displacement paths that were closer to parallel, resolving many of the regional incompatibilities related to intersect-ing plane-strain shortening directions (Fig. 11). In turn, this reduced the magnitude of fault-parallel displacement interpreted at the orocline core in order to resolve kinematic incompati-bility between the core and southern limb. We believe that this indicates that at least ~13° of rotation in both limbs is required to achieve greatest degree of kinematic compatibility in a reconstruction with the current constraints available. This is slightly larger than the 5°–10° of rotation estimated by Kley (1999), but agrees with GPS rotation magnitudes extrapolated over the 15–0 Ma SA deformation window (Allmendinger et al., 2005). For the region of the fold-thrust belt covered by this reconstruc-tion (14.6°S–22.5°S), 13° limb rotations used are within the range of solutions proposed by Arriagada et al. (2008).
Preferred Model
Even in the maximum rotation model, local-ized areas of overlap persist at the orocline axis despite the regional improvement in kinematic compatibility. In addition, introduced kinematic incompatibility related to slip on the RNF in the southern limb suggests that large right-lateral offsets may not be viable there. The CF was considered fi xed for the minimum and maxi-mum rotation models, but may have accommo-dated transpressional deformation based on its oblique orientation relative to the surrounding EC structural fabric (Fig. 6). Further refi ning the core kinematics to reduce the remaining over-laps beyond the available constraints can resolve local incompatibilities as well as elucidate the role of the CF in accommodating deformation at the core.
0
1
5
10
15Plane Strain
Ov
erl
ap
Are
a (
10
3 k
m2)
Total overlap
IA overlap
EC overlap
SA overlap
Southern limb
Northern limb
A
0
1
2
3
4
5
6
7Minimum Rotation
B
5 10 15 20 25 30 35 40 45 500
1
2
3
4
5Maximum Rotation
Time (Ma)
C
Figure 8. Plot of overlap area at each time step. (A) Plane-strain model. (B) Minimum rotation model. (C) Maximum rotation model. Shapes correspond to each physiographic region, colors indicate position in the orocline. The northern limb is not included because no over-lap occurs there. EC—Eastern Cordillera; IA—Interandes; SA—Subandes.
as doi:10.1130/GES01064.1Geosphere, published online on 11 March 2015

Bolivian orocline reconstruction
Geosphere, April 2015 11
5 M
a
02
00
40
0k
m
10
Ma
15
Ma
20
Ma
25
Ma
30
Ma
40
Ma
35
Ma
45
Ma
50
Ma
20° S15° S
65
° W
20° S15° S
65
° W
Fig
ure
9. M
inim
um r
otat
ion
reco
nstr
ucti
on r
esul
ts.
The
nor
ther
n an
d so
uthe
rn l
imb
rota
te 7°.
At
the
core
, the
nor
thw
est-
sout
heas
t–tr
endi
ng s
truc
ture
s of
the
Eas
tern
Cor
-di
llera
rot
ate
wit
h th
e no
rthe
rn li
mb,
the
IA
—In
tera
ndes
and
Sub
ande
s re
mai
n fi x
ed.
Nor
th-s
outh
slip
is a
pplie
d to
the
Rio
Nov
iller
o fa
ult (
see
faul
t loc
atio
n in
Fig
. 4A
). L
ati-
tude
and
long
itud
e at
5 M
a an
d 50
Ma
are
inte
nded
as
a ge
nera
l ref
eren
ce f
or a
rea
and
posi
tion
cha
nge
only
. Col
or c
odin
g is
as
in F
igur
e 4A
.
as doi:10.1130/GES01064.1Geosphere, published online on 11 March 2015

Eichelberger and McQuarrie
12 Geosphere, April 2015
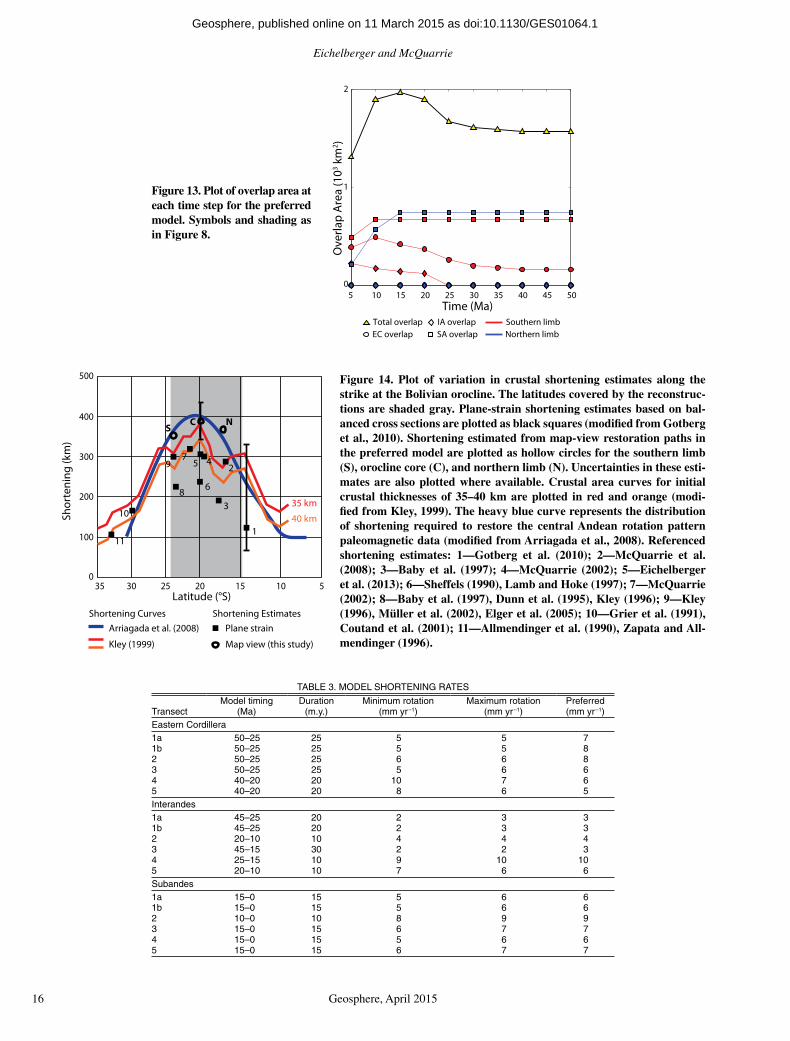
To investigate these possibilities, we present an additional, preferred model that builds on the results from the maximum rotation model (Fig. 12). For the orocline limbs, displacement mag-nitude, limb rotation, and timing are all kept the same. At the orocline core we prescribe SA rota-tion to be equivalent to limb rotation magnitudes and impose small rotations in the core IA and EC as well as fault-parallel offsets on the CF to resolve remaining internal core overlaps. As with the EC, northwest-southeast–trending SA fault blocks rotate with the northern limb while more north-south–trending SA blocks rotate with the southern limb (dashed rotation lines, Fig. 4A). The fi nal overlap with these adjustments is ~1600 km2 with a peak overlap of 1900 km2 at 15 Ma for a ~50% reduction in peak and fi nal over-lap from the maximum rotation model (Fig. 13).
By allowing the core SA to rotate the full magnitude of limb rotation, the internal overlap decreases slightly from 900 km2 to 700 km2. Slight differences in the structural orientation of the SA in the core and southern limb result in a shift of some SA overlap to the southern limb, increasing overlap from <100 km2 in the maximum rotation model to ~600 km2. The total magnitude of SA overlap remains similar (1400 km2 compared to 1000 km2 in the maxi-mum rotation model), indicating that the internal SA overlap was redistributed southward (Fig. 13). The remaining SA kinematic incompatibil-ity at the core is related to the gradual change in SA structural orientation in the area, implying local, nonparallel displacement directions (Fig. 4A). A possible solution would be small but dis-
tributed fault-parallel displacements along the north-south–trending SA structures, similar to the model of Kley (1999).
As with the fi rst two models, northwest-southeast–trending EC blocks defi ned by struc-tures west of the RNF rotated with northern limb but at a lower magnitude (~5° instead of 13°; Fig. 4A). The EC and IA structures east of the RNF had no defi ned rotation in the fi rst two models, but here are rotated ~5° with the southern limb based on their close alignment with the north-south southern limb fabric. In effect, the RNF becomes a rotational boundary that accommodates transpression related to the counter rotation of the two structural domains. By allowing the north-south EC and IA struc-tures at the core to counter rotate, we resolve all the internal core overlap related to the east to west change in structural orientation between the SA, IA, and EC (cf. IA overlap in Figs. 8C and 13). Slip along the CF was applied to accommodate both the counter rotation of the northwest-southeast and north-south structural domains and shortening within the IA at the orocline core. By allowing ~50 km of left-lat-eral CF slip over 25–0 Ma (Table 2), kinematic incompatibility between the EC at the orocline core and the southern limb was largely elimi-nated. This is equivalent to the magnitude of right-lateral RNF slip from the maximum rota-tion model, but has the advantage of not produc-ing additional overlap in the limbs. The majority of orogen-parallel strike-slip motion occurs on the CF in this model while the RNF accommo-dates <10 km of right-lateral motion.
Transpressional Deformation
In the preferred model the RNF and CF behave as a conjugate fault system (Dewey and Lamb, 1992). However, rather than accommo-dating purely strike-slip motion, the reconstruc-tion suggests that both accommodated out-of-plane transpressional deformation that was not previously recognized (Fig. 12). For the RNF, the preferred model estimates ~40–50 km of strike-normal shortening, which we have dis-tributed across 4 fault blocks between the RNF and the IA-EC boundary over 25–15 Ma and concentrated along the RNF trace from 15 to 0 Ma (Table 2). The preferred model estimates ~60–70 km of strike-normal shortening on the CF from 45 to 0 Ma (Table 2). This amount of shortening is a function of how the IA is restored at the orocline core from 45 to 15 Ma, but is currently not accounted for in shorten-ing estimates in the region. Less than 20 km of CF shortening occurred from 15 to 0 Ma, because the IA and EC were inactive. As a result, motion on the CF was dominated by the strike-slip displacements imposed to resolve kinematic incompatibility. The geologic map patterns for both faults (McQuarrie, 2002; Eichelberger et al., 2013) do not rule out the possibility of signifi cant shortening, but most thrust faults in the central Andes have offsets <15 km (e.g., McQuarrie, 2002). This suggests that transpression is most likely distributed over several structures rather than localized to the degree modeled here. The CF region has higher structural elevations and deeper exposed
TABLE 2. COMPARISON OF SHORTENING MAGNITUDES
TransectSA
Shortening(km)IA EC
AP
Total map-view shortening
(km)CF slip(km)
Timing(Ma)
RNF slip(km)
Timing(Ma)
Additional map-view shortening
(km)Total shortening
difference(km)CS MV CS MV CS MV RNF CF SA
Minimum rotation model1a 66 77 48 48 123 125 40 290 0 N.A. 0 N.A. 0 0 11 131b 66 78 48 48 123 123 40 289 0 N.A. 0 N.A. 0 0 12 122 71 80 39 39 142 142 47 308 0 N.A. 0 N.A. 0 0 9 93 86 86 43 45 136 136 47 214 0 N.A. 0 N.A. 0 0 0 24 67 76 96 94 122 200 41 411 0 N.A. 90 50–0 78 0 9 855 78 87 62 70 95 166 41 364 0 N.A. 90 50–0 71 0 9 88Maximum rotation model1a 66 90 48 50 123 125 40 305 0 N.A. 0 N.A. 0 0 24 281b 66 95 48 50 123 123 40 308 0 N.A. 0 N.A. 0 0 29 312 71 90 39 37 142 138 47 312 0 N.A. 0 N.A. 0 0 19 133 86 87 43 45 136 140 47 319 0 N.A. 0 N.A. 0 0 1 74 67 85 96 95 122 146 41 367 0 N.A. 50 50–0 24 0 18 415 78 100 62 60 95 120 41 321 0 N.A. 50 50–0 25 0 22 45Preferred model1a 66 90 48 50 123 186 40 366 50 25–0 0 N.A. 0 63 24 891b 66 90 48 50 123 190 40 370 50 25–0 0 N.A. 0 67 24 932 71 90 39 97 142 210 47 384 50 25–0 0 N.A. 0 68 19 853 86 105 43 80 136 158 47 390 0 N.A. <10 15–0 59 0 19 784 67 83 96 97 122 125 41 346 0 N.A. <10 15–0 3 0 16 205 78 100 62 61 95 100 41 302 0 N.A. <10 15–0 5 0 22 26
Note: SA—Subandes; IA—Interandes; EC—Eastern Cordillera; AP—Altiplano; CF—Cochabamba fault, left-lateral slip; RNF—Rio Novillero fault, right-lateral slip; CS—cross-section shortening; MV—map view shortening; N.A.—not applicable, no fault slip applied.
as doi:10.1130/GES01064.1Geosphere, published online on 11 March 2015

Bolivian orocline reconstruction
Geosphere, April 2015 13
5 M
a
20° S15° S
65
° W
02
00
40
0k
m
10
Ma
15
Ma
20
Ma
25
Ma
30
Ma
35
Ma
40
Ma
45
Ma
50
Ma
20° S15° S
65
° W
Fig
ure
10. M
axim
um r
otat
ion
reco
nstr
ucti
on r
esul
ts. T
he n
orth
ern
and
sout
hern
lim
b ro
tate
13°
. A
t th
e co
re,
the
nort
hwes
t-so
uthe
ast–
tren
ding
str
uctu
res
of t
he E
aste
rn
Cor
dille
ra r
otat
e w
ith
the
nort
hern
lim
b, t
he I
nter
ande
s an
d Su
band
es r
emai
n fi x
ed.
Nor
th-s
outh
slip
is
appl
ied
to t
he R
io N
ovill
ero
faul
t (s
ee f
ault
loc
atio
n in
Fig
. 4A
).
Lat
itud
e an
d lo
ngit
ude
at 5
Ma
and
50 M
a ar
e in
tend
ed a
s a
gene
ral r
efer
ence
for
area
an
d po
siti
on c
hang
e on
ly. C
olor
cod
ing
is a
s in
Fig
ure
4A.
as doi:10.1130/GES01064.1Geosphere, published online on 11 March 2015

Eichelberger and McQuarrie
14 Geosphere, April 2015
stratigraphy than the RNF region, consistent with localized shortening. The CF also fea-tures large transtensional basins with 2–3 km of relief, indicating nontrivial offsets along the fault. Comparatively, the RNF has only minor topographic expression and is largely defi ned by the change in structural orientation across the apparent fault trace.
The CF and RNF are both located within the EC, which is restored over 50–25 Ma in this reconstruction (Fig. 12). As such, the transpres-sional displacements applied to the faults over 20–0 Ma in the preferred model represent out-of sequence deformation relative to the period of deformation interpreted from thermochronol-ogy and geologic constraints. Apatite fi ssion track cooling ages from the region indicate the time at which the rocks were exhumed to ~110 ± 10 °C (Gallagher et al., 1998). As a result, later phases of deformation may not be resolved well, especially if the structures in question were not sampled in detail, or accompanied by signifi cant exhumation. The geologic constraints that led us to terminate EC deformation (Gillis et al., 2006; Horton, 2005) do not strictly prohibit localized deformation in the vicinity of the RNF or CF. Modern seismicity indicates that both faults continue to accommodate strike-slip displace-ments on nearly vertical fault planes (Fig. 6), but the available focal mechanisms do not indicate active thrust faulting (Dewey and Lamb, 1992; Funning et al., 2005). From 5 to 0 Ma in the preferred model, the CF and RNF accommodate 5–10 km of fault-parallel slip, but negligible strike-normal shortening (<5 km; see 5 Ma time step in Figs. 10 and 12), consistent with modern seismicity.
Map-View Shortening Implications
Both the maximum rotation and preferred reconstructions demonstrate that out-of-plane displacements are critical to obtaining the most self-consistent reconstruction with the avail-able kinematic constraints. Regional limb rota-tions and transpressional deformation focused at the orocline core have the combined effect of increasing shortening estimates (Pueyo et al., 2004) over previously published 2-D plane-strain estimates alone (e.g., Müller et al., 2002; McQuarrie, 2002). The preferred model estimates ~340 km of shortening at the oro-cline axis, compared to ~270 km estimated by cross section alone (Eichelberger et al., 2013). The ~70 km of additional map-view shorten-ing at the core is due to the combined effect of transpressional shortening (~50 km) at the RNF and ~20 km of additional SA shortening due to the imposed curved slip paths from limb rota-tion. Including Altiplano shortening (~40 km; McQuarrie, 2002) and the shortening estimate error at the orocline axis (~15%; Eichelberger et al., 2013), total map-view shortening at the orocline axis would be 380 ± 50 km. Total map-view shortening for both orocline limbs is also higher compared to published plane-strain estimates (Fig. 14). For the northern limb, the preferred model predicts ~370 km compared to ~280–300 km (McQuarrie, 2002; McQuarrie et al., 2008). There, the 70–90 km increase is due to ~20 km of additional SA shortening imposed by rotation and ~60–70 km of transpressional shortening along the CF (Table 2). In the southern limb the preferred model predicts ~300–350 km of shortening compared to ~280–330 km (Dunn et al., 1995; Kley, 1996; McQuarrie, 2002; Müller et al., 2002). The ~20 km increase in southern limb shortening is related to SA rotation because RNF offset is negligible in the preferred model.
Shortening rate ranges predicted by the mod-els are 5–10 mm yr–1 in the EC, 2–4 mm yr–1 in the northern and central IA, 6–10 mm yr–1 in the southern IA, and 5–9 mm yr–1 in the SA (Table 3). The predicted shortening rate during EC deformation (ca. 50–20 Ma) are consistent with rates calculated from balanced cross sec-tions (Barnes et al., 2008; McQuarrie et al., 2008) but are at the upper end the 0–8 mm yr–1 rate proposed for early ca. 45–30 Ma EC defor-mation in southernmost Bolivia (Oncken et al., 2006) (transect 5, Fig. 4A). SA shortening rates from 15 to 0 Ma in the models are also simi-lar to cross-section shortening rates, but lower than the 9–16 mm yr–1 SA rates from 10 to 0 Ma proposed by Oncken et al. (2006). Although the modeled shortening rates do not consider short-term (<5 m.y.) fl uctuations, the modeled 5–9
mm yr–1 SA rate is more consistent with Qua-ternary shortening rates of 7–10 mm yr–1 (Echa-varria et al., 2003; Uba et al., 2009). The maxi-mum rotation and preferred models impose limb rotations similar to GPS data (Allmendinger et al., 2005) and predict average SA shortening rates of 6–9 mm yr–1, at the low end of 9–13 mm yr–1 GPS rates from the southern SA (Brooks et al., 2011).
In the minimum rotation model SA shorten-ing is 5–10 km greater than cross-section esti-mates and 20–25 km greater in the maximum rotation and preferred models (Table 2). At face value, the preferred model estimates increase the SA shortening differential between south-ern Peru to the orocline axis to 88 km (based on 17 km of SA shortening; Gotberg et al., 2010), corresponding to ~6° rotation for the northern limb. Between the axis and northern Argentina, the predicted differential is 45 km (60 km of SA shortening; Echavarria et al., 2003), corre-sponding to ~5° of rotation. In both cases, this represents slightly less than half the total rota-tion imposed in the model (~13°). If curved SA slip paths accommodated limb rotation as mod-eled, regional bending unassociated with short-ening may be partially responsible for modern orogenic curvature. Alternatively, if SA cross-section shortening estimates represent the total SA displacement fi eld, only ~3°–5° of rotation can be attributed to an SA shortening gradient (Eichelberger et al., 2013), while the remain-ing 8°–10° would be related to regional bend-ing. Ultimately, the models indicate that ~13° of limb rotation produces the most kinematically viable reconstructions, but the relative rotational contributions of differential shortening, curved slip paths, and regional bending are uncertain.
At the orocline axis, predicted map-view shortening from the preferred model is equiva-lent, within error, to the 400 km shortening esti-mate modeled by restoring the central Andean rotation pattern paleomagnetic data (Arriagada et al., 2008) (Fig. 14). Both rotationally modeled and plane-strain shortening estimates have been used to estimate crustal thickness based on cross-section area (e.g., Gotberg et al., 2010; Kley and Monaldi, 1998; McQuarrie, 2002). The recon-structions presented here suggest that the out-of-plane contribution to shortening may be as high as ~90 km. The map-view shortening estimates for both limbs and the orocline axis exceed the magnitude required to account for the modern cross-sectional area (Fig. 14) without requiring signifi cant additional shortening in the forearc. As a result, shortening at the orocline may be suffi cient to account for, and even exceed, mod-ern crustal thickness. From a crustal budget per-spective, this opens the possibility that crustal material may have been transferred by lower
Minimum Rotation
Scenario
S: 262°
N: 237°φ = 25°
e ≈ s/2
s1
s2
N: 243°
S: 256°
φ = 13°
e ≈ s/5
Maximum Rotation
Scenario
s1
s2
φ
e
s1
s2
φs
1
e
s2
Figure 11. Schematic diagram of the effect of accounting for rotation on plane-strain displacement paths (see text and Fig. 2). As displacement paths rotate closer to parallel (larger limb rotations), the mag-nitude of predicted overlap decreases (as shown in Fig. 2A).
as doi:10.1130/GES01064.1Geosphere, published online on 11 March 2015

Bolivian orocline reconstruction
Geosphere, April 2015 15
5 M
a
02
00
40
0k
m
10
Ma
15
Ma
20
Ma
25
Ma
30
Ma
35
Ma
40
Ma
45
Ma
50
Ma
20° S15° S
65
° W
20° S15° S
65
° W
Fig
ure
12. P
refe
rred
rec
onst
ruct
ion
resu
lts.
The
nor
ther
n an
d so
uthe
rn l
imb
rota
te 1
3°.
At
the
core
, th
e no
rthw
est-
sout
heas
t–tr
endi
ng s
truc
ture
s of
the
E
aste
rn C
ordi
llera
rot
ate
wit
h th
e no
rthe
rn li
mb
(13°
), t
he I
nter
ande
s ro
tate
w
ith
the
sout
hern
lim
b bu
t at
a l
ower
mag
nitu
de (
–4°)
, an
d th
e Su
band
es
rota
te t
he s
ame
mag
nitu
de a
s th
e so
uthe
rn li
mb
(–13°)
. Wes
t-no
rthw
est–
east
-so
uthe
ast
slip
is
appl
ied
to t
he C
ocha
bam
ba f
ault
and
min
imal
nor
th-s
outh
sl
ip i
s ap
plie
d to
the
Rio
Nov
iller
o fa
ult
(see
fau
lt l
ocat
ions
in
Fig
. 4A
). L
ati-
tude
and
long
itud
e at
5 M
a an
d 50
Ma
are
inte
nded
as
a ge
nera
l ref
eren
ce f
or
area
and
pos
itio
n ch
ange
onl
y. C
olor
cod
ing
is a
s in
Fig
ure
4A.
as doi:10.1130/GES01064.1Geosphere, published online on 11 March 2015
Eichelberger and McQuarrie
16 Geosphere, April 2015
5 10 15 20 25 30 35 40 45 50
0
1
2
Time (Ma)
Total overlap IA overlap
EC overlap SA overlap
Southern limb
Northern limbO
ve
rla
p A
rea
(1
03 k
m2)
500
400
300
200
100
035 30 25 20 15 10 5
11
10
86
3
1
25
79 4
NCS
35 km
40 km
Latitude (°S)
Sh
ort
en
ing
(k
m)
Arriagada et al. (2008)
Kley (1999)
Shortening Curves Shortening Estimates
Plane strain
Map view (this study)
Figure 13. Plot of overlap area at each time step for the preferred model. Symbols and shading as in Figure 8.
Figure 14. Plot of variation in crustal shortening estimates along the strike at the Bolivian orocline. The latitudes covered by the reconstruc-tions are shaded gray. Plane-strain shortening estimates based on bal-anced cross sections are plotted as black squares (modifi ed from Gotberg et al., 2010). Shortening estimated from map-view restoration paths in the preferred model are plotted as hollow circles for the southern limb (S), orocline core (C), and northern limb (N). Uncertainties in these esti-mates are also plotted where available. Crustal area curves for initial crustal thicknesses of 35–40 km are plotted in red and orange (modi-fi ed from Kley, 1999). The heavy blue curve represents the distribution of shortening required to restore the central Andean rotation pattern paleomagnetic data (modifi ed from Arriagada et al., 2008). Referenced shortening estimates: 1—Gotberg et al. (2010); 2—McQuarrie et al. (2008); 3—Baby et al. (1997); 4—McQuarrie (2002); 5—Eichelberger et al. (2013); 6—Sheffels (1990), Lamb and Hoke (1997); 7—McQuarrie (2002); 8—Baby et al. (1997), Dunn et al. (1995), Kley (1996); 9—Kley (1996), Müller et al. (2002), Elger et al. (2005); 10—Grier et al. (1991), Coutand et al. (2001); 11—Allmendinger et al. (1990), Zapata and All-mendinger (1996).
TABLE 3. MODEL SHORTENING RATES
TransectModel timing
(Ma)Duration
(m.y.)Minimum rotation
(mm yr–1)Maximum rotation
(mm yr–1)Preferred(mm yr–1)
Eastern Cordillera7555252–05a18555252–05b18665252–0526655252–05367010202–0445680202–045
Interandes3320252–54a13320252–54b14440101–0223220351–543010190151–5246670101–025
Subandes665510–51a1665510–51b1998010–012776510–513665510–514776510–515
as doi:10.1130/GES01064.1Geosphere, published online on 11 March 2015

Bolivian orocline reconstruction
Geosphere, April 2015 17
crustal fl ow or removed entirely via delamina-tion events. Enhanced lithospheric thickening related to orocline formation has been linked to delamination in the Cantabrian orocline of north-ern Iberia (Gutiérrez-Alonso et al., 2004).
CONCLUSIONS
The map-view reconstructions presented here integrate plane-strain shortening estimates, structural orientations, paleomagnetic rotations, and deformation timing constraints from ther-mochronology and geology into 3-D kinematic models for the Bolivian orocline. These models indicate that material displacements parallel to orogenic trend are critical to produce kinemati-cally viable orocline reconstructions. In particu-lar, out-of-plane displacements are largely the result of convergent orocline limb rotations that are accommodated at the orocline core by strike-slip and transpressional faulting. Overall, the reconstructed displacement fi eld suggests that map-view shortening estimates may account for, or even exceed, modern crustal thickness at the central Andes. In general, plane-strain stud-ies of deformation (such as balanced cross sec-tions) in areas of orogenic curvature only record a portion of the total orogenic displacement fi eld. Here, map-view shortening estimates from the reconstruction may exceed those required to account for modern crustal thicknesses. If cor-rect, this suggests that formation of the Bolivian orocline contributed to localized crustal thicken-ing and lower crustal loss proposed to explain rapid surface uplift in the Altiplano.
Our main conclusions are as follows.1. By accounting for limb rotation, kinematic
compatibility as measured by map-view overlap was drastically improved over a reconstruction with no rotation (plane-strain model). North-south displacements on the strike-slip RNF fur-ther reduced kinematic incompatibilities at the orocline core. Final overlap in the plane-strain reconstruction was ~14,000 km2 compared to ~5000 km2 in the minimum rotation model (6°), and ~3000 km2 in the maximum rotation model (13°). The minimum rotation model predicted ~90 km of strike-slip displacement on the RNF fault while the maximum rotation model pre-dicted ~45 km of slip.
2. We developed a third, preferred model based on the maximum rotation model. The preferred model includes minor rotations at the orocline core and slip on both the RNF and CF, resulting in ~1600 km2 of fi nal overlap. This model applied ~50 km of left-lateral slip on the CF and <10 km of slip on the RNF. Imposed transpressional deformation predicted ~60–70 km of additional strike-normal shortening in the vicinity of the CF and ~50 km of shortening
near the RNF. The model predicts that some of this shortening occurs after the main phase of deformation in the EC (before 25 Ma) where the faults are located.
3. In the preferred model, the combined effect of limb rotation and transpressional deforma-tion produces map-view shortening estimates that are greater than in cross-section shorten-ing estimates. Map-view shortening predicted by the preferred model is ~370 km in the northern limb, ~380 km at the orocline core, and 320–340 km in the southern limb. Lower shortening estimates are predicted for the southern limb because transpressional short-ening is limited to the orocline core and north-ern limb. The 70–90 km increase in shortening in the northern limb and orocline core is the result of 60–70 km of transpressional shorten-ing and ~20 km of additional SA shortening due to curved slip paths.
4. Increases in SA shortening due to the curved slip paths imposed in the model would result in 5°–6° of limb rotation due to differ-ential shortening between southern Peru, the orocline core, and northern Argentina. This is slightly less than half the total rotation applied in the preferred model, suggesting that regional bending may be a factor. If limb rotation is not the result of curved slip as modeled here, 8°–10° of the total 13° limb rotations required for kine-matic compatibility would have to be the result of regional bending.
5. Map-view shortening at the orocline axis is predicted to be 380 ± 50 km. This value exceeds the magnitude required to account for modern cross-section area of the crust. This suggests that deformation at the orocline may be suffi cient to account for the modern crustal thickness without signifi cant additional short-ening in the forearc. This opens the possibil-ity that any excess may have been transferred along strike by lower crustal fl ow or removed from the system entirely by processes such as delamination.
ACKNOWLEDGMENTS
We thank Stephen Johnston and an anonymous reviewer for their feedback and insightful comments on the initial version of this paper. Early versions of the reconstructions benefi tted from discussions with Carmala Garzione, Laura Wagner, Todd Ehlers, Susan Beck, George Zandt, Brian Horton, Chris Poulsen, and their respective students. These inter-actions took place at workshops organized as part of the Central Andean Geodynamics and High Topog-raphy (CAUGHT) project funded by the National Science Foundation (NSF grant EAR-0908972 to McQuarrie). Blair Schoene provided comments on an early version of the manuscript. Melissa Brenneman created the original ArcGIS (geographic information system) script that produced the recon-structions shown here.
REFERENCES CITED
Allmendinger, R.W., Figueroa, D., Snyder, D.B., Beer, J., Mpodozis, C., and Isacks, B.L., 1990, Foreland shortening and crustal balancing in the Andes at 30°S latitude: Tectonics, v. 9, p. 789–809, doi :10 .1029 /TC009i004p00789 .
Allmendinger, R.W., Smalley, R., Jr., Bevis, M., Caprio, H., and Brooks, B., 2005, Bending the Bolivian orocline in real time: Geology, v. 33, p. 905–908, doi :10 .1130 /G21779 .1 .
Arriagada, C., Roperch, P., Mpodozis, C., and Fernandez, R., 2006, Paleomagnetism and tectonics of the south-ern Atacama Desert (25–28°S), northern Chile: Tecton-ics, v. 25, TC4001, doi :10 .1029 /2005TC001923 .
Arriagada, C., Roperch, P., Mpodozis, C., and Cobbold, P.R., 2008, Paleogene building of the Bolivian Orocline; tec-tonic restoration of the central Andes in 2-D map view: Tectonics, v. 27, TC6014, doi :10 .1029 /2008TC002269 .
Baby, P., Herail, G., Salinas, R., and Sempere, T., 1992, Geometry and kinematic evolution of passive roof duplexes deduced from cross section balancing: Exam-ple from the foreland thrust system of the southern Bolivian Subandean Zone: Tectonics, v. 11, p. 523–536, doi :10 .1029 /91TC03090 .
Baby, P., Rochat, P., Mascle, G., and Herail, G., 1997, Neo-gene shortening contribution to crustal thickening in the backarc of the Central Andes: Geology, v. 25, p. 883–886, doi :10 .1130 /0091 -7613 (1997)025 <0883: NSCTCT>2 .3 .CO;2 .
Barke, R., Lamb, S.H., and MacNiocaill, C., 2007, Late Cenozoic bending of the Bolivian Andes; new paleo-magnetic and kinematic constraints: Journal of Geo-physical Research, v. 112, B01101, doi :10 .1029 /2006JB004372 .
Barnes, J.B., and Ehlers, T.A., 2009, End member models for Andean Plateau uplift: Earth-Science Reviews, v. 97, p. 105–132, doi :10 .1016 /j .earscirev .2009 .08 .003 .
Barnes, J.B., and Heins, W.A., 2009, Plio-Quaternary sedi-ment budget between thrust belt erosion and foreland deposition in the central Andes, southern Bolivia: Basin Research, v. 21, p. 91–109, doi :10 .1111 /j .1365 -2117 .2008 .00372 .x .
Barnes, J.B., Ehlers, T.A., McQuarrie, N., O’Sullivan, P.B., and Pelletier, J.D., 2006, Eocene to recent variations in erosion across the central Andean fold-thrust belt, northern Bolivia; implications for plateau evolution: Earth and Planetary Science Letters, v. 248, p. 118–133, doi :10 .1016 /j .epsl .2006 .05 .018 .
Barnes, J.B., Ehlers, T.A., McQuarrie, N., O’Sullivan, P.B., and Tawackoli, P.B., 2008, Thermochronometer record of central Andean Plateau growth, Bolivia (19.5° S): Tectonics, v. 27, TC3003, doi :10 .1029 /2007TC002174 .
Barnes, J.B., Ehlers, T.A., Insel, N., McQuarrie, N., and Poulsen, C.J., 2012, Linking orography, climate, and exhumation across the central Andes: Geology, v. 40, p. 1135–1138, doi :10 .1130 /G33229 .1 .
Brooks, B.A., and 12 others, 2011, Orogenic-wedge defor-mation and potential for great earthquakes in the cen-tral Andean backarc: Nature Geoscience, v. 4, p. 380–383, doi :10 .1038 /ngeo1143 .
Carey, S.W., 1955, The orocline concept in geotectonics, part I: Royal Society of Tasmania Papers and Proceed-ings, v. 89, p. 255–288.
Coutand, I., Gautier, P., Cobbold, P.R., de Urreiztieta, M., Chauvin, A., Gapais, D., Rossello, E.A., and Lopez-Gammundi, O., 2001, Style and history of Andean deformation, Puna Plateau, northwestern Argentina: Tectonics, v. 20, p. 210–234, doi :10 .1029 /2000TC900031 .
Dahlstrom, C.D.A., 1969, Balanced cross sections: Cana-dian Journal of Earth Sciences, v. 6, p. 743–757, doi: 10 .1139 /e69 -069 .
DeCelles, P.G., and Horton, B.K., 2003, Early to middle Tertiary foreland basin development and the history of Andean crustal shortening in Bolivia: Geological Soci-ety of America Bulletin, v. 115, p. 58–77, doi :10 .1130 /0016 -7606 (2003)115 <0058: ETMTFB>2 .0 .CO;2 .
Dewey, J.F., and Lamb, S.H., 1992, Active tectonics of the Andes, in Oliver, R.A., et al., eds., Andean geodynam-ics: Tectonophysics, v. 205, p. 79–95, doi :10 .1016 /0040 -1951 (92)90419 -7 .
as doi:10.1130/GES01064.1Geosphere, published online on 11 March 2015

Eichelberger and McQuarrie
18 Geosphere, April 2015
Dunn, J.F., Hartshorn, K.G., and Hartshorn, P.W., 1995, Structural styles and hydrocarbon potential of the Subandeanthrust belt of southern Bolivia, in Tankard, A.J., et al., eds., Petroleum basins of South America: American Association of Petroleum Geologist Memoir 62, p. 523–543.
Echavarria, L., Hernández, R., Allmendinger, R., and Reynolds, J., 2003, Subandean thrust and fold belt of northwestern Argentina: Geometry and timing of the Andean evolution: American Association of Petroleum Geologists Bulletin, v. 87, p. 965–985, doi :10 .1306 /01200300196 .
Ege, H., Sobel, E.R., Scheuber, E., and Jacobshagen, V., 2007, Exhumation history of the southern Altiplano plateau (southern Bolivia) constrained by apatite fission-track thermochronology: Tectonics, v. 26, TC1004, doi :10 .1029 /2005TC001869 .
Eichelberger, N., and McQuarrie, N., 2015, Three-dimen-sional (3-D) fi nite strain at the central Andean orocline and implications for grain-scale shortening in oro-gens: Geological Society of America Bulletin, v. 127, p. 87–112, doi :10 .1130 /B30968 .1 .
Eichelberger, N., McQuarrie, N., Ehlers, T.A., Enkelmann, E., Barnes, J.B., and Lease, R.O., 2013, New constraints on the chronology, magnitude, and distribution of deforma-tion within the central Andean orocline: Tectonics, v. 32, p. 1432–1453, doi :10 .1002 /tect .20073 .
Elger, K., Oncken, O., and Glodny, J., 2005, Plateau-style accumulation of deformation; southern Altiplano: Tec-tonics, v. 24, TC4020, doi :10 .1029 /2004TC001675 .
Funning, G.J., Barke, R.M.D., Lamb, S.H., Minaya, E., Parsons, B., and Wright, T.J., 2005, The 1998 Aiquile, Bolivia earthquake; A seismically active fault revealed with InSAR: Earth and Planetary Science Letters, v. 232, p. 39–49, doi :10 .1016 /j .epsl .2005 .01 .013 .
Gallagher, K., Brown, R., and Johnson, C., 1998, Fission track analysis and its applications to geological prob-lems: Annual Reviews in Earth and Planetary Science, v. 26, p. 519–572, doi :10 .1146 /annurev .earth .26 .1 .519 .
Garzione, C.N., Hoke, G.D., Libarkin, J.C., Withers, S., MacFadden, B., Eiler, J., Ghosh, P., and Mulch, A., 2008, Rise of the Andes: Science, v. 320, p. 1304–1307, doi :10 .1126 /science .1148615 .
Gillis, R.J., Horton, B.K., and Grove, M., 2006, Thermo-chronology, geochronology, and upper crustal structure of the Cordillera Real: Implications for Cenozoic exhu-mation of the Central Andean Plateau: Tectonics, v. 25, TC6007, doi :10 .1029 /2005TC001887 .
Gotberg, N., McQuarrie, N., and Caillaux, V.C., 2010, Com-parison of crustal thickening budget and shortening estimates in southern Peru (12–14°S): Implications for mass balance and rotations in the “Bolivian oro-cline”: Geological Society of America Bulletin, v. 122, p. 727–742, doi :10 .1130 /B26477 .1 .
Gregory-Wodzicki, K.M., 2000, Relationships between leaf morphology and climate, Bolivia: Implications for esti-mating paleoclimate from fossil fl oras: Paleobiology, v. 26, p. 668–688, doi :10 .1666 /0094 -8373 (2000)026 <0668: RBLMAC>2 .0 .CO;2 .
Grier, M.E., Salfi ty, J.A., and Allmendinger, R.W., 1991, Andean reactivation of the Cretaceous Salta rift, north-western Argentina: Journal of South American Earth Sciences, v. 4, p. 351–372, doi :10 .1016 /0895 -9811 (91)90007 -8 .
Gutiérrez-Alonso, G., Fernández-Suárez, J., and Weil, A.B., 2004, Orocline triggered lithospheric delamination, in Sussman, A.J., and Weil, A.B., eds., Orogenic curva-ture: Integrating paleomagnetic and structural analy-ses: Geological Society of America Special Paper 383, p. 121–131, doi :10 .1130 /0 -8137 -2383 -3 (2004) 383 [121: OTLD] 2 .0 .CO;2 .
Gutiérrez-Alonso, G., Murphy, B., Fernández-Suárez, J., Weil, A.B., Franco, M.P., and Gonzalo, J.C., 2011, Lithospheric delamination in the core of Pangea: Sm-Nd insights from the Iberian mantle: Geology, v. 39, p. 155–158, doi :10 .1130 /G31468 .1 .
Hindle, H., and Burkhard, M., 1999, Strain, displacement and rotation associated with the formation of curvature on fold belts: The example of the Jura arc: Journal of Structural Geology, v. 21, p. 1089–1101, doi :10 .1016 /S0191 -8141 (99)00021 -8 .
Hindle, D., Kley, J., Oncken, O., and Sobolez, S., 2005, Crustal balance and crustal fl ux from shortening esti-
mates in the Central Andes: Earth and Planetary Sci-ence Letters, v. 230, p. 113–124, doi :10 .1016 /j .epsl .2004 .11 .004 .
Hoke, G.D., and Garzione, C.N., 2008, Paleosurfaces, paleoelevation, and the mechanisms for the late Mio-cene topographic development of the Altiplano pla-teau: Earth and Planetary Science Letters, v. 271, p. 192–201, doi :10 .1016 /j .epsl .2008 .04 .008 .
Horton, B.K., 2005, Revised deformation history of the Central Andes: Inferences from Cenozoic foredeep and intermontane basins of the Eastern Cordillera, Bolivia: Tectonics, v. 24, TC3011, doi :10 .1029 /2003TC001619 .
Horton, B.K. and DeCelles, P.G., 1997, The modern fore-land basin system adjacent to the Central Andes: Geol-ogy, v. 25, p. 895–898.
Isacks, B.L., 1988, Uplift of the Central Andean Plateau and bending of the Bolivian Orocline: Journal of Geo-physical Research, v. 93, p. 3211–3231, doi :10 .1029 /JB093iB04p03211 .
Johnston, S.T., Weil, A.B., and Gutiérrez-Alonso, G., 2013, Oroclines: Thick and thin: Geological Society of America Bulletin, v. 125, p. 643–663, doi :10 .1130 /B30765 .1 .
Kennan, L., Lamb, S.H., and Rundle, C., 1995, K-Ar dates from the Altiplano and Cordillera Oriental of Bolivia: Implications for Cenozoic stratigraphy and tecton-ics: Journal of South American Earth Sciences, v. 8, p. 163–186, doi :10 .1016 /0895 -9811 (95)00003 -X .
Kley, J., 1996, Transition from basement-involved to thin-skinned thrusting in the Cordillera Oriental of south-ern Bolivia: Tectonics, v. 15, p. 763–775, doi :10 .1029 /95TC03868 .
Kley, J., 1999, Geologic and geometric constraints on a kine-matic model of the Bolivian orocline: Journal of South American Earth Sciences, v. 12, p. 221–235, doi :10 .1016 /S0895 -9811 (99)00015 -2 .
Kley, J., and Monaldi, C.R., 1998, Tectonic shortening and crustal thickness in the Central Andes: How good is the correlation?: Geology, v. 26, p. 723–726, doi :10 .1130 /0091 -7613 (1998)026 <0723: TSACTI>2 .3 .CO;2 .
Lamb, S., and Hoke, L., 1997, Origin of the high plateau in the Central Andes, Bolivia, South America: Tectonics, v. 16, p. 623–649, doi :10 .1029 /97TC00495 .
Laubscher, H.P., 1965, Ein kinematisches modell der Jurafal-tung: Eclogae Geologicae Helvetiae, v. 58, p. 232–318.
McQuarrie, N., 2002, The kinematic history of the central Andean fold-thrust belt, Bolivia: Implications for building a high plateau: Geological Society of America Bulletin, v. 114, p. 950–963, doi :10 .1130 /0016 -7606 (2002)114 <0950: TKHOTC>2 .0 .CO;2 .
McQuarrie, N., and Davis, G.H., 2002, Crossing the several scales of strain-accomplishing mechanisms in the hin-terland of the central Andean fold-thrust belt, Bolivia: Journal of Structural Geology, v. 24, p. 1587–1602.
McQuarrie, N., and Wernicke, B.P., 2005, An animated tec-tonic reconstruction of southwestern North America since 36 Ma: Geosphere, v. 1, p. 147–172, doi :10 .1130 /GES00016 .1 .
McQuarrie, N., Horton, B.K., Zandt, G., Beck, S., and DeCelles, P.G., 2005, Lithospheric evolution of the Andean fold-thrust belt, Bolivia, and the origin of the central Andean plateau: Tectonophysics, v. 399, p. 15–37, doi :10 .1016 /j .tecto .2004 .12 .013 .
McQuarrie, N., Barnes, J.B., and Ehlers, T.A., 2008, Geo-metric, kinematic, and erosional history of the central Andean Plateau, Bolivia (15–17°S): Tectonics, v. 27, TC3007, doi :10 .1029 /2006TC002054 .
Müller, J.P., Kley, J., and Jacobshagen, V., 2002, Structure and Cenozoic kinematics of the Eastern Cordillera, southern Bolivia: Tectonics, v. 21, p. 1-1–1-24, doi :10 .1029 /2001TC001340 .
Oncken, O., Hindle, D., Kley, J., Elger, K., Victor, P., and Schemmann, K., 2006, Deformation of the central Andean upper plate system—Facts, fi ction, and con-straints for plateau models, in Oncken, O., et al., eds., The Andes: Active subduction orogeny: Berlin, Springer-Verlag, p. 3–27.
Pardo-Casas, F., and Molnar, P., 1987, Relative motion of the Nazca (Farallon) and South American plates since Late Cretaceous time: Tectonics, v. 6, p. 233–248, doi :10 .1029 /TC006i003p00233 .
Pueyo, E.L., Pocoví, A., Millán, H., and Sussman, A.J., 2004, Map-view models for correcting and calculat-
ing shortening estimates in rotated thrust fronts using paleomagnetic data, in Sussman, A.J., and Weil, A.B., eds., Orogenic curvature: Integrating paleomagnetic and structural analyses: Geological Society of America Special Paper 383, p. 57–71, doi :10 .1130 /0 -8137 -2383 -3 (2004)383 [57: MMFCAC]2 .0 .CO;2 .
Roperch, P., Sempere, T., Macedo, O., Arriagada, C., For-nari, M., Tapia, C., Garcia, M., and Laj, C., 2006, Counterclockwise rotation of late Eocene–Oligocene fore-arc deposits in southern Peru and its signifi cance for oroclinal bending in the central Andes: Tectonics, v. 25, TC3010, doi :10 .1029 /2005TC001882 .
Roperch, P., Carlotto, V., Ruffet, G., and Fornari, M., 2011, Tectonic rotations and transcurrent deforma-tion south of the Abancay defl ection in the Andes of southern Peru: Tectonics, v. 30, TC2010, doi :10 .1029 /2010TC002725 .
Scheuber, E., Mertmann, D., Ege, H., Silva-Gonzalez, P., Heubeck, C., Reutter, K., and Jacobshagen, V., 2006, Exhumation and basin development related to forma-tion of the central Andean Plateau, 21°S, in Oncken, O., et al., eds., The Andes: Active Subduction Orogeny: Berlin, Germany, Springer, p. 285–301.
Schmitz, M., and Kley, J., 1997, The geometry of the central Andean backarc crust: Joint interpretation of cross-section balancing and seismic refraction data: Journal of South American Earth Sciences, v. 10, p. 90–110.
Sempere, T., Herail, G., Oller, J., and Bonhomme, M.G., 1990, Late Oligocene–early Miocene major tectonic crisis and related basins in Bolivia: Geology, v. 18, p. 946–949, doi :10 .1130 /0091 -7613 (1990)018 <0946: LOEMMT>2 .3 .CO;2 .
Sheffels, B.M., 1988, Structural constraints on structural shortening in the Bolivian Andes [Ph.D. thesis]: Cam-bridge, Massachusetts Institute of Technology, 167 p.
Sheffels, B., 1990, Lower bound on the amount of crustal shortening in the central Bolivian Andes: Geology, v. 18, p. 812–815, doi :10 .1130 /0091 -7613 (1990)018 <0812: LBOTAO>2 .3 .CO;2 .
Sheffels, B.M., 1995, Is the bend in the Bolivian Andes an orocline?, in Tankard, A.J., et al., eds., Petroleum basins of South America: American Association of Petroleum Geologists Memoir 62, p. 511–522.
Somoza, R., 1998, Updated Nazca (Farallon)–South Amer-ica relative motions during the last 40 My: Implications for mountain building in the central Andean region: Journal of South American Earth Sciences, v. 11, p. 211–215, doi :10 .1016 /S0895 -9811 (98)00012 -1 .
Sussman, A.J., Pueyo, E.L., Chase, C.G., Mitra, G., and Weil, A.B., 2012, The impact of vertical-axis rotations on shortening estimates: Lithosphere, v. 4, p. 383–394, doi :10 .1130 /L177 .1 .
Wigger, P.J., Schmitz, M., Araneda, M., Asch, G., Bald-zuhn, S., Giese, P., Heinsohn, W.-D., Martínez, E., Ricaldi, E., Röwer, P., and Viramonte, J., 1994, Varia-tion in the crustal structure of the southern Central Andes deduced from seismic refraction investigations, in Reutter, K. J., et al., eds., Tectonics of the Southern Central Andes: Structure and Evolution of an Active Continental Margin: Springer, New York, p. 23–48.
Uba, C.E., Heubeck, C., and Hulka, C., 2005, Facies analy-sis and basin architecture of the Neogene Subandean synorogenic wedge, southern Bolivia: Sedimentary Geology, v. 180, p. 91–123, doi :10 .1016 /j .sedgeo .2005 .06 .013 .
Uba, C.E., Heubeck, C., and Hulka, C., 2006, Evolution of the late Cenozoic Chaco foreland basin, southern Bolivia: Basin Research, v. 18, p. 145–170, doi :10 .1111 /j .1365 -2117 .2006 .00291 .x .
Uba, C.E., Kley, J., Strecker, M.R., and Schmitt, A., 2009, Unsteady evolution of the Bolivian Subandean thrust belt: The role of enhanced erosion and clastic wedge progradation: Earth and Planetary Science Letters, v. 281, p. 134–146, doi :10 .1016 /j .epsl .2009 .02 .010 .
Yonkee, A., and Weil, A.B., 2010, Reconstucting the kine-matic evolution of curved mountain belts: Internal strain patterns in the Wyoming salient, Sevier thrust belt, U.S.A.: Geological Society of America Bulletin, v. 122, p. 24–49, doi :10 .1130 /B26484 .1
Zapata, T.R., and Allmendinger, R.W., 1996, Thrust-front zone of the Precordillera, Argentina: A thick-skinned triangle zone: American Association of Petroleum Geologists Bulletin, v. 80, p. 359–381.
as doi:10.1130/GES01064.1Geosphere, published online on 11 March 2015

Geosphere
doi: 10.1130/GES01064.1 published online 11 March 2015;Geosphere
Nathan Eichelberger and Nadine McQuarrie Kinematic reconstruction of the Bolivian orocline
Email alerting servicesarticles cite this article
to receive free e-mail alerts when newwww.gsapubs.org/cgi/alertsclick
Subscribe to subscribe to Geospherewww.gsapubs.org/subscriptions/click
Permission request to contact GSAhttp://www.geosociety.org/pubs/copyrt.htm#gsaclick
official positions of the Society.citizenship, gender, religion, or political viewpoint. Opinions presented in this publication do not reflectpresentation of diverse opinions and positions by scientists worldwide, regardless of their race, includes a reference to the article's full citation. GSA provides this and other forums for thethe abstracts only of their articles on their own or their organization's Web site providing the posting to further education and science. This file may not be posted to any Web site, but authors may postworks and to make unlimited copies of items in GSA's journals for noncommercial use in classrooms requests to GSA, to use a single figure, a single table, and/or a brief paragraph of text in subsequenttheir employment. Individual scientists are hereby granted permission, without fees or further Copyright not claimed on content prepared wholly by U.S. government employees within scope of
Notes
articles must include the digital object identifier (DOIs) and date of initial publication. priority; they are indexed by GeoRef from initial publication. Citations to Advance online prior to final publication). Advance online articles are citable and establish publicationyet appeared in the paper journal (edited, typeset versions may be posted when available Advance online articles have been peer reviewed and accepted for publication but have not
© Geological Society of America
as doi:10.1130/GES01064.1Geosphere, published online on 11 March 2015