kinetic characterization of yeast alcohol dehydrogenases
TRANSCRIPT

Q 1987 by The American Society of R ~ i ~ c ~ Chemists, Inc. THE JOURNAL OF RIOLOGICAL CHEMISTRY Val. 262, No. 8, Issue of March 15. pp. 3754-3761,1987
Printed in C! S. A.
Kinetic Characterization of Yeast Alcohol Dehydrogenases AMINO ACID RESIDUE 294 AND SUBSTRATE SPECIFICITY*
(Received for publication, October 28,1986)
Axel J. Ganzhorn, David W. Green, Andrew D, Hershey, Robert M, Gould, and Bryce V. Plapp From the Department of Biochemistry, The University of Iowa, Iowa City, Iowa 52242
A three-dimensional model of yeast alcohol dehydro- genase, based on the homologous horse liver enzyme, was used to compare the substrate binding pockets of the three isozymes (I, 11, and 111) from Saccharomyces cerevisiae and the enzyme from Sch~zo~aecharomyces pombe. Isozyme I and the S. pombe enzyme have me- thionine at position 294 (numbered as in the liver enzyme, corresponding to 270 in yeast), whereas iso- zymes I1 and I11 have leucine. Otherwise the active sites of the S. eerevisiae enzymes are the same. All four wild-type enzymes were produced from the cloned genes. In addition, oligonucleotide-directed mutagen- esis was used to change Met-294 in alcohol dehydro- genase I to leucine. The mechanisms for all five en- zymes were predominantly ordered with ethanol (but partially random with butanol) at pH 7.3 and 30 OC. The wild-type alcohol dehydrogenases and the leucine mutant had similar kinetic constants, except that iso- zyme I1 had 10-20-fold smaller Michaelis and inhibi- tion constants for ethanol. Thus, residue 294 is not responsible for this difference. Apparently, substitu- tions outside of the substrate binding pocket indirectiy affect the interactions of the alcohol dehydrogenases with ethanol. Nevertheless, the substitution of methi- onine with leucine in the substrate binding site of al- cohol dehydrogenase I produced a 7-10-fold increase in reactivity (V/Km) with butanol, pentanol, and hex- anol. The higher activity is due to tighter binding of the longer chain alcohols and to more rapid hydrogen transfer.
Saccharomyces cerevisiae produces two cytosolic alcohol dehydrogenases (Lutstorf and Megnet, 1968; Ciriacy, 1975; Young et al., 1982). Alcohol dehydrogenase I functions as the fermentative isozyme oxidizing NADH with acetaldehyde. Isozyme I1 is repressed by glucose and may function to oxidize ethanol. It should use low concentrations of ethanol efficiently since its K,,, is at least 10-fold lower than the K;, of isozyme I (Wills, 1976). The physiological significance and the struc- tural basis for this difference are still unclear.
The amino acid sequences of the two isozymes (Wills and Jornvall, 1979; Young et al., 1982) show only 22 differences out of 347 residues and no differences in the groups directly involved in catalysis. The sequence of the yeast enzyme (for which no crystal structure has been obtained) was aligned
* This work was supported by Grant AA06223 from the National Institute on Alcohol Abuse and Alcoholism, United States Public Health Service. The costs of publication of this article were defrayed in part by the payment of page charges. This article must therefore be hereby marked “advertisement” in accordance with 18 U.S.C. Section 1734 solely to indicate this fact.
with the three-dimensional structure of horse liver alcohol dehydrogenase (Jornvall et at., 1978), and we have confirmed this model with a computer graphics system. A schematic view of the active site, as compared to the horse liver enzyme, has been presented (Plapp et al., 1987). The only difference between the two isozymes within the alcohol binding pocket. seems to be at position 294, where a methionine in alcohol dehydrogenase I is changed to a leucine in isozyme 11. The extra methyl group could account for the difference in speci- ficity for ethanol. Alcohol dehydrogenase 111, the mitochon- drial isozyme in S. cereuisiae, also has Leu-294 (Young and Pilgrim, 1985), whereas the enzyme from Schizosaccharomyces pombe has methionine (Russell and Hall, 1983). In order to evaluate the role of this amino acid residue, we used site- directed mutagenesis to change the ATG codon (for methio- nine) in the gene for alcohol dehydrogenase I to TTG (for leucine), purified the five enzymes, and compared their kinetic properties.
EXPERIMENTAL PROCEDURES
Materials-The mutamer (mutagenic primer), a 21-base oligonu- cleotide, TTGGTCGGTTTGCCAGCTGGT (the underline marks the point of mutation) and other oligonucleotides were made on a Beckman DNA synthesizer by the phosphoramidite method (Beau- cage and Caruthers, 1981). The primers used for sequencing were complementa~ to the noncoding strand of the AVHl gene, and their positions relative to the A in the ATG start codon were as follows: ATATTTCAAGCTATACC (position -451, TGTCACACTA ACTTGCACGC (+126), CAACTGTCCTCACGC (+326), TGGG- TATTGGTGGTGGTGAA (+597), TTGGTCGGTTTGCCAGC- TGGT (+803). Kits for subcloning into M13 and dideoxy sequencing as well as the DNA modifying enzymes for mutagenesis were pur- chased from either Bethesda Research Laboratories or New England Biolabs.
Plasmids, Yeast Strains, and Media-The four yeast ADH genes have been cloned and described (Bennetzen and Hall, 1982; Russell et al., 1983; Russell and Hall, 1983; Young and Pilgrim, 1985). The 16-kilobase plasmid used for mutagenesis and production of alcohol dehydrogenase I was derived from the yeast shuttle vector YEpl3 (Broach et ai., 1979) and contained the genomic 7-kilobase BamHI fragment for ADHI, the ampicillin resistance gene for selection in Escherichia eo& parts of the 2 p circle for autonomous replication in yeast, and the LEU2 gene for selection in yeast. Similar plasmids were used to produce the other isozymes. A strain of S. cerevisiae that did not produce active alcohol dehydrogenase, 302-21#2 (adhl-11, adh2, leu2, trpl), was used for the expression of the ADHI, ADH2, and pambe genes. ADH3 was expressed in strain 900-17 (adh-AI, adh2-601, ade2, trpl, ural). YEPD, a rich medium containing 2% dextrose, 2% Bacto-peptone, and 1% yeast extract was used for growth without selective pressure. Antimycin A (1 pg/ml) was added to select for alcohol dehydrogenase I and the enzyme from S. pombe. Cells transformed with AVH2 were grown aerobically in 3% ethanol, 2% glycerol, 2% Bacto-peptone, 1% yeast extract, and 0.2% glucose. Strain 900-17 was grown in lactic acid medium (Daum et al., 1982) under aerobic conditions. In all cases, a minimal medium of 0.67%
3754

Kinetics of Yeast Alcohol Dehydrogenases 3755
yeast nitrogen base with 2% glucose or ethanol was used to select for the amino acid marker.
Mutagenesis-The mutagenesis procedure was based on the method described by Wallace et ol. (1980) and Dalbadie-McFarland et al. (1982). A single strand in the plasmid containingADH1 was cut with the HindIII restriction enzyme in the presence of ethidium bromide (80 pg/ml), and the nicked product was partially digested with exonuclease 111. The mutamer was phosphorylated (Zoller and Smith, 1984) and annealed to the gapped duplex, and the gap was filled with DNA polymerase I (Klenow fragment) and T4 DNA ligase. The reaction mixture was used to transform E. coli HBlO1, selecting for ampicillin resistance, grown in 1% Bacto-tryptone, 0.5% yeast extract, 0.5% NaCl, 0.1% glucose, and 150 mg/liter ampici~in. Trans- formed colonies were hybridized (Hanahan and Meselson, 1983) to the radioactively labeled mutamer at a selective temperature (Wallace et al., 1981). Plasmid DNA was isolated (Birnboim, 1983) from 5 colonies showing strong hybridization. A second cycle of transfor- mation and screening with this DNA yielded about 50% mutant colonies. An isolated colony was used for the final plasmid preparation (Summerton et ab, 1983).
Single and double restriction enzyme digests with HindIII, EcoRI, and BarnHI showed that fragments obtained from mutant and wild- type plasmid DNA were identical in number and size and consistent with the sequence of the plasmid to the extent that it is known.
~ r a ~ f o r m a ~ ~ o n of Yeast-S. cerevisiue 302-21#2 was transformed with plasmid DNA in the presence of lithium acetate. Control exper- iments without DNA did not produce any revertants. Colonies were selected on minimal medium for acquisition of the LEU2 marker. Some of these colonies were screened for alcohol dehydrogenase activity on plates of YEPD with antimycin A. Growth on minimal medium was observed only when tryptophan was added. This elimi- nated the possibility of contamination with wild-type yeast. As a final test for the presence of the alcohol dehydrogenase gene, mutant and wild-type transformants were grown in liquid culture, the cells ho- mogenized, and the homogenate assayed for alcohol dehydrogenase activity. Both mutant and wild-type cultures grew to approximately the same cell density (12-14 Am, 24 h) and had about the same alcohol dehydrogenase activity (150 units total in a 50-ml culture). Both cell extracts showed a large band on sodium dodecyl sulfate- polyacrylamide gel electrophoresis, corresponding to alcohol dehydro- genase.
Plasmid DNA was reisolated from transformed yeast cells by the method of Winston et al. (1983). The plasmid was amplified in E. coli and isolated as described above.
DNA Sequencing-Plasmids were digested with SphI enzyme, and a 1600-base pair fragment containing the complete alcohol dehydro- genase gene was isolated from an agarose gel by electrophoresis onto DEAE membrane (Schleicher and Schuell NA45). The fragment was ligated into M13mp18RF (Messing, 1983) following the directions in the cloning manual by Bethesda Research Laboratories.
The method of Sanger et al. (1977) was used for sequence deter- mination. Clones with the insert in the right orientation were iden- tified by analyzing single-stranded DNA from several plaques with a universal sequencing primer.
Enzyme Purification-Starter cultures in 50 ml of selective media were grown to full density with shaking at 30 "C. These were used to inoculate 10 liters of rich medium which was allowed to grow with agitation at 30 "C to full density. The cells were collected by centrif- ugabion and washed with 50 mM potassium phosphate buffer, pH 7.9, containing 1 mM EDTA and 0.25 mM 2-mercaptoethanol. This yielded approximately 10 g of cells/liter (wet weight). The cells were lysed using a bead beater (BioSpec Products, 330-ml capacity) with the above phosphate buffer a t 4 "C. The extract was treated with 0.2% protamine sulfate (Sigma Salmon Grade 11) to remove nucleic acids, In addition, extracts with alcohol dehydrogenase I11 and the S. pombe enzyme were heated at 60 "C for 10 min. The enzyme was then selectively precipitated with polyethylene glycol (Fluka, PEG,,) using a range from 6 to 18%. The precipitate was resuspended in 50 mM Tris-HC1, pH 7.9,1 mM EDTA, 1 mM 2-mercapt~than01, applied to a column of DEAE-Sepharose CL-GB (Pharmacia, 2.5 X 20 cm), which was washed with buffer and developed with a 400-ml linear gradient of 50-200 mM Tris-HCl buffer, pH 7.9. A 5-150 mM gradient containing 20 mM 2-mercaptoethanol was used to elute alcohol de- hydrogenase 111. The active fractions were pooled and further purified by affinity chromato~aphy on a column of agarose/hexane/~AD+ (Type I, Pharmacia P-L Biochemicals). The enzyme was bound as
the ternary NAD+-pyrazole complex in the presence of 1 mM pyrazole; the column was washed with the pyrazole/Tris buffer, and alcohol dehydrogenase was eluted with 0.25 mM NAD' in 50 mM Tris-HC1 buffer, pH 7.9, without pyrazole. The enzyme was r ~ h r o m a t o ~ a p h e d on the DEAE column, concentrated by ultrafiltration, and crystallized by adding PEGw.
If necessary, residual NAD+ was removed by gel filtration before the enzyme was used in kinetic experiments. Alternatively, a hydro- phobic interaction column (octyl-Sepharose CL-4B from Pharmacia P-L B i ~ h e ~ i c a l s ) was used instead of NAD-agarose. The column was equilibrated with 1 M ammonium sulfate in 50 mM Tris-HCl buffer, pH 7.9. After loading the sample the column was washed with the same buffer, and the enzyme eluted by applying a 300-ml linear gradient of 1-0 M ammonium sulfate in Tris buffer. Active fractions were combined and concentrated by ultrafiltration. A summary of a typical purification is given in Table I. The final enzyme preparations appeared to be at least 90% pure by sodium dodecyl sulfate-polyac- rylamide gel electrophoresis (Laemmli, 1970). The concentration of purified enzyme was determined by using a value for Ai.;% of 1.26 at 280 nm (Hayes and Velick, 1954). The enzymes appeared to be free of coenzyme as indicated by a ratio of 1.8 for Azso/Azso. Specific activities, determined in a standard assay at 30 "C (Plapp, 19701, were 280 unitslmg for alcohol dehydrogenase I1 and 470 units/mg for the other enzymes. The concentration of active sites was determined by spectrophotometric titration of about 20 PN enzyme with NAD+ in the presence of 10 mM pyrazole using a double difference technique (Theorell and Yonetani, 1963). The extinction coefficient of the E- NAD+-pyrazole complex at 293 nm was 10.9 mM-lcm". The apparent dissociation constant of NAD+ from the complex was 0.5-4 PM, depending on the isozyme. Turnover numbers were calculated from the concentration of active sites. As compared to the protein concen- tration, about 70% (5040%) of the sites in the various enzymes could bind NAD+ and pyrazole.
Kinetics-Product inhibition studies were performed for all four substrates (NAD", ethanol, NADH, and acetaldehyde) by holding the concentration of one substrate constant while varying the other substrate concentration within a range from one-fifth to five times its It, value. Concentrations of ethanol were below those that caused substrate inhibition. A physiological buffer of 83 mM potassium phosphate and 40 mM KC1 at pH 7.3 and 30 "C was used for all of the kinetic experiments (Cornell, 1983). Activity was determined by measuring the change in absorbance at 340 nm on a Cary 118C spectrophotometer interfaced to an IBM PC/XT computer equipped with a Data Translation 2805 A/D board. A Fortran program was used to estimate initial velocities by a linear or parabolic fit of the data. Initial velocities were fitted to the appropriate equations with the programs HYPER, COMP, NONCOMP, UNCOMP (Cieland, 1979).
Peptide Mapping-The protein (10 mg) was reduced under nitrogen with dithiothreitol(l0 mM) in 1 ml of 6 M guanidine HCl, 0.1 M Tris- HCl, 1 mM EDTA, pH 8.1, for 2 h at 37 "C and subsequently S- carboxymethylated with bromoacetate (20 mM) for 1 h at room temperature. The reaction product was dialyzed against 50 mM am- monium bicarbonate, pH 8.5, and digested with trypsin (0.1 mg/ml) for 12 h at room temperature. The reaction was stopped by adjusting the solution to pH 3 with 80% formic acid. Peptides were analyzed on a Synchropak RP-P column (25 cm X 4.1 mm) at a flow rate of 1 ml/min, applying a linear gradient of 3-35% acetonitrile in 0.1% trifluoroacetic acid in 1 h. The absorbance was measured at 229 and 280 nm.
RESULTS
Fig. 1 shows the DNA sequence of the region in which the gene was mutagenized. The expected A to T change was easily
TABLE I Purification of alcohol dehydrogenase I
Total units Units/mg (mg)
Homogenate 3,160 163,000 51 Polyethylene glycol 1,260 148,000 118
DEAE-Sepharose fractionation
285 82,000 288 Octyi-Sepbarose 139 64,000 462
"
....

3756 Kinetics of Yeast Alcohol Dehydrogenases
ADH I-Leu ADH I
A C G T A C G T
br ATG
FIG. 1. DNA sequence coding for amino acids 268-273 in wild-type (right) and mutant (left) alcohol dehydrogenase I.
x)
25 20 l5 lo 5 0
-4 0 4 8 n 16 - 5 0 5 l o b 2 0 2 5 x ) V i NAD VmM NADH
no w 60
40
20
0 -0.2-0.1 0.0 0.1 02 0.3 0.4 0.5 0.6 -4 0 4 8 12
VmM hhand v i Acetddehyde FIG. 2. Product inhibition patterns for alcohol dehydrogen-
ase 11. A, inhibition by NADH (0, 0.01,0.02, and 0.04 mM) at 25 mM ethanol; 3.42 nN enzyme. B, inhibition by NAD+ (0,0.193, 0.368, and 0.772 mM) at 2 mM acetaldehyde; 0.342 nN enzyme. C, inhibition by acetaldehyde (0, 0.02, 0.04, and 0.08 mM) at 1.4 mM NAD'; 3.42 nN enzyme. 0, inhibition by ethanol (0, 4, 8, and 16 mM) at 0.177 mM NADH; 0.342 nN enzyme. l /u is the reciprocal initial velocity in [ A A / min]".
identified. I t was still present after the mutagenized plasmid was reisolated from yeast. Both mutant and wild-type DNA were sequenced throughout the whole gene. No other changes could be detected, suggesting that the mutamer anneals spe- cifically to the intended site. The sequence was compared to the DNA sequence of the alcohol dehydrogenase I gene pub- lished by Bennetzen and Hall (1982). Eight differences were found, which occur in the third base of a codon and, therefore, do not affect the amino acid sequence. These are 54 G, 66 A, 117 A, 516 C, 525 T, 528 C, 540 T, and 900 T. One change, however, 61 T, would result in a switch from histidine to tyrosine at position 20 (yeast numbering), as found for the amino acid sequence (Wills and Jornvall, 1979).
The final protein product was further characterized by peptide mapping in order to ensure that no truncated or otherwise largely altered enzyme was produced from the mu- tant plasmid. The elution profiles of the tryptic digests were very similar for the mutant and the wild-type enzymes. We, therefore, conclude that the mutagenesis procedure did not affect the correct expression of the ADH gene.
Kinetic Mechanism-In order to interpret the kinetic con- stants and compare the enzymes, the mechanism was estab- lished for each of the isozymes. The product inhibition pat- terns for alcohol dehydrogenase I1 are shown in Fig. 2. NAD+ and NADH are mutually competitive inhibitors, whereas ace- taldehyde and ethanol are mutually noncompetitive. In other
experiments with the same enzyme, acetaldehyde appeared to be a competitive inhibitor against ethanol. The other three isozymes and the mutant enzyme showed essentially the same product inhibition patterns. Again, as with alcohol dehydro- genase 11, values for Kip (the inhibition constant for acetal- dehyde) could not always be determined. This may arise if the slope inhibition constant for acetaldehyde is so much larger than the intercept inhibition constant that the pattern does not appear noncompetitive. On this assumption, the data are consistent with an Ordered Bi Bi mechanism with coen- zyme binding before substrate.
The results in Fig. 2 also fit a rapid equilibrium random mechanism with dead-end complexes, although this mecha- nism has been ruled out for the yeast enzyme (Wratten and Cleland, 1963; Silverstein and Boyer, 1964). Our results also exclude this mechanism, since trifluoroethanol was an uncom- petitive inhibitor against NAD' (Fig. 3A). No better fit of the data could be obtained with the equation for noncompetitive inhibition. Nevertheless, a slight slope effect is evident, es- pecially at the highest inhibitor concentration, and Student's t test showed that the slopes for some lines were significantly different from one another. The same result was obtained for the leucine mutant, whereas for alcohol dehydrogenase I1 no such difference in the slopes could be detected. The uncom- petitive pattern fits a predominantly ordered mechanism with NAD+ binding before ethanol, but the slope effect at high inhibitor concentrations indicates that alcohol may bind to free enzyme. High concentrations of ethanol (above 20-30 mM) activate alcohol dehydrogenases I, 111, and I-Leu, and isozyme I1 is activated above 100 mM. Formation of an E- NADH-alcohol complex which dissociates quickly to E-alco- hol and then to free enzyme could explain this behavior (Dalziel and Dickinson, 1966). Substrate inhibition was ob- served at ethanol concentrations above 1 M.
The kinetic constants for all five enzymes are listed in Table 11. The equilibrium constants calculated from the Hal- dane relationship agree well with the experimentally deter- mined value of 10 PM (Sund and Theorell, 1963) and indicate that the kinetic constants are self-consistent. Table I11 shows the rate constants of coenzyme binding and release, which were calculated from the kinetic constants for the Ordered Bi Bi mechanism (Cleland, 1963). In some cases, the value cal- culated for b, the rate constant for dissociation of the enzyme- NAD' complex, is slightly less than the turnover number for acetaldehyde reduction. However, the maximum rate in a given direction cannot be faster than any unimolecular step in that direction. This inconsistency has been observed for yeast and horse liver alcohol dehydrogenases and was ascribed to a conformational change of the enzyme-NAD+ complex (Wratten and Cleland, 1963; Plapp et dl., 1986). As shown in Table I11 for the mutant enzyme, the discrepancy becomes
L'" I / 4 Q - 1 0 1 2 3 4 5 6 - 1 0 1 2 3 4 5 6
V I NAD VmM NAD FIG. 3. Dead-end inhibition patterns for alcohol dehydro-
genase I. A, inhibition by 2,2,2-trifluoroethanoI (0, 10, 20, and 40 mM) at 10 mM ethanol; 8.1 nN enzyme. B, inhibition by lH,IH- heptafluorobutanol (0,5,10, and 20 mM) at 15 mM butanol; 39.5 nN enzyme. l /u is the reciprocal initial velocity in [AA/min]".
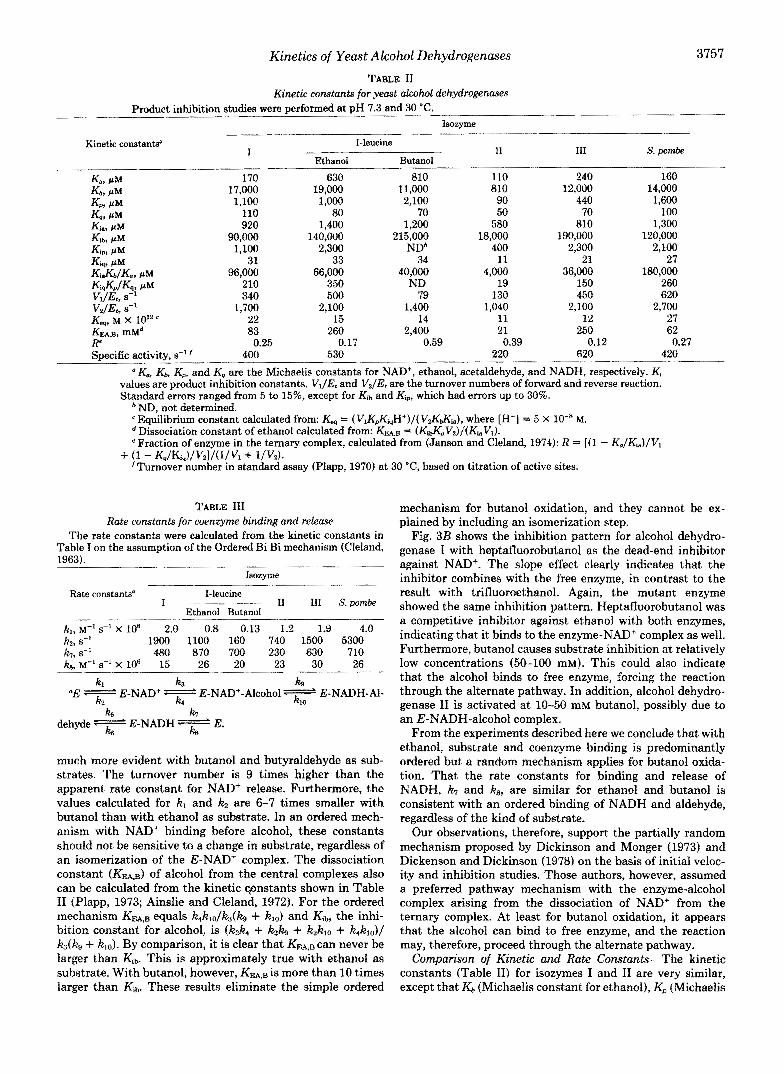
Kinetics of Yeart Alcohol Dehydrogenases 3757 TABLE I1
Kinetic constants for yeast akohl dehydrogenases Product inhibition studies were Derformed at DH 7.3 and 30 "C.
Isozyme
Kinetic constantso I-leucine l__l_
I Ethanol Butanol
I1 I11 s. pornbe
k + PM 170 630 810 110 240 160 Kbt PM 17,000 19,000 11,000 810 12,000 14,000 Km PM 1,100 1,000 2,100 90 440 1,600 Kq, PM 110 80 70 50 70
920 100
Kim PM 1,400 1,200 580 810 ~,~
1,300 Kihq P M 1 4 0 , ~ 215,000 18,000 190,000 120,000 Kip, PM 1,100 2,300 NDb 400 2,300 2,100 Ktq, PM 31 33 34 11 21 27
260 KiaKdKw PM 96,000 66,000 40,000 4,000 36,000 180,000 Ki&n/&? PM 210 350 ND 19 150 Vl/Et, s-' 500 79 130 450 620 VdEt, 8-l 1,700 2,100 1,400 1,040 2,100 2,700 K-, M X 10" 22 15 14 11
83 260 12 27
KFAB, mMd 2,400 21 250 62 E
400 Specific activity, s" f 530 220 620 420
340
0.25 0.17 0.59 0.39 0.12 0.27
a X , Kk Km and Kq are the Michaelis constants for NAD+, ethanol, acetaldehyde, and NADH, respectively. Kj values are product inhibition constants. VJE, and Vz/Et are the turnover numbers of forward and reverse reaction. Standard errors ranged from 5 to 15%, except for Ki,, and Kip, which had errors up to 30%.
ND, not determined. Equilibrium constant calculated from: Kw = ( VIK,,Ki,H+)/( V2KZia), where [H+] = 5 x lo-* M.
*Dissociation constant of ethanol calculated from: Km, = (K~~Vz) / (Ki~Vl) . e Fraction of enzyme in the ternary complex, calculated from (Janson and Cleland, 1974): R = [(I - K,/Ki,,)/Vl
'Turnover number in standard assay (Plapp, 1970) at 30 "C, based on titration of active sites. + (1 - Kq/Kiq)/Vz]/(l./V1 + l /Vd.
TABLE I11 Rate constants for coenzyme binding and release
The rate constants were calculated from the kinetic constants in Table I on the assumption of the Ordered Bi Bi mechanism (Cleland, 1963).
""
Isozyme
Rate constantse I-leucine 1 - 11 I11 S. pombe
Ethanol Butanol .. ~
kt , M"s" X 10' 2.0 0.8 0.13 1.2 1.9 4.0 kz, S" 1900 1100 160 740 1500 5300 h, s-l 480 870 700 230 630 710 ka, M" s-' X lo6 15 26 20 23 30 26
kl k3 kg
k2 k4 klo
dehyde E-NADH E.
"E = E-NAD+ E-NAD+-Alcohol= E-NADH-AI- k6 k7
k3 ks
much more evident with butanol and butyraldehyde as sub- strates. The turnover number is 9 times higher than the apparent rate constant for NAD' release. Furthermore, the values calculated for kl and kz are 6-7 times smaller with butanol than with ethanol as substrate. In an ordered mech- anism with NAD+ binding before alcohol, these constants should not be sensitive to a change in substrate, regardless of an isomerization of the E-NAD+ complex. The dissociation constant KEA,^) of alcohol from the central complexes also can be calculated from the kinetic cpnstants shown in Table I1 (Plapp, 1973; Ainslie and Cleland, 1972). For the ordered mechanism KEA,B equals k,klo/k,(k, + klo) and Kib, the inhi- bition constant for alcohol, is (&k4 + k2k, + kzklo + k4ttlo)/ ks(k, + klo). By comparison, it i s clear that KEA,BCB~ never be larger than &. This is approxima~ly true with ethanol as substrate. With butanol, however, KEA,B is more than 10 times larger than Ifib. These results eliminate the simple ordered
mechanism for butanol oxidation, and they cannot be ex- plained by including an isomerization step.
Fig. 3B shows the inhibition pattern for alcohol dehydro- genase I with heptafluorobutanol as the dead-end inhibitor against NAD+. The slope effect clearly indicates that the inhibitor combines with the free enzyme, in contrast to the result with trifluoroethanol. Again, the mutant enzyme showed the same inhibition pattern. Heptafluorobutanol was a competitive inhibitor against ethanol with both enzymes, indicating that it binds to the enzyme-NAD+ complex as well. Furthermore, butanol causes substrate inhibition at relatively low concentrations (50-100 mM). This could also indicate that the alcohol binds to free enzyme, forcing the reaction through the alternate pathway. In addition, alcohol dehydro- genase I1 is activated at 10-50 mM butanol, possibly due to an E-NADH-alcohol complex.
From the experiments described here we conclude that with ethanol, substrate and coenzyme binding is predominantly ordered but a random mechanism applies for butanol oxida- tion. That the rate constants for binding and release of NADH, k, and k8, are similar for ethanol and butanol is consistent with an ordered binding of NADH and aldehyde, regardless of the kind of substrate.
Our observations, therefore, support the partially random mechanism proposed by Dickinson and Monger (1973) and Dickenson and Dickinson (1978) on the basis of initial veloc- ity and inhibition studies. Those authors, however, assumed a preferred pathway mechanism with the enzyme-alcohol complex arising from the dissociation of NAD+ from the ternary complex. At least for butanol oxidation, it appears that the alcohol can bind to free enzyme, and the reaction may, therefore, proceed through the alternate pathway.
C o ~ F a r ~ o n of Kinetic and Rate Constants-The kinetic constants (Table 11) for isozymes I and I1 are very similar, except that K b (~ ichae l i s constant for ethanol), Kp (~ ichae l i s

3758 Kinetics of Yeast Alcohol Dehydrogenases
constant for acetaldehyde), and Kib (ethanol inhibition con- stant) are 7-20-fold smaller for alcohol dehydrogenase 11. Furthermore, KEA,B (dissociation constant for ethanol) is 4- fold higher in the fermentative enzyme as compared to the repressible form. The mi~chondrial enzyme, the S. pombe enzyme, and the mutated enzyme resemble alcohol dehydro- genase 1 rather than 11 in most of their kinetic constants. Kb, Kp, and Kib are similar to isozyme I, and the ethanol dissocia- tion constant is even higher in some cases (mutant and mitochondrial enzyme). The only notable difference between the mutant and the wild-type enzyme is a 4-fold increase in Ka (Michaelis constant for NAD+) in the mutant form. X-ray crystallography of the horse liver enzyme (Eklund et al., 1981) shows that in the ternary complex Val-294 contacts the nic- otinamide ribose. Thus, adding a methyl group to the corre- sponding residue in the yeast enzyme could interfere with coenzyme binding and, therefore, account for the change in K,. Alcohol dehydrogenase I1 has somewhat lower turnover numbers than do the other isozymes.
The rate constants for coenzyme binding and release (Table 111), show that the “off” velocity for NAD+, kp, is significantly higher in the S. pombe enzyme as compared to the other isozymes. At position 293 in the S. pombe enzyme serine is substituted for glycine. This may lead to steric interference with the nicotinamide ribose. NADH release (k7) seems to be fastest, and the NAD+ “on” velocity slowest in the mutant enzyme, even though a 2-fold difference (as compared to alcohol dehydrogenase I), might not be considered significant.
The constants obtained from dead-end inhibition studies, mainly with mutant and wild-type alcohol dehydrogenase I, are summarized in Table IV. There are no striking differences in the binding of several inhibitors between the two enzymes. However, whereas the inhibitors with shorter chain lengths seem to bind slightly better to alcohol dehydrogenase I, longer molecules (butyramide, h e p ~ f f u o ~ b u ~ n o l ~ bind twice as tightly to the mutant enzyme, but only in the ternary complex. Binding of heptafluorobutanol to the free enzyme (the slope inhibition constant from Fig. 3B) did not change significantly. It was surprising that butyramide was a competitive inhibitor against ethanol. Apparently, binding to the enzyme-NADH
TABLE IV Inhibition constants for yeast alcohol dehydrogenases
The dead-end inhibition studies were performed with concentra- tions as in the legend to Fig. 3 in experiments with NAD’ as the varied substrate. Ethanol was varied between 1 and 20 mM, but only over a 5-fold range in a given experiment. NAD’ was fixed at 2 mM. Inhibitor concentrations were 0-2 rnM 4-methylpyrazole, 0-20 mM butyramide or heptafluorobutanol, and 0-40 mM trifluoroethanol. __-__ ”
Inhibitor Varied Fixed K p Isozyme substrate SUbStFab
mM Trifluoroethanol I
I Ethanol NAD 2.85
NAD Ethanol 2.1’ I-leucine NAD Ethanol 3.0’
I1 NAD Ethanol 0.36b 4-methylpyrazole I Ethanol NAD 0.7
I-leucine Ethanol NAD 1.1 Butyramide I Ethanol NAD 92
I-leucine Ethanol NAD 39 Heptafluorobutanol I Ethanol NAD 17
I-leucine Ethanol NAD 7 I NAD Butanol 17
I-leucine NAD Butanol 14 Values are slope inhibition constants, from competitive patterns,
except those indicated by Footnote b. Standard errors were 5-10% except with butyramide, which were 20-30%.
* Intercept inhibition constants from uncompetitive patterns.
complex is so weak that an intercept effect could not be detected. Similar problems were encountered with respect to the competitive patterns obtained with heptafluorobutanol. In these cases, higher substrate concentrations should be used in order to determine possible intercept effects, but the inhib- itor was poorly soluble.
Alcohol dehydrogenase 11, as could be expected from the product inhibition results, binds trifluoroethanol much tighter than do the other two enzymes.
Substrate Specificity-The V,, , and K, values for the iso- zymes I, 11, and I11 and for the mutant enzyme were deter- mined with alcohols of various chain lengths (Table V). The rate enhancement specificities of the four enzymes, V/Kb, for the different alcohols are compared in Fig. 4. Wild-type and mutant enzyme show approximately the same specificity for ethanol and propanol. Starting with a chain length of 4, however, a significant increase in V/K (7-fold with butanol, 10-fold with pentanol and hexanol) for the leucine mutant compared to the methionine enzyme can be observed. In this respect, the mutated alcohol dehydrogenase I is very similar to the mitochondrial enzyme, which also has a leucine at position 294. Isozyme I1 has higher V/K values for all the alcohols, but the pattern of reactivity resembles tfiat of the other leucine-containing enzymes. As can be seen from Table V, V,,, and K , both contribute to the observed effect on V/ K. In general, Vmax tends to decrease with an increasing number of carbon at.oms in the substrate for all four enzymes. However, this decrease is considerably reduced in the iso- zymes with Leu-294.
TABLE V Kinetic constants for different alcohols
Substrates were varied over a &fold range up to 100 mM (ethanol, propanol), 50 mM (butanol), or 10 mM (pentanol, hexanol) with 2 mM NAD’. The enzyme concentrations were adjusted for each substrate so that reasonable velocities were obtained.
Isozyme Substrate
Ethanol Propanol Butanol Pentanol Hexanol v, s-1
I 340 120 51 29 16 I-leucine 500 120 79 72 I1
57 130 89 98 88 71
111 490 88 92 47 31
I K, m~
17 27 55 37 9.5 I-leucine 19 20 11 8.8 3.3 I1 0.8 2.6 111 12
2.9 3.8 1.4 11 7.7 5.2 1.9
.___
2.0 1
0.0 1 -0.5
1 2 3 4 5 6 7
Number of Carbons in Substrate FIG. 4. Rate enhancement specificity for yeast alcohol de-
hydrogenases with aliphatic alcohols. A homologous series of primary alcohols was tested as substrates for alcohol dehydrogenase I (El), I1 (01, I11 (01, and the alcohol dehydrogenase I-leucine mutant (A).

Kinetics of Yeast Alcoh~l ~ e ~ y ~ r o g e n ~ e s 3759
DISCUSSION
Leu-294 by itself does not account for the lower K, of alcohol dehydrogenase I1 for ethanol as compared to the isozymes with Met-294. This was shown by the kinetic studies with alcohol dehydrogenase I11 and a mutated alcohol dehy- drogenase I, which both have leucine at that position. Neither of them had lower I(, values for ethanol or higher v/Kb values than the enzymes containing methionine. Changes outside of the substrate binding pocket must be responsible for the different kinetic behavior of the repressible enzyme form. These substitutions could alter substrate binding indirectly by affecting conformational changes. Horse liver alcohol de- hydrogenase undergoes a conformational change upon coen- zyme binding, which narrows the cleft between the coenzyme binding and catalytic domains (Eklund and Brand&, 1979). Fluorometric studies (Karlovii: et ul., 1976) have indicated that an isomerization also accompanies coenzyme binding in the yeast enzyme. Interactions of the residues that line the cleft between the domains could affect the extent of that conformational change and possibly the binding of substrates. There are some differences in the amino acid residues of the different isozymes at the top of the cleft, but our model of the three-dimensional structure does not provide a clear sugges- tion for their involvement in conformational changes. Thus, the structural basis for the kinetic properties of alcohol de- hydrogenase I1 still remains to be elucidated.
An important result of this work is the determination of the effect on catalysis of one methyl group at a substrate binding site. By using directed mutagenesis we were able to examine this problem in a well-defined way. Naturally occur- ring isozymes (such as the yeast enzymes studied here) may provide some information, but it is always difficult to deter- mine the influence of other changes in the structure, even though they may be distant from the active site.
The mutant leucine enzyme shows an increased rate of
reaction (VI&) with alcohols with long carbon chains as compared to the wild type methionine enzyme. This effect of rate enhancement specificity, ranging from "-fold with bu- tanol to 10-fold with pentanol and hexanol, could be due to better steric interactions, improving orientation or binding of the substrate, or to increased hydrophobicity caused by the substitution of a methyl group for a thioether group. It should be noted that alcohol dehydrogenases I1 and I11 show the same patterns of reactivity with homologous alcohols as the mutant isozyme I; it appears that Leu-294 has the same effect on substrate specificity in all three enzymes.
In an Ordered Bi Bi mechanism (shown in Table 111), VI/ E, and v/& are defined as follows (Plapp, 1973).
ksk7k9 "lEt = ksk7 + ksk, + k7k, + k7k1, (1)
(Since the V/Kb values for different alcohols were determined in the presence of high concentrations of NAD', the mecha- nism is considered to be predominantly ordered even for the longer chain alcohols.)
Alcohol dehydrogenase I has much lower turnover numbers with longer aliphatic alcohols than with ethanol. Dickenson and Dickinson (1975) concluded from deuterium isotope ef- fects and stopped-flow experiments that hydrogen transfer is rate limiting for butanol oxidation, whereas ethanol oxidation is controlled by release of NADH. The chemical reactivity of aliphatic alcohols cannot account for such an observation. Most likely, the positioning of the substrate in the active site controls the rate of hydrogen transfer. If this positioning is unfavorable, as might be the case with butanol, k7 becomes much larger than $. On the assumption that kIo >> $ (which is reasonable since V,/E, for butyraldehyde reduction is 1400
FIG. 5. Model for the active site of yeast alcohol dehydrogenase. The catalytic zinc (MTL 375) is ligated to the substrate butanol, which was built into the model with an optimal position for transferring the pro-R hydrogen to the nicotinamide. Residue 294 is shown as leucine (solid lines) or methionine (dashed line).
3760 Kinetics of Yeast Alcohol Dehydrogenases
s" and any unimolecular step has to be at least that fast), Equation 1 simplifies to
Alcohol dehydrogenase 1 shows a steady decrease of the maximum rate of alcohol oxidation with an increasing number of substrate carbon atoms. By replacing Met-294 with leucine, this decrease can be considerably reduced (Table V). We, therefore, conclude that Leu-294 allows positioning of longer chain alcohols in a more productive mode for hydrogen trans- fer. The effect of the mutation on the turnover numbers is probably due to a change in $, but effects on k5 and klo cannot be excluded.
Also, since k4, for the same reason as klo, is much larger than $, Equation 2 can be simplified as follows.
It follows from Equation 4 that K b equals k4/k3, and, therefore, the lower Michaelis constants of the mutant enzyme with the long chain alcohols directly reflect a higher affinity for those substrates as compared to the wild type form. Again, the effect could be due to steric interference between the substrate and the long side chain of Met-294. On the other hand, solubility measurements of amino acids in organic solvents have shown that leucine is more hydrophobic than methionine and the effect is equivalent to one additional methyl group (Nozaki and Tanford, 1971). The same fact is indicated by the reten- tion times of peptides on a reverse phase column (Meek, 1980). Thus, a leucine at position 294 increases the hydropho- bicity of the substrate binding site. Hansch et al. (1972) showed that one additional methylene unit in a substrate molecule increased its affinity to a hydrophobic binding pocket by a factor of 2. By analogy, we assume that this is also true for one additional methyl group in the active site of an enzyme interacting with a given hydrophobic substrate. The results of the dead-end inhibition studies support this idea. Binding of heptafluorobutanol and butyramide in the ternary complex is increased by a factor of 2-3 in the mutant as compared to the wild-type enzyme. Binding to the free enzyme, on the other hand, does not seem to be significantly affected. This is not surprising because, by analogy to the horse liver structure, the free enzyme exists in an open form in which residue 294 points away from the active site (Eklund et al., 1981). I t was shown in Equation 4 that the contribution of tighter binding to the better activity of the mutant enzyme can directly be determined from the differences in K b . For butanol this contribution is approximately &fold, which does not quite match the value determined in the dead-end inhi- bition studies. However, the inhibitors may not bind in exactly the same manner as the substrate. Furthermore, Equations 3 and 4 are only approximations, and other rate constants may change. In any case, the analysis of the kinetic data shows that tighter binding, whether primarily due to steric or hydro- phobic effects, and faster hydrogen transfer together account for the increase in catalytic efficiency caused by the methio- nine to leucine substitution.
I t is also evident that there is no interaction of residue 294 with ethanol and propanol. The same observation was made with the shorter inhibitors trifluoroethanol and 4-methylpyr- azole. Significant changes in the catalytic efficiency between mutant and wild-type enzyme were first seen with butanol as substrate, which leads to direct conclusions about the distance between residue 294 and the catalytic zinc ion. A model of the
substrate binding site of yeast alcohol dehydrogenase is shown in Fig. 5. The catalytic zinc is ligated by two cysteine residues, one histidine, and the substrate butanol. The C., of the alcohol is in a position where it may interfere with the rotational movements of the side chain of Met-294. The same kind of steric hindrance seems less likely with a leucine residue be- cause of its more restricted rotational freedom and shorter chain length. Nevertheless, both 6 carbons of Leu-294 are in van der Waals contact with C4, leading to potentially tighter binding due to a hydrophobic effect. On the other hand, residue 294 seems to be too far away from the substrate C, to interfere with the productive binding of ethanol. The experi- mental results of this study, therefore, support our model of the substrate binding pocket of yeast alcohol dehydrogenase.
Acknowledgments-We thank Drs. E. T. Young and B. D. Hall and their co-workers for generously providing the cloned genes and host yeast strains. Dr. J. A. Walder supervised the synthesis of the oligo- nucleotides.
REFERENCES
Ainslie, G. R., Jr., and Cleland, W. W. (1972) J. Biol. Chem. 247, 946-951
Beaucage, S. L., and Caruthers, M. H. (1981) Tetrahedron Lett. 2 2 , . ~ . ."
1859-1862 Bennetzen, J. L., and Hall, B. D. (1982) J. Biol. Chem. 2 5 7 , 3018-
Birnboim, H. C. (1983) Methods Enzyrnol. 100,243-255 Broach, J. R., Strathern, J. N., and Hicks, J. B. (1979) Gene 8, 121-
Ciriacy, M. (1975) Mol. Gen. Genet. 138, 157-164 Cleland, W. W. (1979) Methods Enzymol. 63, 103-138 Cleland, W. W. (1963) Biochim. Biophys. Acta 6 7 , 104-137 Cornell, N. W. (1983) Pharrnacol. Biochem. Behau. 18 , Suppl. 1,215-
221 Dalbadie-McFarland, G., Cohen, L. W., Riggs, A. D., Morin, C.,
Itakura, K., and Richards, J. H. (1982) Proc. Natl. Acad. Sci. U. S.
3025
133
A. 79,6409-6413 Dalziel, K., and Dickinson, F. M. (1966) Biochem. J. 100, 34-46 Daum, G., Bohni, P. C., and Schatz, G. (1982) J. Biol. Chem. 257,
Dickinson, F. M., and Monger, G. P. (1973) Biochem. J. 131 , 261-
Dickenson, C. J., and Dickinson, F. M. (1975) Biochem. J. 147,541-
Dickenson, C. J., and Dickinson, F. M. (1978) Biochem. J. 171,613-
Eklund, H., and BrandBn, C.-I. (1979) J. Biol. Chem. 254,3458-3461 Eklund, H., Samama, J.-P., Wallh, L., Brand&, C.-I., Akeson, A,
Hanahan, D., and Meselson, M. (1983) Methods Enzymol. 100,333-
Hansch, C., Schaeffer, J., and Kerley, R. (1972) J. Biol. Chem. 2 4 7 ,
Hayes, J. E., Jr., and Velick, S. F. (1954) J. Biol. Chem. 207 , 225-
Janson, C. A., and Cleland, W. W. (1974) J. Biol. Chem. 249,2562-
Jornvall, H., Eklund, H., and Brand&, C.-I. (1978) J. Bwl. Chern.
Karlovit, D., Amiguet, P., Bonner, F. J., and Luisi, P. L. (1976) Eur.
Laemmli, U. K. (1970) Nature 227,680-685 Lutstorf, U., and Megnet, R. (1968) Arch. Biochem. Biophys. 126,
Meek, J. L. (1980) Proc. Natl. Acad. Sci. U. S. A. 7 7 , 1632-1636 Messing, J. (1983) Methods Enzymol. 101,20-78 Nozaki, Y., and Tanford, C. (1971) J. Biol. Chem. 246, 2211-2217 Plapp, B. V. (1970) J. Bwl. Chem. 2 4 6 , 1727-1735 Plapp, B. V. (1973) Arch. Biochem. Biophys. 156,112-114 Plapp, B. V., Sogin, D. C., Dworschack, R. T., Bohlken, D. P.,
Woenckhaus, C., and Jeck, R. (1986) Biochemistry 25,5396-5402 Plapp, B. V., Ganzhorn, A. J., Gould, R. G., Green, D. W., and
Hershey, A. D. (1987) in Enzymology and Molecular Biology of
13028-13033
270
574
627
and Jones, T. A. (1981) J. Mol. Biol. 146 , 561-587
342
4703-4710
244
2566
253,8414-8419
J , Bwchem. 66,277-284
933-944

Kinetics of Yeast Alcohol Dehydrogenases 3761
Carbonyl Metabolism 3: Aldehyde Dehydrogenase, Aldo-Keto Reduc- tase, and Alcohol Dehydrogenase, Progress in Clinical and Biological Research (Weiner, H., and Flynn, T. G., e&) Vol. 232, pp. 227-236, Alan R. Liss, New York
Russell, P. R., and Hall, B. D. (1983) J. Biol. Chem. 258,143-149 Russell, D. W., Smith, M., Williamson, V. M., and Young, E. T.
Sanger, F., Nicklen, S., and Coulson, A. R. (1977) Proc. Nutl. Acad.
Silverstein, E., and Boyer, P. D. (1964) J. Bwl. Chem. 239, 3908-
Summerton, J., Atkins, T., and Bestwick, R. (1983) Anal. Biochem.
Sund, H., and Theorelf, H. (1963) in The Enzymes (Boyer, P. D., ed)
Theorell, H., and Yonetani, T. (1963) Biochem. 2. 338,537-553
(1983) J. Biol. Chem. 258,2674-2682
Sci. U. S. A. 74, 5463-5467
3914
133 , 79-84
Vol. 7, pp. 25-83, Academic Press, New York
Wallace, R. B., Johnson, P. F., Tanaka, S., Schold, M., Itakura, K.,
Wallace, R. B., Schold, M., Johnson, M. J., Dembek, P., and Itakura,
Wratten, C. C., and Cleland, W. W. (1963) Biochemistry 2 , 935-941 Wills, C. ( 1976) Nature 2 6 1 , 2 6 2 9 Wills, C., and Jornvall, H. (1979) Eur. J. Biochem. 99,323-331 Winston, F., Chumley, F., and Fink, G. R. (1983) ~e~~ Enzymol.
Young, E. T., and Pilgrim, D. (1985) MOL Cell. Bbl. 5,3024-3034 Young, T., Williamson, V., Taguchi, A., Smith, M., Sledziewski, A.,
Russell, D., O s ~ r m a n n , J., Denis, C., Cox, D., and Beier, D. (1982) in Genetic Engineering of Microorganisms for Chemicals (Hollaen- der, A., DeMoss, R. D., Kaplan, S., Konisky, J., Savage, D., and Wolfe, R. S., eds) pp. 335-361, Plenum Publishing Corp., New York
and Abelson, J. (1980) Science 2 0 9 , 1396-1400
K. (1981) Nucleic Acids Res. 9,3647-3656
101,211-228
Zoller, M. J., and Smith, M. (1984) DNA 3,479-488