kinetic fractionation of non-traditional stable isotopes...
TRANSCRIPT
4Reviews in Mineralogy & GeochemistryVol. 82 pp. 85-125, 2017Copyright © Mineralogical Society of America
1529-6466/17/0082-0004$10.00 http://dx.doi.org/10.2138/rmg.2017.82.4
Kinetic Fractionation of Non-Traditional Stable Isotopes
by Diffusion and Crystal Growth Reactions
James M. WatkinsDepartment of Geological Sciences
University of Oregon Eugene, OR
Donald J. DePaoloEarth Sciences Division
Lawrence Berkeley National Laboratory Berkeley, CA
USAand
Department of Earth and Planetary Science University of California
Berkeley, CA USA
E. Bruce WatsonDepartment of Geology
Rensselaer Polytechnic Institute Troy, NY
USA
INTRODUCTION
Natural variations in the isotopic composition of some 50 chemical elements are now being used in geochemistry for studying transport processes, estimating temperature, reconstructing ocean chemistry, identifying biological signatures, and classifying planets and meteorites. Within the past decade, there has been growing interest in measuring isotopic variations in a wider variety of elements, and improved techniques make it possible to measure very small effects. Many of the observations have raised questions concerning when and where the attainment of equilibrium is a valid assumption. In situations where the distribution of isotopes within and among phases is not representative of the equilibrium distribution, the isotopic compositions can be used to access information on mechanisms of chemical reactions and rates of geological processes. In a general sense, the fractionation of stable isotopes between any two phases, or between any two compounds within a phase, can be ascribed to some combination of the mass dependence of thermodynamic (equilibrium) partition coefficients, the mass dependence of diffusion coefficients, and the mass dependence of reaction rate constants.

86 Watkins, DePaolo & Watson
Many documentations of kinetic isotope effects (KIEs), and their practical applications, are described in this volume and are therefore not reviewed here. Instead, the focus of this chapter is on the measurement and interpretation of mass dependent diffusivities and reactivities, and how these parameters are implemented in models of crystal growth within a fluid phase. There are, of course, processes aside from crystal growth that give rise to KIEs among non-traditional isotopes, such as evaporation (Young et al. 2002; Knight et al. 2009; Richter et al. 2009a), vapor exsolution (Aubaud et al. 2004), thermal diffusion (Richter et al. 2009a, 2014b; Huang et al. 2010; Dominguez et al. 2011), mineral dissolution (e.g., Brantley et al. 2004; Wall et al. 2011; Pearce et al. 2012; Druhan et al. 2015), and various biological processes (e.g., Zhu et al. 2002; Weiss et al. 2008; Nielsen et al. 2012; Robinson et al. 2014). Coverage of these topics, and how they give rise to KIEs, can be found throughout this volume and in the recent literature.
Organization of the article
In the first part of this review, we provide a compilation of the mass dependence of diffusion coefficients in low-temperature aqueous solutions, high-temperature silicate melts, solid metals and silicate minerals. The reader will appreciate both the complexity of isotope diffusion in condensed media as well as the simplicity of the systematic relationships that have emerged, which allow for general predictions regarding the sign and magnitude of isotope fractionation by diffusion in solids and liquids. The second part of this review covers isotope fractionation during crystal growth. We start with models that involve isotope mass dependent diffusion of impurities to a growing crystal. The impurities could be compatible or incompatible elements, provided that they do not affect the growth rate of the crystal itself. We then discuss kinetic isotope fractionation of the stoichiometric constituents of a mineral (e.g., Ca isotopes in CaCO3) due to diffusion as well as surface reaction controlled kinetics, followed by consideration of isotope fractionation of impurities that affect growth rate itself. The presentation includes discussion of three different types of “surface entrapment models,” the underlying mechanisms of mass-dependent reaction rates, and whether isotope fractionation occurs on the aqueous side or the mineral side of the solid–liquid interface.
Throughout the chapter, we rely heavily on trace element and stable isotope data for the mineral calcite because of our own familiarity with this mineral and because it is perhaps the best studied phase in the KIE and crystal growth contexts. We note at the outset that while many of the principles developed herein can be transferred to other minerals with similar (desolvation rate-limited) surface reaction mechanisms or growth pathways, additional work is required to adequately describe KIEs for crystals precipitated via non-classical, particle mediated pathways, as described at the end of this chapter. Along the way, it will be seen that molecular dynamics simulations are playing a key role in drawing connections between nano-scale processes and macro-scale observables related to KIEs.
ISOTOPE FRACTIONATION BY DIFFUSION
The recognition that diffusion is capable of generating measurable (sub-‰) to large (tens of ‰) isotopic fractionations has catalyzed efforts over the past decade towards figuring out how, when and where diffusion is responsible for isotopic variations in nature (e.g., Ellis et al. 2004; Lundstrom et al. 2005; Beck et al. 2006; Roskosz et al. 2006; Teng et al. 2006, 2011; Dauphas 2007; Jeffcoate et al. 2007; Marschall et al. 2007; Parkinson et al. 2007; Rudnick and Ionov 2007; Bourg and Sposito 2008; Gallagher and Elliott 2009; Dauphas et al. 2010; Sio et al. 2013; Müller et al. 2014; Richter et al. 2014a, 2016; Oeser et al. 2015). In this section, we focus on the progress towards a predictive theory for the mass dependence of diffusion coefficients in aqueous solutions, silicate melts, silicate minerals, and metallic alloys at high temperature.

Kinetic Fractionation by Diffusion and Crystal Growth Reactions 87
Expressions for diffusive fluxes
Fick’s first law states that the flux of a chemical species i is directly proportional to the concentration gradient:
,i i iJ D C=− ∇ (1)
where Ji is the flux (moles m−2 s−1), Di is the diffusion coefficient (m2 s−1), and Ci is the concentration (moles m−3). Note that concentration can be expressed as Ci = rwi / Mi, where r is the density of the liquid, wi is the weight fraction of i, and Mi is the molecular weight of i. If the density of the liquid is constant, then concentration gradients can equivalently be expressed in units of wt%. Equation (1) applies to diffusion of a solute in dilute aqueous solution or diffusion of a trace species in an otherwise homogeneous silicate melt. In concentrated solutions or in cases where the diffusing species are unknown, it is customary to define a basis set of chemical components and to recognize that the flux of a component can be driven by concentration gradients in any of the other components. A more general form of Fick’s first law is (Onsager 1945; De Groot and Mazur 1963):
1
1
,n
i ij jj
J D C−
=
= − ∇∑ (2)
where Dij is a matrix of diffusion coefficients. If diffusion of each component i is independent of all other n components, then Dij is a diagonal matrix and each component obeys Equation (1). Generally, this is not the case and the off-diagonal elements of Dij specify the extent of diffusive coupling between the chosen components.
The diffusion coefficients Di or Dij are where most of the complication arises in problems involving chemical diffusion. The diffusivity of an element or species depends on the physical properties of the diffusing medium; it may vary spatially in an anisotropic material and it may depend on variables such as temperature, pressure and chemical composition.
Isotopic mass dependence of diffusion in “simple” systems
The kinetic theory of gases gives the diffusivity of molecules in an ideal gas as:
1 ,3
D = λn (3)
where v is the mean molecular velocity of particles and λ is the mean free path between collisions. Inserting expressions for v and λ, the tracer diffusion coefficient for a molecular species in a dilute gas is (see Lasaga 1998):
2
8,
3 2
RT RTD
MPNd=
ππ(4)
where T, P, N, d, and M are temperature, pressure, Avogadro’s number, the molecular diameter, and the molecular weight of the gas. This expression is the basis for the square-root-of-mass law, which states that the ratio of diffusion coefficients of two gaseous species is proportional to the inverse square root of their mass; i.e.,
1/2
2 1
1 2
,D m
D m
=
(5)
which is only valid for systems in which the assumptions of kinetic theory (point masses, low pressure such that collisions are infrequent and intermolecular forces are negligible) are approximately valid.

88 Watkins, DePaolo & Watson
In condensed systems the effect of mass on diffusion coefficients is considerably more complicated, primarily because the diffusing species have non-negligible potential interactions with their nearest neighbors. Intermolecular potentials are theoretically complex because they depend on the shape and rotation of molecules whose identities are often unknown or are not well defined in systems such as aqueous solutions and silicate melts, as discussed in Watkins et al. (2009, 2011). It has therefore become customary to express the ratio of diffusion coefficients of solute isotopes (D2 / D1) as an inverse power-law function of the ratio of their masses, m2 and m1 (Richter et al. 1999):
2 1
1 2
, D m
D m
β
=
(6)
where β is a dimensionless empirical parameter. In this review, m will refer to isotopic mass and not the mass of isotopically substituted molecules such as, for example, CO2 or CH4. The β factor is a convenient means of reporting the ratio of isotopic diffusion coefficients because it allows for direct comparison between different elements that have different fractional mass differences between the isotopes (e.g., 7 Li / 6 Li, which differ in mass by about 14%, versus 29Si / 28Si, which differ in mass by about 3%).
Isotopic mass dependence of diffusion in aqueous solution
A compilation of β factors for diffusion in aqueous solution is provided in Table 1 and Figure 1. The first takeaway is that isotope fractionation by diffusion in aqueous solution is not nearly as efficient as isotope fractionation by diffusion in a dilute gas, as all but two of the β factors (one measurement for He and one for Ar; see Table 1) are significantly less than the kinetic theory value of 0.5. The second takeaway is that the noble gas elements have larger β factors than the rest of the solutes and their β factors correlate with atomic mass (or radius) such that lighter noble gas elements exhibit greater mass discrimination by diffusion.
The low βs for charged species relative to uncharged species, and the dependence of β on atomic size, can be rationalized by considering solute–solvent interactions and the plausible physical mechanisms of diffusion in aqueous solution. The horizontal axis of Figure 1a is the diffusivity of the species normalized by that of H2O. Most of the ionic species diffuse more
Figure 1. The efficiency of isotope fractionation by diffusion (β) versus metrics for the strength of solute–solvent interactions in aqueous solutions. (a) The β factors correlate with the solvent-normalized diffusiv-ity. Most of the charged species diffuse more slowly than H2O because they interact strongly with their surrounding H2O molecules. (b) Molecular dynamics simulation show that the β factors also correlate with the water exchange rate, kwex, which is equivalent to 1/τ, where τ is the residence time of water molecules in the first hydration sphere surrounding the cation (Bourg et al. 2010). See Table 1 for references.
0.00
0.05
0.10
0.15
0.20
10−1 100 1010.00
0.05
0.10
0.15
0.20
0.2 0.4 0.6 0.8 1.0
He
Ne
Ar
CO2
HCO3HCO-CO2-CO30.0
MgZn Ca
Fe
Li
Na ClK Xe
Br
β
H2ODDi /
β
kwex or 1/τ (ps-1)
He
Ne
Ar
Mg
Li
Na
Cs
KXeCs
Cl
0.0 CaMo Mo
A B

T DescriptionIsotopic system
Dsolute (10−11 m2/s)
Dsolvent (10−11 m2/s) β ReferencesNoble gases
25 °C MD simulation He 785 ± 54 230 ± 10 0.171 ± 0.028 Bourg and Sposito (2008)25 °C Experiment He 722 ± 27 230 ± 10 0.492 ± 0.122 Jahne et al. (1987)25 °C MD simulation Ne 478 ± 37 230 ± 10 0.150 ± 0.018 Bourg and Sposito (2008)20 °C Experiment Ne – 204 ± 10 0.108 to 0.145 Tempest and Emerson (2013)Room? Experiment Ne – – 0.104 ± 0.031 Tyroller et al. (2014)25 °C MD simulation Ar 257 ± 15 230 ± 10 0.078 ± 0.029 Bourg and Sposito (2008)20 °C Experiment Ar – – 0.055 to 0.074 Tempest and Emerson (2013)Room? Experiment Ar N/A N/A 0.508 ± 0.036 Tyroller et al. (2014)25 °C MD simulation Xe 157 ± 11 230 ± 10 0.059 ± 0.023 Bourg and Sposito (2008)
Ionic species75 °C Experiment Ca2+ – 590 ± 10 0.0045 ± 0.0005 Richter et al. (2006)75 °C MD simulation Ca2+ 150 ± 3 590 ± 10 0.0000 ± 0.0108 Bourg et al. (2010)75 °C Experiment Mg2+ – 590 ± 10 0.0000 ± 0.0015 Richter et al. (2006)75 °C MD simulation Mg2+ 121 ± 6 590 ± 10 0.006 ± 0.018 Bourg and Sposito (2007)75 °C Experiment Li+ – 590 ± 10 0.015 ± 0.002 Richter et al. (2006)75 °C MD simulation Li+ 212 ± 8 590 ± 10 0.0171 ± 0.0159 Bourg and Sposito (2007)25 °C Experiment Na+ – – 0.023 ± 0.023 Pikal (1972); Richter et al. (2006)75 °C MD simulation Na+ 269 ± 9 590 ± 10 0.029 ± 0.0.022 Bourg et al. (2010)75 °C Experiment K+ – 590 ± 10 0.042 ± 0.002 Bourg et al. (2010)75 °C MD simulation K+ 385 ± 17 590 ± 10 0.049 ± 0.017 Bourg et al. (2010)75 °C MD simulation Cs+ 404 ± 20 590 ± 10 0.030 ± 0.018 Bourg et al. (2007)75 °C Experiment Cl− – 590 ± 10 0.0258 ± 0.0144 Richter et al. (2006)21 °C Experiment Cl- 114 ± 14 209 ± 10 0.0296 ± 0.0027 Eggenkamp and Coleman (2009)75 °C MD simulation Cl− 327 ± 14 590 ± 10 0.034 ± 0.018 Bourg and Sposito (2007)21 °C Experiment Br− 153 ± 17 209 ± 10 0.025 ± 0.005 Eggenkamp and Coleman (2009)20 °C Experiment Fe 57.8 ± 2.3 204 ± 10 0.0025 ± 0.0003 Rodushkin et al. (2004)20 °C Experiment Zn 47.1 ± 0.7 204 ± 10 0.0019 ± 0.0003 Rodushkin et al. (2004)
Molecular species
20 °C,pH ~0.5
Diffusion of Mo7O24
6− and Mo8O26
4−Mo 52 ± 10 204 ± 10 0.0000 ± 0.0010 Malinovsky et al. (2007)
20 °C,pH ~7
Diffusion of MoO4
2− Mo 124 ± 2 204 ± 10 0.0058 ± 0.0019 Malinovsky et al. (2007)
25 °C ExperimentCO2
(13C)191 ± 7 230 ± 10 0.039 ± 0.009 Jähne et al. (1987)
25 °C MD simulationCO2
(13C)204 ± 35 230 ± 10 0.01 to 0.14 Zeebe (2011)
25 °C MD simulationHCO3
− (13C)
110 ± 18 230 ± 10 −0.04 to 0.17 Zeebe (2011)
25 °C MD simulationCO3
2−
(13C)80 ± 18 230 ± 10 −0.04 to 0.13 Zeebe (2011)
20 °CGas–water exchange exp.
H2 N/A 204 ± 10 0.067 to 0.090 Knox et al. (1992)
20 °C ExperimentCH4 (13C)
N/A 204 ± 10 0.020 to 0.026 Fuex (1980)
20 °C Experiment O2 N/A 204 ± 10 0.069 to 0.093 Benson and Krause (1980)20 °C Experiment N2 N/A 204 ± 10 0.050 to 0.066 Benson and Krause (1980)
Notes1. Water diffusivity comes from Bourg and Sposito (2007) (their Fig. 1)2. For gas-water exchange experiments, the range in b represents the range of n = 0.5 to 0.67, where n is related to the dynamics of the air-water interface (cf. Tempest and Emerson 2013)
Table 1. Isotopic mass dependence of diffusion in aqueous solutions

90 Watkins, DePaolo & Watson
slowly than H2O (Di / 2H OD < 1) because the polar water molecules interact strongly with ions in solution, forming a hydration sphere. If a number of water molecules are strongly bound to the ion, the hydrodynamic radius becomes larger, and as a result, the diffusivity as well as the fractional mass difference between isotopically substituted hydrated ions is smaller, leading to an attenuated mass discrimination.
The nature of solute-solvent interactions can now be probed in more detail using molecular dynamics simulations. For example, the metal–water exchange frequency (kwex), which is the inverse of the average residence time of water molecules in the first solvation shell, has been shown to correlate with the calculated mass dependence on diffusivity (Fig. 1b). A low kwex implies that water molecules are more strongly affixed to the diffusing cation. The correlations between β and proxies for the strength of solute–solvent interactions are evidence that whenever the hydration shell is massive enough, or alternatively, the lifetime of the water molecules in the hydration shell long enough, diffusion is sluggish and the isotopic effect on diffusion tends toward zero, as seems to be the case for aqueous Mg2+. An important side note is that kwex itself has a mass dependence (Hofmann et al. 2012), which has implications for the origin of kinetic isotope effects due to desolvation at a mineral surface, as discussed in a later section.
Isotopic mass dependence of diffusion in silicate melts
Diffusion data in silicate liquids is usually presented and modeled in terms of simple oxide components even though diffusion does not occur through the motion of long-lived or ‘indestructible’ molecules. Instead, the evidence from nuclear magnetic resonance (NMR) studies is that diffusion occurs through rapid chemical exchange between the constituent molecular structures (Stebbins 1995). The main structural units in silicate materials are silica and alumina tetrahedra, 4
4(Si,Al)O − , that are linked together by bridging oxygen atoms to form chains, sheets, and three-dimensional networks. The degree of interlinking, or polymerization, is dependent on a number of factors, including the presence and abundance of other cations (Fe, Mg, Ca, Na, and K), making it difficult to classify the diffusing species. A loose analogy to aqueous solutions can be drawn by considering silicate melts as “concentrated solutions,” with the 4
4(Si,Al)O − tetrahedra units being the “solvent” molecules. Such an analogy is useful insofar as the mass dependence on diffusivity seems to vary systematically with the strength of cation–aluminosilicate (“solute–solvent”) interactions, as seen above for diffusion in dilute aqueous solutions.
Richter et al. (1999) were the first to investigate the mass dependence of diffusion in silicate melts. They measured Ca isotope fractionation by diffusion in molten CaO–Al2O3–SiO2 melts and Ge isotope fractionation by diffusion in molten GeO2. Those experiments, and the ones that have followed, involve juxtaposing two silicate glass cores or powders of different composition but the same (or nearly the same) stable isotope ratio for the element of interest. When heated above the liquidus for a specified duration, diffusion leads to stable isotope fractionation because light isotopes tend to diffuse faster than heavier isotopes. The diffusion couple experiments of Richter et al. (1999) showed that measurable isotopic fractionations can arise even at the high temperatures of molten silicates.
Richter et al. (2003, 2008, 2009b) and Watkins et al. (2009) reported β factors for Ca, Li, Mg, and Fe in diffusion-couple experiments involving natural silicate liquid compositions (e.g., basalt–rhyolite and ugandite–rhyolite). A key observation is that the major elements (Ca, Mg, and Fe) exhibit less mass discrimination (β ≈ 0.05 ± 0.05) than elements that are present in minor quantities such as Li (β ≈ 0.22). This has been attributed to the cooperative nature of diffusion in dense systems, either due to diffusion of multi-atom complexes or other factors such as mass balance; a diffusive flux of a major component must be accommodated by a concomitant flux of the other components (Watkins et al. 2009). Subsequently, Watkins et al. (2011) studied diffusive isotopic fractionation of Ca and Mg in diffusion-couple experiments involving simplified liquids along the albite–anorthite and albite–diopside join. In these experiments, the cations Mg and Ca

Kinetic Fractionation by Diffusion and Crystal Growth Reactions 91
were present in relatively minor quantities (< 5 wt%) and it was shown that β can be highly variable for a given cation depending on liquid composition. To further understand the relationship between isotope fractionation and diffusive coupling between components, Watkins et al. (2014) investigated isotope fractionation by multicomponent diffusion in molten CaO–Na2O–SiO2. Their experiments show that diffusive isotopic fractionation can depend on the direction of diffusion in composition space, even for a given bulk composition, and that large diffusive isotope fractionations do not require large concentration gradients in the diffusing element.
Despite the complexity of isotope diffusion in silicate melts, some generalizations can be made from the few experiments that have been carried out thus far. The overall range of measured β factors is 0–0.22, considerably less than the value of 0.5 for dilute gases and comparable to the range observed for diffusion in aqueous solutions. As shown in Figure 2a, the β factors vary systematically with the solvent-normalized diffusivity, here taken to be the diffusivity of the cation normalized by that of Si. Since Si is strongly bound in multi-atom complexes with O (as well as Al and other Si atoms), it diffuses more slowly than other elements, and hence the ratio Di / DSi is generally greater than 1. This is opposite the case for diffusion in aqueous solutions, where the solvent H2O molecules interact weakly with one another and hence are more mobile than the solute ions. In cases where the elements are present in major quantities, the ratio Di / DSi is close to unity. For minor or trace species, faster diffusion implies a decoupling between the diffusing component and the rest of the components in the liquid, and corresponds to greater mass discrimination. The regime where Di / DSi → 1 tends to occur in more silica-rich liquids and with decreasing temperature (Dingwell 1990). This is borne out in Figure 2b, which indeed suggests a direct link between the β factors for Ca and the SiO2 + Al2O3 content of the liquid.
Just as MD simulations have been valuable for probing the mechanisms of mass discrimination by diffusion in aqueous solution, MD simulations involving simplified silicate melt compositions are being used to complement the experimental studies. Goel et al. (2012) used MD simulations to determine β factors for Mg and Si in MgSiO3 and SiO2 liquids at 4000–4500 K. Their results are in good agreement with experimental data (Fig. 2a), and suggest that large diffusive isotope effects persist at extreme temperatures. The details of their study, and their discussion about the cooperative nature of diffusion in dense liquids, is exemplary for how MD simulations can be used to probe solute–solvent interactions in ways that are not accessible to spectroscopic and experimental diffusion studies.
Figure 2. The efficiency of isotope fractionation by diffusion (β) versus metrics for the strength of solute-solvent interactions in silicate melts. (a) The β factors correlate with the solvent-normalized diffusivity. Cations that diffuse much faster than silicon (e.g., lithium) move in a way that is decoupled from the motion of melt matrix and therefore exhibit a larger mass discrimination. Other cations, such as iron, that diffuse only slightly faster than silicon are inferred to be coupled to the motion of larger aluminosilicate complex and therefore exhibit much smaller mass discrimination. (b) Higher values of β (as well as Di/DSi) tend to occur in higher silica liquids. See Table 2 for references.
Di /DSi
β
Ca Li
Mg
Fe
Si
ExperimentsMD simulations
Mg
Ca
Ca
Mg
Mg
0.00
0.05
0.10
0.15
0.20
0.25
50 60 70 80 90
SiO2 + Al2O3
Ca
Ca
Ca
Ca
0.00
0.05
0.10
0.15
0.20
0.25
100 101 102 103
Ca
A B

92 Watkins, DePaolo & Watson
Isotopic mass dependence of diffusion in minerals and metals
The classical theory of the isotopic mass dependence of diffusion rates in crystalline solids was developed in the 1950s to 1960s (Vineyard 1957; Schoen 1958; Tharmalingam and Lidiard 1959; Mullen 1961; Le Claire 1966; Rothman and Peterson 1969). The primary goal of these studies was to use β factors alongside crystal lattice models to infer diffusion mechanisms (e.g., interstitial, vacancy, divacancy, collinear interstitialcy, direct exchange, etc.; see Rothman and Peterson 1969) as well as the properties of point defects (Schüle and Scholz 1979).
Richter et al. (2009a) compiled β factors for diffusion of cations in metals and metalloids (their Fig. 8 and grey symbols in Fig. 3). All of the values are less than 0.5, with many between 0.15 and 0.35, demonstrating that mass discrimination is generally larger for diffusion in solids than in aqueous solutions and silicate melts. The scatter of β factors plotted against temperature reflects the sensitivity of mass discrimination by diffusion to the nature of the cation as well as the composition of the solid host. Diffusion in solids is further complicated by diffusion anisotropy, wherein the diffusion mechanism or rate of diffusion by a single mechanism depends on the direction of the diffusive flux in relation to, for example, the crystallographic axes.
Figure 3. Compilation of β factors in metals and minerals. Gray symbols are data from the materials sci-ence literature compiled by Richter et al. (2009a). Isotope fractionation by diffusion is more efficient in ideal gases (β = 0.5) than in solids (β ~ 0.25 ± 0.15) and liquids (β < 0.2; Figs. 1 and 2). The scatter in the data for solids reflects the sensitivity of β factors to the diffusing cation, the host composition, purity of the host, and temperature. Black symbols are data from the relatively recent geoscience literature (Roskosz et al. 2006; Dauphas 2007; Sio et al. 2013; Müller et al. 2014; Richter et al. 2014a; Oeser et al. 2015; Van Orman and Krawczynski 2015). Curves are calculated βs for different cations diffusing by a vacancy mechanism in periclase (MgO) (Van Orman and Krawczynski 2015).
β
0.0
0.1
0.2
0.3
0.4
0.5
0 500 1000 1500 2000 2500
T (˚C)
Ni
CoMn
Fe
Mg in MgO
Various elements in metals and metalloids (Richter et al. 2009 compilation)Fe and Ni in Fe-Ni alloysLi in diopsideC in Fe metalFe in olivine
Mg in olivineFe in Fe metalCo in MgO

Kinetic Fractionation by Diffusion and Crystal Growth Reactions 93
In the materials science literature, isotopic diffusion coefficients are often discussed in terms of the number and masses of other atoms whose motions are correlated with the movement of the atom of interest (e.g., Vineyard 1957; Schoen 1958; Mullen 1961; Mundy et al. 1966; Rothman and Peterson 1969). Such information is folded into the so-called correlation and coupling coefficients:
H
L
H
1/2
L
11
,2
2 1
D
Df
m
m
−
β ≈ = κ −
(7)
where f (< 1) is the correlation coefficient, representing the degree to which the diffusion process deviates from a random walk, and the κ is the coupling coefficient, representing the degree to which the motion of an atom during a single jump is coupled to that of other nearby atoms (Van Orman and Krawczynski 2015). The values of f and κ depend on the diffusion mechanism(s) as well as the type of lattice (Mullen 1961; Le Claire 1966). For example, f is close to unity for diffusion by an interstitial mechanism but deviates from unity for diffusion by a vacancy mechanism (e.g., Le Claire 1966). The parameter κ is related to the deformation (dilation/relaxation) of the crystal lattice that accompanies the diffusive jump of an atom (Le Claire 1966; Müller et al. 2014). Historically, β factors have been used to infer either f or κ given independent knowledge of one or the other, but in principle, if f and κ are known independently, they can be used to predict β.
Van Orman and Krawczynski (2015) provide a comprehensive review of the classical theory applied to diffusion in silicate minerals. They point out that κ values range from 0.5 to 1.0 whereas f values range from 0 to 1.0. They show how to calculate f for (1) diffusion of trace elements by a vacancy, interstitial, or interstitialcy mechanism, (2) diffusion of major elements (e.g., Mg in MgO) and (3) diffusion along grain boundaries. In most cases there are no experimental data on the mass dependence of the diffusivity to compare to the theoretical predictions, and most of the theoretical predictions are not purely theoretical, but are derived from experimental diffusion data by applying the classical theory. In some instances, there is enough information to make predictions. The curves in Figure 3 show the expected behavior of Fe, Mn, Co and Ni diffusion by a vacancy mechanism in MgO using diffusion parameters from density functional theory calculations (Crispin et al. 2012; Van Orman and Krawczynski 2015). An encouraging result is that the curve for Co intersects the only experimental data point for Co at 1300 ºC. It is noteworthy that the β factors are expected to increase with temperature for these cations because they exchange with vacancies more readily than Mg. The temperature-dependence of β has the opposite sense for trace elements that exchange with vacancies less readily than the solvent Mg atoms. For olivine, the prediction is that βFe < βNi < βMg < βCa, but the experimental data suggest that βFe > βMg (Fig. 3; Sio et al. 2013; Oeser et al. 2015). Some possible reasons for this discrepancy are discussed by Van Orman and Krawczynski (2015) and include uncertainty in the binding energy between Fe and vacancies and local ordering in olivine that is not accounted for in the theory. For magnetite, the prediction is that the slowly diffusing cations Ni, Cr, Al and Ti have β factors of about 0.4–0.45 that do not vary with Ti content. Other cations such as Fe, Co, and Mn are predicted to have smaller β factors (~0.2 to 0.3) that are sensitive to Ti content. For rutile, the β factors for Co, Mn, Fe, Ni and Li are expected to exhibit anisotropy because these cations diffuse rapidly in the c-direction and slowly in the a-direction. In general, faster diffusion in solids implies less mass discrimination, opposite the relationship observed in aqueous solutions and silicate melts. All of these predictions are subject to caveats, as discussed by Van Orman and Krawczynski (2015), but offer much in the way of testable hypotheses moving forward.
94 Watkins, DePaolo & Watson
The motivation to interpret stable isotope variations in nature has led to renewed efforts to determine β factors in silicate minerals and metals relevant to geochemistry and cosmochemistry (black symbols in Fig. 3). The β factors measured over the past decade have been used in models of Fe and Ni isotope fractionation during growth of kamacite (α-Fe) lamellae in taenite (γ-Fe) (Dauphas 2007), diffusion of Fe into metal from a silicate liquid reservoir (Roskosz et al. 2006), C isotope fractionation during growth of γ-Fe in meteorites (Müller et al. 2014), and Fe, Mg, and Li isotope exchange between olivine or pyroxene and the host rock/melt during subsolidus cooling (Beck et al. 2006; Sio et al. 2013; Richter et al. 2014a; Oeser et al. 2015). The experimental studies are also guiding theoretical developments, leading to a deeper understanding of how β factors are related to the physical mechanisms of diffusion in solids (see, in particular, Müller et al. 2014 and Richter et al. 2014a).
DIFFUSIVE BOUNDARY LAYERS IN THE GROWTH MEDIUM
In this section we describe the effects of competition between mineral growth rate and isotope fractionation by diffusion in the fluid phase, with growth rate being a specified dependent variable. A common assumption, which is adopted here for now, is that the surface of the mineral is in equilibrium with the composition of the fluid at the solid–fluid interface. It is also assumed, for now, that diffusion in the solid is negligible. Hence, any kinetic effects described in this section are due to diffusion in the fluid phase. These effects are placed in a broader context in the next section, where growth rate, diffusion in the growth medium and the kinetics of chemical exchange at the mineral surface are addressed concurrently.
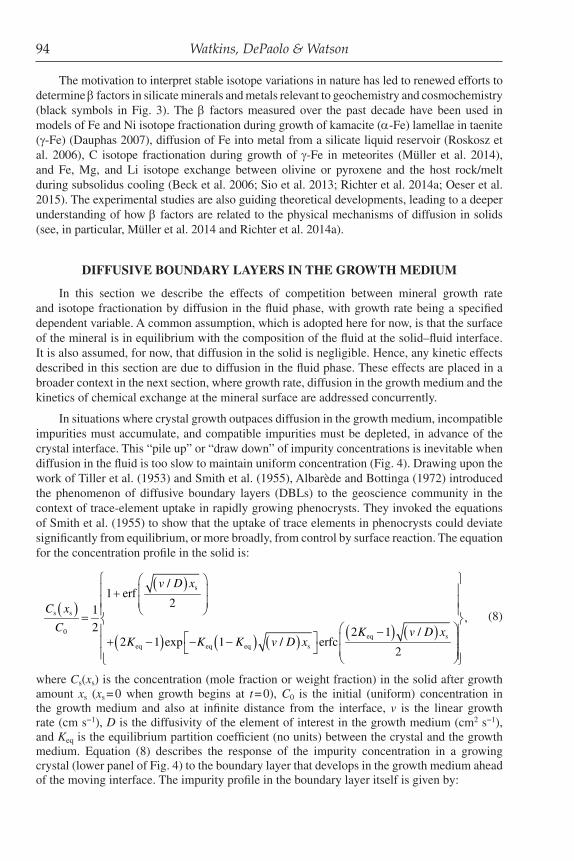
In situations where crystal growth outpaces diffusion in the growth medium, incompatible impurities must accumulate, and compatible impurities must be depleted, in advance of the crystal interface. This “pile up” or “draw down” of impurity concentrations is inevitable when diffusion in the fluid is too slow to maintain uniform concentration (Fig. 4). Drawing upon the work of Tiller et al. (1953) and Smith et al. (1955), Albarède and Bottinga (1972) introduced the phenomenon of diffusive boundary layers (DBLs) to the geoscience community in the context of trace-element uptake in rapidly growing phenocrysts. They invoked the equations of Smith et al. (1955) to show that the uptake of trace elements in phenocrysts could deviate significantly from equilibrium, or more broadly, from control by surface reaction. The equation for the concentration profile in the solid is:
( )( )
( ) ( ) ( ) ( ) ( )
s
s s
0eq s
eq eq eq s
/1 erf
21,
2 2 1 /2 1 exp 1 / erfc
2
v D x
C x
C K v D xK K K v D x
+ =
− + − − −
(8)
where Cs(xs) is the concentration (mole fraction or weight fraction) in the solid after growth amount xs (xs = 0 when growth begins at t = 0), C0 is the initial (uniform) concentration in the growth medium and also at infinite distance from the interface, v is the linear growth rate (cm s−1), D is the diffusivity of the element of interest in the growth medium (cm2 s−1), and Keq is the equilibrium partition coefficient (no units) between the crystal and the growth medium. Equation (8) describes the response of the impurity concentration in a growing crystal (lower panel of Fig. 4) to the boundary layer that develops in the growth medium ahead of the moving interface. The impurity profile in the boundary layer itself is given by:

Kinetic Fractionation by Diffusion and Crystal Growth Reactions 95
Figure 4. Development of a diffusive boundary layer (DBL) during 1-D crystal growth. Top: Four snapshots in time of a DBL (shaded) in the growth medium against a crystal interface advancing from left to right, where the curves above the shaded areas are given by Equation (9). Assuming equilibrium at the immediate interface, the concentration of the element of interest in the crystal follows that in the immediately contacting growth medium (Cs = Keq · Cl), where Keq is the equilibrium partition coefficient between the crystal and the growth medium. Bottom: The concentration profile in the crystal, which is given by Equation (8). The inset shows the slight difference in concentration between two isotopes whose diffusivities in the growth medium differ by 1%. The partition coefficient is assumed to be identical for the two isotopes (i.e., no solid–liquid equilibrium fractionation), so the observed fractionation is attributable entirely to the difference in diffusivity.
0.0 0.2 0.4 0.6 0.8 1.0
x (crystal growth in cm)s
0
2
4
6
8
10
12
eqn 8
interface
11.0
10.0
10.5
0.90 0.95 1.0
conc.
in c
ryst
al
0
200
400
600
800
1000
1200
eqn 9
DBL
conc.
in b
oundary
laye
r
-1���/D = 10 cm
K = 0.01eq
C � 1000

96 Watkins, DePaolo & Watson
( ) ( ) ( )
( ) ( )
( )
eq
0 eq
eqeq eq
eq eq
eq
1 11 exp erfc erfc
2 22 2
1 1 1exp 1
2 1
1erfc 2 1 ,
2
l l l ll
l
l
C x x vt x vtK vx
C K D Dt Dt
K vK x K vt
K K D
x K vtDt
− +− = + − − − + − − − + × −
+ −
(9)
where Cl(xl) is the concentration of the impurity in the growth medium at time t and distance xl from the interface (upper panel of Fig. 4). Tiller et al. (1953) showed that for sustained crystal growth, the concentration profile given by Equation (9) (i.e., the diffusive boundary layer) eventually reaches a steady state in which growth and diffusion are balanced and the effective bulk partition coefficient becomes unity. At this stage, the steady-state concentration profile in the growth medium is given by
( ) eq
0 eq
11 exp .l l
l
C x K vx
C K D
− = + −
(10)
The simplicity of this equation is appealing, but for the range of growth rates and diffusivities pertinent to natural systems, this steady-state condition is never likely to be achieved. It can be seen by inspection of Equations (8) and (9) that the ratio v / D (along with Keq) is key in determining the amplitude of the concentration perturbation in the growth medium and the consequent deviation from the equilibrium in the crystal. Albarède and Bottinga (1972) emphasized the importance of v / D, but they were handicapped in making specific predictions about non-equilibrium behavior of individual trace elements by the lack of data constraining the growth rate v of phenocrysts and the diffusivity D of elements of interest in the molten silicate growth medium. For phenocryst growth in molten basalt, much more is known today than was known in 1972 about appropriate values of v and D, but the usefulness of the equations of Smith et al. (1955) nevertheless remains limited by the fact that they pertain to growth and diffusion in one dimension only. In petrological systems, the length scales of diffusion in fluid growth media are comparable to the crystal sizes under consideration, which means that multidimensional aspects of diffusion are probably important. In addition, the width of the diffusive boundary layer and the magnitude of any non-equilibrium effects resulting from its presence will be influenced by the dynamics of the liquid phase.
In the context of the present review of isotopic fractionations during crystal growth, we can use the β factors in Table 2 to calculate non-equilibrium isotopic profiles in crystals and their surrounding host medium. The lower panel of Figure 4 shows the subtle difference in the concentration profiles in a hypothetical crystal of two isotopes of a given element whose abundances in the growth medium are the same but whose diffusivities differ by 1%. The slower-diffusing isotope is enriched in the crystal because its concentration rises to a slightly higher level in the diffusive boundary layer (for an incompatible element). The net result is that the isotope ratio in the crystal is different from that in the bulk growth medium, amounting to a kinetic fractionation. The example in Figure 4 serves as a useful illustration of the potential for rapid crystal growth to fractionate isotopes, but the large magnitude of the isotopic separation (~10‰) is unrealistic for three reasons: (1) nearly a centimeter of sustained rapid growth is required to produce it, (2) the 1% difference in diffusivity is on the high side of the plausible range for natural systems (see below), and (3) the 1-D equation of Smith et al. (1955) was used to generate the diagram (Eqn. 8). Crystal growth in 3-D produces more subdued effects, but these may nevertheless be significant in some instances.

Kinetic Fractionation by Diffusion and Crystal Growth Reactions 97
Watson and Müller (2009) extended the approach of Smith et al. (1955) and Albarède and Bottinga (1972) to spherical geometries using finite-difference numerical approaches incorporating a moving boundary. Here, the growth rate v for a spherical crystal is considered to be a linear increase in radius with time, although other growth rate laws are just as worthy of consideration (see Gardner et al. 2012). For the present purposes, we consider three hypothetical pairs of isotopes whose diffusivities differ by 0.1%, 0.5% and 1%. These differences can be related to those between actual isotope pairs using Table 2, which lists diffusivity ratios for relevant isotopes of Li, Mg, Ca, and Fe based on measured or estimated β values. In Figure 5, the isotopic consequences of a diffusive boundary layer in the growth medium are shown as radial isotope profiles in the crystal for both incompatible and compatible elements; i.e., Keq = 0.01 and 100. These partition coefficients are arbitrary, but the results for all elements with Keq < 0.1 are very similar, as are those for all elements with Keq > 10.
Figure 5 shows model isotope profiles in crystals grown from 0.001 to 0.5 cm in radius for v / D ratios varying from 0.2 to 10 cm−1, which is considered a plausible range for phenocryst growth in which diffusive isotope fractionation in a boundary might occur. Values of v / D < 0.2 cm−1 produce minimal isotope fractionation, and sustained v / D values > 10 cm−1
Description Composition ElementDx/DSi
Isotope masses: heavy, light
β Diffusivity ratio
References
Natural volcanic liquids
basalt–rhyolite Ca 1.6 44, 40 0.075 0.993 Richter et al. (2003)
basalt–rhyolite Ca 2.2 44, 40 0.035 0.997 Watkins et al. (2009)
basalt–rhyolite Mg1 − 26, 24 0.050 0.996 Richter et al. (2008)
basalt–rhyolite Li 290 7, 6 0.215 0.967 Richter et al. (2003)
basalt–rhyolite Fe 1.3 56, 54 0.030 0.999 Richter et al. (2009b)
Simple silicate liquids
albite + anorthite Ca 23 44, 40 0.210 0.980 Watkins et al. (2011)
albite + diopside Ca 6.3 44, 40 0.165 0.984 Watkins et al. (2011)
albite + diopside Mg 1.5 26, 24 0.100 0.992 Watkins et al. (2011)
CaO–Na2O–SiO2 Ca – 44, 40 0.100 0.991 Watkins et al. (2014)
CaO–Na2O–SiO2 Ca – 44, 40 0.060 0.994 Watkins et al. (2014)
Molecular dynamics simulations
SiO2 Si 1 30, 28 0.055 0.996 Goel et al. (2012)
SiO2 Si 1 30, 28 0.042 0.997 Goel et al. (2012)
SiO2 Si 1 30, 28 0.063 0.996 Goel et al. (2012)
SiO2 Si 1 30, 28 0.045 0.997 Goel et al. (2012)
MgSiO3 Si 1 30, 28 0.047 0.997 Goel et al. (2012)
MgSiO3 Si 1 30, 28 0.043 0.997 Goel et al. (2012)
MgSiO3 Si 1 30, 28 0.047 0.997 Goel et al. (2012)
MgSiO3 Mg 4.3 26, 24 0.135 0.989 Goel et al. (2012)
MgSiO3 Mg 2.3 26, 24 0.092 0.993 Goel et al. (2012)
MgSiO3 Mg 2.3 26, 24 0.084 0.993 Goel et al. (2012)
Table 2. Isotopic mass dependence of diffusion in silicate melts
Notes:1. In Figure 2 it is assumed that DMg / DSi ≈ 1.

98 Watkins, DePaolo & Watson
0.0
0.1
0.2
0.3
0.4
0.5
0.6
1 2 3 4 50
H LD /D = 0.999
= 0.01Keq10
5
1
0.5
0.2
c
center rim
radial position (mm)
incompatible compatible
0
1
2
3
4
5
6
1 2 3 4 50
H LD /D = 0.99
K = 0.01eq
10
5
a
1
0.5
0.2
-1 /D (cm ) = 2
1 2 3 4 50
H LD /D = 0.99
= 100Keq
2
5
1
0.5
0.2
0
-2
-4
-6
-8
d
-1 /D (cm ) = 10
-1 /D (cm ) = 2
1 2 3 4 50
H LD /D = 0.995
= 0.01Keq10
5
1
0.5
0.20.0
1.0
2.0
3.0
0.5
1.5
2.5
b
H/L
�
(‰)
-1 /D (cm ) = 2
1 2 3 4 50
H LD /D = 0.995
= 100Keq
0
-1
-2
-3
-4
e
2
5
1
0.5
0.2
-1 /D (cm ) = 10
1 2 3 4 50
H LD /D = 0.999
= 100Keq0.0
-0.2
-0.4
-0.6
-0.8
f
center rim
2
5
1
0.5
0.2
-1 /D (cm ) = 10
Figure 5. Radial isotope fractionation profiles resulting from development of diffusive boundary layers in the growth medium of a spherical crystal. The curves are outputs of numerical simulations in which the crystal was allowed to grow from 0.01 to 5 mm in radius, with v / D varying from 0.2 to 10 cm−1 (see Watson and Mül-ler 2009). Isotope fractionation is expressed in conventional geochemical δ notation, referenced to the isotope ratio in the growth medium (Eqn. 11). Superscripts H and L refer to the heavy and light isotope, respectively; the ratio DH/DL is indicated in each panel (compare with specific isotope pairs listed in Table 2). Panels a–c show behavior of the isotopes of an incompatible element (Keq = 0.01); panels d–f are for compatible elements (Keq = 100). Note that the magnitude of the isotopic fractionation scales linearly with DH/DL.

Kinetic Fractionation by Diffusion and Crystal Growth Reactions 99
are probably uncommon given typical rates of phenocryst growth (e.g., Maaløe 2011). Isotopic fractionation is portrayed in Figure 5 using geochemical δ notation:
( )( )
intH L
H/L
H L
/1 1000,
/
C C
C C∞
δ = − ×
(11)
where (CH / CL)int is the concentration ratio of the heavy (H) to light (L) isotope in the melt at the interface with the crystal, and (CH / CL)∞ is the “far-field” isotope ratio in the melt. Assuming no equilibrium fractionation of isotopes between crystal and melt (i.e., assuming Keq is not dependent on mass), (CH / CL)int is acquired by the crystal as it grows, leading to the radial isotopic profiles shown in Figure 5. An important generalization from this figure is that fractionation of the isotopes of incompatible elements leads to enrichment of the heavy isotope in the crystal, with the isotopic fractionation increasing monotonically as the crystal grows (Fig. 5a–c). For compatible elements, on the other hand, the heavy isotope is depleted in the crystal and the isotopic fractionation is greatest (i.e., δH/L reaches a minimum) after a relatively small amount of growth and lessens thereafter (Fig. 5d–f).
The radial isotope profiles in crystals shown in Figure 5 were produced by numerically monitoring the development of diffusive boundary layers around spherical crystals during growth. After 5 mm of growth, the resulting diffusion fields (“haloes”) extend from the crystal interface to a distance of ~0.2 cm to ~2 cm into the growth medium for v / D values of 10 and 0.2 cm−1, respectively (see Fig. 5 of Watson and Müller 2009). It is important to ask under what natural circumstances such large diffusion fields could develop without disruption by physical factors. The low viscosity of mafic magmas means that growing crystals are likely to be in motion relative to their growth medium, which would lead to erosion of a developing diffusion field. For this reason, even though the fractionation curves in Figure 5 are quantitatively accurate, they may overestimate isotopic fractionation during phenocryst growth in mafic systems. The purely diffusive model represented by Figure 5 may be more relevant to crystal growth in relatively viscous, silicic melts in which crystal motion relative to the growth medium might be unimportant, and perhaps also to porphyroblast growth in metamorphic systems.
In addition to static environments in which mass transport occurs solely by diffusion, Watson and Müller (2009) also discussed dynamic crystal-growth environments in which the width of the diffusive boundary layer is regulated by fluid dynamics. Despite the seeming greater complexity of dynamic systems, isotope fractionation during crystal growth can be modeled in such systems without resorting to complex numerical simulations. A simple analytical expression can be used, provided the width of the boundary layer in the growth medium can be specified on the basis of fluid dynamical considerations:
( ) ( )H
BLeqL H
‰ 1000 1 1 .D vx
KD D
δ = − −
(12)
This general equation of Watson and Müller (2009) describes the expected steady-state (maximum) fractionation of two isotopes in a growing crystal in terms of the ratio of their diffusivities (DH/DL) in the growth medium and the thickness (xBL) of the physically regulated boundary layer. As in the case of Equation (10), the steady-state described by Equation (12) is established only after a certain amount of growth, which in this case depends critically on the width of the physical boundary layer. If the boundary is thin, as in the case of low viscosity silicate melts (e.g., 10−100 mm; see Kerr 1995), the steady-state is closely approached after a relatively small amount of growth (Fig. 6). However, this figure also shows that for physical boundary layers substantially wider than ~100 mm, the steady state may not be approached for

100 Watkins, DePaolo & Watson
typical crystal sizes of a few millimeters. As noted by Watson and Müller (2009), Equation (12) provides an accurate prediction of the level of steady-state fractionation for highly incompatible elements (Keq ≲ 0.1), but accuracy decreases as the element of interest becomes more compatible. For Keq ~ 0.4, for example, the fractionation is underestimated by ~14‰.
A fundamental assumption in the development and use of Figures 5 and 6 and Equation (12) is that the radius of the crystal of interest increases linearly with time (dr / dt is constant). Other possibilities are illustrated in Figure 7; these include an inverse square-root dependence of v upon time and a linear increase in v with time (the specifics are shown in Fig. 7b). In the first of these two models, the initially high growth rate decelerates sharply at the outset and more slowly as growth continues (Fig. 7c), which is the expected pattern for diffusion-controlled crystal growth (e.g., Zhang 2008, p. 277). The linearly accelerating growth rate, on the other hand, might be realistic for interface reaction-controlled growth under conditions of strong undercooling; i.e., with ∆Gcrystallization becoming increasingly negative with increasing time. In Figure 7, these two markedly different growth scenarios are compared with the constant-dr / dt model used in generating Figures 5 and 6. The specific growth laws were chosen to produce the same total amount of growth (5 mm) in a given time (6.7 × 10⁶ s) (Fig. 7b–c). The potential of these different growth scenarios to fractionate isotopes is illustrated in Figure 7e using DH / DL = 0.993, which would apply to diffusion of 44Ca versus 40Ca in basaltic melt, for example. The partition coefficient Keq between the crystal and the growth medium was assumed to be 0.01, but the results would be similar for any moderately to strongly incompatible element. A specific value of D (10−8 cm2 s−1) was used to produce Figure 7, but because it is v / D that determines outcome, the ratio is plotted in Figures 7c–d. The simple conclusion from
Figure 6. Isotope fractionation as a consequence of crystal growth with v / D = 10 cm−1 in a dynamic medium where the diffusive boundary layer (DBL) is limited to a fixed width (xBL) by fluid dynamical considerations. The smooth curves represent numerical results for radial crystal growth in which xBL widens by diffusion until the pre-specified maximum is reached and a steady state established. The dotted lines show the frac-tionation given by Equation (12), which was derived for linear growth with the steady-state DBL present from the start (see Watson and Müller 2009). For xBL values that are small relative to the crystal size, Equa-tion (12) provides a good estimate of δH/L. For phenocryst growth in magmas, xBL is probably < 100 mm.
radial position in crystal (mm)
0 4 6 8 10 2
0.0
0.5
1.0
1.5
2.0
xBL = 400 �m
50 �m
25 �m
100 �m
x = 00 �mBL 2
equation 12
numerical resultH
/L
�(‰
)
-1 /D=10 cmH
D / 0.995
= 0.01
LD =
Keq

Kinetic Fractionation by Diffusion and Crystal Growth Reactions 101
Figure 7e is that the constant v and v α t models produce broadly similar δH/L versus radial position curves. However, the rapid initial growth scenario causes an abrupt deviation from equilibrium (rise in δH/L) near the center of the crystal that is maintained throughout the 5 mm of growth. The lesson seems to be that an early perturbation from equilibrium caused by fast initial growth (v / D ~ 80 cm−1) can be maintained by only modest subsequent v / D (~5 cm−1).
Figure 7. Numerical model output illustrating the effects of various growth laws on isotope fractionation in a growing crystal due to the presence of a diffusive boundary layer (DBL) in the growth medium. Cartoons in (a) show progressive crystal growth with equivalent time intervals indicated by the dashed markers. The reference case is constant v (left), but decelerating or accelerating v is also possible (middle and right; see text). The curves in (b) show three specific growth laws used in numerical models, corre-sponding to the cartoons in (a). The equations describing v as a function of time are shown on the graph (v in cm/s); these were chosen so that all three growth laws yield the same total crystal growth (5 mm) in the same time (6.7 × 10⁶ s), thus allowing direct comparison. The diffusivity was also assumed to be the same (10−8 cm2 s−1) in all cases. Panel (c) shows v / D as a function of time for the three growth laws; in (d), v / D is shown as a function of radial position. Panel (f) compares the ultimate consequences of the three growth laws for isotopic fractionation in the crystal when DH / DL = 0.993. Note that the line symbols (solid, dot–dash, and dash) are used consistently in b–e for the three growth laws shown in (b).
increasing �Grxn
with cooling?constant rate ofmass addition?
timemarkers
a accelerating constant decelerating
H LD /D = 0.993L -8 2D = 10 cm /s
radial position (mm)
0
1
2
3
4
5
0 1 2 3 4 5
e
H/L
�
(‰)
0
20
40
60
80
0 1 2 3 4 5
L -8D = 10 cm /s2
radial position (mm)
d
-1/
D (
cm)
6t /10 (s)
0
20
40
60
80
0 1 2 3 4 5 6 7
L -8D = 10 cm /s2c
-1/
D (
cm)
0 1 2 3 4 5 6 7
radiu
s (m
m)
0
1
2
3
4
5
6t /10 (s)
b
= . = 7.452 D
constant
=�4
104
(10 + t)½
= t�14. 2.2 10

102 Watkins, DePaolo & Watson
In closing this section on isotope fractionation caused by diffusive boundary layers (DBLs) of trace elements in the growth medium, we note that in general the rate of crystal growth will itself be limited by diffusion of structural constituents. This more general case is treated in the following two sections. Trace elements likely to experience deviations from isotopic equilibrium are those whose diffusivities in the growth medium are similar to or lower than those of the structural constituents of the mineral under consideration.
ISOTOPE FRACTIONATION BY COMBINED REACTION AND DIFFUSION
In the previous section, we considered the special case of isotopic fractionation by diffusion of a trace element where the growth rate is unaffected by the incorporation or presence of the tracer. It was further assumed that the local equilibrium partition coefficient Keq is independent of mass. Here we review a more general model applicable to diffusion and reaction of the stoichiometric constituents of a mineral. The kinetic isotope effects may arise from diffusive transport to the mineral surface as well as the mass dependence on reaction rates at the mineral–fluid interface.
General framework for crystal growth from an infinite solution
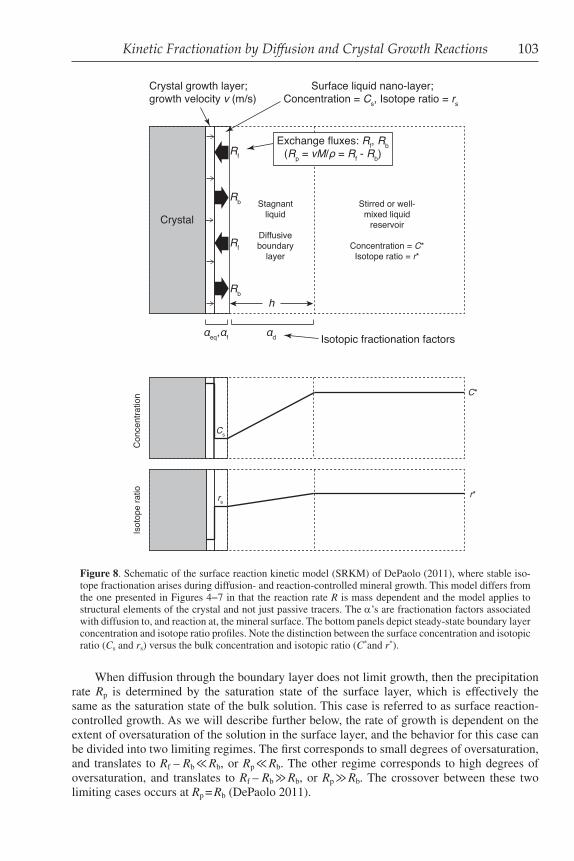
The physical framework of the surface reaction kinetic model (SRKM) that we will use for discussion (Fig. 8), is generalized from the discussions in DePaolo (2011) and includes:
• the mineral surface, advancing as a consequence of precipitation at a velocity v,
• a surface liquid layer that represents that region immediately above the mineral surface from which ions are transferred onto the mineral surface and to which ions are transferred from the mineral surface,
• a stagnant liquid layer of thickness h through which dissolved ions must diffuse to the mineral surface from the bulk fluid reservoir, and
• a stirred or well-mixed fluid reservoir that constitutes the ultimate source of ions that precipitate to grow the crystal.
The advancement of the mineral surface as a consequence of precipitation (or growth) can be described in terms of a velocity (v) expressed in units of m s−1 or a precipitation flux Rp = vr / M, in units of moles m−2 s−1. In this expression M is molar mass of the crystal (kg mol−1) and r is density (kg m−3). At the mineral surface there is in general an exchange of ions between the mineral surface and the fluid surface layer. The exchange can be separated into a forward flux (Rf) of ions from the fluid to the mineral surface, and a backward flux (Rb) from the mineral surface to the fluid surface layer. The growth rate is the difference between the forward flux and the backward flux, or:
p f b.v
R R RM
r= = − (13)
In situations where diffusion through the stagnant boundary layer limits growth, then Rp must be equal to the flux through the boundary layer, or:
*d sp f b ,
v C CR R R D
M h
r −= = − = (14)
where C* is the concentration in the bulk solution, Cs is the concentration in the immediate vicinity of the mineral surface, and h is the diffusive boundary layer thickness. This relationship is sufficient to describe the various limiting cases for crystal growth that are discussed below and in other chapters of this volume.
Kinetic Fractionation by Diffusion and Crystal Growth Reactions 103
When diffusion through the boundary layer does not limit growth, then the precipitation rate Rp is determined by the saturation state of the surface layer, which is effectively the same as the saturation state of the bulk solution. This case is referred to as surface reaction-controlled growth. As we will describe further below, the rate of growth is dependent on the extent of oversaturation of the solution in the surface layer, and the behavior for this case can be divided into two limiting regimes. The first corresponds to small degrees of oversaturation, and translates to Rf – Rb ≪ Rb, or Rp ≪ Rb. The other regime corresponds to high degrees of oversaturation, and translates to Rf – Rb ≫ Rb, or Rp ≫ Rb. The crossover between these two limiting cases occurs at Rp = Rb (DePaolo 2011).
Figure 8. Schematic of the surface reaction kinetic model (SRKM) of DePaolo (2011), where stable iso-tope fractionation arises during diffusion- and reaction-controlled mineral growth. This model differs from the one presented in Figures 4−7 in that the reaction rate R is mass dependent and the model applies to structural elements of the crystal and not just passive tracers. The α’s are fractionation factors associated with diffusion to, and reaction at, the mineral surface. The bottom panels depict steady-state boundary layer concentration and isotope ratio profiles. Note the distinction between the surface concentration and isotopic ratio (Cs and rs) versus the bulk concentration and isotopic ratio (C*and r*).
Crystal growth layer;growth velocity v (m/s)
Surface liquid nano-layer;Concentration = Cs, Isotope ratio = rs
Isotopic fractionation factors
Stirred or well-mixed liquid
reservoir
Concentration = C*Isotope ratio = r*
Stagnantliquid
Diffusiveboundary
layer
Crystal
Rb
Rb
Rf
Rf
αeq,αf αd
h
Con
cent
ratio
n
Cs
C*
Isot
ope
ratio rs
r*
Exchange fluxes: Rf, Rb(Rp = vM/ρ = Rf - Rb)
104 Watkins, DePaolo & Watson
If we represent the surface reaction controlled precipitation rate as
( )sp p s eq ,R k C C= − (15)
then we can derive an expression for the diffusion-controlled regime by equating Equations (14) and (15):
( ) ( )*p s eq s .
Dk C C C C
h− = − (16)
Solving for Cs and substituting into Equation (15) gives:
( )*p eq
pp
.k D C C
RD hk
−=
+(17)
This expression gives the growth rate in terms of the concentration in the bulk solution, the equilibrium concentration and the parameters D, h, and kp. Equation (17) can be rearranged to the form:
( ) ( )* *p p eq eq
1 1,
h
R k C C D C C= +
− −(18a)
which can also be written as
s* d*p p p
1 1 1.
R R R= + (18b)
where s*pR is the surface-controlled rate assuming that the surface layer concentration is equal
to the bulk–fluid concentration C*, and d*pR is the diffusion-limited growth rate assuming that
the surface layer concentration is the equilibrium concentration, Ceq. An additional useful way to write Equation (18b) is in terms of an effective rate constant keff:
*p eff eq ( )R k C C= − (19)
where
1
effp
.1 h
kk D
−
= +
(20)
Equation (18) provides a description of the transition from surface-reaction-controlled growth to diffusion-limited growth. When h = 0, the growth rate is exactly the surface-controlled rate. Diffusion to the mineral surface begins to have an effect when h / D is a significant fraction of 1 / kp, and dominates when h / D > 1/kp. The crossover in behavior between surface reaction controlled and diffusion-controlled growth is at D / h = kp, or when D / hkp = 1.
The above analysis leads to the framework described by DePaolo (2011) and reproduced in slightly modified form as Figure 9. The conditions that describe the controls on kinetic isotope effects, under both near-equilibrium and far-from-equilibrium conditions, are the same as those that describe surface reaction and diffusion-controlled crystal growth. Crystal growth at isotopic equilibrium can only occur when Rp ≪ Rb, and in the absence of diffusion control. The extent to which diffusion control affects KIEs is determined by the dimensionless parameter D / hkp, although for most mineral growth reactions the elemental concentration in solution that controls growth rate may not be the element of interest for isotopic composition. For this reason it may be more useful to rewrite Equation (18a) in the form:

Kinetic Fractionation by Diffusion and Crystal Growth Reactions 105
( ) ( ) ( ) ( )p p eq eq b eq
1 1 1 ,
1 1 1 1
h h
R k C S DC S R S DC S= + = +
− − − −(21)
where S is the saturation of the bulk solution defined as S = C* / Ceq. This leads to a form for the dimensionless parameter of DCeq = h/Rb, which is similar to the form used in DePaolo (2011). Large D and/or small boundary layer thickness are associated with fast diffusive transport and thus push the system towards a surface reaction controlled regime. A smaller ion exchange rate at the mineral surface (related to Rb) also pushes the system towards a surface reaction controlled regime. Finally, an increase in Ceq independent of C* decreases C* − Ceq, which is effectively the definition of moving away from transport control.
Crystal growth and kinetic isotope effects
Although it would be best to have a completely general formulation for KIEs during crystal growth, there are many variations for different cations and anions, and the details are just as important as the generalities. For this reason we start here with a formulation for KIEs for two isotopes of Ca (44Ca and 40Ca) in calcite, which is a fairly simple example. The first step, following DePaolo (2011), is to write equations for the forward (Rf) and backward (Rb) reaction rates for each isotope in the surface reaction controlled regime. It is expected that the aqueous isotopic species 44Ca2+ and 40Ca2+ will have slightly different kf and kb values and hence different rates of reaction. The simplified equations for the rate of attachment (precipitation) of the two Ca isotopic species as mineral crystal growth proceeds can be written:
40 40 40 2 2f f 3s s
Ca COR k + − = (22a)
and
44 44 44 2 2f f 3s s
Ca C .OR k + − = (22b)
Figure 9. Regime diagram showing when mineral growth rates are controlled by surface reaction kinetics versus diffusion kinetics. The x-axis is the ratio of the net mineral precipitation rate (Rp = Rf − Rb) to the rate of ion detachment from the mineral surface (Rb). The y-axis is a dimensionless parameter that describes the rela-tive importance of diffusive transport versus surface-reaction kinetics in determining the overall growth rate. The four panels on the right depict the steady-state concentration profiles for the four regimes. Note that the assumption of local equilibrium at the crystal-liquid interface only applies when Rp / Rb ≪ 1 (Regimes 1 and 2). Hence the model presented in Figures 4−7 is effectively a “Regime 2” model. Modified from DePaolo (2011).
104
10410-410-4
1
1
Rp / Rb
D /h
k p o
r D
Ceq
/hR
b
Regime 1Near
equilibrium
Regime 3Surface
reaction kineticslimited
Regime 2Transport limited,near equilibrium
surface layer
Regime 4Transport andsurface kinetic
effects
Transitional regimes
Ceq
C*
Ceq
C*
C* = Ceq
Ceq
C*
Regime 1
Regime 2
Regime 3
Regime 4

106 Watkins, DePaolo & Watson
The dissolution rates are:
40 40 40b b 3CaCOR k = (23a)
and
44 44 44b b 3CaCO .R k = (23b)
Implicit in these expressions are the two kinetic isotopic fractionation factors associated with the forward and backward reactions:
44f
f 40f
k
kα = (24a)
and
44b
b 40b
.k
kα = (24b)
The equilibrium fractionation factor is:
44eqf solid
eq 40b eq fs eq
,K r
K r
αα = = = α
(25)
where r is shorthand for the isotopic ratio 44Ca/40Ca, and ‘fs’ refers to the fluid at the mineral surface. If the above expressions are substituted into the previous equations, two equations can be derived that relate the isotope-specific forward and backward rates:
44 40f f fs fR r R= α (26a)
and
44 40 40fb b solid b solid b
eq
.R r R r Rα
= α =α
(26b)
These equations can be used to derive a general equation for the fractionation attending mineral precipitation under steady state, surface reaction controlled conditions. It should be noted that the isotopic effects are not dependent on the exact form of the kinetic rate expression; they are only dependent on the rates.
The effective isotopic fractionation factor for steady state precipitation can be derived starting first with the rate of change of the isotopic ratio of the solid surface layer:
Ca
Ca
44solid
40
,N
rN
= (27)
where N designates the number of atoms (or moles of atoms), and at steady state:
( )Ca Ca
Ca Ca
44 40 44 40solidsolid p solid p
40 40
1 10 .
dN dNdrr R r R
dt N dt dt N
= = − = −
(28)
Steady state in this case means that the isotopic composition of the surficial layer of the solid is not changing with time as the crystal grows. After substitution of Equations (26a) and (26b) into (28) and some algebraic manipulation, the following expression is obtained for the steady condition:

Kinetic Fractionation by Diffusion and Crystal Growth Reactions 107
s solid f fp
fluid ss b f b f
f eq p b eq
.
1 1 1 1
r
r R R
R R R
α αα = = = α α + − + − α + α
(29)
Note that when the precipitation rate Rp → 0, we have p eqsα →α , and hence the equilibrium
condition is recovered.
Interpreting the model parameters
The expression in Equation (29) is generally applicable, but requires knowledge of the parameters Rp, Rb, aeq and af. DePaolo (2011) argued that Rb can be estimated from the far from equilibrium dissolution rate of calcite, which is dependent on pH and temperature. This proposal fares well when the model is compared to data on ap versus growth rate (Rp) reported by Tang et al. (2008a) (Fig. 10a). The inflection point of Equation (29) occurs at Rp = Rb, which at 25 °C is very close to the dissolution rate of 6 × 10⁻⁷ moles m2 s−1 measured by Chou et al. (1989). This correspondence supports the theory that underlies Equation 29, and the data are best fit with Equation (29) using aeq = 0.9995 and af = 0.9984. However, as also noted by DePaolo (2011), these parameters do not extrapolate to ap = 1.0000 as Rp goes to zero (equilibrium). Based on analysis of precipitation rate data from the literature, DePaolo (2011) hypothesized that Rb is proportional to 1/2
pR , when Rp < Rb. This is the basis for “Model 2” of DePaolo (2011), which is shown for Ca isotope fractionation at 25 °C in Figure 10a. The values of aeq and af need to be inferred from comparison of model to data. For “Model 2,” the inferred values are aeq = 0.9998 and af = 0.9984.
A next step in developing the model is to obtain a better representation of Rb and its relationship to growth rate and solution composition. This has been done by Nielsen et al. (2012), who adapted the ion-by-ion crystal growth models of Zhang and Nancollas (1998) to predict both precipitation rate and Ca isotopic fractionation in calcite (Fig. 10a–b). In Figure 10b, the equilibrium and kinetic fractionation factors are assumed to be independent of temperature, but the data could also accommodate a slight temperature dependence to these parameters. The model begins with the recognition that calcite growth proceeds by ion attachment and detachment on kink sites along growth steps on the crystal surface (Fig. 11). The growth rate is determined largely by the rate constants for attachment and detachment of Ca2+ and 2
3CO −, which are directly related to the forward and backward reaction rates. With additional thermodynamic and geometric parameters, a formulation can be made for the growth rate in terms of solution chemistry, and Rp is found to depend not only on solution saturation state, but also on the ratio of [Ca2+] to 2
3[CO ]− in solution.
Some of the predictions for Rb from the ion-by-ion growth model are shown in Figure 12. Because there is a dependence on Ca2+ / 2
3CO − of the solution, the values of Rb are plotted for different values of [Ca2+]aq. The DePaolo (2011) Model 2 values for Rb vs. Rp behave in a manner similar to that predicted by the ion-by-ion model, with Rb = f( 1/2
pR ) as is indicated by literature data on calcite precipitation kinetics. The ion-by-ion model predicts that the values of Rb will be dependent on [Ca2+]aq, and that the values are a different function of S and Rb at high supersaturations and growth rates. These additional features in the ion-by-ion model make prediction of Ca isotope fractionation somewhat more complex, but also more interesting. The ion-by-ion model predicts that, for the same growth rate, Ca isotope fractionation should be larger when the solution Ca2+ / 2
3CO − is low and smaller when Ca2+ / 23CO − is high (Fig. 13). This implies
that Ca isotope fractionation can be dependent on pH and total dissolved carbon, and this has been verified to some extent with measurements of carbonate formed in an alkaline lake (Nielsen and DePaolo 2013). It is also noteworthy that the dependence of Ca isotope fractionation on solution Ca2+ / 2
3CO − is one way to differentiate the surface kinetic models for isotope fractionation from those based on the diffusion in the near surface of the mineral discussed in a later section.

108 Watkins, DePaolo & Watson
A further issue with isotope effects due to surface reaction kinetics is to identify the controls on the parameters (ki and ni; Fig. 11) that determine the rates of attachment to and detachment from the crystal surface. These parameters are key to understanding calcite precipitation kinetics, but it is their dependence on isotopic mass that controls the kinetic isotope effect.
Figure 10. Ca isotope fractionation between calcite and aqueous solution as a function of crystal growth rate. (a) Results from two different modeling approaches. The DePaolo (2011) curve is based on the equa-tions presented herein, and the crossover point from Regime 1 to Regime 3 occurs at Rp = Rb. DePaolo (2011) noted that this crossover corresponds to the measured far-from-equilibrium dissolution rate of cal-cite at 25 °C (Chou et al. 1989), suggesting that Rb can be estimated from dissolution experiments. The Nielsen et al. (2012) curve is based on an ion-by-ion growth model where the rate constants for ion attach-ment and detachment are mass-dependent, and Rb is a function of solution chemistry. Both models can ex-plain the data but the ion-by-ion model predicts a larger kinetic fractionation factor, af, which corresponds to larger fractionations in the fast growth limit. (b) The temperature dependence of kinetic isotope effects for calcium in calcite. In the ion-by-ion model, temperature shifts Rb via the temperature dependence of kink density. According to this model, the equilibrium and kinetic end member fractionation factors, aeq and af, are relatively insensitive to temperature.
−4.0
−3.0
−2.0
−1.0
0.0
10−12 10−10 10−8 10−6 10−4 10−2
Δ(4
4/40
) Ca ca
lcite
-aq
Regime 3:Surfacereactioncontrol
Regime 1:Near equilibrium
DePaolo (2011) Model 2
Nielsen et al. (2012)Ion-by-ion model
Rp = Rb
Transition
Rp (moles/m2/s)
−4.0
−3.0
−2.0
−1.0
0.0
10−12 10−10 10−8 10−6 10−4 10−2
Δ(4
4/40
) Ca ca
lcite
-aq Nielsen et al. (2012)
Ion-by-ion model
Tang et al. (2014a, 2014b)Watkins et al. (unpublished)
5ºC 25ºC
5ºC
25ºC
A
B

Kinetic Fractionation by Diffusion and Crystal Growth Reactions 109
1
3
5
2
Site types1. Terrace (least reactive)2. Step3. Kink4. Ledge5. Adatom (most reactive)4
νCOCO3CO2-
CO2-[CO3 ]kCOCO3CO2-
[Ca2+ ]kCaCa2+
νCaCa2+
Figure 11. Schematic for the ion-by-ion approach to modeling crystal growth (see Zhang and Nancollas 1998), which was adapted by Nielsen et al. (2012) to explain KIEs during crystal growth. The mass-depen-dent parameters are the attachment and detachment rate constants, ki (M−1 s−1) and ni (s−1) to the kink sites and step edges of a cubic crystal. Although kink sites react more slowly than ledge and adatom sites, the kink sites and step edges control the overall growth and dissolution rate owing to their higher concentration.
Figure 12. A key parameter in modeling KIEs during crystal growth is the rate of ion detachment, Rb, from the mineral surface relative to the net growth rate (Rp) or degree of supersaturation (S= [Ca2+][ 2
3CO − ]/Ksp). Based on analysis of precipitation rate data from the literature, DePaolo (2011) hypothesized that Rb is proportional to 1/2
pR , when Rp < Rb. This functional form is in good agreement with the rate dependence of Rb in the ion-by-ion model of Nielsen et al. (2012). Note that Rb is an input of the DePaolo (2011) model and an output of the ion-by-ion model.
10−10
10−9
10−8
10−7
10−6
10−5
10−11 10−10 10−9 10−8 10−7 10−6 10−5 10−410−11
10−10
10−9
10−8
10−7
10−6
10−5
10−4 10−3 10−2 10−1 100 101
RbRb
Rp S-1
Ion-by-ion calcite growth modelsIon-by-ion calcite growth models
[Ca2+] = 5.2 mmol0.52 mmol
0.052 mmol
[Ca2+] = 5.2 mmol
0.52 mmol
0.052 mmol
DePaolo (2011) Model 1
DePaolo (2011) Model 2

110 Watkins, DePaolo & Watson
One possibility is that the desolvation rate of Ca2+ ions in solution is mass dependent. To investigate whether this mass dependence would be in the correct sense and of appropriate magnitude, Hofmann et al. (2012) carried out MD simulations that produce estimates of the residence time of water molecules in the first hydration shell of various cations in a solution of pure water. Their findings show that water molecules have smaller residence times in the solvation shells around lighter isotopes, meaning that lighter isotope cations are more easily desolvated. When converted to estimates of possible kinetic isotopic fractionation factors, the MD results correspond to af values of a few permil favoring the light isotope (Fig. 14), close to the values observed for af in experiments (Fig. 10). The Hofmann et al. (2012) results suggest that it may be possible to gain a molecular level understanding of, and predictive capability for, the KIEs of major cations through a combination of modeling and experiments. The result also implies that any aspect of solution chemistry that changes the stability of the hydration shells around cations could also change the KIEs of those cations during crystal growth.
Stable isotope fractionation during electroplating
Over the past decade, electrochemistry experiments have been used to investigate kinetic isotope effects for Fe, Zn, and Li during redox reactions (Fig. 15; Kavner et al. 2005, 2008; Black et al. 2009, 2010a,b, 2014). The observations that have been made, and the extremely well-controlled nature of the experiments, present an opportunity to develop and test models for combined reaction and diffusion (i.e., Regimes 3 and 4) in a “simple” system.
In a typical experiment, a rotating disc electrode is immersed in aqueous solution and controls the driving force of the reaction as well as the transport of dissolved ions to the metal surface. The dependence of isotopic fractionation between electro-deposited metal and aqueous solution has been studied as a function of temperature, overpotential, composition of the aqueous solution, composition of the electrode and rotation rate of the electrode. The key findings from these studies were recently summarized by Black et al. (2014) and are repeated here: (1) the electro-deposited metal has thus far been observed to be isotopically lighter than the dissolved species in aqueous solution, (2) the fractionation does not depend on electrode composition, (3) the fractionation varies with solution composition, (4) the fractionation generally increases with increasing temperature, (5) the fractionation decreases
−4
−3
−2
−1
0
10−3 10−1 101 103 105 107
Δ(4
4/40
) Ca ca
lcite
-aq
Ca2+:CO3CO2-
S = 0.5
S = 1.0
S = 5.0
seawater
Figure 13. Calculations from the ion-by-ion model of Nielsen et al. (2012) showing the expected calcium isotope fractionation as a function of solution composition for different values of the saturation index. Predictions such as these are attractive targets for future experiments.

Kinetic Fractionation by Diffusion and Crystal Growth Reactions 111
with increasing overpotential or deposition rate, (6) the fractionation varies depending on the cation of interest, (7) the fractionation increases with increasing rotation rate of the electrode, (8) the sensitivity to rotation rate increases with overpotential and (9) the KIEs are more scattered when electroplating efficiency is low (e.g., Fe in FeSO4 solutions).
The overall rate of an electrochemical reaction under simultaneous control of mass-transport to the electrode and electrochemical processes at the electrode is given by the Koutecky–Levitch equation (Bard and Faulkner 1980):
* *total reaction transport
1 1 1,
i i i= + (30)
where i is the current (Coulombs m−2 s−1) and the asterisks are a reminder that Cs = C*
for the reaction term and Cs = 0 for the transport term when itotal is expressed in this form. This expression is exactly analogous to Equation (18b) for the crystal growth problem. For electrochemistry problems, the far-from-equilibrium rate of reaction under non-transport-limited conditions (Regime 3) is given by the far-from-equilibrium limit of the Butler–Volmer equation (also known as the Tafel equation):
* 0reaction s ,
nF
RTi nFC k e−κ η
= (31)
where n is the number of electrons transferred in the reaction, F is Faraday’s constant (96485 C mol−1), Cs is the concentration at the electrode surface (moles cm−3), k0 is a standard rate constant, κ is a transfer coefficient (Bard and Faulkner 1980), η is the electrochemical driving force (Vapplied – Vequilibrium), R is the gas constant (8.3145 J mol−1 K−1) and T is temperature (K).
In the limit where electroplating takes place as fast as ions can be supplied to the surface (Regime 4), the current at the electrode is equal to the rate of mass transport by advection and diffusion as given by the Levitch equation (Bard and Faulkner 1980):
* * 2/3 1/6 1/2transport 0.6 ,2i nFC D v−= ω (32)
Figure 14. Estimates of possible kinetic isotopic fractionation factors (af) based on mass dependent ion desolvation rates (i.e., mass dependent kwex; see Fig. 1). These estimates were made using MD simulations and calculating the residence time of water molecules in the first hydration shell of various cations in a solution of pure water (Hofmann et al. 2012).
0.990
0.992
0.994
0.996
0.998
1.000
alph
a (M
D)
0.90 0.92 0.94 0.96 0.98 1.00
(mLight/mHeavy)1/2
β = 0.0497Li/6Li
44Ca/40Ca
41K/39K
87Rb/85Rb88Sr/86Sr
137Ba/134Ba

112 Watkins, DePaolo & Watson
where C* is the concentration in the bulk solution (moles cm−3), D is the diffusion coefficient (cm2 s−1), ω is the rotation rate (s−1), and v is the kinematic viscosity (cm s−1). Lower viscosity, faster rotation and faster diffusion all serve to increase the rate of ion transport to the surface of the electrode.
For isotopic fractionation, it is expected the rate constant k0 and the diffusion coefficient D are mass dependent. The isotopic ratio can be written as (Black et al. 2010b):
Htotal
L * L * L * L *Lreaction reaction transport transporttotal
H * H * H * H *reaction transport transport reaction
1 1,
i
i i i iii i i i
= ++ +
(33)
where
Figure 15. Kinetic isotope effects in electroplating experiments where the temperature, rotation rate of the electrode, and overpotential are controlled (see text references and additional details). The curves are model results based on the Koutecky–Levitch equation (30) with mass dependent diffusivities and reaction rate constants. (a) For Zn, we use 66∆ / 64∆ = 0.99993 (β = 0.0019) and af = 66k0 / 64k0 = 0.996. (b) For Fe, we use 56∆ / 54∆ = 0.99993 (β = 0.0025) and af = 56k0 / 54k0 = 0.998.
0˚C25˚C50˚C
Larger symbols = faster rotation rate
Δ(6
6/64
) Zn m
etal
-aq
Regime 3:Surface reaction
control
−4
−3
−2
−1
0
10−4 10−3 10−2 10−1 100
Transition toRegime 4
Regime 4
AΔ
(56/
54) F
e met
al-a
q
0˚C25˚C35˚C
Black: FeCl2 solutionsGray: FeSO4 solutions
Regime 3:Surface reaction
control
Transition toRegime 4
itotal /itransport
−4
−3
−2
−1
0
10−4 10−3 10−2 10−1 100
Regime 4
B

Kinetic Fractionation by Diffusion and Crystal Growth Reactions 113
L * L 0 L *reaction
H * H 0 H *reaction
,i k C
i k C
=
(34)
L * L 2/3 L *transport
H * H 2/3 H *transport
,i D C
i D C
=
(35)
L * L 0 L *reaction
H * H 2/3 H * 1/6 1/2transport
,0.62
nF
RTi k C e
i D C v
−κ η
−
= ω
(36)
and
L * L 2/3 L * 1/6 1/2transport
H * H 0 H *reaction
0.62.
nF
RT
i D C v
i k Ce
−
−κ η
ω=
(37)
The model curves in Figure 15 were constructed by substituting Equations (34−37) into Equation (33) and plotting the result against itotal / itransport. In the diffusion-controlled limit (itotal / itransport → 1), the magnitude of isotopic fractionation is dictated by the β factor, or ratio of isotopic diffusion coefficients. For both Zn2+ and Fe2+, the β factor is near zero (Table 1). In the surface reaction-controlled limit, the magnitude of isotopic fractionation is dictated by the ratio of reaction rate constants. Hence, for each curve the Regime 4 limit is constrained by independent experimental data on β factors, but the Regime 3 limit is a fitting parameter that is not yet constrained by independent data.
The fact that the data for Zn in ZnCl2, and also perhaps Fe in FeCl2, collapse to a single trend suggests that β and af are relatively insensitive to temperature over the temperature range of the experiments. This is significant because the insensitivity of kinetic isotope fractionation factors to temperature might be a common feature, as it is seen in the available data for calcium, carbon, and oxygen isotopes in calcite (e.g., Fig. 10b; Tang et al. 2008a; Dietzel et al. 2009; Watkins et al. 2013, 2014; Baker 2015). The systematic misfit in the data for Zn could be taken as evidence that af is sensitive to factors other than temperature. For example, a much better fit can be obtained by casting af as function of electro-deposition rate (results not shown). For Fe in FeSO4 (gray symbols in Fig. 15), the data are more scattered, especially in Regime 3 where surface reaction kinetics dominate. Black et al. (2010a) noted that the electrodeposition efficiency is low in these experiments, meaning that the redox reaction of interest accounts for only a small fraction of the current registered by the electrode (Kavner, pers. comm.). The low efficiency could be taken as an indication that the complex surface chemistry responsible for the deposition of charge (in excess of that produced by the redox reaction) affects af and β in ways that are not captured by the model.
Stable isotope fractionation of trace elements
Many of the factors that govern kinetic isotope effects of major structural constituents also apply to the partitioning of trace elements and their isotopes. Trace element abundances are widely used to infer the temperatures of mineral formation, but many recent experimental studies have shown that factors beyond temperature affect trace element uptake under non-equilibrium conditions. This leads to correlations between trace element partition coefficients and kinetic isotope effects, as shown in Figure 16 for the mineral calcite.
Different impurities are incorporated into minerals in different ways, presenting an opportunity to probe the micro-scale processes that underlie KIEs from multiple angles. Both Mg2+ and Sr2+ behave like Ca2+ in calcite insofar as they occupy the same structural site and the light isotope of each of these elements is enriched in the solid phase. For Sr2+, the degree
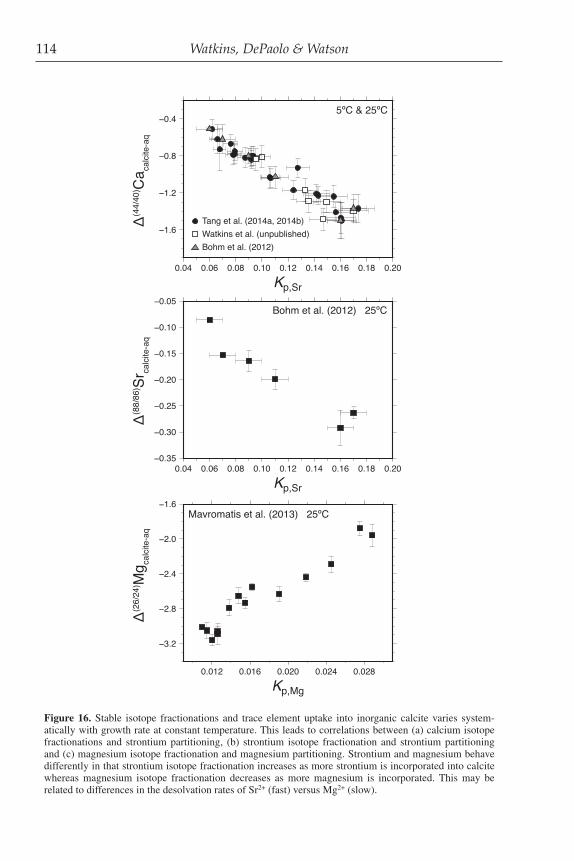
114 Watkins, DePaolo & Watson
Figure 16. Stable isotope fractionations and trace element uptake into inorganic calcite varies system-atically with growth rate at constant temperature. This leads to correlations between (a) calcium isotope fractionations and strontium partitioning, (b) strontium isotope fractionation and strontium partitioning and (c) magnesium isotope fractionation and magnesium partitioning. Strontium and magnesium behave differently in that strontium isotope fractionation increases as more strontium is incorporated into calcite whereas magnesium isotope fractionation decreases as more magnesium is incorporated. This may be related to differences in the desolvation rates of Sr2+ (fast) versus Mg2+ (slow).
−1.6
−1.2
−0.8
−0.4
0.04 0.06 0.08 0.10 0.12 0.14 0.16 0.18 0.20
Kp,Sr
−0.35
−0.30
−0.25
−0.20
−0.15
−0.10
−0.05
0.04 0.06 0.08 0.10 0.12 0.14 0.16 0.18 0.20
Kp,Sr
−3.2
−2.8
−2.4
−2.0
−1.6
0.012 0.016 0.020 0.024 0.028
Kp,Mg
Δ(4
4/40
) Ca ca
lcite
-aq
Δ(8
8/86
) Sr ca
lcite
-aq
Δ(2
6/24
) Mg ca
lcite
-aq
Tang et al. (2014a, 2014b)Watkins et al. (unpublished)Bohm et al. (2012)
5ºC & 25ºC
Mavromatis et al. (2013) 25ºC
Bohm et al. (2012) 25ºC

Kinetic Fractionation by Diffusion and Crystal Growth Reactions 115
of light isotope enrichment increases with growth rate and strontium uptake (Tang et al. 2008b; Böhm et al. 2012; Fig. 16b). For Mg2+, the degree of light isotope enrichment decreases with growth rate and magnesium uptake, leading to the opposite relationship (Mavromatis et al. 2013; Saenger and Wang 2014; Fig. 16c). An important difference between these two elements is that Sr2+ desolvates as readily as Ca2+ (kwex ~ 109 s−1) whereas Mg2+ desolvates ~3 orders of magnitude more slowly (Nielsen 1984). Mavromatis et al. (2013) compared infrared spectra from calcite grown at different rates and found evidence for incomplete desolvation of Mg2+ ions at higher growth rates based on the presence of water in the infrared spectra of fast-grown calcite. The conclusion is that with less complete desolvation, the kinetic fractionation factor (af) tends toward unity—a finding that supports the hypothesis that ion desolvation is the primary physical mechanism underlying af for free aqueous metal cations (Hofmann et al. 2012).
The growing dataset provides exciting opportunities to develop process-based models for trace element uptake and isotope discrimination. For the relatively simple case of strontium uptake into calcite, DePaolo (2011) wrote an expression for trace element partitioning that is analogous to Equation (29), with Sr replacing 44Ca and Ca replacing 40Ca:
( )( )
fsolidp,Sr
b ffluid ss
p b eq
Sr/Ca,
Sr/Ca1 1
KK
R K
R R K
= = + − +
(38)
where the Kf = KSr / KCa is the forward kinetic fractionation factor for Sr/Ca and Keq is the equilibrium Sr/Ca partition coefficient. While this expression can explain the rate-dependence of Sr partitioning into calcite as well as the observed correlation between Sr/Ca and ∆(44/40)Ca (Fig. 16a), it does not account for the isotopes of trace elements and the feedbacks between impurity uptake and calcite growth kinetics.
Nielsen et al. (2013) used the ion-by-ion model to derive expressions relating strontium and magnesium concentrations in calcite to ion detachment frequencies and overall crystal growth rate. They obtained attachment and detachment rate coefficients from fits to atomic force microscopy (AFM) measurements of step velocity versus impurity concentration in solution. Their Figure 9 shows how the detachment rate coefficient for calcium is directly correlated with the mole fraction of SrCO3 but inversely correlated with the mole fraction of MgCO3. The conclusion is that Sr2+ impedes calcite growth by straining the local crystal lattice and increasing calcite solubility (note that Sr2+ is larger than the Ca2+ ion) whereas Mg2+ impedes calcite growth by blocking Ca2+ from active growth sites (recall that Mg2+ desolvates slowly). The theory has yet to be extended to include the isotopes of strontium and magnesium, in part because data on the growth rate dependence of stable isotope fractionation were not available until recently (Immenhauser et al. 2010; Böhm et al. 2012; Li et al. 2012; Mavromatis et al. 2013). Additional complexity arises when one considers a trace element such as boron, which is delivered to calcite from multiple, isotopically distinct dissolved species (B(OH)3 and 4B(OH)−) that can be incorporated into structural sites as well as non-structural (defect) sites (Gabitov et al. 2014; Mavromatis et al. 2015; Uchikawa et al. 2015). Even for cations such as Ca2+ and Mg2+, the formation of ion pairs in solution (e.g., 3MgHCO+
or 03MgCO ) can perturb the coordination sphere and contribute to isotopic fractionation in ways that
have not been investigated until recently (Schott et al. 2016).
THE ROLE OF THE NEAR SURFACE OF CRYSTALS
The surface reaction kinetic model (SRKM) of DePaolo (2011) and the ion-by-ion models are, in effect, “surface entrapment models” that involve a competition between growth rate (Rp) and the gross ion detachment rate (Rb) from the surface. Up to this point, the interpretation of kinetic isotope effects (KIEs) has focused on processes operating on the liquid side of the

116 Watkins, DePaolo & Watson
solid–liquid interface; i.e., mass-dependent diffusion in the liquid and mass-dependent solvation–desolvation kinetics. In some circumstances, it may be possible for isotope ratios to be influenced by the properties of, and atomic mobility within, the immediate near-surface of the crystal itself.
High-resolution X-ray reflectivity measurements reveal that the outermost few monolayers of crystals are structurally different from the bulk lattice (Fenter et al. 2000a,b, 2003; Schlegel et al. 2002). Recent MD simulations have confirmed that the outermost layers of crystals are characterized by changes in bond angles relative to the bulk lattice, as well as a general lengthening of bonds and consequent reduction in the binding energies (vacancy formation energies) of cations (Fig. 17; Lanzillo et al. 2014). These characteristics suggest that the equilibrium isotopic composition of the near-surface region could be distinct from that of the bulk lattice and that atomic mobility may be enhanced relative to the “deep” lattice. The equilibrium isotopic composition of, and atomic mobility within, the near-surface is difficult to measure experimentally, but efforts have been made using isotope-exchange experiments involving calcite and CO2 at 200 °C (Hamza and Broecker 1974).
The growth entrapment model (GEM)
Watson and Liang (1995) used the concept of a chemically anomalous surface region to develop a growth entrapment model (GEM) that differs conceptually from the SRKM in that it deals exclusively with the solid side of the solid–liquid interface. The essence of the growth entrapment model (GEM) is shown schematically in Figure 18a–b, where growth is depicted as overplating of new atomic layers onto the pre-existing surface. This aspect of the model is essentially identical to what is shown in Figure 8a for the SRKM. At the time of deposition, each new layer has the equilibrium composition of the structurally anomalous near-surface region, which is given by the surface concentration factor F (Fig. 18a,c). This part of the model is different from what is shown in Figure 8a, and effectively specifies that, for all cases, Rb ≫ Rp (i.e., local equilibrium). If the assumption of local equilibrium in the GEM is relaxed, however, there is more room to reconcile the SRKM and GEM, as discussed further below. In the GEM, the entrapped layer will adjust composition insofar as atomic mobility or “near surface diffusion” allows this to happen. As depicted in Figure 18b, atomic mobility may be only partially effective, so the composition of the resulting crystal (i.e., the concentration plateau) lies between the equilibrium value and the anomalous near-surface concentration.
Figure 17. Estimated near-surface (ns) equilibrium Ti concentration relative to the “deep-lattice” value as a function of proximity to the [100] and [010] surfaces of alpha quartz. These estimates were ob-tained by assuming [Ti]ns / [Ti]deep ≈ exp(∆Eex / RT), where ∆Eex is the energy change associated with the exchange reaction Sins + Tideep = Sideep + Tins. The value for ∆Eex was obtained from ab initio molecular dynamics simulations (Lanzillo et al. 2014). Note the similarity of this plot with the description of the near-surface anomaly shown in Figure 18c.
0.2 0.0
depth in quartz lattice (nm)
0.40.6
1
5
9
13
17
21
[Ti] /
[Ti]
ns
dee
p
(100)
(010)
surfa
ce

Kinetic Fractionation by Diffusion and Crystal Growth Reactions 117
In the GEM, trace element uptake depends on the competition between mineral growth rate, expressed in terms of a growth velocity (v) normal to the crystal surface, and the redistribution of the trace constituent back to the mineral surface. This competition is quantified by the dimensionless quantity Pe = v · l / D, where l is the half-width of the anomalous near-surface layer and D is an effective diffusivity meant to describe the sum of all transport processes in the near surface of the mineral. When growth is slow relative to atomic transport (Pe ≪ 1), the crystal is able to relax to the true lattice equilibrium composition. When growth is fast (Pe ≫ 1), the crystal completely entraps and preserves the composition of the anomalous surface.
In this formulation, a growth rate dependence to trace element uptake should be observed whenever the growth rate spans Pe = v · l / D ≈ 0.1 to 10 (Fig. 19a). The growth velocity, v, is determined from laboratory experiments, and the width of the structurally relaxed near-surface region, l, is about 1−2 nm in a variety of minerals (including silicates, carbonates and sulfates) based on the X-ray reflectivity measurements of Fenter and colleagues (Fenter et al. 2000a,b, 2003; Schlegel et al. 2002). This length scale was also returned in the MD simulations of Ti in quartz (Lanzillo et al. 2014) (see Fig. 17). For a typical calcite precipitation experiment, Rp ≈ 10−6 moles m−2 s−1, which translates to a growth velocity of v = 3.7 × 10⁻¹¹ m s−1. In order for Pe to be on the order of unity, the diffusivity must be on the order of 10−19−10−20 m2 s−1, which is about 16 orders of magnitude greater than the diffusivity of Ca or Sr in the calcite lattice and 10 orders of magnitude less than the diffusivity of Ca or Sr in the aqueous phase. This analysis led DePaolo (2011) to conclude that diffusion within the solid phase was far too slow to allow the competition between solid state diffusion and growth rate to be the process responsible for the growth rate-dependence of trace element partitioning into calcite. The same analysis led Watson and Liang (1995) to hypothesize that the ionic diffusivity was much faster in the nm-scale surface layer of calcite, and in particular, had values that caused the Peclet number to fall in the range of 0.1−10 so that the solid state diffusion could cause a growth rate dependence to the observed Sr/Ca partitioning. To match the data from other trace elements such as Mn/Ca, Co/Ca, and Cd/Ca in calcite, which show a more gradual change in partitioning over four or five orders of magnitude change in Pe, Watson (2004) modified the GEM by expressing D as a function of depth within the crystal:
Figure 18. Illustration of some aspects of the growth entrapment model (GEM). The schematic in (a) shows the structurally and chemically anomalous near surface region present at equilibrium in most if not all crystals (see text). During crystal growth, this region is “overplated” with new material and is no longer in equilibrium. If growth is fast, diffusion may not be able to fully restore equilibrium, as suggested in (b). Panel (c) shows mathematical representations of the near-surface equilibrium chemical anomaly as postulated by Watson and Liang (1995), illustrating the surface concentration factor F and the half-width l of the anomalous near-surface region. Ci is the concentration of impurity i; CL is the equilibrium concentration at depth in the crystal.
distance
equilibrium profile
actual profile
conce
ntr
ation
crystalgrowthmedium
b
0-1-2-3
Ci
CL
x / l
F=10
l = 1
F=5
l = 1
F=10
l = 0.5
surface
10
8
6
4
2
0F=0.1
l = 1
c
chemicalanomaly
(equilibrium)
distance
conce
ntr
ation
crystal
growthmedium(uniform)
a

118 Watkins, DePaolo & Watson
( ) ( )exp[ /( )]
lattice surface lattice / ,x m l
D x D D D= (39)
where D(x) is the diffusivity at some distance x from the surface, Dlattice is the diffusivity in the normal (deep) lattice, and Dsurface is the diffusivity at the immediate surface. The parameter m is a multiplier relating the width of the diffusively anomalous region to that of the chemically anomalous region. The ad hoc postulate of a spatially variable diffusivity added more adjustable parameters to the GEM, which gives the model a great deal of flexibility, but the model parameters (Dsurface, m, and l) are too poorly known for the model to be used in a predictive way.
Future molecular dynamics simulations may shed light on F values (Fig. 17), but quantification of near-surface diffusion may not yield so readily to the same approaches. Lanzillo et al. (2014) were able to show that the activation energy for diffusion of Ti in the near-surface of the quartz lattice is strongly depth-dependent in the outermost 2−3 polyhedral layers, but they were not able to place actual values on the diffusivity in this region. The near-surface diffusivity in the GEM may be likened to the grain boundary diffusivity in polycrystals, perhaps limited at the high end by the diffusivity of atoms on the actual surface. In general, the Arrhenius laws for lattice and grain boundary diffusion tend to converge at high temperature (Dohmen and Milke 2010), so Dlattice may be the relevant diffusivity in the GEM applied to phenocryst growth in magmas (with m = 1). This is the assumption made by Watson et al. (2015) in applying the GEM to phosphorus uptake during growth of olivine phenocrysts.
The surface reaction kinetic model (SRKM), growth entrapment model (GEM), and isotopes
The GEM has also been used to model kinetic isotope effects by specifying the equilibrium composition of the bulk lattice (aeq) and the distorted surface relative to the bulk lattice (mass-dependent F). This yields curves that are similar, but not identical, to those produced by the SRKM (Fig. 20), as discussed by DePaolo (2011). In both the SRKM and GEM, there is a slow growth limit and fast growth limit to the trace element concentration and stable isotope composition. The slow growth limit corresponds to the equilibrium composition and is a specified input. The fast growth limit corresponds to the composition of the surface in the absence of a detachment or outward diffusive flux and is also a specified input. These similarities
Figure 19. (a) Numerically computed curves illustrating the efficiency of growth entrapment for several values of the dimensionless quantity v·l / D. As shown in the inset, the concentration profiles are “traverses” across new growth on a pre-existing seed. The surface concentration factor F was assumed to be 10 for these calculations; the “trapped” concentration is that represented by the plateaus identified with specific v·l / D values. As in the previous figure, Ci is the concentration of impurity i and CL is the equilibrium concentration at depth in the crystal. In (b), percent enrichment (i.e., the plateau level relative to the equi-librium concentration) is shown as a function of v·l / D for various values of F.
0 1 2
20
40
60
80
100
0
% e
nrich
ment
F=2
F=10
F=100
b
.( )log l /D
10
8
6
4
2
0.0 0.2 0.4 0.6 0.8 1.0
8
4
2
1
0.5
x/X0
"seed"
newgrowth
concentrationprofile
Ci
CL
a .l /D = 16
.l /D = 0

Kinetic Fractionation by Diffusion and Crystal Growth Reactions 119
led Thien et al. (2014) to suggest that Rb is similar to D / (m · l) and Kf is similar to F', where F' is the surface/bulk solution partition coefficient. For trace element partitioning, they wrote:
( )
fp
b f
p b eq
.
1 11 1
K FK
DR Km lR R K F
Dv
m l
= =
+ − ⋅ +
′
+ − +
⋅
(40)
This expression is mathematically identical to the SRKM but with a detachment flux Rb that varies depending on the values of D, m, and l. Thien et al. (2014) referred to diffusion in the near surface as a “generic homogenization process” that could include dissolution and reprecipitation. Thien et al. (2014) also relaxed the assumption that the surface composition represents an equilibrium surface composition, which allows for solution hydrodynamics and ion desolvation kinetics to be part of the consideration (Hofmann et al. 2012). This helps to reconcile the conceptual differences that set the SRKM and GEM apart, namely (a) what processes set the surface composition (kinetics versus local equilibrium), and (b) what processes modulate that composition through ion detachment from the surface (detachment of adsorbed ions versus solid-state diffusion)?
As discussed throughout this chapter, the composition of the surface depends on many factors, including surface roughness at the atomic scale and the thermodynamic properties of the mineral surface on both sides of the solid–liquid interface. While these properties may be a key
−2.0
−1.5
−1.0
−0.5
0.0
10−12 10−10 10−8 10−6 10−4 10−2
Rp (moles/m2/s)
Δ(4
4/40
) Ca ca
lcite
-aq Growth
entrapment model (GEM)
25ºC
Pe = 1
Parameters used by Tang et al. (2008b):Dsurface = 0.06 nm2/sDlattice = 1.53 × 10⁻¹⁸ nm2/sl = 0.5 nmm = 8
Figure 20. The GEM can match the growth rate dependence of calcium isotope fractionation between calcite and aqueous solution. The crossover between equilibrium and kinetic effects occurs at Pe = 1, which requires a surface diffusivity that is 16 orders of magnitude greater than the lattice diffusivity and 10 orders of magnitude less than the aqueous diffusivity. In the GEM, the surface composition is attributed to local equilibrium and the thermodynamic properties of the distorted near surface of the solid phase. The actual “entrapped” compo-sition is determined by the efficiency of near surface, solid-state diffusion relative to crystal growth rate. This is conceptually different from the SRKM and ion-by-ion models (Fig. 10), where the surface is inferred to be out of equilibrium with the solution (perhaps due to ion desolvation kinetics) and the “entrapped” composi-tion is determined by the efficiency of ion detachment relative to crystal growth rate.
120 Watkins, DePaolo & Watson
factor influencing ion attachment and detachment kinetics, there are situations (Regimes 3 and 4 of Fig. 9) where the assumption of local equilibrium is not tenable. Consider, for example, the desolvation rates of various impurities relative to the desolvation rate of Ca2+, which is likely the rate-limiting step for calcite growth because Ca2+ desolvates 1−2 orders of magnitude more slowly than the carbonate anions (Nielsen 1984; Larsen et al. 2010). As summarized by Mavromatis et al. (2013), Sr2+ and Ba2+ desolvate as readily as Ca2+ (kwex ~ 109 s−1) whereas Mg2+, Fe2+, Co2+ and Ni2+ desolvate 3−5 orders of magnitude slower. If calcite growth proceeds as fast as the Ca2+ ions can desolvate, it is difficult to imagine how Mg2+, Fe2+, Co2+ and Ni2+ could establish an equilibrium distribution of desolvated species on the mineral surface, let alone within the outer layers of the solid phase. For rapidly desolvating species like 3HCO−
and 23CO −,
an equilibrium distribution of adsorbed species can possibly be established even when calcite growth is fast. This line of reasoning was used by Watkins et al. (2014) to explain how af could plausibly be greater than or less than one for carbon or oxygen isotopes in calcite, depending on the bonding properties on, near, or perhaps within the mineral surface. As noted by Thien et al. (2014), application of the GEM does not require the surface to be in equilibrium with the solution, only that the surface composition be different from the bulk lattice equilibrium value.
PERSPECTIVES
The fact that kinetic isotope effects (KIEs) are sensitive to the pathways of chemical reactions presents both challenges and opportunities for decoding the isotopic composition of minerals to infer conditions of mineral formation. Many of the advances toward understanding KIEs have been made by investigating minerals precipitated from aqueous solution, which presents opportunities to extend the insights gained to problems involving crystal growth from a silicate melt. Further advances in our understanding of kinetic fractionation of non-traditional stable isotopes by diffusion and crystal growth reactions will come from a combination of new experiments designed to isolate specific kinetic processes, continued advances in in situ isotopic measurements, and the continued application of computational methods to simulate what happens at phase boundaries. Not only can these tools be used to probe the underlying mechanisms of KIEs, but KIEs can be used as a tool to probe nano-scale processes that are inaccessible to direct observation.
There are many possible diffusion and growth pathways that are not explicitly accounted for in the classical theories of crystal growth covered in this chapter. The classical theories are based on diffusion and attachment of monomers to an isolated crystal, but it is now recognized that biogenic and inorganic crystals can grow by addition of particles that range in size from multi-ion complexes (Schott et al. 2016) to fully formed nanoparticles (Gebauer et al. 2008, 2014; Li et al. 2012; De Yoreo et al. 2015; Gal et al. 2015). These pathways and the concomitant isotope effects may not be adequately described by the surface reaction kinetic model (SRKM), ion-by-ion models, or the growth entrapment model (GEM) described herein. Further complexity arises when one considers biogenic minerals, which are often characterized by unusual, sometimes convoluted, shapes—perhaps reflecting growth by attachment of amorphous or quasi-crystalline nanosphere particles to a pre-existing template or preformed space (Gal et al. 2013, 2015). In such cases, the isotopic composition may be the relict of an initial disordered phase that is no longer present. Bearing these factors in mind, one thing is clear: the real world of crystal growth in nature involves multiple nano-scale phenomena that may discriminate on the basis of mass, and an important challenge moving forward is to better understand how the different nano-scale processes contribute to the kinetic fractionation factors (KFFs) that are deduced from diffusion and crystal growth experiments.

Kinetic Fractionation by Diffusion and Crystal Growth Reactions 121
ACKNOWLEDGMENTS
We acknowledge with admiration Frank Richter's leadership of a nearly two-decade effort to characterize diffusive isotope fractionation in silicate melts and aqueous solutions. The authors appreciate the valuable feedback from James Van Orman, Vasileios Mavromatis, Abby Kavner, and an anonymous reviewer. JMW thanks Frederick Ryerson, Frank Richter, Yan Liang, Ian Bourg, Christian Huber, and Laura Lammers (nee Nielsen) for numerous discussions on the themes of this chapter over the past several years. This work was supported by (1) the National Science Foundation through grant nos. EAR-0337481 and EAR-0738843 to EBW and grant no. NSF-EAR-1249404 to JMW, and (2) the U.S. Department of Energy, Office of Science, Office of Basic Energy Sciences, Chemical Sciences, Geosciences, and Biosciences Division, under Award Number DE-AC02-05CH11231.
REFERENCES
Albarède F, Bottinga Y (1972) Kinetic disequilibrium in trace element partitioning between phenocrysts and host lava. Geochim Cosmochim Acta 36:141–156
Aubaud C, Pineau F, Jambon A, Javoy M (2004) Kinetic disequilibrium of C, He, Ar and carbon isotopes during degassing of mid-ocean ridge basalts. Earth Planet Sci Lett 222:391–406
Baker E (2015) Carbon and Oxygen Isotopes in Laboratory-Grown Inorganic Calcite. Master’s thesis, University of Oregon
Bard AJ, Faulkner LR (1980) Electrochemical methods: Fundamentals and applications. Vol. 2 Wiley New YorkBeck P, Chaussidon M, Barrat JA, Gillet P, Bohn M (2006) Diffusion induced Li isotopic fractionation during
the cooling of magmatic rocks: the case of pyroxene phenocrysts from nakhlite meteorites. Geochim Cosmochim Acta 70:4813–4825
Benson BB, Krause D (1980) The concentration and isotopic fractionation of gases dissolved in freshwater in equilibrium with the atmosphere. 1. Oxygen Limnol Oceanogr 25:662–671
Black JR, Umeda G, Dunn B, McDonough WF, Kavner A (2009) Electrochemical isotope effect and lithium isotope separation. J Am Chem Soc 131:9904–9905
Black JR, John S, Young ED, Kavner A (2010a) Effect of temperature and mass transport on transition metal isotope fractionation during electroplating. Geochim Cosmochim Acta 74:5187–5201
Black JR, Young ED, Kavner A (2010b) Electrochemically controlled iron isotope fractionation. Geochim Cosmochim Acta 74:809–817
Black JR, John SG, Kavner A (2014) Coupled effects of temperature and mass transport on the isotope fractionation of zinc during electroplating. Geochim Cosmochim Acta 124:272–282
Böhm F, Eisenhauer A, Tang J, Dietzel M, Krabbenhöft A, Kisakürek B, Horn C (2012) Strontium isotope fractionation of planktic foraminifera and inorganic calcite. Geochim Cosmochim Acta 93:300–314
Bourg IC, Sposito G (2007) Molecular dynamics simulations of kinetic isotope fractionation during the diffusion of ionic species in liquid water. Geochim Cosmochim Acta 71:5583–5589
Bourg IC, Sposito G (2008) Isotopic fractionation of noble gases by diffusion in liquid water: Molecular dynamics simulations and hydrologic applications. Geochim Cosmochim Acta 72:2237–2247
Bourg IC, Richter FM, Christensen, JN, Sposito G (2010) Isotopic mass dependence of metal cation diffusion coefficients in liquid water. Geochim Cosmochim Acta 74:2249–2256
Brantley SL, Liermann LJ, Guynn RL, Anbar A, Icopini GA, Barling J (2004) Fe isotopic fractionation during mineral dissolution with and without bacteria. Geochimica et Cosmochimica Acta 68:3189–3204
Chou L, Garrels RM, Wollast R (1989) Comparative study of the kinetics and mechanisms of dissolution of carbonate minerals. Chem Geol 78:269–282
Crispin KL, Saha S, Morgan D, Van Orman JA (2012) Diffusion of transition metals in periclase by experiment and first-principles, with implications for core-mantle equilibration during metal percolation. Earth Planet Sci Lett 357:42–53
Dauphas N (2007) Diffusion-driven kinetic isotope effect of Fe and Ni during formation of the Widmanstätten pattern. Meteoritics Planet Sci 42:1597–1613
Dauphas N, Teng F-Z, Arndt NT (2010) Magnesium and iron isotopes in 2.7 Ga Alexo komatiites: mantle signatures, no evidence for Soret diffusion, and identification of diffusive transport in zoned olivine. Geochim Cosmochim Acta 74:3274–3291
De Groot SR, Mazur, P (1963) Non-Equilibrium Thermodynamics. Dover PublicationsDe Yoreo JJ, Gilbert PU, Sommerdijk NA, Penn RL, Whitelam S, Joester D, Zhang H, Rimer JD, Navrotsky A,
Banfield JF, Wallace AF, Michel FM, Meldrum FC, Cölfen H, Dove PM (2015) Crystallization by particle attachment in synthetic, biogenic, and geologic environments. Science 349(6247),aaa6760

122 Watkins, DePaolo & Watson
DePaolo DJ (2011) Surface kinetic model for isotopic and trace element fractionation during precipitation of calcite from aqueous solutions. Geochim Cosmochim Acta 75:1039–1056
Dietzel M, Tang J, Leis A, Köhler SJ (2009) Oxygen isotopic fractionation during inorganic calcite precipitation: effects of temperature, precipitation rate and pH. Chem Geol 268:107–115
Dingwell DB (1990) Effects of structural relaxation on cationic tracer diffusion in silicate melts. Chem Geol 82:209–216
Dohmen R, Milke R (2010) Diffusion in polycrystalline materials: grain boundaries, mathematical models, and experimental data. Rev Mineral Geochem 72:921–970
Dominguez G, Wilkins G, Thiemens MH (2011) The Soret effect and isotopic fractionation in high-temperature silicate melts. Nature 473:70–73
Druhan JL, Brown ST, Huber C (2015) Isotopic gradients across fluid–mineral boundaries. Rev Mineral Geochem 80:355–391
Eggenkamp H, Coleman ML (2009) The effect of aqueous diffusion on the fractionation of chlorine and bromine stable isotopes. Geochim Cosmochim Acta 73:3539–3548
Ellis AS, Johnson TM, Bullen TD (2004) Using chromium stable isotope ratios to quantify Cr(VI) reduction: lack of sorption effects. Environ Sci Technol 38:3604–3607
Fenter P, Geissbühler P, DiMasi E, Srajer G, Sorensen L, Sturchio N (2000a) Surface speciation of calcite observed in situ by high-resolution X-ray reflectivity. Geochim Cosmochim Acta 64:1221–1228
Fenter P, Teng H, Geissbühler P, Hanchar J, Nagy K, Sturchio N (2000b) Atomic-scale structure of the orthoclase (001)-water interface measured with high-resolution X-ray reflectivity. Geochim Cosmochim Acta 64:3663–3673
Fenter P, Cheng L, Park C, Zhang Z, Sturchio N (2003) Structure of the orthoclase (001)- and (010)-water interfaces by high-resolution X-ray reflectivity. Geochim Cosmochim Acta 67:4267–4275
Fuex A (1980) Experimental evidence against an appreciable isotopic fractionation of methane during migration. Phys Chem Earth 12:725–732
Gabitov R, Sadekov A, Leinweber A (2014) Crystal growth rate effect on Mg/Ca and Sr/Ca partitioning between calcite and fluid: An in situ approach. Chem Geol 367:70–82
Gal A, Habraken W, Gur D, Fratzl P, Weiner S, Addadi L (2013) Calcite crystal growth by a solid-state transformation of stabilized amorphous calcium carbonate nanospheres in a hydrogel. Angew Chem Int Ed 52:4867–4870
Gal A, Weiner S, Addadi L (2015) A perspective on underlying crystal growth mechanisms in biomineralization: solution mediated growth versus nanosphere particle accretion. CrystEngComm 17:2606–2615
Gallagher K, Elliott T (2009) Fractionation of lithium isotopes in magmatic systems as a natural consequence of cooling. Earth Planet Sci Lett 278:286–296
Gardner JE, Befus KS, Watkins JM, Hesse M, Miller N (2012) Compositional gradients surrounding spherulites in obsidian and their relationship to spherulite growth and lava cooling. Bull Volcanol 74:1865–1879
Gebauer D, Völkel A, Cölfen H (2008) Stable prenucleation calcium carbonate clusters. Science 322:1819–1822Gebauer D, Kellermeier M, Gale JD, Bergström L, Cölfen H (2014) Pre-nucleation clusters as solute precursors
in crystallisation. Chem Soc Rev 43:2348–2371 Goel G, Zhang L, Lacks DJ, Van Orman JA (2012) Isotope fractionation by diffusion in silicate melts: Insights
from molecular dynamics simulations. Geochim Cosmochim Acta 93:205–213Hamza M, Broecker W (1974) Surface effect on the isotopic fractionation between CO2 and some carbonate
minerals. Geochim Cosmochim Acta 38:669–681Hofmann A, Bourg I, DePaolo D (2012) Ion desolvation as a mechanism for kinetic isotope fractionation in
aqueous systems. PNAS 109:18689–18694Huang F, Chakraborty P, Lundstrom C, Holmden C, Glessner J, Kieffer S, Lesher C (2010) Isotope fractionation
in silicate melts by thermal diffusion. Nature 464:396–400Immenhauser A, Buhl D, Richter D, Niedermayr A, Riechelmann D, Dietzel M, Schulte U (2010) Magnesium-
isotope fractionation during low-Mg calcite precipitation in a limestone cave - Field study and experiments. Geochim Cosmochim Acta 74:4346–4364
Jähne B, Heinz G, Dietrich W (1987) Measurement of the diffusion coefficients of sparingly soluble gases in water. J Geophys Res: Oceans 92:10767–10776
Jeffcoate A, Elliott T, Kasemann S, Ionov D, Cooper K, Brooker R (2007) Li isotope fractionation in peridotites and mafic melts. Geochim Cosmochim Acta 71:202–218
Kavner A, Bonet F, Shahar A, Simon J, Young E (2005) The isotopic effects of electron transfer: An explanation for Fe isotope fractionation in nature. Geochim Cosmochim Acta 69:2971–2979
Kavner A, John S, Sass S, Boyle E (2008) Redox-driven stable isotope fractionation in transition metals: Application to Zn electroplating. Geochim Cosmochim Acta 72:1731–1741
Kerr RC (1995) Convective crystal dissolution. Contrib Mineral Petrol 121:237–246Knight, KB, Kita NT, Mendybaev RA, Richter FM, Davis AM, Valley JW (2009) Silicon isotopic fractionation of
CAI-like vacuum evaporation residues. Geochim Cosmochim Acta 73:6390–6401
Kinetic Fractionation by Diffusion and Crystal Growth Reactions 123
Knox M, Quay P, Wilbur D (1992) Kinetic isotopic fractionation during air-water gas transfer of O2, N2, CH4, and H2. J Geophys Res: Oceans 97:20335–20343
Lanzillo N, Watson E, Thomas J, Nayak S, Curioni A (2014) Near-surface controls on the composition of growing crystals: Car-Parrinello molecular dynamics (CPMD) simulations of Ti energetics and diffusion in alpha quartz. Geochim Cosmochim Acta 131:33–46
Larsen K, Bechgaard K, Stipp SLS (2010) The effect of the Ca2+ to activity ratio on spiral growth at the calcite surface. Geochim Cosmochim Acta 74:2099–2109
Lasaga AC (1998) Kinetic Theory in the Earth Sciences. Princeton University PressLe Claire A (1966) Some comments on the mass effect in diffusion. Philos Mag 14:1271–1284Lemarchand D, Wasserburg G, Papanastassiou D (2004) Rate-controlled calcium isotope fractionation in
synthetic calcite. Geochim Cosmochim Acta 68:4665–4678Li W, Chakraborty S, Beard BL, Romanek CS, Johnson CM (2012) Magnesium isotope fractionation during
precipitation of inorganic calcite under laboratory conditions. Earth Planet Sci Lett 333:304–316Lundstrom C, Chaussidon M, Hsui AT, Kelemen P, Zimmerman M (2005) Observations of Li isotopic variations
in the Trinity Ophiolite: Evidence for isotopic fractionation by diffusion during mantle melting. Geochim Cosmochim Acta 69:735–751
Maaløe S (2011) Olivine phenocryst growth in Hawaiian tholeiites: Evidence for supercooling. J Petrol 52:1579–1589Malinovsky D, Baxter DC, Rodushkin I (2007) Ion-specific isotopic fractionation of molybdenum during
diffusion in aqueous solutions. Environ Sci Technol 41:1596–1600Marschall, HR, von Strandmann PAP, Seitz H-M, Elliott T, Niu Y (2007) The lithium isotopic composition of
orogenic eclogites and deep subducted slabs. Earth Planet Sci Lett 262:563–580Mavromatis V, Gautier Q, Bosc O, Schott J (2013) Kinetics of Mg partition and Mg stable isotope fractionation
during its incorporation in calcite. Geochim Cosmochim Acta 114:188–203Mavromatis V, Montouillout V, Noireaux J, Gaillardet J, Schott J (2015) Characterization of boron incorporation
and speciation in calcite and aragonite from co-precipitation experiments under controlled pH, temperature and precipitation rate. Geochim Cosmochim Acta 150:299–313
Müller T, Watson EB, Trail D, Wiedenbeck M, Van Orman J, Hauri EH (2014) Diffusive fractionation of carbon isotopes in γ-Fe: Experiment, models and implications for early solar system processes. Geochim Cosmochim Acta 127:57–66
Mullen JG (1961) Isotope effect in intermetallic diffusion. Phys Rev 121:1649 Mundy J, Barr L, Smith F (1966) Sodium self-diffusion and the isotope effect. Philos Mag 14 (130), 785{802Nielsen AE (1984) Electrolyte crystal growth mechanisms. J Cryst Growth 67:289–310Nielsen LC, DePaolo DJ (2013) Ca isotope fractionation in a high-alkalinity lake system: Mono Lake, California.
Geochim Cosmochim Acta 118:276–294 Nielsen LC, Druhan JL, Yang W, Brown ST, DePaolo DJ (2012) Calcium isotopes as tracers of biogeochemical
processes. In: Handbook of Environmental Isotope Geochemistry. Springer, p 105–124 Nielsen LC, De Yoreo JJ, DePaolo DJ (2013) General model for calcite growth kinetics in the presence of impurity
ions. Geochim Cosmochim Acta 115:100–114Oeser M, Dohmen R, Horn I, Schuth S, Weyer S (2015) Processes and time scales of magmatic evolution as revealed
by Fe–Mg chemical and isotopic zoning in natural olivines. Geochim Cosmochim Acta 154:130–150Onsager L (1945) Theories and problems of liquid diffusion. Ann NY Acad Sci 46:241–265Parkinson IJ, Hammond SJ, James RH, Rogers NW (2007) High-temperature lithium isotope fractionation:
Insights from lithium isotope diffusion in magmatic systems. Earth Planet Sci Lett 257:609–621Pearce CR, Saldi GD, Schott J, Oelkers EH (2012) Isotopic fractionation during congruent dissolution,
precipitation and at equilibrium: Evidence from Mg isotopes. Geochim Cosmochim Acta 92:170–183Pikal MJ (1972) Isotope effect in tracer diffusion. Comparison of the diffusion coefficients of 24Na+ and 22Na+ in
aqueous electrolytes. J Phys Chem 76:3038–3040Richter FM, Liang Y, Davis AM (1999) Isotope fractionation by diffusion in molten oxides. Geochim Cosmochim
Acta 63:2853–2861Richter FM, Davis AM, DePaolo DJ, Watson EB (2003) Isotope fractionation by chemical diffusion between
molten basalt and rhyolite. Geochim Cosmochim Acta 67:3905–3923Richter F, Mendybaev R, Christensen J, Hutcheon I, Williams R, Sturchio N (2006) Kinetic isotope fractionation
during diffusion of ionic species in water. Geochim Cosmochim Acta 70:277–289Richter FM, Watson EB, Mendybaev RA, Teng F-Z, Janney PE (2008) Magnesium isotope fractionation in
silicate melts by chemical and thermal diffusion. Geochim Cosmochim Acta 72:206–220 Richter FM, Dauphas N, Teng F-Z (2009a) Non-traditional fractionation of non-traditional isotopes: evaporation,
chemical diffusion and Soret diffusion. Chem Geol 258:92–103Richter FM, Watson EB, Mendybaev R, Dauphas N, Georg B, Watkins J, Valley J (2009b) Isotopic fractionation
of the major elements of molten basalt by chemical and thermal diffusion. Geochim Cosmochim Acta 73:4250–4263

124 Watkins, DePaolo & Watson
Richter FM, Watson EB, Mendybaev R, Dauphas N, Georg B, Watkins J, Valley J (2009c) Isotopic fractionation of the major elements of molten basalt by chemical and thermal diffusion. Geochim Cosmochim Acta 73:4250–4263
Richter F, Watson B, Chaussidon M, Mendybaev R, Ruscitto D (2014a) Lithium isotope fractionation by diffusion in minerals. Part 1: Pyroxenes. Geochim Cosmochim Acta 126:352–370
Richter FM, Watson EB, Chaussidon M, Mendybaev R, Christensen JN, Qiu L (2014b) Isotope fractionation of Li and K in silicate liquids by Soret diffusion. Geochim Cosmochim Acta 138:136–145
Richter F, Chaussidon M, Mendybaev R, Kite E (2016) Reassessing the cooling rate and geologic setting of Martian meteorites MIL 03346 and NWA 817. Geochim Cosmochim Acta 182:1–23
Robinson LF, Adkins JF, Frank N, Gagnon AC, Prouty NG, Roark EB, van de Flierdt T (2014) The geochemistry of deep-sea coral skeletons: A review of vital effects and applications for palaeoceanography. Deep Sea Res Part II 99:184–198
Rodushkin I, Stenberg A, Andrén H, Malinovsky D, Baxter DC (2004) Isotopic fractionation during diffusion of transition metal ions in solution. Anal Chem 76:2148–2151
Roskosz M, Luais B, Watson HC, Toplis MJ, Alexander CM, Mysen BO (2006) Experimental quantification of the fractionation of Fe isotopes during metal segregation from a silicate melt. Earth Planet Sci Lett 248:851–867
Rothman S, Peterson N (1969) Isotope effect and divacancies for self-diffusion in copper. Phys Stat Solidi (b) 35:305–312
Rudnick RL, Ionov DA (2007) Lithium elemental and isotopic disequilibrium in minerals from peridotite xenoliths from far-east Russia: product of recent melt/fluid–rock reaction. Earth Planet Sci Lett 256:278–293
Saenger C, Wang Z (2014) Magnesium isotope fractionation in biogenic and abiogenic carbonates: implications for paleoenvironmental proxies. Quat Sci Rev 90:1–21
Schlegel ML, Nagy KL, Fenter P, Sturchio NC (2002) Structures of quartz (100)- and (101)-water interfaces determined by X-ray reflectivity and atomic force microscopy of natural growth surfaces. Geochim Cosmochim Acta 66:3037–3054
Schoen A (1958) Correlation and the isotope effect for diffusion in crystalline solids. Phys Rev Letters 1:138Schott J, Mavromatis V, Fujii T, Pearce C, Oelkers E (2016) The control of magnesium aqueous speciation on Mg
isotope composition in carbonate minerals: Theoretical and experimental modeling. Chem Geol in pressSchüle W, Scholz R (1979) Properties of vacancies and divacancies in fcc metals. Phys Stat Solidi (B) 93:K119–K123Sio CKI, Dauphas N, Teng F-Z, Chaussidon M, Helz RT, Roskosz M (2013) Discerning crystal growth from diffusion
profiles in zoned olivine by in situ Mg–Fe isotopic analyses. Geochim Cosmochim Acta 123:302–321Smith VG, Tiller WA, Rutter J (1955) A mathematical analysis of solute redistribution during solidification. Can
J Phys 33:723–745Stebbins JF (1995) Dynamics and structure of silicate and oxide melts; nuclear magnetic resonance studies. Rev
Mineral Geochem 32:191–246Tang J, Dietzel M, Böhm F, Köhler S, Eisenhauer A (2008a) Sr2+/Ca2+ and 44Ca/40Ca fractionation during
inorganic calcite formation: II. Ca isotopes. Geochim Cosmochim Acta 72:3733–3745Tang J, Köhler S, Dietzel M (2008b) Sr2+/Ca2+ and 44Ca/40Ca fractionation during inorganic calcite formation: I.
Sr incorporation. Geochim Cosmochim Acta 72:3718–3732Tempest KE, Emerson S (2013) Kinetic isotopic fractionation of argon and neon during air–water gas transfer.
Marine Chem 153:39–47Teng F-Z, McDonough WF, Rudnick RL, Walker RJ (2006) Diffusion-driven extreme lithium isotopic
fractionation in country rocks of the Tin Mountain pegmatite. Earth Planet Sci Lett 243:701–710 Teng F-Z, Dauphas N, Helz RT, Gao S, Huang S (2011) Diffusion-driven magnesium and iron isotope fractionation
in Hawaiian olivine. Earth Planet Sci Lett 308:317–324Tharmalingam K, Lidiard A (1959) Isotope effect in vacancy diffusion. Philos Mag 4 :899–906Thien BM, Kulik DA, Curti E (2014) A unified approach to model uptake kinetics of trace elements in complex
aqueous–solid solution systems. Appl Geochem 41:135–150Tiller W, Jackson K, Rutter J, Chalmers B (1953) The redistribution of solute atoms during the solidification of
metals. Acta Metallurgica 1:428–437Tyroller L, Brennwald MS, Mächler L, Livingstone DM, Kipfer R (2014) Fractionation of Ne and Ar isotopes by
molecular diffusion in water. Geochim Cosmochim Acta 136:60–66Uchikawa J, Penman DE, Zachos JC, Zeebe RE (2015) Experimental evidence for kinetic effects on B/Ca in synthetic
calcite: Implications for potential and B(OH)3 incorporation. Geochim Cosmochim Acta 150:171–191Van Orman JA, Krawczynski MJ (2015) Theoretical constraints on the isotope effect for diffusion in minerals.
Geochim Cosmochim Acta 164:365–381Vineyard GH (1957) Frequency factors and isotope effects in solid state rate processes. J Phys Chem Solids
3:121–127Wall AJ, Mathur R, Post JE, Heaney PJ (2011) Cu isotope fractionation during bornite dissolution: an in situ
X-ray diffraction analysis. Ore Geol Rev 42:62–70

Kinetic Fractionation by Diffusion and Crystal Growth Reactions 125
Watkins JM, DePaolo DJ, Huber C, Ryerson FJ (2009) Liquid composition-dependence of calcium isotope fractionation during diffusion in molten silicates. Geochim Cosmochim Acta 73:7341–7359
Watkins JM, DePaolo DJ, Ryerson FJ, Peterson BT (2011) Influence of liquid structure on diffusive isotope separation in molten silicates and aqueous solutions. Geochim Cosmochim Acta 75:3103–3118
Watkins JM, Nielsen LC, Ryerson FJ, DePaolo DJ (2013) The influence of kinetics on the oxygen isotope composition of calcium carbonate. Earth Planet Sci Lett 375:349–360
Watkins JM, Liang Y, Richter F, Ryerson FJ, DePaolo DJ (2014) Diffusion of multi-isotopic chemical species in molten silicates. Geochim Cosmochim Acta 139:313–326 Watson EB (2004) A conceptual model for near-surface kinetic controls on the trace-element and stable isotope composition of abiogenic calcite crystals. Geochim Cosmochim Acta 68:1473–1488
Watson E (2004) A conceptual model for near-surface kinetic controls on the trace-element and stable isotope composition of abiogenic calcite crystals. Geochim Cosmochim Acta 68:1472–1488
Watson EB, Liang Y (1995) A simple model for sector zoning in slowly grown crystals: Implications for growth rate and lattice diffusion, with emphasis on accessory minerals in crustal rocks. Am Mineral 80:1179–1187
Watson EB, Müller T (2009) Non-equilibrium isotopic and elemental fractionation during diffusion-controlled crystal growth under static and dynamic conditions. Chem Geol 267:111–124
Watson EB, Cherniak D, Holycross M (2015) Diffusion of phosphorus in olivine and molten basalt. American Mineralogist 100:2053–2065
Weiss DJ, Rehkdmper M, Schoenberg R, McLaughlin M, Kirby J, Campbell PG, Arnold T, Chapman J, Peel K, Gioia S (2008) Application of nontraditional stable-isotope systems to the study of sources and fate of metals in the environment. Environ Sci Technol 42:655–664
Young E, Galy A, Nagahara H (2002) Kinetic and equilibrium mass-dependent isotope fractionation laws in nature and their geochemical and cosmochemical significance. Geochim Cosmochim Acta 66:1095–1104
Zhang Y (2008) Geochemical Kinetics. Princeton University Press Zhang J, Nancollas GH (1998) Kink density and rate of step movement during growth and dissolution of an AB
crystal in a nonstoichiometric solution. J Colloid Interface Sci 200:131–145Zhu X, Guo Y, Williams R, Onions R, Matthews A, Belshaw N, Canters G, De Waal E, Weser U, Burgess B,
Salvado B (2002) Mass fractionation processes of transition metal isotopes. Earth Planet Sci Lett 200:47–62Zeebe R (2011) On the molecular diffusion coefficients of dissolved CO2, HCO3
− and CO32− and their dependence
on isotopic mass. Geochim Cosmochim Acta 75:2483–2498