kinetic studies monooxygenase inhibition nitrosomonas ...aem.asm.org/content/59/8/2501.full.pdf ·...
TRANSCRIPT
APPLIED AND ENVIRONMENTAL MICROBIOLOGY, Aug. 1993, p. 2501-25100099-2240/93/082501-10$02.00/0Copyright © 1993, American Society for Microbiology
Kinetic Studies of Ammonia Monooxygenase Inhibition inNitrosomonas europaea by Hydrocarbons and Halogenated
Hydrocarbons in an Optimized Whole-Cell AssayWILLIAM K. KEENER AND DANIEL J. ARP*
Laboratory for Nitrogen Fixation Research, Oregon State University, Corvallis, Oregon 97331-2902
Received 4 March 1993/Accepted 19 May 1993
The inhibitory effects of 15 hydrocarbons and halogenated hydrocarbons on NH3 oxidation by ammoniamonooxygenase (AMO) in intact cells of the nitrifying bacterium Nitrosomonas europaea were determined.Determination of AMO activity, measured as N02 production, required coupling of hydroxylamineoxidoreductase (HAO) activity with NH3-dependent NH20H production by AMO. Hydrazine, an alternatesubstrate for HAO, was added to the reaction mixtures as a source of reductant for AMO. Most inhibitorsexhibited competitive or noncompetitive inhibition patterns. The competitive character generally decreased(KiES/KES increased) as the molecular size of the inhibitors increased. For example, CH4 and C2H4 were
competitive inhibitors of NH3 oxidation, whereas the remaining alkanes (up to C4) and monohalogenated (Cl,Br, I) alkanes were noncompetitive. Oxidation of C2H.Br (noncompetitive) increased as the NH4' concentra-tion increased up to 40 mM, whereas oxidations of inhibitors with competitive character (KiE iKIES) were
diminished at 40 mM NH4+. Multichlorinated compounds produced nonlinear Lineweaver-Burk plots.Iodinated alkanes (CH3I, C2H11) and C2C14 were potent inhibitors of NH3 oxidation. Maximum rates of NH3,C2H4, and C2H6 oxidations were approximately equivalent, suggesting a common rate-determining step. Thesedata support an active-site model for AMO consisting of an NH3-binding site and a second site that bindsnoncompetitive inhibitors, with oxidation occurring at either site.
The widely distributed soil bacterium Nitrosomonas euro-
paea is an obligate chemolithoautotrophic aerobe which usesammonia as its sole natural energy source (28). The oxida-tion of ammonia to nitrite in N. europaea is initiated byammonia mono-oxygenase (AMO). Because of the broadsubstrate range ofAMO (2, 19, 21, 24), attention has focusedrecently on the possibility of using nitrifiers such as N.europaea in the bioremediation of contaminated soils andaquifers and in the treatment of wastes. Exploitation of thispotential of nitrifiers will require a thorough knowledge ofAMO and its interaction with alternate substrates.AMO catalyzes the oxidation of NH3 to hydroxylamine
which is subsequently oxidized to N02 by hydroxylamineoxidoreductase (HAO) with the release of four electrons(28). Two of the four electrons must be transferred to AMOto activate 02 and maintain steady-state rates of ammoniaoxidation (28). Free NH20H concentrations are apparentlyvery low during ammonia oxidation (28). The coupling ofAMO and HAO activities is illustrated in the top half of Fig.1. AMO in N. europaea also catalyzes the oxidation ofseveral alternate substrates (including hydrocarbons andhalogenated hydrocarbons) (19-21, 24). These oxidations,such as the oxidation of ethylene to ethylene oxide (Fig. 1,bottom half), require reductant, which can be suppliedby the simultaneous oxidation of ammonia to provideNH20H.
Previous studies of halogenated hydrocarbon oxidationsby N. europaea focused on the substrate range of theenzyme (11, 19-21, 24), product identification (11, 19), andthe toxicity associated with the oxidation of some com-pounds (21, 24). As potential substrates for AMO, hydrocar-bons and halogenated hydrocarbons can be categorized into
* Corresponding author.
three classes as defined by Rasche et al. (21): class 1 (thosenot oxidized by AMO), class 2 (those oxidized byAMO withlittle or no resultant toxic effect on the cells), and class 3(those oxidized by AMO but yielding reactive products thatinactivate NH3 oxidation). Two examples of class 1 com-
pounds are carbon tetrachloride and tetrachloroethylene(21). Chloromethane (21) and monohaloethanes (19) are class2 substrates, which yield formaldehyde and acetaldehyde as
oxidation products, respectively. Chloroform and trichloro-ethylene are examples of class 3 compounds, although bothare oxidatively dechlorinated (21).Although previous studies have provided information on
the substrate range and other aspects of alternate substrateoxidations byAMO, they have provided little information onhow halogenated hydrocarbon substrates interact with theactive site of AMO. Kinetic inhibition studies can providesuch insights into the active site of AMO and should there-fore have predictive value for biotransformations of com-
pounds structurally related to those we have tested, as wellas for in situ biotransformations of mixtures of compounds.With whole cells of N. europaea, the inhibition of NH3oxidation by CH4 (13) and C2H4 (14) is competitive, whichindicates mutually exclusive binding of NH3 and thesealternate substrates. Benzene, which is oxidized to phenoland subsequently top-hydroquinone, exhibits a noncompet-itive pattern (12). At low NH4+ concentrations, the double-reciprocal plots for CH4 and C2H4 deviate from the patternexpected for simple competitive inhibition; reductant deple-tion was cited as an explanation (14). Suzuki et al. (23)monitored AMO activity by measuring NH3-dependent 02
consumption in cell extracts and obtained double-reciprocalplots for the inhibitors CH4, CO, and CH30H which are alsoindicative of competitive inhibition. Their plots also deviatesomewhat from simple competitive inhibition.
2501
Vol. 59, No. 8
on May 6, 2018 by guest
http://aem.asm
.org/D
ownloaded from

2502 KEENER AND ARP
02 + 2H+ H20
NH3m
NH20H N02- 5H+
29 H20 40e
Terminal oxidase
2e- H20
ktAMO}C2H4 t C2H40
02 + 2H+
FIG. 1. Reactions catalyzed by AMO and HAO. Reactants areshown in numbers required for a single catalytic turnover event.
We wished to investigate the interactions of hydrocarbonsand halogenated hydrocarbons with AMO by determiningthe inhibition patterns and apparent inhibition constantsassociated with the inhibition of NH3 oxidation by thesecompounds. Since bioremediation applications with N. eu-
ropaea would involve whole cells, our experiments werecarried out with intact cells. Active, purified preparations ofAMO are not available. Furthermore, there is considerabledifficulty involved in stabilizing and assaying cell extracts(6). The direct electron donor for AMO has not beenidentified, necessitating the use of a coupled enzyme system,as in our study. The efficiency of coupling ofAMO and HAOactivities is apparently greatly reduced when cells are lysed(6). Alternate substrates can influence AMO activity in intactcells by three distinct mechanisms: (i) direct binding andinteraction with AMO, (ii) interference with the reductantsupply to AMO (oxidation of alternate substrates requiresreductant, but the products are not further oxidized toreplenish the reductant as is the case with NH3), or (iii)oxidation to highly reactive products that covalently bindand inactivate AMO and other enzymes. To avoid thecytotoxic effects associated with reactive products, we lim-ited our study to class 1 and 2 compounds. To ensure a
constant supply of reductant to AMO, we included hydra-zine, an alternate substrate for HAO, in the reaction mix-tures. In this way, we attempted to restrict the inhibitoryeffects of class 2 compounds to direct interactions withAMO. Fifteen hydrocarbon and halogenated hydrocarboninhibitors produced a variety of inhibition patterns includingcompetitive, noncompetitive, and nonlinear (concave-down)v-1-versus-S-1 plots (for definitions of v and S, see Materialsand Methods). Within the selection of inhibitors, trends werenoted in molecular size, identity of the halogen substituent,and number of halogen substituents. These trends shouldenhance the predictive value of the present work.
MATERIALS AND METHODS
Cell growth and preparation. N. europaea ATCC 19718was cultured in 1.5-liter batches at 30°C. The growth mediumcontained 25 mM (NH4)2SO4 and other constituents as
described previously (21). Cultures were inoculated with 40ml of a 2-day-old culture of N. europaea grown on the samemedium. Nitrite concentrations were determined spectro-photometrically by using the formula (352 - A40)/0.0225 =
[NO2-] (millimolar concentration). When the NO2 concen-
trations in the medium reached 15 to 21 mM (-42 h), thecells were harvested by centrifugation. At this age, the cellculture is in the late exponential growth phase; AMO activityfor a given cell density is maximal (9) and consistent (as
indicated by the day-to-day consistency of V and Kmvalues for control curves in v- -versus-S-1 plots [see be-low]. The cells were washed once in assay buffer, consistingof 50 mM NaH2PO4 (pH 7.7) and 2 mM MgCl2, and thensedimented and resuspended in assay buffer to a constantcell density (1.8 mg of protein per ml). Cell suspensions wereprepared daily, stored on ice in the dark, and used within 15h. Protein content was determined by using the biuret assay(7) after the cells were solubilized in 3 N NaOH for 1 h at650C.
Materials. Liquid inhibitors included CCl4 (Fisher, FairLawn, N.J.); C2H5Cl (Kodak, Rochester, N.Y.); andC2H5Br, C2C14, C2H5I, CH3I, CC13CH2CI, and n-ClC3H7(Aldrich Chemical Co., Milwaukee, Wis.). Gaseous inhibi-tors included CH4 and C2H4 (Airco, Vancouver, Wash.);C3H8 and n-C4H1o (Aldrich); and CH3Br, CH3Cl, and C2H6(Liquid Carbonic, Chicago, Ill.). The purities of all com-pounds were .99% unless otherwise noted. Other reagentsincluded 1-allyl-2-thiourea (Kodak), NH2OH. HCl (97.8%pure; Fisher), N2H4. H2SO4 (Fisher), and (NH4)2SO4(Mallinckrodt, Paris, Ky.). All other chemicals were ofreagent grade.
Kinetic inhibition assays. Stock solutions of the liquidinhibitors were prepared by adding the compounds to buffer-filled vials with microsyringes. Solutions were stirred mag-netically to achieve equilibrium, and then appropriate vol-umes were added with microsyringes to glass serum vials(volume, 6.5 ml) sealed with butyl rubber stoppers (Teflon-lined stoppers were used with C2C14). Gaseous inhibitorswere added directly to sealed serum vials with microsy-ringes. Serum vials contained 4.9 ml of assay buffer. Inhib-itor concentrations in the liquid phase of the assay vials werecalculated from dilutions (solutions of liquids in buffer) orvolumes added (gases), accounting for partitioning betweenthe gas and liquid phases (determined by gas chromatogra-phy). Cells (50 pl of the aforementioned suspension) wereadded to the reaction vials, which were preincubated for 10min in a water bath with shaking at 30°C. The reactions wereinitiated by addition of an aqueous solution (50 pl) contain-ing (NH4)2SO4 and N2H4 in concentrations appropriate togive the desired initial concentrations in the assay vials. Thevials were shaken in a reciprocating water bath (threereciprocations per s) at 300C. After 10 min, the reactionswere stopped by addition of 1-allyl-2-thiourea (to 40 ,uM), apotent, specific inhibitor of NH3 oxidation (16). The amountof N02 produced in the reactions was determined colori-metrically (8). For the experiment whose results are shownin Table 1, NH3 concentrations were determined colorimet-rically as described previously (27).To examine NH3 as an inhibitor of C2H4 oxidation by
AMO, we determined the inhibition pattern for several fixedNH4' concentrations with variable C2H4 concentrations.The production of ethylene oxide was quantified by gaschromatography as described previously (19) (see Fig. 5).The reaction conditions were as described above, includingthe addition of an optimized concentration of N2H4 for eachcombination of NH4' and C2H4 (see below).
Analysis of kinetic inhibition data. The rates of NO2formation (v) (or of C2H40 formation [see Fig. 5]) obtainedat various NH4' concentrations (S) at a fixed inhibitorconcentration were fit to the equation v = (Vmax. S)(Km +S)-1 by using the unweighted least-squares method and theMarquardt-Levenberg algorithm for nonlinear curve fitting(SigmaPlot; Jandel Corp.). Data for tetrachlorinated inhibi-tors clearly exhibited more complex behavior than for theremaining inhibitors; therefore, Ki values were not deter-
APPL. ENvIRON. MICROBIOL.
on May 6, 2018 by guest
http://aem.asm
.org/D
ownloaded from

AMMONIA MONOOXYGENASE INHIBITION IN NITROSOMONAS SPP.
mined for these compounds. The datum points in Fig. 7 are
connected by straight lines to indicate that they correspondto a given inhibitor concentration. The kinetic inhibition datawere plotted as v-l versus S1 at several inhibitor concen-
trations to facilitate visual analysis. The inhibition constants
K'E and KiEs were obtained by replotting the inhibitorconcentrations versus the slopes ory intercepts obtained on
the v-1-versus-S-1 plots, respectively. The constants were
taken as the absolute values of the x intercepts on theappropriate replots. For purified enzymes with one substrateand an unreactive inhibitor, KiE and KiEs are the dissocia-tion constants for binding of the inhibitor to the free enzyme(E) and the enzyme-substrate complex (ES), respectively(4). Our system provides apparent Ki values that cannot beconsidered true dissociation constants. However, these val-ues should provide reasonable approximations for the rela-tive affinities of these inhibitors for AMO in vivo.
Addition of hydrazine to circumvent reductant limitation.To eliminate reductant depletion caused by the oxidation ofalternate substrates by AMO, we added hydrazine to thereaction mixture at a concentration that gave the maximumN02 production rate. This optimum N2H4 concentrationwas determined empirically for each combination of NH4'and inhibitor concentrations as follows. Hydrazine concen-
trations (0, 0.1, 0.2, 0.3, 0.5, 0.7, and 0.9 mM) were testedfor 0.5, 1, and 5 mM NH4' for each of the high, low, andintermediate inhibitor concentrations (five concentrationswere used for most inhibitors). The optimum N2H4 concen-
tration was then interpolated for the remaining combinationsof NH4' and inhibitor concentrations.
V.,.,1 and Km determinations for C2H4 and C2H6. Vm. andKm values were determined for the alternate substrates C2H4and C2H6 by using N2H4 (added from aqueous stock solu-tions) to provide reductant. Oxidation rates of C2H4 andC2H6 were maximized with 0.8 mM N2H4; varying the N2H4concentration was unnecessary. The respective productsethylene oxide and ethanol were quantified by gas chroma-tography as described previously (19). All other reactionconditions were as described above.
Alternate substrate oxidations with NH3 as the sole reduc-tant source. The effects of increasing NH4' concentrationson the oxidation rates of C2H4, CH3Br, C2H5Br, and CH3C1were determined. The alternate substrates (300 ,uM in theaqueous phase) were combined with cells, preincubated as
above, and (NH4)2SO4 was added (final NH4+ concentra-tions, 1, 2, 5, 10, 20, and 40 mM) to initiate the reaction.Oxidation rates with endogenous reductant only were deter-mined in the absence of NH4' (see Table 4). Hydrocarbonand halogenated hydrocarbon oxidations were determined asthe amount of product formed or the difference between theinitial substrate concentrations and the substrate concentra-tion that remained after a fixed period. Substrates andproducts were quantified with liquid-phase injections byusing gas chromatography. All other reaction conditionswere as described above.
RESULTS
Determination of the validity of a coupled assay to measurerates of NH3 oxidation in the presence ofAMO inhibitors. Wesought to investigate the kinetic mechanisms of the interac-tions of hydrocarbon and halogenated hydrocarbon com-
pounds with the physiological substrate NH3. AMO activitycan be determined in a number of ways, including gas-chromatographic analysis of organic substrate depletion anddetermination of the residual NH4+ concentration by use of
TABLE 1. Comparison of ammonium consumed and nitriteproduced by whole cells of N. europaea in the presence
of ethylene and/or hydrazinea
Additin.Amt of ammonium Amt of nitriteAddition consumed (1Lmol) produced (pmol)
0.5 mM NH4+ 1.52 1.581 mM NH4} 2.76 2.770.5 mM NH4+ + 0.7 mM N2H4 1.18 1.191 mM NH4+ + 0.7 mM N2H4 1.93 1.890.5 mM NH4+ + 690 ,uM C2H4 + 0.61 0.61
0.5 mM N2H41 mM NH4+ + 690 ,uM C2H4+ 1.14 1.16
0.5 mM N2H4a Reactions were stopped with C2H2 after 1 h. Ammonium and nitrite
concentrations were measured as described in Materials and Methods.
an ion-selective electrode or a colorimetric assay. However,these methods suffer from the need to accurately determinesmall changes in NH3 or alternate substrate concentration.We chose to determine rates of N02 production from NH3as a measure of AMO activity; colorimetric N02 quantifi-cation is a simple and sensitive assay. A shortcoming of thismethod is that N02 production involves the coupling oftwo enzyme activities-AMO and HAO-through the inter-mediate NH2OH. Therefore, a number of assumptions areinherent in this assay. The first assumption was that all theoxidized NH3 was converted to NO2-. To test this assump-tion, we performed an experiment in which the amounts ofNH3 consumed were determined and compared with theamounts of N02- produced under various experimentalconditions. As shown in Table 1, the amount of NH3consumed after incubation for 1 h equaled the amount ofNO2 produced under all conditions tested, which includedthe presence of a representative inhibitor, C2H4 (690 ,uM),and/or the reductant N2H4 (0.7 mM). This approach was notfeasible for measuring small changes in NH4' concentrationoccurring during 10-min reaction periods, as used in thekinetic assays. However, when the highest concentration ofan alternate substrate/inhibitor was used (with its optimalN2H4 concentration [see below]) and AMO was specificallyand rapidly inactivated with C2H2 after 10-min reactions, nosignificant further increases in N02- concentration weremeasured after continued incubation of the reaction mix-tures. Supraoptimal N2H4 concentrations diminished N02-production over 10-min reactions but also correlated withsignificant increases in N02 concentration with extendedincubations. These observations can be explained if negligi-ble NH2OH concentrations accumulate with optimal N2H4concentrations, whereas supraoptimal N2H4 concentrationscause accumulation of NH2OH.The second assumption was that changes in the concen-
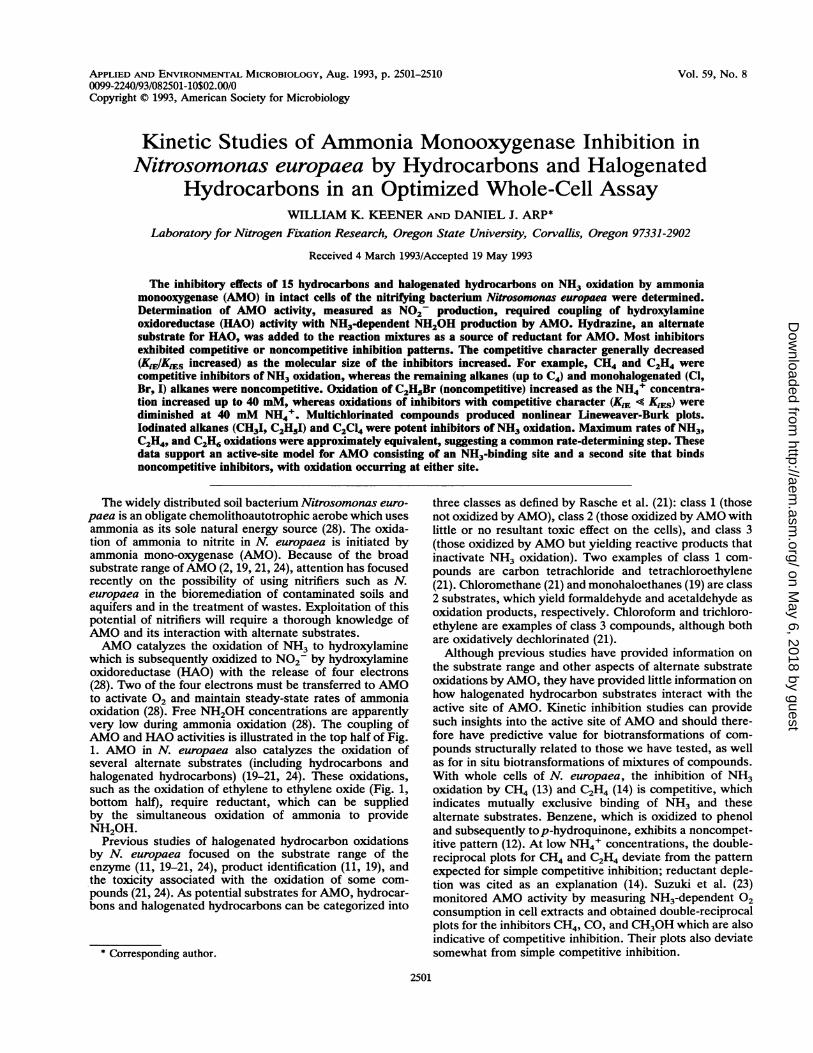
trations of substrates, inhibitors, and products during thetime course of the reaction (10 min) did not affect theobserved rates of N02 production. To test this assumption,we determined time courses of N02 production with theinhibitor C2H4 under the conditions used for Fig. 2. Thereaction rates were constant up to 16 min. In subsequentexperiments, the rates were determined from the first 10 minof the reaction. Similar tests of rate constancy were con-ducted for all 15 compounds examined; rates of N02-production were constant over the time course of the exper-iments, with only C2H5Br and C2H5I causing slight ratedecreases at the highest inhibitor concentrations.The third assumption was that any inhibition of NH3
2503VOL. 59, 1993
on May 6, 2018 by guest
http://aem.asm
.org/D
ownloaded from
2504 KEENER AND ARP
0Ej.
0.0
0 4 8 12 16Time (min)
FIG. 2. Time courses of N02- production by N. europaea. Foreach line, reactions in quintuplicate vials were initiated by additionof cells and individually stopped at 4-min intervals by addition ofC2H2. For vials containing C2H4, N2H4 concentrations providingmaximum N02- production were determined (see Materials andMethods) and included in quintuplicate vials. Symbols: *, 0.5 mMNH4+; *, 1 mM NH4+; A, 5 mM NH4; El, 0.5 mM NH4' + 690,uM C2H4 + 0.7 mM N2H4; 0, 1 mM NH4+ + 690 ,uM C2H4 + 0.7mM N2H4; A, 5 mM NH4' + 690 puM C2H4 + 0.3 mM N2H4.
oxidation observed was specific for AMO and was not due toinhibition of HAO or other enzymes involved in the coupledreaction. To test this assumption, we investigated whetherthe oxidation of NH2OH to N02 by HAO was influencedby any of the 15 inhibitors tested. AMO was inactivated withC2H2, a mechanism-based inactivator of AMO (15). Reac-tions were stopped after 8 min by addition of an aliquot ofthe reaction mixture to the acidic reagent for the N02assay. Even at the highest concentrations of the inhibitorsused to obtain the kinetic data, the oxidation ofNH2OH (200p,M) was not inhibited by 14 of the compounds. OnlyCCl3CH2Cl (1.2 mM) inhibited the oxidation of NH2OH (by18%). This indicates that HAO and other enzymes andproteins required in the oxidation of NH2OH to N02 inintact cells were not influenced by the inhibitors.Because the reactions were carried out with intact cells, a
fourth assumption was that NH4' diffusion gradients be-tween the medium and the cell periplasm were not influencedby changes in AMO activity. To determine whether NH4'concentration gradients exist, we partially and specificallyinactivated AMO in whole cells with light (10) and thenadjusted the concentration of the cells to give the samemaximum velocity of N02 production as in untreatedcontrol cells (at 20 mM NH4+). Rates of NO2- production asa function of NH4' concentration (0.33 to 20 mM) weredetermined. AMO inactivation should allow any NH4' dif-fusion gradient to approach equilibrium, resulting in a de-crease in the apparentKm for NH4' (17). With 0, 52, 82, and92% inactivation, the apparent Kms were 1.21, 1.17, 1.11,and 1.02 mM, respectively. These results suggest that anNH4+ diffusion gradient, if it existed, was small. Therefore,any changes in the gradient as a result of addition ofinhibitors would not be expected to have a significant impacton the kinetics of N02 production. In summary, theseresults confirm the validity of determining rates of N02production from intact cells as a measure of AMO activity.
Addition of hydrazine to circumvent reductant limitation.In previous studies, it was shown that the effects of alternatesubstrates on the rates ofAMO activity cannot be accountedfor solely by direct effects occurring at the active site of
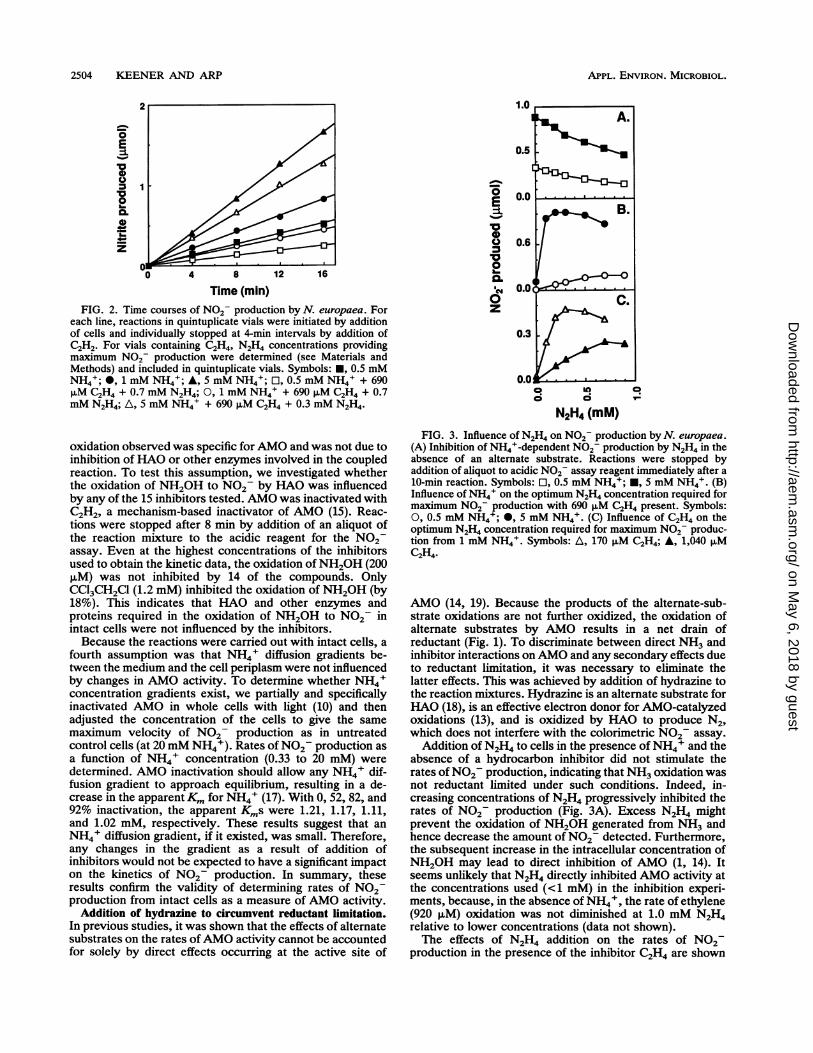
FIG. 3. Influence of N2H4 on N02- production by N. europaea.(A) Inhibition of NH4+-dependent N02- production by N2H4 in theabsence of an alternate substrate. Reactions were stopped byaddition of aliquot to acidic N02 assay reagent immediately after a10-min reaction. Symbols: El, 0.5 mM NH4+; *, 5 mM NH4+. (B)Influence of NH4' on the optimum N2H4 concentration required formaximum N02 production with 690 F.M C2H4 present. Symbols:0, 0.5 mM NH4+; *, 5 mM NH4+. (C) Influence of C2H4 on theoptimum N2H4 concentration required for maximum N02 produc-tion from 1 mM NH4.( Symbols: A, 170 ,uM C2H4; A, 1,040 pMC2H4.
AMO (14, 19). Because the products of the alternate-sub-strate oxidations are not further oxidized, the oxidation ofalternate substrates by AMO results in a net drain ofreductant (Fig. 1). To discriminate between direct NH3 andinhibitor interactions onAMO and any secondary effects dueto reductant limitation, it was necessary to eliminate thelatter effects. This was achieved by addition of hydrazine tothe reaction mixtures. Hydrazine is an alternate substrate forHAO (18), is an effective electron donor for AMO-catalyzedoxidations (13), and is oxidized by HAO to produce N2,which does not interfere with the colorimetric N02 assay.
Addition of N2H4 to cells in the presence of NH4' and theabsence of a hydrocarbon inhibitor did not stimulate therates ofN02 production, indicating that NH3 oxidation wasnot reductant limited under such conditions. Indeed, in-creasing concentrations of N2H4 progressively inhibited therates of N02 production (Fig. 3A). Excess N2H4 mightprevent the oxidation of NH2OH generated from NH3 andhence decrease the amount of N02 detected. Furthermore,the subsequent increase in the intracellular concentration ofNH20H may lead to direct inhibition of AMO (1, 14). Itseems unlikely that N2H4 directly inhibited AMO activity atthe concentrations used (<1 mM) in the inhibition experi-ments, because, in the absence of NH4', the rate of ethylene(920 ,uM) oxidation was not diminished at 1.0 mM N2H4relative to lower concentrations (data not shown).The effects of N2H4 addition on the rates of N02
production in the presence of the inhibitor C2H4 are shown
1.0
0E
0
000
0.
z
InCo
N2H4 (mM)
a
APPL. ENvIRON. MICROBIOL.
on May 6, 2018 by guest
http://aem.asm
.org/D
ownloaded from

AMMONIA MONOOXYGENASE INHIBITION IN NITROSOMONAS SPP. 2505
C)0
0 c
*L E [
[NH4+J (mM)
FIG. 4. Effect of N2H4 on NH4+-dependent N02- productionrates by N. europaea in the presence of 345 ,uM C2H4 (and control).Symbols: [1, NH4+ only; 0, C2H4 without N2H4; A, C2H4 +0.1mMN2H4; 0, N2H4 concentrations selected (for each NH4+ concentra-tion) which yielded maximum N02- production.
in Fig. 3B and C. In contrast to the situation in the absenceof C2H4, low concentrations of N2H4 stimulated the rate ofN07- production in the presence of C2H4. This stimulationwas attributed to circumvention of the reductant limitationimposed by the oxidation of C2H4. As in the absence of analternate substrate, higher concentrations of N2H4 resultedin a decreased rate of N02- production, presumably for thereasons stated above. These results demonstrate that differ-ent concentrations of N2H4 are required to achieve optimalrates of N02- formation under different conditions. Sinceincreasing concentrations of the same compound will causegreater depletion of the reductant supply (Fig. 3C), it isobvious that each set of experimental conditions is associ-ated with a unique optimal N2H4 concentration. Therefore,in all subsequent experiments, the concentration of N2H4supporting the maximum rate of N02- production wasdetermined for each unique set of conditions. Throughoutthis text, "optimal N2H4 concentration" refers to the con-centration of N2H4 required to maximize the rate of N02-production under the stated conditions.Maximum N02- production rates with optimal N2H4
concentrations were constant for 16 min (Fig. 2). Also,NH3-dependent N02- production equaled NH3 consump-tion over 1 h when 0.7 mM N2H4 was present (Table 1).These results show that the assumptions of the previoussection were still valid when N2H4 was included in the assay.We also assumed that optimal N2H4 concentrations replen-ished the reductant to a constant level and that only theinitial inhibitor and NH3 concentrations varied significantlyamong reaction vials.
Saturation kinetics are observed in the coupled assay. Thecoupled assay (NH3 to NO2-), with addition of optimizedconcentrations of N2H4, was used to determine the velocityof NH3 oxidation as a function of NH3 concentration. Asshown in Fig. 4, saturation kinetics were observed for NH3alone. When C2H4 was included in the reaction mixture, therates of N02- production decreased and the pattern was nolonger typical of saturation kinetics. Addition of a singleconcentration of N2H4 (0.1 mM) increased the rates, but thecurve was not hyperbolic. However, when optimized con-centrations of N2H4 were added to the reaction mixturealong with C2H4, the plot once again was typical of satura-
0.
0. 0
I 0 22
1 0 1 2
1/[NHe] (mM-1)FIG. 5. Lineweaver-Burk plot for C2H4 as an inhibitor of NH44-
dependent N02 production in N. europaea. Symbols: 0, 0 ,MC2H4; 0, 345 pM C2H4; A, 520 ,uM C2H4; *, 690 ,uM C2H4; *, 860pLM C2H4; A, 1,040 p.M C2H4. (Inset) Slope replot. Slopes of curveswere plotted against inhibitor concentration to obtain KiE, theabsolute value of the x intercept.
tion kinetics, albeit with an apparently higher Km. Thus,including optimal N2H4 concentrations was necessary toobtain saturation kinetics.
Kinetic inhibition patterns and constants. By using theassay described above, we investigated the inhibition ofNH3oxidation to N02- by the 15 hydrocarbons and halogenatedhydrocarbons listed above. Except for CH3I, all of theseinhibitors have been reported to be either substrates forAMO or class 1 nonsubstrates (C2C14 and CC14) (11, 20, 21).For each inhibitor, a series of v-1-versus-S-1 curves wereobtained, with each curve representing a fixed concentrationof inhibitor. Because each experiment included a controlsaturation curve with no inhibitor added, this provided ameans of determining the day-to-day variability of the ki-netic data. In 15 experiments, an average Km for NH4' of1.34 ± 0.22 mM and an average Vma, of 1.59 + 0.17,umol min-' mg of protein-' were determined. This con-sistency facilitated comparison of results obtained on differ-ent days.As an example of this approach, the results of the inhibi-
tion of NH3 oxidation by C2H4 are shown in Fig. 5. Thedouble-reciprocal plot reveals a pattern typical of a compet-itive inhibitor. The replot of slopes versus inhibitor concen-trations (slope replot) is linear and yields a KiE of 660 puM(Fig. 5 inset). We also determined the inhibition pattern withNH3 as the inhibitor and C2H4 as the variable substrate. Therate of ethylene oxide formation was determined. Again, thepattern was typical of a competitive inhibitor, although theslope replot was not linear (Fig. 6). For a competitiveinhibitor which also acts as a substrate, the Ki for thecompound as inhibitor should equal its Km as substrate (4).The Ki for C2H4 of 660 ,uM compares favorably with the Kmfor C2H4 of 658 + 154 ,uM (see Table 3). Methane was alsoa competitive inhibitor of NH3 oxidation (see Table 2). TheK1 for CH4 (3,240 ,uM) was about fivefold higher than the K1for C2H4. The high Ki for CH4 is consistent with theobservation that CH4 is a relatively poor substrate for AMO(13).Most of the compounds we examined did not give inhibi-
tion patterns typical of competitive inhibitors. Indeed, non-
VOL. 59, 1993
I -5
on May 6, 2018 by guest
http://aem.asm
.org/D
ownloaded from
2506 KEENER AND ARP
6
a [,0ric- 6
0*
x 2L
0 0 -2 04
1/[C2Hm (mM-')
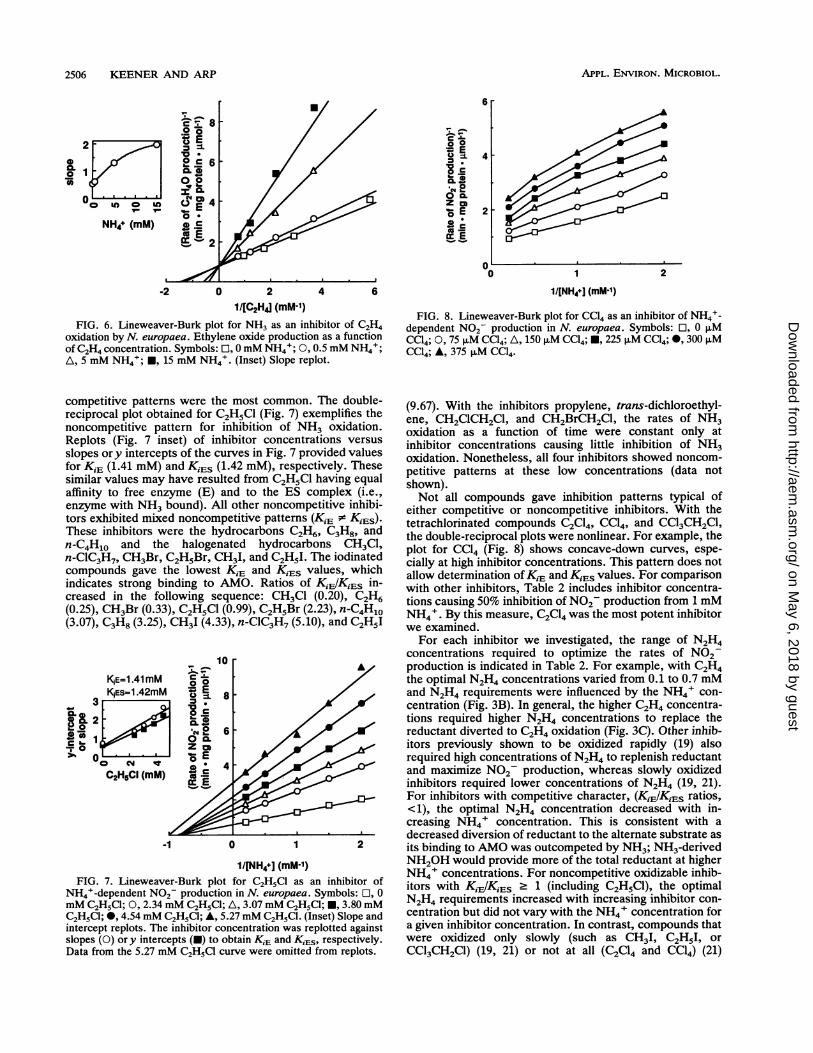
FIG. 6. Lineweaver-Burk plot for NH3 as an inhibitor of C2H4oxidation by N. europaea. Ethylene oxide production as a functionof C2H4 concentration. Symbols: El, 0mM NH4I; 0, 0.5 mM NH4+;A, 5 mM NH4+; U, 15 mM NH4+. (Inset) Slope replot.
competitive patterns were the most common. The double-reciprocal plot obtained for C2H5Cl (Fig. 7) exemplifies thenoncompetitive pattern for inhibition of NH3 oxidation.Replots (Fig. 7 inset) of inhibitor concentrations versusslopes ory intercepts of the curves in Fig. 7 provided valuesfor KiE (1.41 mM) and KiES (1.42 mM), respectively. Thesesimilar values may have resulted from C2H5Cl having equalaffinity to free enzyme (E) and to the ES complex (i.e.,enzyme with NH3 bound). All other noncompetitive inhibi-tors exhibited mixed noncompetitive patterns (KiE . KiES).These inhibitors were the hydrocarbons C2H6, C3H8, andn-C4H1o and the halogenated hydrocarbons CH3C1,n-ClC3H7, CH3Br, C2H5Br, CH3I, and C2H51. The iodinatedcompounds gave the lowest K,E and K,Es values, whichindicates strong binding to AMO. Ratios of Ki,IKiS in-creased in the following sequence: CH3Cl (0.20), C2H6(0.25), CH3Br (0.33), C2H5Cl (0.99), C2H5Br (2.23), n-C4H10(3.07), C3H8 (3.25), CH3I (4.33), n-ClC3H7 (5.10), and C2H5I
1NE=1.41mM 0KSEs=1.42mM *, E
0.~~~~~~~~~~~~~~~.
0~~~~~
I, 0 ? Z E00 N
E
C2H5CI (mM) cc E
-1 0 1
1/[NH4tJ (mM-1)FIG. 7. Lineweaver-Burk plot for C2H5Cl as an inhibitor of
NH44-dependent N02- production in N. europaea. Symbols: ], 0mM C2H15C; 0, 2.34 mM C2H5Cl; A, 3.07 mM C2H5Cl; *, 3.80 mMC2H5C1; *, 4.54mM C2H5C1; A, 5.27mM C2H5C1. (Inset) Slope andintercept replots. The inhibitor concentration was replotted againstslopes (0) or y intercepts (U) to obtain KiE and KiES, respectively.Data from the 5.27 mM C2H5CI curve were omitted from replots.
CT -I-. _
I IO.0*t; E
.-0*0 Q
a E
a:_ E
4
2
u0 1 2
1/[NH4'] (mM-1)
FIG. 8. Lineweaver-Burk plot for CC14 as an inhibitor of NH4+-dependent N02- production in N. europaea. Symbols: El, 0 ,uMCC14; 0, 75 p.M CC14; A, 150 ,uM CC14; M, 225 puM CC14; 0, 300 ,MCC14; *, 375 ,uM CC14.
(9.67). With the inhibitors propylene, trans-dichloroethyl-ene, CH2C1CH2C1, and CH2BrCH2Cl, the rates of NH3oxidation as a function of time were constant only atinhibitor concentrations causing little inhibition of NH3oxidation. Nonetheless, all four inhibitors showed noncom-petitive patterns at these low concentrations (data notshown).Not all compounds gave inhibition patterns typical of
either competitive or noncompetitive inhibitors. With thetetrachlorinated compounds C2C14, CC14, and CCl3CH2Cl,the double-reciprocal plots were nonlinear. For example, theplot for CC14 (Fig. 8) shows concave-down curves, espe-cially at high inhibitor concentrations. This pattern does notallow determnination of KiE and K,Es values. For comparisonwith other inhibitors, Table 2 includes inhibitor concentra-tions causing 50% inhibition of N02 production from 1 mMNH4+. By this measure, C2C14 was the most potent inhibitorwe examined.
For each inhibitor we investigated, the range of N2H4concentrations required to optimize the rates of N02production is indicated in Table 2. For example, with C2H4the optimal N2H4 concentrations varied from 0.1 to 0.7 mMand N2H4 requirements were influenced by the NH4+ con-centration (Fig. 3B). In general, the higher C2H4 concentra-tions required higher N2H4 concentrations to replace thereductant diverted to C2H4 oxidation (Fig. 3C). Other inhib-itors previously shown to be oxidized rapidly (19) alsorequired high concentrations of N2H4 to replenish reductantand maximize N02 production, whereas slowly oxidizedinhibitors required lower concentrations of N2H4 (19, 21).For inhibitors with competitive character, (KiE/KiEs ratios,<1), the optimal N2H4 concentration decreased with in-creasing NH4+ concentration. This is consistent with adecreased diversion of reductant to the alternate substrate asits binding to AMO was outcompeted by NH3; NH3-derivedNH20H would provide more of the total reductant at higherNH4+ concentrations. For noncompetitive oxidizable inhib-itors with KiIK1ES 2 1 (including C2H5Cl), the optimalN2H4 requirements increased with increasing inhibitor con-centration but did not vary with the NH4+ concentration fora given inhibitor concentration. In contrast, compounds thatwere oxidized only slowly (such as CH3I, C2H51, orCCl3CH2Cl) (19, 21) or not at all (C2C14 and CC14) (21)
APPL. ENvIRON. MICROBIOL.
on May 6, 2018 by guest
http://aem.asm
.org/D
ownloaded from
AMMONIA MONOOXYGENASE INHIBITION IN NITROSOMONAS SPP. 2507
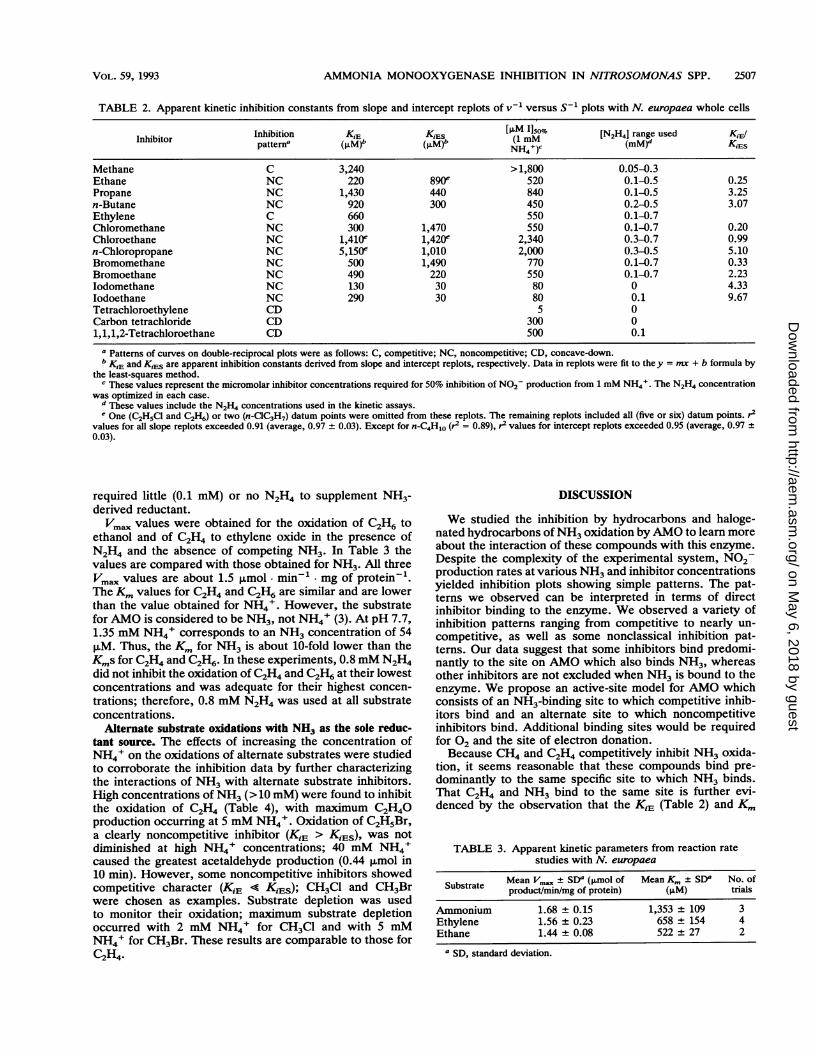
TABLE 2. Apparent kinetic inhibition constants from slope and intercept replots of v-' versus S` plots with N. europaea whole cells
InhibitorInhibition K,E K~~~~~~!~s [PLM 1150%Inhibitor Inhibipattern KiE (KM (1 mm [N2H4J range used KiElpattern'(ILM), (M), 1NH)c (MM)' KLES
Methane C 3,240 > 1,800 0.05-0.3Ethane NC 220 890e 520 0.1-0.5 0.25Propane NC 1,430 440 840 0.1-0.5 3.25n-Butane NC 920 300 450 0.2-0.5 3.07Ethylene C 660 550 0.1-0.7Chloromethane NC 300 1,470 550 0.1-0.7 0.20Chloroethane NC 1,410e 1,420e 2,340 0.3-0.7 0.99n-Chloropropane NC 5,150" 1,010 2,000 0.3-0.5 5.10Bromomethane NC 500 1,490 770 0.1-0.7 0.33Bromoethane NC 490 220 550 0.1-0.7 2.23Iodomethane NC 130 30 80 0 4.33Iodoethane NC 290 30 80 0.1 9.67Tetrachloroethylene CD 5 0Carbon tetrachloride CD 300 01,1,1,2-Tetrachloroethane CD 500 0.1
I Patterns of curves on double-reciprocal plots were as follows: C, competitive; NC, noncompetitive; CD, concave-down.b K'E and KEs are apparent inhibition constants derived from slope and intercept replots, respectively. Data in replots were fit to they = mx + b formula by
the least-squares method.c These values represent the micromolar inhibitor concentrations required for 50% inhibition of NO2- production from 1 mM NH4'. The N2H4 concentration
was optimized in each case.d These values include the N2H4 concentrations used in the kinetic assays.e One (C2H5Cl and C2H6) or two (n-ClC3H7) datum points were omitted from these replots. The remaining replots included all (five or six) datum points. r2
values for all slope replots exceeded 0.91 (average, 0.97 + 0.03). Except for n-C4H10 (r2 = 0.89), r2 values for intercept replots exceeded 0.95 (average, 0.97 ±0.03).
required little (0.1 mM) or no N2H4 to supplement NH3-derived reductant.Vm. values were obtained for the oxidation of C2H6 to
ethanol and of C2H4 to ethylene oxide in the presence ofN2H4 and the absence of competing NH3. In Table 3 thevalues are compared with those obtained for NH3. All threeVm. values are about 1.5 ,umol. min-' mg of protein-'.The Km values for C2H4 and C2H6 are similar and are lowerthan the value obtained for NH4'. However, the substratefor AMO is considered to be NH3, not NH4+ (3). At pH 7.7,1.35 mM NH4' corresponds to an NH3 concentration of 54p,M. Thus, the Km for NH3 is about 10-fold lower than theK5s for C2H4 and C2H6. In these experiments, 0.8 mM N2H4did not inhibit the oxidation of C2H4 and C2H6 at their lowestconcentrations and was adequate for their highest concen-
trations; therefore, 0.8 mM N2H4 was used at all substrateconcentrations.
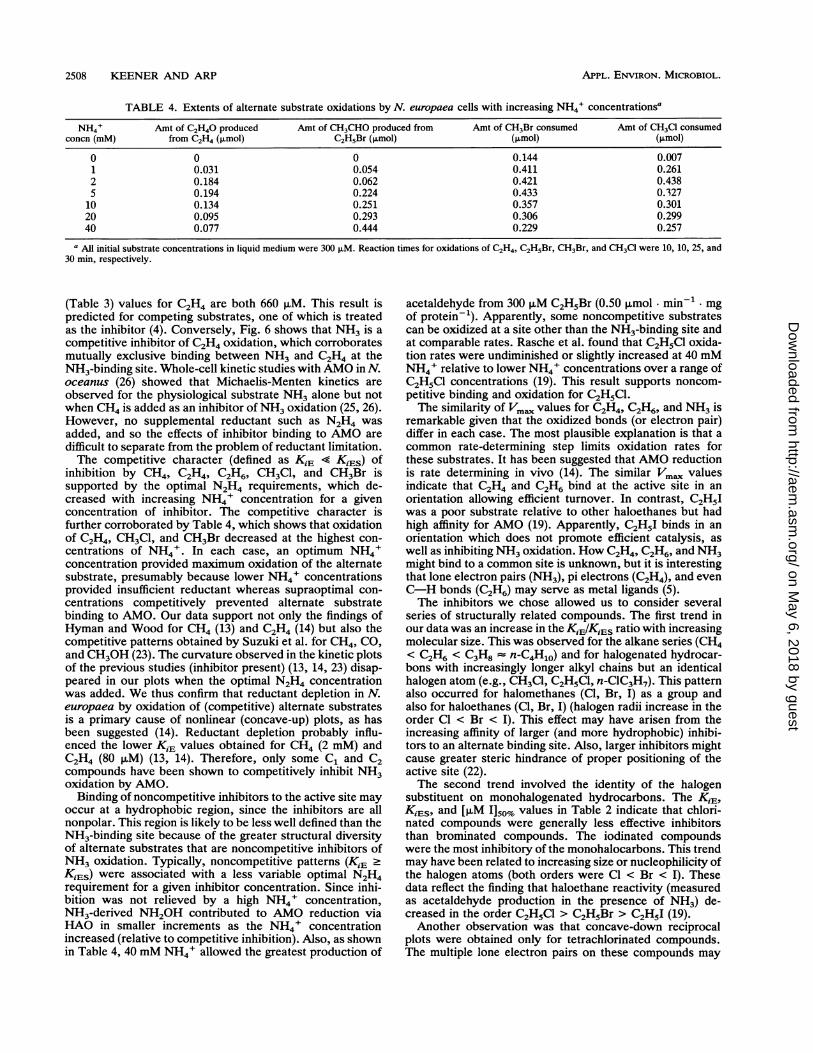
Alternate substrate oxidations with NH3 as the sole reduc-tant source. The effects of increasing the concentration ofNH4' on the oxidations of alternate substrates were studiedto corroborate the inhibition data by further characterizingthe interactions of NH3 with alternate substrate inhibitors.High concentrations of NH3 (> 10 mM) were found to inhibitthe oxidation of C2H4 (Table 4), with maximum C2H40production occurring at 5 mM NH4'. Oxidation of C2H5Br,a clearly noncompetitive inhibitor (KiE > IEs), was notdiminished at high NH4' concentrations; 40 mM NH4'caused the greatest acetaldehyde production (0.44 p,mol in10 min). However, some noncompetitive inhibitors showedcompetitive character (K1E << K1E); CH3C1 and CH3Br
were chosen as examples. Substrate depletion was usedto monitor their oxidation; maximum substrate depletionoccurred with 2 mM NH4' for CH3C1 and with 5 mMNH4' for CH3Br. These results are comparable to those forC2H4.
DISCUSSION
We studied the inhibition by hydrocarbons and haloge-nated hydrocarbons ofNH3 oxidation byAMO to learn moreabout the interaction of these compounds with this enzyme.Despite the complexity of the experimental system, NO2production rates at various NH3 and inhibitor concentrationsyielded inhibition plots showing simple patterns. The pat-terns we observed can be interpreted in terms of directinhibitor binding to the enzyme. We observed a variety ofinhibition patterns ranging from competitive to nearly un-competitive, as well as some nonclassical inhibition pat-terns. Our data suggest that some inhibitors bind predomi-nantly to the site on AMO which also binds NH3, whereasother inhibitors are not excluded when NH3 is bound to theenzyme. We propose an active-site model for AMO whichconsists of an NH3-binding site to which competitive inhib-itors bind and an alternate site to which noncompetitiveinhibitors bind. Additional binding sites would be requiredfor 02 and the site of electron donation.Because CH4 and C2H4 competitively inhibit NH3 oxida-
tion, it seems reasonable that these compounds bind pre-dominantly to the same specific site to which NH3 binds.That C2H4 and NH3 bind to the same site is further evi-denced by the observation that the KiE (Table 2) and Km
TABLE 3. Apparent kinetic parameters from reaction ratestudies with N. europaea
Substrate Mean Vma,, + SD' (I.mol of Mean K__- SD' No. ofproduct/min/mg of protein) (PM) trials
Ammonium 1.68 ± 0.15 1,353 + 109 3Ethylene 1.56 ± 0.23 658 ± 154 4Ethane 1.44 ± 0.08 522 ± 27 2
I SD, standard deviation.
VOL. 59, 1993
on May 6, 2018 by guest
http://aem.asm
.org/D
ownloaded from
2508 KEENER AND ARP
TABLE 4. Extents of alternate substrate oxidations by N. europaea cells with increasing NH4' concentrationsa
NH4+ Amt of C2H40 produced Amt of CH3CHO produced from Amt of CH3Br consumed Amt of CH3Cl consumedconcn (mM) from C2H4 (,umol) C2H5Br (,umol) (Lmol) (Amol)
0 0 0 0.144 0.0071 0.031 0.054 0.411 0.2612 0.184 0.062 0.421 0.4385 0.194 0.224 0.433 0.32710 0.134 0.251 0.357 0.30120 0.095 0.293 0.306 0.29940 0.077 0.444 0.229 0.257
a All initial substrate concentrations in liquid medium were 300 ±tM. Reaction times for oxidations of C2H4, C2H5Br, CH3Br, and CH3Cl were 10, 10, 25, and30 min, respectively.
(Table 3) values for C2H4 are both 660 p,M. This result ispredicted for competing substrates, one of which is treatedas the inhibitor (4). Conversely, Fig. 6 shows that NH3 is acompetitive inhibitor of C2H4 oxidation, which corroboratesmutually exclusive binding between NH3 and C2H4 at theNH3-binding site. Whole-cell kinetic studies with AMO in N.oceanus (26) showed that Michaelis-Menten kinetics areobserved for the physiological substrate NH3 alone but notwhen CH4 is added as an inhibitor of NH3 oxidation (25, 26).However, no supplemental reductant such as N2H4 was
added, and so the effects of inhibitor binding to AMO aredifficult to separate from the problem of reductant limitation.The competitive character (defined as K1E < KIES) of
inhibition by CH4, C2H4, C2H6, CH3C1, and CH3Br issupported by the optimal N2H4 requirements, which de-creased with increasing NH4' concentration for a givenconcentration of inhibitor. The competitive character isfurther corroborated by Table 4, which shows that oxidationof C2H4, CH3Cl, and CH3Br decreased at the highest con-centrations of NH4+. In each case, an optimum NH4'concentration provided maximum oxidation of the alternatesubstrate, presumably because lower NH4+ concentrationsprovided insufficient reductant whereas supraoptimal con-centrations competitively prevented alternate substratebinding to AMO. Our data support not only the findings ofHyman and Wood for CH4 (13) and C2H4 (14) but also thecompetitive patterns obtained by Suzuki et al. for CH4, CO,and CH30H (23). The curvature observed in the kinetic plotsof the previous studies (inhibitor present) (13, 14, 23) disap-peared in our plots when the optimal N2H4 concentrationwas added. We thus confirm that reductant depletion in N.europaea by oxidation of (competitive) alternate substratesis a primary cause of nonlinear (concave-up) plots, as hasbeen suggested (14). Reductant depletion probably influ-enced the lower KiE values obtained for CH4 (2 mM) andC2H4 (80 p,M) (13, 14). Therefore, only some C1 and C2compounds have been shown to competitively inhibit NH3oxidation by AMO.
Binding of noncompetitive inhibitors to the active site mayoccur at a hydrophobic region, since the inhibitors are allnonpolar. This region is likely to be less well defined than theNH3-binding site because of the greater structural diversityof alternate substrates that are noncompetitive inhibitors ofNH3 oxidation. Typically, noncompetitive patterns (KiE >
KiES) were associated with a less variable optimal N2H4requirement for a given inhibitor concentration. Since inhi-bition was not relieved by a high NH4' concentration,NH3-derived NH20H contributed to AMO reduction viaHAO in smaller increments as the NH4+ concentrationincreased (relative to competitive inhibition). Also, as shownin Table 4, 40 mM NH4' allowed the greatest production of
acetaldehyde from 300 ,uM C2H5Br (0.50 ,umol min-' mgof protein-1). Apparently, some noncompetitive substratescan be oxidized at a site other than the NH3-binding site andat comparable rates. Rasche et al. found that C2H5Cl oxida-tion rates were undiminished or slightly increased at 40 mMNH4' relative to lower NH4' concentrations over a range ofC2H5Cl concentrations (19). This result supports noncom-petitive binding and oxidation for C2H5Cl.The similarity of Vm. values for C2H4, C2H6, and NH3 is
remarkable given that the oxidized bonds (or electron pair)differ in each case. The most plausible explanation is that acommon rate-determining step limits oxidation rates forthese substrates. It has been suggested that AMO reductionis rate determining in vivo (14). The similar Vm. valuesindicate that C2H4 and C2H6 bind at the active site in anorientation allowing efficient turnover. In contrast, C2HAIwas a poor substrate relative to other haloethanes but hadhigh affinity for AMO (19). Apparently, C2H51 binds in anorientation which does not promote efficient catalysis, aswell as inhibiting NH3 oxidation. How C2H4, C2H6, and NH3might bind to a common site is unknown, but it is interestingthat lone electron pairs (NH3), pi electrons (C2H4), and evenC-H bonds (C2H6) may serve as metal ligands (5).The inhibitors we chose allowed us to consider several
series of structurally related compounds. The first trend inour data was an increase in the KiE/KiEs ratio with increasingmolecular size. This was observed for the alkane series (CH4< C2H6 < C3H8 = n-C4H1O) and for halogenated hydrocar-bons with increasingly longer alkyl chains but an identicalhalogen atom (e.g., CH3C1, C2H5Cl, n-ClC3H7). This patternalso occurred for halomethanes (Cl, Br, I) as a group andalso for haloethanes (Cl, Br, I) (halogen radii increase in theorder Cl < Br < I). This effect may have arisen from theincreasing affinity of larger (and more hydrophobic) inhibi-tors to an alternate binding site. Also, larger inhibitors mightcause greater steric hindrance of proper positioning of theactive site (22).The second trend involved the identity of the halogen
substituent on monohalogenated hydrocarbons. The KiE,KiES, and [,uM 1150% values in Table 2 indicate that chlori-nated compounds were generally less effective inhibitorsthan brominated compounds. The iodinated compoundswere the most inhibitory of the monohalocarbons. This trendmay have been related to increasing size or nucleophilicity ofthe halogen atoms (both orders were Cl < Br < I). Thesedata reflect the finding that haloethane reactivity (measuredas acetaldehyde production in the presence of NH3) de-creased in the order C2H5Cl > C2H5Br > C2H5I (19).Another observation was that concave-down reciprocal
plots were obtained only for tetrachlorinated compounds.The multiple lone electron pairs on these compounds may
APPL. ENVIRON. MICROBIOL.
on May 6, 2018 by guest
http://aem.asm
.org/D
ownloaded from

AMMONIA MONOOXYGENASE INHIBITION IN NITROSOMONAS SPP. 2509
constitute potential ligands that could allow some competi-tion with NH3 binding to the active site, whereas themolecular size of the compounds would predict a highKiE/KiES ratio. This would explain the concave-down curva-ture: a disproportionate increase in N02 production rateswith increasing NH4' concentration.Our data support a model in which (i) the NH3-binding site
can be occupied significantly only by C1 compounds and C2hydrocarbons (including C2H2 [15]); (ii) iodinated com-pounds, C2 (and larger) halogenated compounds, and mosthydrocarbons (>C2) would bind predominantly at a morehydrophobic site, to which NH3 would not bind; and (iii)oxidation of an organic substrate at the alternate site couldoccur at a rate comparable to oxidation at the NH3-bindingsite. Binding at the alternate site could interfere with oxida-tion at the NH3-binding site by competing for activated 02(i.e., alternate substrate oxidation) or by interfering withturnover (e.g., by drawing the enzyme into a dead-endcomplex).
Vannelli et al. (24) proposed a model in which an alternatesubstrate such as trans-2-butene was bound to AMO throughinteractions at two sites. This model, which proposes asingle oxidation site, was presented to explain the productratios (alcohol/epoxide) for the substrates cis- and trans-2-butene (11) and the relative reactivities of cis- and trans-dibromoethylene (24). It should be noted that differing bonddissociation energies and the intrinsic steric inaccessibilityof the pi bonds may have accounted for the product ratios(11, 24). Our model and the model of Vannelli et al. are notnecessarily mutually exclusive; substrate binding orienta-tions are not excluded by our model as a factor influencingbond reactivities, product ratios, or inhibition patterns.Our model describes the experimental results in terms of
the direct interactions of the inhibitors with AMO. However,given that the experiments were carried out with intact cells,other factors may have influenced the results. For example,the inhibitors could have altered the activities of enzymesother than AMO that are required for the coupled assay.This appeared not to be the case, given that the oxidation ofNH20H was not substantially altered by the inhibitors. If anNH4+/NH3 diffusion gradient existed across the periplasmicmembrane, addition of inhibitors could alter this gradient.Decreasing the activity of AMO would be expected to causea shallowing of any diffusion gradient and a decrease in theapparent Km for NH4' (17). However, specific inactivationof AMO by light resulted in only small changes in theapparent Km for NH4', which suggests that the diffusiongradient, if it existed, was small. Therefore, if the AMOinhibitors we used also diminished the apparently smallgradient, only small decreases in curve slopes on the double-reciprocal plots would have resulted. It is also possible thatAMO is part of a multienzyme complex in intact cells andthat the kinetics we have measured are a reflection of thecomplex rather than the active site of AMO. Because ofthese and additional factors that could influence the values ofmeasured kinetic constants, the values are referred to asapparent kinetic constants to distinguish them from theconstants that would be determined if active, purified en-zyme preparations were available.
In our experiments, N2H4 was added as a source ofreductant, so that reductant limitation was not a factorinfluencing the observed kinetics. The results provide a basisfor predicting the outcome when N2H4 is not included andNH4' is the only source of reductant. For noncompetitiveinhibitors (KiE > K1Es) which are also substrates, the rate ofoxidation of the alternate substrate should not decrease
substantially at high NH4' concentrations (>20 mM). Incontrast, for the alternate substrates that are competitiveinhibitors of NH3 oxidation or display competitive character(KiE < K,Es), their rate of oxidation should decrease sub-stantially at high NH4' concentrations. In both cases, lowconcentrations of alternate substrates will inhibit AMOactivity by depleting the NH3-derived reductant supply. Thepredicted results were observed for a competitive inhibitor(C2H4), a distinctly noncompetitive inhibitor (C2H5Br), andtwo noncompetitive inhibitors with competitive character(CH3CI and CH3Br) (Table 4).
In summary, we have observed trends regarding hydro-carbon and halogenated hydrocarbon inhibition of NO2-production by whole cells ofN. europaea. The trends reflectstructural relationships of the inhibitors: increasing molecu-lar size produced increasing KiEIKiES ratios, and increasinghalogen size was correlated with greater inhibitor effective-ness. Corroborating studies indicated that high NH3 concen-trations decreased oxidation rates for alternate substrateswith competitive character (KiE < KiES) as inhibitors ofNO2- production but not for substrates with predominantlynoncompetitive character (K1E > K1Es). These results sup-port an active-site model for AMO consisting of (at least)two substrate-binding sites in addition to the O2-binding siteand the site of electron donation to AMO; oxidation mayoccur at either site. The correlation of structural relation-ships with the observed trends indicates that our data shouldallow predictions for structurally related compounds regard-ing their interactions with NH3 at the active site of AMO.
ACKNOWLEDGMENTS
This research was supported by U.S. Environmental ProtectionAgency grant R816531 and the Oregon Agricultural ExperimentStation.We gratefully acknowledge Michael Hyman, Scott Ensign, and
Luis Sayavedra-Soto for providing helpful comments and sugges-tions.
REFERENCES
1. Anderson, J. H. 1965. Studies on the oxidation of ammonia byNitrosomonas. Biochem. J. 95:688-698.
2. Arciero, D. M., T. Vannelli, M. Logan, and A. B. Hooper. 1989.Degradation of trichloroethylene by the ammonia-oxidizing bac-terium Nitrosomonas europaea. Biochem. Biophys. Res. Com-mun. 159:640-643.
3. B6dard, C., and R Knowles. 1989. Physiology, biochemistry,and specific inhibitors of CH4, NH4', and CO oxidation bymethanotrophs and nitrifiers. Microbiol. Rev. 53:68-84.
4. Cornish-Bowden, A. 1979. Inhibitors and activators, p. 73-98. InFundamentals of enzyme kinetics. Butterworths, Boston, Mass.
5. Crabtree, R. H., and D. G. Hamilton. 1988. H-H, C-H, andrelated sigma-bonded groups as ligands, p. 299-338. In F. G.Stone, and R. West (ed.), Advances in organometallic chemis-try. Academic Press, Inc., San Diego, Calif.
6. Ensign, S. A., M. R. Hyman, and D. J. Arp. 1993. In vitroactivation of ammonia monooxygenase from Nitrosomonaseuropaea by copper. J. Bacteriol. 175:1971-1980.
7. Gornall, A. G., C. J. Bardawill, and M. M. David. 1949.Determination of serum proteins by means of the biuret reac-tion. J. Biol. Chem. 177:751-766.
8. Hageman, R. H., and D. P. Hucklesby. 1971. Nitrate reductasefrom higher plants. Methods Enzymol. 23:491-503.
9. Hyman, M. R. 1985. Ph.D. thesis. University of Bristol, Bristol,United Kingdom.
10. Hyman, M. R., and D. J. Arp. 1992. 14C2H2- and '4C02-labellingstudies of the de novo synthesis of polypeptides by Nitrosomo-nas europaea during recovery from acetylene and light inacti-
VOL. 59, 1993
on May 6, 2018 by guest
http://aem.asm
.org/D
ownloaded from
2510 KEENER AND ARP
vation of ammonia monooxygenase. J. Biol. Chem. 267:1534-1545.
11. Hyman, M. R., I. B. Murton, and D. J. Arp. 1988. Interaction ofammonia monooxygenase from Nitrosomonas europaea withalkanes, alkenes, and alkynes. Appl. Environ. Microbiol. 54:3187-3190.
12. Hyman, M. R., A. W. Sansome-Smith, J. H. Shears, and P. M.Wood. 1985. A kinetic study of benzene oxidation to phenol bywhole cells of Nitrosomonas europaea and evidence for thefurther oxidation of phenol to hydroquinone. Arch. Microbiol.143:302-306.
13. Hyman, M. R., and P. M. Wood. 1983. Methane oxidation byNitrosomonas europaea. Biochem. J. 212:31-37.
14. Hyman, M. R., and P. M. Wood. 1984. Ethylene oxidation byNitrosomonas europaea. Arch. Microbiol. 137:155-158.
15. Hyman, M. R., and P. M. Wood. 1985. Suicidal inactivation andlabelling of ammonia monooxygenase by acetylene. Biochem. J.227:719-725.
16. Lees, H. 1952. The biochemistry of the nitrifying organisms. 1.The ammonia-oxidizing systems of Nitrosomonas. Biochem. J.52:134-139.
17. Martinez, M. B., F. J. Schendel, M. C. Flickinger, and G. L.Nelsestuen. 1992. Kinetic properties of enzyme populations invivo: alkaline phosphatase of the Escherichia coli periplasm.Biochemistry 31:11500-11509.
18. Nicholas, D. J., and 0. T. G. Jones. 1960. Oxidation of hydrox-ylamine in cell-free extracts of Nitrosomonas europaea. Nature(London) 185:512-514.
19. Rasche, M. E., R. E. Hicks, M. R. Hyman, and D. J. Arp. 1990.Oxidation of monohalogenated ethanes and n-chlorinated al-kanes by whole cells of Nitrosomonas europaea. J. Bacteriol.
172:5368-5373.20. Rasche, M. E., M. R. Hyman, and D. J. Arp. 1990. Biodegra-
dation of halogenated hydrocarbon fumigants by nitrifying bac-teria. Appl. Environ. Microbiol. 56:2568-2571.
21. Rasche, M. E., M. R. Hyman, and D. J. Arp. 1991. Factorslimiting aliphatic chlorocarbon degradation by Nitrosomonaseuropaea: cometabolic inactivation of ammonia monooxygen-ase and substrate specificity. Appl. Environ. Microbiol. 57:2986-2994.
22. Segel, I. H. 1976. Enzymes, p. 208-323. In Biochemical calcu-lations. John Wiley & Sons, Inc., New York.
23. Suzuki, I., S.-C. Kwoks, and U. Dular. 1976. Competitiveinhibition of ammonia oxidation in Nitrosomonas europaea bymethane, carbon monoxide, or methanol. FEBS Lett. 72:117-120.
24. Vannelli, T., M. Logan, D. M. Arciero, and A. B. Hooper. 1990.Degradation of halogenated aliphatic compounds by the ammo-nia-oxidizing bacterium Nitrosomonas europaea. Appl. Envi-ron. Microbiol. 56:1169-1171.
25. Ward, B. B. 1987. Kinetic studies on ammonia and methaneoxidation by Nitrosococcus oceanus. Arch. Microbiol. 147:126-133.
26. Ward, B. B. 1990. Kinetics of ammonia oxidation by a marinenitrifying bacterium: methane as a substrate analogue. Microb.Ecol. 19:211-225.
27. Weatherburn, M. W. 1967. Phenol-hypochlorite reaction fordetermination of ammonia. Anal. Chem. 39:971-974.
28. Wood, P. M. 1986. Nitrification as a bacterial energy source, p.39-62. In J. I. Prosser (ed.), Nitrification. Society for GeneralMicrobiology (IRL Press), Washington, D.C.
APPL. ENvIRON. MICROBIOL.
on May 6, 2018 by guest
http://aem.asm
.org/D
ownloaded from