kinetics 0f the catalytic hydrogenation of n...
TRANSCRIPT

Kinetics of the catalytic hydrogenation of n-heptanal with copper-chromium oxide catalyst
Item Type text; Thesis-Reproduction (electronic)
Authors Flanagan, Joseph Edward, 1940-
Publisher The University of Arizona.
Rights Copyright © is held by the author. Digital access to this materialis made possible by the University Libraries, University of Arizona.Further transmission, reproduction or presentation (such aspublic display or performance) of protected items is prohibitedexcept with permission of the author.
Download date 19/05/2018 07:42:53
Link to Item http://hdl.handle.net/10150/319452

KINETICS 0F THE CATALYTIC HYDROGENATION OF N-HEPTANAL MTH COPRER-CHROMUM OXIDE CATALYST
byJoseph Edward Flanagan
A Thesis Submitted to the Faculty of theDEPARTMENT OF CHEMICAL ENGINEERING
In Partial Fulfillment of the Requirements ' For the Degree of
MASTER OF SCIENCEIn the Graduate CollegeTHE UNIVERSITY OF ARIZONA
1963

STATEMENT BY AUTHOR
This thesis has been submitted, in partial fulfillment of requirements for an advanced degree at The University of Arizona and is deposited in The University Library to be made available to borrowers under rules of the Library.
Brief quotations from this thesis are allowable without special permission, provided that accurate acknowledgment of source is made. Requests for permission for extended quotation from or reproduction of this manuscript in whole or in part may be granted by the head of the major department or the Bean of the Graduate College when in their judgement the proposed use of the material is in the interests of scholarship. In all other instances, however, permission must be obtained from the author.
APPROVAL BY THESIS DIRECTOR
This thesis has been approved on the date shown below:
R. A. DAMON f DateAssistant Professor of Chemical Engineering
TABLE OF C03MTMTSPage
ABSTRACT vI. Introduction 1II. Apparatus 7
A. High Pressure Reactor 7B. Flow System 8C. Sampling System 9D. Chromatograph 9E. Distillation Column 10Fo Ref ractomet er 11
III. Experimental 12A. Preparation of Reactants 12B. Laboratory Procedure 13C. Analysis 15
IV. Discussion of Results 19A. Thermodynamic Considerations 19B. Reaction Order 19C. Controlling Step .20D. The Catalyst 28E. Side Reactions 29
V. Summary 31VI. Acknowledgment s 35
ii

VII. Literature Cited APPENDIX
Figure1. Free Energies of Keptanal and
n-Heptanol2. Hydrogen Solubility in Alcohols3. Schematic Flow Diagram of Ex
perimental Process4. Sample Chromatogram of Reaction
Mixture5. Heptanal Concentration versus
Time at 1000 psi6. First Order Plot for 1000 psi
and 800 psi at 350°F7. Heptanal Concentration versus
Time at 800 psi and 1000 psi8. First Order Plot for 1000 psi at
300°F9. Arrhenius Plot for Zero Order
Reaction at 1000 psi10. Arrhenius Plot for First Order
Reaction at 1000 psi31. Reaction Rates for Crushed and
Pellet Size Catalyst12. First Order Plot for 1000 psi and
350°F (High Catalyst Ratio)13. Reaction Rates for High and Low
. Catalyst Ratios14. Generalized Adsorption Isotherm
Equilibrium Curve
36
4041
42
43
44
45
46
47
48
49
50
51
52
53

TableI. Reaction Variables and. Conversion
to HeptanolII. Reaction Variables and Conversion
to HeptanolIII. Reaction Variables and Conversion
to HeptanolIV. Reaction Variables and Conversion
to HeptanolV. Reaction Variables and Conversion
to HeptanolVI. Reaction Variables and Conversion
to HeptanolVII. Reaction Variables and Conversion
to HeptanolVIII. Reaction Variables and Conversion
to HeptanolIX. Specific Reaction Rate Constants
and Activation EnergiesX. Summary of Rate Controlling StepsXI. Physical Properties of n-HeptanolXII. Physical Properties of Heptanal
iv ,
54
55
56
57
56
59
60
61
62636467
ABSTRACT
The kinetics of the catalytic hydrogenation of n-heptanal to n-heptyl alcohol at high temperatures5 250°F to 350°F5 and high pressures, 800 psig to 1000 psig, were studied in a stirred tank reactor. Kinetic data on the hydrogenation of aldehydes above butyraldehyde are nonexistent. The availability of n-heptanal as a natural by-product of castor oil prompted its choice for this study.
The n-heptanal and copper chromite catalyst were charged to the reactor prior to heating, and upon reaching the reaction temperature, high pressure hydrogen was injected. Sampling at specified time intervals was accomplished through a convenient sample line which extended directly into the liquid phase. Chromatography was applied to analyze the liquid samples.
Eight experimental runs were made using specific combinations of the four important reaction variables in each run.These variables were: temperature, pressure, catalyst size, andcatalyst to reactant weight ratio. The reaction rate was found to increase for the following change in variables: increasedtemperature, decreased catalyst size, and increased catalyst to reactant weight ratio. The change in pressure of the system had no observable effect upon the reaction rate.
v

The reaction was found to be zero order with respect to the aldehyde for high concentrations of the n-heptanal, and first order with respect to the aldehyde at high alcohol concentrations.
The slowest or rate controlling step for the zero order portion of the reaction was thought to be the surface reaction between the adsorbed aldehyde and adsorbed hydrogen. Mhen the reaction changed from zero order to first order3 three possibilities arose. The adsorption of the heptaldehyde could control, the diffusion of the hept aldehyde to the catalyst surface could control, or the diffusion of the n-heptyl alcohol to the bulk liquid phase could control. It can not be clearly discerned from the data which of these steps is rate controlling at high conversions.
Copper chromite was found to be a very effective catalyst in that 99.9 percent conversion of the n-heptanal was obtained. Only slight reduction of the catalyst took place thereby verifying the ability of the incorporated barium oxide as a promoter and stabilizer.

I. INTRODUCTION
Agricultural by-products are finding numerous new uses in the chemical industries each year, yet there exists a large void in the technology of the chemical processing of these products.
A particular field of interest lies in the production of the alcohols of these by-products through hydrogenation reactions. Hydrogenation reactions can be used to produce both saturated and unsaturated alcohols from the corresponding acids, aldehydes, and esters of the alcohols depending upon the catalyst and conditions which are employed.
In particular, heptaldehyde was chosen for study since it is the most readily available of the higher carbon aldehydes. After castor oil has been extracted from the castor bean, one of the major constituents remaining is ricinoleic acid. Upon destructive distillation of the ricinoleic acid, both 10-hen- decenoic acid and heptaldehyde remain (34). The reaction that occurs is:
ch3(ch2)5chch2ch=ch(ch2)7cooh — ► ch2=ch(ch2)8cooh + ch3(ch2)5cho.OH
The reduction of the aldehyde to the corresponding
1
2
alcohol does not necessarily have to be accomplished by gaseous hydrogenation. In fact, earlier studies in the production of .n-heptyl alcohol from heptaldehyde were conducted in several different ways. Probably the earliest reaction was that of Bouis and Carlet in 1862, in which heptaldehyde was reduced to n-heptyl alcohol by using zinc dust in the presence of acetic acid (4). Several years later Sehrolemmer employed a similar technique in that he used acetic acid as a solvent, but he substituted a sodium amalgam for the zinc dust as a reducing agent (36). The Bouveault-Blanc reduction technique of sodium metal in ethanol was used about this time also (17). A variation of the three methods already mentioned appeared later when Levene and Taylor in 1918, reduced heptaldehyde to n-heptyl alcohol in a mixture of sodium in toluene and acetic acid (24).
After these methods had been used successfully, little was done until the advent of platinum and palladium catalysts.In 1924, Garothers and Adams used a platinum oxide catalyst in a dilute ferric salt solution with the heptaldehyde and obtained 70 percent to 80 percent yields of n-heptyl alcohol (6).
About 1930, a large amount of hydrogenation research hadbegun to take place at the University of Wisconsin under thedirection of Dr. Homer Adkins. His principal interest was in the field of nickel and copper-chromium oxide catalysts, although the work was not strictly limited to these two catalysts (l). Heptaldehyde was reduced in a 95 percent yield to n-heptyl alcohol

using a Raney nickel catalyst, a temperature of 150°C, a pressure of three atmospheres, and a catalyst ratio of six grams catalyst per 285 grams of heptaldehyde with a reaction time of four hours.
The ability of nickel to catalyze hydrogenation reactions was well_ established by now, yet the Raney or Kieselghur nickel catalyst could be easily poisoned by certain trace impurities of sulfur or halogens (2). The copper-chromium oxide catalyst was found to be less sensitive than nickel to these poisoning agents, and it had the additional advantage of not requiring special preparation before usage as was the case with the nickel. However, much higher pressures of the order of magnitude of 50 to 300 atmospheres are necessary when working with copper-chromium oxide (19).
Another improvement was made on the copper-chromium oxide catalyst in 1932, when Adkins along with several associates found that the addition of barium, calcium and magnesium stabilized the catalyst against reduction, and consequent deactivation, while apparently enhancing its activity (8).
Apparently the interest in using the copper-chromium. oxide catalyst to produce n-heptyl alcohol ceased for some time after Adkins' initial work, for the next attempt to produce the alcohol was reported in 1939. Several Russian chemists found that they could obtain a 98 percent yield of n-heptyl alcohol by reacting 100 grams of heptaldehyde in 3GP milliliters of '96
4
percent ethanol with 100 grams of pyrophoric nickel at 55°C and one atmosphere pressure (5).
The next year a report appeared in a French journal which stated that an equimolar solution of n-heptyl alcohol and 2-pentyl-l-nonanal was obtained by reacting two moles of hept- aldehyde in the presence of 49 grams of nickel catalyst at temperatures ranging from 25°C to 100°C (31). This article also stated that the hydrogenation was accompanied by aldolization and crotonization. This was the first mention of side reactions.
In 1942, two Chinese chemists reported that n-hexane and n-heptyl alcohol were obtained when heptaldehyde was hydrogenated at 250°C, one atmosphere pressure, and with a Kieselghur nickel catalyst being employed (43). This reaction was carried out completely in the vapor phase and small traces of carbon monoxide and water were found in the product mixture.
The next decade brought about the advent of the metal hydride catalysts such as LiAlH^ and NaBH . The reduction of heptaldehyde with LiAlH^ in a hydrochloric acid atmosphere would be a consecutive reaction following these steps (17):
4RCH0 + LiAlH4 > (RCH20)4AlLi
(RCH20), AlLi — Hcl> 4RCH20H + AlClg + LiCl
where R = CH^-fCHg)^- •The metal alkoxides could also be used for the direct reduction of the heptaldehyde.

5
Several Russian publications appeared in 1956 dealing with the hydrogenation of heptaldehyde. One publication stated that the barium and calcium stabilized copper chromite catalyst had facilitated 95 percent to 100 percent conversion to n-hepta- nol at temperatures ranging from 160°C to 300°G> and pressures from 1 to 200 atmospheres (22). This work was conducted exclusively in the vapor phase in a flow reactor. A second publication in 1956 stated that nickel sulfide and tungsten sulfide on activated alumina had been employed as catalysts in the hydrogenation reaction (25). However, a hydrogen to aldehyde ratio of 1000:1 was used along with a pressure of 30© atmospheres and a temperature of 230*0 to obtain a 90 percent yield. Similar results were obtained in a few exploratory tests using an aluminum-cobalt-molybdenum catalyst. Groggins has stated that the sulfide catalysts used in this type of work are advantageous only when the reaction mixture contains sulfur poisons (19).The latest Russian article stated that the hydrogenation ability of copper chromite is dependent upon, the crystal lattice constants and the filling of the d shell (40).
With this background in mind, a research project was undertaken for the specific purpose of obtaining the specific reaction rate constants, the order of the reaction, and activation energies for the reaction of heptaldehyde and hydrogen at temperatures of 25©°F to 35©°F, pressures of.800 psi to 1000 psi, using barium stabilized eopper-chromium oxide catalyst.

ImdHstriaUy promising chemical reactions are often thoroughly studied in bench scale reactors to explore the useful ranges of pressures5 temperatures, and catalyst ratios, or to evaluate other reactor variables.
In order to simplify this study the hydrogen was kept in large excess so that all data was reported on the basis of aldehyde concentration only. In other words, this was a pseudo- reaction study.
The objective of this research also included a determination of the rate controlling step in this heterogeneous reaction. Mine important steps can control the reaction rate; therefore, the reaction variables such as temperature, pressure, catalyst size, and catalyst to reactant ratio were varied in such a manner as to gain the proper insight into the rate controlling step.

II. APPARATUS
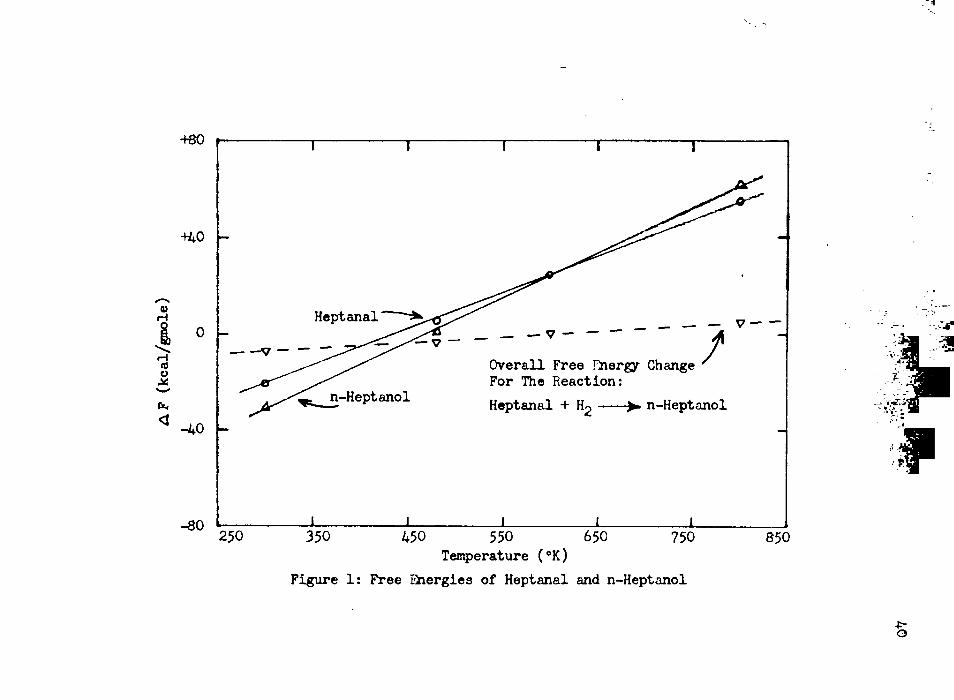
A. High Pressure ReactorAll of the hydrogenation reactions were carried out in
a Series 4500 ©ne-liter Parr Instrument Company high pressure reactor, as illustrated in Figure 3«
The reactor was mounted inside of a steel circular encasement, 10 inches in diameter with a 4i“ineh circular hole in which the reactor was placed. Inside the encasement were heating coils, and the power input to these coils was controlled by a Variac. Both the Variac and the reactor were mounted on a zp-inch steel base plate which facilitated the moving of the entire system if so desired.
The reactor was constructed of 316 stainless steel, using Teflon gaskets to seal the reactor head and the reactor proper.Two semi-circular clamps were bolted securely into place about the reactor head, and a steel band encircled the two clamps.Extending down into the reactor were the gas injection line and sampling line, the 6-bladed 2^-inch mixing impeller, and the cooling coils.
Extending from the top surface of the reactor head were six objects. First was the pressure gauge which had a range of 0 to 2000 psi, and was divided into 20 psi increments. The pressure could be read to the nearest 5 psi. Second were the needle
7

valves which controlled the gas input and sampling lines < Two separate valves controlled these operations independently„ Third was the gas outlet line which was controlled by another needle valve. The fourth item was the safety blow-out line which was connected directly to the outside vent line. Inside of this line was a special silver rupture disc, g-inch in diameter and 0.010 inches thick, which was rated to rupture at a pressure of 180© psi. The reactor was tested at the factory up to 3000 psi, but was never operated above 1025 psi, thus leaving a sufficient safety margin. The fifth item was the stirrer shaft which was topped with a 5g-ineh pulley. A"V-belt?' connected the pulley to a 1/20 horsepower motor which drove the stirrer at a constant speed.The last item was a thermometer which had a range of Q°C to 500°G, and which could be read accurately to the nearest five degrees.
All, electrical connections were explosion-proof.
B. Flow SystemTwo separate -ineh stainless steel tubing lines led from
the nitrogen and hydrogen gas bottles to a joining manifold. A Hoke valve was placed in the line leading from the nitrogen bottle so that the high hydrogen pressure could be kept from contacting the nitrogen pressure regulator. A zp-inch stainless steel tubing line led from the manifold to the gas inlet needle valve.
On the outlet side, 3/8-inch stainless steel tubing led from the outlet needle valve to a "T". From the "T" two routes could be. followed by the gas. The first route went through.
9
another Hoke valve and then directly to the vent line. The second route went to a Hoke valve and then through a Brooks hydrogen flowmeter and eventually out through the vent line. The operating procedure determined which of the two routes was traversed by the gas.
The vent line was directed out of the laboratory and emerged about 12 feet above the ground level into the open atmosphere.
The safety blow-out line was 3/8-inehes stainless steel tubing and led directly to the vent line.
G. Sampling SystemThe sampling line was ^-ineh stainless steel tubing one
foot in length. At the end of the tubing was a 3g-inch heat exchanger constructed of one inch copper tubing, and water was passed through the shell as coolant. This small heat exchanger was installed to insure complete condensation of the samples. A high pressure needle valve located on the reactor head controlled the rate of flow in the sample line.
B. ChromatographA type 26-002 GIG gas chromatograph control unit coupled
with a 26-014 GEO analyzer was used to analyze the liquid products. The liquid samples were vaporized in the high temperature analyser and the separation of the gases occurred in a 10 feet long, ip-inch diameter stainless steel column packed with butanediol succinate

10
on Chromosorb. The eolwin packing is often referred to as Craig polyester. The components were differentiated by using thermal conductivity detectors which measured the difference between the thermal conductivity of the carrier gas and the individual components . Helium was used as a carrier gas because of its inertness and high thermal conductivity. The output signal from the detector cell was attenuated and traced on a Leeds & Horthrup recorder, where each component was identified by an individual peak. The individual peaks afforded a qualitative analysis, while the peak area afforded a quantitative analysis. The recorder was equipped with a disc integrator, which automatically determined the relative areas of the peaks.
This analytical setup provided a rapid and accurate means of analyzing the chemical constituents encountered in the research, for even minute traces of impurities could be resolved on the chromatograph, and high reproducibility could be obtained with this unit.
E. Distillation ColumnA Ig-inch I.E. column, which was five feet long, and which
was packed to a height of 20 inches with 6-mm Berl saddles, was used to purify the heptaldehyde. The distillation pot was of one liter capacity, and this pot was contained in a large heating mantle. The power input to the heating mantle was regulated by a Variac.

F. Refractomet erThe parity of the distilled, samples was cheeked asing a
Baaseh-Lomb refraetometer which coaid be read acearately to the fifth decimal place„

III. EIPEB3MTAL
The research was performed, in such a manner as to secure the necessary data of a quality that would permit accurate determination of the kinetic quantities in question at various combinations of reaction variables for the hydrogenation of kept aldehyde.
A. Preparation of ReactantsThe heptaldehyde used as the reactant was obtained from
Distillation Products Industries as a technical grade chemical.The purity of the chemical as received was checked on a refraeto- meterj and certain impurities were suspected to be present, since the index of refraction was extremely high. A value of 1.43147 at 26.2°C was obtained, whereas the literature value for pure material is 1.40972 at this temperature. Also, a slight yellow coloring was present, and pure heptaldehyde is colorless.
The pure heptaldehyde distilled over at 147*0 at a pressure of 705 millimeters of mercury along with extremely small traces of water. The water was removed in a separatory funnel, and the index of refraction of the purified heptaldehyde checked to the fourth decimal with the literature value.
The impurities were suspected to be ricinoleie acid and 10-hendeeenoic acid, which are the other two components obtained
12

33
in the destructive distillation of castor oil (34). The index of refraction of rieinoleie acid and 10-hemdeeemoic acid are 1.4320 and 1.4501 respectively at 20°G (21), Also5 the boiling points of the two acids are 250°C at 15 millimeters of mercury and 275*0 at 76© millimeters of mercury in the same respective order. The high boiling fraction began to come over at 272°C and had a deep yellow color, thereby strengthening the conclusion as to the identity of the contaminants.
The copper chromium oxide catalyst was obtained in a reduced form from the Harshaw Chemical Company, catalogue number Cu-1170-T. The catalyst was l/S-inch by l/8-ineh cylindrical pellets, and the following analysis was supplied by the manufacturer: 33.0% CuO, 38.0% GrgGg, 10.5% Ba©, and 18.5% support.The constituents were actually present as CuO, OuOrgO , andBaCrO, .4
B. Laboratory ProcedureThe heptaldehyde and catalyst were carefully weighed into
the reactor in specified weight ratios. The weighings were made to the nearest 0.1 gram. The reactor was securely bolted into place in the heating jacket, and nitrogen gas was used to purge the system clean of oxygen. A minimum of eight nitrogen purges were used, and with each purge the nitrogen pressure was allowed to build up to 100 psi before the system was bled to 25 psi. Care was always taken to keep the reactor at higher than atmospheric pressure to prevent “back flushing# of the air. When the system

was satisfactorily purged, the nitrogen pressure was set between 35 and 40 psi, and the heating coils were started.
The heating was done rapidly up to within 50 "P of the desired reaction temperature, and then a very gradual increase was used to attain the final temperature, care being taken not to "over-shoot" the desired temperature. "When the system appeared to be at a thermal equilibrium with the surroundings, that is, when the convection and radiation losses were balanced against heat input, the hydrogen gas was cautiously injected into the system.
The total injection period was between lg and 2 minutes, for the reactor was tested for leaks at several pressures on the way to the final maximum pressure. A soap solution was used for the testing purposes. The initial zero time for the reaction was taken to be when the hydrogen was first injected, for the stirrer was operating and the hydrogen was injected directly into the liquid phase.
The temperature of the reactor was maintained within -5°F of the reaction temperature by adjusting the Variae setting or by passing cooling water through the coils. Only experience allowed one to accurately judge how to change the settings, or what flow rate of water to use.
Samples were withdrawn at equal time increments, usually 15 or 20 minutes apart. The hydrogen inlet valve was closed, and the sample valve was cautiously opened. A brief sudden discharge

15
took place5 and. then a small sample bottle was placed under the tubing and a -milliliter sample was withdrawn. This was an adequate size sample for use in the chromatograph. An asbestos glove was used to hold the sample bottle as a precaution against an accidental burn to the operator. The discharge of the hydrogen gas served to "clean out" any portion of a previous sample that may have been left in the sampling tube, thus assuring homogeneity of the samples.
When the reaction was completed the hydrogen bottle valve was closed tightly, and cooling water was run through the reactor at a high flow rate. The warm hydrogen was bled from the reactor, followed by a minimum of ten nitrogen purges. The reactor was then bled to atmospheric pressure, removed from the heating chamber, and broken open for removal of the final reaction mixture.
. Immediate cleaning with acetone and detergent and consequent air drying insured the good condition of the reactor. Also, this readied the reactor for the next run.
C. AnalysisThe liquid products were analyzed by gas chromatography
in which a butanediol-succinate column provided the separation.The detector signals were traced on a Leeds & Horthrup recorder. The X axis on the chart represented time, and the Y axis represented the concentration of each component. This allowed a qualitative and quantitative analysis since each component had a definite elution time, and the disc integrator which operates in

16
conjunction with the recorder permitted integration of the peak areas.
At the beginning of each run standard samples of hept- aldehyde and n-heptyl alcohol were injected into the chromatograph to check elution time for the operating conditions being used and to obtain the peak area correction factors.
In order to obtain a mole percent analysis, it was necessary to take the percentage obtained from the peak areas and multiply these values by a correction factor. This correction factor, which varied from day to day, and thereby necessitated the use of standard samples each day, could be obtained from the following formula which was given in the literature (11):
Mole fraction of A = faa/(faa + f b)where
f = correction factor for component Af^ = correction factor for component Ba = integrator counts for component Ab = integrator counts for component B
By assuming either f or f^ to be 1.00, thus establishing a “reference base", the other correction factor could be obtained from the standard samples.
The operating conditions of the column were kept as constant as possible for all analyses, namely: temperature at 230°C,carrier gas of helium, column pressure of 40 psi, carrier gas

17
flow of SQml/min, and the use of the same column. These conditions affect the retention times of the various components, and all of these conditions except the temperature could be held very constant. The temperature fluctuated between 228°G and 232*6 due to the variation in local power output. However, this was a variation in initial condition only and did not occur to any noticeable exbent during the actual running of the chromatographs. Only a 1*0 temperature variation was noticed during any given analysis period.
A precautionary step of allowing the column to come to thermal equilibrium was always undertaken. This reduced the H drift11 of the recorder to a minimum, and the "drift" usually could not be detected except at the most sensitive attenuations.
Each sample was injected into the vaporizer chamber using a 50 microliter syringe. The standard size injection sample was 10 microliters.
The septum on the vaporizer could be punctured between 15 and 20 times before it was necessary to replace it. If it was used more than 20 times "blow-back" occured. That is, the sample contained in the micro syringe would be blown back at the operator when he was attempting to inject the sample.
Each analysis was allowed to run for twelve minutes, thereby assuring complete resolution of all the components. The heptaldehyde and n-heptyl alcohol would normally be completely eluted in five minutes, but the small trace of water formed in

the surface reduction of the catalyst would not elute before eight minutes.

IV. DISCUSSION OF RESULTS
The results were derived from eight experimental runs in which temperature, pressure, catalyst to. reactant ratio, and catalyst size were varied.
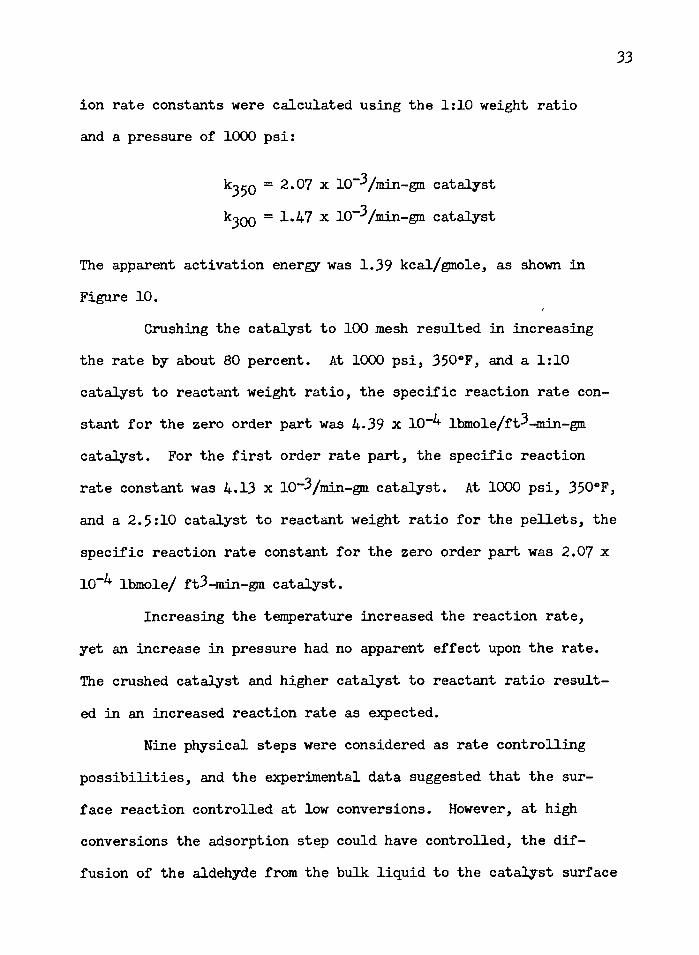
A. Thermodynamic ConsiderationsCalculation of the thermodynamic feasibility of the re
action from free-energy changes at atmospheric pressure was done using the method of Franklin (14), and the results are plotted in Figure 1. The overall free-energy change for the reaction is negative until a temperature of 600°K is reached, and then the aldehyde is seem to possess a lower free-energy value than the alcohol. However, the application of high pressure permits the reaction to proceed even at the higher temperatures. Groggins has emphasized these facts in discussing hydrogenation of the carbonyl group, and supports his statements with additional graphical presentations (19).
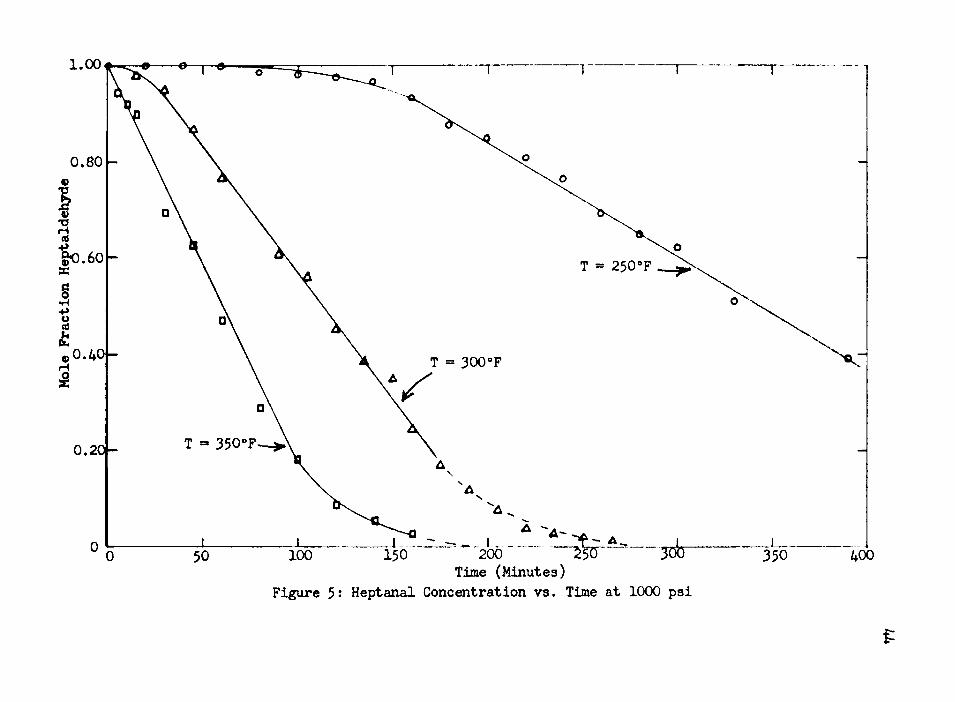
B. Reaction OrderIt was found that an “induction period" was necessary at
250°F and 300°F before the reaction would proceed smoothly, and this can be observed in Figure 5» At 350°F, this period of induction has apparently vanished, and it can be concluded that the
19

length of the induction period is a function of the temperature.Once the induction period had passed, the reaction pro
ceeded according to a zero order rate law with respect to theheptaldehyde until a low concentration of heptaldehyde remained in the reaction mixture. At this point the reaction became first order with respect to the heptaldehyde and remained so until completion of the reaction.
The variation in reaction order was observed during all eight experimental runs regardless of the conditions employed in any given run.
Since the hydrogen was always kept in large excess in thebulk phase, no attempt was made to obtain the order of the reactionwith respect to the hydrogen.
6. Controlling Stepline steps take place in series, and it is possible for
any of them to control the overall rate of reaction. If the rate of any one step is appreciably slower than that of the others, the overall rate will adjust itself to that of the slow step. The slow step is known as the controlling reaction step, and will hereafter be referred to as the rate controlling step. Each step will be ' considered separately.
1. Gas-Liquid InterfaceThe transfer of the hydrogen from the gaseous region above
the reaction mixture into the bulk liquid phase is influenced
21
primarily by the solubility of the hydrogen in the liquid. Therefore, the possibility that the transfer of the hydrogen from the gas phase into the bulk liquid phase was controlling was investigated.
Data yon the solubility of hydrogen in aldehydes could not be found. Therefore, the solubility in a similar liquid such as an alcohol was used as a criteria in examining this step. Data on the solubility of hydrogen in alcohols up to n-butanol has been published (15), and the graph of"this study is presented in Figure 2. The solubility is seen to increase with increasing pressure, and Henry's law is followed with reasonable accuracy for most alcohols. It has also been shown that the solubility of hydrogen in most organic liquids increases with increasing temperature (19).
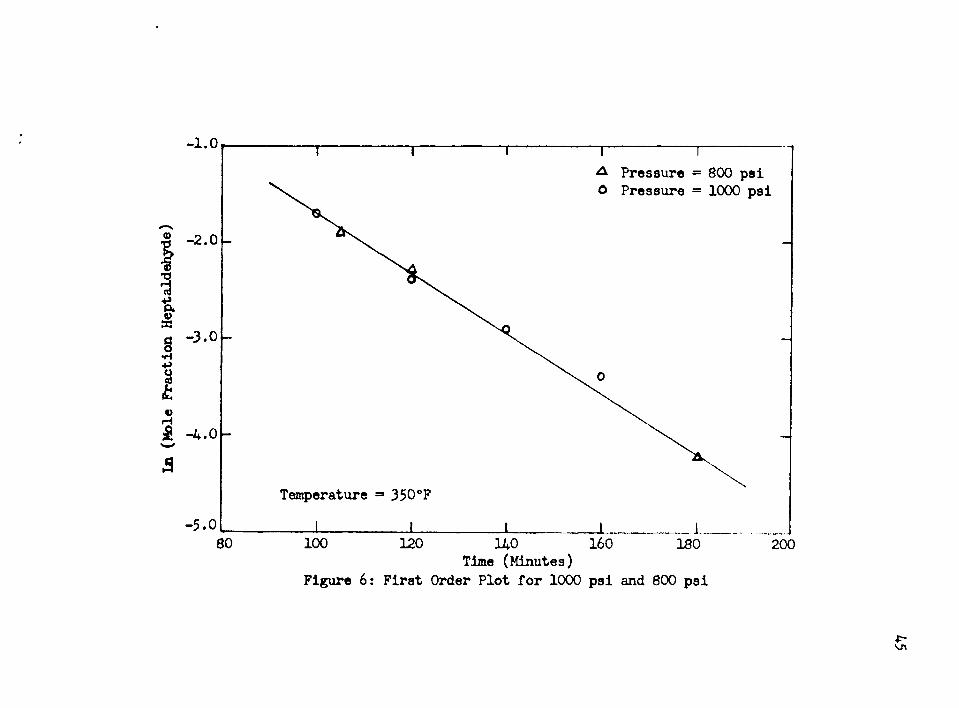
If the solubility of the hydrogen had been the controlling step, the increase in hydrogen pressure from 800 psi to 1000 psi would have increased the rate. However, the results presented in Figure 7 show that increasing the hydrogen pressure had no effect on the reaction rate, lather, the curves for 800 psi and 1000 psi fell directly upon one another. It was therefore concluded that this step was not rate controlling.
2. External Diffusion (In)In a batch reactor the molecular diffusion of the hydro
gen to the catalyst surface is very often the dominant factor in the rate controlling mechanism. The rate of mass transfer from the bulk liquid phase to the solid surface can be expressed by the

22
equationN =
whereN = rate of mass transfer per unit mass of catalyst
= mass transfer coefficientCg = concentration of diffusing component in the bulk streamC. = concentration of diffusing component at the solid
interfacea = external area of catalyst particle per unit mass
The value of Cg-C^ determines the importance of external diffusionin the overall mechanism. By increasing the partial pressure of the hydrogen in the vapor phase the concentration in the bulk liquid phase would increase according to Henry's law, and the rate of the reaction should increase. Increasing the partial pressure of the hydrogen did not increase the reaction rate, and it was concluded that this was not the rate controlling step.
The diffusion of the aldehyde at low conversions was not rate controlling, for the rate would not follow a zero order law if this were the case. By considering the diffusion equation once again, it can be seen that Cg-C^ would have to be constant for a zero order reaction.
When the reaction becomes first order with respect to the aldehyde at high conversions, the diffusional step could become an important factor in the overall rate. This type of behavior is expected with a diffusion controlling step. In addition, the low

23
activation energy of 1.39 keal/gmole is highly indicative of a diffusion controlling step.
It is believed that the diffusion of the aldehyde from the bulk liquid phase to the catalyst surface is rate controlling at high conversions. However, additional evidence should be gathered to support this postulation. It is suggested that future efforts be directed at proving or disproving this postulation by varying the superficial velocity of the reactants within the reactor. If diffusion is truly controlling, the change in superficial velocity of the reactants about the catalyst should change the reaction rate (9). However, if no change in reaction rate is observed, the diffusional step could be eliminated as the rate controlling step.
3. Pore Diffusion (In)The interior surface of the catalyst is more significant
than the outside surface, for within the catalyst the vast array of active sites is present.
In order for the inside surface to be effectively used, the reactants must diffuse through the pores to the active sites. The larger the catalyst pellet, the longer is the path of diffusion to the remote interior. A decrease in catalyst size will decrease the path traveled by the diffusing molecules and speed up the reaction if this is the controlling step.
The l/8-ineh catalyst pellets were ground to a 100 mesh size, and the reaction with l/8-inch pellets was duplicated with

24
this crashed, catalyst „ An increase in the rate was observed, but this increase was only of the order of 80 percent. This indicates that pore diffusion might contribute some resistance to the re-' xaction, but that its effect is fairly negligible in contrast to the other steps. The increase in reaction rate is to be expected even if the pore diffusion is not controlling. The increase in surface area brings about an increase in the number of active sites, thus increasing the reaction rate.
It should be noted that the changing of the system pressure could not help answer any questions concerning pore diffusion since it is highly independent of pressure (39)»
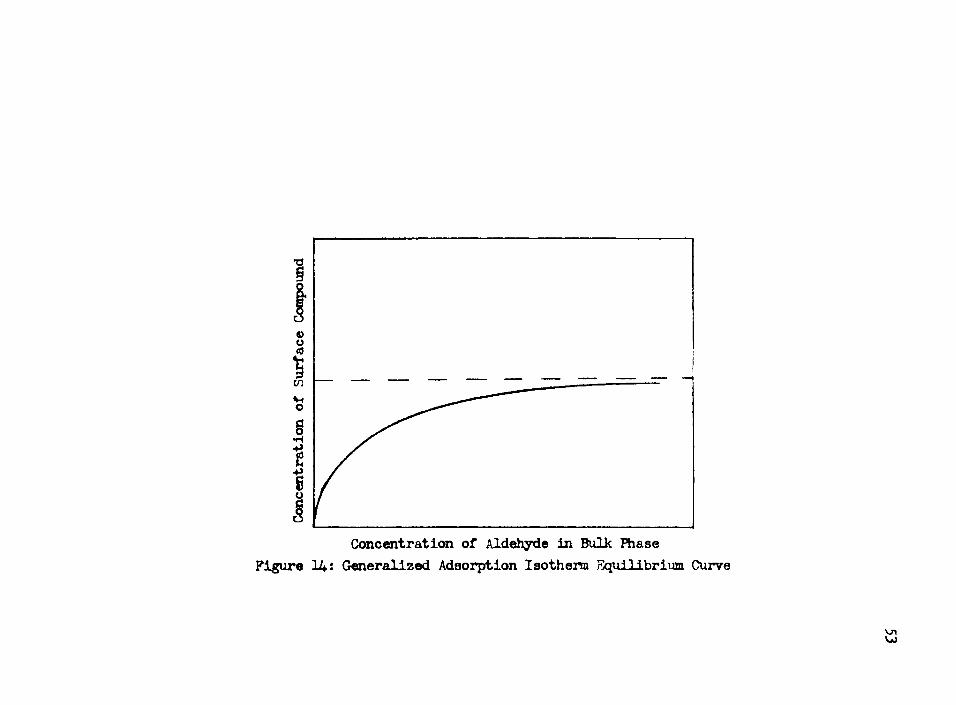
4. Adsorption of HeptaldehydeThe zero order rate for low conversions would seem to elim
inate adsorption of the aldehyde as rate controlling for low conversions. Rate equations based on an adsorption step as rate controlling would contain the concentration of the adsorbed component raised to some power, whether fractional or integral (23 , 27).
Gomsideration of a general adsorption isotherm illustrates that a zero order reaction is typical when the concentration of the adsorbed compound is a constant, as shown in Figure 14. In effect, this is saying that the adsorption step is in equilibrium, and not rate controlling.
At high conversions, the rate becomes first order and adsorption could control. However, the low value of activation energy supports a diffusions! step as controlling rather than an
25
adsorption step.Oldenburg has shown that in the vapor phase hydrogenation
of the Og-Oj aldehydes to the corresponding alcohols, the adsorption of the aldehydes was the controlling step (30). However, he employed a nickel catalyst and a differential flow reactor, in which four percent conversion was a maximum, ill of his correlations were based on initial rate data, and care must be taken not to rely too heavily on the comparison of vapor phase work to liquid phase work.
5. Adsorption of HydrogenIn general the adsorption of hydrogen increases substan
tially with an increase in pressure (42). Therefore, when the hydrogen pressure was increased from 800 psi to 100© psi the reaction rate would have increased, but this was not observed. Therefore, it was concluded that the adsorption of the hydrogen was not the controlling step.
The vast summary of previous experience with metal and metal oxide catalysts indicates that hydrogen is readily adsorbed on these surfaces, and generally in the atomic state. This adds strength to the argument that the adsorption of the hydrogen is not rate controlling.
6. Surface ReactionThis appears to be the rate controlling step for low con
versions. As an example, it can be postulated that the hydrogen

26
is adsorbed as atomic hydrogen, then the following rate equation can be postulated for the surface reaction:
r = (As)(Hs)2 - k_2 (Bs)(s)2
where(As) = adsorbed aldehyde concentration(Hs) = adsorbed hydrogen concentration(Bs) = adsorbed alcohol concentration(s) = effective concentration of unreacted active sitesk^,k ^ = rate constants for forward and reverse reactions
respectively
However, the contribution of the reverse reaction can be assumed to be negligible, and the second term of the rate equation can be neglected. The rate curves can be explained in the following manner based on this form of the surface reaction. As the reaction proceeds at low conversions, the rate remains constant, for the relative amounts of As and Hs remain fixed. That is to say, the adsorption steps are in equilibrium and the rate is merely a function of how rapidly the surface reaction takes place.
Furthermore, this type of rate behavior would be exhibited for the surface reaction controlling even if the hydrogen were not dissociated, but reacted as adsorbed molecular hydrogen, or reacted in the bulk phase.
At high conversions, the rate becomes first order with respect to the aldehyde concentration, and the activation energy

27
decreases to a value of 1.39 keal/gmole. This change in reaction order5 and especially the substantial decrease in the value of the activation energy, suggests a change in the controlling step. The low value of the activation energy suggests ruling out the continuance of the surface reaction as the controlling step.
7. Desorption of n-HeptanolThe rate equation based on the desorption of the alcohol
as a controlling step would not be zero order, since the concentration of the alcohol would appear in the equation.
In addition, by applying the Lewis theory of acids and bases to the electronic structure of the alcohol and aldehyde, it can be seen that the aldehyde is more basic, that is, a better electron donor. The metallic catalyst surface has a greater affinity for the aldehyde, since it is an electron acceptor. This helps promote the rapid desorption of the alcohol.
8. Pore Diffusion (Out)The same, statements made under pore diffusion (in) will1 ■ -
apply in this case and therefore no further comment is necessary.
9. External Diffusion (Out)When the rate equation was zero order, diffusion could
not be the controlling step, since the rate equation would contain the concentration of the alcohol to some power.
When the reaction becomes first order at high conversions, the diffusion of the alcohol from the interface to the bulk liquid

28
phase could become an important factor in the overall rate.It can not be proven from the data obtained whether this
diffusional resistance is due to the inward diffusion of the reactant, or outward diffusion of the product. It can only be postulated that the diffusion of the alcohol could be a significant contributing factor to the overall resistance.
10. Summary of StepsA tabular summary of the nine steps considered would be
helpful at this point in presenting a clearer picture of the overall situation. This tabular summary can be found in the Appendix, Table X.
D. The CatalystThe mechanism by which the copper chromite catalyst op
erates has been postulated by Cram (10). It is a highly selective catalyst, and the selectivity arises from the adsorption of the polar carbonyl function on the metal oxide surface as illustrated below
— — — Cr 0 — — —
Barium oxide is added to the catalyst to serve as a promoter. The purpose of the promoter is to substitute into the lattice of the catalyst crystal and cause distortion (45). Since the active sites on the surface are believed to be a function of lattice defects, the promoters effectively increase the number of

29
active sites.The copper oxide was present originally as the black cupric
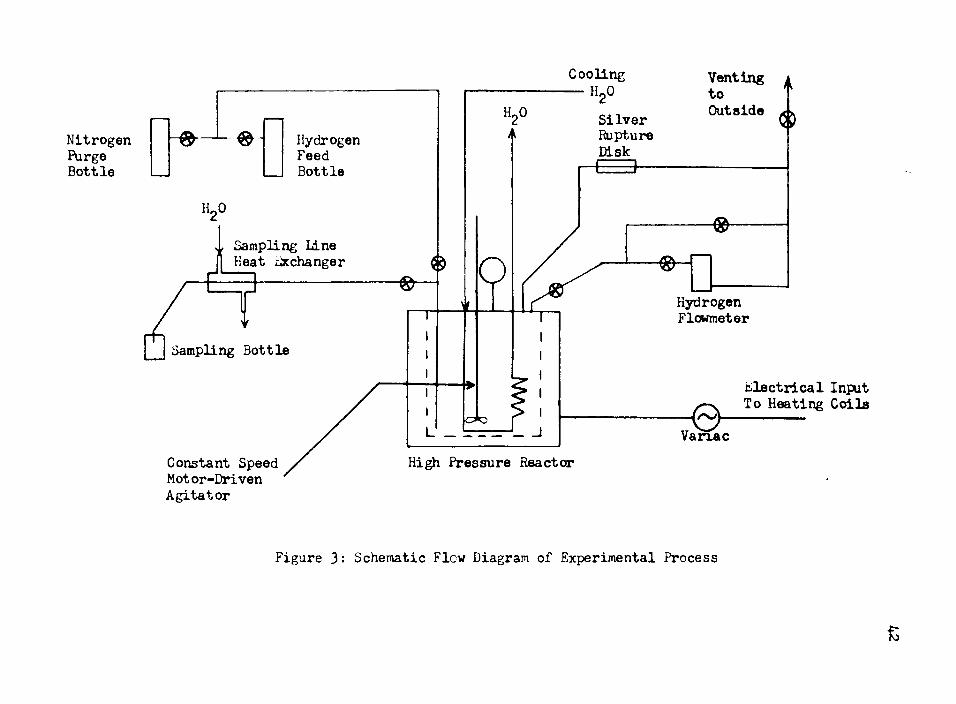
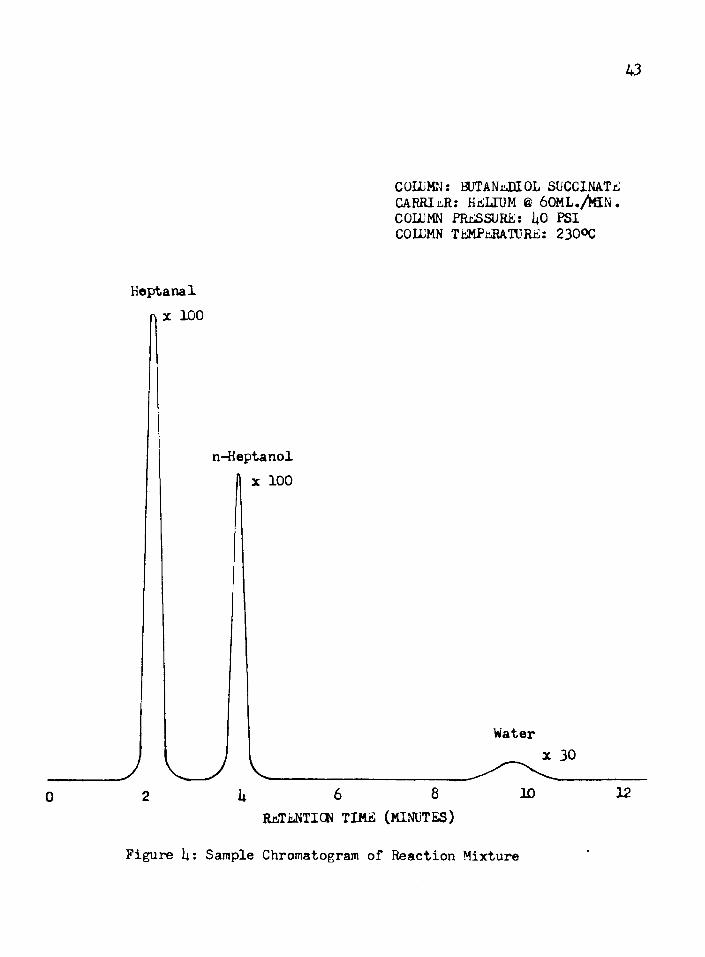
oxide. Evidence of surface reduction to cuprous oxide is twofold, since the reddish color of the lower valence oxide is present at the end of the reaction, and the appearance of small traces of water in the chromatograms suggests the following reaction:
2CuO + H2 > Cu20 + H20
The sample chromatogram shown as Figure 4 indicates the water peak.The apparent induction periods, which appeared at 250°F
and 300°F, support the theory that surface reduction of the catalyst is necessary before the reaction can proceed. The length of these induction periods should be a function of the system temperature, since reduction is a function of temperature, and the data presented in Figure 5 illustrates the length of the induction period.
E. Side ReactionsAlthough several earlier investigators obtained products
other than n-heptanol from this type of reaction, regardless of the catalyst employed, only once did a side product appear in this work.(31, 43).
This product was not identified and was present as 5 parts in 8000, which is extremely small. The chromatograph peak for this product appeared between the heptaldehyde and n-heptanol peaks. As reported in an earlier work (43), n-hexane was found

to be a reaction product. However, in using the normal column operating conditions, the n-hexane would have been resolved one minute before the heptaldehyde and not between the two reaction components.
¥«. SUMMARY
In the past the catalytic hydrogenation of aldehydes to the corresponding alcohols was a subject of interest primarily in organic chemistry, which was generally concerned with percentage yields rather than the kinetics of the reaction. As new industrial processes take shape, the chemical engineer must search further than yield percentages, for he is concerned with equipment design and the economics of any given process. Kinetic data becomes an indispensable tool in evaluating any chemical process.
The lack of kinetic data on the hydrogenation of aldehydes above butyraldehyde prompted this study. Since heptaldehyde is a natural product obtained from castor oil, it seemed logical that it should be the aldehyde chosen for study.
In a gas-liquid reaction catalyzed by a solid, several variables influence the reaction kinetics: temperature, pressure, the catalyst employed, and agitation rate. By changing these variables in varying degrees, the rate controlling step of the reaction can be found and the sealing-up of reaction equipment from bench scale to pilot plant can be made from the rate equations thus obtained.
A small high pressure reactor which was especially constructed for hydrogenation work was employed in this research.
31

32
The equipment allowed each variable to be changed from run to run, thus affording a good series of kinetic tests.
The reactions were run at temperatures of 250°F, 300°F, and 350°F. Pressure was varied from 800 psi to 1000 psi, and catalyst to reactant ratio on a mass basis was varied from 1:10 to 2.5:10. The l/8-inch catalyst pellets were employed in all but one run in which the catalyst was crushed to 100 mesh.
Liquid products were analyzed by chromatography which gave an accurate analysis of the heptaldehyde and n-heptyl alcohol along with trace amounts of water formed in the surface reduction of the copper chromite catalyst.
The reaction was found to follow a zero order rate law until low aldehyde concentrations where a first order rate law took over. At a pressure of 1000 psi, the specific reaction rate constants for the zero order rate and for a catalyst to reactant weight ratio of 1:10 (l/8-inch pellets employed) were as follows:
350 ~ 21*5 x 10”5 Ibmole/ft^-min-gm catalystkoQQ = 9.95 x 10⁻⁵ lbmole/ft^-min-gm catalystkg^Q = 6.31 x 10~*5 Ibmole/ft-*-min-gm catalyst
The apparent activation energy from the Arrhenius plot, see Figure9, was 7.56 kcal/gmole. By changing the pressure to 800 psi, butkeeping all other variables constant, the k at 350°F was found tobe the same as for the 1000 psi case.
For the first order rate law, the following specific react-
33
ion rate constants were calculated using the 1:10 weight ratio and a pressure of 1000 psi:
350 = 2.07 x 10“3/min-gm catalyst k300 = 1*47 x 10~l/min-gm catalyst
The apparent activation energy was 1.39 kcal/gmole, as shown in Figure 10.
Crushing the catalyst to 100 mesh resulted in increasing the rate by about 80 percent. At 1000 psi, 350°F, and a 1:10 catalyst to reactant weight ratio, the specific reaction rate constant for the zero order part was 4-39 x 10"4 Ihmole/ft^-min-gm catalyst. For the first order rate part, the specific reaction rate constant was 4.13 x 10~3/min-gm catalyst. At 1000 psi, 350°F, and a 2.5:10 catalyst to reactant weight ratio for the pellets, the specific reaction rate constant for the zero order part was 2.07 x 10~4 Ibmole/ ft3-min-gm catalyst.
Increasing the temperature increased the reaction rate, yet an increase in pressure had no apparent effect upon the rate. The crushed catalyst and higher catalyst to reactant ratio resulted in an increased reaction rate as expected.
Nine physical steps were considered as rate controlling possibilities, and the experimental data suggested that the surface reaction controlled at low conversions. However, at high conversions the adsorption step could have controlled, the diffusion of the aldehyde from the bulk liquid to the catalyst surface

34
could have controlled, or the diffusion of the alcohol from the catalyst surface into the bulk liquid could have controlled. The data does not clearly indicate which of these steps did control.
The chromatograph was capable of detecting 1 part in 10,000 of either component and gave very satisfactory results.From the analyses it can be seen that 99-9 percent conversion of the n-heptanal to n-heptyl alcohol can be obtained with the copper- chromium oxide catalyst.

V I. ACKHOTfJIEDCMSHTS
The author gratefully acknowledges the encouragement given by the faculty of the Department of Chemical Engineering of the University of Arizona during the course of this work. Through the grant of a graduate assistant ship,, the Department's financial support of the research project, and the continuance of an academic scholarship from the Los Angeles Times, the year of graduate study was made possible. Special appreciation is extended to Dr. Robert A. Damon for his guidance as director of this research, and for the many additional hours of help he extended beyond that normally rendered by a thesis director.The critical comments and helpful suggestions of Professors Edward Freeh, Neil Cox, and Ray Richardson were greatly appreciated.
35

¥11. LITERATURE CITED
(1) Adkins, Homer, REACTIONS OF HYDROGEN WITH ORGANIC COMPOUNDS OVER COPPER-CHROMEUM OXIDE AND. NICKEL CATALYSTS, University of Wisconsin Press, Madison,. (1946). .
(2) Adkihs, Homer, and Connor, Ralph, Am. Chem. Soe., 53:1091-95 (1931).
(3) Andrews, Donald H., «L_ Franklin Inst., 206; 285-99 (1928).(4) Bonis, and Garlet, Ann., 124; 352 (1862).(5) Bryusova, L. Ya., and Kore, S., Applied Chem. (U.S.S.R.)
12; 1457-61 (1939). -(6) Garothers, W. H., and Adams, R., tL_ Am. Chem. Soc., 46;
1682 (1924).(7) Coates, J., and Sakiadis, B. C., A.I.Ch.E„ Jonr., 1: 275-
88 (1955).(8) Connor, R., Folkers, K., and Adkins, H., J. Am. Chem. Soc.,
54; 1138-45 (1932).(9) Corrigan, T. E., Chan. Engr. Reprints, Nov. 1954, 242-44(10) Gram, D. J., and Hammond, G. S., ORGANIC CHEMISTRY, McGraw-
Hill Book Co., New York (1959).(11) Dal Nogare, S., and Juvet, R. S. Jr., GAS-LIQUID CHROMA
TOGRAPHY, Interscience, New York (1962). .(12) Deffet, L., Bull, soc. ohim. Belg., 40: 385-402 (1931).(13) Erickson, L. ¥., Brennstaff-Chem., 33: 166-72 (1952).(14) Franklin, J. L., Ind. & Engr. Chem., 41: 1070 (1949).(15) Frolich, P. K.,. Tauch, E. J., Hogan, J. J., and Peer, A. A.
Ind. & Engr. Chem., 23; 548-50 (1931)..

37
(16(17
(18(19
(21
(22
(23
(24(25)
(26
(27
(29(30
(31(32
(33
Fulmer, K., Ber., 57; 514 (1924).Geissman, T. A., PRINCIPLES OF ORGANIC CHEMISTRY, ¥. H. Freeman Co., San Franciseo (1959). . . .
Green, J. H. S., J. Applied. Chem., 11; 397-404 (1961).Groggins, P. H., UNIT PROCESSES IN ORGANIC SYNTHESIS, McGraw- Hill Book Co., New. York (1958). . .
Hennaut-Roland, Mae., and Lek, M., Bull, soc. chlm. Belg.,40; 177-94 (1931)
Hodgman, 0. D., HANDBOOK OF CHEMISTRY & PHYSICS, Chemical Rubber Publishing Co., Cleveland, 40th Ed., (1959).
Ketslakh, M. M., and Rudkovskii, D. M., Khim. i Tekhnol. Topliva, 12; 23-9 (1956).
Laidler, K. J., CHEMICAL KINETICS, McGraw-Hill Book Co.,New York (1950).
Levene, and Taylor, J. Biol. Chem., 35; 281 (1918).Levin, S. Z., Diner, I. S., and Karpov, A. Z., Khim. i Tekhnol. Topliva, 8:8-12 (1956).
McKenna, F. E., Tarter, H. V., and lingafelter, 0. E., Am. Chem. Soc., 71: 729-32 (1949).
Moore, W. J., PHYSICAL GHMISTRY, Prentice-Hall, Englewood Cliffs, (1958). . .
Nicholson, G. R., Chem. Soc., 141: 2377-78 (I960).Noordyun, A. G., Ree. trav. chlm., 38: 345-50 (1919).Oldenburg, C. C., and Rase, H. F., A.I.Ch.E. Jour., 3: 462- 66 (1957).
Palfray, L., Bull, sec, chlm., 7 : 401-6 (1940).Parks, G. S., Kennedy, W. D., Gates, R.R., Mosley, J.R., and Moore, G. E., J. Am. Chem. Soc., 78: 56-9 (1956).
Perry, J. H., CHEMICAL ENGINEERS HANDBOOK, McGraw-Hill BookCo., New York, 3rd Ed., (1950).

3S
Royals, E. E., ADVANCED ORGANIC CHEMISTRY, Prentiee-Hall,New York (1954). ....
Schaffer, W., Physlk. Chem/, 194 : 28-38 (1944).Schrolemmer, Aim., 177 : 303 (1875).Sherrill, M. L., J. Am. Chem. Soc., 52: 1982-92 (1930).Smith, B. J. F., Trans. Am. Soc. Mech. Engrs., 58: 719-25 (1936).
Smith, J. M., CHEMICAL ENGINEERING KINETICS, McGraw-Hill Book Co., New. York (1956). . . ~.
Sokol'skii, D. V., Vaporsy Khim. Kint. Kataliza i Reaktsion- nai Sposobnosti, Akad. Nauk. S.S.S.R., 388-607 (1955).
Timmermans, J., PHYSICO-CHEMICAL CONSTANTS OF PURE ORGANIC. COMPOUNDS, Elsevier, New York (1950). .
Trapnell, B. M. ¥., CHEMISORPTION, Academic Press, New York. (1955).Izeng-Jineq-Swan, and Fan, S., Am. Chem. Soc., 64: 1460-2. (1942).Verkade, P. E., and Coops, J., Rec. tray, ehim., 46: 903-7 (1927).
Walas, S. M., REACTION KINETICS FOR CHEMICAL ENGINEERS, McGraw-Hill Book.Go.,. New, York (1959).

APPENDIX
A F (kcal/gmole)
+80
Keptanal0
Overall Free Energy Change For The Reaction:Heptanal + Hn-Heptanol n-Heptanol
-40
-80 650350250 450 550 750 850Temperature (°K)
Figure 1: Free Energies of Heptanal and n-Heptanol

Volume of
Hydrogen
Volume of
Liquid
20
Temperature = 25°C
Methanol
n-Butanol
10050 1250 7525Pressure (Atras.)
Figure 2: Hydrogen Solubility in Alcohols
NitrogenPurgeBottle
Cooling Venting
OutsideSilverRuptureDiskHydrogen
FeedBottle
Sampling line Heat rjcchanger
HydrogenFlowmeter
Sampling Bottle
Electrical Input To Heating Coils
VanacHigh Pressure ReactorConstant Speed
Motor-DrivenAgitator
Figure 3: Schematic Flow Diagram of Experimental Process
43
COLUMN: BUTANaDIOL SUCCINATB CARRIER: HriLLUM 6 60ML./4aN. COLUMN PRESSURE: 1*0 PSI COLUMN TEMPERATURE: 230%
Heptanalx 100
n-Heptanol 1 x 100
Waterx 30
128 106h20RETENTION TIME (MINUTES)
Figure h: Sample Chromatogram of Reaction Mixture
1.00
0.80
gO.60
•H
0.40
0.20-
^ ~ 200 Time (Minutes)
150 350100 400Figure 5: Heptanal Concentration vs. Time at 1000 psi
In (Ho
le Fraction
Kept
alde
hyde
)- 1.0
A Pressure = 800 psi O Pressure = 1000 psi
- 2.0
-3.0
-4.0
Temperature = 350°F
18016010080 120 140 200Time (Minutes)
Figure 6: First Order Plot for 1000 psi and 800 psi
f-VX

1.00
Pressure = 800 psi Pressure = 1000 psi
0.75
X 0.25
160 24080 120 200400Time (Minutes)
Figure 7: Heptanal Concentration vs. Time at 800 psi & 1000 psi
&

In (Mo
le Fraction
Kept
alde
hyde
)- 1.00
- 3.00
— 4.00
- 5.00150120
Time (Minutes)Figure 8: First Order Plot for 1000 psi at 300°F

48
-4.50
-4.75
-5.oo
-5*25
5 -5.50
-5.75 —
- 6.00 —
-6o251.20
1 1 1loltO 1.1*5
Figure 9: Arrhenius Plot for Zero Order Reaction @ 1000 psi
1.25 1.30 1.351/T x 103 (OR-1)
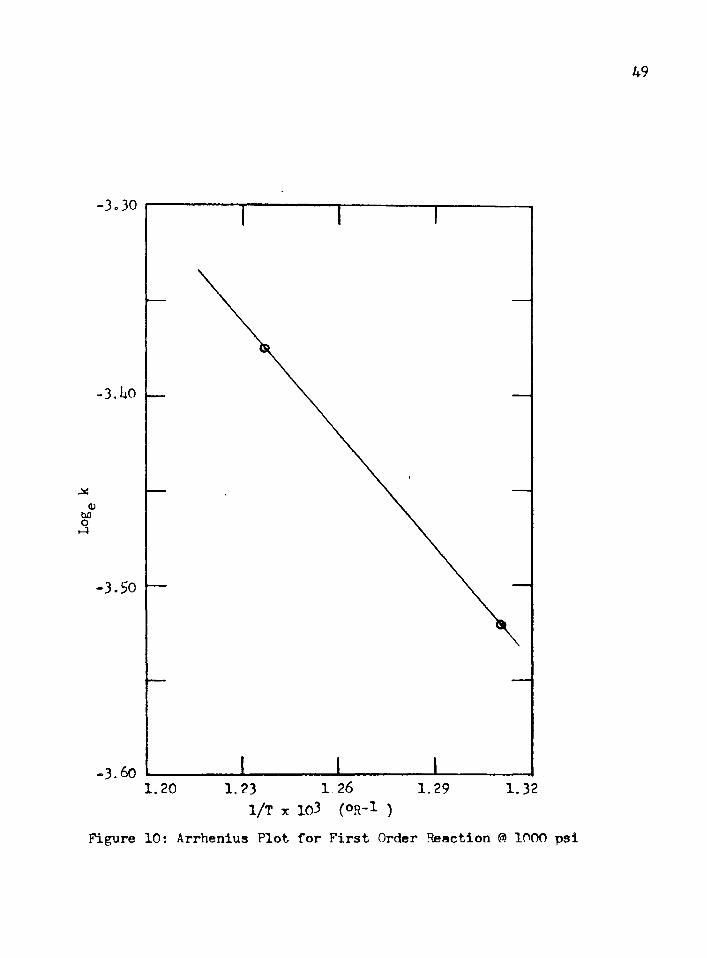
-3 .3 0
-3.10 —
-3.50 —
- 3.601 26 1.291.20 1.32
1/T x 103 (or-1 )
Figure 10: Arrhenius Plot for First Order Reaction @ 1000 psi

Mole
Fraction
Heptal
dehy
de1.00
o l/8-inch pellets A Crushed
0.75
Pressure = 1000 psi Temperature = 350°F
0.50
0.25
60 120 15030 90 1800Time (Minutes)
Figure 11: Reaction Rates for Crushed & Pellet Catalyst
vnO
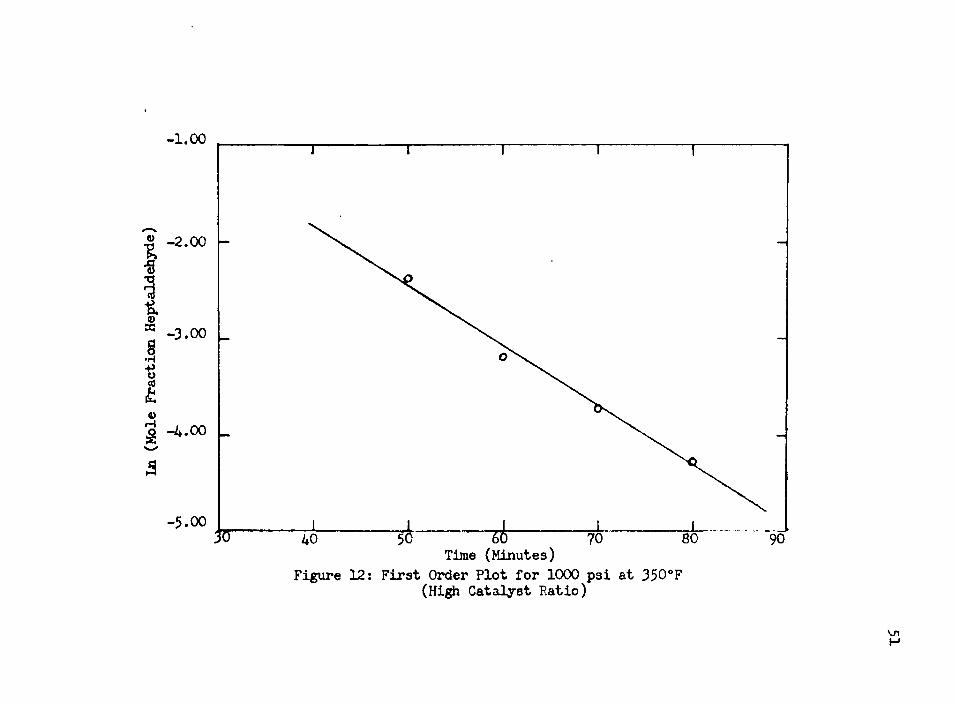
In (Mo
le Fraction
Heptaldehyde)
- 1.00
- 2.00
- 3.00
—/f .0 0
- 5.00Time (Minutes)
Figure 12: First Order Plot for 1000 psi at 350°F (High Catalyst Ratio)
vnH

Mole
Fraction
Kept al
dehyde
1.00O Low Catalyst Ratio T7 Hi^i Catalyst Ratio
0.75Temperature = 350°F
Pressure = 1000 psi
0.50
0.25
120 150 18060 90300Time (Minutes)
Figure 13: Reaction Rates for High and Low Catalyst Ratios
vnfo
e>8
o
IoConcentration of Aldehyde in Bulk Phase
Figure 14: Generalized Adsorption Isothenn Equilibrium Curve

TABLE I .
REACTION VARIABLES AID CONVERSION TO HEPTMOL
Time(Min)
Temperature . ( ° F )
Pressure#(psi)
Mole Fraction Heptanal
0 250 1000 1.00020 250 1000 1.00040 250 1000 1.00060 250 1000 1.00080 250 995 0.988100 250 1000 0.986120 250 .1000 0.976140 250 1000 0.966160 255 1000 0.922180 250 1000 0.877200 250 1000 0.853220 250 1000 0.807240 255 1005 0.768260 250 1000 0.68?280 250 1000 0.660300 250 1000 0.628330 255 1005 0.503390 250 1000 0.391Initial Quantities Used.?
a.) 170.4 grams heptanalb.) 17.0 grams l/8-inch catalyst pellets
* Nitrogen Partial Pressure = 60 psi
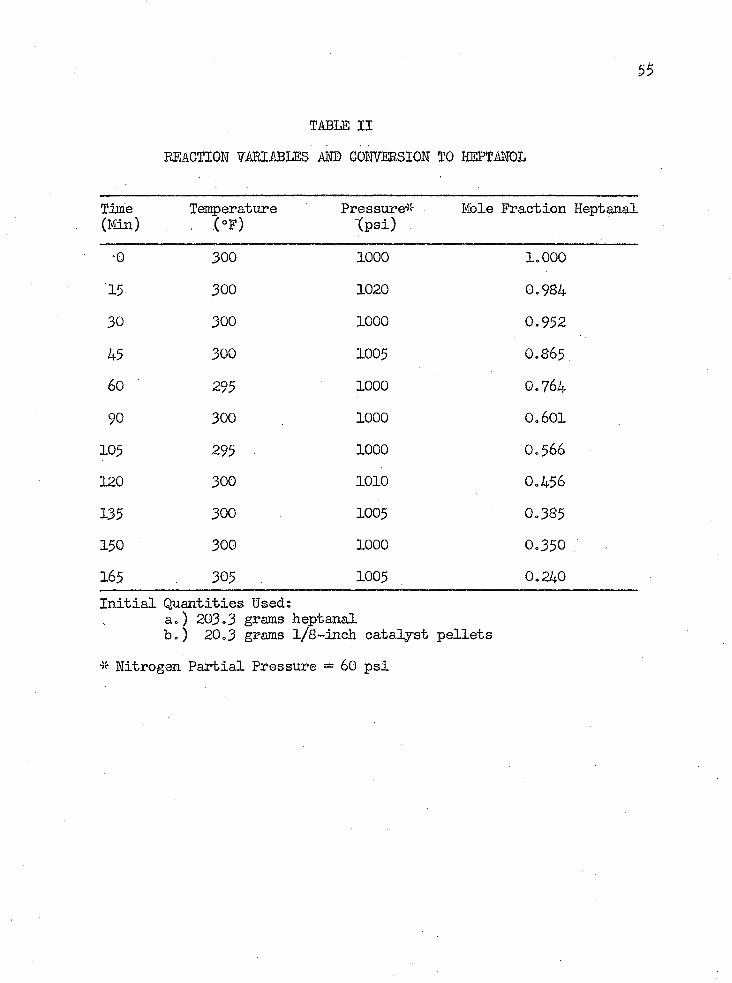
TABLE I I
REACTION VARIABLES AND CONVERSION TO HEPTANOL
Time(Min)
Temperature ■ (°F)
Pressure-55-(psi)
Mole Fraction Heptanal
*0 300 1000 1.000'15 300 1020 0.98430 300 1000 0.95245 300 1005 0.865.60 295 1000 0.76490 300 1000 0.601105 295 • 1000 0.566120 300 1010 0.456135 300 1005 0.385150 300 1000 0.350165 , . 305 1005 0.240Initial Quantities Ised:
a.) 203.3 grams heptanalb.) 20.3 grams l/8-inch catalyst pellets
* Nitrogen Partial Pressure = 60 psi

s < 1 TABLE III AMD CONVERSION TO HEPTANOL
Time(Min)
Temperature . (°F)
Pressure*(psi)
Mole Fraction Heptanal
0. 350 1000 1.0005 : 345 1000 0.93810 350 1000 0.91815 350 1000 0.89530 350 1000 0.69345 350 1000 0.63360 350 1000 0.46880 345 1000 0.285100 345 995 0.182120 350 1000 0.092140 350 1000 0.056160 345 1000 0.033180 350 1000 0.032 #*Initial Quantities Used:
a.) 156.7 grams heptanalb.) 15.7 grams l/8-inch catalyst pellets
-x- Nitrogen Partial Pressure = 60 psi** This point was discarded from the data due to the fact that - . the chromatogram of this sample did not yield the sharpness
normally exhibited by the samples. It was concluded that this point was unreliable.

TABLE 17
REACTION VARIABLES AND CONVERSION TO HEPTANOL
Time(Min)
Temperature . (°F)
Pressure*(psi)
Mole Fraction Heptanal
0 350 1000 1.00010 350 1000 0.91315 355 1000 0.84730 350 995 O.65645 355 1000 0.40660 350 1000 0.20180 355 1000 0.089100 345 1000 0.010120 35G 1000 0.004Initial Quantities UseeU
a.) 151.0 gratis heptanalb.) 15.1 grams 100-mesh catalyst
* Nitrogen Partial Pressure = 60 psi

TABLE VREACTION VARIABLES AND CONVERSION TO HEPTANOL
Time(Min)
Temperature(°F)
Pressure-5'*(psi)
Mole Fraction Heptanal
0 350 800 1.00010 350 800 0.94420 355 800 0.87930 • 350 800 0.79445 350 800 0.67660 365 800 O.46675 350 800 0.38890 350 . 800 0.231105 350 800 0.160120 350 800 0.098180 350 800 0.014Initial Quantities Used;
a.) 169.2 grams heptanalbo) 16.9 grams l/8-inch catalyst pellets
* Nitrogen Partial Pressure = 60 psi
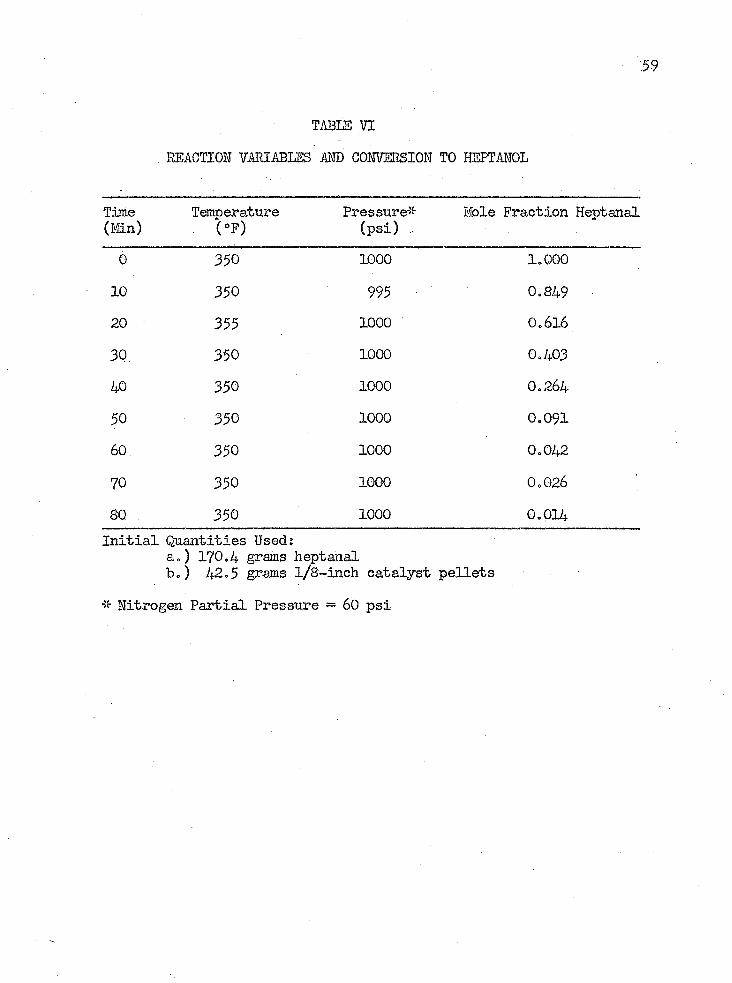
TABLE VI
REACTION VARIABLES AND CONVERSION TO HEPTANOL
Time(Min)
Temperature■ (°P)
Pressure#(psi)
Mole Fraction Heptanal
0 350 1000 1.00010 350 995 0.84920 355 1000 O.6I630 350 1000 0.40340 350 1000 0.26450 350 1000 0.09160. 350 1000 0.04270 350 1000 0.02680 350 1000 0.014Initial Quantities Used:
a.) 170.4 grams heptanalb.) 42.5 grams l/8-inch catalyst pellets
* Nitrogen Partial Pressure — 60 psi

TABLE H I
REACTION VARIABLES AND CONVERSION TO HEPTANOL
Time ' (Min)
Temperature . (°P)
Pressure#(psi)
Mole Fraction Heptanal
0 300 1000 0.40315 300 1000 0.35830 300 1000 0.33245 .300 1000 0.24360 300 1000 0.17275 300 1000 0.116 . ^90 305 1005 0.076105 300 1000 0.039120 300 1000 0.028135 300 1000 0.019150 300 1000 0.011165 300 1000 0.007Initial Quantities Used;
a,) 60.0 grams heptanalb.) 90.0 grams n-heptyl alcohole.) 15.0 grams l/8-inch cataJ-yst pellets
* Nitrogen Partial Pressure = 60 psi
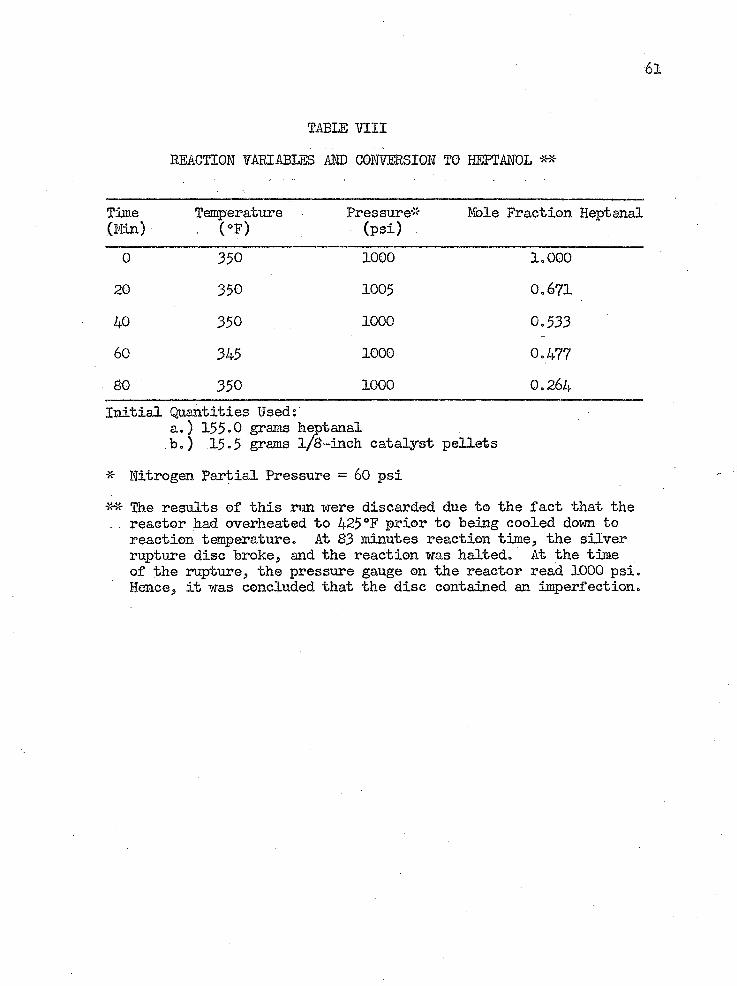
TABLE H I I
REACTION ?ARI ABIES AND CONVERSION TO HEPTANOL ■»*
Time(Min)
Temperature(°F)
Pressure#(psi)
Mole Fraction Heptanal
0 350 1000 1.00020 350 1005 0.67140 350 1000 0.53360 345 ■ 1000 0.47780 350 1000 0.264Initial Quantities Used:
a.) 155.0 grams keptanalbo) 15.5 grams l/8-inch catalyst pellets
* Nitrogen Partial Pressure = 60 psiThe results of this run were discarded due to the fact that the
. reactor had overheated to 425°F prior to being cooled down to reaction temperature. At 83 minutes reaction time, the silver rupture disc broke, and the reaction was halted. At the time of the rupture, the pressure gauge on the reactor read 1000 psi. Hence, it was concluded that the disc contained an imperfection.

62
TABLE IX
SPECIFIC REACTION RATE CONSTANTS & ACTIVATION ENERGIES
A. System Pressure: 1000 psiCatalyst/Reactant Weight Ratio: 1:10Catalyst: l/8-inch pelletsZero Order Reaction:
k350 = 21*5 x 10"5 Ibmole/ft^-min-gm catalystkoQQ = 9.95 x 10“5 Ibmole/ft^-min-gm catalyst^250 = 6.31 x 10~5 Ibmole/ft- -min-gm catalystEa = 7.56 kcal/gmole
First Order Reaction:= 2.0? x 10“ /min-gm catalyst
k300 = x 10"^/min-gm catalystEa =1.39 kcal/gmole
B. System Pressure: 1000 psiCatalyst/Reactant Weight Ratio: 1:10Catalyst: 100 mesh powderZero Order Reaction:
k^Q = 4.39 x 10“ Ibmole/ft^-min-gm catalyst First Order Reaction:
k350 = x 10” /min-gm catalyst
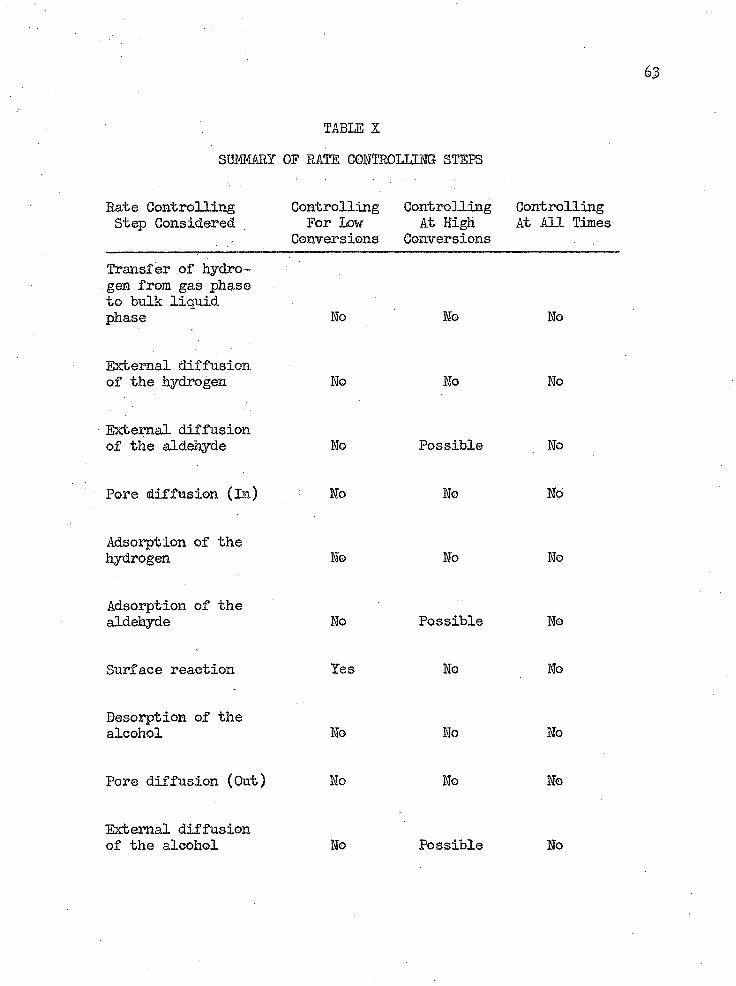
TABLE X
SUMMARY OF RATE CONTROLLING STEPS
Rate Controlling Controlling ControllingStep Considered For Low At High
Conversions ConversionsTransfer of hydrogen from gas phase to bulk liquid phase
External diffusion of the hydrogen
External diffusion of the aldehyde
Pore diffusion (In)
Adsorption of the hydrogen
Adsorption of the aldehyde
Surface reaction
Desorption of the alcohol
Pore diffusion (Out)
External diffusion of the alcohol
No No
No No
No Possible
No No
No No
No Possible
Yes No
No No
No No
No Possible
Controlling At All Times
No
No
No
No
No
No
No
No
No
No
64-
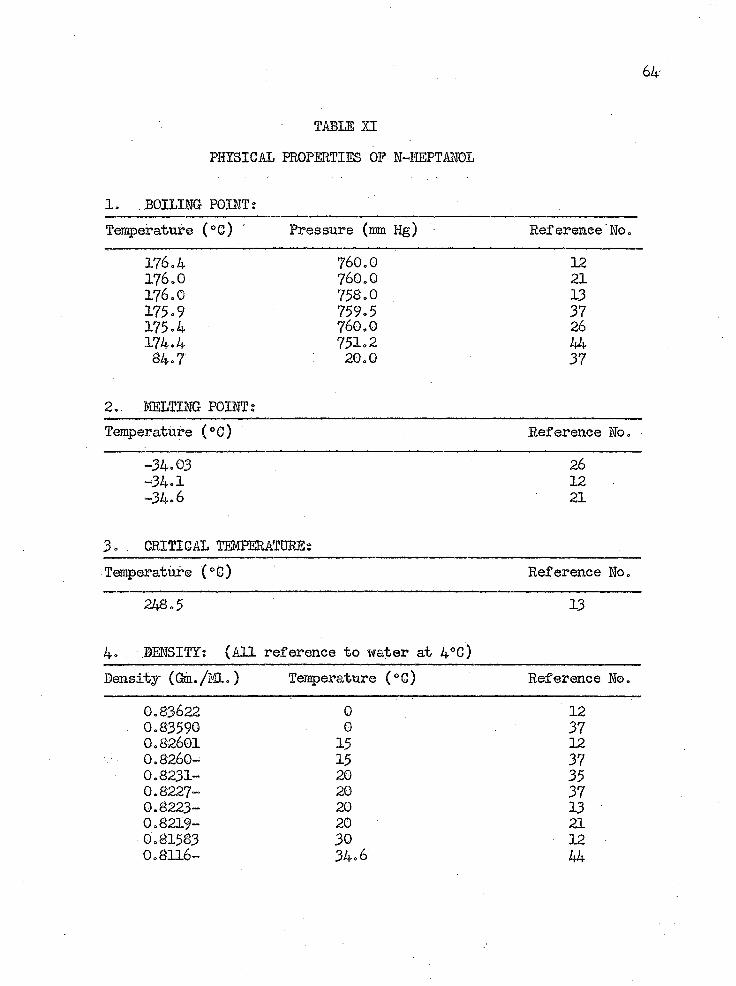
TABIE XI
PHYSICAL PROPERTIES OF H-HEPTAHOL
1. BOILING POINT:Temperature (°C) Pressure (mm Hg) Reference No.
176.4 760.0 12176.0 760.0 21176.0 758.0 13175.9 759.5 37175.4 760.0 26174.4 751.2 4484.7 20.0 37
2. MELTING POINT;Temperature (°6) Reference No.
-34.03 26-34.1 12-34.6 21
3. .. CRITICAL TEMPERATURE;Temperature (°C) Reference No.
248.5 13
4. DENSITY: (All reference to water at 4°C)Density ((Sa./ML.) Temperature (0C) Reference No.
0.83622 0 120.8359© 0 370.82601 15 120.8260- 15 370.8231- 20 350.8227- 20 370.8223- 20 130.8219- 20 210.81583 30 120.8116- 34.6 44

65
5. INDEX ©F REFRACTIONsIndex of Refraction light Temperature Reference No.
Source (°c)1„4249- 1 line 20 131.4245- D line 20 371.4241- D line 20 211.42190 He red 20 371.42456 He yellow 20 371.43043 He green 15 371.43002 He green 15 121.42351 He red 15 371.42310 He red 15 121.42627 He yellow 15 371.42567 He yellow 15 121.42874 He green 20 371.43424 He violet 15 121.42347 H alpha 15 121.43102 H beta 15 121.43520 H epsilon 15 12
6. THERMAL CONDUCTIVITY;Thermal Conductivity 'Units Temperature Reference No.
(°o)0.000383 COS 30 380.000377 CCS 60 380.000369 COS 100 380.0903 BTU 100 (°f) 7
7. SURFACE TENSION;Surface Tension Temperature Reference No.(lynes/Gm.) (°c)
24.84 15 2024.42 20 2023.61 30 20
8. VAPOR PRESSURE: (Reference No. 21)P (mm. Hg) " 1 10 40 100 400 760Temp. (°G) 42.4 74.7 99.8 119.5 155.6 175.8

66v
9. THEEMODIHAMIG PROPERTIES: (Reference No.18)Temp, (h°-hs)t s°- GP - H| Log K|(°c) cal./deg. cal./deg,, cal./deg. kcal273 26.55 111.26 40.11 80.89 28.35298 27.8© 114.83 42.70 81.65 22.93300 27.88 115.07 42.91 81.71 22.56400 32.98 128.79 53.62 84.52 7.42500 38.12 141.82 63.51 86.83 - 1.94600 43.05 154.08 71.92 88.68 - 8.34700 47.67 165.69 79.15 90.11 -12.99800 52.02 176.69 85.32 91.13 -16.54900 56.04 187.02 90.65 81.80 -19.311000 59.72 "196.83 95.25 92.23 -21.54
10. N-HEPTAN0L - N-HEPTANAL SYSTEH: (Reference No. 26)Hole Fraction Heptanol Freezing Point (°C)
0.000 ■ -43.710.037 -46.110.074 -50.440.143 -48.150.187 -34.520.238 -19.690.296 - 7.850.353 - 1.980.401 0.330.456 1.570.489 2.250.594 0.470.662 — 4.160.715 -10.310.777 -26.040.794 -32.970.829 —44»920.849 -49.060.877 -45.271.000 —34.03
11. SOLUBILITY IN WATER: (Reference No. 16)Temp,, (°C) 18 70 80 90 100 110 120Gnu Heptanol inn j_?5 .170 .225 .285 .355 .430100, da, Soln,
67
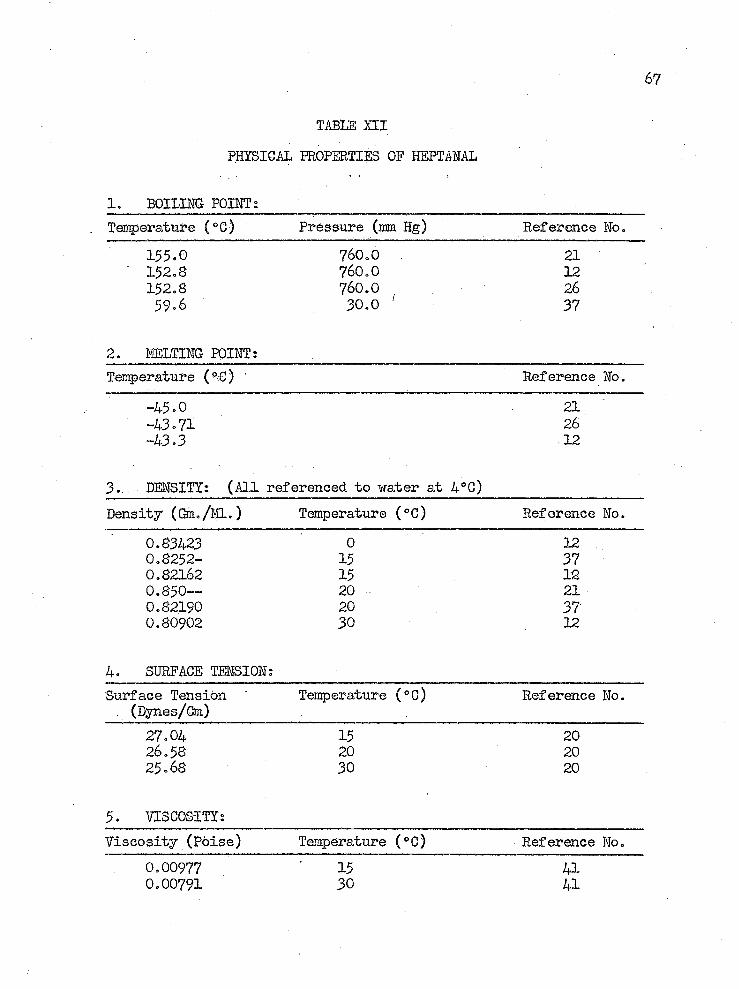
TABLE H I PHYSICAL PROPERTIES OF HEPTAHAL
1. BOILING POIHTsTemperature (°C) ' Pressure (ram Hg) Reference No.
155.0 760.0 21152.8 760.0 12152.8 760.0 2659.6 30.0 37
2. MELTING POINT;Temperature (°G) ’ Reference No.
-45.0 21-43.71 26-43.3 12
3.. DENSITY: (All referenced to water at 4*0)Density (Gm./EL.) Temperature (°C) Reference No.
0.83423 0 120.8252- 15 370.82162 15 120.850™ 20 210.82190 20 370.80902 30 12
4. SURFACE TENSION:Surface Tension Temperature (°G) Reference No.. (Dynes/Cm)
27.04 15 2026.58 20 2025.68 30 20
5. VISCOSITY:Viscosity (Poise) Temperature (°C) Reference No.
0.00977 15 410.00791 30 41

6. INDEX OF REFRACTION:___________________________________Index of Refraction ' Light Temperature Reference Ho.
Source (°C)1.4131- D line 20 211.41247 He red 15 121.41952 He green 15 121.41511 He yellow 15 121.4237S He violet 15 121.41282 H alpha 15 121.42044 H beta 15 121.42471 H epsilon 15 12dn/dt = 0.00054/°G for D line
7» SPECIFIC HEAT;__________Op (cal/gm-0G) Temperature (°C) Reference Mo.
0.258 -167.57 0.431 - 80.320.364 0.00
8. THERM0DIHAHC PROPERTIES;
3333
Quantity Reference Ho.Hf 29s == -66.66 kcal/gmole 32Hf,298 = -74.50 kcal/gmole 28Hcomb. “ -IO62.I kcal/gmole 28Ff 293 = -37.71 kcal/gmole 32
9. VAPOR PRESSURE: (Reference Ho. 21)P (mm Hg) 1 10 40 100 400 760Temp. (°C) 12.0 43.0 66.3 84.0 125.5 155.0
10. SOLUBILITY IN MATER; (Reference Ho. 29)0.124 gms./lOO gram solution @ 11.4*0