kinetics and mechanism of aqueous chemical synthesis …ring/crystallizationweb/testino_2004.pdf ·...
TRANSCRIPT

Kinetics and Mechanism of Aqueous Chemical Synthesisof BaTiO3 Particles
Andrea Testino,† Maria Teresa Buscaglia,‡ Vincenzo Buscaglia,*,‡
Massimo Viviani,‡ Carlo Bottino,‡ and Paolo Nanni†
Institute for Energetics and Interphases, Department of Genoa, National Research Council,I-16149 Genoa, Italy, and Department of Process and Chemical Engineering,
University of Genoa, I-16129 Genoa, Italy
Received September 17, 2003. Revised Manuscript Received November 24, 2003
A systematic kinetic investigation on the chemical synthesis of BaTiO3 particles fromaqueous solutions of BaCl2 and TiCl4 at T < 100 °C and at pH 14 has been performed.Initially, a viscous suspension of a Ti-rich gel phase is obtained at room temperature. Later,formation of BaTiO3 is induced by heating above 70 °C and the gel phase is graduallyconverted to the crystalline perovskite. The isothermal formation kinetics of BaTiO3 andthe evolution of crystal size and particle size during the course of reaction are significantlyinfluenced by temperature, concentration, and barium-to-titanium ratio of the solution. Theearly stages of reaction (yield < 1%) are dominated by primary nucleation, and slow formationof single nanocrystals of BaTiO3 was observed by HRTEM. At a later stage, formation ofpolycrystalline particles occurs by secondary nucleation of BaTiO3 on the surface of alreadyexisting crystals. During this stage, the reaction rate increases by 1 order of magnitude.When the yield exceeds 50%, nucleation becomes less important and the reaction is dominatedby growth. Final particles have a diameter in the range 0.3-1.6 µm, depending on theprocessing parameters.
1. Introduction
Barium titanate, BaTiO3, is a ferroelectric ceramicmassively used in electric and electronic applications.As a dielectric, it is utilized in multilayer ceramiccapacitors (MLCCs) and for embedded capacitance inprinted circuit boards. Recent developments in micro-electronics and communication have led to the minia-turization of MLCCs. To achieve this goal and to makethe next step forward, powders with improved qualityand small and uniform size (<300 nm) are required.1
Many chemical methods have been proposed for thesynthesis of high-quality BaTiO3 powders.2 Amongthem, the hydrothermal route has some advantagesbecause it leads directly to fine, pure, crystallinepowders at relatively low temperatures without theneed of a further thermal treatment. The hydrothermalprocess is generally carried out by suspending TiO2particles or a TiO2 gel in an aqueous Ba(OH)2 solutionand then autoclaving at 150-300 °C. Thermodynamicmodeling of the Ti-Ba-H2O-CO2 system3 has beenused to assess the conditions corresponding to the
quantitative formation of BaTiO3. In the absence of CO2and at pH >12, BaTiO3 is the stable phase over a widerange of barium concentrations. The calculated stabilitydiagrams have also shown that quantitative formationof BaTiO3 is possible even at temperatures <100 °C.Therefore, synthesis of BaTiO3 using more conven-tional chemical precipitation processes has also beenexplored.4-8
The size distribution of the particles that grow fromsolution depends, in general, on the rates of nucleiformation and crystallite growth. Crystal agglomerationcan also contribute substantially the overall particlegrowth process.9-10 The relative importance of nucle-ation and growth is determined by the supersaturationof the solution. In turn, supersaturation is very sensitiveto temperature, concentration, and mixing conditions.Despite the large potential interest, there is scantyinformation available on the influence of the aboveparameters on the formation kinetics of BaTiO3 par-ticles.11-14 The evolution of particle morphology duringhydrothermal synthesis was reported by several
* To whom correspondence should be addressed. E-mail:[email protected].
† University of Genoa.‡ National Research Council.(1) Rae, A.; Chu, M.; Ganine, V. In Ceramic Transactions Dielectric
Ceramic Materials; Nair, K. M., Bhalla, A. S., Eds.; The AmericanCeramic Society: Westerville, OH, 1999; Vol. 100, p 1. (b) Venigalla,S. Am. Ceram. Soc. Bull. 2001, 6, 63.
(2) Nanni, P.; Viviani, M.; Buscaglia, V. In Handbook of Low andHigh Dielectric Constant Materials and Their Applications; Nalwa, H.S., Ed.; Academic Press: San Diego, CA, 1999; Vol. 1, p 429.
(3) Lencka, M. M.; Riman, R. E. Chem. Mater. 1993, 5, 61. (b)Lencka, M. M.; Riman, R. E. Ferroelectrics 1994, 151, 159.
(4) Kiss, K.; Magder, J.; Vukasovich, M. S.; Lockhart, R. J. J. Am.Ceram. Soc. 1966, 49, 291.
(5) Her, Y.-S.; Matijevic, E.; Chon, M. C. J. Mater. Res. 1995, 10,3106. (b) Her, Y.-S.; Lee, S.-H.; Matijevic, E. J. Mater. Res. 1996, 11,156.
(6) Leoni, M.; Viviani, M.; Nanni, P.; Buscaglia, V. J. Mater. Sci.Lett. 1996, 15, 1302.
(7) Kumar, V. J. Am. Ceram. Soc. 1999, 82, 2580.(8) Grohe, B.; Miehe, G.; Wegner, G. J. Mater. Res. 2001, 16, 1901.(9) Dirksen, J. A.; Ring, T. A. Chem. Eng. Sci. 1991, 46, 2389.(10) Zukoski, C. F.; Rosenbaum, D. F.; Zamora, P. C. Chem. Eng.
Res. Des. 1996, 74A, 723. (b) Van Hyning, D. L.; Klemperer, W. G.;Zukoski, C. F. Lamgmuir 2001, 17, 3128.
(11) Hertl, W. J. Am. Ceram. Soc. 1988, 71, 879.
1536 Chem. Mater. 2004, 16, 1536-1543
10.1021/cm031130k CCC: $27.50 © 2004 American Chemical SocietyPublished on Web 03/23/2004

groups,13-24 but the observations were mainly qualita-tive.
Analysis of the above-cited literature shows thatmany fundamental aspects of the formation of BaTiO3particles from solution are not yet well defined. Ingeneral, the formation rate of BaTiO3 increases and theparticle size decreases with increasing barium concen-tration, but these dependencies were never studied ona systematic basis. The effect of temperature is uncer-tain. The particles are often polycrystalline, but it isunclear whether this is a consequence of secondarynucleation or originates from colloidal aggregation ofsmaller crystals. In any case, heterogeneous nucleationis reported to be an important factor at the early stagesof reaction. Tendency to formation of dendritic particleswas also observed when the barium concentration isdecreased.
The study described here was aimed to gain a betterunderstanding of the formation of barium titanateparticles from dilute (e0.1 M) aqueous metal chloridesolutions at temperatures <100 °C. Synthesis of BaTiO3particles was carried out according to the overall reac-tion
where (aq) denotes a salt in an aqueous solution.
According to our observations, reaction 1 is rather fastat T g 80 °C and cation concentration >0.1 mol dm-3,and formation of a white BaTiO3 precipitate can bereadily observed. However, at lower concentration, thereaction proceeds in two steps: (i) initial, rapid forma-tion of an amorphous Ti-rich gel phase and (ii) slowerreaction between the gel phase and the Ba2+ ions leftin solution with formation of crystalline BaTiO3 par-ticles. While step (i) is very fast at any temperature,step (ii) is hindered below ≈70 °C. The isothermalcrystallization kinetics and the evolution of morphology,crystallite size, and particle size were determined as afunction of concentration at two different temperatures.The influence of the barium-to-titanium ratio wasinvestigated for a given combination of temperature andTi concentration.
2. Experimental Section
2.1. Synthesis of BaTiO3. To obtain reproducible resultscorresponding to a well-defined condition, precipitation experi-ments were carried out by premixing the reactant solutionsat room temperature, where formation of BaTiO3 is kineticallyinhibited, and then heating the resulting gel suspension to thereaction temperature. Several precipitation experiments (seeTable 1) were performed in a 500 mL vessel using ≈250 mLof an aqueous solution of TiCl4 (Acros, 99.9%) and BaCl2·2H2O(Aldrich, 99.9%). The chloride solution was quickly mixed (20s) with the same volume of a NaOH solution with immediateformation of a highly viscous, gelatinous suspension of a Ti-rich gel phase. The concentration of the NaOH solution wasthat required to have [OH-] ) 1 mol dm-3 after quantitativeprecipitation of BaTiO3, according to reaction 1. The experi-ments were conducted at two different temperatures, 82 and92 °C, and the barium concentration in the reactor (i.e. theconcentration referred to the total volume after mixing of thereactant solutions) was varied from 0.02 to 0.12 mol dm-3.Unless otherwise stated, the [Ba]/[Ti] molar ratio, R, in thesolution was 1.11. The vessel was then closed, heated, and keptat constant temperature with stirring. The closed environmentavoids formation of BaCO3. The temperature inside the reactorwas measured by means of a Pt100 sensor. Progressiveformation of crystalline BaTiO3 occurs during aging. Thetransformation was visually indicated by the transition froma translucent viscous medium to a white and opaque suspen-sion. The head of the reactor was equipped with 12 plastic(PEEK) tubes and valves. Each tube was connected to a
(12) Vivekanandan, R.; Philip, S.; Kutty, T. R. N. Mater. Res. Bull.1986, 22, 99. (b) Kutty, T. R. N.; Padmini, P. Mater. Chem. Phys. 1995,39, 200.
(13) Eckert, J. O., Jr.; Hung-Houston, C. C.; Gersten, B. L.; Lencka,M. M.; Riman, R. E. J. Am. Ceram. Soc. 1996, 79, 2929.
(14) Moon, J.; Suvaci, E.; Morrone, A.; Costantino, S. A.; Adair, J.H. J. Eur. Ceram. Soc. 2003, 23, 2153.
(15) Hennings, D.; Rosenstein, G.; Schreinemacher, H. J. Eur.Ceram. Soc. 1991, 8, 107.
(16) Dutta, P. K.; Gregg, J. R. Chem. Mater. 1992, 4, 843. (b) Dutta,P. K.; Asiaie, R.; Akbar, S. A.; Zhu, W. Chem. Mater. 1994, 6, 1542.
(17) Kumazawa, H.; Annen, S.; Sada, E. J. Mater. Sci. 1995, 30,4740.
(18) Chien, A. T.; Speck, J. S.; Lange, F. F.; Daykin, A. C.; Levi, C.G. J. Mater. Res. 1995, 10, 1784.
(19) Slamovich, E. B.; Aksay, I. A. J. Am. Ceram. Soc. 1996, 79,239.
(20) Zhao, L.; Chien, A. T.; Lange, F. F.; Speck, J. S. J. Mater. Res.1996, 11, 1325.
(21) Choi, J. Y.; Kim, C. H.; Kim, D. K. J. Am. Ceram. Soc. 1998,81, 1353.
(22) Bagwell, R. B.; Sindel, J.; Sigmund, W. J. Mater. Res. 1999,14, 1844.
(23) Hu, M. Z.-C.; Kurian, V.; Payzant, E. A.; Rawn, C. J.; Hunt,R. D. Powd. Technol. 2000, 110, 2.
(24) MacLaren, I.; Ponton, C. B. J. Eur. Ceram. Soc. 2000, 20, 1267.
Table 1. Summary of Precipitation Experiments and Properties of Final Powdersa
expt[Ba]
(mol dm-3)[Ba]/[Ti]gel phase
duration(min)
final yield(%)
t1/2b
(min)final d50
(µm) (d90 - d10)/d50
final dBET(µm)
final dXRD(µm)
82 °C1 0.035 0.63 1320 92 185 2.2c 1.0 >0.32 0.044 0.63 150 100 47.5 0.86 0.75 0.29 0.263 0.052 0.66 66 100 13.4 0.55 0.51 0.25 0.224 0.070 0.64 48 100 2.6 0.36 0.49 0.20 0.225 0.121 30 100 <1 0.28 0.56 0.16 0.106 0.045 0.63 37 100 8.5 0.51 0.47 0.24 0.217 0.047 0.64 41 100 4.5 0.49 0.49 0.25 0.27
92 °C8 0.023 0.57 270 91 62 1.57 0.96 >0.39 0.029 0.56 65 93 6.9 0.77 0.61 0.22 0.14
10 0.035 0.53 34 100 6.1 0.57 0.58 0.21 0.2111 0.0405 0.53 14.5 100 3.8 0.47 0.69 0.19 0.1212 0.059 30 100 <1 0.36 0.46 0.18 0.10a For expts 1-5 and 8-12, R ) 1.11. For expt 6, R ) 1.155. For expt 7, R ) 1.2. R is the [Ba]/[Ti] ratio in the reactor. b Half-transformation
time for formation of BaTiO3. c d50 is 1.38 µm after 270 min.
BaCl2(aq) + TiCl4(aq) + 6NaOH(aq) f
BaTiO3(s) + 6NaCl(aq) + 3H2O(l) (1)
Aqueous Chemical Synthesis of BaTiO3 Particles Chem. Mater., Vol. 16, No. 8, 2004 1537

syringe on one side and immersed in the suspension on theother side. At given times (time zero corresponds to the instantthe temperature reaches the reaction temperature) 20 mL ofsuspension was collected, cooled, and sealed in small bottles.Each syringe was used only once. The aliquot collected at timezero was used to determine the Ba/Ti ratio in the gel phase.After quantitative precipitation of BaTiO3 (or when conversionattains a constant value), the suspension remaining in thereactor was centrifuged, and the powder was washed andfinally freeze-dried.
2.2. Particle Characterization and Measurement ofParticle Size Distribution. A 5-10 mL portion of suspensionwas washed and filtered on a filter paper. The X-ray diffraction(XRD) pattern of the precipitate was collected directly fromthe surface of the filter after drying with a Philips PW1710diffractometer (Co KR radiation). The powder patterns, includ-ing (110) and (111) reflections, were recorded in the range 35-50° 2θ using a 2θ step of 0.03° and a sampling time (for eachstep) up to 60 s for samples containing a small amount ofcrystalline phase. The crystallite size (dXRD) of BaTiO3 wasestimated from the broadening of the (111) XRD peak bymeans of the Scherrer equation, after correction for instru-mental broadening, assuming negligible microstrain broaden-ing. The (hhh) reflections are not subjected to splitting duringthe cubic to tetragonal distortion of the BaTiO3 unit cell. Thedrawback of using the (111) reflection is its low relativeintensity, only 30%. Therefore, for yield values <10%, mean-ingful crystal size measurements could not be carried outbecause the signal-to-noise ratio was too low. Since thebroadening effect for particles >150 nm is rather small, sizemeasurements of the coarser crystallites may be affected by alarge uncertainty. Above 300 nm, broadening is negligible andsize measurements are no longer possible. Because of thelimitations described above, the crystallite size data shouldbe considered as semiquantitative values.
The number particle size distribution (PSD) was obtainedfrom the measurement of the diameter of ≈1000 particles bya Philips 515 scanning electron microscope (SEM). For thispurpose, 5 mL of suspension was centrifuged, and the pre-cipitate was washed and finally treated with a 5% HNO3
solution to dissolve the gel phase, leaving the BaTiO3 particles.SEM observation before and after the treatment has shownno appreciable variation of particle morphology. Three param-eters, d10, d50, and d90, were obtained from the PSD. In general,dp is the diameter corresponding to the percentage p ofparticles in the cumulative particle size distribution. Theaverage particle size was defined as the number mediandiameter (d50) of the PSD.
The powder obtained after completion of reaction was alsocharacterized. The density, F, was measured by helium pic-nometry (model Accupyc 1330, Micromeritics, Norcross, GA).The specific surface area, SBET, was determined by nitrogenphysisorption (BET method, model ASAP 2010, Micromeritics,Norcross, GA). The equivalent BET diameter, dBET, wascalculated with the formula dBET ) 6/FSBET.
2.3. Determination of the Reaction Kinetics. Method1. A 10 mL portion of suspension was centrifuged and thebarium concentration in the supernatant was determined bygravimetric titration as BaSO4. Use of conductometric titrationgave equivalent results. The progress of reaction was calcu-lated by the equation
where [Ba] is the barium concentration in the supernatant,[Ba]T the total barium concentration, and Rg the Ba/Ti ratioin the gel phase (measured on the suspension withdrawn attime zero), assumed to be constant during the course ofreaction. This hypothesis was verified by determining theprecipitation kinetics at a barium concentration of 0.035 moldm-3 by a second independent method.
Method 2. The suspension was centrifuged, the precipitatewashed, and finally the gel phase was removed by the same
treatment adopted for PSD measurement. The BaTiO3 pre-cipitate was finally dissolved using a 3:1 mixture of concen-trated HCl and HNO3, and the amount of barium wasdetermined by gravimetric titration. Although SEM observa-tions showed that the treatment for removal of the gel phasehas not an appreciable influence on particle morphology,leaching of barium ions from the surface of BaTiO3 could notbe completely avoided and a small correction of the raw kineticdata was required for method 2. This correction was deter-mined from the amount of barium dissolved from a referenceBaTiO3 powder prepared with the same methodology andsubjected to the same treatment. As shown in Figure 1, thekinetic data obtained by the two methods result to be nearlycoincident. However, method 1 was preferred because it isfaster and more reliable.
2.4. TEM Observation. The growth of BaTiO3 nanocrystalsduring the early reaction stages (yield < 2 mol %) could beobserved by conventional and high-resolution transmissionelectron microscopy (TEM and HRTEM) with a JEOL J2010microscope operated at 200 kV. A precipitation experiment was
yield )R([Ba] - [Ba]T) + Rg[Ba]T
(Rg - 1)[Ba]T
Figure 1. Formation kinetics of crystalline BaTiO3 fromaqueous solutions of BaCl2 and TiCl4. The legend of (a) and(b) indicates the barium concentration. (a) At 82 °C and [Ba]/[Ti] ) 1.11. (b) At 92 °C and [Ba]/[Ti] ) 1.11. (c) At 82 °C and[Ti] ) 0.039 mol dm-3 for different values of [Ba]/[Ti]. Opensymbols represent kinetic data obtained by titration of super-natant. Full symbols represent kinetic data obtained bytitration of the BaTiO3 precipitate after removal of the Ti-richgel phase.
1538 Chem. Mater., Vol. 16, No. 8, 2004 Testino et al.
performed at 82 °C at a barium concentration of 0.044 moldm-3. Aliquots of the suspension were collected at differenttimes. The samples were transferred in small bottles andsealed. Immediately before observation, a drop of the suspen-sion was deposited onto a carbon-coated copper grid and dried.Identification of BaTiO3 crystals was carried out using anenergy-dispersive electron microprobe and electron diffraction(ED).
3. Results
3.1. Reaction Kinetics. The synthesis conditions aregiven in Table 1. The Ba/Ti molar ratio in the gel phaseat the beginning of reaction (time zero) is practicallyindependent of concentration and equal to 0.64 at 82°C and 0.55 at 92 °C. The formation kinetics of BaTiO3is shown in Figure 1. All the curves have a sigmoidalshape and the reaction rate is strongly dependent onconcentration. At 82 °C (Figure 1a), as the bariumconcentration is increased by a factor 2 (from 0.035 to0.07 mol dm-3), the half-transformation time, t1/2,decreases by a factor 70 (from 185 to 2.6 min). At 92 °C(Figure 1b), the reaction is ≈20 times faster at [Ba] )0.041 mol dm-3 than at [Ba] ) 0.023 mol dm-3. Theeffect of temperature can be illustrated by comparingthe two experiments (1 and 10) performed at a bariumconcentration of 0.035 mol dm-3. As the temperature islowered from 92 to 82 °C, t1/2 increases by a factor 30(from 6 to 185 min). The strong slowing down of thecrystallization kinetics induced by a 10 °C decrease oftemperature explains why formation of BaTiO3 is notobserved near room temperature. At low concentration,the precipitation of BaTiO3 is not quantitative, evenafter times much longer than the half-transformationtime (see Table 1, expts 1, 8, 9). At the highestconcentration for both temperatures (expts 5 and 12),formation of BaTiO3 is rather fast and the reaction hasalready started before the temperature attained thepreset value. The corresponding kinetic data were thusdiscarded. The influence of the [Ba]/[Ti] ratio on thecrystallization of BaTiO3 at 82 °C is shown in Figure1c. The experiments were conducted at a constant Ticoncentration of 0.039 mol dm-3. It can be observed thatupon increasing R from 1.11 to 1.2, t1/2 decreases from47.5 to 4.5 min. This is a significant effect consideringthat the barium concentration only changes by 7%.
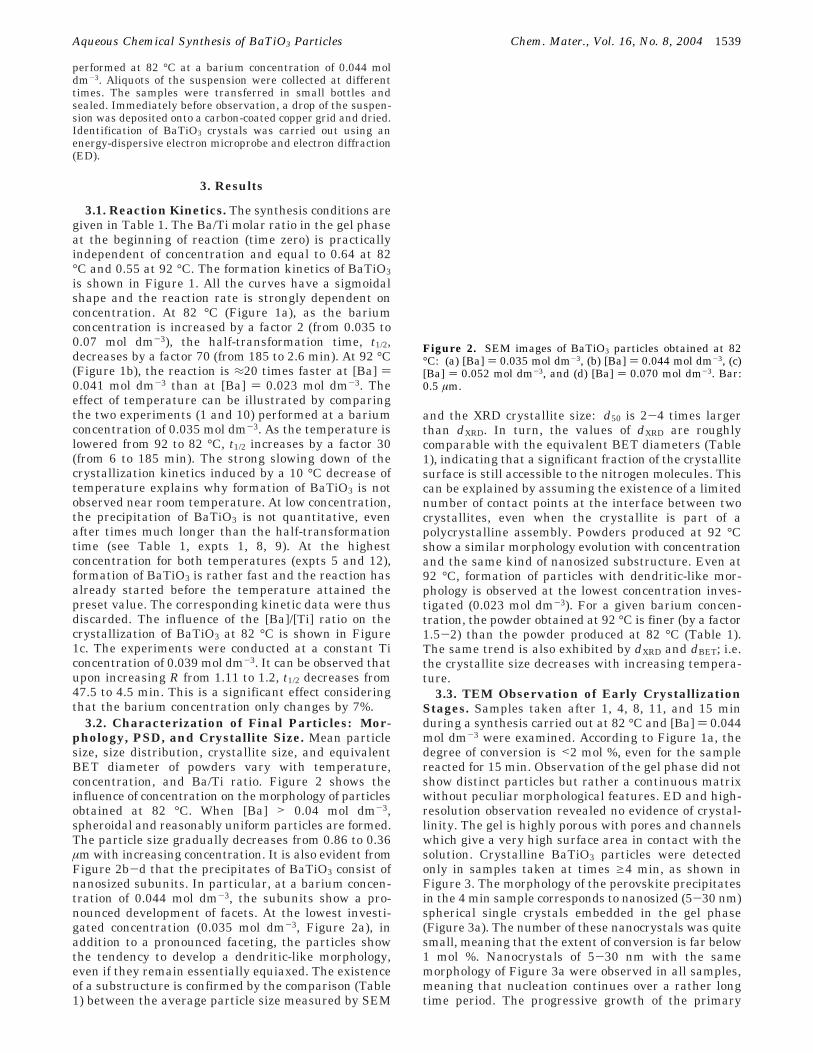
3.2. Characterization of Final Particles: Mor-phology, PSD, and Crystallite Size. Mean particlesize, size distribution, crystallite size, and equivalentBET diameter of powders vary with temperature,concentration, and Ba/Ti ratio. Figure 2 shows theinfluence of concentration on the morphology of particlesobtained at 82 °C. When [Ba] > 0.04 mol dm-3,spheroidal and reasonably uniform particles are formed.The particle size gradually decreases from 0.86 to 0.36µm with increasing concentration. It is also evident fromFigure 2b-d that the precipitates of BaTiO3 consist ofnanosized subunits. In particular, at a barium concen-tration of 0.044 mol dm-3, the subunits show a pro-nounced development of facets. At the lowest investi-gated concentration (0.035 mol dm-3, Figure 2a), inaddition to a pronounced faceting, the particles showthe tendency to develop a dendritic-like morphology,even if they remain essentially equiaxed. The existenceof a substructure is confirmed by the comparison (Table1) between the average particle size measured by SEM
and the XRD crystallite size: d50 is 2-4 times largerthan dXRD. In turn, the values of dXRD are roughlycomparable with the equivalent BET diameters (Table1), indicating that a significant fraction of the crystallitesurface is still accessible to the nitrogen molecules. Thiscan be explained by assuming the existence of a limitednumber of contact points at the interface between twocrystallites, even when the crystallite is part of apolycrystalline assembly. Powders produced at 92 °Cshow a similar morphology evolution with concentrationand the same kind of nanosized substructure. Even at92 °C, formation of particles with dendritic-like mor-phology is observed at the lowest concentration inves-tigated (0.023 mol dm-3). For a given barium concen-tration, the powder obtained at 92 °C is finer (by a factor1.5-2) than the powder produced at 82 °C (Table 1).The same trend is also exhibited by dXRD and dBET; i.e.the crystallite size decreases with increasing tempera-ture.
3.3. TEM Observation of Early CrystallizationStages. Samples taken after 1, 4, 8, 11, and 15 minduring a synthesis carried out at 82 °C and [Ba] ) 0.044mol dm-3 were examined. According to Figure 1a, thedegree of conversion is <2 mol %, even for the samplereacted for 15 min. Observation of the gel phase did notshow distinct particles but rather a continuous matrixwithout peculiar morphological features. ED and high-resolution observation revealed no evidence of crystal-linity. The gel is highly porous with pores and channelswhich give a very high surface area in contact with thesolution. Crystalline BaTiO3 particles were detectedonly in samples taken at times g4 min, as shown inFigure 3. The morphology of the perovskite precipitatesin the 4 min sample corresponds to nanosized (5-30 nm)spherical single crystals embedded in the gel phase(Figure 3a). The number of these nanocrystals was quitesmall, meaning that the extent of conversion is far below1 mol %. Nanocrystals of 5-30 nm with the samemorphology of Figure 3a were observed in all samples,meaning that nucleation continues over a rather longtime period. The progressive growth of the primary
Figure 2. SEM images of BaTiO3 particles obtained at 82°C: (a) [Ba] ) 0.035 mol dm-3, (b) [Ba] ) 0.044 mol dm-3, (c)[Ba] ) 0.052 mol dm-3, and (d) [Ba] ) 0.070 mol dm-3. Bar:0.5 µm.
Aqueous Chemical Synthesis of BaTiO3 Particles Chem. Mater., Vol. 16, No. 8, 2004 1539
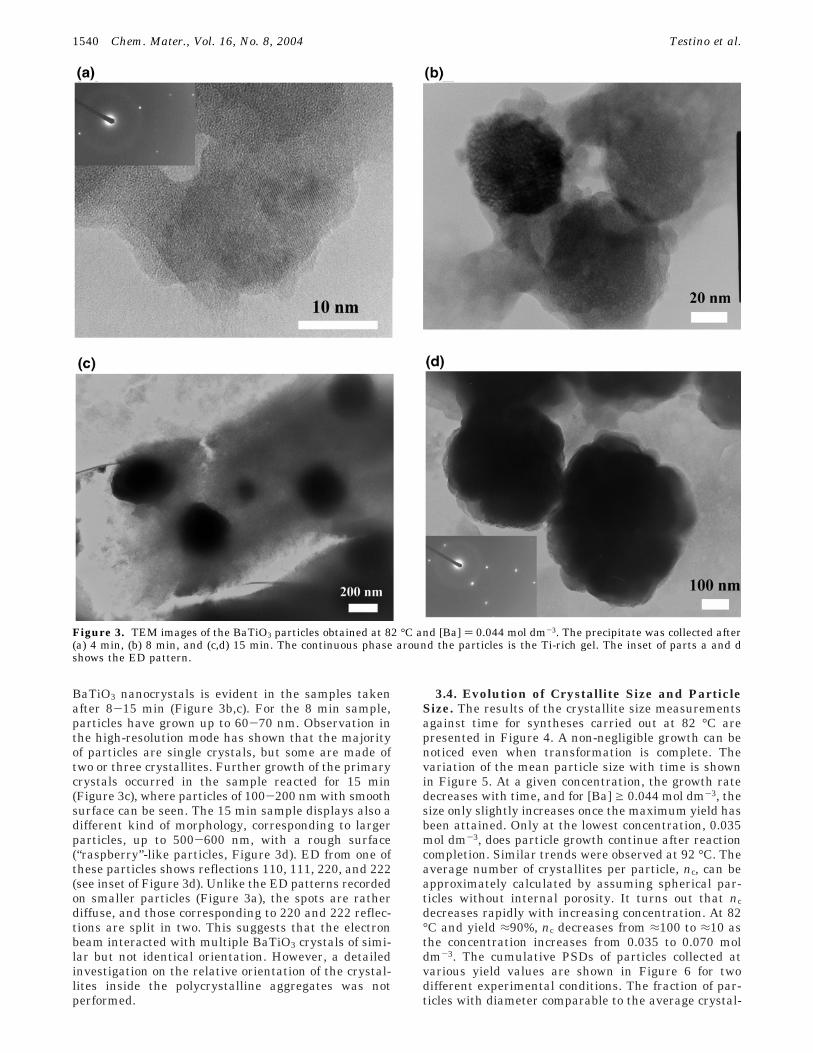
BaTiO3 nanocrystals is evident in the samples takenafter 8-15 min (Figure 3b,c). For the 8 min sample,particles have grown up to 60-70 nm. Observation inthe high-resolution mode has shown that the majorityof particles are single crystals, but some are made oftwo or three crystallites. Further growth of the primarycrystals occurred in the sample reacted for 15 min(Figure 3c), where particles of 100-200 nm with smoothsurface can be seen. The 15 min sample displays also adifferent kind of morphology, corresponding to largerparticles, up to 500-600 nm, with a rough surface(“raspberry”-like particles, Figure 3d). ED from one ofthese particles shows reflections 110, 111, 220, and 222(see inset of Figure 3d). Unlike the ED patterns recordedon smaller particles (Figure 3a), the spots are ratherdiffuse, and those corresponding to 220 and 222 reflec-tions are split in two. This suggests that the electronbeam interacted with multiple BaTiO3 crystals of simi-lar but not identical orientation. However, a detailedinvestigation on the relative orientation of the crystal-lites inside the polycrystalline aggregates was notperformed.
3.4. Evolution of Crystallite Size and ParticleSize. The results of the crystallite size measurementsagainst time for syntheses carried out at 82 °C arepresented in Figure 4. A non-negligible growth can benoticed even when transformation is complete. Thevariation of the mean particle size with time is shownin Figure 5. At a given concentration, the growth ratedecreases with time, and for [Ba] g 0.044 mol dm-3, thesize only slightly increases once the maximum yield hasbeen attained. Only at the lowest concentration, 0.035mol dm-3, does particle growth continue after reactioncompletion. Similar trends were observed at 92 °C. Theaverage number of crystallites per particle, nc, can beapproximately calculated by assuming spherical par-ticles without internal porosity. It turns out that ncdecreases rapidly with increasing concentration. At 82°C and yield ≈90%, nc decreases from ≈100 to ≈10 asthe concentration increases from 0.035 to 0.070 moldm-3. The cumulative PSDs of particles collected atvarious yield values are shown in Figure 6 for twodifferent experimental conditions. The fraction of par-ticles with diameter comparable to the average crystal-
Figure 3. TEM images of the BaTiO3 particles obtained at 82 °C and [Ba] ) 0.044 mol dm-3. The precipitate was collected after(a) 4 min, (b) 8 min, and (c,d) 15 min. The continuous phase around the particles is the Ti-rich gel. The inset of parts a and dshows the ED pattern.
1540 Chem. Mater., Vol. 16, No. 8, 2004 Testino et al.
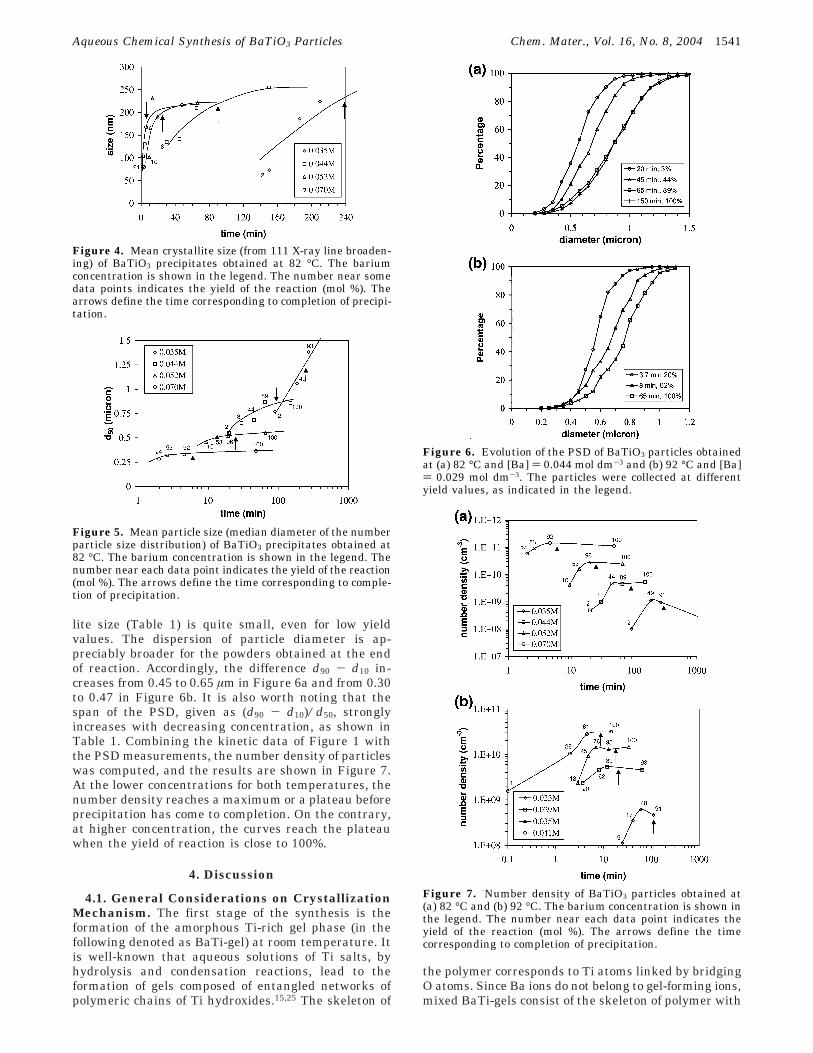
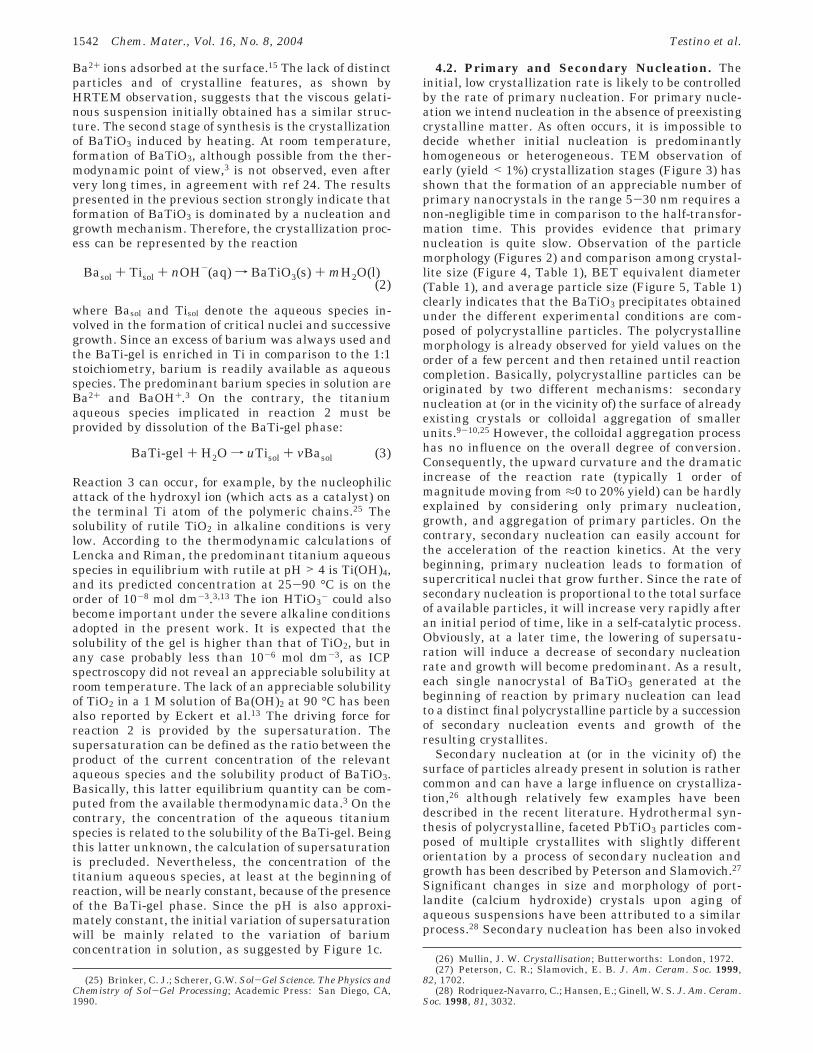
lite size (Table 1) is quite small, even for low yieldvalues. The dispersion of particle diameter is ap-preciably broader for the powders obtained at the endof reaction. Accordingly, the difference d90 - d10 in-creases from 0.45 to 0.65 µm in Figure 6a and from 0.30to 0.47 in Figure 6b. It is also worth noting that thespan of the PSD, given as (d90 - d10)/d50, stronglyincreases with decreasing concentration, as shown inTable 1. Combining the kinetic data of Figure 1 withthe PSD measurements, the number density of particleswas computed, and the results are shown in Figure 7.At the lower concentrations for both temperatures, thenumber density reaches a maximum or a plateau beforeprecipitation has come to completion. On the contrary,at higher concentration, the curves reach the plateauwhen the yield of reaction is close to 100%.
4. Discussion
4.1. General Considerations on CrystallizationMechanism. The first stage of the synthesis is theformation of the amorphous Ti-rich gel phase (in thefollowing denoted as BaTi-gel) at room temperature. Itis well-known that aqueous solutions of Ti salts, byhydrolysis and condensation reactions, lead to theformation of gels composed of entangled networks ofpolymeric chains of Ti hydroxides.15,25 The skeleton of
the polymer corresponds to Ti atoms linked by bridgingO atoms. Since Ba ions do not belong to gel-forming ions,mixed BaTi-gels consist of the skeleton of polymer with
Figure 4. Mean crystallite size (from 111 X-ray line broaden-ing) of BaTiO3 precipitates obtained at 82 °C. The bariumconcentration is shown in the legend. The number near somedata points indicates the yield of the reaction (mol %). Thearrows define the time corresponding to completion of precipi-tation.
Figure 5. Mean particle size (median diameter of the numberparticle size distribution) of BaTiO3 precipitates obtained at82 °C. The barium concentration is shown in the legend. Thenumber near each data point indicates the yield of the reaction(mol %). The arrows define the time corresponding to comple-tion of precipitation.
Figure 6. Evolution of the PSD of BaTiO3 particles obtainedat (a) 82 °C and [Ba] ) 0.044 mol dm-3 and (b) 92 °C and [Ba]) 0.029 mol dm-3. The particles were collected at differentyield values, as indicated in the legend.
Figure 7. Number density of BaTiO3 particles obtained at(a) 82 °C and (b) 92 °C. The barium concentration is shown inthe legend. The number near each data point indicates theyield of the reaction (mol %). The arrows define the timecorresponding to completion of precipitation.
Aqueous Chemical Synthesis of BaTiO3 Particles Chem. Mater., Vol. 16, No. 8, 2004 1541
Ba2+ ions adsorbed at the surface.15 The lack of distinctparticles and of crystalline features, as shown byHRTEM observation, suggests that the viscous gelati-nous suspension initially obtained has a similar struc-ture. The second stage of synthesis is the crystallizationof BaTiO3 induced by heating. At room temperature,formation of BaTiO3, although possible from the ther-modynamic point of view,3 is not observed, even aftervery long times, in agreement with ref 24. The resultspresented in the previous section strongly indicate thatformation of BaTiO3 is dominated by a nucleation andgrowth mechanism. Therefore, the crystallization proc-ess can be represented by the reaction
where Basol and Tisol denote the aqueous species in-volved in the formation of critical nuclei and successivegrowth. Since an excess of barium was always used andthe BaTi-gel is enriched in Ti in comparison to the 1:1stoichiometry, barium is readily available as aqueousspecies. The predominant barium species in solution areBa2+ and BaOH+.3 On the contrary, the titaniumaqueous species implicated in reaction 2 must beprovided by dissolution of the BaTi-gel phase:
Reaction 3 can occur, for example, by the nucleophilicattack of the hydroxyl ion (which acts as a catalyst) onthe terminal Ti atom of the polymeric chains.25 Thesolubility of rutile TiO2 in alkaline conditions is verylow. According to the thermodynamic calculations ofLencka and Riman, the predominant titanium aqueousspecies in equilibrium with rutile at pH > 4 is Ti(OH)4,and its predicted concentration at 25-90 °C is on theorder of 10-8 mol dm-3.3,13 The ion HTiO3
- could alsobecome important under the severe alkaline conditionsadopted in the present work. It is expected that thesolubility of the gel is higher than that of TiO2, but inany case probably less than 10-6 mol dm-3, as ICPspectroscopy did not reveal an appreciable solubility atroom temperature. The lack of an appreciable solubilityof TiO2 in a 1 M solution of Ba(OH)2 at 90 °C has beenalso reported by Eckert et al.13 The driving force forreaction 2 is provided by the supersaturation. Thesupersaturation can be defined as the ratio between theproduct of the current concentration of the relevantaqueous species and the solubility product of BaTiO3.Basically, this latter equilibrium quantity can be com-puted from the available thermodynamic data.3 On thecontrary, the concentration of the aqueous titaniumspecies is related to the solubility of the BaTi-gel. Beingthis latter unknown, the calculation of supersaturationis precluded. Nevertheless, the concentration of thetitanium aqueous species, at least at the beginning ofreaction, will be nearly constant, because of the presenceof the BaTi-gel phase. Since the pH is also approxi-mately constant, the initial variation of supersaturationwill be mainly related to the variation of bariumconcentration in solution, as suggested by Figure 1c.
4.2. Primary and Secondary Nucleation. Theinitial, low crystallization rate is likely to be controlledby the rate of primary nucleation. For primary nucle-ation we intend nucleation in the absence of preexistingcrystalline matter. As often occurs, it is impossible todecide whether initial nucleation is predominantlyhomogeneous or heterogeneous. TEM observation ofearly (yield < 1%) crystallization stages (Figure 3) hasshown that the formation of an appreciable number ofprimary nanocrystals in the range 5-30 nm requires anon-negligible time in comparison to the half-transfor-mation time. This provides evidence that primarynucleation is quite slow. Observation of the particlemorphology (Figures 2) and comparison among crystal-lite size (Figure 4, Table 1), BET equivalent diameter(Table 1), and average particle size (Figure 5, Table 1)clearly indicates that the BaTiO3 precipitates obtainedunder the different experimental conditions are com-posed of polycrystalline particles. The polycrystallinemorphology is already observed for yield values on theorder of a few percent and then retained until reactioncompletion. Basically, polycrystalline particles can beoriginated by two different mechanisms: secondarynucleation at (or in the vicinity of) the surface of alreadyexisting crystals or colloidal aggregation of smallerunits.9-10,25 However, the colloidal aggregation processhas no influence on the overall degree of conversion.Consequently, the upward curvature and the dramaticincrease of the reaction rate (typically 1 order ofmagnitude moving from ≈0 to 20% yield) can be hardlyexplained by considering only primary nucleation,growth, and aggregation of primary particles. On thecontrary, secondary nucleation can easily account forthe acceleration of the reaction kinetics. At the verybeginning, primary nucleation leads to formation ofsupercritical nuclei that grow further. Since the rate ofsecondary nucleation is proportional to the total surfaceof available particles, it will increase very rapidly afteran initial period of time, like in a self-catalytic process.Obviously, at a later time, the lowering of supersatu-ration will induce a decrease of secondary nucleationrate and growth will become predominant. As a result,each single nanocrystal of BaTiO3 generated at thebeginning of reaction by primary nucleation can leadto a distinct final polycrystalline particle by a successionof secondary nucleation events and growth of theresulting crystallites.
Secondary nucleation at (or in the vicinity of) thesurface of particles already present in solution is rathercommon and can have a large influence on crystalliza-tion,26 although relatively few examples have beendescribed in the recent literature. Hydrothermal syn-thesis of polycrystalline, faceted PbTiO3 particles com-posed of multiple crystallites with slightly differentorientation by a process of secondary nucleation andgrowth has been described by Peterson and Slamovich.27
Significant changes in size and morphology of port-landite (calcium hydroxide) crystals upon aging ofaqueous suspensions have been attributed to a similarprocess.28 Secondary nucleation has been also invoked
(25) Brinker, C. J.; Scherer, G.W. Sol-Gel Science. The Physics andChemistry of Sol-Gel Processing; Academic Press: San Diego, CA,1990.
(26) Mullin, J. W. Crystallisation; Butterworths: London, 1972.(27) Peterson, C. R.; Slamovich, E. B. J. Am. Ceram. Soc. 1999,
82, 1702.(28) Rodriquez-Navarro, C.; Hansen, E.; Ginell, W. S. J. Am. Ceram.
Soc. 1998, 81, 3032.
Basol + Tisol + nOH-(aq) f BaTiO3(s) + mH2O(l)(2)
BaTi-gel + H2O f uTisol + vBasol (3)
1542 Chem. Mater., Vol. 16, No. 8, 2004 Testino et al.
to explain the development of polycrystalline particleswith unusual morphologies or complex structures.29-31
4.3. Growth. The number density of particles re-mains almost constant or even decreases once thedegree of transformation exceeds 50% (see Figure 7).This is an indication that the second stage of reactionis dominated by the growth of the crystallites nucleated(and grown to some extent) during the first stage.Likely, the crystals at the surface of the aggregates growmuch faster than those in the interior, because theyhave surfaces directly exposed to solvent. However, theresults of BET measurements (Table 1) suggest that thesolvent and the aqueous species involved in growth canhave access to a fraction of the inner surfaces of theaggregate, and therefore, a solvent-mediated recrystal-lization process of the whole aggregate cannot beexcluded. It is well-known that a variation of super-saturation can induce a modification of crystal habit,because the growth rate of different surfaces can bedifferently influenced by concentration.9 Previous stud-ies on the synthesis of BaTiO3 from Ba(OH)2 solutionsat 90 °C reported a variation of particle morphologyfrom spherical or cubic to octahedral with decreasingconcentration.20,22 Thus, the tendency to develop den-dritic-like morphologies at low concentration (Figure 2)can be possibly ascribed to preferential growth alongsome directions or preferred secondary nucleation onspecific faces.
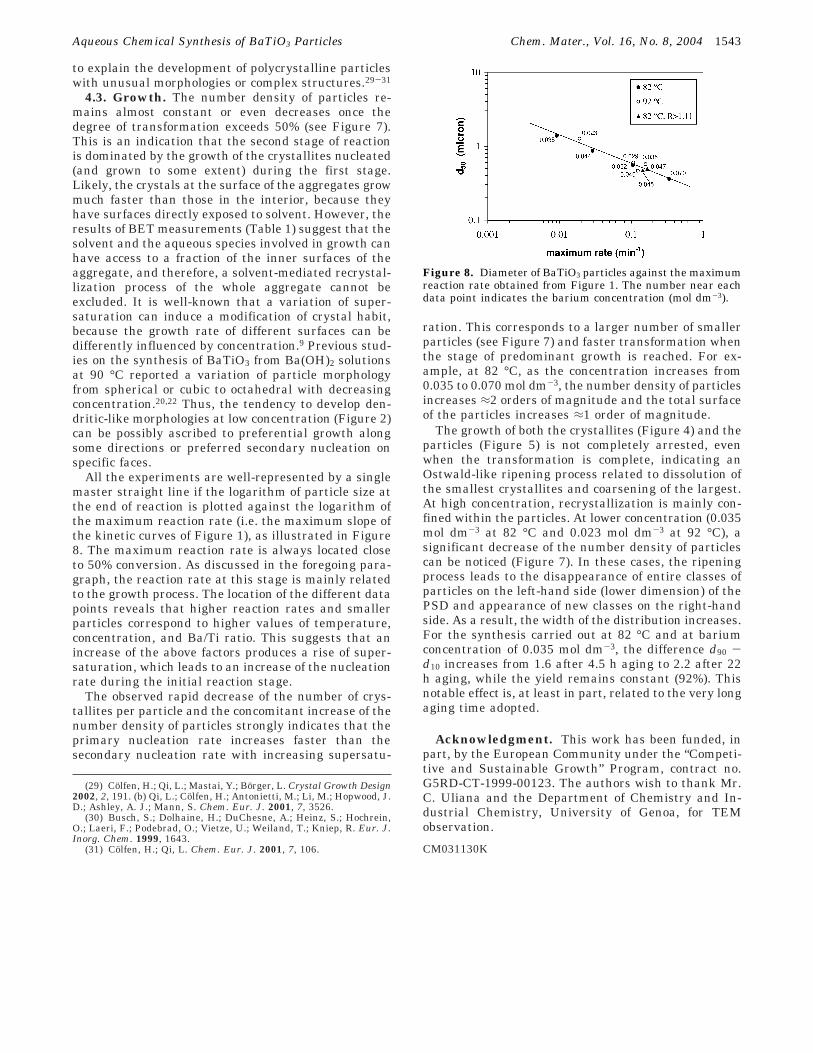
All the experiments are well-represented by a singlemaster straight line if the logarithm of particle size atthe end of reaction is plotted against the logarithm ofthe maximum reaction rate (i.e. the maximum slope ofthe kinetic curves of Figure 1), as illustrated in Figure8. The maximum reaction rate is always located closeto 50% conversion. As discussed in the foregoing para-graph, the reaction rate at this stage is mainly relatedto the growth process. The location of the different datapoints reveals that higher reaction rates and smallerparticles correspond to higher values of temperature,concentration, and Ba/Ti ratio. This suggests that anincrease of the above factors produces a rise of super-saturation, which leads to an increase of the nucleationrate during the initial reaction stage.
The observed rapid decrease of the number of crys-tallites per particle and the concomitant increase of thenumber density of particles strongly indicates that theprimary nucleation rate increases faster than thesecondary nucleation rate with increasing supersatu-
ration. This corresponds to a larger number of smallerparticles (see Figure 7) and faster transformation whenthe stage of predominant growth is reached. For ex-ample, at 82 °C, as the concentration increases from0.035 to 0.070 mol dm-3, the number density of particlesincreases ≈2 orders of magnitude and the total surfaceof the particles increases ≈1 order of magnitude.
The growth of both the crystallites (Figure 4) and theparticles (Figure 5) is not completely arrested, evenwhen the transformation is complete, indicating anOstwald-like ripening process related to dissolution ofthe smallest crystallites and coarsening of the largest.At high concentration, recrystallization is mainly con-fined within the particles. At lower concentration (0.035mol dm-3 at 82 °C and 0.023 mol dm-3 at 92 °C), asignificant decrease of the number density of particlescan be noticed (Figure 7). In these cases, the ripeningprocess leads to the disappearance of entire classes ofparticles on the left-hand side (lower dimension) of thePSD and appearance of new classes on the right-handside. As a result, the width of the distribution increases.For the synthesis carried out at 82 °C and at bariumconcentration of 0.035 mol dm-3, the difference d90 -d10 increases from 1.6 after 4.5 h aging to 2.2 after 22h aging, while the yield remains constant (92%). Thisnotable effect is, at least in part, related to the very longaging time adopted.
Acknowledgment. This work has been funded, inpart, by the European Community under the “Competi-tive and Sustainable Growth” Program, contract no.G5RD-CT-1999-00123. The authors wish to thank Mr.C. Uliana and the Department of Chemistry and In-dustrial Chemistry, University of Genoa, for TEMobservation.
CM031130K
(29) Colfen, H.; Qi, L.; Mastai, Y.; Borger, L. Crystal Growth Design2002, 2, 191. (b) Qi, L.; Colfen, H.; Antonietti, M.; Li, M.; Hopwood, J.D.; Ashley, A. J.; Mann, S. Chem. Eur. J. 2001, 7, 3526.
(30) Busch, S.; Dolhaine, H.; DuChesne, A.; Heinz, S.; Hochrein,O.; Laeri, F.; Podebrad, O.; Vietze, U.; Weiland, T.; Kniep, R. Eur. J.Inorg. Chem. 1999, 1643.
(31) Colfen, H.; Qi, L. Chem. Eur. J. 2001, 7, 106.
Figure 8. Diameter of BaTiO3 particles against the maximumreaction rate obtained from Figure 1. The number near eachdata point indicates the barium concentration (mol dm-3).
Aqueous Chemical Synthesis of BaTiO3 Particles Chem. Mater., Vol. 16, No. 8, 2004 1543