kinetics of adsorption of cationic surfactants
DESCRIPTION
In the present chapter the study has been extended for kinetics of adsorption ofcationic surfactants at charcoal surface under various physicochemical conditions. From the temperatureeffect on the rate of adsorption, the values of energy of activation, enthalpy of activation, entropy ofactivation and free energy of activation associated with different kinetic steps have been calculated.TRANSCRIPT

KINETICS OF ADSORPTION OF CATIONIC SURFACTANTS ATCHARCOAL-WATER INTERFACE
Chapter-5
KINETICS OF ADSORPTION OF CATIONIC SURFACTANTS ATCHARCOAL-WATER INTERFACE
Introduction
The equilibrium adsorption of fatty acids, nonionic, cationic and anionic surfactants at charcoal-
water interface has been investigated by different workers1-9. The extent of adsorption of several sodium
alkyl sulphate, quaternary ammonium compounds and nonionic compounds by carbon black are found to
reach limiting value close to the cmc of the surfactants5. Matel et al.7 have studied the adsorption of
cationic and anionic surfactants on activated wood charcoal in the presence of metallic ions and they have
found that hydrophobic rather than ionic interactions were mainly responsible for surfactant adsorption
onto activated charcoal. The extents of adsorption of anionic surfactants on wood charcoal have been
studied by Sugimura et al..8 Very recently Chattoraj et al9 have studied the adsorption of cationic
surfactants onto graphite and other surfaces from thermodynamic considerations. They have shown that the
orientation of surfactant molecules may change depending upon the polarity of solid surfaces.
Kinetics of adsorption of organic compounds on charcoal surface has been studied by many
workers.10-12 Kinetics of adsorption of polymers on charcoal has been investigated by Hobden et al13 and
others.14-16 Adsorption onto plane surface from dilute polymer solution appears to be governed by a kinetic
law similar to that proposed by Langmuir for adsorption of gases. Adsorption may also occur in two stages,
each stage being governed by the same general equation. This was found to be true in the adsorption of
polystyrene from methyl ethyl ketone by charcoal.13 Sometimes a break in the adsorption versus time plot
occurs and this was attributed to reorientation of the molecular layers first adsorbed, so leaving further
surface of the adsorbent or to migration of the layer initially adsorbed on the exterior of charcoal into the
pores. The rate of adsorption depends to a large extent on the molecular weight of the polymer.14 The study
on the kinetics of adsorption of surfactants on solid surfaces are rare.17-19 Recently, Tiberg et al20, 21 have
studied the kinetics of adsorption of nonionic surfactants at hydrophilic and hydrophobic silica surfaces.
In chapter 4, we have presented extensive data on kinetics of adsorption of cationic surfactants at
hydrophilic silica surface. In the present chapter the study has been extended for kinetics of adsorption of
cationic surfactants at charcoal surface under various physicochemical conditions. From the temperature
effect on the rate of adsorption, the values of energy of activation, enthalpy of activation, entropy of
activation and free energy of activation associated with different kinetic steps have been calculated.
Materials and Methods
Crystalline granular charcoal (C 2889, mess 8-20) was obtained from Sigma Chemicals Co.
U.S.A. The source, purity and the critical micellar concentration (cmc) of the cationic surfactants
cetyltrimethyl ammonium bromide (CTAB), myristyltrimethyl ammonium bromide (MTAB) and
(110)
dodecyltrimethyl ammonium bromide (DTAB) used in the present study are reported in chapter 2. The
common electrolytes and acids used were of analytical grade. Double distilled water was used althrough the
experimental work.
Before use, the charcoal was washed several times with distilled water. The wet solid was then
dried at 350ºC for eight hours till a constant weight was attained. Dried mass was then kept in a desiccator
over anhydrous CaCl2. The specific surface area (A) of charcoal was determined by acetic acid adsorption
from aqueous solution. The details of the experimental method were described elsewhere.22 The average
specific surface area of charcoal was found to be 63.8 ± 0.5 square meters per gram of charcoal.
For the study of adsorption kinetics, in a set of standard joint stoppered conical flasks (capacity
100 ml) a definite amount W (equal to 2.0 × 10⁻⁴ kg) of dried charcoal was taken into each flask. A definite
volume V (equal to 20 ml) of surfactant solution of known concentration ( tC2 ) prepared in a solvent of
fixed pH and ionic strength was added into each flask. The time of addition was noted with the help of a
stop watch. The flasks were then shaken gently on a horizontal shaker at constant temperature. At different
intervals of time, the flasks were taken away one by one from the shaker and the supernatant solutions were
collected in different test tubes. The concentration of the surfactant (C2) in the supernant collected at
different time interval was then estimated by the dye partition technique23 using disulphine blue (200 mg/lit
in N/50 H2SO4) with chloroform as the organic solvent. The details of the experimental method have been
described in chapter 2.
The moles of surfactant ( 12Γ ) adsorbed per square meter of charcoal at time t was then calculated
using the relation 5.1
1000
)(1000
)( 222212
ttt VCCWA
VCC −≈
−=Γ (5.1)
Here Vt stands for the volume of solution per square meter of solid surface and is equal to V/WA.
The values of equilibrium adsorption ( e2Γ ) was estimated by shaking a definite volume V (equal
to 20 ml) of the surfactant solution of concentration tC2 with a definite amount, W (equal to 2.0 × 10⁻⁴ kg)
of charcoal for 24 hours and then the flask was kept undisturbed for another 8 hours. The equilibrium
concentration ( eC2 ) of the surfactant was estimated using dye partition technique25 mentioned earlier. The
value of e2Γ was calculated using equation 5.1 replacing C2 by eC2 . The standard error in the measurement
of 12Γ for four identical sets was found to be 4 to 5%. The errors are graphically shown in Fig. 5.1.
Results and Discussion
(111)
Fig. 5.1 to 5.4 shows the time dependence of the extent of adsorption ( 12Γ ) of surfactant on the surface of
charcoal at different physicochemical conditions. In fig 5.1 the plot of 12Γ against time t for different values
of initial concentration ( tC2 ) below and above cmc of CTAB are compared. One finds from this figure that
below cmc, 12Γ at constant tC2 increases slowly with t until the equilibrium value e
2Γ is reached. The
values of e2Γ for different systems are presented in tables 5.1 and 5.2. Values of e
2Γ for adsorption at
charcoal-water interface are found to be 1.6 to 2.0 times higher than those for adsorption at silica-water
interface (vide chapter 4).
Following a non-linear least square fitting routine using equation 4.2 (vide Fig. 5.5), the values of
kinetic rate constants k1 and k2 associated with different kinetic steps in surfactant-charcoal interaction are
calculated. These values of k1 and k2 for different systems ate presented in tables 5.1 and 5.2.
Again as mention in the case of adsorption of surfactant at silica-water interface, the rate of
adsorption of surfactant at charcoal-water interface can alternatively be represented by equation 4.3. The
plot of �ln [ e2Γ - 1
2Γ ] against time (vide Fig. 5.6) gives two straight lines with two slopes (k1 and k2) and
two intercepts. The values of k1 and k2 obtained from non-linear least square fitting routine are found to be
identical with those calculated from the slope of [ ]122ln Γ−Γ− e vs t plot.
One finds from table 5.1 that k1 below cmc of CTAB is high at tC2 equal to 0.15 mM but its value
decreases as concentration of CTAB increases from 0.15 mM to 0.60 mM. Similar observation has also
been noted for adsorption of CTAB at silica-water interface (vide chapter 4). But values of k1 for
adsorption of CTAB at silica-water interface are 3 to 5 times higher than that for adsorption at hydrophobic
charcoal surface. As pointed out earlier, the decrease in the value of k1 indicates that as tC2 approaches the
value of cmc of CTAB (0.89 mM), there is increasing tendency for hydrophobic association of surfactant
molecules near the surface in the premicellar region. Finally, at and above cmc, k1 decreases at a slower
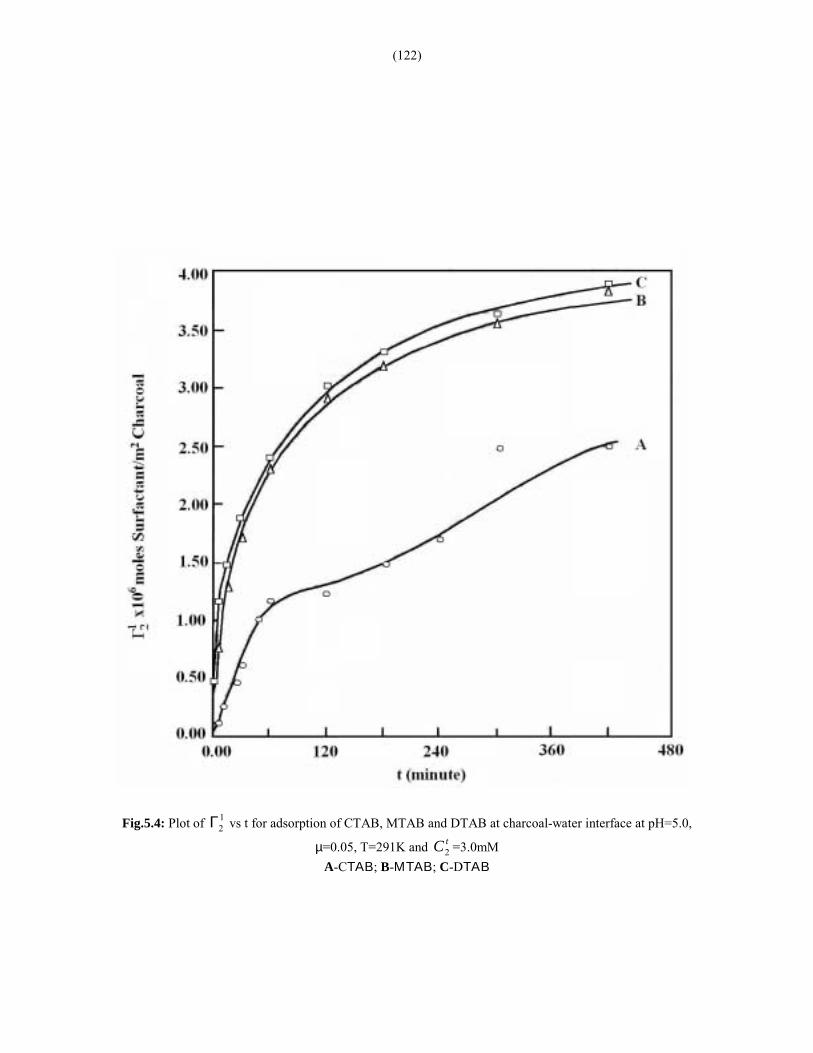
rate (vide Fig. 5.7) as concentration of surfactant increases. One also notes that at tC2 equal to 3.0 mM
concentration k1 for CTAB, MTAB and DTAB are 0.011, 0.026 and 0.058 min-1 respectively at pH 5.0,
ionic strength 0.05 and at 301°K. This means that hydrophobic effect of surfactant molecule at the interface
is highest for CTAB above its cmc but it increases for MTAB having cmc 3.4 mM and DTAB of cmc 13.3
mM.
The value of k2 below cmc decreases sharply when tC2 approaches the bulk cmc of CTAB (vide
Fig. 5.7 and table 5.1). At and above cmc variation of k2 with tC2 becomes slower. One notes that the
values of k2 are several times lower than the values of k1. k2 is related to the compact packing of surfactant
molecule bound to the active spots by breaking of chemical bonds and reorientation of these possibly due to
surface micellisation.
(112)
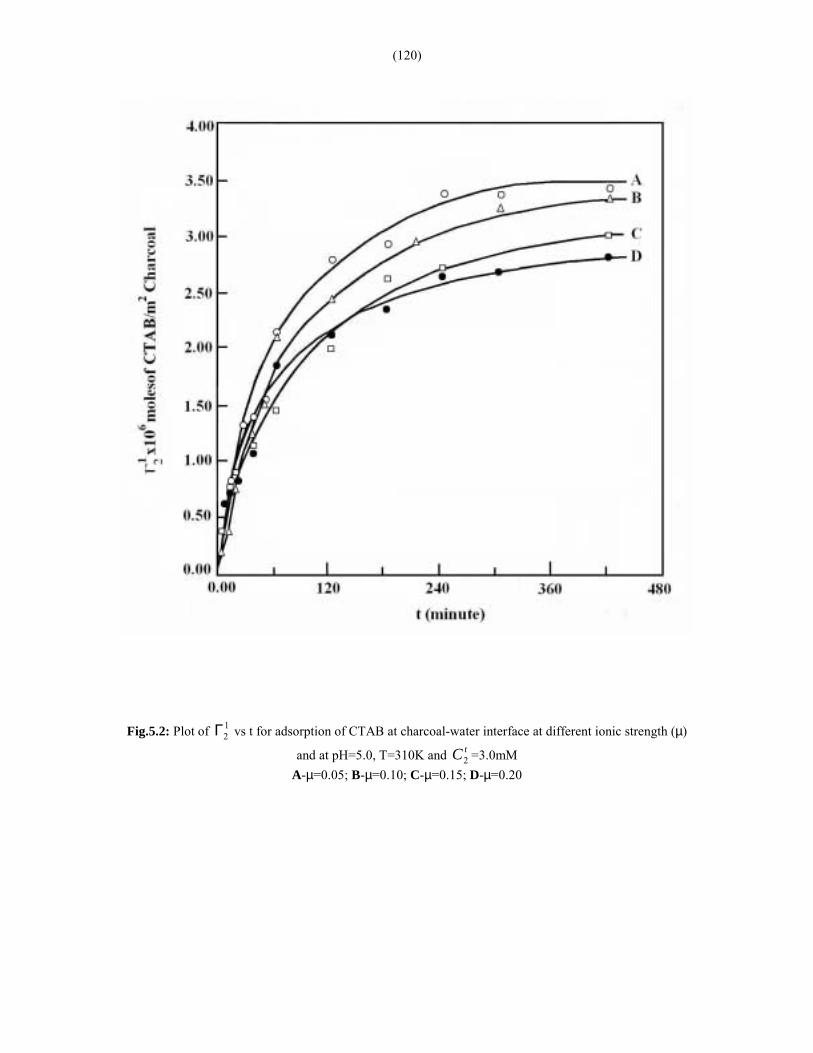
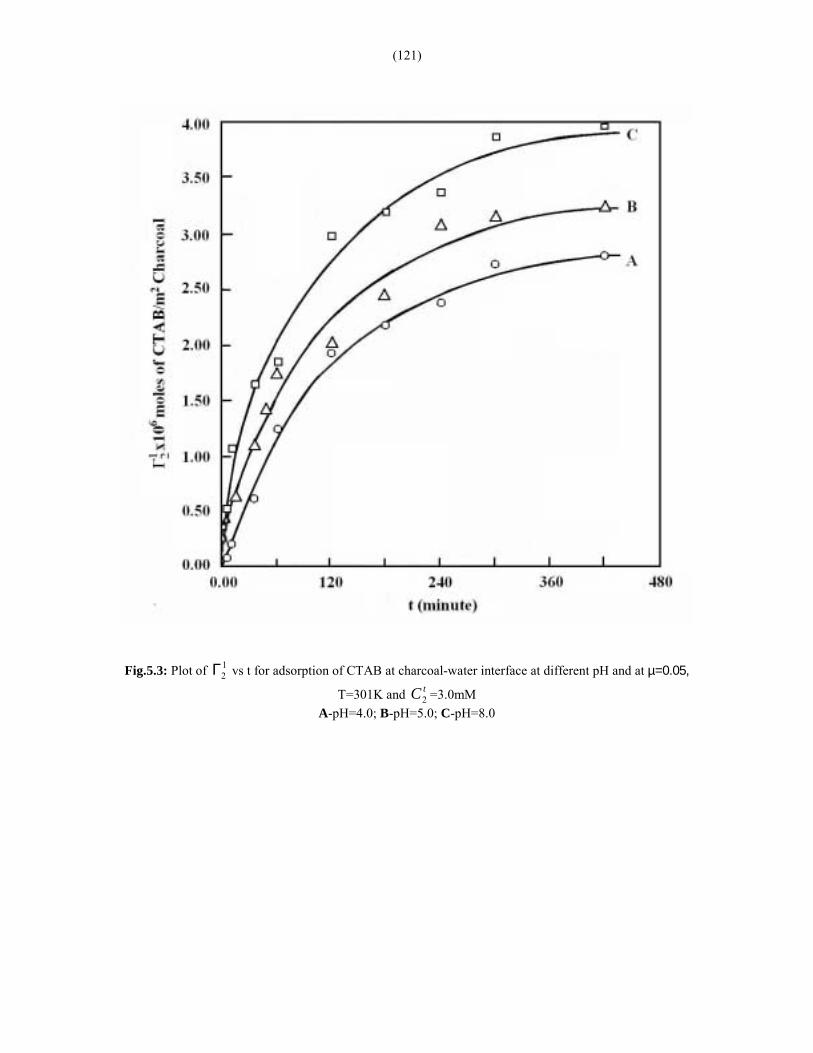
From table 5.2, one notes that for initial concentration of CTAB equal to 3.0 mM (i.e. above its
cmc) at pH 5.0 and at 301°K, k1 is observed to increase from 0.082 to 0.095 min-1 for increase of ionic
strength of the medium from 0.05 to 0.20. For the change of pH from 4.0 to 8.0 at 301°K and ionic strength
0.05, the value of k1 increases from 0.06 to 0.19 min-1 (vide table 5.2). These effects of pH and ionic
strength on the value of k1 above the cmc of CTAB may be related to the change of the shape, aggregation
number, cmc values of CTAB micelle in the bulk so that the extent of dissociation of monomers from
micelle alters in a complex manner. The values of k2 is also found to depend upon the pH and ionic strength
of the medium.
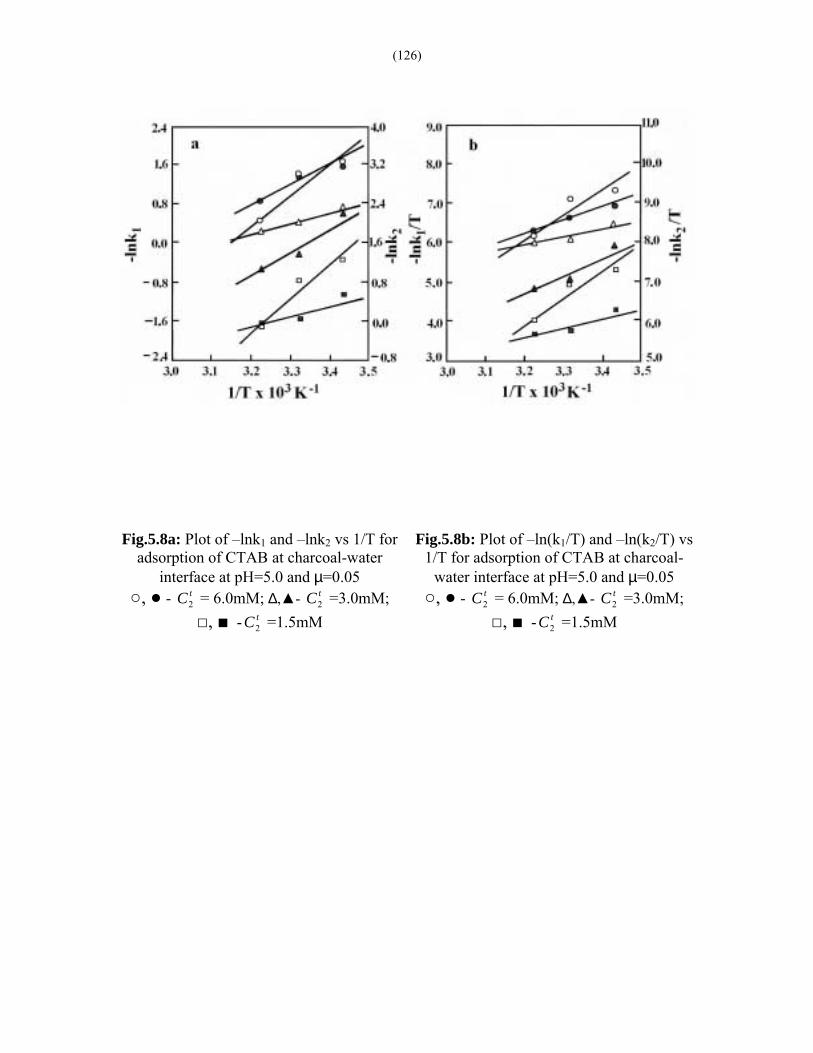
From tables 5.1 and 5.2 one notes that both values of k1 and k2 increase with increase of
temperature, so that using Arrhenius equation, the energies of activation 1aE and 2aE for both the kinetic
steps can be calculated from the slope of the linear plot of �lnk1 and �lnk2 against T1
(vide Fig. 5.8a).
These values of 1aE and 2aE are included in table 5.3.
From table 5.3, one notes that the value of 1aE increases from 15.3 to 44.3 KJ/mole when CTAB
concentration ( tC2 ) increases from 0.15 mM to 0.60 mM below cmc. But the value of 2aE , below cmc of
CTAB is found to decrease with increase in the value of tC2 . Both the values of 1aE and 2aE are found to
decrease with decrease in the number of −− 2CH groups in the hydrocarbon tail part of surfactant
molecule.
One also notes from table 5.3, the values of 1aE and 2aE vary in an irregular fasion with
concentration of CTAB ( tC2 ) above the cmc. There is also significant effect of pH and ionic strength on
the values of 1aE and 2aE . The rate constants k1 and k2 determined at different temperatures are found to
fit in the Eyring equation 4.5 (vide Fig. 5.8b). The values of enthalpy of activation ( #1H∆ and #
2H∆ ) and
entropy of activation ( #1S∆ and #
2S∆ ) for both the kinetic steps have been calculated from the slope and
intercept of T
k1ln− and
Tk2ln−
against T1
(vide fig. 5.8b). These are presented in table 5.3 for
different systems studied.
One finds from table 5.3 that below the cmc of CTAB, the value of #1H∆ increases gradually
with increase in the value of concentration of CTAB ( tC2 ) and the value of #2H∆ is observed to decrease
with increase in the value of tC2 . The values of #1H∆ and #
2H∆ are found to decrease considerably with
decrease of the number of −− 2CH groups in the hydrocarbon, tail part of surfactant molecule.
(113)
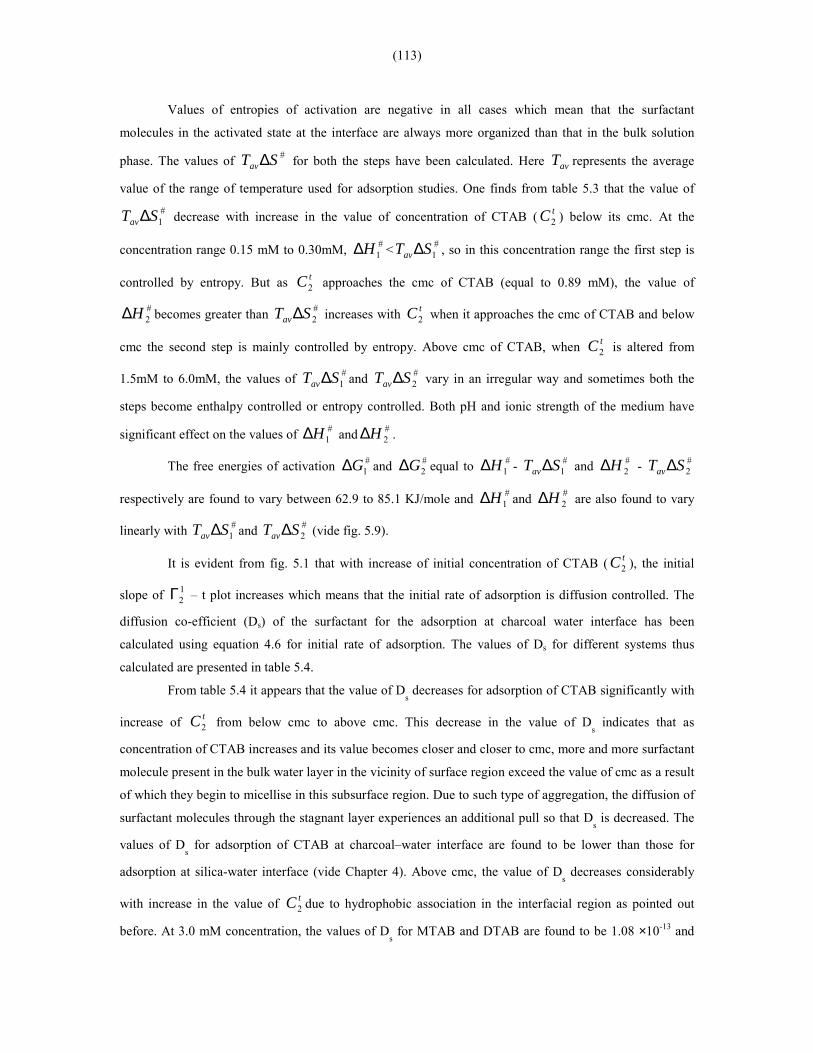
Values of entropies of activation are negative in all cases which mean that the surfactant
molecules in the activated state at the interface are always more organized than that in the bulk solution
phase. The values of #STav∆ for both the steps have been calculated. Here avT represents the average
value of the range of temperature used for adsorption studies. One finds from table 5.3 that the value of#
1STav∆ decrease with increase in the value of concentration of CTAB ( tC2 ) below its cmc. At the
concentration range 0.15 mM to 0.30mM, #1H∆ < #
1STav∆ , so in this concentration range the first step is
controlled by entropy. But as tC2 approaches the cmc of CTAB (equal to 0.89 mM), the value of
#2H∆ becomes greater than #
2STav∆ increases with tC2 when it approaches the cmc of CTAB and below
cmc the second step is mainly controlled by entropy. Above cmc of CTAB, when tC2 is altered from
1.5mM to 6.0mM, the values of #1STav∆ and #
2STav∆ vary in an irregular way and sometimes both the
steps become enthalpy controlled or entropy controlled. Both pH and ionic strength of the medium have
significant effect on the values of #1H∆ and #
2H∆ .
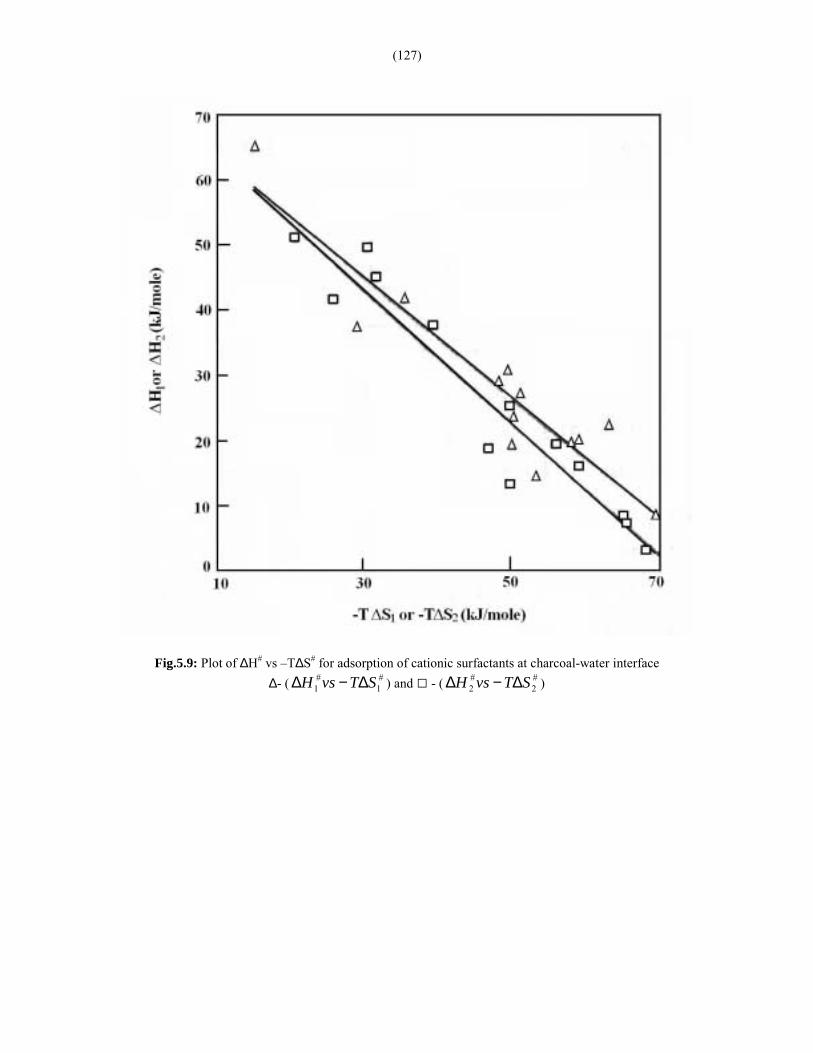
The free energies of activation #1G∆ and #
2G∆ equal to #1H∆ - #
1STav∆ and #2H∆ - #
2STav∆
respectively are found to vary between 62.9 to 85.1 KJ/mole and #1H∆ and #
2H∆ are also found to vary
linearly with #1STav∆ and #
2STav∆ (vide fig. 5.9).
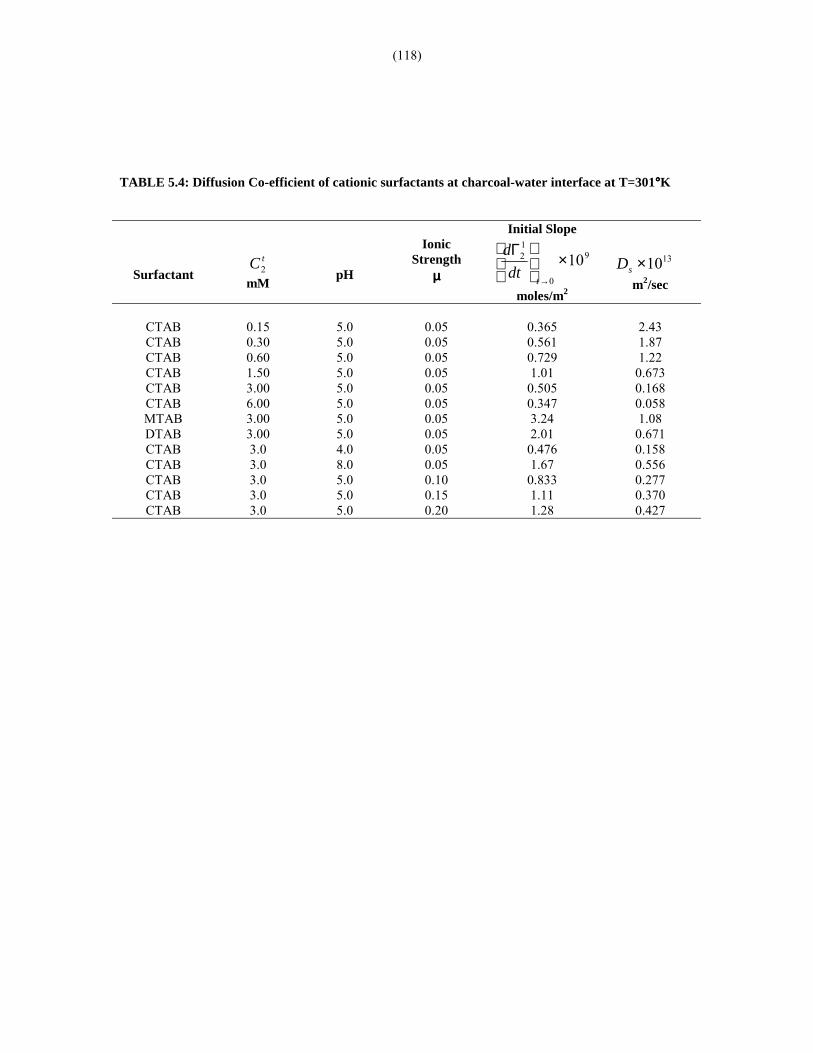
It is evident from fig. 5.1 that with increase of initial concentration of CTAB ( tC2 ), the initial
slope of 12Γ � t plot increases which means that the initial rate of adsorption is diffusion controlled. The
diffusion co-efficient (Ds) of the surfactant for the adsorption at charcoal water interface has been
calculated using equation 4.6 for initial rate of adsorption. The values of Ds for different systems thus
calculated are presented in table 5.4.
From table 5.4 it appears that the value of Ds decreases for adsorption of CTAB significantly with
increase of tC2 from below cmc to above cmc. This decrease in the value of Ds indicates that as
concentration of CTAB increases and its value becomes closer and closer to cmc, more and more surfactant
molecule present in the bulk water layer in the vicinity of surface region exceed the value of cmc as a result
of which they begin to micellise in this subsurface region. Due to such type of aggregation, the diffusion of
surfactant molecules through the stagnant layer experiences an additional pull so that Ds is decreased. The
values of Ds for adsorption of CTAB at charcoal�water interface are found to be lower than those for
adsorption at silica-water interface (vide Chapter 4). Above cmc, the value of Ds decreases considerably
with increase in the value of tC2 due to hydrophobic association in the interfacial region as pointed out
before. At 3.0 mM concentration, the values of Ds for MTAB and DTAB are found to be 1.08 ×10⁻¹³ and

(114)
0.671 ×10⁻¹³m2/sec respectively, which are considerably lower than the value of Ds for CTAB below its
cmc. Thus with decrease in the length of hydrocarbon chain of surfactant molecules the value of Ds
decreases. One also notes from table 5.4 that both pH and ionic strength have significant effect on the value
of Ds for CTAB above its cmc.
(115)
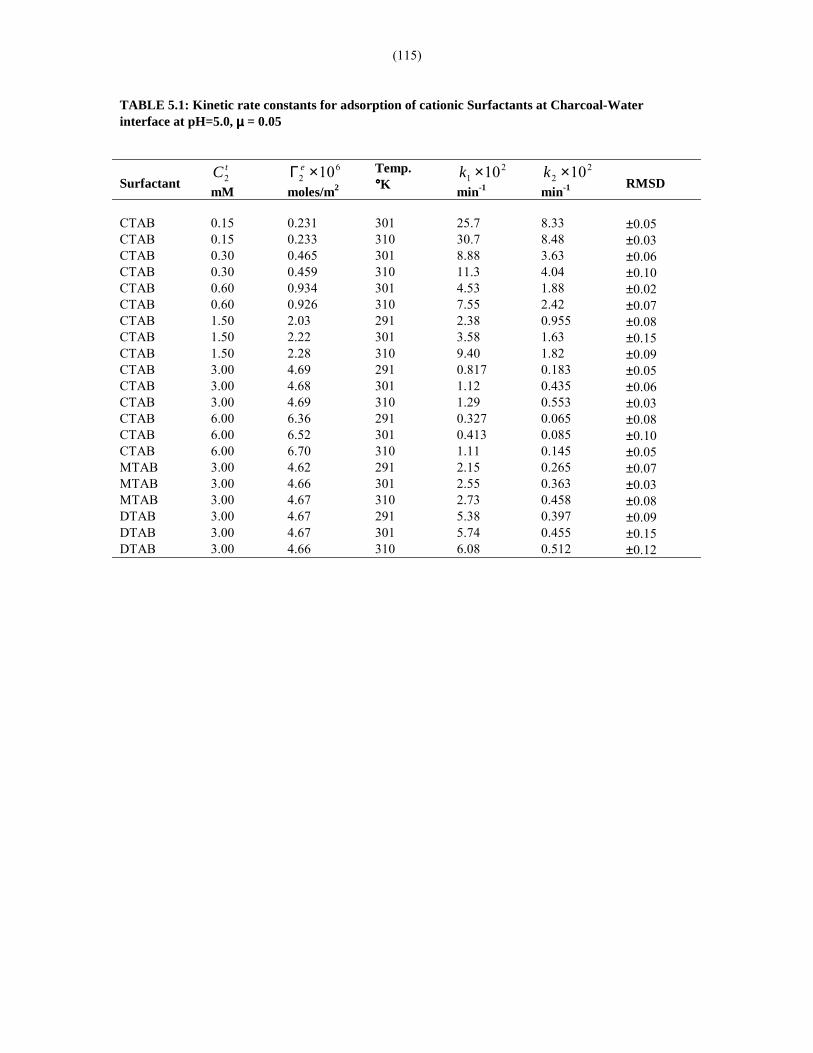
TABLE 5.1: Kinetic rate constants for adsorption of cationic Surfactants at Charcoal-Waterinterface at pH=5.0, µµµµ = 0.05
SurfactanttC2
mM
62 10×Γ e
moles/m2
Temp.°°°°K
21 10×k
min-1
22 10×k
min-1 RMSD
CTAB 0.15 0.231 301 25.7 8.33 ±0.05CTAB 0.15 0.233 310 30.7 8.48 ±0.03CTAB 0.30 0.465 301 8.88 3.63 ±0.06CTAB 0.30 0.459 310 11.3 4.04 ±0.10CTAB 0.60 0.934 301 4.53 1.88 ±0.02CTAB 0.60 0.926 310 7.55 2.42 ±0.07CTAB 1.50 2.03 291 2.38 0.955 ±0.08CTAB 1.50 2.22 301 3.58 1.63 ±0.15CTAB 1.50 2.28 310 9.40 1.82 ±0.09CTAB 3.00 4.69 291 0.817 0.183 ±0.05CTAB 3.00 4.68 301 1.12 0.435 ±0.06CTAB 3.00 4.69 310 1.29 0.553 ±0.03CTAB 6.00 6.36 291 0.327 0.065 ±0.08CTAB 6.00 6.52 301 0.413 0.085 ±0.10CTAB 6.00 6.70 310 1.11 0.145 ±0.05MTAB 3.00 4.62 291 2.15 0.265 ±0.07MTAB 3.00 4.66 301 2.55 0.363 ±0.03MTAB 3.00 4.67 310 2.73 0.458 ±0.08DTAB 3.00 4.67 291 5.38 0.397 ±0.09DTAB 3.00 4.67 301 5.74 0.455 ±0.15DTAB 3.00 4.66 310 6.08 0.512 ±0.12
(116)
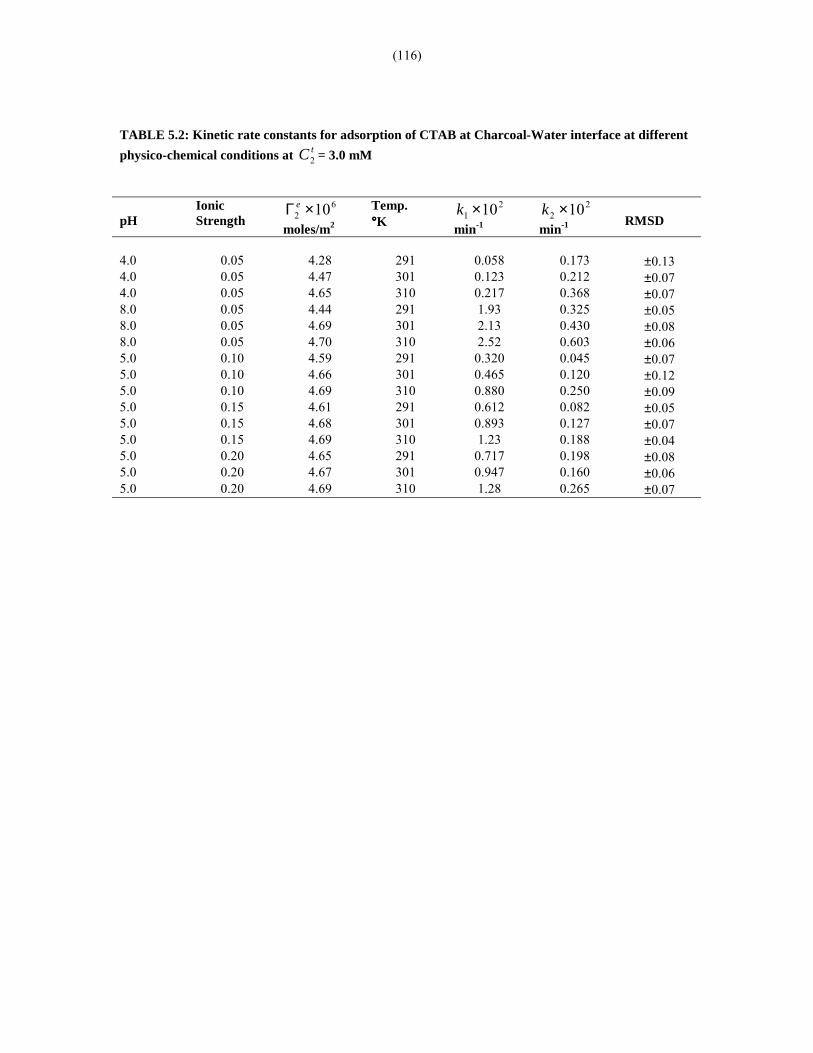
TABLE 5.2: Kinetic rate constants for adsorption of CTAB at Charcoal-Water interface at differentphysico-chemical conditions at tC2 = 3.0 mM
pHIonicStrength
62 10×Γ e
moles/m2
Temp.°°°°K
21 10×k
min-1
22 10×k
min-1 RMSD
4.0 0.05 4.28 291 0.058 0.173 ±0.134.0 0.05 4.47 301 0.123 0.212 ±0.074.0 0.05 4.65 310 0.217 0.368 ±0.078.0 0.05 4.44 291 1.93 0.325 ±0.058.0 0.05 4.69 301 2.13 0.430 ±0.088.0 0.05 4.70 310 2.52 0.603 ±0.065.0 0.10 4.59 291 0.320 0.045 ±0.075.0 0.10 4.66 301 0.465 0.120 ±0.125.0 0.10 4.69 310 0.880 0.250 ±0.095.0 0.15 4.61 291 0.612 0.082 ±0.055.0 0.15 4.68 301 0.893 0.127 ±0.075.0 0.15 4.69 310 1.23 0.188 ±0.045.0 0.20 4.65 291 0.717 0.198 ±0.085.0 0.20 4.67 301 0.947 0.160 ±0.065.0 0.20 4.69 310 1.28 0.265 ±0.07
(117)
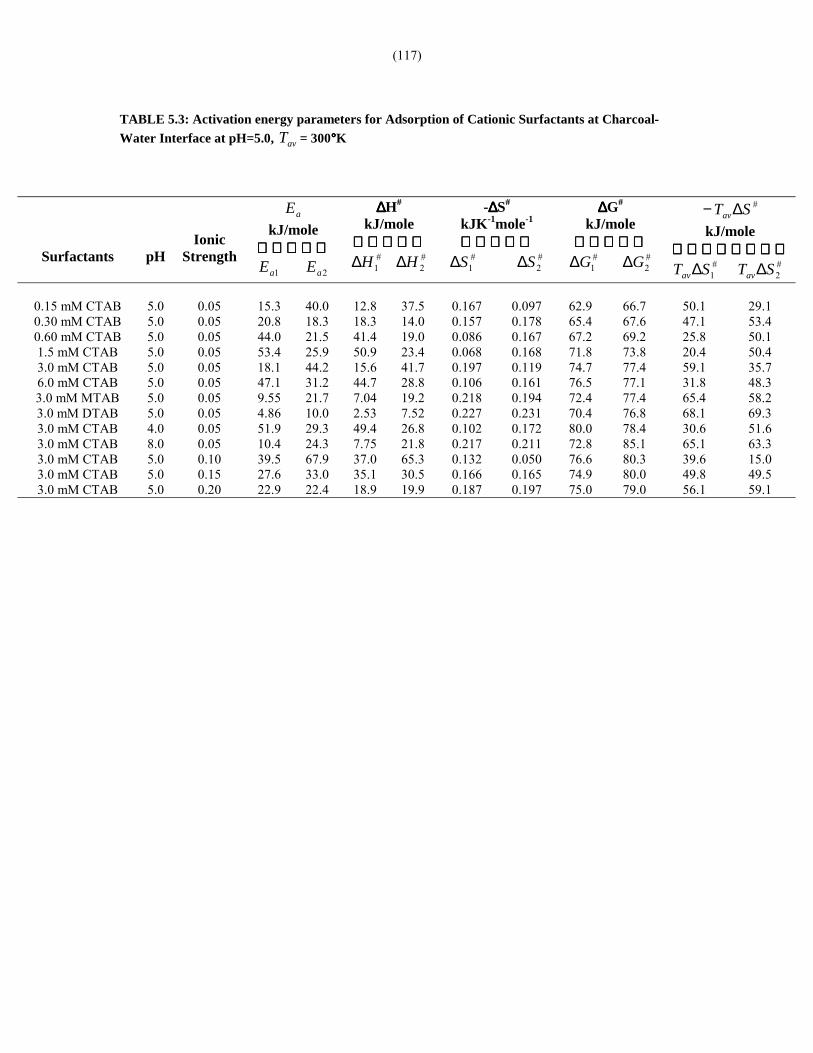
TABLE 5.3: Activation energy parameters for Adsorption of Cationic Surfactants at Charcoal-Water Interface at pH=5.0, avT = 300°°°°K
Surfactants pHIonic
Strength
aEkJ/mole
1aE 2aE
∆∆∆∆H#
kJ/mole
#1H∆ #
2H∆
-∆∆∆∆S#
kJK-1mole-1
#
1S∆ #2S∆
∆∆∆∆G#
kJ/mole
#1G∆ #
2G∆
#STav∆−kJ/mole
#
1STav∆ #2STav∆
0.15 mM CTAB 5.0 0.05 15.3 40.0 12.8 37.5 0.167 0.097 62.9 66.7 50.1 29.10.30 mM CTAB 5.0 0.05 20.8 18.3 18.3 14.0 0.157 0.178 65.4 67.6 47.1 53.40.60 mM CTAB 5.0 0.05 44.0 21.5 41.4 19.0 0.086 0.167 67.2 69.2 25.8 50.11.5 mM CTAB 5.0 0.05 53.4 25.9 50.9 23.4 0.068 0.168 71.8 73.8 20.4 50.43.0 mM CTAB 5.0 0.05 18.1 44.2 15.6 41.7 0.197 0.119 74.7 77.4 59.1 35.76.0 mM CTAB 5.0 0.05 47.1 31.2 44.7 28.8 0.106 0.161 76.5 77.1 31.8 48.33.0 mM MTAB 5.0 0.05 9.55 21.7 7.04 19.2 0.218 0.194 72.4 77.4 65.4 58.23.0 mM DTAB 5.0 0.05 4.86 10.0 2.53 7.52 0.227 0.231 70.4 76.8 68.1 69.33.0 mM CTAB 4.0 0.05 51.9 29.3 49.4 26.8 0.102 0.172 80.0 78.4 30.6 51.63.0 mM CTAB 8.0 0.05 10.4 24.3 7.75 21.8 0.217 0.211 72.8 85.1 65.1 63.33.0 mM CTAB 5.0 0.10 39.5 67.9 37.0 65.3 0.132 0.050 76.6 80.3 39.6 15.03.0 mM CTAB 5.0 0.15 27.6 33.0 35.1 30.5 0.166 0.165 74.9 80.0 49.8 49.53.0 mM CTAB 5.0 0.20 22.9 22.4 18.9 19.9 0.187 0.197 75.0 79.0 56.1 59.1
(118)
TABLE 5.4: Diffusion Co-efficient of cationic surfactants at charcoal-water interface at T=301°°°°K
SurfactanttC2
mM pH
IonicStrength
µµµµ
Initial Slope
9
0
12 10×
Γ
→tdt
d
moles/m2
1310×sDm2/sec
CTAB 0.15 5.0 0.05 0.365 2.43CTAB 0.30 5.0 0.05 0.561 1.87CTAB 0.60 5.0 0.05 0.729 1.22CTAB 1.50 5.0 0.05 1.01 0.673CTAB 3.00 5.0 0.05 0.505 0.168CTAB 6.00 5.0 0.05 0.347 0.058MTAB 3.00 5.0 0.05 3.24 1.08DTAB 3.00 5.0 0.05 2.01 0.671CTAB 3.0 4.0 0.05 0.476 0.158CTAB 3.0 8.0 0.05 1.67 0.556CTAB 3.0 5.0 0.10 0.833 0.277CTAB 3.0 5.0 0.15 1.11 0.370CTAB 3.0 5.0 0.20 1.28 0.427

(119)
Fig.5.1: Plot of 12Γ vs t for adsorption of CTAB at charcoal-water interface at pH=5.0,
µ=0.05 and T=301KA - tC2 =0.15mM; B - tC2 =0.30mM; C - tC2 =0.60mM; D - tC2 =1.5mM; E - tC2 =3.0mM;
F - tC2 =6.0mM
(120)
Fig.5.2: Plot of 12Γ vs t for adsorption of CTAB at charcoal-water interface at different ionic strength (µ)
and at pH=5.0, T=310K and tC2 =3.0mMA-µ=0.05; B-µ=0.10; C-µ=0.15; D-µ=0.20
(121)
Fig.5.3: Plot of 12Γ vs t for adsorption of CTAB at charcoal-water interface at different pH and at µ=0.05,
T=301K and tC2 =3.0mMA-pH=4.0; B-pH=5.0; C-pH=8.0
(122)
Fig.5.4: Plot of 12Γ vs t for adsorption of CTAB, MTAB and DTAB at charcoal-water interface at pH=5.0,
µ=0.05, T=291K and tC2 =3.0mMA-CΤΑΒ; B-ΜΤΑΒ ; C-DΤΑΒ
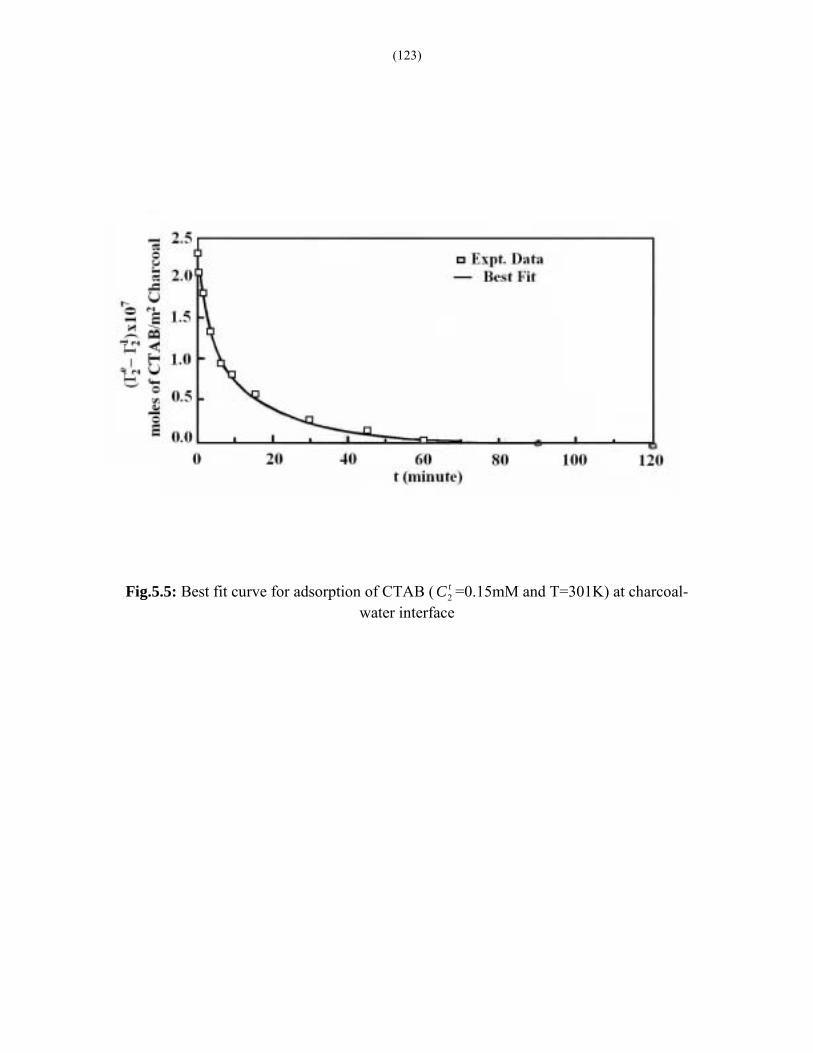
(123)
Fig.5.5: Best fit curve for adsorption of CTAB ( tC2 =0.15mM and T=301K) at charcoal-water interface
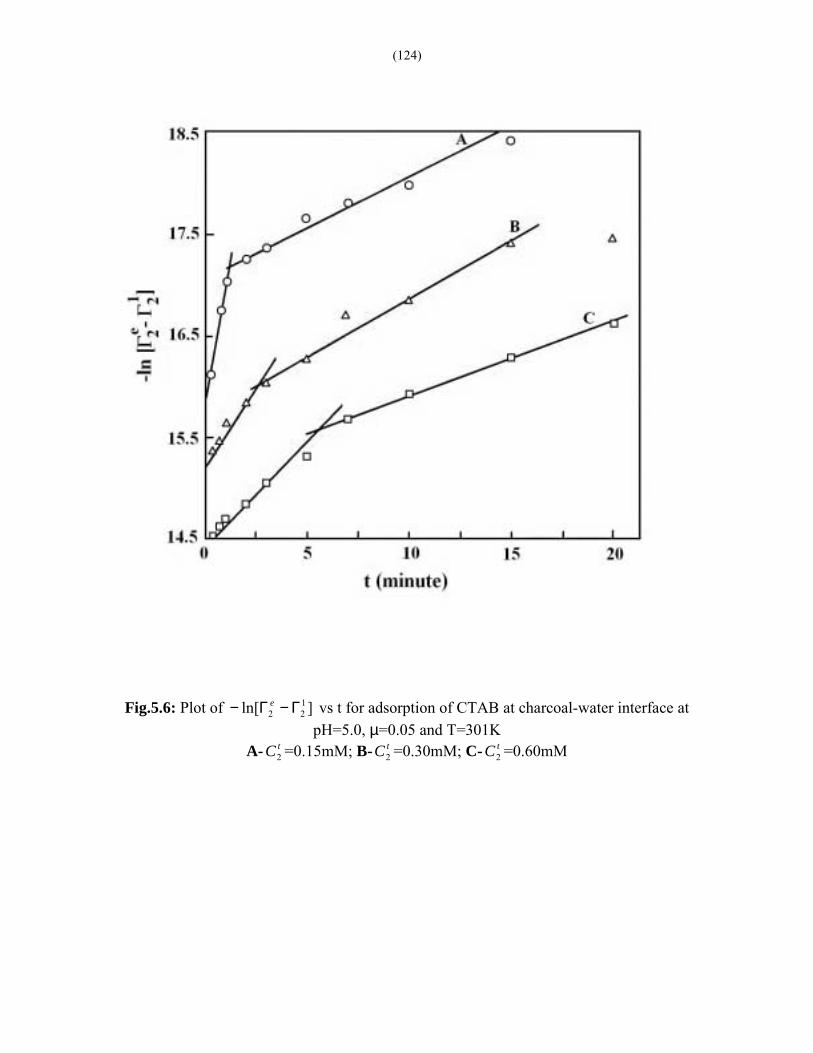
(124)
Fig.5.6: Plot of ]ln[ 122 Γ−Γ− e vs t for adsorption of CTAB at charcoal-water interface at
pH=5.0, µ=0.05 and T=301KA- tC2 =0.15mM; B- tC2 =0.30mM; C- tC2 =0.60mM

(125)
Fig.5.7: Plot of k1 and k2 vs tC2 for adsorption of CTAB at charcoal-water interface
○-k1 and ▲-k2
(126)
Fig.5.8a: Plot of �lnk1 and �lnk2 vs 1/T foradsorption of CTAB at charcoal-water
interface at pH=5.0 and µ=0.05○, ● - tC2 = 6.0mM; ∆,▲- tC2 =3.0mM;
□, ■ - tC2 =1.5mM
Fig.5.8b: Plot of �ln(k1/T) and �ln(k2/T) vs1/T for adsorption of CTAB at charcoal-
water interface at pH=5.0 and µ=0.05○, ● - tC2 = 6.0mM; ∆,▲- tC2 =3.0mM;
□, ■ - tC2 =1.5mM
(127)
Fig.5.9: Plot of ∆H# vs �T∆S# for adsorption of cationic surfactants at charcoal-water interface∆- ( #
1#
1 STvsH ∆−∆ ) and □ - ( #2
#2 STvsH ∆−∆ )
(128)
References1. Garner, W.E., Mckie, M. and Knight, B. C. J. G., J. Phys. Chem., 31, 641 (1992).2. Hansen, R. S., Fu, Y. and Bartell, E. F., J. Phys. Chem., 53, 769 (1949).3. Hansen, R. S. and Graig, R. P., J. Phys. Chem., 58, 211(1954).4. Blackburn, A. and Kipling, J. J., J. Chem. Soc., 1493 (1955).5. Rose, G. R. F.; Weatherburn, A. S. and Bayley, C. H., J. Textile Res., 21, 427 (1951).6. Corrin, M. L.; Lind, E. L.; Roginsky, A. and W. D. Harkins, J. Colloid Interface Sci., 485 (1949).7. Matel, M.; Dusant, O and Lafrance, P., J. Surf. Sci. Technol., 5 (4), 345 (1989):8. Fujita, I.; Tomooka, J. and Sugimura, T., Bull. Chem. Soc., Japan, 64 (2), 738 (1991).9. Chattoraj, D. K., Mahapatra, P. K. and Biswas, S. C., in "Surfactants in Solution" Mittal, K.L. and Chattopadhaya, A. (Eds), MDI, New York, Vol. 64, 83 (1996).10. Smith, R. N., Geiger, C. F. and Pierce, C., J. Phys Chem., 57, 382 (1953)11. Bhaskar, G. V. and Bhamidimarri, R. S. M., J. Chem. Technol. Biotechnol , 53 (3), 297 (1992).12. Hu, X. and Do, D. D., Chem Eng. Sci., 47 (7), 1715 (1992)13 Hobden, J. F. and Jellinek, H. H. G., J. Polym. Sci. II. 365 (1953)14. Claesson, J. and Claesson, S., Arkiv Kemi Geol., 19A. No. 5 (1945)15. Peterson, C and Kwei, T. K., J. Phys. Chem., 65, 1330 (1961).16. Jellinek, H. H. G. and Morthey, H. L. J. Polym. Sci., 14, 583 (1954).17. Klimenko, N. A.; Permilovsaya, A. A.; Traysorudova, A. A. and A. M. Kaganovski, Kollodin Zh., 37, 972 (1975).18. Partyka, S.; Zaina, S.; Lindheimer, M. and B. Brun, Colloids Surf., 12, 255 (1984).19. Soederlind, E. and Stilbs, P., J. Colloid Interface Sci., 143 (2) 586 (1991).20. Tiberg, F.; Jönsson, B. and Lindman, B., Langmuir, 10, 3714 (1994).21. Tiberg, F., J. Chem. Soc., Faraday Trans., 93 (4), 531 (1996).22. Biswas, S. C. and Chattoraj, D. K., (under preparation).23. Biswas, S. C. and Chattoraj, D. K., Langmuir, 13, 4505 (1997).24. Orr, G. and Dallavalle, J. M., "Fine Particle Measurement. Size, Surface & Phase Volume". New York (1959)25. Mondal, B. M. and Palit, S. R, J. Polym. Sci. Part-A, 9, 3301 (1971).26. Davis, J. S., in "Methods in Enzymology". Brand, L. and Johnson, M. L. (Eds), 210, 374 (1992).27. Sarkar, D. and Chattoraj, D. K., Indian J. Biochem Biophys., 29, 135 (1992).28. Ward, A. F. H. and Tordai, L., J. Chem. Phys., 14, 453 (1946).29. Bull, H. B., "Introduction to Physical Biochemistry", Second edition (F. A. Devis, Phila- delphia), 277 (1971).

(129)