kinetics of change in colour and some bio-chemical ... · countries are ivory coast, indonesia,...
TRANSCRIPT

Ndukwu & Udofia, Cogent Food & Agriculture (2016), 2: 1268743http://dx.doi.org/10.1080/23311932.2016.1268743
FOOD SCIENCE & TECHNOLOGY | RESEARCH ARTICLE
Kinetics of change in colour and some bio-chemical composition during fermentation of cocoa beanM.C. Ndukwu1* and M. Udofia1
Abstract: Fermentation and drying of cocoa bean harvested during the late season in Nigeria were studied with four different fermentation methods bordering on heap and basket fermentations. Assessment was made on the content of theobromine, caffeine,total phenol, crude protein, crude fats, carbohydrates and The L* (light–dark spectrum), a* (intensity in green and red), b* (intensity in blue- yellow), C* (chrome) and h* (hue angle) colour parameters. The maximum difference observed for theo-bromine caffeine and the phenolic content for all groups were 0.52, 0.24 and 0.05% respectively while crude protein, fat and carbohydrates varied by 0.78, 0.67 and 7.76%. Highest decrease in hue angle of 6.2% was recorded for Basket fermentation with the pulp regularly mixed, indicating more browning. Theoretical modeling was performed on the colour kinetics based on the first order kinetics. The experimen-tal and the predicted value of the colour ratios showed good agreements between them with the RMSE, χ2 and R2 values of 1.04 × 10⁻⁴–1.22 × 10⁻³, 2.62 × 10⁻⁵–7 × 10⁻⁴ and 88.31–95.69% respectively. Drying trials were conducted in a thin layer with tempering using the oven and natural sunlight. Drying with tempering produced a first-grade cocoa bean with a pH range of 5.37–5.39.
Subjects: Environment & Agriculture; Food Science & Technology; Engineering & Technology
Keywords: biochemica compounds; colour parameters; Nigeria; Arrhenius equation; cacoa bean
*Corresponding author: M.C. Ndukwu, Departments of Agricultural and Bioresources Engineering, Michael Okpara University of Agriculture, Umudike, P.M.B 7267 Umuahia, Abia State, NigeriaE-mails: [email protected], [email protected]
Reviewing editor:Fatih Yildiz, Middle East Technical University, Turkey
Additional information is available at the end of the article
ABOUT THE AUTHORSM.C. Ndukwu is a senior lecturer in Agricultural and Bioresources Engineering. He specialized in crop processing and storage engineering with special interest in processes, machines and equipment for processing crops to achieve sustainable food production and quench hunger in Sub Saharan Africa.
M. Udofia was a student studying for B.ENG degree in Agricultural and Bioresources Engineering under supervision by Ndukwu.
PUBLIC INTEREST STATEMENTDrying and fermentation are the two most critical steps, in the series of unit operations resulting in the finished products, of the cocoa bean. They contribute significantly to the development of the special aroma, colour and taste that makes cocoa products desirable in many parts of the world. Improper fermentation and drying of cocoa bean has been observed to results in off colour, astringency and bitterness that lower the quality of the bean in the market. In different parts of the world, several methods have been adopted to carry out these two most important steps in cocoa processing. Studies by engineers and food processors has focused more on the mechanism of moisture removal process, aroma, final colour, content of polyphenol and acidity development after fermentation and drying but the kinetics of colour developments of cocoa bean during fermentation has been ignored none has tried to rationalise the rate constant of colour change as affected by fermentation period and methods.
Received: 24 October 2016Accepted: 01 December 2016First Published: 08 December 2016
Page 1 of 13
© 2016 The Author(s). This open access article is distributed under a Creative Commons Attribution (CC-BY) 4.0 license.

Page 2 of 13
Ndukwu & Udofia, Cogent Food & Agriculture (2016), 2: 1268743http://dx.doi.org/10.1080/23311932.2016.1268743
1. IntroductionCocoa (Theobroma cacao L.) is an economic tree crop found mostly in the humid tropics. Although cocoa originated from South and Central America, it is now mostly grown in West Africa and the Far East. It thrives well in tropical rain forest zones within latitude 15–20°. The major cocoa growing countries are Ivory Coast, Indonesia, Malaysia, Nigeria, Ghana, Cameroon, Papua New Guinea, St. Lucia, Brazil and Ecuador. The most important part of cocoa is the cocoa bean embedded in ferment-able mucilage housed inside the pod known as cocoa pod. Cocoa bean is a large source of anthocya-nin, catechins (3.00–6.00%), leucocyanidin (2.50%), tannins (2.00–3.50%), caffeine (0.10–0.20%), theobromine (2.50–3.20%), and theophylline (Afoakwa & Paterson, 2010a; Aroyeun, Ogunbayo, & Olaiya, 2006; Kratzer et al., 2009; Kyi et al., 2005; Osman, Nasarudin, & Lee, 2004; Rodriguez-Campos, Escalona-Buendía, Orozco-Avila, Lugo-Cervantes, & Jaramillo-Flores, 2011; Schwan & Wheals, 2004). The bean is used in the production of chocolate, beverages, wine, cocoa butter, cosmetics etc. (Afoakwa & Peterson, 2010b). The cocoa tree usually starts to produce ripe pods two years after planting depending on variety, soil and environmental factors. In Nigeria, the major harvesting pe-riod of cocoa pods is October to December which is the main season and March to April which is the off season. Immediately after harvesting and breaking of ripped pods, fermentation commences and lasts about 5–7 days followed by drying to a moisture content of about 7.50% w.b (Hii, Law, & Cloke, 2009a, 2009b). However, Ndukwu, Ogunlowo, and Olukunle (2010) stated that drying and fermentation are the two most critical steps, in the series of unit operations resulting in the finished products, of the cocoa bean. They contribute significantly to the development of the special aroma, colour and taste that makes cocoa products desirable in many parts of the world. Improper fermen-tation and drying of cocoa bean has been observed to results in off colour, astringency and bitter-ness that lower the quality of the bean in the market. In different parts of the world, several methods have been adopted to carry out these two most important steps in cocoa processing. In the case of fermentation, methods used include heap fermentation covered with banana or plantain leaves, basket fermentations lined with banana leaves and box fermentations. The pulp is mixed every one or two days. Drying can be carried out artificially using a cocoa bean dryer or by spreading the beans on a raised platform under the direct sunlight. Faborode, Favier, and Ajayi (1996) noted that while fermentation is a continuous process till the final day, intermittent drying and curing (rest period) should be adopted to allow the oxidative enzyme activity on the biochemical compounds started during fermentation to be completed. Through oxidative enzyme activity and diffusion this com-pounds contributes to various quality attributes of cocoa bean including flavour quality and brown-ing. Drying tends to inactivate the oxidative enzymes by removing moisture and decrease water activity (Argyropoulos & Müller, 2014). However the rest period will provide the opportunity for the desired biochemical process to be completed. During fermentation, the cocoa bean gradually changes colour to the desirable brown or pale as a result of significant amount of flavonoids, phe-nolic compounds and phenolic acids which act as a substrate for polyphenol oxidase in the presence of oxygen (Afoakwa, Paterson, Fowler, & Ryan, 2008). Therefore colour is a primary quality assess-ment tool to the consumers for cocoa bean and many other crops. Evaluation of colour of cocoa bean and other crops during processing has been carried out by several researchers using the CIELAB method (Arabhosseini, Padhye, Huisman, van Boxtel, & Müller, 2011; Argyropoulos & Müller, 2014; Hii et al., 2009a, 2009b; Martinov, Mujic, & Muller, 2007; Rahimmalek & Goli, 2013). The CIELAB method is applied using L* (light–dark spectrum), a* (green–red spectrum) and b* (blue–yellow spectrum) values. Hue angles (h*) and chroma (C*) is also used as the colour assessment parameters (Arabhosseini et al., 2011). Studies by engineers and food processors has focused more on the mech-anism of moisture removal process, aroma, final colour, content of polyphenol and acidity develop-ment after fermentation and drying (Hii, Abdul Rahman, Jinap, & Che Man, 2006; Hii et al., 2009a, 2009b; Kyi et al., 2005; Ndukwu, 2009; Ndukwu et al., 2010; Ndukwu, Simonyan, & Ndirika, 2012; Sari FarahDina, HimsarAmbarita, Napitupulu, & Hideki Kawai, 2015). However, studies on the kinetics of colour developments of cocoa bean during fermentation are scarce in literature. Furthermore none has tried to rationalise the rate constant of colour change as affected by fermentation period and methods. Therefore this study differs from other research in cocoa bean in this area. The study was conducted in Tropical Rain Forest Zone of Eastern Nigeria and it is limited to the use of late crop season cocoa bean (Forastero var.) harvested in April. This season of cocoa, usually varies in size

Page 3 of 13
Ndukwu & Udofia, Cogent Food & Agriculture (2016), 2: 1268743http://dx.doi.org/10.1080/23311932.2016.1268743
from the main season crop in October–December. The fermentation methods were restricted to the use of heap and basket technique. The variability of weather dictated the existed field condition with its component of humidity, temperature and air movement. Also, drying was restricted to the use of Laboratory Oven and open-air sun drying.
2. Material and methodAbout 850 cocoa pods (forastero var.) of uniform ripeness were obtained from the cocoa farmers from Ikwuano area in Abia state South Eastern Nigeria. They were split and the pulp with seeds re-moved for the experiment process.
2.1. FermentationThe experimental flow chart is shown in Figure 1. Four sets of 50 kg each of the split wet cocoa beans surrounded by the pulp were set up for the research. Two sets were piled on plantain leaves spread out in a circle on the ground while another two sets were piled inside a basket (lined inside with perforated plantain leaves). The basket was made from the back of the stem of palm front. The heaps and baskets were covered with a lot of leaves and left for 8 days. A set of heap (Ht) and basket (Bt) of cocoa pulp were turned at regular interval every two days while the remaining set of heaps (Hwt) and basket (Bwt) was left undisturbed. Three k-type thermocouple, connected to omega data logger, (model: HH1147; Omega, Stanford, USA) at three points within the heaps at equal distance from the top of the heaps. About 15 g each of cocoa beans was removed from the middle of the heap and the baskets at three points for biochemical and colour analysis every 48 h. Also, the ambi-ent humidity was also measured by taking the wet bulb temperature and calculating the humidity using Psychrometric chart.
2.2. Colour measurementThe colour of the cocoa beans was periodically determined during fermentation using the Commission International d’ Eclairage L* a* b* system (CIELAB system) as presented in cocoa manual (ADM Cocoa International, 2009). The colour parameter was expressed as L* showing lightness (L*–0 for black, L*–100 for white), a* showing intensity in green and red (a* ≤ 0 for green, a* ≥ 0 for red) and b* show-ing intensity in blue-yellow (b* ≤ 0 for blue, b* ≥ 0 for yellow).The colour of each sample was obtained by the Hue-angle method described by ADM Cocoa International (2009) cocoa manual. A 400 ml
Figure1. Fermentation and drying flow chart.

Page 4 of 13
Ndukwu & Udofia, Cogent Food & Agriculture (2016), 2: 1268743http://dx.doi.org/10.1080/23311932.2016.1268743
beaker was filled with 5.0 ± 0.1 g of ground nibs and 100 ml of demineralized water at 50°C was added and stirred with stirring rod until smooth slurry is obtained without a lump. Another 50 ml of demineralized water was added at room temperature and continued stirring for 10 min using mag-netic stirrer. The blend was forced through the quartz flow cuvette, while stirring and was carefully positioned against the illuminated window of the calibrated colour meter (Spectraflash 450X; Brand –BYK, Paris France; Measurement geometric–d/8; Illumination—D 65; observed angle—10°). The L* (light–dark spectrum), a* (intensity in green and red) and b* (intensity in blue- yellow) values was measured. The C* (chrome) and h* (hue angle) values were calculated using Equations (1) and (2).
where L* = the lightness and darkness co-ordinate with a low value indicates dark colour and a high value indicate light colour; a* = the red and green coordinate (−a* indicates greencolour and +a* in-dicates red colour); b* = the yellow and blue coordinate (−b* indicating blue colour and +b* indicating yellow colour); C* = the chroma co-ordinate; indicating saturation, a higher value indicating bright colour; h* = the hue-angle; a lower value indicates more redness and a higher value indicate more yellowness.
2.3. Colour kinetics of the fermentation processFermentation is a temperature dependent process, therefore the colour changes of L*, a*, and b* is assumed to vary based on forward order kinetics of the form.
As the fermentation progresses, the desired optimum colour of the bean will be reached which will be the final equilibrium. Therefore the rate of colour change (C–L*, a*, and b*) can be fitted into the equation of the form presented by Krokida, Tsami, and Maroulis (1998) as follows:
where Ct − (L*, a*, and b*) = colour change at time t during fermentation and drying, t = time (day), Ce = colour at equilibrium, Ci = initial colour at day zero, k = colour rate constant (s−1). The plot of the natural log of the colour ratio (Cr) against time (t) will give a straight line and the slope will give the rate constant k (Argyropoulos & Müller, 2014).
2.4. Biochemical analysisPrior to fermentation of the cocoa bean, 10 g of fresh beans were removed from the middle of each of the experimental set up and taken to the laboratory in triplicate for initial bioactive compound, fat content, crude protein, carbohydrates and the colour test determination respectively. The processes were repeated for day 2, 4, 6 and 8 respectively. The biochemical compounds determined were total phenols, theobromine and caffeine. Also proximate analyses carried out were Protein, Moisture, Crude fat and carbohydrates.
The total phenols contents were determined by spetrophotometric method using UV–spectropho-tometer (UV-vis Uvikon XS Bio-Tek Instruments, France) by measuring their assay at wavelengths (λ) of 760 nm (Chen et al., 2009). High-performance Liquid Chromatography (HPLC) was used for caf-feine and theobromine analysis (Lo, Lanuzza, Micali, & Cappellano, 2007). The Assay was analyzed in the extract on a C-18 (4.6 × 250 mm) column. Identification were made by measuring there ab-sorbance at λ = 275 nm and quantification by standard solutions. Crude fat was determined by sox-hlet extraction method while Kjeldahl method was used for protein content analysis (Association of Official Analytical Chemists, 1990).
(1)C∗=
√
a∗ + b∗
(2)h∗ = tan−1
(
b∗
a∗
)
(3)CtCi
= exp(−kt)
(4)Cr =Ct − CeCi − Ce
= exp(−kt)

Page 5 of 13
Ndukwu & Udofia, Cogent Food & Agriculture (2016), 2: 1268743http://dx.doi.org/10.1080/23311932.2016.1268743
2.5. Drying of cocoa beanAfter fermentation for 7 days, cocoa beans completely fermented were washed and dried using di-rect sun energy and oven drying method respectively.
2.5.1. Drying methodsEach of the experiment was divided into two parts, one part was dried separately using sun drying method while the remaining part was dried using oven drying method at 60°C. In the sun drying method, 2 kg of cocoa bean were spread on a black polyethene (0.45 × 0.72 m) in a raised platform and exposed to direct sunlight. The beans were mixed at 1 h interval to promote uniform drying and to break agglomerates until the moisture content attends equilibrium. The weights of the cocoa bean were measured every day until equilibrium moisture content was achieved. Drying starts by 8 am local time and ends by 6 pm daily. At the end of each day, the seeds were placed inside a jute bag and stored inside a room in the night for curing process to continue (Faborode et al., 1996). In the oven dry method, about 500 g of basket fermented cocoa bean (with regular mixing of bean) were placed on a dry tray (0.0676 m2) and put inside a laboratory oven (UMB 500 Sehutzart, DIN EN 60529-IP 20, Memmert, Germany) with a constant temperature of 65°C. The weight of the seeds was measured every 1 h interval until equilibrium moisture content was achieved. Also 24 h curing was also introduced for every three hours continuous drying in the oven. The cocoa bean colour was matched with cocoa quality colour chat presented in Hollywn (2008) at the end of the drying process.
2.5.2. pH determinationTo determine the pH of the dried cocoa bean, 5 g each of the dried bean was dehulled and milled with a hammer mill. The milled sampled was sieved and homogenized with 5 ml of distilled water and allowed for 12 hours. A digital pH meter (Labtech India), previously calibrated with Buffer 4 and 10 was inserted into the solution.
2.6. Statistical analysesStatistical coefficient of root mean square error (RMSE), R2 and chi-square (χ2) were used to assess the goodness of fitting of the colour model with the experimental values. Statistical software used is the ORIGIN Pro 9.1 spreadsheet (Origin 9.1, 2013 data analysis and graphic software, www.originlab.com). The low χ2 and RMSE and high R2present a good fit for the model of the colour attribute (Ndukwu et al., 2010). One-way analysis of variance (ANOVA) followed by Post Hoc test was used to test the level of significance (p ≤ 0.05) among groups for all the parameters determined and colour fittings.
3. Results and discussions
3.1. Changes in biochemical content during fermentationTable 1 presents the values of the percentage Theobromine (PTB), for different fermentation meth-ods. The PTB ranged from 0.83 ≤ PTB ≤ 1.35. The PTB’s increased per 100 mg as the fermentation progresses and peaked on the 6th day for Bt and BWt. There was a sharp increase in the PTB (62.20%) for Bt method of fermentation compared to the Ht method on the 6th day. A factor like the draining of the pulp through the basket or enzymatic activities may be responsible for the increase (Schwan & Wheals, 2004). However, BWt method resulted in comparatively lower increase of 47% in PTB while Ht and Hwt method increased by 55.50–59.70%. Additionally, Table 1 shows that Ht gave the highest mean PTB while Hwt gave the least mean values. The effect of various fermentation meth-ods on PTB were found not to be statistically significant at 5% (ANOVA; post hoc test) with the excep-tion of Bt method which showed to be statistically difference from others at 5% level of significance.
The percentage caffeine (PCAF) value varies for different fermentation periods Table 1. The PCAF values exists between 0.1067–0.3467 for Ht, 0.1533–0.3267 for Hwt, 0.1733–0.3933 for Ht and 0.1733–0.3733 for Bwt. The PCAF values are within the range reported by Osman et al. (2004). The PCAF for all the methods increased with fermentation periods. However the highest PCAF occurred

Page 6 of 13
Ndukwu & Udofia, Cogent Food & Agriculture (2016), 2: 1268743http://dx.doi.org/10.1080/23311932.2016.1268743
Tabl
e 1.
Cha
nge
in b
ioch
emic
al c
onte
nt d
urin
g fe
rmen
tatio
n
Not
es: H
t-he
ap fe
rmen
tatio
n m
etho
d w
ith re
gula
r mix
ing
of th
e pu
lp, H
wt-
heap
ferm
enta
tion
with
out m
ixin
g of
the
pulp
, Bt-
bask
et fe
rmen
tatio
n w
ith m
ixin
g, B
wt-
bask
et fe
rmen
tatio
n w
ithou
t mix
ing.
Days
of
Ferm
en-
tatio
n
Theo
brom
ine
(%)
Caff
eine
(%)
Tota
l phe
nol (
%)
Prot
ein
(%)
Crud
e fa
t (%
)Ca
rboh
ydra
tes
(%)
Ht
Hwt
Bt
Bwt
Ht
Hwt
Bt
Bwt
Ht
Hwt
Bt
Bwt
Ht
Hwt
Bt
Bwt
Ht
Hwt
Bt
Bwt
Ht
Hwt
Bt
Bwt
00.
850.
830.
830.
890.
110.
150.
170.
170.
390.
400.
390.
4113
.71
13.7
113
.71
13.7
148
.09
48.0
948
.09
48.0
922
.32
22.0
023
.33
22.8
5
20.
940.
930.
920.
930.
140.
190.
190.
180.
430.
440.
410.
4214
.06
14.1
214
.29
14.2
748
.08
48.1
148
.27
48.2
222
.98
22.9
522
.77
22.6
1
41.
151.
131.
091.
100.
260.
270.
310.
310.
430.
450.
430.
4314
.29
14.2
414
.44
14.3
248
.35
48.2
348
.39
48.2
522
.68
21.4
21.5
322
.56
61.
301.
291.
351.
310.
270.
270.
310.
310.
430.
450.
430.
4314
.46
14.4
114
.49
14.4
848
.76
48.6
548
.78
48.6
918
.24
22.0
115
.57
21.9
8
81.
331.
321.
351.
310.
350.
330.
390.
370.
440.
450.
430.
4314
.46
14.4
014
.49
14.4
848
.76
48.6
548
.72
48.6
918
.24
22.0
115
.57
21.9
8
Final
di
ffer-
ence
, ΔE
at th
e 8t
h da
y
0.48
0.49
0.52
0.42
0.24
0.18
0.22
0.20
0.05
0.05
0.04
0.02
0.75
0.69
0.78
0.69
0.67
0.56
0.63
0.60
4.08
0.01
7.76
0.87
Page 7 of 13
Ndukwu & Udofia, Cogent Food & Agriculture (2016), 2: 1268743http://dx.doi.org/10.1080/23311932.2016.1268743
at the 8th day for Bt method while the least mean PCAF was obtained for Ht (Table 2). The analysis of variance (ANOVA) and further post hoc test shzows that Ht and Hwt methods were significantly difference from Bt and Bwt methods at 5% confidence level.
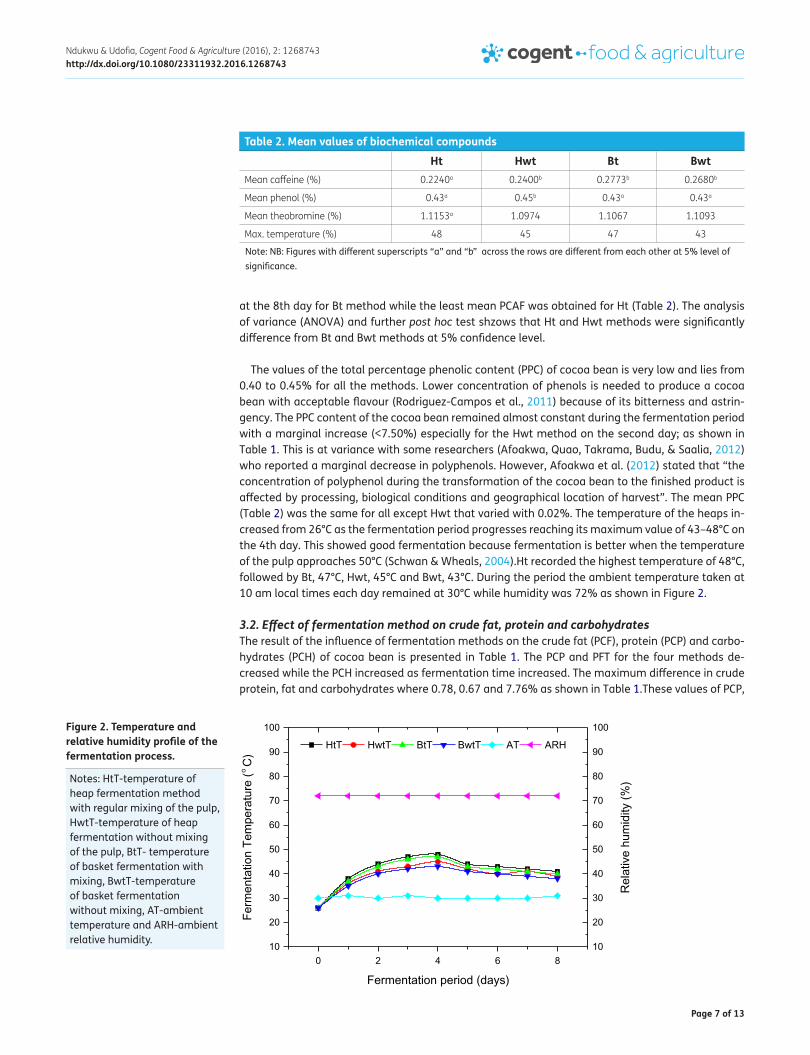
The values of the total percentage phenolic content (PPC) of cocoa bean is very low and lies from 0.40 to 0.45% for all the methods. Lower concentration of phenols is needed to produce a cocoa bean with acceptable flavour (Rodriguez-Campos et al., 2011) because of its bitterness and astrin-gency. The PPC content of the cocoa bean remained almost constant during the fermentation period with a marginal increase (<7.50%) especially for the Hwt method on the second day; as shown in Table 1. This is at variance with some researchers (Afoakwa, Quao, Takrama, Budu, & Saalia, 2012) who reported a marginal decrease in polyphenols. However, Afoakwa et al. (2012) stated that “the concentration of polyphenol during the transformation of the cocoa bean to the finished product is affected by processing, biological conditions and geographical location of harvest”. The mean PPC (Table 2) was the same for all except Hwt that varied with 0.02%. The temperature of the heaps in-creased from 26°C as the fermentation period progresses reaching its maximum value of 43–48°C on the 4th day. This showed good fermentation because fermentation is better when the temperature of the pulp approaches 50°C (Schwan & Wheals, 2004).Ht recorded the highest temperature of 48°C, followed by Bt, 47°C, Hwt, 45°C and Bwt, 43°C. During the period the ambient temperature taken at 10 am local times each day remained at 30°C while humidity was 72% as shown in Figure 2.
3.2. Effect of fermentation method on crude fat, protein and carbohydratesThe result of the influence of fermentation methods on the crude fat (PCF), protein (PCP) and carbo-hydrates (PCH) of cocoa bean is presented in Table 1. The PCP and PFT for the four methods de-creased while the PCH increased as fermentation time increased. The maximum difference in crude protein, fat and carbohydrates where 0.78, 0.67 and 7.76% as shown in Table 1.These values of PCP,
Table 2. Mean values of biochemical compounds
Note: NB: Figures with different superscripts “a” and “b” across the rows are different from each other at 5% level of significance.
Ht Hwt Bt BwtMean caffeine (%) 0.2240a 0.2400b 0.2773b 0.2680b
Mean phenol (%) 0.43a 0.45b 0.43a 0.43a
Mean theobromine (%) 1.1153a 1.0974 1.1067 1.1093
Max. temperature (%) 48 45 47 43
Figure 2. Temperature and relative humidity profile of the fermentation process.
Notes: HtT-temperature of heap fermentation method with regular mixing of the pulp, HwtT-temperature of heap fermentation without mixing of the pulp, BtT- temperature of basket fermentation with mixing, BwtT-temperature of basket fermentation without mixing, AT-ambient temperature and ARH-ambient relative humidity.
0 2 4 6 810
20
30
40
50
60
70
80
90
100
10
20
30
40
50
60
70
80
90
100
Rel
ativ
e hu
mid
ity (%
)
Ferm
enta
tion
Tem
pera
ture
(oC
)
Fermentation period (days)
HtT HwtT BtT BwtT AT ARH

Page 8 of 13
Ndukwu & Udofia, Cogent Food & Agriculture (2016), 2: 1268743http://dx.doi.org/10.1080/23311932.2016.1268743
PFT and PCH are within the range reported in literature for cocoa bean (Grivetti & Shapiro, 2009). The results show that fermentation has a positive influence on the PFT and PCP while PCH decreased. This result is tied to the oxidative activities of the enzymes that break the polyphenols into amino acids and proteins (Afoakwa et al., 2008). However this activity of the enzymes diminishes as can be seen from day six and eight day in Table 1. Similar observation has been reported by Lopez and Dimick (1995). Higher PFT and PCP were observed for Bt method with lower PCH while Hwt method has higher PCH and lower PFT and PCP. Previous research (Gildemberg, Luiz, Priscilla, Flavio, & Antonio, 2008; Schwan & Wheals, 2004) has shown that decrease in the PCHof cocoa bean is as a result of consumption of pulp sugar by yeast and lactic bacteria. This is to produce ethanol which is further degraded by pectinolytic yeasts to produce heat and rise in temperature. Additionally, mix-ing of the pulp increases the air flow through the pulp, thereby favouring the production of acetate bacteria that produce the acetate that break down the ethanol to generate carbon dioxide and heat. The PCH values were not statiscally significant at 5%, however significant difference exist between Hwt and Bt on the 4th day for PCP. Furthermore their were significant difference between basket fermentation and heap methods on the 2nd day.
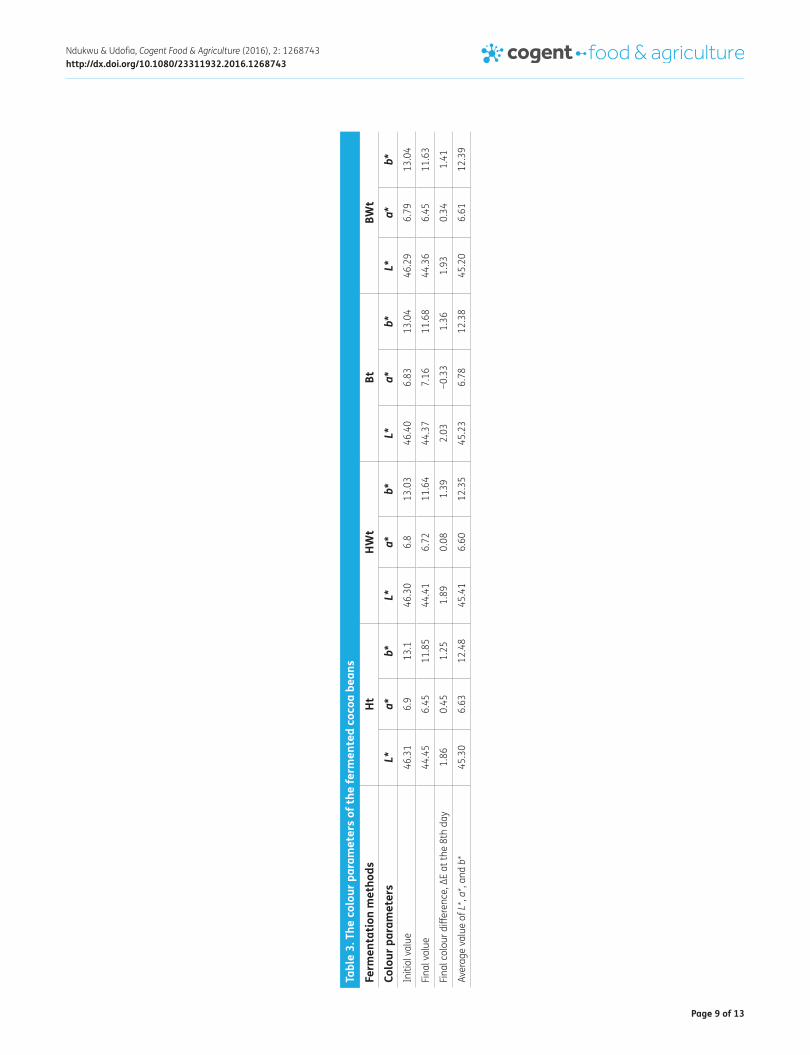
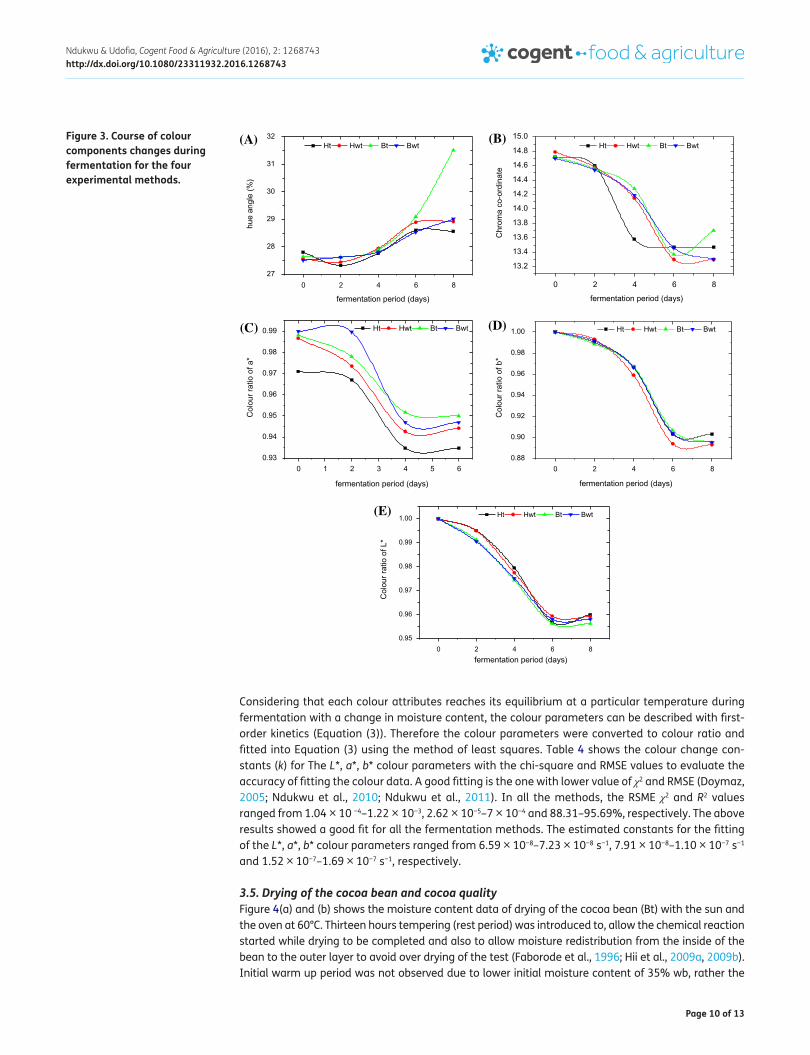
3.3. Evaluation of colour parameters during fermentationThe values of the colour parameters in the initial and final phases as well as the mean value are presented in Table 3 while the calculated hue angle and chroma coordinate are shown in Figure 3(a) and (b).
The L*, a*, b*, C* and h* colour parameters for the four methods showed a decreasing trend with the fermentation periods with the exception of the BT method where only a* increased slightely. The L*, a*, b*, C* and h* values ranged from 44.46–46.40, 6.45–7.12, 11.63–13.01 and 58.49–62.49 respectively for all the four methods as shown in Table 3 and Figure 3. The results showed loss of brightness (L*), redness (a*) and yellowness(b*) except for BT that showed increased redness at the final phase. The colour parameters are related to the final cocoa quality. The browner cocoa bean obtained the better the quality of the fermentation process. However no significant difference at 5% was observed for redness (a*) among the same or between groups as the fermentation progresses. However, the brightness (L*) and yellowness (b*) showed a difference at 5% among the same group. Therefore it can be said that brightness (L*) and yellowness (b*) is the most sensitive colour compo-nents for the perception of colour changes in off-season South Eastern Nigeria cocoa bean during fermentation. Also hue angle and chromate coordinate is also a good perception index. The ANOVA test and post hoc test showed that L* value for the entire group is significantly different from each other on the eight day at 5%. On the 6th day, the redness (a*) of Hwt and Bwt showed significant difference with Bt while the redness showed no significant difference at 5% between all the meth-ods.The decrease in the hue angle shows more browning of the bean. Also several researchers (Hawlader, Perera, & Tian, 2006; Hii et al., 2009a; Rocha & Morais, 2003) has indicated that decrease in L*(lightness) value, an increase in a* (redness) value and decrease in hue angle (h) shows a better browning reaction of cocoa bean. The highest decrease of 6.21% in hue angle was recorded for Bt while the lowest decrease of 1.32% was recorded for Ht. It implies that hue angle gradually moved deeper into the red quadrant in Bt than any other method (Argyropoulos & Müller, 2014). Basket fermentation produced a higher decrease in hue angle and chroma coordinates (less saturation) which showed a better browning reaction than the heap fermentation methods. Comparative mix-ing the pulp has a positive influence on the browning reaction in the basket fermentation at p < 5% confidence level. This indicated that even when cocoa bean fermentation regime is undertaken with the same cocoa specie, adopting the same fermentation method but different treatment, cocoa beans with diverse colour and flavour distinctiveness can be produced due to variation in biochemi-cal composition, microbial count and metabolic process during different methods and treatments.
3.4. Colour kinetics of cocoa bean during fermentationFigure 3(c)–(e) shows the course of changes in colour components (colour ratio) during the fermen-tation periods for the four fermentation methods. Colour changes have always been associated with temperature and loss of moisture in biomaterials (Hii et al., 2009a, 2009b; Martinov et al., 2007).
Page 9 of 13
Ndukwu & Udofia, Cogent Food & Agriculture (2016), 2: 1268743http://dx.doi.org/10.1080/23311932.2016.1268743
Tabl
e 3.
The
col
our p
aram
eter
s of
the
ferm
ente
d co
coa
bean
sFe
rmen
tatio
n m
etho
dsHt
HWt
BtBW
tCo
lour
par
amet
ers
L*a*
b*L*
a*b*
L*a*
b*L*
a*b*
Initi
al v
alue
46.3
16.
913
.146
.30
6.8
13.0
346
.40
6.83
13.0
446
.29
6.79
13.0
4
Final
val
ue44
.45
6.45
11.8
544
.41
6.72
11.6
444
.37
7.16
11.6
844
.36
6.45
11.6
3
Final
col
our d
iffer
ence
, ΔE
at th
e 8t
h da
y1.
860.
451.
251.
890.
081.
392.
03−0
.33
1.36
1.93
0.34
1.41
Aver
age
valu
e of
L*,
a*, a
nd b
*45
.30
6.63
12.4
845
.41
6.60
12.3
545
.23
6.78
12.3
845
.20
6.61
12.3
9
Page 10 of 13
Ndukwu & Udofia, Cogent Food & Agriculture (2016), 2: 1268743http://dx.doi.org/10.1080/23311932.2016.1268743
Considering that each colour attributes reaches its equilibrium at a particular temperature during fermentation with a change in moisture content, the colour parameters can be described with first- order kinetics (Equation (3)). Therefore the colour parameters were converted to colour ratio and fitted into Equation (3) using the method of least squares. Table 4 shows the colour change con-stants (k) for The L*, a*, b* colour parameters with the chi-square and RMSE values to evaluate the accuracy of fitting the colour data. A good fitting is the one with lower value of χ2 and RMSE (Doymaz, 2005; Ndukwu et al., 2010; Ndukwu et al., 2011). In all the methods, the RSME χ2 and R2 values ranged from 1.04 × 10 −4–1.22 × 10⁻³, 2.62 × 10⁻⁵–7 × 10⁻⁴ and 88.31–95.69%, respectively. The above results showed a good fit for all the fermentation methods. The estimated constants for the fitting of the L*, a*, b* colour parameters ranged from 6.59 × 10⁻⁸–7.23 × 10⁻⁸ s−1, 7.91 × 10⁻⁸–1.10 × 10⁻⁷ s−1
and 1.52 × 10⁻⁷–1.69 × 10⁻⁷ s−1, respectively.
3.5. Drying of the cocoa bean and cocoa qualityFigure 4(a) and (b) shows the moisture content data of drying of the cocoa bean (Bt) with the sun and the oven at 60°C. Thirteen hours tempering (rest period) was introduced to, allow the chemical reaction started while drying to be completed and also to allow moisture redistribution from the inside of the bean to the outer layer to avoid over drying of the test (Faborode et al., 1996; Hii et al., 2009a, 2009b). Initial warm up period was not observed due to lower initial moisture content of 35% wb, rather the
Figure 3. Course of colour components changes during fermentation for the four experimental methods.
(A) (B)
(C) (D)
(E)
0 2 4 6 8
13.2
13.4
13.6
13.8
14.0
14.2
14.4
14.6
14.8
15.0
Chr
oma
co-o
rdin
ate
fermentation period (days)
Ht Hwt Bt Bwt
0 2 4 6 827
28
29
30
31
32
hue
angl
e (%
)
fermentation period (days)
Ht Hwt Bt Bwt
0 2 4 6 80.88
0.90
0.92
0.94
0.96
0.98
1.00
Col
our r
atio
of b
*
fermentation period (days)
Ht Hwt Bt Bwt
0 1 2 3 4 5 60.93
0.94
0.95
0.96
0.97
0.98
0.99
Col
our r
atio
of a
*
fermentation period (days)
Ht Hwt Bt Bwt
0 2 4 6 80.95
0.96
0.97
0.98
0.99
1.00
Col
our r
atio
of L
*
fermentation period (days)
Ht Hwt Bt Bwt

Page 11 of 13
Ndukwu & Udofia, Cogent Food & Agriculture (2016), 2: 1268743http://dx.doi.org/10.1080/23311932.2016.1268743
moisture content decreased continuously as the drying time progressed. Ndukwu et al. (2010) reported similar results in cocoa bean drying with artificial dryer. It took 52 h including rest period to dry the cocoa bean at 60°C to 13–14% db moisture content. However sun drying was terminated after 12 days due to the unfavourable weather conditions when the moisture content is about 23% db or less. The ambient temperature varied from 30.2 to 37.8°C and humidity ranged from 62 to 72% during the dry-ing period. The oven dried cocoa bean was cut open and compared with the cocoa quality colour charts. Twenty-two adults were asked to match the dried cocoa colour using the cocoa quality colour chart. About 90% matched the colour with the first picture on the “well fermented line” while 10% said it is slightly over fermented. However, the pH values of the milled cocoa powder ranged from 5.37 to 5.39. The pH is higher than the oven dried cocoa bean from Malaysia (Hii et al., 2009a, 2009b), however it fall within the international acceptable range of 5.00–5.55 for dried cocoa beans (Hii et al., 2009a).
4. ConclusionFermentation and drying studies of cocoa bean harvested during the late season in the southeastern Nigeria were undertaken with four different fermentation techniques. The following deductions were made from the research
Table 4. Values of rate constants determined through method of least square for all methodsFermentation method k (s−1) χ2 RMSE R2
L*
Ht 6.60 × 10⁻⁸ 0.0000393 0.000157 0.9000
Hwt 6.59 × 10⁻⁸ 0.0000256 0.000103 0.9299
Bt 7.23 × 10⁻⁸ 0.0000218 0.000873 0.94512
Bwt 6.94 × 10⁻⁸ 0.000186 0.000746 0.94775
a*
Ht 1.10 × 10⁻⁷ 0.00070 0.00028 0.90768
Hwt 9.14 × 10⁻⁸ 0.000445 0.000178 0.93149
Bt 7.91 × 10⁻⁸ 0.0000262 0.000104 0.95691
Bwt 7.92 × 10⁻⁸ 0.000114 0.000455 0.82759
b*
Ht 1.53 × 10⁻⁷ 0.000259 0.00104 0.8831
Hwt 1.69 × 10⁻⁷ 0.000305 0.00122 0.88679
Bt 1.56 × 10⁻⁷ 0.000216 0.000865 0.90573
Bwt 1.58 × 10⁻⁷ 0.000255 0.00102 0.89377
Figure 4. Moisture content data for oven during at 60°C (a) and sun drying (b) for the cocoa bean.

Page 12 of 13
Ndukwu & Udofia, Cogent Food & Agriculture (2016), 2: 1268743http://dx.doi.org/10.1080/23311932.2016.1268743
• The total phenol content did not vary much throughout except in the 2nd day of fermentation for all the methods. The value of theobromine, caffeine and phenol content ranged from 0.83–1.35%, 0.11–0.39% and 0.39–0.45%, respectively.
• Fermentation resulted in an increase of crude fats and protein per 100 mg of dried matter while percentage carbohydrates decreased. The Bt method gave higher fat and protein content with lower carbohydrates while the reverse was the case in Ht method at the end of fermentation.
• Cocoa bean was more sensitive to lightness (L*, light–dark spectrum)) and yellowness (b*- intensity in blue-yellow) during fermentation
• The estimated rate constants for the L*, a*, b* colour parameters for all the methods lie from 6.59 × 10⁻⁸–7.23 × 10⁻⁸ s−1, 7.91 × 10⁻⁸–1.10 × 10⁻⁷ s−1 and 1.52 × 10⁻⁷–1.69 × 10⁻⁷ s−1, respectively
• The pH of dried bean with tempering range of 5.37–5.39.
AcknowledgementsThe authors’ wishes to thank the laboratory staffs of national root crop research institute (NRCRI) Umudike Umuahia Nigeria for their assistance during the laboratory tests.
FundingThe authors received no direct funding for this research.
Competing InterestsThe authors declare no competing interest.
Author detailsM.C. Ndukwu1
E-mails: [email protected], [email protected]. Udofia1
E-mail: [email protected] Departments of Agricultural and Bioresources Engineering,
Michael Okpara University of Agriculture, Umudike, P.M.B 7267, Umuahia, Abia State, Nigeria.
Citation informationCite this article as: Kinetics of change in colour and some bio-chemical composition during fermentation of cocoa bean, M.C. Ndukwu & M. Udofia, Cogent Food & Agriculture (2016), 2: 1268743.
ReferencesADM Cocoa International. (2009): De Zaan cocoa manual.
Chicago, IL: Author.Afoakwa, E. O., Paterson, A., Fowler, M., & Ryan, A. (2008).
Flavor formation and character in cocoa and chocolate: A critical review. Critical Reviews in Food Science and Nutrition, 48, 840–857. http://dx.doi.org/10.1080/10408390701719272
Afoakwa E. O., & Paterson A. (2010a). Cocoa fermentation: Chocolate flavour quality. In Encyclopedia of biotechnology in agriculture and food (pp. 457–468). Oxford: Taylor & Francis.
Afoakwa, E. O., & Peterson, J. (2010b). Chocolate science and technology (pp. 23–82). Oxford: Wiley-Blackwell. http://dx.doi.org/10.1002/9781444319880
Afoakwa, E. O., Quao, J., Takrama, F. S., Budu, A. S., & Saalia, F. K. (2012). Changes in total polyphenols, O-diphenols and anthocyanin concentrations during fermentation of pulp pre-conditioned cocoa (Theobroma Cacao) beans. International Food Research Journal, 19, 1071–1077.
Arabhosseini, A., Padhye, S., Huisman, W., van Boxtel, A., & Müller, J. (2011). Effect of drying on the color of tarragon (Artemisia dracunculus L.) leaves. Food and Bioprocess Technology, 4, 1281–1287. http://dx.doi.org/10.1007/s11947-009-0305-9
Argyropoulos D., Müller, J. (2014). Kinetics of change in colour and rosmarinic acid equivalents during convective drying of lemon balm (Melissa officinalis L.). Journal of Applied
Research on Medicinal and Aromatic Plants, e15–e22. http://dx.doi.org/10.1016/j.jarmap.2013.12.001
Aroyeun, S. O., Ogunbayo, J. O., & Olaiya, A. O. (2006). Effect of modified packaging and storage time of cocoa pods on the commercial quality of cocoa beans. British Food Journal, 108, 141–151. http://dx.doi.org/10.1108/00070700610644951
Association of Official Analytical Chemists [AOAC]. (1990). Copper catalyst kjeldahl method (984.13). In Official methods of analysis. 1990 (15th ed.). Rockville, MD: Author.
Cheng, C. M., Abbe, M. M. J., & Ismail, A. (2009). Phenolic and theobromine contents of commercial dark, milk and white chocolates on the Malaysian market. Molecules, 14, 200–209. doi:10.3390/molecules14010200
Doymaz, I. (2005). Sun drying of figs: An experimental study. Journal of Food Engineering, 71, 403–407. http://dx.doi.org/10.1016/j.jfoodeng.2004.11.003
Faborode, M. O., Favier, J. F., & Ajayi, O. A. (1996). On the effects of forced air drying on cocoa quality. Journal of Food Engineering, 25, 455–472.
Gildemberg A. L. J., Luiz, H. G., Priscilla, E., Flavio, C. T., Antonio F. (2008). Fermentation of cacao (Theobroma Cacao L.) seeds with a hybrid kluyveromyces marxianus strain improved product quality attributes. Federation of European Microbiological Societies (IFEM) Yeast Res, 8, 788–798.
Grivetti, L. E., & Shapiro, H. Y. (2009). Chocolate, history, culture and heritage. Hobroken, NJ: A John Wiley and sons.
Hawlader, M. N. A., Perera, C. O., & Tian, M. (2006). Properties of modified atmosphere heat pump dried foods. Journal of Food Engineering, 74, 392–401. http://dx.doi.org/10.1016/j.jfoodeng.2005.03.028
Hii, C. L., Abdul Rahman, R., Jinap, S., & Che Man, Y. B. (2006). Quality of cocoa beans dried using a direct solar dryer at different loadings. Journal of the Science of Food and Agriculture, 86, 1237–1243. http://dx.doi.org/10.1002/(ISSN)1097-0010
Hii, C. L., Law, C. L., & Cloke, M. (2009a). Modeling using a new thin layer drying model and product quality of cocoa. Journal of Food Engineering, 90, 191–198. http://dx.doi.org/10.1016/j.jfoodeng.2008.06.022
Hii, C. L., Law, C. L., Cloke, M., & Suzannah, S. (2009b). Thin layer drying kinetics of cocoa and dried product quality. Biosystems Engineering, 102, 153–161. http://dx.doi.org/10.1016/j.biosystemseng.2008.10.007
Hollywn. (2008). Cocoa processing methods for the production of high quality cocoa in Vietnam. In Cocoa fermentation and drying manual Vietnam (pp. 1–18). Canberra: Australian agency for international aid.
Kratzer, U., Frank, R., Kalbacher, H., Biehl, B., Wöstemeyer, J., & Voigt, J. (2009). Subunit structure of the vicilin-like globular storage protein of cocoa seeds and the origin of cocoa- and chocolate-specific aroma precursors. Food Chemistry, 113, 903–913. http://dx.doi.org/10.1016/j.foodchem.2008.08.017

Page 13 of 13
Ndukwu & Udofia, Cogent Food & Agriculture (2016), 2: 1268743http://dx.doi.org/10.1080/23311932.2016.1268743
© 2016 The Author(s). This open access article is distributed under a Creative Commons Attribution (CC-BY) 4.0 license.You are free to: Share — copy and redistribute the material in any medium or format Adapt — remix, transform, and build upon the material for any purpose, even commercially.The licensor cannot revoke these freedoms as long as you follow the license terms.
Under the following terms:Attribution — You must give appropriate credit, provide a link to the license, and indicate if changes were made. You may do so in any reasonable manner, but not in any way that suggests the licensor endorses you or your use. No additional restrictions You may not apply legal terms or technological measures that legally restrict others from doing anything the license permits.
Cogent Food & Agriculture (ISSN: 2331-1932) is published by Cogent OA, part of Taylor & Francis Group. Publishing with Cogent OA ensures:• Immediate, universal access to your article on publication• High visibility and discoverability via the Cogent OA website as well as Taylor & Francis Online• Download and citation statistics for your article• Rapid online publication• Input from, and dialog with, expert editors and editorial boards• Retention of full copyright of your article• Guaranteed legacy preservation of your article• Discounts and waivers for authors in developing regionsSubmit your manuscript to a Cogent OA journal at www.CogentOA.com
Krokida, M. K., Tsami, E., & Maroulis, Z. B. (1998). Kinetics on color changes during drying of some fruits and vegetables. Drying Technology, 16, 667–685. http://dx.doi.org/10.1080/07373939808917429
Kyi, T. M., Daud, W. R. W., Mohammad, A. B., Wahid Samsudin, M. W., Kadhum, A. A. H., & Talib, M. Z. M. (2005). The kinetics of polyphenol degradation during the drying of Malaysian cocoa beans. International Journal of Food Science and Technology, 40, 323–331. http://dx.doi.org/10.1111/ifs.2005.40.issue-3
Lo, Coco F., Lanuzza, F., Micali, G., & Cappellano, G. (2007). Determination of theobromine, theophylline, and caffeine in by-products of cupuacu and cacao seeds by high-performance liquid chromatography. Journal of Chromatographic Science, 45, 273–275.
Lopez, A. S., & Dimick, P. S. (1995). Cocoa fermentation. In G. Reed & T. W. Nagodawithana (Eds.), Enzymes, biomass, food and feed (pp. 561–577). Weinheim: VCH.
Martinov M., Mujic, I., & Muller, J. (2007). Einfluss der Trocknungstemperatur auf den Trocknungsverlauf und die Qualita¨ t von Hypericum perforatum L.[Impact of drying air temperature on course of drying and quality of hypericum perforatum L.]. Zeitschrift Fu¨ R Arznei- & Gewu¨ Rzpflan-Zen, 12, 136–140.
Ndukwu, M. C., (2009). Effect of drying temperature and drying air velocity on the drying rate and drying constant of cocoa bean. Agricultural Engineering International: CIGR Journal, 11, Manuscript 1091.
Ndukwu, M. C., Ogunlowo, A. S., & Olukunle, O. J. (2010). Cocoa bean (Theoboroma Cacao L.) drying kinetics. Chilean Journal of Applied Agriculture, 70, 633–639.
Ndukwu, M. C., Ogunlowo, A. S., Olukunle, O. J., & Olalusi, A. P. (2011). Analysis of moisture variation in layers of cocoa bean during drying. In Proceedings of the 11th International Conference and 32nd Annual General
Meeting of the Nigerian Institution of Agricultural Engineers (NIAE Ilorin 2011), October 17–20, 2011, Ilorin.
Ndukwu, M. C., Simonyan, K. J., & Ndirika, V. I. O. (2012). Investigation of the structural changes of cocoa bean (with and without Seed Coat) during convective drying. International Journal of Agricultural and Biological Engineering, 5, 75–82.
Osman, H., Nasarudin, R., & Lee, S. L. (2004). Extracts of cocoa (Theobroma cacao L.) leaves and their antioxidation potential. Food Chemistry, 86, 41–46. http://dx.doi.org/10.1016/j.foodchem.2003.08.026
Rahimmalek, M., & Goli, S. (2013). Evaluation of six drying treatments with respect to essential oil yield, composition and color characteristics of Thymys daenensis subsp. daenensis. Celak leaves. Industrial Crops and Products, 42, 613–619. http://dx.doi.org/10.1016/j.indcrop.2012.06.012
Rocha, A. M. C. N., & Morais, A. M. M. B. (2003). Shelf life of minimally processed apple (cv. Jonagored) determined by colour changes. Food Control, 14, 13–20. http://dx.doi.org/10.1016/S0956-7135(02)00046-4
Rodriguez-Campos, J., Escalona-Buendía, H. B., Orozco-Avila, I., Lugo-Cervantes, E., & Jaramillo-Flores, M. E. (2011). Dynamics of volatile and non-volatile compounds in cocoa (Theobroma cacao L.) during fermentation and drying processes using principal components analysis. Food Research International, 44, 250–258. http://dx.doi.org/10.1016/j.foodres.2010.10.028
Sari FarahDina, A. B., HimsarAmbarita, B. N., Napitupulu, Farel H., & Hideki Kawai, B. (2015). Study on effectiveness of continuous solar dryer integrated with desiccant thermal storage for drying cocoa beans. Case Studies in Thermal Engineering, 5, 32–40.
Schwan, R. F., & Wheals, A. E. (2004). The microbiology of cocoa fermentation and its role in chocolate quality. Critical Review in Food Science and Nutrition, 44, 1–17.