kinetics of mineral scale membrane fouling
TRANSCRIPT

Technical Article
Kinetics of Mineral Scale Membrane Fouling
A Comparison of Conventional Crossflow Membranesand V✧SEP, a Vibratory Membrane System.
Greg Johnsona, Dr. Brad Culkin PHD. a, Michele Monroea
aNew Logic Research, Incorporated
1295 67th Street, Emeryville, CA 94608
Presented :
Keywords: Membrane, Fouling, Mineral Scale, Solubility Limits, Scaling Control, Reverse Osmosis, Filtration
Abstract
Polymer Membrane Filtration is often used for
water treatment. During the filtration process, very
clean water is obtained as the permeable membrane
allows very small nuclei to diffuse through it when
pressure is applied. Suspended colloids, inorganic
salts, dissolved organics, and other disassociated
species are rejected. The benefit of membranes is
the accuracy of the separation process and the high
quality of filtrate that can be recovered. One of the
limitations on membrane performance is that the
permeate rate can be reduced by fouling or blind-
ing of the surface. This can occur in several ways
including charge association, hydrogen bonding,
hydrophobic interaction, or from exothermic
chemical precipitation of sparingly soluble earth
metal salts which can occur at the membrane ma-
trix. This paper investigates the initiation mecha-
nisms and effects of mineral scale formation in
membrane systems and compares the benefits of
using a vibrating membrane system such as the
V✧SEP, (Vibratory Shear Enhanced Process), to
the use of conventional crossflow membranes.
Other studies have shown the benefits of V✧SEP
when is comes to the Ultrafiltration process and
its ability to mitigate the potential effects of or-
ganic fouling and diffusion polarization of the
membrane surface. This study will investigate
benefits of V✧SEP on a molecular level with re-
gard to spontaneous chemical bonding that can
occur in Nano-Filtration and Reverse Osmosis
membranes.
The focus of study is on the effects of mineral scal-
ing in membrane systems. During the filtration pro-
cess the solubility limits of slightly soluble salts
can be reached and the salts will then precipitate
out as crystalline mineral scale; forming additional
suspended colloidal which poses a threat of foul-
ing. The study demonstrates the resiliency of
V✧SEP with respect to mineral scale formation
and the lack of need for pre-treatment with anti-
scalants or other chemicals to inhibit crystal for-
mation and growth.

Background
Membrane fouling and scaling can significantly in-
crease the cost of a membrane system as well as reduce
its reliability. This limitation has been the cause of a
great deal of recent development in membrane science.
Several approaches have been used to try and mini-
mize the effects of fouling.
Polymer chemists are developing many new mem-
branes that have “low fouling” characteristics. Several
techniques are used like altering the Zeta Potential or
amount of ionic charge of the membrane surface. An-
other method is modifying the thermodynamic poten-
tial of the membrane surface by using low surface en-
ergy materials that reduce the chemical free energy
change upon absorption of foulants.
Other developments have focused upon offering the po-
tential foulants an alternate site for chemical attraction,
or limiting their rate of precipitation, so these foulants
are used up or diluted in their effect and thus will not
pose a threat to the membrane itself. Examples of these
are “anti-scalants” which can be organic compounds
with sulfonate, phosphonate, or carboxylic acid func-
tional groups. Also used are chelating agents which
sequester and neutralize a particular foulant. Carbon,
Alum, and zeolites can be used. They offer huge sur-
face areas loaded with nucleation sites suitable for ab-
sorption or crystallization to occur spontaneously at
relatively low solubility levels.
Another method of combating fouling is by affecting
the fluid dynamics at or near the membrane surface.
“Crossflow” membrane systems employ aggressive
tangential flow in order to help reduce the thickness of
diffusion polarization layers of foulants, as well as col-
loidal films that can form on the membrane. Since static
dead-end media will simply retain particles or ions left
behind as the water is removed, it is only a matter of
time until the rejected material must be physically re-
moved. Cartridge filters and bag filters work in this
manner. Crossflow membranes employ the use of tur-
bulent flow across the membrane surface to “wash”
away the particulate matter that is deposited, and to
depolarize the membrane. Vibrating membranes, such
as V✧SEP, use crossflow in addition to the increased
shear caused by torsional oscillation of the membrane
itself to repel suspended solids.
Most often, the optimum membrane system will em-
ploy several of these developments in order to combat
fouling. For example, crossflow membrane systems
will utilize pre-treatment of the feed water by using a
5.0µm bag filter followed by a 1.0µm Cartridge filter.
Then the system will use a “Low Fouling” membrane
with advantageous surface chemistry. An antiscalant
will be dosed into the feed to sequester any potential
foulants. And finally, aggressive crossflow is used to
keep the membrane clear. This is a suitable treatment
process as long as the feedwater is within specific cri-
teria including LSI (Langolier Saturation Index), and
SDI (Silt Density Index), amounts of sparingly soluble
salts and other suspended colloids.
Introduction
Membrane filtration using Reverse Osmosis and Nano-
Filtration has been proven as a very effective technol-
ogy for the removal of dissolved solids including toxic
substances from industrial wastewater. It can also pro-
vide a source of ultra-pure water for chemical process-
ing, manufacturing, and for drinking water. The re-
sults of the filtrate quality are predictable and reliable.
The filtrate quantity that results from a membrane sys-
tem is more difficult to predict. There is no reliable
method for predicting either the rate of fouling or the
extent of it. This can lead to miscalculations in system
sizing and unreliable performance. One way to mini-
mize this risk is to over design a system with ample
turn down ratio and also to minimize fouling or the
mechanisms for fouling.
Mineral Scale fouling of aMembrane

Types of Mineral Scale
Minerals that will precipitate and form scale as they
come out of solution are predominantly composed of
divalent metal ions. Monovalent metals such as Sodium
and Potassium are nearly completely soluble, whereas,
in the presence of Sulfate, Phosphate, or Carbonate,
divalent ions such as Calcium, Iron, Magnesium,
Barium, Strontium, Radium, Beryllium, Lead, and Sili-
con are nearly insoluble. As these molecules precipi-
tate, they form crystals that begin at a nucleation site.
Common forms of mineral scale include:
Calcium Carbonate
Calcium Sulfate
Calcium Phosphate
Barium Sulfate
Strontium Sulfate
Iron Hydroxide
Silicon Dioxide (Silica)
One type of membrane fouling comes from mineral
scale which can crystallize and grow at the membrane
surface leading to a loss in performance. Eliminating
mineral scale as a possible membrane foulant greatly
reduces the rate of fouling of any membrane system.
The conventional method of controlling membrane scal-
ing is to use synthetic organic compounds and poly-
mers, or anti-scalants, which work to inhibit the growth
of crystals. While somewhat effective, these chemi-
cals do have certain limitations and drawbacks.
Addition of these chemicals to the feed waters of the
membrane system increases the amount of waste, which
is problematic from an environmental point of view.
The exact dosing is not exactly known and so overdos-
ing is needed to ensure successful use. Anti-scalants
must often be tailor made for various scaling compo-
nents. The chemical addition adds to the operating costs
of a membrane system, increases its complexity, and
adds liability with regard to worker safety and dis-
charge. Phosphonate anti-scalants can lead to bio-foul-
ing of the membrane as the presence of phosphorous
promotes biological growth both in the membrane sys-
tem and in the sanitary discharge system.
This can put an unnecessary load on local POTW treat-
ment plants. Although anti-scalants are effective at re-
ducing mineral scale formation on membrane surfaces
there are other effective non-chemical methods more
desirable.
Organic Bio-fouling of aMembrane
Calcium Sulfate Crystal
Calcium Carbonate Crystal

Chemical Thermodynamics
The First Law of Thermodynamics states that energy
cannot be created or destroyed. Energy can only change
its form. Heat and Work are interchangeable forms of
energy. Heat can produce Work and Work can pro-
duce Heat. For example, steam drives a locomotive
and the brakeshoe of a railcar produces heat. Energy
is stored in materials is known as potential energy.
Chemical reactions occur if the free energy is reduced
overall. Chemical precipitation will occur if the re-
agents have reached their solubility limit and if the re-
action represents a favorable free energy change incre-
mentally, i.e. “on the margin”. By way of analogy, the
water in a mountain lake can reduce its free energy by
flowing down hill. It does not do so because incremen-
tally, it must first flow up hill over the banks of the lake
before going down hill. The process is halted because
locally, incrementally, “on the margin” the change in
free energy is increasing not decreasing, so nothing
happens. The same thing can happen in chemical sys-
tems when crystals or bubbles are forming.
Consider a supersaturated solution of Carbon Dioxide
in water like champagne. The bubbles of gas come out
of solution only at specific locations on the wall of the
glass. The small number of formation sites limits the
rate of gas evolution allowing the beverage to stay
“fizzy” for hours. Almost everywhere in the system,
for a bubble to form, locally, incrementally, and “on
the margin” the free energy must first increase to form
a bubble. Therefore nothing happens.
Equilibrium and Solubility
“For every action, there must be an equal and oppo-
site reaction” In stoichiometric chemistry calculations,
it is assumed that the reaction runs to completion. In
actual fact, a chemical reaction is a continuous state
of equilibrium. Each chemical reaction has its own
constant ratio of reactants and products. A reaction
my “look” finished when equilibrium is reached, but
what is happening is that forward and reverse reac-
tions are occurring simultaneously. Such is the case
for partially soluble solutes in a solvent.
Le Chatelier’s Principle states that if a system at equi-
librium changes, the system will shift its equilibrium
to compensate for the change. Each ionic compound
will have its own solubility limit. This is the maxi-
mum amount of component that can remain disasso-
ciated in solution. This is measured in g/L and is iden-
tified as Ksp (solubility product constant). The solu-
bility constant is dynamic and can change with tem-
perature, pressure, and pH swings.
There are several states also affecting the solubility
of compounds. If the amount of reactants is well be-
low the total amount that can be dissolved in solu-
tion, (below the solubility limit), the solution is said
to be dilute. In this case little or no precipitation will
occur. As the concentration of the reagents increases
and nears the solubility limit, the solution is said to
be a saturated solution. If the amounts of reagents
are above the solubility limit, the solution is “super-
saturated”. Around the solubility limit exists a zone
known as the “metastable” range. This is a range of
solubility levels at which precipitation can occur if
certain conditions exist in favorable ways.
Phase changes occur at liquid/solid interfaces. These
reagents will look for nucleation sites to assist in the
initiation of the precipitation process. In systems with
a lot of liquid/solid interface full of nucleation sites,
precipitation can occur readily at the lower end of the
metastable range of solubility. For systems with small
surface to liquid ratios or for surfaces low in surface
energy or nucleation sites, the solubility of reagents
must be increased to the super saturated condition
since access for the reagents to a favorable reaction
site are limited. Another factor is time. Precipitation
occurs at a finite rate determined by the number of
sites, the degree of saturation, temperature, pressure,
and many other variables.
Potential & Kinetic Energy
A Roller Coaster is an example of PotentialEnergy and Kinetic Energy. Energy converted towork as the car is pulled to the top is stored andreleased as the car reaches the crest

change rapidly with the addition of huge amounts of
nucleation sites. Long ago, chemists invented boiling
beads to prevent such dangerous percolation effects in
hot beakers of water.
Osmosis and Reverse Osmosis
Gibb’s Law of Free Energy also explains the process
of Osmosis. Gibb’s noticed that particles of pollen when
added to water would move in a random pattern. His
theory was that nuclei within the bulk liquid were in a
constant state of collision and that this random pattern
represented a state of equilibrium. This was later proven
mathematically by Einstein in 1905.
It turns out that ions in solution exert a pressure on the
walls of the container exactly as though they were gas
molecules. If two chambers are separated by a reverse
osmosis membrane (permeable to water but not ions),
with pure water on one side and water plus ions on the
other side, there will be a pressure difference between
the two chambers according to the relation PV=nRT.
This is the ideal gas law. P is the osmotic pressure, V
is the volume of each chamber, n is the number of moles
of dissociated ions in each chamber, R is the universal
gas constant and T is degrees Kelvin. The pure water
side has zero osmotic pressure since n is zero on this
side. We know that one mole occupies 22.4 liters at
standard temperature of 25 degrees C and one
atmosphere. Therefore 1/ 22.4 moles per liter of ions
will exert one bar of osmotic pressure on the side with
the dissolved electrolyte.
Saturation of Soluble Ions during Filtration
When pressure is applied and reverse osmosis occurs,
nearly pure water is forced through the membrane thus
changing the equilibrium and consequently the concen-
tration of solutes to solvent. If this process continues
until the solute reaches it limit of solubility, precipita-
tion is likely to occur. Once precipitation has begun at
appropriate nucleation sites, as more water is removed
more product is created from the reagents. This will
continue, as the system will attempt to keep the con-
centration of solutes at or below the solubility limit. If
water is removed by filtration, but not in enough quan-
tity to reach the solubility limit of the solutes, no scal-
ing or precipitation will occur. One method used dur-
ing conventional membrane filtration is recover water
from the system to the point where solubility limits are
not reached. The second method is to use anti-scalants
Specifically, suppose a very small bubble did appear in
the middle of the glass, away from the wall. This tiny
bubble will have a surface tension as all liquid gas in-
terfaces do. The pressure inside any gas bubble is twice
the surface tension divided by the radius of the bubble.
For a newly forming bubble, this pressure is therefore
very high (one over R is a big number), but if the gas
pressure is higher than the pressure that was originally
used to supersaturate the liquid, not only won’t the
bubble grow, it will in fact shrink and disappear. The
system lowers its free energy by some gas leaving the
water, but it raises its free energy by creating new in-
terfacial area ( the units of surface tension are energy
per unit area). On balance the process cannot occur
because the net change is an increase of free energy.
For the precipitation of solids from a saturated solu-
tions, the same analysis applies. In all cases of nucle-
ation, the phase change results in a favorable energy
change proportional to volume precipitated or radius
cubed, combined with an unfavorable energy change
proportional to new area created or radius squared. For
small values of radius (nucleation by definition) r
squared is bigger than r cubed and so the process is
unfavorable energetically.
To get gas evolution, we need a “seed” bubble, or nucle-
ation site. This is provided by the walls of the glass. A
typical gas nucleation site is a crevice in which there is
pre-trapped air or gas. At such a place, the pre-existing
liquid/gas interface can have a radius of curvature such
that the interface can grow instead of shrink. The result
is that the bubble grows out of this feature until it is so
big that buoyancy lifts it up and a pinch off occurs.
Then the process begins again, with the result being a
steady stream of bubbles leaving that nucleation site.
This explains a number of common experiences we
have all had. It explains why shaking a can of soda
makes it fizz explosively when opened. The shaking
puts thousands of small bubbles into the soda. When
opened, these nucleation sites allow gas evolution by
bubble growth at each site, causing explosive fizzing.
A cup of nearly pure water put in a microwave and
heated presents an imbalance of gas molecules (steam)
wanting to escape and looking for nucleation sites. If
the cup is very smooth with few nucleation sites and
there are no impurities in the liquid, the gas will be
starved for nucleation sites.
When the cup is removed from the microwave and a
tea bag is placed in the hot water, an explosive reaction
can occur as the enthalpy of the system is allowed to

that either inhibit the growth of crystals or sequester
the reagents and thus reduce the available concentra-
tion. Another method is to seed the reagents with over-
whelming alternate sources for nucleation and dilute
any effect of nucleation near the membrane surface.
Calculating % Recovery & Solubility Limits
Conventional membrane systems have strict guidelines
for incoming feed water composition. The reason for
this is to minimize the potential problem of scaling or
precipitating of slightly soluble ions. Precipitated in-
soluble materials like mineral scale can foul or blind
off crossflow membranes quickly. These must be con-
trolled in order to operate the system properly. Levels
of reagents are measured to insure that they will re-
main soluble during the filtration process. These lim-
its can be exceeded to some degree if antiscalants are
used to consume reagents or to inhibit and block growth
of scale.
For example:
Well Water is to be treated using membranes for puri-
fication. The water contains 30 ppm of dissolved silica
(SiO2). The solubility limit of Silica can be 120 ppm
depending on pH and temperature. To figure how much
pure water can be extracted through filtration before
the solubility limit of silica is reached the following
equations can be used:
120 ppm (Ksp) ÷ 30 ppm = 4
The Silica can be volume reduced by a factor of 4 be-
fore the solubility limit will be reached.
100% ÷ 4 = 25%
The liquid volume can be reduced by 75% so that a
concentrate volume of 25% is left at which point the
solubility limit has been reached. This is also known
as a 75% recovery. Since near the solubility limit, there
is a metastable region where precipitation can occur
prior to the solubility limit if favorable conditions ex-
ist some safety factor must be used. Slight variations
in temperature, pressure, and pH can shift the point of
solubility and cause unexpected scaling. For this rea-
son, conventional membrane systems are not run at the
solubility limit, rather they are run at significantly less
than that or anti-scalants are used to insure safety fac-
tor.
In the example above, with 30 ppm of Silica, safe op-
eration for conventional membrane systems would be
at 50% recovery without pretreatment or 75% recov-
ery with antiscalant addition. If the silica content of
the raw water was 100 ppm, the water is almost not
treatable using conventional membranes alone. Water
softening must be used to reduce the hardness and min-
eral content to sufficiently low levels prior to entry into
the membrane system.
It should be mentioned that effective means are avail-
able for cleaning of mineral scale and many membrane
systems are fitted with Clean in Place (CIP) functions
for this purpose. The difficulty is that with rapid or
heavy mineral scale formation, membrane cleaning
would be frequent and expensive.
Kinetics of Scaling
The discussion above concludes that it is
thermodynamically impossible to begin the
precipitation or crystallization process without a
nucleation site.
Once the process of precipitation has begun it is a
separate analysis that is required to get the rate at which
precipitation will occur. To grow a crystal, atoms must
diffuse toward the interface where they can incorporate
into the solid phase. There is therefore a depleted region
near the surface of all forming particles which is fed
by diffusion from the bulk solution. Antiscalants do
their job by interfering with the arrival and
incorporation of ions into the particle. These are surface
active molecules which absorb to the growing nucleated
particles thus getting in the way of the dissolved mineral
salts attempting to precipitate. Without antiscalants,
the rate is predominantly controlled by the total amount
Filtration Samples of Wastewater

Scale Problems & Conventional Membranes
When scaling occurs in a membrane system, colloids
of insoluble mineral salts are formed. While some scal-
ing can occur on the membrane itself, most of it will
occur at other more efficient locations and then will
become suspended colloids, which will act as any other
suspended solid during the filtration process. Conven-
tional membranes are subject to colloidal fouling as
suspended matter can become polarized at the mem-
brane surface and obstruct filtration. Crossflow is used
to reduce the effects of concentration polarization. The
main problem with scaling for membrane systems is
that the process introduces a large amount of potential
foulants into the system, which can reduce flux. Just
as conventional membranes have limits on TDS due to
the solubility limits of the various constituents, they
also have limits on TSS, as colloidal fouling will oc-
cur if these levels are too high.
Scaling Formation in Vibrating Membranes
V✧SEP employs torsional oscillation at a rate of 50
Hz at the membrane surface to inhibit diffusion polar-
ization of suspended colloids. This is a very effective
method of colloid repulsion as sinusoidal shear waves
from the membrane surface help to repel oncoming
particles. The result is that suspended solids are held
in suspension hovering above the membrane as a par-
allel layer where they can be washed away by tangen-
tial crossflow.
This washing away process occurs at equilibrium. Pres-
sure and filtration rate will determine the thickness and
mass of the suspended layer. Particles of suspended
colloids will be washed away by crossflow and at the
same time new particles will arrive. The removal and
arrival rate will be different at first until parody is
of liquid-solid interfacial area. The rate is pretty much
controlled by diffusion at each individual particle. If
the particles are attached to a membrane surface, then
one-sided growth may occur because the membrane
limits access to the adjacent particle surface. In this
case particles may grow as a sheet until they form a
contiguous mat of precipitate in the membrane surface.
From a fouling perspective this is very undesirable.
In a functioning membrane system there are
simultaneous processes some potentially capable of
fouling the membrane surface while others are
harmless. Far from the membrane surface, there are
nucleation sites in the form of free floating colloidal
particles. Perhaps these arrive with the feed material,
or maybe they have formed by chemical precipitation.
These particles remove the stress of super saturation at
a rate proportional to the total surface area of these
particles. Meanwhile, at the membrane surface, the
stress of super saturation is growing as water is
removed, and supersaturated liquid is created at the
membrane surface. The concentration is a maximum
at the membrane surface, and decays away into the bulk
liquid. If there are solid particles available to serve as
nucleation sites at the membrane surface these will
grow at the fastest rate since they exist at the highest
degree of super saturation. If there are no such particles,
nucleation is suppressed, and the ions rejected by the
membrane will diffuse away into the bulk where they
will precipitate on free floating particles. These
particles will eventually be convected out with the
reject stream and so fouling does not occur. It really
matters from a fouling stand point whether the
nucleation sites are on the membrane surface, or are in
the bulk solution. The nucleation site for
commencement can be any perturbation of a surface at
a liquid/solid interface. This surface can be a polymeric
membrane, suspended solids, system components, etc.
Some nucleation sites are more favorable than others,
so crystallization and scaling will occur first at the most
favorable perturbations with the most amounts of free
energy available. While some scaling can occur on a
polymeric membrane itself, most membrane surfaces
are relatively low energy and are not the best source
for crystal formation. Most crystal formation will occur
in the bulk of the liquid where plenty of imperfect solid
surfaces exist in the form or suspended solids, cake
layers of organic matter, metal components, etc.
Fouling occurs if the population of nucleation sites at
the membrane surface is large in comparison to the
number of sites away from the membrane surface.
Dynamic Filtration
Fluid Dynamics Comparison Between V✧SEPand Conventional Crossflow Filtration

reached and the system is at a state of equilibrium with
respect to the diffusion layer. (Also known as a bound-
ary layer) This layer is permeable and is not attached
to the membrane but is actually suspended above it.
In V✧SEP, this layer acts as a nucleation site for min-
eral scaling. Mineral scale that precipitates will act in
just the same way as any other arriving colloid. If too
many of the scale colloids are formed, more will be
removed to maintain the equilibrium of the diffusion
layer. As documented by other studies, V✧SEP is not
limited when it comes to TSS concentrations as con-
ventional membrane systems are. Conventional mem-
brane systems could develop cakes of colloids that
would grow large enough to completely blind the con-
ventional membrane. In V✧SEP, no matter how many
colloids arrive at the membrane surface there are an
equal number removed as the diffusion layer is limited
in size and cannot grow large enough to blind the sys-
tem. In fact V✧SEP is capable of filtration of any liq-
uid solution as long as it remains a liquid. At a certain
point, as water or solvent is removed, the solution will
reach a gel point. This is the limitation of V✧SEP.
V✧SEP Advantages
In the V✧SEP membrane system, scaling will occur in
the bulk liquid and become just another suspended col-
loid. One other significant advantage is that the vibra-
tion and oscillation of the membrane surface itself in-
hibits crystal formation. Just as a stirred pot won’t boil,
lateral displacement of the membrane helps to lower
the available surface energy for nucleation. Free en-
ergy is available at perturbations and non-uniform fea-
tures of liquid/solid interfaces. With the movement of
the membrane back and forth at a speed of 50 times per
second, any valleys, peaks, ridges, or other micro im-
perfections become more uniform and less prominent.
The smoother and more uniform a surface, the less free
energy is available for crystallization.
In the absence of any other nucleation sites, this would
lead to a super-saturated solution. In actual fact, what
happens is that nucleation occurs first and primarily at
other nucleation sites not being on the membrane, which
present much more favorable conditions for nucleation.
Crystals and scale also take time to form. The moving
target of the membrane surface does not allow suffi-
cient time for proper germination and development.
Other stationary features within V✧SEP present a much
more favorable nucleation site. Whereas, with conven-
tional membranes that are static, scale formation on the
membrane is possible and has plenty of time to develop
and grow. Another feature of V✧SEP is that filtration
occurs at a dramatically higher rate per m2 than with
conventional membranes due to the suspension of col-
loids above the membrane. Studies have shown as
much as a 15x improvement in flux per area. The re-
sult of this is that as much as 1/15th
of the membrane
area is required to do the same job as a conventional
crossflow membrane. This is beneficial for many rea-
sons one of which is hold up volume of feed waters.
The result is that filtration occurs quickly and the length
of travel of feed waters over membrane surfaces is re-
duced by as much at 15x. This means that there is much
less time for scaling and crystal formation within the
membrane system. Crystal formation is a function of
time, especially with respect to Silica, which is very
slow to grow. If scaling is to occur within the system,
it will more likely occur at high-energy nucleation
points and not on the membrane. In addition to that,
the high filtration rate is capable of making a super satu-
rated solution, which may not even have residence time
sufficient to react within the membrane system itself
and may wait until it has been discharge to complete
the equilibrium process.
Tangential Flow Pattern in Crossflow Membrane Systems
RelativeFluid
Velocity
Open ChannelBulk Fluid Flow
PermeableMembrane
Tangential Flow Pattern in Vibratory V✧SEP Membrane Systems
RelativeFluid
Velocity
Open ChannelBulk Fluid Flow
PermeableMembrane
Laminar Flow Patterns withinConventional Crossflow & V✧SEP

In fact, full scale V✧SEP membrane systems employ-
ing vibrational shear are installed for a colloidal silica
gel processing application. The concentrations of silica
are way beyond even the point of super saturation and
the function of filtration is dewatering of suspended
insoluble silica colloids. Other installations include
Calcium Carbonate concentration, Titanium Dioxide
dewatering, Bentonite Clay clarification, and other pre-
cipitated earth metal mineral slurries.
Validation Testing
A test protocol was developed to test the theories pro-
posed above. In this case, V✧SEP would be tested
with respect to mineral scaling so that the actual re-
sults can be used to confirm theory. It is necessary to
isolate the variable of mineral scale formation on the
membrane itself in a static system and also in a vibrat-
ing membrane system for comparison. To test this
theory the following protocol was developed.
Protocol One: Tap Water Concentration
Objective
Normal City tap water contains reagents for hardness
precipitation. The first study looked at measuring the
concentrations of earth metal ions in the water and then
concentrating the solution past the point of the solu-
bility of these materials. The objective of this test is to
isolate the variable of mineral scale formation and
measure its effect on membranes while vibrating. Based
on the process objectives given, the following mem-
brane was chosen for study:
Procedure
The V✧SEP pilot scale Series L unit and feed tank
was used for this test with X-20 Polyamide membrane
installed. The system is first configured in “Slipstream
Mode”. Once the membrane is installed and the ma-
chine is configured, the system is first started up run-
ning on a continuous feed of DI (deionized) water for
a 100 hour “Line Out Study”.
The data from this is collected for comparison. Then
the system is fed with 100 gallons of DI water with
NaCl added to simulate the conductivity of normal tap
water. The permeate is discharged to drain and the rejct
is returned to the feed tank for a concentration study in
“Batch Mode”. Once this data has been collected, the
system is set up with the same feed tank filled with
Ultrafiltration permeate of tap water. The unit is started
and fed water out of the tank and permeate is sent to
drain while reject from the filtration is returned to the
feed tank. The tank is volume reduced until 99.98%
of the volume is removed as filtrate.
Performance
The following Table shows the relative performance
of each study
* Flow Rates are ml/min corrected to 25°C
X-20™* Reverse Osmosis MembraneComposition Polyamide Urea
Nominal Salt Rejection 99.0%
Operating Pressure 0-600 psi
Continuous pH Range 4-11
Max Flat Sheet Temp 60ºC*X-20 is manufactured by Trisep corporation under license from Dupont
FEED TANK15 gallons
V✧SEPSeries LP
Sewer
Feed fromthe Plant
"Slipstream"Operation
FEED TANK15 gallons
V✧SEPSeries LP
Permeate
Concentrate
PermeateTANK
15 gallons
BatchConcentration
Operation
Line Out Initial Flow Ending Flow
DI Water 132 ml 92 ml
NaCl + DI Water 99% Rec 125 ml 75 ml
UF Permeate 99.98% Rec 128 ml 72 ml
Table 1: Tap Water Sample Analysis
Description
RO Feed Water
RO Permeate
RO Concentrate
Silica
5.3 ppm
<1 ppm
26,200 ppm
*TC 25ºC, pH 7.0, 400 psi
Solubility Limit
Calcium
24 ppm
2 ppm
110,000 ppm
Magnesium
5.5 ppm
<1 ppm
27,400 ppm
Barium
<1 ppm
ND
1,130 ppm
120 ppm 180 ppm 42 ppm 10 ppm
Samples of Tap Water

The objective is to isolate the effects of solubility of
various reagents as much as possible. Many variables
can affect permeate flow rates over time. Here the DI
water test was used to measure what effect 100 hours
of 450-psi pressure would have on the membrane. The
concentration of saline DI water can be used to mea-
sure the effects of polarization of ionic species. The
final line out study uses UF permeate of tap water where
suspended solids colloids, and organic materials are
removed by the UF process so that the remaining solu-
tion contains only dissolved and disassociated ions and
water. The final line out adds the effect of solubility
limits being reached and surpassed. The effects of time
and pressure and the effects of ionic polarization can
be measured. The final line out includes these two vari-
ables as well as mineral precipitation. If the first two
variables are subtracted from the final results, it is as-
sumed the remaining measured effect is nearly entirely
due to mineral scale formation.
Results
The data series represents the final UF permeate con-
centration with the effects of ionic polarization and pres-
sure effects being removed according to the data in the
first two line outs. This final data series shows the iso-
lated effect of filtration past the solubility limits of
mineral reagents in tap water.
Protocol Two - Super-Saturated Silica Filtration
Objective
The first test measured performance on the various
minerals found in tap water as they reach their solubil-
ity limit. This test was done to measure performance
of vibrating membranes while dewatering a super-satu-
rated solution of dissolved silica. The objective is to
isolate silica precipitation alone and measure the effect
on filtration rates.
Procedure
The V✧SEP pilot scale Series L unit and feed tank was
used for this test with X-20 Polyamide membrane in-
stalled. The system is first configured in “Batch Mode”.
A solution of super-saturated dissolved silica is pre-
pared by first dissolving Silicon metal fines in a ten-
gallon solution of pH10 RO Permeate water. The con-
centrated solution of dissolved Silica is added to the
feed tank and pH adjusted to 7.0 using HCl. At this
reduced pH, the solubility limit has been surpassed and
the solution is super-saturated. Once the membrane is
installed and the machine is configured, the system is
first started up running on a continuous feed of satu-
rated Silica for a 150 hour “Line Out Study”. The data
0 20 40 60 80 100
40
60
80
100
% Recovery
GF
D (
Ga
llo
ns/
SF
/Da
y)
RO Concentration of Municiple Tap WaterUsing VSEP (Vibratory Shear Enhanced Process)Test Conditions: 400 psi, 25ºC, City of Oakland Tap Water
90
70
50
99.98% Recovery
Graph OneFlux vs % RecoveryConcentration of Tap Waterpast the solubility limits ofvarious divalent metalsillustrating scaling resis-tance of V✧SEP

from this is collected for comparison. Then the perme-
ate is discharged to drain until 5 gallons of water have
been removed. Once this data has been collected, the
system is run for a long-term line out study.
Performance
The following Table shows the performance of the study
during the “Line Out” & “Concentration” period
* Flow Rates are ml/min corrected to 25°C
Results
The results of the line out and concentration are shown graphi-
cally. The first data series shows the effects of flux vs time
as the boundary layer of colloidal suspended solids forms
over the membrane and finally reaches equilibrium. The sec-
ond data series shows primarily the results of ionic polariza-
tion as the feed water is concentrated. No sign of significant
Silica wetting or scaling is apparent.
Procedure: Initial Flow Ending Flow
Saturated Silica Line Out 132 ml 105 ml
Silica Concentration 128 ml 85 ml
0 30 60 90 120 150
60
80
100
120
Time (Hours)
GF
D (
Ga
llo
ns/
SF
/Da
y)
RO Flux vs. Time on Saturated SiO2Using VSEP (Vibratory Shear Enhanced Process)Test Conditions: 400 psi, 25ºC, Saturated Silica Slurry
Distilled Water saturated
with dissolved and suspended
Silicon (Si) and Silica (SiO2)
0 20 40 60 80 100
60
80
100
% Recovery
GF
D (
Gall
on
s/S
F/D
ay)
RO Concentration of Saturated SiO2Using VSEP (Vibratory Shear Enhanced Process)Test Conditions: 400 psi, 25ºC, pH 7.0, Saturated Dissolved Silica Slurry
90
70
98.5% Recovery
Graph Two (Above Right)Flux vs % Time
Filtration of Saturated Silica Line out
Graph Three (Right)Flux vs % % Recovery
Concentration of Saturated Silica
Table 2: Saturated Silicon/Silica Sample Analysis
Description
RO Feed Water Total Silica Concentration
RO Permeate Total Silica Concentration
RO Concentrate Total Silica Concentration
Amount
620 ppm
42 ppm
31,900 ppm
*TC 25ºC, pH 7.0, 400 psi
Total Permeate Recovery 98.5 %

Protocol 3 - Saturated Calcium Sulfate Filtration
Objective
Since Silica scale forms by wetting surfaces and tap
water contains a composite amount of scalants, another
test was conducted to isolate one specific crystallizing
mineral scalant. The objective of this test was to iso-
late Calcium Sulfate (Gypsum) precipitation alone and
measure the effect on filtration rates.
Procedure
A pH 3 solution of super-saturated dissolved CaSO4 is
prepared by first dissolving in water and then filtering
using a UF membrane. The UF membrane is used to
removed any suspended solids and leave behind dis-
solved Calcium in the presence of Sulfates. The con-
centrated solution of dissolved Calcium Sulfate is
added to the feed tank and pH adjusted to 8.0 using
HCl. At this pH, the solubility limit has been surpassed
and the solution is super-saturated. The solution is fil-
ter using an X-20 RO membrane and concentrated by
removing permeate from the feed tank until 98.5% of
the water has been taken out.
Performance
The following Table shows the performance of the
study during the “Line Out” period
* Flow Rates are ml/min corrected to 25°C
Results
The results of the data series shows primarily the re-
sults of colloidal polarization as the feed water is con-
centrated. No sign of significant mineral scaling is appar-
ent.
0 20 40 60 80 100
50
60
70
80
% Recovery
GF
D (
Gall
on
s/S
F/D
ay)
RO Concentration of Saturated CaSO4
Using VSEP (Vibratory Shear Enhanced Process)Test Conditions: 400 psi, 25ºC, Calcium Sulfate Slurry
75
65
5598.50% Recovery
Graph Four
Flux vs % RecoveryConcentration of Calcium Sulfate past the solubility limit
Procedure: Initial Flow Ending Flow
Gypsum Concentration 94 ml 70 ml
Table 1: Saturated Calcium Sulfate Sample Analysis
Description
RO Feed Water Calcium Concentration
RO Permeate Calcium Concentration
RO Concentrate Calcium Concentration
Amount
1420 ppm
30 ppm
92,600 ppm
*TC 25ºC, pH 8.0, 400 psi
Total Permeate Recovery 98.5 %
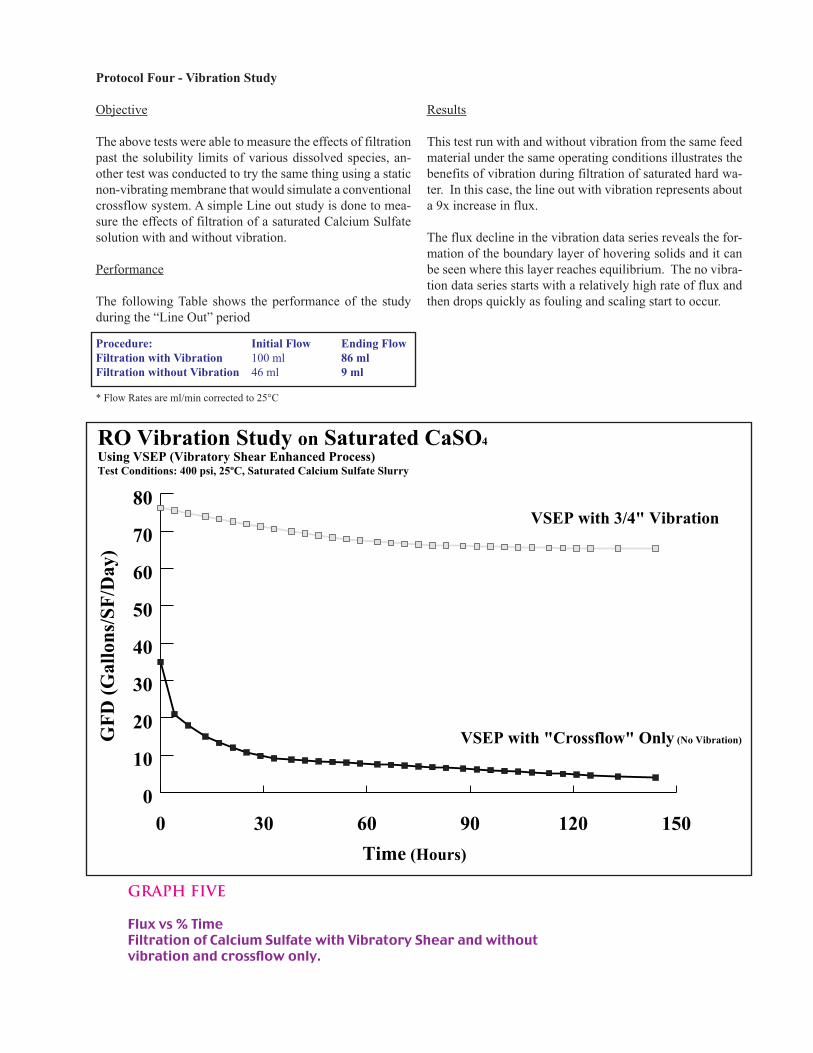
Protocol Four - Vibration Study
Objective
The above tests were able to measure the effects of filtration
past the solubility limits of various dissolved species, an-
other test was conducted to try the same thing using a static
non-vibrating membrane that would simulate a conventional
crossflow system. A simple Line out study is done to mea-
sure the effects of filtration of a saturated Calcium Sulfate
solution with and without vibration.
Performance
The following Table shows the performance of the study
during the “Line Out” period
* Flow Rates are ml/min corrected to 25°C
Results
This test run with and without vibration from the same feed
material under the same operating conditions illustrates the
benefits of vibration during filtration of saturated hard wa-
ter. In this case, the line out with vibration represents about
a 9x increase in flux.
The flux decline in the vibration data series reveals the for-
mation of the boundary layer of hovering solids and it can
be seen where this layer reaches equilibrium. The no vibra-
tion data series starts with a relatively high rate of flux and
then drops quickly as fouling and scaling start to occur.
Procedure: Initial Flow Ending Flow
Filtration with Vibration 100 ml 86 ml
Filtration without Vibration 46 ml 9 ml
0 30 60 90 120 150
0
10
20
30
40
50
60
70
80
Time (Hours)
GF
D (
Ga
llo
ns/
SF
/Da
y)
RO Vibration Study on Saturated CaSO4
Using VSEP (Vibratory Shear Enhanced Process)Test Conditions: 400 psi, 25ºC, Saturated Calcium Sulfate Slurry
VSEP with 3/4" Vibration
VSEP with "Crossflow" Only (No Vibration)
Graph Five
Flux vs % TimeFiltration of Calcium Sulfate with Vibratory Shear and withoutvibration and crossflow only.
References
[1] Douglas M Ruthven, Separation Technology, Wiley-Interscience 1997
[2] J. Mallevialle, I.H. Suffet, U. S. Chan, Influence and Removal of Oraganics in Drinking Water,
Lewis Publishers 1992
[3] Milton J. Rosen, Surfactants and Interfacial Phenomena, Second Edition, Wiley Publications, 1898
[4] I. Bremere, M. Kennedy, P Michel, R. Emmerick, G. Witkamp, J. Schippers, Desalinatiuon (1999)
51-62
[5] R. J. Bowell, Sulfate and Salt Minerals, Mining Environmental Management May 2000
[6] R. Brian, K. Yammamoto, Y. Watanabe, Desalination Publications, ISBN 0-86689-060-2, Oct 2000
Conclusion
Other studies have shown that vibration can reduce the effects of concentration polarization while
using UF membranes, this study illustrates the effects are the same for RO membranes. Mineral scal-
ing, predominant in conventional membrane systems, which is caused by the deposition of colloidal
materials in close proximity to the membrane surface and leading to fouling can be held off the mem-
brane by vibrational shear found in systems like VSEP. Once mineral salts evolve, they would act as
any other suspended colloids in the vibrational membrane system. VSEP is uniquely capable of reduc-
ing the effects of colloidal fouling including precipitated mineral scales that can form. The study also
illustrates that nucleation and crystal formation occurs in the system, but, is not able to form in signifi-
cant quantities on the vibrating membrane surface itself, and rather, forms in the bulk of the media at
other more attractive nucleation sites with more available free energy.