kinetics of organic compound removal from waste … · kinetics of organic compound removal from...
TRANSCRIPT
Kinetics of Organic Compound Removal from Waste Gases with a Biological Filter
S. P. P. OTTENGRAF and A. H. C. VAN DEN OEVER, Department of Chemical Engineering, Eindhoven University of Technology, Eindhoven,
The Netherlands
Summary
In order to eliminate organic pollutants in waste gases, a biological filter bed technique has been developed, with a high self-regenerating capacity and a low pressure drop. The bed consists of an appropriate filling material (mainly peat compost), in order to let the microorganisms grow on the solid surface and to supply them with inorganic nutrients. Most organic compounds are oxidized to carbon dioxide and water. The compositions of the solid phase and the viable organ- isms present are such that aging is prevented, as a result of which a relatively high activity can be maintained during a long period of time (years). Experiments have been carried out in labora- tory-scale columns with composite gas mixtures at varied concentrations and superficial gas ve- locities. The (macro) kinetics of the elimination processes have been studied, which enables the prediction of the elimination capacity of the filter bed.
INTRODUCTION
In process and bioindustry, wastewater and sewage treatment works, and some branches of the food and allied products industry, problems are often encountered, with respect to waste gases, in which odorous organic compo- nents are present. In many cases, this kind of air pollution is only a source of nuisance, although sometimes the presence of toxic substances-even in low concentrations-directly endangers health. In many countries, a statutory control of air pollution is enforced, as a result of which small factories and industries (e.g. chemical plants, color factories, lacqueries, etc.) are in want of simple, inexpensive, and reliable waste gas cleaning techniques. The com- mon air deodorization processes applied are 1) physical treatment, such as absorbing or adsorbing polluting constituents in liquid or solid materials (e.g. activated carbon) or UV radiation and 2) chemical treatment, e.g., in- cineration, catalytic combustion, ozonization, and chlorination.
It is surprising that up to now little attention has been paid to the use of (micro)biological methods in the treatment of air effluents, although this technique can offer a number of advantages: it is inexpensive, reliable, and kind to the environment. In the case of biological treatment, waste gases are forced to rise through a packed bed, in which microorganisms are attached to an appropriate filling material, in order to let the microorganisms grow and
Biotechnology and Bioengineering, Vol. XXV, Pp. 3089-3102 (1983) 0 1983 John Wiley & Sons, Inc. CCC OOO6-3592/83/123089-14SO2.40

3090 OTTENGRAF AND VAN DEN OEVER
to supply them with nutrients supplementary to those present in the waste gas.
Up to now, this method has mainly been applied to eliminate odorous com- pounds present in low concentrations in certain waste gases (e.g., wastewater treatment plants, stock farms, compost factories, etc.). Thistlethwayte and co-workers' describe a trickling column packed with river gravel or with glass balls in which waste air, containing H2S, C2H5SH, (CzH5hNH, and C4H9CH0 flows in countercurrent with a nutrition solution. The column was seeded with activated sludge from sewage treatment works. Dependent on the liquid and air flow rate to the column, the removal percentages observed were from 40 up to 100% for the various contaminants. In German patent 2445.315 (CLBOlD), Kneer2 describes a method, in which organic impurities of waste gas or air are adsorbed by forcing the gas to rise through a bed con- taining particles inoculated with a biologically active material. The adsorbent particles are continuously removed at the bottom and after regeneration re- turned to the top of the container. Helmel3 uses soil filter beds to extract products of anaerobic fermentation of organic materials (e.g., NH3, H2S, sul- fides, alcohols, and aldehydes). Various types of filter beds, dry and wet, are described. Regeneration processes of the filter bed by microbial, thermal, and chemical methods are discussed by the author.
In our laboratory, an experimental investigation has been carried out to achieve the biological elimination of organic compounds from air effluents of lacqueries in a self-regenerating filter bed. We believe this technique is very promising for the treatment of many kinds of waste gases containing volatile organic compounds.
EXPERIMENTAL SETUP
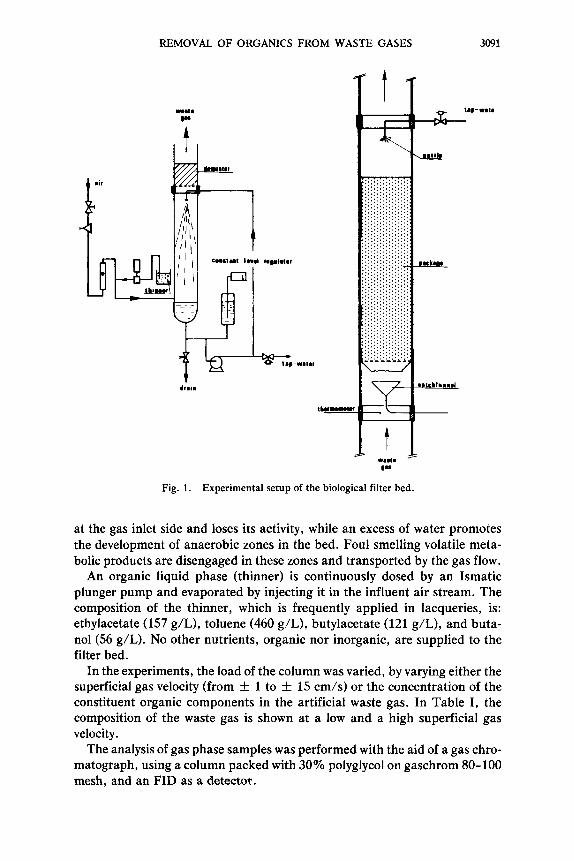
Experiments on the laboratory as well as the pilot scale have been carried out at room temperature during a period of almost two years. A scheme of the laboratory scaled experimental setup is shown in Figure 1. The laboratory- scale apparatus consists of Quick fit glass columns divided into five separate stages with an inner diameter of 6 in., having a height of 60 cm each.
At the bottom of each stage a perforated sieve plate is fitted to support the package, which consists mainly of peat compost. The package is inoculated with an activated sludge suspension from a municipal wastewater treatment plant and with a toluene-eliminating organism, isolated from samples of soil, taken in the vicinity of a petrol-filling station. To keep the humidity of the filter bed at a desired level of ca. 50-709'0, tap water is periodically sprayed by a nozzle, mounted at the top of each stage. Humidification of the package can also be carried out in a separate wetting column outside the filter bed. There is generally no other water removal from the system other than by the water- saturated effluent gas.
Experimentally, it has proved to be important to fulfill humidification con- ditions as best as possible. At an insufficient supply of water, the bed dries up
REMOVAL OF ORGANICS FROM WASTE GASES 3091
*=
Fig. 1. Experimental setup of the biological filter bed.
at the gas inlet side and loses its activity, while an excess of water promotes the development of anaerobic zones in the bed. Foul smelling volatile meta- bolic products are disengaged in these zones and transported by the gas flow.
An organic liquid phase (thinner) is continuously dosed by an Ismatic plunger pump and evaporated by injecting it in the influent air stream. The composition of the thinner, which is frequently applied in lacqueries, is: ethylacetate (157 g/L), toluene (460 g/L), butylacetate (121 g/L), and buta- no1 (56 g/L). No other nutrients, organic nor inorganic, are supplied to the filter bed.
In the experiments, the load of the column was varied, by varying either the superficial gas velocity (from -t- 1 to f 15 cm/s) or the concentration of the constituent organic components in the artificial waste gas. In Table I, the composition of the waste gas is shown at a low and a high superficial gas velocity.
The analysis of gas phase samples was performed with the aid of a gas chro- matograph, using a column packed with 30% polyglycol on gaschrom 80-100 mesh, and an FID as a detector.
3092 OTTENGRAF AND VAN DEN OEVER
TABLE I Gas Inlet Concentrations
Gas velocity (cm/s)
Component 0.84 14.8
Gas inlet concentration (g/m3)
Toluene 5.606 0.308 Butylacetate 1.527 0.050 Ethylacetate 1.377 0.064 Butanol 0.692 . . .
THEORETICAL MODEL
In the following, a theoretical model is presented which describes the elimi- nation of the carbon sources in the filter bed. This model builds on a theoreti- cal model that was already presented by Jennings and co-workers4 and which was commented by Ottengraf .5 Jennings developed a mathematical model for percentage of removal of a pure, nonadsorbable, biodegradable substrate in a submerged biological filter using the nonlinear Monod expression for the sub- strate utilization rate. In their model, the authors start from a biological slime layer coating a spherical particle. The slime layer is in its turn surrounded by a liquid boundary layer. In the liquid boundary layer, Jennings and co-work- ers properly suppose interface mass transfer resistance.
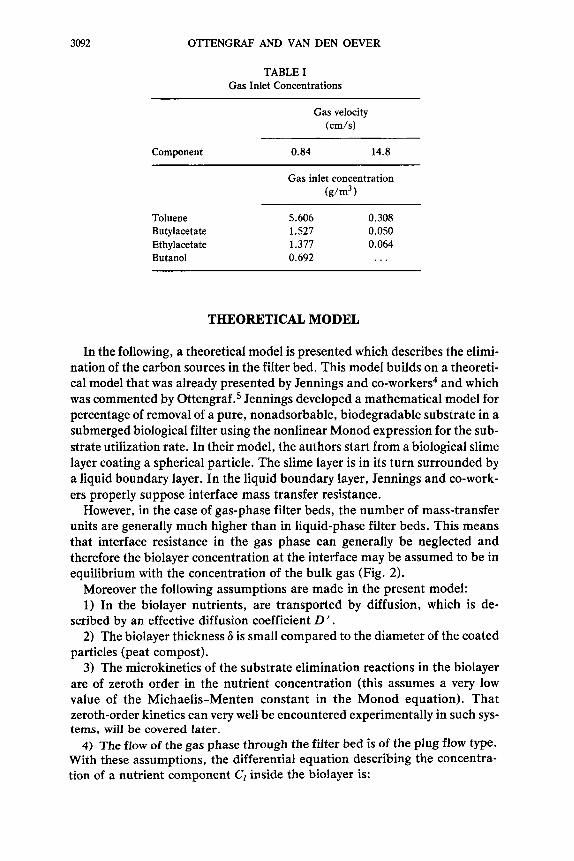
However, in the case of gas-phase filter beds, the number of mass-transfer units are generally much higher than in liquid-phase filter beds. This means that interface resistance in the gas phase can generally be neglected and therefore the biolayer concentration at the interface may be assumed to be in equilibrium with the concentration of the bulk gas (Fig. 2).
Moreover the following assumptions are made in the present model: 1) In the biolayer nutrients, are transported by diffusion, which is de-
scribed by an effective diffusion coefficient D ’ . 2) The biolayer thickness 6 is small compared to the diameter of the coated
particles (peat compost). 3) The microkinetics of the substrate elimination reactions in the biolayer
are of zeroth order in the nutrient concentration (this assumes a very low value of the Michaelis-Menten constant in the Monod equation). That zeroth-order kinetics can very well be encountered experimentally in such sys- tems, will be covered later.
4) The flow of the gas phase through the filter bed is of the plug flow type. With these assumptions, the differential equation describing the concentra- tion of a nutrient component C, inside the biolayer is:
REMOVAL OF ORGANICS FROM WASTE GASES 3093
0
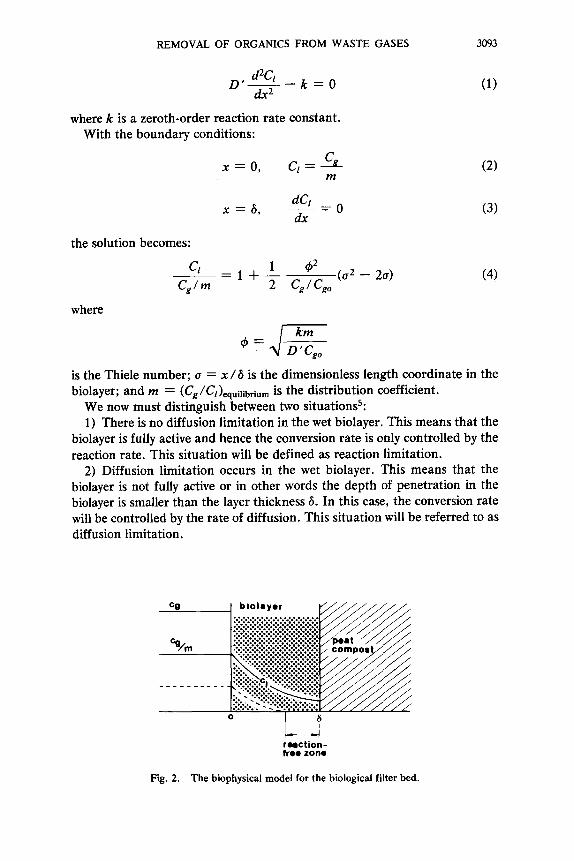
where k is a zeroth-order reaction rate constant. With the boundary conditions:
6
C m
x = o , c,=-
dC1 -0 x = 6 , -- dx
the solution becomes:
where
is the Thiele number; a = x/6 is the dimensionless length coordinate in the biolayer; and rn = (Cg /Cl)equilibrium is the distribution coefficient.
We now must distinguish between two situations5: 1) There is no diffusion limitation in the wet biolayer. This means that the
biolayer is fully active and hence the conversion rate is only controlled by the reaction rate. This situation will be defined as reaction limitation.
2) Diffusion limitation occurs in the wet biolayer. This means that the biolayer is not fully active or in other words the depth of penetration in the biolayer is smaller than the layer thickness 6. In this case, the conversion rate will be controlled by the rate of diffusion. This situation will be referred to as diffusion limitation.
U rwction- troo zono
Fig. 2. The biophysical model for the biological filter bed.

3094 OTTENGRAF AND VAN DEN OEVER
Reaction Limitation
From a gas-phase mass balance on the substrate it follows for the gas con- centration at a height h of the filter bed, with A, the biolayer surface per volume of package and N the substrate flux into the biolayer:
dC -UE--$ = NA,
where
From eqs. (5) and (6) it follows for the exit gas concentration Cge with the boundary conditions h = 0 and CE = CEO:
where H is the height of the tower. Assuming A,k6 = K to be constant, it follows that
and for the degree of conversion$
Diffusion Limitation
This phenomenon, which is schematically shown in Figure 2 by the dotted line, occurs at an insufficiently high rate of diffusion compared to the sub- strate utilization rate. As the rate of diffusion is controlled by the concentra- tion gradient in the biolayer and therefore by the concentration level at the interface, this situation is possible at lower gas-phase concentration levels. The occurrence of a reaction-free zone is physically determined by the value of the Thiele number. By substituting C, = 0 at u = 1 in eq. (4), it can easily be derived that the critical value of the Thiele number at which diffusion limita- tion just occurs amounts to:
At lower gas-phase concentrations, C, corresponding with this value, the conversion rate and thus the elimination capacity of the filter bed will not only be controlled by the reaction rate but also by the diffusion rate in the biolayer. That this condition is indeed experimentally encountered will be shown in the next section.

REMOVAL OF ORGANICS FROM WASTE GASES 3095
The boundary condition according to eq. (3) has now changed into:
The solution of differential eq. (1) becomes:
Since C, = 0 at u = h/6, eq. (10) makes it possible to calculate the penetra- tion thickness A:
"4- (11)
From a gas-phase mass balance on the substrate, it now follows for the gas concentration at a height h of the filter bed:
dC - U g y = NA, = khA,
From eqs. (11) and (12), it follows for the exit gas concentration C,, with the boundary conditions h = 0 and C, = C,,:
From eq. (13), it can be concluded that in this case the elimination capacity of the filter bed will be controlled by both the reaction rate as well as the diffu- sion rate.
EXPERIMENTAL RESUX/IS
Batch-Experimental Investigation of the Microkinetics
From experimental studies in shaking flasks, the microkinetics of the sub- strate elimination reactions have been determined. For that purpose, a sam- ple of the soil in the filter column was taken, and from it three strains were isolated. Each of these strains was inoculated in four shake flasks, containing either butanol, butylacetate, ethylacetate, or toluene as a sole carbon source in a watery solution of inorganic nutrients. The composition of the inorganic nutrient base is given in Table 11. The concentrations of the carbon sources in these cultures were measured as a function of time.
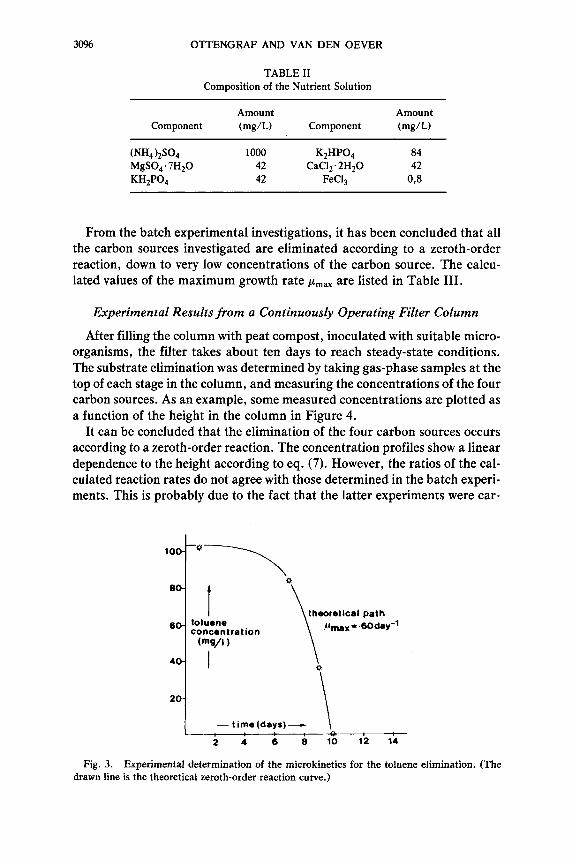
As an example, Figure 3 shows the measured concentrations of toluene as a carbon source. From the experimental data, a value of the maximum growth rate of pmax = 0.60 day-' has been calculated by means of a Lineweaver- Burk plot. As is shown in the figure, there is a good agreement with the theo- retical path according to zeroth-order reaction kinetics.
3096 OTTENGRAF AND VAN DEN OEVER
TABLE I1 Composition of the Nutrient Solution
Amount Amount Component (mg/L) Component (mg/L)
From the batch experimental investigations, it has been concluded that all the carbon sources investigated are eliminated according to a zeroth-order reaction, down to very low concentrations of the carbon source. The calcu- lated values of the maximum growth rate pmax are listed in Table 111.
Experimental Results from a Continuously Operating Filter Column
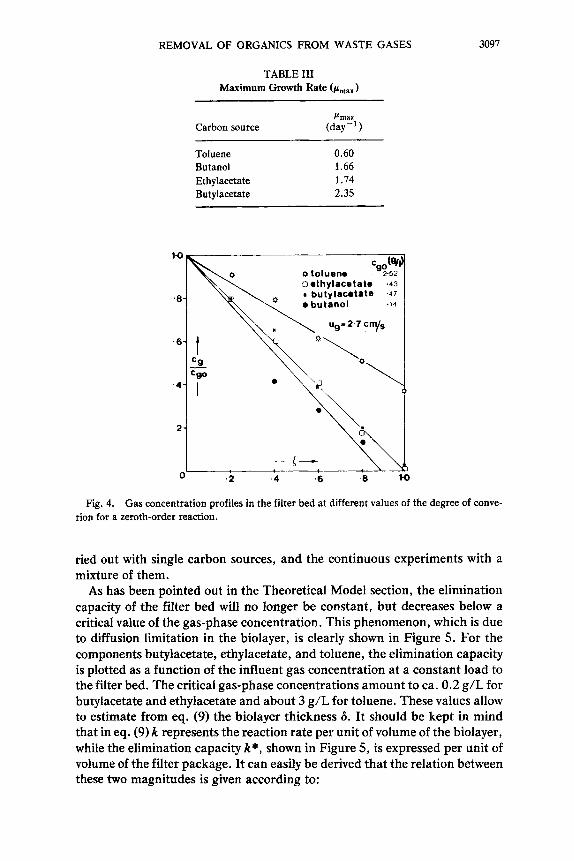
After filling the column with peat compost, inoculated with suitable micro- organisms, the filter takes about ten days to reach steady-state conditions. The substrate elimination was determined by taking gas-phase samples at the top of each stage in the column, and measuring the concentrations of the four carbon sources. As an example, some measured concentrations are plotted as a function of the height in the column in Figure 4.
It can be concluded that the elimination of the four carbon sources occurs according to a zeroth-order reaction. The concentration profiles show a linear dependence to the height according to eq. (7). However, the ratios of the cal- culated reaction rates do not agree with those determined in the batch experi- ments. This is probably due to the fact that the latter experiments were car-
100
80
60
40
20
I \ thuoretical oath . - P,,=.60dSy-' \ toluene
concentrat ion (ma/l)
\ I *
- time (days) : - ; \ = 2 4 6 8 10 12 14
Fig. 3. Experimental determination of the microkinetics for the toluene elimination. (The drawn line is the theoretical zeroth-order reaction curve.)
REMOVAL OF ORGANICS FROM WASTE GASES 3097
TABLE I11 Maximum Growth Rate (pma
Pmax Carbon source (day-')
Toluene Butanol Ethylacetate Butylacetate
0.60 1.66 1.74 2.35
2-
. 2 .4 .6 0
Fig. 4. Gas concentration profiles in the filter bed at different values of the degree of conve- rion for a zeroth-order reaction.
ried out with single carbon sources, and the continuous experiments with a mixture of them.
As has been pointed out in the Theoretical Model section, the elimination capacity of the filter bed will no longer be constant, but decreases below a critical value of the gas-phase concentration. This phenomenon, which is due to diffusion limitation in the biolayer, is clearly shown in Figure 5. For the components butylacetate, ethylacetate, and toluene, the elimination capacity is plotted as a function of the influent gas concentration at a constant load to the filter bed. The critical gas-phase concentrations amount to ca. 0.2 g/L for butylacetate and ethylacetate and about 3 g/L for toluene. These values allow to estimate from eq. (9) the biolayer thickness 6. It should be kept in mind that in eq. (9) k represents the reaction rate per unit of volume of the biolayer, while the elimination capacity k*, shown in Figure 5 , is expressed per unit of volume of the filter package. It can easily be derived that the relation between these two magnitudes is given according to:

3098 OTTENGRAF AND VAN DEN OEVER
1 k = k* (1 - €)[l - (1 - y]
where E is the void fraction of the package and dp is the mean particle diameter.
m) can be estimated from the pressure drop in the filter bed by means of the Ergun relation. In Table IV, the calculated values for the biolayer thickness are given; they look very reasonable.
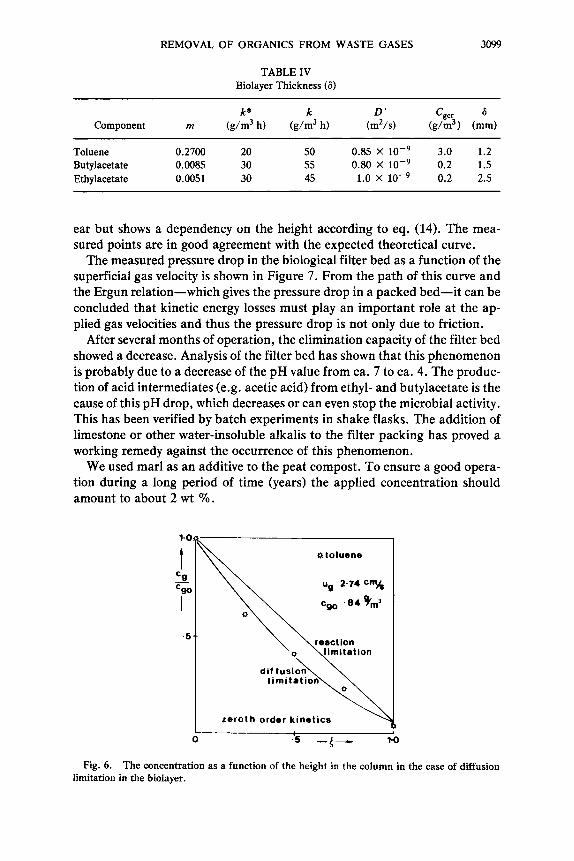
The phenomenon of diffusion limitation in the biolayer also finds its ex- pression, if the gas-phase concentration is plotted as a function of the height in the column at low inlet gas concentrations (Fig. 6). If the rate of conversion is controlled by the diffusion rate in the biolayer, this profile is no longer lin-
The values of E (being f 0.29) and dp (being f 8.5 X
total load-constant=SO (g/rnlh)
I 0' .5 1.0 1.5
4 I 1 y' "
f 20 uo I
et hylacetate
toluene 2ow 0 2 4 6
-gasinletconcentration (g/,J) - Fig. 5. The elimination capacity versus the influent gas concentration at constant load.
REMOVAL OF ORGANICS FROM WASTE GASES 3099
TABLE IV Biolayer Thickness ( 6 )
k* k D ’ cgcr 6
Toluene 0.2700 20 50 0.85 x 10⁻⁹ 3.0 1.2 Butylacetate 0.0085 30 55 0.80 x 1 0 - ~ 0.2 1.5 Ethylacetate 0.0051 30 45 1.0 x 10⁻⁹ 0.2 2.5
Component m (g/m3 h) (g/m3 h) (m2/s) (g/m3) (mm)
ear but shows a dependency on the height according to eq. (14). The mea- sured points are in good agreement with the expected theoretical curve.
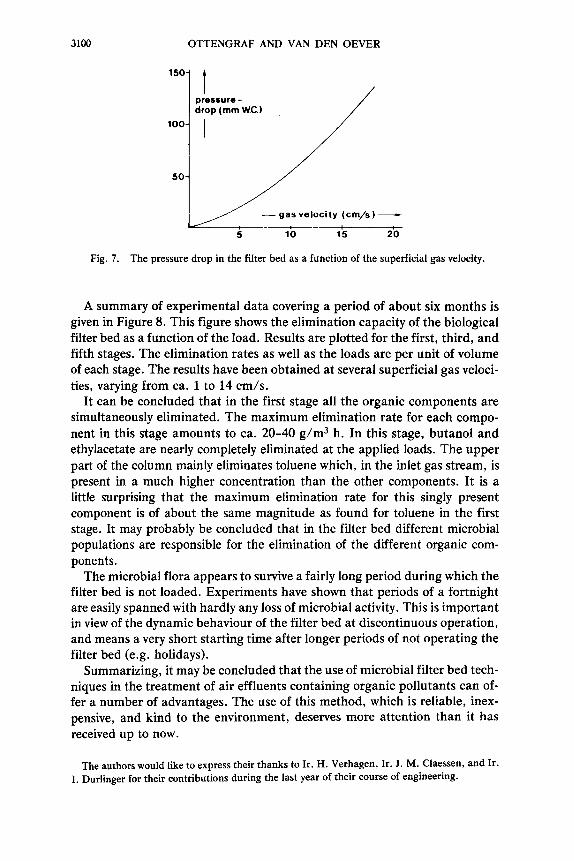
The measured pressure drop in the biological filter bed as a function of the superficial gas velocity is shown in Figure 7. From the path of this curve and the Ergun relation-which gives the pressure drop in a packed bed-it can be concluded that kinetic energy losses must play an important role at the ap- plied gas velocities and thus the pressure drop is not only due to friction.
After several months of operation, the elimination capacity of the filter bed showed a decrease. Analysis of the filter bed has shown that this phenomenon is probably due to a decrease of the pH value from ca. 7 to ca. 4. The produc- tion of acid intermediates (e.g. acetic acid) from ethyl- and butylacetate is the cause of this pH drop, which decreases or can even stop the microbial activity. This has been verified by batch experiments in shake flasks. The addition of limestone or other water-insoluble alkalis to the filter packing has proved a working remedy against the occurrence of this phenomenon.
We used marl as an additive to the peat compost. To ensure a good opera- tion during a long period of time (years) the applied concentration should amount to about 2 wt %.
1.0
0 toluene
Uo 2.74 C”)c
zeroth order kinetics
Fig. 6. The concentration as a function of the height in the column in the case of diffusion limitation in the biolayer.
3100 OTTENGRAF AND VAN DEN OEVER
Fig. 7. The pressure drop in the filter bed as a function of the superficial gas velocity.
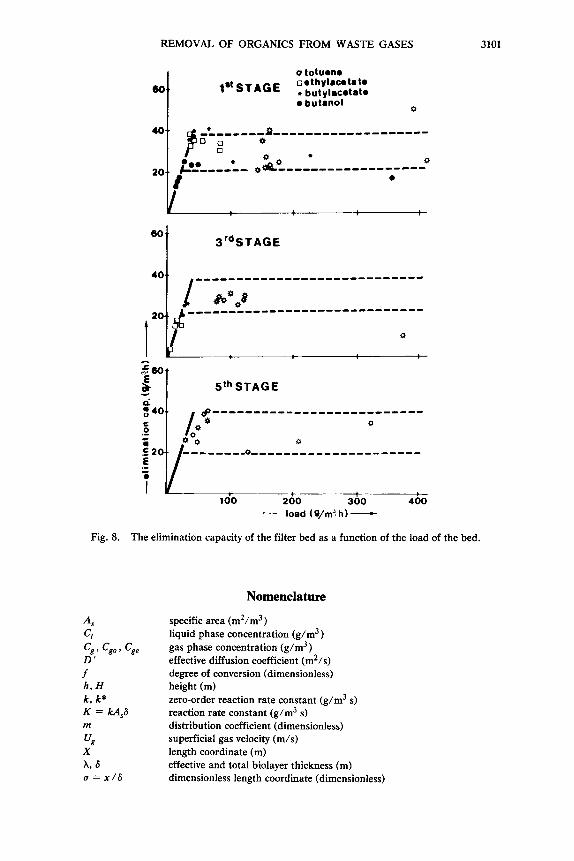
A summary of experimental data covering a period of about six months is given in Figure 8. This figure shows the elimination capacity of the biological filter bed as a function of the load. Results are plotted for the first, third, and fifth stages. The elimination rates as well as the loads are per unit of volume of each stage. The results have been obtained at several superficial gas veloci- ties, varying from ca. 1 to 14 cm/s.
It can be concluded that in the first stage all the organic components are simultaneously eliminated. The maximum elimination rate for each compo- nent in this stage amounts to ca. 20-40 g/m3 h. In this stage, butanol and ethylacetate are nearly completely eliminated at the applied loads. The upper part of the column mainly eliminates toluene which, in the inlet gas stream, is present in a much higher concentration than the other components. It is a little surprising that the maximum elimination rate for this singly present component is of about the same magnitude as found for toluene in the first stage. It may probably be concluded that in the filter bed different microbial populations are responsible for the elimination of the different organic com- ponents.
The microbial flora appears to survive a fairly long period during which the filter bed is not loaded. Experiments have shown that periods of a fortnight are easily spanned with hardly any loss of microbial activity. This is important in view of the dynamic behaviour of the filter bed at discontinuous operation, and means a very short starting time after longer periods of not operating the filter bed (e.g. holidays).
Summarizing, it may be concluded that the use of microbial filter bed tech- niques in the treatment of air effluents containing organic pollutants can of- fer a number of advantages. The use of this method, which is reliable, inex- pensive, and kind to the environment, deserves more attention than it has received up to now.
The authors would like to express their thanks to Ir. H. Verhagen, Ir. J. M. Ciaessen, and Ir. I. Duriinger for their contributions during the last year of their course of engineering.
REMOVAL. OF ORGANICS FROM WASTE GASES 3101
0 butanol 0
.,I 3'dSTAGE
I I &**a
5th STAGE
---load (S/m?h)-
Fig. 8. The elimination capacity of the filter bed as a function of the load of the bed.
f h , H k, k* K = kA,S rn
Nomenclature
specific area (m2/m3) liquid phase concentration (g/m3) gas phase concentration (g/m3) effective diffusion coefficient (m2/s) degree of conversion (dimensionless) height (m) zero-order reaction rate constant (g/m3 s) reaction rate constant (g/m3 s) distribution coefficient (dimensionless) superficial gas velocity (m/s) length coordinate (m) effective and total biolayer thickness (m) dimensionless length coordinate (dimensionless)
3102 OTTENGRAF AND VAN DEN OEVER
km Thiele number (dimensionless)
dimensionless height (dimensionless) E = h/H
References
1. D. K. B. Thistlethwayte, B. Hardwick, and E. E. Goleb, Chimie Znd., 106, 795 (1973). 2. F. Kneer, “Einrichtung zum Abscheiden gasf6rmiger organischer Veruntreinigungen aus
3. R. Helmer, Ges. Zng., 95, 21 (1974). 4. P. A. Jennings, V. L. Snoeyink, and E. S. K. Chian, Biotechnol. Bioeng., 23,1249 (1976). 5. S. P. P. Ottengraf, Biotechnol. Bioeng., 19, 1411 (1977).
Abgasen,” German Patent No. 2.4.45 315 (CLBOID) (1976).
Accepted for Publication May 12, 1983